Embed Size (px)
Citation preview

2012
ILIANA IANKOULOVA
May 1, 2012
MASTER THESIS BUSINESS INTELLIGENCE FOR HORIZONTAL COOPERATION
UNRESTRICTED VERSION


UNRESTRICTED
B US INESS INT ELL IGEN CE F OR H ORIZ ONTAL CO OP ERAT IO N
MEASURING THE PERFORMANCE OF A TRANSPORTATION NETWORK SHARING COOPERATION BETWEEN LOGISTICS COMPANIES
Author Iliana Iankoulova Study program Master of Science in Business Information Technology
School of Management and Governance University of Twente, Enschede, The Netherlands
Student number s1027077
E-mail [email protected]
GRADUATION COMMITTEE
First Supervisor
Mr. Simon Dalmolen PhD candidate School of Management and Governance Information Systems and Change Management Group University of Twente, Enschede, The Netherlands
Second Supervisor
Dr. Maya Daneva Assistant Professor Faculty of Electrical Engineering, Mathematics and Computer Science Information Systems Group University of Twente, Enschede, The Netherlands
Logica Supervisors
Dr.ir. Hans Moonen Consultant Transport & Logistics Logica, Amstelveen, The Netherlands René Kleizen Project Leader Working Tomorrow Logica Arnhem Logica, Arnhem, The Netherlands


BI FOR HORIZONTAL COOPERATION ACKNOWLEDGEMENTS
UNRESTRICTED Page i
ACKNOWLEDGEMENTS
The writing of this thesis has been an exciting journey. During my internship at Logica and in relation to this project, I met many remarkable people who taught me much about logistics, performance management and inter-organizational cooperation. I would like to express my sincere gratitude to them and everyone who helped me arrive at my final destination – the successful completion of this graduation project.
First of all, I would like to thank Simon, my first supervisor from the Univeristy of Twente, for his constant enthusiasm, straight forward feedback, and guidance that helped me stay on the right track. His innovative ideas inspired the creation of the OTE framework and dashboard, the main products of this project. Also, I greatly appreciate the invaluable input from Hans, my mentor from Logica, and Maya, my second supervisor from the university.
I thank René for his daily support at Working Tomorrow Logica. Our progress meetings have kept me up to speed all the way throughout this journey. Also I must mention my colleagues, who have made my days enjoyable, memorable and often very intellectually stimulating. In addition, I am grateful to Eric for giving me the opportunity to work on this project. The successful completion of which, would not have been possible without the involvement of Kuehne + Nagel and the Dutch Institute for Advanced Logistics. Namely, I would like to thank Tim, Bart-Jan, Frank, Arthur, Philippe and Piet for their cooperation, business insights and challenging comments.
My love and gratitude also goes to the people dearest to me, who have always been extremely supportive and believed in me.
Thank you! Iliana Arnhem May 1, 2012


BI FOR HORIZONTAL COOPERATION ABSTRACT
UNRESTRICTED Page ii
ABSTRACT
The focus of this research is on identifying how the operational performance of a horizontal cooperation can be measured with the help of Business Intelligence solutions. The type of horizontal cooperation that is researched in this thesis is the one where two or more logistics service providers share their transportation network and vehicles in order to reduce the empty kilometres, optimize the vehicles’ utilization and improve the on-time performance of the shipments. In this situation, the partners are also direct competitors; this imposes restrictions on the information the partners will share with each other. The aim of this research is to identify a possible solution that complies with the information sharing restrictions, but at the same time can use operational data from the planning and the execution of shipments to measure the performance of the transportation cooperation.
Such a study is important in two ways. First, it has high practical relevance. The number of logistics service providers that are already part of a horizontal cooperation or consider the opportunity is predicted to rise significantly in the next few years. This trend emerges due to the rising pressure on road transportation companies to cut cost and improve the efficiency and the effectiveness of their operations. The availability of a tool that can measure the performance of horizontal cooperation in transportation will be very useful in identifying improvement gaps; also, it will enable the partners to set targets. Second, this study can be beneficial to the theory building in the emerging research field of horizontal cooperation and especially in the area of implementing and managing on a day-to-day basis the working of such initiative, an area in which almost no research is available.
The research approach adopted in this thesis includes the design science methodology as an overall research method. Also, a case study is used for the requirements gathering and the empirical validation which further improves the theoretical relevance of the thesis since there is a high need of case studies in the field of logistics. An appropriate measurement framework is proposed based on the findings from the literature review about Business Intelligence solutions, logistics performance measurement, and cooperation performance measurement; and an insight from a case study in which three logistics companies were preparing for horizontal cooperation. The proposed Overall Transport Effectiveness (OTE) framework concentrates on the measurement of transportation effectiveness, which combined with measures for the extent of the cooperation (harmonization measures) and the efficiency of the planning, can be a reliable source for information in cooperation setting that requires minimal amount of data sharing. In addition to the OTE framework, a BI dashboard is designed and implanted to illustrate the application and the capabilities of the framework.
The main conclusions, drawn from the validation of the OTE framework and dashboard, are that they can have, in fact, high utility with logistics service providers. The framework consists of relevant, understandable, and comparable measures; where the dashboard effectively realizes the features of the framework and is an efficient and useful BI tool with which users are well satisfied. A recommendation for the practitioners is to use the OTE framework to identify losses and gaps in transportation effectiveness. If the OTE is to be implemented in a dashboard, the provided prototype could be used to identify the features that will have the highest added value in the particular case. The construct validity and the internal validity of the study do not suffer from any strong limitations. However, more can be desired in terms of external validity. The experts that participated in the design and the validation are representatives from one logistics service provider, and most of them were strategic and tactical decision makers. This might have injected some bias into the results. Therefore, more future research in that area is suggested that includes experts making decisions at different levels, for example operational. Including more decision-making perspectives would strengthen the external validity of the results and, in turn, would improve the theoretical relevance of this study.
Keywords: horizontal cooperation, Business Intelligence (BI), performance measurement, Overall Transport Effectiveness (OTE), logistics, road transportation, cooperation harmonization indicators


BI FOR HORIZONTAL COOPERATION TABLE OF CONTENTS
UNRESTRICTED Page iii
TALBE OF CONTENTS
ACKNOWLEDGEMENTS ___________________________________________________________________ I
ABSTRACT ______________________________________________________________________________ II
TALBE OF CONTENTS ____________________________________________________________________ III
LIST OF FIGURES _________________________________________________________________________ V
LIST OF TABLES __________________________________________________________________________ V
LIST OF EQUATIONS _____________________________________________________________________ VI
LIST OF FIGURES IN THE APPENDIX _________________________________________________________ VI
ABBREVIATIONS _______________________________________________________________________ VII
1 INTRODUCTION _____________________________________________________________________ 1
1.1 MOTIVATION FOR THE RESEARCH ___________________________________________________ 1 1.2 RESEARCH AIM AND OBJECTIVES ____________________________________________________ 3 1.3 RESEARCH METHODS _____________________________________________________________ 6
1.3.1 OVERALL METHODOLOGY _____________________________________________________ 6 1.3.2 LITERATURE REVIEW METHODOLOGY ___________________________________________ 7 1.3.3 RESEARCH STRATEGY _________________________________________________________ 8
2 LITERATURE REVIEW ________________________________________________________________ 11
2.1 BUSINESS INTELLIGENCE (BI) ______________________________________________________ 11 2.1.1 DEFINITION _______________________________________________________________ 11 2.1.2 THE BI TECHNOLOGY ________________________________________________________ 11 2.1.3 THE ADDED VALUE OF BI FOR THE BUSINESS _____________________________________ 13 2.1.4 APPLICATION OF BI IN LOGISTICS ______________________________________________ 15
2.2 PERFORMANCE MEASUREMENT IN LOGISTICS ________________________________________ 17 2.2.1 SPECIFIC MEASUREMENTS AND THEIR QUALITIES _________________________________ 17 2.2.2 RELATIONS BETWEEN MEASURES ______________________________________________ 18
Critical success factors _____________________________________________________________________ 19 Relation between efficiency and effectiveness __________________________________________________ 20
2.2.3 MEASUREMENT FRAMEWORKS _______________________________________________ 21 Griffis et al. (2007) framework _______________________________________________________________ 21 Krauth et al. (2005) framework ______________________________________________________________ 22 Overall Vehicle Effectiveness (OVE) Framework _________________________________________________ 24 Comparison between the measurement frameworks _____________________________________________ 25
2.3 HORIZONTAL COOPERATION ______________________________________________________ 25 2.3.1 DEFINITION _______________________________________________________________ 26 2.3.2 REASONS FOR ESTABLISHING HORIZONTAL COOPERATION __________________________ 27 2.3.3 MEASURING COOPERATION PERFORMANCE _____________________________________ 28
Performance measures based on non-operational data ___________________________________________ 28 Supply chain cooperation measurement frameworks _____________________________________________ 30
3 CASE STUDY – 4C4MORE PROJECT _____________________________________________________ 32
3.1 LOGISTICS COMPANIES INVOLVED __________________________________________________ 32 3.1.1 KUEHNE + NAGEL ___________________________________________________________ 32 3.1.2 NABUURS _________________________________________________________________ 33 3.1.3 BAKKER LOGISTIEK __________________________________________________________ 33
3.2 CURRENT SITUATION ____________________________________________________________ 34 3.3 DESIRED SITUATION _____________________________________________________________ 35
4 OVERALL TRANPORT EFFECTIVENESS (OTE) FRAMEWORK __________________________________ 36
4.1 DESIGN CRITERIA _______________________________________________________________ 36 4.2 DESIGN PROCESS _______________________________________________________________ 37 4.3 OTE FRAMEWORK DEFINITION _____________________________________________________ 39 4.4 OTE FRAMEWORK USES __________________________________________________________ 43
BI FOR HORIZONTAL COOPERATION TABLE OF CONTENTS
UNRESTRICTED Page iv
5 OTE DASHBOARD ___________________________________________________________________ 45
5.1 DESIGN CRITERIA _______________________________________________________________ 45 5.2 DESIGN PROCESS _______________________________________________________________ 46 5.3 BACK END _____________________________________________________________________ 47
5.3.1 OPERATIONAL DATA SOURCES ________________________________________________ 47 5.3.2 DATA QUALITY _____________________________________________________________ 48 5.3.3 DATA INTEGRATION AND ENRICHMENT _________________________________________ 50 5.3.4 DATA WAREHOUSE _________________________________________________________ 55
5.4 FRONT END ____________________________________________________________________ 55
6 SOLUTIONS DESIGN VALIDATION ______________________________________________________ 59
6.1 VALIDATION APPROACH __________________________________________________________ 59 6.2 VALIDATION RESULTS ____________________________________________________________ 60
6.2.1 OTE FRAMEWORK VALIDATION _______________________________________________ 60 6.2.2 OTE DASHBOARD VALIDATION ________________________________________________ 65
6.3 VALIDITY OF THE RESULTS ________________________________________________________ 67 6.3.1 CONSTRUCT VALIDITY _______________________________________________________ 68 6.3.2 INTERNAL VALIDITY _________________________________________________________ 68 6.3.3 EXTERNAL VALIDITY _________________________________________________________ 70
7 CONCLUSION _______________________________________________________________________ 72
7.1 RESEARCH OBJECTIVES: SUMMARY OF FINDING _______________________________________ 72 Objective O1: Business Intelligence (BI) ________________________________________________________ 72 Objective O2: Logistics performance measurement ______________________________________________ 73 Objective O3: Horizontal cooperation performance measurement __________________________________ 74 Objective O4: Case study ___________________________________________________________________ 74 Objective O5: OTE framework _______________________________________________________________ 75 Objective O6: OTE dashboard prototype _______________________________________________________ 75 Objective O7: Validation ____________________________________________________________________ 76
7.2 RECOMENDATIONS AND CONTRIBUTION TO PRACTICE _________________________________ 77 7.3 CONTRIBUTION TO KNOWLEDGE ___________________________________________________ 78 7.4 LIMITATIONS __________________________________________________________________ 79 7.5 FUTURE RESEARCH ______________________________________________________________ 80
REFERENCES ___________________________________________________________________________ 81
APPENDIX A ___________________________________________________________________________ 87
APPENDIX B – DASHBOARD DESIGN ________________________________________________________ 95
APPENDIX C – QUESTIONNAIRE __________________________________________________________ 102

BI FOR HORIZONTAL COOPERATION LIST OF FIGURES & TABLES & EQUATIONS
UNRESTRICTED Page v
LIST OF FIGURES
Figure 1: Timescale for adoption of horizontal cooperation (EyeForTransport 2010) __________ 2 Figure 2: Logistics service providers' trips with and without cooperation ____________________ 4 Figure 3: Research approach ______________________________________________________ 6 Figure 4: Five-Stage Grounded-Theory Method ________________________________________ 7 Figure 5: Literature refinement iteration (Step 3 of the Five-Stage Grounded-Theory Method) __ 8 Figure 6: Typical BI architecture (Chaudhuri et al. 2011) ________________________________ 12 Figure 7: How IT creates business value – a process model (Crossland & Smith 2008) ________ 14 Figure 8: Business drivers justifying BI initiatives according to Logica BI community (2009) ____ 15 Figure 9: Application of BI in logistics _______________________________________________ 16 Figure 10: Primary and supporting logistics functions where BI can be applied and add value __ 17 Figure 11: Categories of empty kilometres adapted from McKinney & Fitzer 2010) __________ 18 Figure 12: List of sample logistics KPIs (focus on transportation activities) __________________ 18 Figure 13: Critical Success Factors in logistics _________________________________________ 19 Figure 14: Griffis Framework - measurement space adapted from Griffis et al. (2007) ________ 22 Figure 15: High-level framework to cluster logistics KPI’s (Krauth et al. 2005) _______________ 23 Figure 16: Cooperation types in the supply chain (J. Audy et al. 2010) _____________________ 26 Figure 17: Coordination mechanisms for the logistics activities adapted from Audy et al. (2010) 27 Figure 18: Drivers encouraging 3PLs to consider horizontal cooperation (EyeForTransport 2010) 28 Figure 19: Logistics vs. Supply chain management (SCM) adapted from Larson et al. (2007) ___ 30 Figure 20: The Auditor General of Canada criteria for performance measures hierarchy ______ 37 Figure 21: Concept for logistics cooperation performance measurement __________________ 38 Figure 22: Categories of indicators relevant to cooperation performance __________________ 39 Figure 23: Example of the complex relations between measures _________________________ 39 Figure 24: OTE framework - measures hierarchies _____________________________________ 40 Figure 25: Overall Transportation Effectiveness (OTE) framework ________________________ 41 Figure 26: Map between the factors and the criteria used in the design of the dashboard _____ 46 Figure 27: Operational data sources for the dashboard _________________________________ 48 Figure 28: Data quality - selecting good data for the dashboard (UNRESTRICTED) ____________ 49 Figure 29: Integration process for the OTE dashboard __________________________________ 51 Figure 30: Generic data warehouse snowflake schema for the OTE dashboard ______________ 55 Figure 31: Map of validation questions for the OTE framework __________________________ 59 Figure 32: Map of validation questions for the dashboard prototype ______________________ 60 Figure 33: Evaluation results of the OTE framework ___________________________________ 64 Figure 34: Evaluation results of the OTE dashboard (criteria) ____________________________ 65 Figure 35: Evaluation results of the OTE dashboard (factors) ____________________________ 67
LIST OF TABLES
Table 1: Example of cooperation for load sharing between logistics service providers .................... 4 Table 2: Research strategies overview (Biggam 2011)....................................................................... 9 Table 3: OVE value adding and waste activities in transport adapted from Simons et al. (2004) ... 24 Table 4: Collaboration Intensity Index (CII) attributes (Bahinipati et al. 2009) ............................... 30 Table 5: Measuring the delivery activity in the supply chain ........................................................... 31 Table 6: The Auditor General of Canada criteria for performance measures ................................. 36 Table 7: QUIM factors used in the design of the dashboard ........................................................... 45 Table 8: QUIM criteria used in the design of the dashboard ........................................................... 46 Table 9: Dashboard tabs description................................................................................................ 57
BI FOR HORIZONTAL COOPERATION LIST OF FIGURES & TABLES & EQUATIONS
UNRESTRICTED Page vi
LIST OF EQUATIONS
Equation 1: OVE availability ............................................................................................................. 25 Equation 2: OVE performance .......................................................................................................... 25 Equation 3: OVE quality ................................................................................................................... 25 Equation 4: OVE measure ................................................................................................................ 25 Equation 5: OTE levels formulas ...................................................................................................... 42 Equation 6: OTE Availability ............................................................................................................. 42 Equation 7: OTE Performance .......................................................................................................... 42 Equation 8: OTE Quality ................................................................................................................... 43 Equation 9: OTE formula .................................................................................................................. 43 Equation 10: On-time performance calculation steps ..................................................................... 54 Equation 11: OTE calculation approaches and anomalies (with an example) ................................. 62
LIST OF FIGURES IN THE APPENDIX
Appendix A-1: Freight volume EU (Eurostat 2011) .......................................................................... 87 Appendix A-2: Calculation of average lorry capacity (European Commission 2011) ....................... 87 Appendix A-3: BI application in transportation management (Rao & Swarup 2001) ...................... 88 Appendix A-4: BI application in warehouse management (Rao & Swarup 2001) ............................ 88 Appendix A-5: BI application in value added services (Rao & Swarup 2001) .................................. 89 Appendix A-6: BI application in information technology services (Rao & Swarup 2001) ................ 89 Appendix A-7: List of clustered performance indicators for LSPs (Krauth et al. 2005) .................... 90 Appendix A-8: Adaptation of the framework proposed by Krauth et al. (2005) ............................. 91 Appendix A-9: Results from the brainstorming session at K+N ....................................................... 92 Appendix A-10: SSIS integration package – DFT: Move data from flat files to DB ........................... 92 Appendix A-11: SSIS integration package – DFT: Get FROM and TO addresses .............................. 93 Appendix A-12: SSIS integration package – DFT: Enrich addresses with geo coordinates .............. 93 Appendix A-13: SSIS integration package – DFT: Get shipments' distances and CO2 ..................... 94 Appendix B-1: Dashboard OTE ......................................................................................................... 95 Appendix B-2: Dashboard OTE trends .............................................................................................. 96 Appendix B-3: Dashboard OTE details ............................................................................................. 97 Appendix B-4: Dashboard OTE planned vs. executed ...................................................................... 98 Appendix B-5: Dashboard OTE per province (Google map) ............................................................. 99 Appendix B-6: Dashboard OTE Google map of shipments ............................................................. 100 Appendix B-7: Dashboard OTE set limits ........................................................................................ 101
Appendix C-1: Questionnaire OTE framework evaluation ............................................................. 102 Appendix C-2: Questionnaire OTE dashboard evaluation .............................................................. 103

BI FOR HORIZONTAL COOPERATION ABBREVIATIONS
UNRESTRICTED Page vii
ABBREVIATIONS
Abbreviation Name
4C Cross Chain Control Center
4PL Fourth - party logistics
BI Business Intelligence
CEP Complex Event Processing
CFO Chief Financial Officer
CI Collaboration index
CII Collaboration intensity index
CIO Chief Information Officer
CRM Customer Resource Management
CSF Critical Success Factors
Dinalog Dutch Institute of Advanced Logistics
DS Decision synchronization
EEV Enhanced Environmentally friendly Vehicle
ERP Enterprise Resource Planning
ETL Extract, transform and load
GFCC Global Facility Carbon Calculator
IA Incentive alignment
IS Information sharing
IT Information Technology
K+N Kuehne + Nagel
KPI Key performance indicator
LSP Logistics service provider
OEE Overall Equipment Effectiveness
OLAP Online analytical processing
OPE Overall Plant Effectiveness
OTE Overall Transport Effectiveness
OTP On-time performance
OVE Overall Vehicle Effectiveness
QUIM Quality in Use Integrated Management
RDBMS Relational database management systems
ROI Return on Investment
SCM Supply chain management
SSIS Microsoft SQL Server 2008 Integration Services
TMS Transportation management system
TPL (3PL) Third - party logistics
WMS Warehouse Management System

BI FOR HORIZONTAL COOPERATION INTRODUCTION
UNRESTRICTED Page 1
1 INTRODUCTION
This chapter outlines an overview of the motivation for the research. The aim and objectives are listed and explained followed by a description of the research methods used throughout the thesis.
1.1 MOTIVATION FOR THE RESEARCH
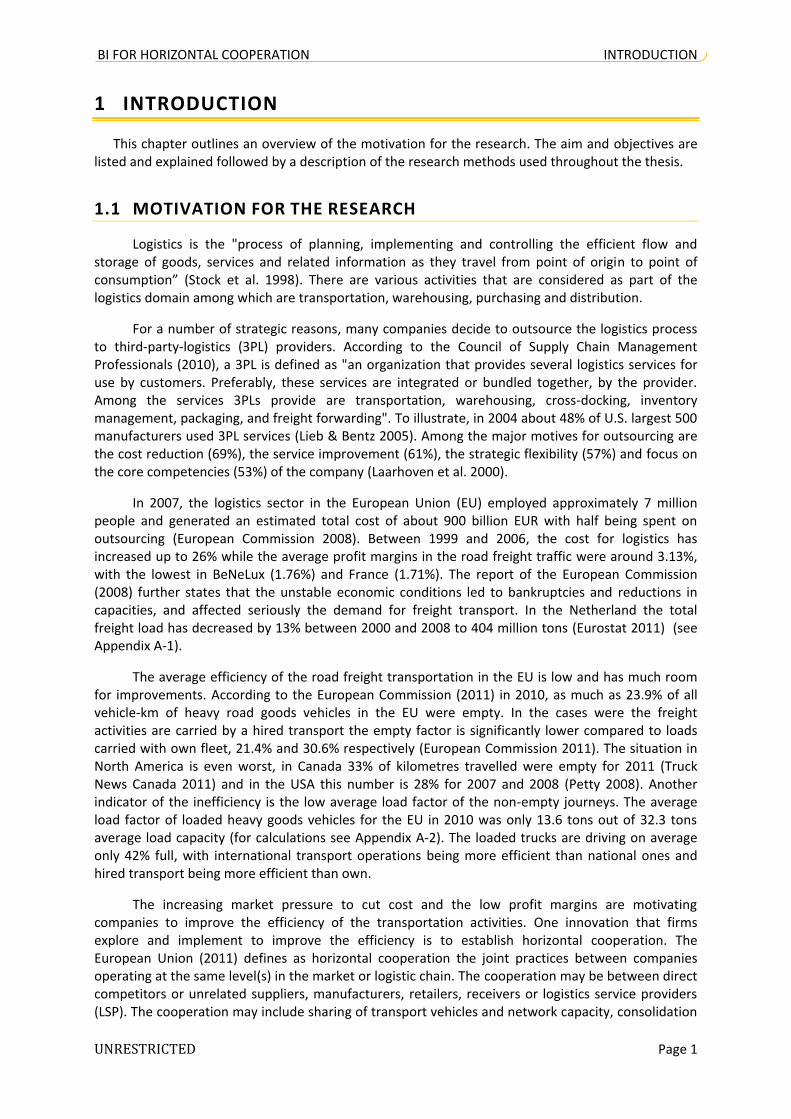
Logistics is the "process of planning, implementing and controlling the efficient flow and storage of goods, services and related information as they travel from point of origin to point of consumption” (Stock et al. 1998). There are various activities that are considered as part of the logistics domain among which are transportation, warehousing, purchasing and distribution.
For a number of strategic reasons, many companies decide to outsource the logistics process to third-party-logistics (3PL) providers. According to the Council of Supply Chain Management Professionals (2010), a 3PL is defined as "an organization that provides several logistics services for use by customers. Preferably, these services are integrated or bundled together, by the provider. Among the services 3PLs provide are transportation, warehousing, cross-docking, inventory management, packaging, and freight forwarding". To illustrate, in 2004 about 48% of U.S. largest 500 manufacturers used 3PL services (Lieb & Bentz 2005). Among the major motives for outsourcing are the cost reduction (69%), the service improvement (61%), the strategic flexibility (57%) and focus on the core competencies (53%) of the company (Laarhoven et al. 2000).
In 2007, the logistics sector in the European Union (EU) employed approximately 7 million people and generated an estimated total cost of about 900 billion EUR with half being spent on outsourcing (European Commission 2008). Between 1999 and 2006, the cost for logistics has increased up to 26% while the average profit margins in the road freight traffic were around 3.13%, with the lowest in BeNeLux (1.76%) and France (1.71%). The report of the European Commission (2008) further states that the unstable economic conditions led to bankruptcies and reductions in capacities, and affected seriously the demand for freight transport. In the Netherland the total freight load has decreased by 13% between 2000 and 2008 to 404 million tons (Eurostat 2011) (see Appendix A-1).
The average efficiency of the road freight transportation in the EU is low and has much room for improvements. According to the European Commission (2011) in 2010, as much as 23.9% of all vehicle-km of heavy road goods vehicles in the EU were empty. In the cases were the freight activities are carried by a hired transport the empty factor is significantly lower compared to loads carried with own fleet, 21.4% and 30.6% respectively (European Commission 2011). The situation in North America is even worst, in Canada 33% of kilometres travelled were empty for 2011 (Truck News Canada 2011) and in the USA this number is 28% for 2007 and 2008 (Petty 2008). Another indicator of the inefficiency is the low average load factor of the non-empty journeys. The average load factor of loaded heavy goods vehicles for the EU in 2010 was only 13.6 tons out of 32.3 tons average load capacity (for calculations see Appendix A-2). The loaded trucks are driving on average only 42% full, with international transport operations being more efficient than national ones and hired transport being more efficient than own.
The increasing market pressure to cut cost and the low profit margins are motivating companies to improve the efficiency of the transportation activities. One innovation that firms explore and implement to improve the efficiency is to establish horizontal cooperation. The European Union (2011) defines as horizontal cooperation the joint practices between companies operating at the same level(s) in the market or logistic chain. The cooperation may be between direct competitors or unrelated suppliers, manufacturers, retailers, receivers or logistics service providers (LSP). The cooperation may include sharing of transport vehicles and network capacity, consolidation

BI FOR HORIZONTAL COOPERATION INTRODUCTION
UNRESTRICTED Page 2
of goods flows, sharing warehouses, consolidating buying power and back office processes such as finance, administration, customer service, IT (EyeForTransport 2010).
The horizontal cooperation strategy is a relatively new phenomenon but is gaining wide spread acceptance. In 2010, about 70% of 3PL companies in Benelux indicated that they have either already implemented horizontal cooperation or plan to do it within the next 4-5 years (see Figure 1). For logistics companies, the horizontal cooperation is especially appealing because of the opportunity to cut cost for customers and company, reducing empty running, improving overall efficiency and gaining more customer. However, such initiatives also meet resistance due to multiple barriers among which are trust issues, problems to find appropriate partners, lack of clarity over leadership, lack of gain sharing models, etc (EyeForTransport 2010). In fact, between 30% and 70% of the strategic alliances such as horizontal cooperation fail (Bamford et al. 2003, p.1). The reasons for the failures are different in every case, but the most common are the unclear strategy, poor partner choice, weak or unbalanced alliance economics, and dysfunctional governance. According to Bamford et al. (2003) the previously mentioned reasons are an expression of that the “companies are taking too narrow a view of what it takes to make an alliance succeed” and a comprehensive alliance strategy is needed.
Figure 1: Timescale for adoption of horizontal cooperation (EyeForTransport 2010)
One of the elements of the alliance strategy is the management of the alliance in the post formation stage (Bamford et al. 2003, p.3). Essential for the alliance management is to define how the performance of the alliance and the relationship between the partners is measured and monitored, and how will those measures be linked to individual incentives. The presence of an alliance metrics framework is also identified as an important factor for the success of the strategic alliances by Kale & Singh (2009) because it will provide support in the governance of the cooperation. The old management proverb: “you cannot manage what you do not measure” applies for the management of inter-organizational cooperation as well as for intra-organizational activities. For the effective management of logistics processes, it is vital that the performance measurements report relevant and timely information, given the continuously increasing volume of information that logistics professionals must consider making decisions (Griffis et al. 2007).
Given the increased number of horizontal cooperation in logistics and the pressure for their creation, it is essential that the performance and the result of the cooperation should be measured and used for decision making. The business activity that is concerned with the gathering of measurement data and turning it into decision relative information is called Business Intelligence (BI). The scope of BI is broad and includes multiple technologies and processes to deliver to the business users the information that will help them run a successful business. Some of the deliverables of BI are scorecards, dashboards and reports that provide information on specific Key Performance Indicators (KPIs).
BI FOR HORIZONTAL COOPERATION INTRODUCTION
UNRESTRICTED Page 3
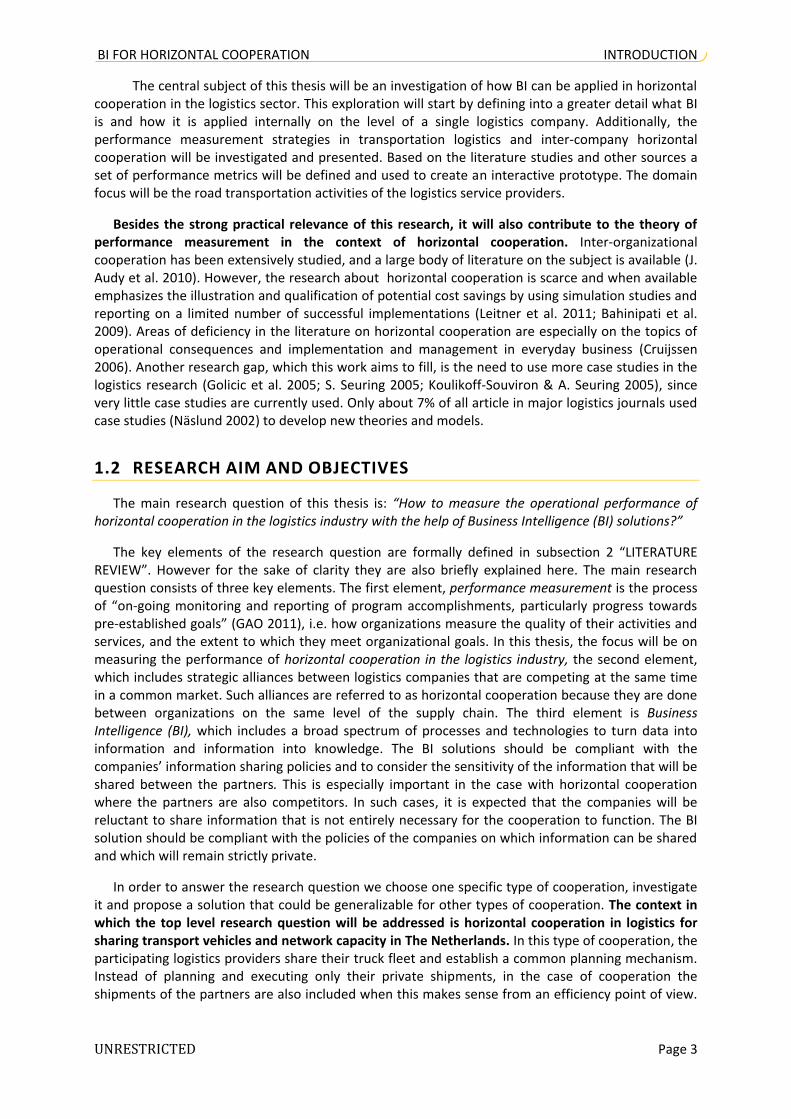
The central subject of this thesis will be an investigation of how BI can be applied in horizontal cooperation in the logistics sector. This exploration will start by defining into a greater detail what BI is and how it is applied internally on the level of a single logistics company. Additionally, the performance measurement strategies in transportation logistics and inter-company horizontal cooperation will be investigated and presented. Based on the literature studies and other sources a set of performance metrics will be defined and used to create an interactive prototype. The domain focus will be the road transportation activities of the logistics service providers.
Besides the strong practical relevance of this research, it will also contribute to the theory of performance measurement in the context of horizontal cooperation. Inter-organizational cooperation has been extensively studied, and a large body of literature on the subject is available (J. Audy et al. 2010). However, the research about horizontal cooperation is scarce and when available emphasizes the illustration and qualification of potential cost savings by using simulation studies and reporting on a limited number of successful implementations (Leitner et al. 2011; Bahinipati et al. 2009). Areas of deficiency in the literature on horizontal cooperation are especially on the topics of operational consequences and implementation and management in everyday business (Cruijssen 2006). Another research gap, which this work aims to fill, is the need to use more case studies in the logistics research (Golicic et al. 2005; S. Seuring 2005; Koulikoff-Souviron & A. Seuring 2005), since very little case studies are currently used. Only about 7% of all article in major logistics journals used case studies (Näslund 2002) to develop new theories and models.
1.2 RESEARCH AIM AND OBJECTIVES
The main research question of this thesis is: “How to measure the operational performance of horizontal cooperation in the logistics industry with the help of Business Intelligence (BI) solutions?”
The key elements of the research question are formally defined in subsection 2 “LITERATURE REVIEW”. However for the sake of clarity they are also briefly explained here. The main research question consists of three key elements. The first element, performance measurement is the process of “on-going monitoring and reporting of program accomplishments, particularly progress towards pre-established goals” (GAO 2011), i.e. how organizations measure the quality of their activities and services, and the extent to which they meet organizational goals. In this thesis, the focus will be on measuring the performance of horizontal cooperation in the logistics industry, the second element, which includes strategic alliances between logistics companies that are competing at the same time in a common market. Such alliances are referred to as horizontal cooperation because they are done between organizations on the same level of the supply chain. The third element is Business Intelligence (BI), which includes a broad spectrum of processes and technologies to turn data into information and information into knowledge. The BI solutions should be compliant with the companies’ information sharing policies and to consider the sensitivity of the information that will be shared between the partners. This is especially important in the case with horizontal cooperation where the partners are also competitors. In such cases, it is expected that the companies will be reluctant to share information that is not entirely necessary for the cooperation to function. The BI solution should be compliant with the policies of the companies on which information can be shared and which will remain strictly private.
In order to answer the research question we choose one specific type of cooperation, investigate it and propose a solution that could be generalizable for other types of cooperation. The context in which the top level research question will be addressed is horizontal cooperation in logistics for sharing transport vehicles and network capacity in The Netherlands. In this type of cooperation, the participating logistics providers share their truck fleet and establish a common planning mechanism. Instead of planning and executing only their private shipments, in the case of cooperation the shipments of the partners are also included when this makes sense from an efficiency point of view.

BI FOR HORIZONTAL COOPERATION INTRODUCTION
UNRESTRICTED Page 4
Figure 2 provides an illustrative hypothetical example scenario for load sharing where the two LSPs involved could benefit from cooperation.
Figure 2: Logistics service providers' trips with and without cooperation
In order for cooperation to be possible, there are few conditions that should be met. Foremost the combined load of the trips for the two service providers should be less or equal to the capacity of the largest available truck/trailer (weight or volume, whichever is the smallest constraint). Other considerations are also the type of the goods transported (e.g., cooled food), the unloading/loading sequence, the available time windows, etc. Assuming that the example scenario from Figure 2 complies will all the constraints by cooperation the benefits indicated in Table 1 can be realized. Some of the benefits are lower percentage of empty kilometres, the improved load factor, and lower consumptions of resources. There are cost savings such as less fuel, less human hours, less equipment amortization and others. However, in addition to the obvious savings, there is extra coordination cost which makes the bottom line unclear.
Logistics provider ‘‘A’‘ trip Logistics provider ‘‘B’‘ trip ‘‘A’‘ and ‘‘B’‘ combine trips
Trip route (A) Utrecht
(C) Wageningen
(E) Nijmegen
(F) 's-Hertogenbosch
(A) Utrecht
(B) Amersfoort
(D) Arnhem
(G) Tiel
(B) Amersfoort
(A) Utrecht
(B) Amersfoort
(C) Wageningen
(D) Arnhem
(E) Nijmegen
(F) 's-Hertogenbosch
(G) Tiel
(A) Utrecht
Trip distance 181km 166km 240km
Empty distance 55km 69km 50km
Empty % 30% 42% 21%
Load factor 12 pallets in a standard trailer of max 26 pallets (~ 46% average load factor)
9 pallets in a standard trailer of max 26 pallets (~ 35% average load factor)
21 pallets in a combi of max 30 pallets (~ 70% average load factor)
Cooperation benefits
Lower percentage empty kilometres
Possible improvement on load factor
Less distance travelled (instead of total distance of 347km with two trucks, by cooperating one truck drives 240km resulting in saving 107km)
Table 1: Example of cooperation for load sharing between logistics service providers
Given that the two logistics providers in the above case decide to cooperate, at some point they would most likely need to assess the impact of the cooperation on their performance from multiple angles. They would need to measure if the cooperation, in fact, realized the expected benefits in

BI FOR HORIZONTAL COOPERATION INTRODUCTION
UNRESTRICTED Page 5
efficiency gain and the impact on the service quality. Consider the following two possible scenarios. In the first scenario, all the benefits given in Table 1 are realized, however, because of some delays with the unloading in Nijmegen (Provider A location) the truck could not make it for the unloading window in Tiel (Provider B location). As a result of that, Provider B got a complaint from a customer. In this scenario, the cooperation positively affected the efficiency of both companies but impacted negatively the service quality of Provider B. What is the net effect? Who is to blame? In the second scenario let us assume that everything went as planned, even more, another 1000 trips were done in a cooperative mode, and no issues were recorded. However, as a result of that some trucks/trailers remained underutilized and thus the fleet has to be reduced. Which trucks and drivers to cut, Provider A’s or Provider B’s? In addition to those questions, the companies would want to know to what extend the cooperation impacted their internal performance. For example, if the companies cooperated on 40% of the loads the cooperation impact will be much higher than if only 5% of the trips were shared. In the first case the change in efficiency and service quality will be more as a result of the cooperation than in the second case.
By answering the top level research question of this thesis, it will be easier for logistics companies to assess the performance of their cooperation, with its apparent benefits and not so apparent costs. In order to answer this question two elements must be defined. First, the performance measures in the context of cooperation must be identified. Most likely this will be a collection of KPIs for measuring the internal performance and the extent to which the cooperation is functional. Some of those KPIs will be private for the companies and some of them will be public for the cooperation. The second element should be an improvement guideline. This guideline will provide certain prescription for actions given a trend in the KPIs.
The main research question of this thesis is further decomposed into the following objectives/sub-question:
O1. Identify the added value of Business Intelligence (BI) tools and solutions for companies in the logistics sector. - What is BI? - What is the added value of BI for the business and how it is measured? - How can BI solutions be applied in logistics and what is its added value?
O2. Define how the performance of the logistics activities can be measured.
- What KPIs are available to measure the internal performance of logistics companies? - What frameworks are available to measure the internal performance of logistics
companies?
O3. Define how the performance of horizontal cooperation can be measured. - What is horizontal cooperation? - What are the reasons for establishing horizontal cooperation for load sharing? - Which frameworks are available that measures the cooperative performance?
O4. What are the current and the desired situation according to the companies from the case
study? - What are the reasons to select a particular case study? - Provide a case study description.
O5. Propose a framework of KPIs for horizontal cooperation in the logistics industry (focus on load sharing in the transportation activity). - What internal KPIs can be used? - What cooperative KPIs on a network level can be used?
BI FOR HORIZONTAL COOPERATION INTRODUCTION
UNRESTRICTED Page 6
O6. Develop a prototype of a BI solution for reporting the performance (e.g., scorecard, dashboard, report) of horizontal cooperation in the logistics industry. - Based on the literature review and feedback from the users create a BI prototype (use
specific data from a case study or simulated data). O7. Validate the framework and the prototype with stakeholders’ feedback.
- Cary our expert panel sessions.
1.3 RESEARCH METHODS
This chapter provides an overview of the research methods used in this thesis. The overall methodology followed is the design science methodology (Hevner et al. 2004; Wieringa 2011). For the literature review the Five-Stage Grounded-Theory Method of Wolfswinkel et al. (2011) is used as a guideline although not strictly applied. Finally, for the empirical study and validation of the designed solution a qualitative explorative case study is applied.
1.3.1 OVERALL METHODOLOGY
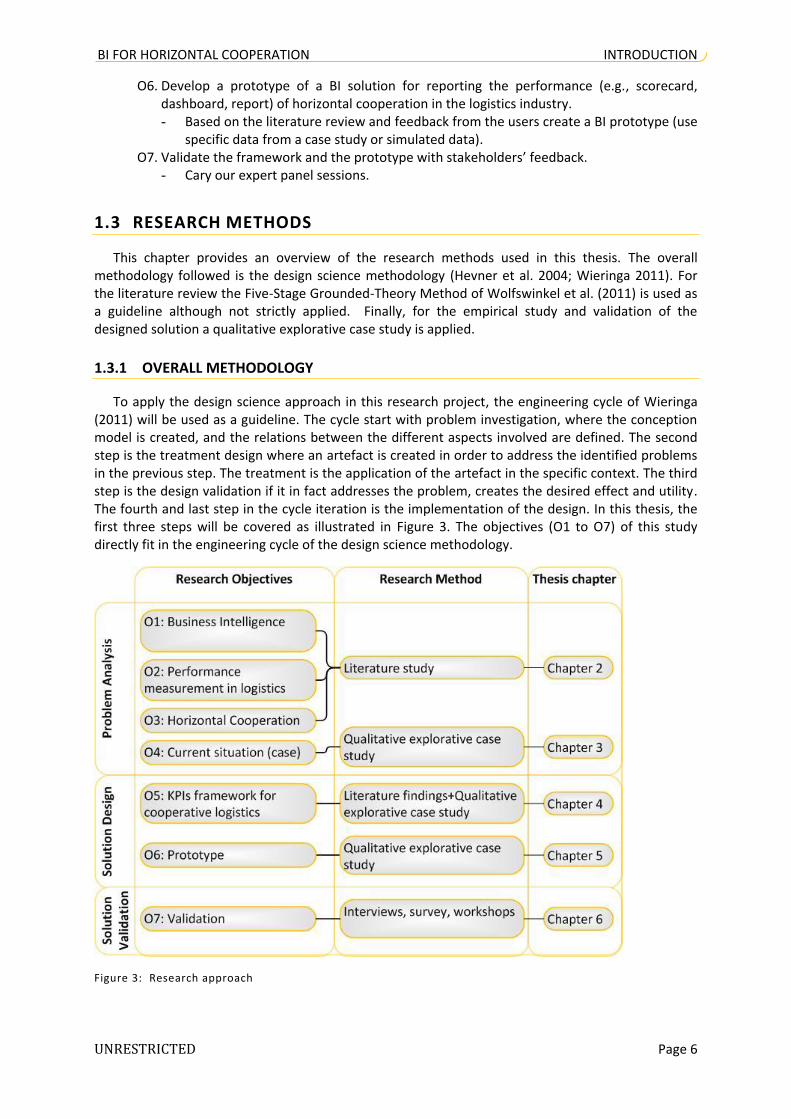
To apply the design science approach in this research project, the engineering cycle of Wieringa (2011) will be used as a guideline. The cycle start with problem investigation, where the conception model is created, and the relations between the different aspects involved are defined. The second step is the treatment design where an artefact is created in order to address the identified problems in the previous step. The treatment is the application of the artefact in the specific context. The third step is the design validation if it in fact addresses the problem, creates the desired effect and utility. The fourth and last step in the cycle iteration is the implementation of the design. In this thesis, the first three steps will be covered as illustrated in Figure 3. The objectives (O1 to O7) of this study directly fit in the engineering cycle of the design science methodology.
Figure 3: Research approach

BI FOR HORIZONTAL COOPERATION INTRODUCTION
UNRESTRICTED Page 7
In the “problem analysis” step there are four objectives. The first objective is to find out if BI solutions can be used in the context of logistics. The second objective is to identify how exactly logistics transportation performance is measured. The third objective is to understand the features of horizontal cooperation and how to measure the success of such initiatives. The first three objectives are addressed in Chapter 2 “LITERATURE REVIEW”. Finally, the fourth objective in the problem identification step is to explore how horizontal cooperation in logistics is performed in a real world situation. This explorative study is described in Chapter 3 “CASE STUDY – 4C4MORE PROJECT”.
In the “solution design” step there are two objectives – develop a performance measurement framework for horizontal cooperation in transportation and develop an interactive prototype of the measurement framework. The proposed measurement framework is based on the finding from the literature study and the observation from the case study. The framework is described in Chapter 4 “OVERALL TRANPORT EFFECTIVENESS (OTE) FRAMEWORK”. After the framework it designed, it is realized in dashboard prototype. According to the design science methodology a prototype is considered part if the validation and not so much a designed solution (artefact). However in this case a considerable design effort was placed on the dashboard and the interactions with it. The dashboard is not only realization of the proposed framework but also shows how it related to other measures and provides specific interaction scenarios. In this thesis, the dashboard prototype is considered as a separate design that not only validates the usability of the proposed framework but itself (as an artefact) must be validated as well. The dashboard prototype and used BI tools are covered in Chapter 5 “OTE DASHBOARD”.
Finally, the designed artefacts are validated with practitioners. The artefacts are presented to a group of representatives from the companies involved in the case study. The utility of the proposed framework and the dashboard are evaluated based on the feedback from the stakeholders. This feedback is gathered from unstructured interviews and meeting initially and with a structured questionnaire at the end. The validation of the solution designs can be found in Chapter 6 “SOLUTIONS DESIGN VALIDATION”.
1.3.2 LITERATURE REVIEW METHODOLOGY
In order to ensure a rigorous, complete and unbiased literature review the of Wolfswinkel et al. (2011) is adopted implicitly. The criteria for literature selection are defined first, followed by a literature search. The main sources of publications are Scopus, Google scholar, SpringerLink, and ACM Digital Library. Once an initial publications set is retrieved it is refined, and additional publications are fetched from the forward and backward citations. Forward citations are the publications that use the paper of interest as a source, and backward citations are the publications that are referenced in the paper of interest. After the final set of literature to be reviewed is selected, it is analysed and presented (Figure 4).
Figure 4: Five-Stage Grounded-Theory Method
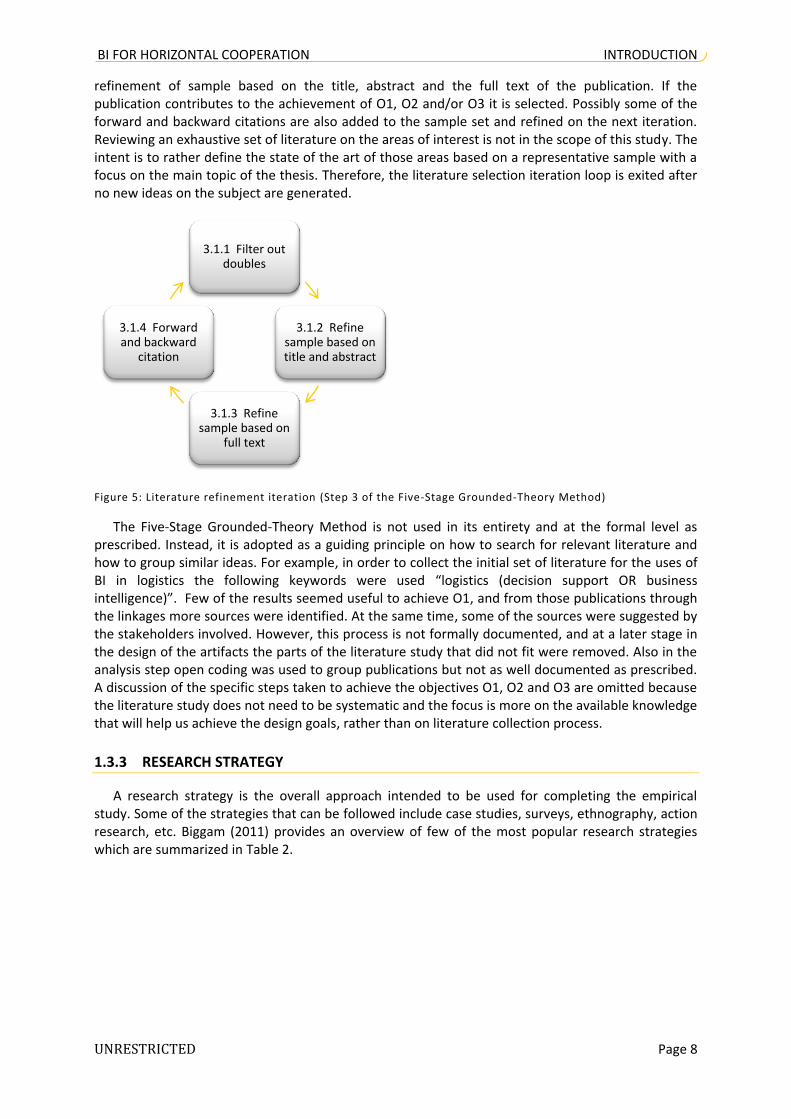
The publications that appear in Chapter 2 “LITERATURE REVIEW” are gathered and refined as a result of an iterative process (Figure 5 expands step 3 from Figure 4) of filtering duplicated studies,
1 DEFINE
1.1 Define the Criteria for Inclusion/Exclusion
1.2 Identify the Fields of Research
1.3 Determine the Appropriate Sources
1.4 Decide on the Specific Search Terms
2 SEARCH
2.1 Search
3 SELECT
3.1 Refine the Sample
4 ANALYZE
4.1 Open Coding
4.2 Axial Coding
4.3 Selective Coding
5 PRESENT
5.1 Represent and Structure the Content
5.2 Structure the Article
BI FOR HORIZONTAL COOPERATION INTRODUCTION
UNRESTRICTED Page 8
refinement of sample based on the title, abstract and the full text of the publication. If the publication contributes to the achievement of O1, O2 and/or O3 it is selected. Possibly some of the forward and backward citations are also added to the sample set and refined on the next iteration. Reviewing an exhaustive set of literature on the areas of interest is not in the scope of this study. The intent is to rather define the state of the art of those areas based on a representative sample with a focus on the main topic of the thesis. Therefore, the literature selection iteration loop is exited after no new ideas on the subject are generated.
Figure 5: Literature refinement iteration (Step 3 of the Five-Stage Grounded-Theory Method)
The Five-Stage Grounded-Theory Method is not used in its entirety and at the formal level as prescribed. Instead, it is adopted as a guiding principle on how to search for relevant literature and how to group similar ideas. For example, in order to collect the initial set of literature for the uses of BI in logistics the following keywords were used “logistics (decision support OR business intelligence)”. Few of the results seemed useful to achieve O1, and from those publications through the linkages more sources were identified. At the same time, some of the sources were suggested by the stakeholders involved. However, this process is not formally documented, and at a later stage in the design of the artifacts the parts of the literature study that did not fit were removed. Also in the analysis step open coding was used to group publications but not as well documented as prescribed. A discussion of the specific steps taken to achieve the objectives O1, O2 and O3 are omitted because the literature study does not need to be systematic and the focus is more on the available knowledge that will help us achieve the design goals, rather than on literature collection process.
1.3.3 RESEARCH STRATEGY
A research strategy is the overall approach intended to be used for completing the empirical study. Some of the strategies that can be followed include case studies, surveys, ethnography, action research, etc. Biggam (2011) provides an overview of few of the most popular research strategies which are summarized in Table 2.
3.1.1 Filter out doubles
3.1.2 Refine sample based on title and abstract
3.1.3 Refine sample based on
full text
3.1.4 Forward and backward
citation

BI FOR HORIZONTAL COOPERATION INTRODUCTION
UNRESTRICTED Page 9
RES
EAR
CH
ST
RA
TEG
Y
DEFINITION ADDITIONAL INFORMATION C
ase
stu
dy This is “an empirical inquiry that investigates a
contemporary phenomenon within its real-life context, especially when the boundaries between phenomenon and context are not clearly evident” (Yin 2003, p.13)
Types: explanatory, descriptive and exploratory.
Surv
ey A representative selection from the population of a
particular type. Ways to carry out a survey: personal; telephone interviews; questionnaire (post, email or group).
Eth
no
- gr
aph
y The study of people in their natural environment, in effect, the study of cultures.
Field notes, the record of the daily observations, are in the hearth of the ethnographic research.
Exp
eri
men
tal
rese
arch
A set of hypotheses is tested throughout some type of experiment.
Activities: state hypotheses; determine sample group; specify control and test groups; establish sampling procedure; perform experiment; analyse raw data; accept/reject null hypothesis.
His
tori
cal
rese
arch
Research that focuses primarily on events that occurred in the distant past.
Primary and secondary sources: manuscripts; books; maps; voice recordings; photographs; films; government documents.
Act
ion
re
sear
ch The researcher starts with a particular problem that he
want to solve, or understand better, usually within the environment where he is working. The researcher is involved not only as an observer but also as a participant.
Model of action research: look, think and act
Gro
un
de
d
the
ory
With this type of method, the researcher does not start with a clearly defined set of research objectives but follows where the research takes him, building up theory as he goes along.
The relationship between the empirical work and the literature review is not sequential but symbiotic.
Table 2: Research strategies overview (Biggam 2011)
The research strategy used in this thesis is a case study. This methodology is particularly relevant for research into supply chains and logistics because it can help form an in-depth understanding of those areas and help develop better, more complete theories about them (Eisenhardt 1989; Yin 2003). However in practice case studies have been underused in the field of logistics research. Näslund (2002) discovered that only 7% of the articles in some of the major journals in the area were based on case studies. Therefore, there is a need of more case studies in the logistics research (Golicic et al. 2005; S. Seuring 2005; Koulikoff-Souviron & A. Seuring 2005).
The case study method, in particular, is appropriate for this research since measuring the cooperative performance of logistics companies is an emerging research area and there is a need of more theories to be developed. The case study will give an in-depth insight into the challenges in performance measurement of cooperation between competing companies. According to Stuart et al. (2002) the case study is a “powerful, influential, and useful contribution to both management practice and theory development” and have strong validity and usefulness for practitioners (Voss et al. 2002).
The three different types of case study are: explanatory, descriptive and exploratory. The explanatory case study focuses on investigating why something happened. The descriptive case study concentrates on providing a full description of a phenomenon and their primary function is to gain a

BI FOR HORIZONTAL COOPERATION INTRODUCTION
UNRESTRICTED Page 10
deeper understanding. The exploratory case studies are associated with pilot studies, and their prime objective is to determine hypotheses for future work (Biggam 2011).
A major concern with case study research is rigor in its design (Koulikoff-Souviron & A. Seuring 2005). Therefore, Yin (2003) proposes three types of validity that ensure a valid and reliable case study. The validity types are construct validity, internal validity and external validity (Yin 2003, p.34). Construct validity requires that the researcher defines “a sufficiently operational set of measures” that preclude “subjective judgments” (Yin 2003, p.35). Internal validity requires that the right cause and effect relations have been defined. External validity addresses the question of the applicability of findings beyond the population under study. Finally, the reliability of the case study could be increased by careful documentation of the research process which ensures traceability of all data.

BI FOR HORIZONTAL COOPERATION LITERATURE REVIEW
UNRESTRICTED Page 11
2 LITERATURE REVIEW
This chapter lays out the theoretical background for the research. The concepts of business intelligence (BI), logistics performance measurement and horizontal cooperation’s performance measurement are defined and the state of art in those areas is given. The focus of this chapter is to fulfil the first three research objectives i.e. O1, O2 and O3.
2.1 BUSINESS INTELLIGENCE (BI)
In this subsection, objective O1 will be addressed. First a definition of BI will be provided, followed by a brief description of the most common BI technologies. After, the added value of BI in general and specifically in the context of the logistics industry will be discussed.
2.1.1 DEFINITION
Business Intelligence (BI) is a fairly new area of academic research in the field of information systems with the bulk of the literature coming from professional publications (Vitt et al. 2002; Gibson et al. 2004). The term BI is first defined by Luhn (1958) in an IBM journal article and was later used in a Gartner Research in 1989 (Gibson et al. 2004). Since then, no common definition of the term has been agreed upon. For different users and vendors of BI software, the term has slightly different connotation (Vitt et al. 2002).
Chee et al. (2009) identifies three main categories of definitions capturing the essence of BI – management aspect, technology aspect and product aspect. The management aspect focuses on the “process of gathering data from internal and external sources and of analysing them in order to generate relevant information for improved decision making”. The technology aspect emphasizes on “the tools and technologies that allow the recording, recovery, manipulation and analysis of information. The product aspect concentrates on “the emerging result/product of in-depth analysis of detailed business data as well as analysis practices using BI tools”.
For the purpose of this thesis the description of Moss & Hoberman (2004) is used because it covers all three categories to some extent, although the technology focus is more dominant.
“The processes, technologies, and tools needed to turn data into information, information into knowledge and knowledge into plans that drive profitable business action. BI encompasses data warehousing, business analytics tools and content/knowledge management.”
2.1.2 THE BI TECHNOLOGY
There are various BI technologies that support each of the process steps of converting data into information and information into knowledge. Figure 6 provides an overview of a typical architecture of an end-to-end BI solution. The architecture has five main elements – data sources; data movement and streaming engines; data warehouse servers; mid-tier servers and front-end applications (Chaudhuri et al. 2011). To the business user the visible elements are usually only the data sources and the front-end applications. However, the bulk of the realization effort goes into the other three elements since implementing the desired connectivity and integration is a major challenge in such solutions. BI solutions provide a sequential processing of data to transform it into useful synthesized information. Most often the data is processed incrementally in batches as new data becomes available all the time.

BI FOR HORIZONTAL COOPERATION LITERATURE REVIEW
UNRESTRICTED Page 12
Figure 6: Typical BI architecture (Chaudhuri et al. 2011)
Data sources. In order to provide a holistic view of a given process, project, organizational unit or the whole organization the data used in BI usually comes from multiple sources. It could be sourced from various organizational applications in a single department or from multiple departments of the company. Other possible sources are systems external to the organization. Often the data from the various systems differs in quality, codes, formats, and semantics (Chaudhuri et al. 2011). Examples of data source for BI solutions are Enterprise Resource Planning (ERP) system and Customer Resource Management (CRM) system, and specifically in the logistics sector - Transportation Management System (TMS) and Warehouse Management System (WMS).
Data movement and streaming engines. The cleansing and the standardization of data could be a challenging task, due to the variation in the data coming from the different source systems the integration. Those tasks are handled by the Extract Transform Load (ETL) tools that assist in discovering data quality problems and facilitate the loading of large amount of data into a warehouse (Chaudhuri et al. 2011). The data quality is extremely crucial for the added value of the BI solutions. If the data that is presented to the users is wrong, incomplete or inconsistent it will not only fail to realize any benefits but may also hinder the decision making process. A data quality issue is, for example, when multiple terms may have the same semantic meaning, but this is not recognized by the BI application; e.g., to have inconsistent country codes in data coming from different sources like ‘‘NL’‘, ‘‘NED’‘, ‘‘H’‘, ‘‘The Netherlands’‘ and ‘‘Holland’‘. In order to improve the data quality, ETL software usually includes data proofing, structure extracting and de-duplication features.
The Complex Event Processing (CEP) engines are used on the same architectural level as the ETL tools. While the ETL tools are mainly used for the processing of batch data and the timeliness is not that critical, the CEP are used to handle real time or near-real time data. In some cases, it is extremely beneficial to have access to real time data that is visualized in such a way that supports fast decisions. In those cases, the batch processing is not sufficient, and the data must be streamed to the BI solution (Chaudhuri et al. 2011).
Data warehouse servers. After the data is extracted, integrated and checked for data quality, it is loaded into a central repository referred to as a data warehouse which is managed by one or more data warehouse servers. According to Bill Inmon, one of the founders of this concept, the data warehouse is “a subject oriented, integrated, time variant, non-volatile collection of data in support of management’s decision making process” (Inmon 2005). Subject oriented means that the data warehouse is designed around the main subjects that concern the business so that they can be easily analyzed. Integrated refers to the fact that data found in a data warehouse often originates from several different operational systems. Time variant indicates that the data warehouse shows the evolution over time and not just the most recent data, as the operational systems tend to do. Nonvolatile means that neither deletions nor updates are applied to data already in the data warehouse, and the only changes are due to the loading of new data (Jensen et al. 2010).

BI FOR HORIZONTAL COOPERATION LITERATURE REVIEW
UNRESTRICTED Page 13
In the core of the data warehouse lays a multidimensional model. The multidimensional data models are designed specifically to support data analyses. Those models classify data as being either “facts” with associated numerical measures or as being “dimensions” that describes the facts and are mostly textual. Dimensions are used for two purposes: the selection of data and the grouping of data at a desired level of detail. A dimension is organized into a hierarchy composed of a number of levels, each of which represents a level of detail that is of interest in the analyses, to be performed. Facts are objects that represent the subjects of the desired analysis. Every fact has a certain granularity, which is determined by the levels from which its dimension values are drawn (Inmon 2005). For example, in the case with empty kilometres in the logistics sector the percentage of empty kilometres could be defined as a fact with dimensions – time, location, truck, driver, planner, customer, etc.
There are two main alternatives when it comes to the engines to store and query the data warehouse. The first alternative is Relational database management system (RDBMS) that is optimized for complex query execution and fast retrieval of the often required data. Large data warehouses often deploy multiple parallel RDBMS engines, so the queries could be executed more efficiently. However, the amount of digital data continuously increases, and after some point the addition of more parallel RDBMS will not be an effective solution. This “Big data” challenge creates a pressure to design new data platforms that can support much larger data volume than the typical RDBMSs. Such platforms are based on the MapReduce paradigm and were originally build to support the analysis of web documents and web search query logs (Chaudhuri et al. 2011).
Mid-tier servers. Provide a special functionality for different BI scenarios and include OLAP servers, Enterprise search engines, Data mining engines and Reporting Servers. The OLAP servers efficiently present the multidimensional model to front end applications or directly to users. The users are able to perform slicing and dicing of data, aggregations, filtering, drill downs and pivoting. The reporting servers facilitate the definition, the order of the execution and the rendering of the reports. The Enterprise search engines support keyword search functions over the text fields in the data warehouse, e.g., email messages, documents. For in-depth analysis and to build predictive models the Data mining engines are used. Similarly to them the Text analytics engines can perform in-depth analysis on large amount of text data and extract valuable information that would be highly labour intensive if extracted manually (Chaudhuri et al. 2011).
Front-end applications. Those applications are used directly by the business users to make decisions. Few of the tools in that architectural element are: enterprise portals for searching, spread sheets, performance management applications that visualize important KPIs e.g. visual dashboards, tools that allow the tech-savvy users to execute ad-hoc queries and tools that visualize data mining models (Chaudhuri et al. 2011). The more flexible the tool is the more it enables dynamic exploration of patterns in the data and the investigation of unusual data points. For example, spread sheets are very static and do not give many options when it comes to what data to see. On the other hand, dashboards could be highly dynamic as they allow the user to drill down in to the data of a particular KPI and provides a different level of data aggregation.
2.1.3 THE ADDED VALUE OF BI FOR THE BUSINESS
Determining the added value of a BI solution is a challenging task. This is due to the fact that the business benefits can be intangible, often indirect and difficult to measure in different parts in the organization (Gartz & Raisinghani 2004). The value of BI is created by acting on the information and knowledge provided to the organization, BI has no value of its own (Lönnqvist & Pirttimäki 2006; Brown 2005). However in practice the assessment of such projects is done based on financial indicators such as Return on Investment (ROI) and often intangible benefits are not taken into consideration; e.g., 86% of CFOs use traditional financial indicators such as ROI and only 18%

BI FOR HORIZONTAL COOPERATION LITERATURE REVIEW
UNRESTRICTED Page 14
acknowledged factors such as reduced costs, timely delivery of information and improved productivity (Silvius 2006).
A process model could be used to effectively improve the evaluatetability of the added value of BI (Silvius 2006). Crossland & Smith (2008) propose one such model which is represented in Figure 7. In this process model, there are five processes that are used in the evaluation BI solutions. The first process is the IT alignment process which includes tasks such as the identification of opportunities and the development of an IT strategy, aligned with the business goals. Second, the Conversion Process is used to address the acquisition of BI products and services and deployment of BI capability. Third, the Use Process represents the activities that are necessary to ensure that BI assets are used appropriately in the organization. Fourth, the IT Competitive process focuses on the benefit the organization achieves through improved products, services and business processes. Fifth and final, the Benefits Realization Management Process could make the prioritization of BI requests simpler and more effective as it would be possible to link priority to expected business benefits. By using the suggested process model to assess the value of the BI solutions, Crossland & Smith (2008) conclude that "the realization of business value from BI is highly dependent on activities that occur in all 5 stages of the process model". This model makes the breakdown of the benefits more concrete but nonetheless the measurement of the individual benefits is still challenging due to the delayed, indirect and intangible nature of many of the benefits. The evaluation of the BI added value, based on the process model, appears to be not straight forward because there is an overlap of tasks between consecutive processes, which may lead to difficulties in assessment.
Figure 7: How IT creates business value – a process model (Crossland & Smith 2008)
Despite the difficulties to assess the exact value of BI, it remains one of the top priorities for CIOs and investments in such technologies continue to grow. According to the Logica BI community (2009) there are three main business drivers that justify BI initiatives as represented in Figure 8. First, the track risk and compliance business driver comes from the fact that organizations have the obligation to inform stakeholders such as regulatory bodies (e.g., banks and governments), the shareholders and the public about their performance. By implementing BI the organization is enabled to be accountable by providing auditable and traceable information flows from operational systems to regulatory reporting. Second business driver is the need to extract more value from customer interactions. Knowledge of the customer needs is critical to retain customers, to attract new customers, or to offer other products/services to existing customers. BI could help to leverage the full potential of customer data in an organization to analyse and predict customer behaviour and value. The third business driver is the pressure to track performance and align metrics across the organization. In order for the strategic management to make successful decisions in complex business situations, they must be equipped with a comprehensive framework of performance measures. BI could support the performance management initiatives in an organization by providing the technologies needed for collecting, analysing and presenting the required metrics.

BI FOR HORIZONTAL COOPERATION LITERATURE REVIEW
UNRESTRICTED Page 15
Figure 8: Business drivers justifying BI initiatives according to Logica BI community (2009)
2.1.4 APPLICATION OF BI IN LOGISTICS
BI is applied in every industry including transportation and logistics. The logistics service providers can take advantage of all BI technologies especially query tools, reporting tools, online analytical processing (OLAP) tools, data visualization and data mining tools (Chee et al. 2009). The usage of such tools results in a reduction of the preparation time for reports; ensures a direct and faster access to the information needed to support decision-making; analyses the flow of businesses across services, clients, regions, currencies, pricing, etc.
Specifically for LSPs, the application of BI can add value in three ways (Rao & Swarup 2001). First, it can lead to service improvement by detailed analyses and reports about all the processes and functions involved in the realization of a particular service, e.g., transport, warehousing, and other value adding services. Second, it can provide information technology based services to clients with specific reports and analyses for their supply chain. This will increase the responsiveness of the clients, increase the transparency and inevitably increase the customer satisfaction. Third, BI can improve the organizational support functions like human resources and accounting by providing support for their decision making processes.
Furthermore, the application and the benefits of BI can be classified according to the main logistics activities – transportation, warehousing, value-added services and information technology services (Rao & Swarup 2001; Zhao & Huang 2009). Figure 9 provides an overview of the different uses of BI in each of those activities. In the transportation management, BI can be especially useful in the carrier performance evaluation, the capacity planning, and the routing and scheduling. If the performance of the contracted carriers is monitored on various factors, then it will be easier to select the best carriers for future projects. This will reduce the risk of carrier malfunctioning and ultimately increase the customer satisfaction. BI can also help in analysing the available capacity, the loss of revenue due to a shortfall in capacity, and the future capacity increments. In the short term, it provides opportunities for engaging empty carriers returning after delivery, thereby reducing the empty kilometres. By using real time (or near real time) BI, the efficiency of the routing and scheduling could benefit due to the updated view of available capacity and manpower at any point in time. The emphasis in this thesis will be on the transportation management activities, but in reality, the other logistics activities are just as important ( Appendix A-3; Appendix A-4; Appendix A-5; Appendix A-6 provide a detailed description of how BI can add value to each of the logistics activities).
Justify BI initiatives
Track risk and compliance
Extract more value from customer
interactions Track
performance and align metrics accross the
organization

BI FOR HORIZONTAL COOPERATION LITERATURE REVIEW
UNRESTRICTED Page 16
Figure 9: Application of BI in logistics
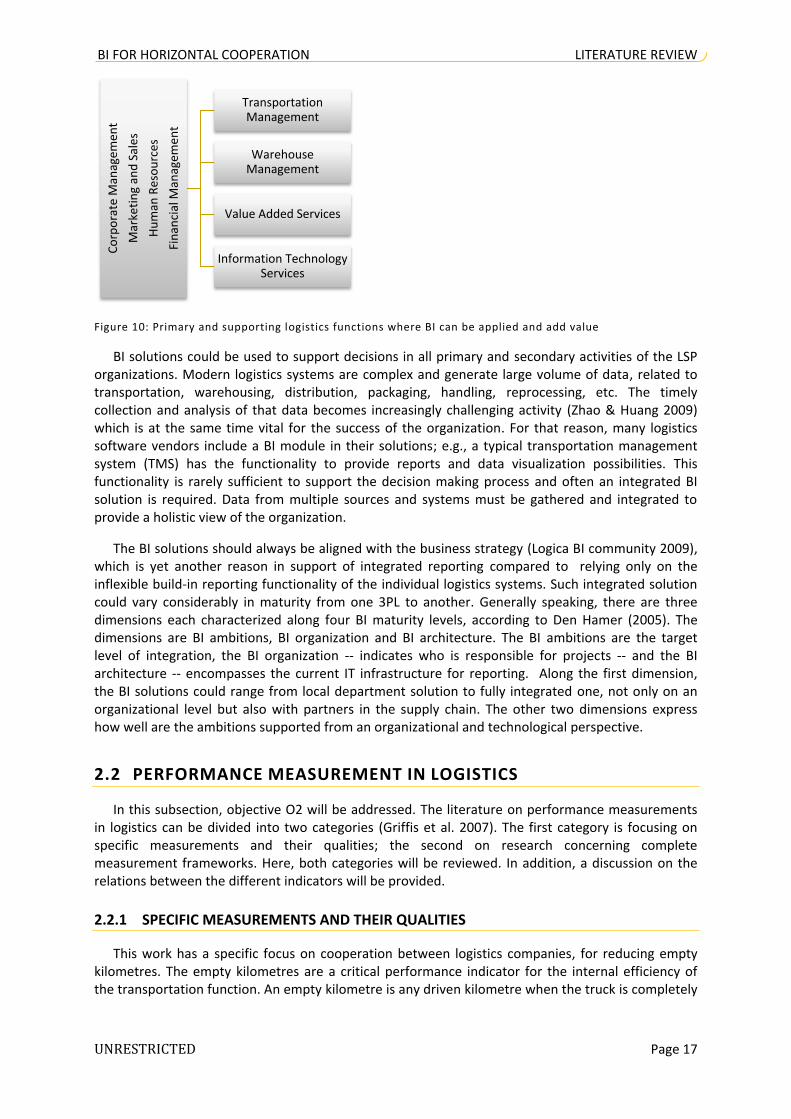
Besides providing valuable insights to those directly involved in the four primary logistics activities (Figure 9), BI could improve the decision making process of the organizational support functions (Rao & Swarup 2001). Such functions are human resources, marketing and sales, financial management, and corporate management. On a corporate management level, BI technologies are used to create dashboard reports on KPIs. For each metric, a target can be set based on historical or on benchmarked data and alerts can be triggered if any KPI falls below the threshold. By having a holistic overview of the organizational performance, the top management will have a better understanding of the current capabilities of the company, and will be able to make better strategic decisions for the future.
In the financial management of LSPs, BI could be used to carry out budgetary analysis. This includes analysis on the budgeted versus the actual expenditures for every cost driver, e.g., labour, fuel, utilities, maintenance. In cases when more detailed investigation is required the drill-down functionality of OLAP tools could be used to access the required data. The allocation of the budget for the following financial period can be facilitated by the presence of BI solutions, as well as a fixed asset return and financial ration analyses. By using data visualization tools in the human resources function an integrate view of the workforce could be provided. Few of the BI applications in HR are human resources reports/analytics, manpower allocation, training and succession planning, and HR portal. In the area of marketing and sales, BI could be applied in the customer service portfolio analysis, customer profitability analysis and the customer service level analysis, among others (Rao & Swarup 2001). Figure 10 provides an overview of the logistics business areas where BI could be effectively used to improve the decision making process.
Transportation Management
-Carrier Performance Evaluation
-Mode-Cost Analysis -Supplier Compliance Analysis
-Carrier Relationship Management
-Capacity Planning
-Cycle Time Analysis
-Routing and Scheduling
-Truck and Driver Performance Analysis
-Root Cause and Claims Analysis
Warehouse Management
-Inventory Analysis
-Warehouse Performance Analysis
-Assigning Warehouse Costs
-Picking Analysis
-Warehouse Space Utilization Analysis
Value Added Services
-Cost-Benefit Analysis
-Reverse Logistics
-Assembly Analysis
-Kitting
Information Technology
Services
-Supply Chain Visibility
-Forecasting
-Customized Reports and Analyses
BI FOR HORIZONTAL COOPERATION LITERATURE REVIEW
UNRESTRICTED Page 17
Figure 10: Primary and supporting logistics functions where BI can be applied and add value
BI solutions could be used to support decisions in all primary and secondary activities of the LSP organizations. Modern logistics systems are complex and generate large volume of data, related to transportation, warehousing, distribution, packaging, handling, reprocessing, etc. The timely collection and analysis of that data becomes increasingly challenging activity (Zhao & Huang 2009) which is at the same time vital for the success of the organization. For that reason, many logistics software vendors include a BI module in their solutions; e.g., a typical transportation management system (TMS) has the functionality to provide reports and data visualization possibilities. This functionality is rarely sufficient to support the decision making process and often an integrated BI solution is required. Data from multiple sources and systems must be gathered and integrated to provide a holistic view of the organization.
The BI solutions should always be aligned with the business strategy (Logica BI community 2009), which is yet another reason in support of integrated reporting compared to relying only on the inflexible build-in reporting functionality of the individual logistics systems. Such integrated solution could vary considerably in maturity from one 3PL to another. Generally speaking, there are three dimensions each characterized along four BI maturity levels, according to Den Hamer (2005). The dimensions are BI ambitions, BI organization and BI architecture. The BI ambitions are the target level of integration, the BI organization -- indicates who is responsible for projects -- and the BI architecture -- encompasses the current IT infrastructure for reporting. Along the first dimension, the BI solutions could range from local department solution to fully integrated one, not only on an organizational level but also with partners in the supply chain. The other two dimensions express how well are the ambitions supported from an organizational and technological perspective.
2.2 PERFORMANCE MEASUREMENT IN LOGISTICS
In this subsection, objective O2 will be addressed. The literature on performance measurements in logistics can be divided into two categories (Griffis et al. 2007). The first category is focusing on specific measurements and their qualities; the second on research concerning complete measurement frameworks. Here, both categories will be reviewed. In addition, a discussion on the relations between the different indicators will be provided.
2.2.1 SPECIFIC MEASUREMENTS AND THEIR QUALITIES
This work has a specific focus on cooperation between logistics companies, for reducing empty kilometres. The empty kilometres are a critical performance indicator for the internal efficiency of the transportation function. An empty kilometre is any driven kilometre when the truck is completely
Co
rpo
rate
Man
agem
ent
Mar
keti
ng
and
Sal
es
Hu
man
Res
ou
rces
Fin
anci
al M
anag
emen
t
Transportation Management
Warehouse Management
Value Added Services
Information Technology Services

BI FOR HORIZONTAL COOPERATION LITERATURE REVIEW
UNRESTRICTED Page 18
empty. There are two different categories of empty kilometre (McKinney & Fitzer 2010) – deadhead and out-of-route (Figure 11).
Figure 11: Categories of empty kilometres adapted from McKinney & Fitzer 2010)
As a result of a survey conducted by the National Private Truck Council in the U.S.A., where 71 transportation companies participated, a set of KPI was indicated as important for performance measurement. The measurements specified as KPIs are percent of on-time delivery (83.9%), percent of empty kilometres (26.6%), annual driver turnover rates (11%), and average miles per gallon (6.1%) (Petty 2005). The on-time service and customer satisfaction are the most significant evaluation of fleet performance according to 51% of the respondents of the same survey. Cost per kilometre is another key method of measuring the performance of fleet; for example, 47% of the Canadian companies are using it as a KPI (Truck News Canada 2011). Some of the most common logistics KPIs with focus on transportation activities as identified by Griffis et al. (2007) are listed in Figure 12 bellow.
Figure 12: List of sample logistics KPIs (focus on transportation activities)
2.2.2 RELATIONS BETWEEN MEASURES
During the literature search, a great deal of individual indicators for measuring the logistics performance were discovered. The measurements are often interrelated and influence each other to a varying degree ((Krauth et al. 2005; Donselaar et al. 1998; Fugate et al. 2010). Particularly interesting are the relations between the operational performance indicators (also referred to as “critical success factors”) and the overall success of the LSP. Another controversial relation turned out to be that between effectiveness and efficiency indicators. Both of those groups of relations are discussed here.
Emp
ty k
ilom
ete
rs
Deadhead: mileage between load destination and pickup location
Out‐of‐Route: mileage beyond the legal route‐line
Authorized: home, maintenance, safety, relays, breakdowns, fueling
Unauthorized: driver decisions
1. On-Time Delivery Percentage
2. Days Order Late
3. Complete Order Fill Rate
4. Items Picked per Person per Hour
5. Average Line Item Fill Rate
6. Weeks of Supply
7. Percent of empty kilometers
8. Annual driver turnover rates
9. Average miles per gallon
10. Cost per kilometer
11. Average Backorder Fill Time
12. Percent Error Pick Rate
13. Perfect Order measurement

BI FOR HORIZONTAL COOPERATION LITERATURE REVIEW
UNRESTRICTED Page 19
Critical success factors
The overall performance of a logistics company can be highly influenced by specific financial and operation data, i.e. specific cost drivers. The cost drivers that have such a high impact on the bottom line are referred to as Critical Success Factors (CSF).
Based on data from 150 Dutch logistics companies, Donselaar et al. (1998) determined that the CSF of the firms specialized in transportation differ from those that are specialized in distribution. A company specializes in distribution if it satisfies at least one of the following two criteria: (1) the loading plus the unloading time is longer than the driving time, and/or (2) the distance between the first and the last stop of a trip is larger than 50% of the total distance per trip. A company that do not comply with any of the above requirements classifies as “transportation”. The performance of both “distribution” and “transportation” companies is operationalized by Donselaar et al. (1998) with the BRAVO-3 score. This score measures the “operational performance at segment level in which a company is doing business” (Donselaar et al. 1998). It is defines as the turnover (revenue) per segment in proportion to the relevant costs in the segment. The costs include the variable cost (e.g., fuel, maintenance, and tiers), the salaries of the drivers, and the direct cost (e.g., depreciation, lease, and insurance). The overhead cost for the supporting functions is not included (e.g,. office personnel, marketing, and IT). Donselaar et al. (1998) tested multiple measurements for correlation to the BRAVO-3 score and identified few CSF for each of the transportation and distribution specification. The CSFs are summarized in Figure 13.
Figure 13: Critical Success Factors in logistics
The “transportation” sector is further divided into short distance trips and long distance trips, with an average distance per trip bellow and above 500km respectively. Each of those sub-segments has different CSF. For the short distance trips, the CSFs are the average wage paid per driver and the average load in a truck (Figure 13). When appropriate, the lowering of the average wages and/or increase the average load in a truck would lead to a substantial difference operational performance (Donselaar et al. 1998). In order to increase the average load factor one or more of the three determining indicators could be improved, i.e. the capacity, the load factor when non empty and the empty kilometres. Empty kilometres and distance travelled per trip are CSFs in the long distance trips. In short, the reduction of the empty kilometres is of high importance for transportation companies and is directly related to the profitability of the company. On the other hand, for the
Critical Success Factors (CSF)
Transportation
Logistics performance (transportation activity)
Distribution
Short distanceavg(dist/trip)<500km
BRAVO-3 score =1.2
Speed = 60 km/h
Empty km = 27%
Long distanceavg(dist/trip)>500km
BRAVO-3 score =1.3
Speed = 70 km/h
Empty km = 14%
↓ Average
wages
paid per
driver
↑ Average load
in a truckAvg(load/truck) =
(loading capacity)
*(load factor when
non empty)
*(percentage of km
driven with a load)
↓ % of
kilometres
driven
empty
↑ Distance
travelled
per trip
(km/trip)
Small dropweightavg(dropweight/stop) < 2.000 kg
BRAVO-3 score = 1.3
Number of stops per trip = 21
Large dropweightavg(dropweight/stop) > 2.000 kg
BRAVO-3 score = 1.3
Number of stops per trip = 7
↑ Scale of the
complete
company
↓ Distance
between two
stops (in
hours and
kilometres)

BI FOR HORIZONTAL COOPERATION LITERATURE REVIEW
UNRESTRICTED Page 20
distribution companies the empty kilometres appear not to be that significant as the overall scale of the company and the average distance between two stops (Donselaar et al. 1998).
In addition to reducing costs, with special attention to the CSFs, it is crucial that the turnover is high. The ability to make satisfactory deals in the logistics sector is just as important as lowering costs according to Donselaar et al. (1998). Therefore, concentrating only on the cost is not a complete solution to be a successful business. The knowledge about which are the CSFs in the segment can help the managers in the company decide if the current level of performance is acceptable, and if more emphasis on improving the values for the CSFs is needed. It should be noted that the CSFs identified in Figure 13 suffer from three main limitations. First, only operation performance indicators are considered, and the overhead costs are not taken into account which makes it possible that there are more CSFs. Second, the company performance is compared to single indicators, and combination of indicators was not tested. It is possible that a given combination could better explain the financial performance of the company. Third, and final, the CSFs were deduced based on a data from more than a decade ago which raises questions if the identified relationships are still as strong as they used to be at the time of analysis.
Relation between efficiency and effectiveness
One of the definitions of logistics performance is “the degree of efficiency, effectiveness, and differentiation associated with the accomplishment of logistics activities” (Bobbitt 2004; Cameron 1986). Logistics functions or companies should strive for excellence in all three dimensions. First, they should aim at higher efficiency, which implies minimizing the ratio of resources utilized against the derived results. Second, the companies should place importance on accomplishing pre-defined goals, i.e. effectiveness. Last, a substantial effort should be placed on gaining superiority when compared to competitors. In the logistics sector, the last dimension is referred to as “logistics differentiation” (Langley & Holcomb 1992), which is equivalent to the process of “benchmarking” as used in the general quality management research and practices (Basak et al. 2006).
Based on the above definition naturally one would assume that as the degree of accomplishments in each of the dimensions increases the overall logistics performance would also increase. Following that logic the highest performance is reached when all three of the dimensions are at the highest level of performance. However, this opposes with the theories that efficiency and effectiveness are often contradicting objectives (Griffis et al. 2007; Mahoney 1988; Fisher 1997; P. Davis & Pett 2002). For example, Mahoney (1988) argues that trade-offs are present between efficiency and effectiveness, which implies that a given organization is either efficient or effective, but cannot be both. This view is supported also with the theory that supply chains should be either efficient by focusing on physical functioning in delivering goods, or for responsiveness by exploiting the market mediating function for passing on information (Fisher 1997; Griffis et al. 2007). One of the reasons for the great amount of research done about the relationship between efficiency and effectiveness is that it is a very important practical problem. Virtually all organizations strive to achieve optimal efficiency and effectiveness in concurrence. However not all achieve that goal, and the large body of research on the topic gives insight into why is that. If one of the viewpoints is proved to be correct this may change the way many companies are steering their business.
The controversy is based on the possibility that the dimensions underlying in the definition of logistics performance could be conflicting (P. Davis & Pett 2002). Contrasting to the views of a necessary trade-of between the dimensions, is the view that an improvement along all the dimensions can be pursued concurrently (Selldin & Olhager 2007; Steers 1975; Ford & Schellenberg 1982; Ostroff & Schmitt 1993; Fugate et al. 2010). Organizations are complex systems and simultaneously work toward multiple goals (Steers 1975) and the highest performing organizations pay attention to both efficiency and effectiveness (Ford & Schellenberg 1982). Additionally, according to an empirical evidence provided by Ostroff & Schmitt (1993) organizations can be highly “effective, efficient, both, or neither.” More recent research is also supporting that view and further proves that

BI FOR HORIZONTAL COOPERATION LITERATURE REVIEW
UNRESTRICTED Page 21
companies that steer on indicators measuring both achieve higher financial performance than the competitors that manage on either one or the other (Selldin & Olhager 2007).
Furthermore, Fugate et al. (2010) performed another empirical large scale research on this controversial topic and concluded that all dimensions of logistics performance are positively related to each other. The findings in the research are based on the responses of managers in more than 400 firms, which imply a high level of external validity and high level of generalizability. The results of the same study also support the hypotheses that the dimensions are not only positively related to each other but also to the logistics performance of the company. This was proven for 96% confidence interval. Fugate et al. (2010) convincingly confirms the view that the performance dimensions reinforce one another and all three can be pursued simultaneously.
Based on the above mentioned arguments for each of the viewpoints, in this work we adopt the theory that the logistics performance dimensions can be improved concurrently, and there are no significant impediments for a company to strive both for efficiency and effectiveness. This theory is adopted here for two reasons. First, the discovered literature in support of this view is more than the literature in support of the traditional “either-or” relationship between the dimensions. Second, the literature in support was far more recent. Third and final, the substantial body of empirical evidence that sustain the theory gives a high level of validity of the claims.
2.2.3 MEASUREMENT FRAMEWORKS
The individual indicators and the complex relations between them are often organised into structured measurement frameworks. Some framework provides a measurement space in which to position individual indicators and assess their applicability in a given situation. Such a framework is defined by Griffis et al. (2007). Another type of frameworks focus on providing holistic set of indicators for an LSP organization that combined can give a balancing overview of the whole organization. An example of this type is designed by Krauth et al. (2005). Yet other frameworks concentrate on a specific logistics activity or even a single aspect of this activity, e.g., the Overall Vehicle Effectiveness (OVE) framework (Simons et al. 2004). The examples for the three types of frameworks are critically evaluated here. This discussion is particularly beneficial for the thesis since the finding from here will be useful to define our own measurement framework for horizontal cooperation in logistics. Perhaps the resulted framework could be hybrid of already existing frameworks of help fit it in a higher level framework, and position it in the spectrum of performance measurement tools.
Griffis et al. (2007) framework
The framework proposed by Griffis et al. (2007) addresses the deficiencies in the literature to offer guidance for selecting the “right measures to provide the required insight”. There is little research done on when specific measures should be used, and when measures are less appropriate. Griffis et al. (2007) consider the second one particularly troubling and argue that in some cases a given measure that provides irrelevant information could be tremendously disruptive for effective logistics management. The Griffis Framework is a tool that can be used by managers, to select appropriate logistics measures that match the information needs in the organization. The basis of this framework is a survey of 311 logistics managers that reviewed 14 logistics measures and evaluated their appropriateness for communicating different types of information (Griffis et al. 2007).
The Griffis Framework has three dimensions along which the measurement indicators are located. The first dimension is competitive basis, which directs the “alignment of product types with appropriate production system capabilities” (Griffis et al. 2007). Innovative products are much different from functional products, and each needs a different measurement system accordingly. Functional products, such a tomato soup, have a stable and predictive demand, while an innovative

BI FOR HORIZONTAL COOPERATION LITERATURE REVIEW
UNRESTRICTED Page 22
product, such as fashion clothing, demands more responsive information system. To represent that difference in product types and services the end points of the competitive basis dimension are responsiveness and efficiency. The second dimension is the measurement focus which indicates the strategic orientation of the decision maker. The two endpoints in this dimension are strategic and operational focus. The third and final dimension is measurement frequency. Here, the endpoints are monitoring and diagnostic. The measurements that are consulted infrequently are referred to as diagnostic measures, and those that are used on a day-to-day basis are monitoring measures. Those dimensions are visualized as a 3D measurement space in Figure 14.
Figure 14: Griffis Framework - measurement space adapted from Griffis et al. (2007)
Although the framework is well structured and rigorous, it is not comprehensive. Only 14 measurements are evaluated according to the measurement space. The selected measurements are believed to be the “most familiar and enjoy wide acceptance among practitioners” (Griffis et al. 2007). This an understandable limitation, given the thorough validation provided. However for this work a more complete framework is needed. Another drawback of the framework is that it supports the view that efficiency contradicts responsiveness as implied in the competitive basis focus. As argued in the previous chapter, it is more reasonable to assume that there is no trade-off between those two endpoint. On the contrary, they can be pursued concurrently and can reinforce each other. Therefore, the semantics of the Griffis framework do not comply with the fundamental assumptions of this work that the logistics performance is positively related to both efficiency and effectiveness.
Krauth et al. (2005) framework
In comparison to the in depth analysis of few indicators proposed by Griffis et al. (2007), a framework that places more emphasis on the breadth of performance measurements in logistics is defined by Krauth et al. (2005). This framework has two main dimensions – parties’ viewpoints and the time frame in which the indicators are used (Figure 15).
Efficiency
Responsiveness
Monitoring
Diagnostic
Operational Strategic
Competitive Basis
Me
asu
rem
en
t Fr
eq
ue
ncy
Measurement Focus
Indicators① On-Time Delivery② % logistics Costs as a % of Sales③ Days Order Late④ Inventory Turnover Ratio⑤ Complete Order Fill Rate⑥ Average Order Cycle Time⑦ Order Cycle Time Variability⑧ Items Picked per Person per Hour⑨ Average Line Item Fill Rate⑩ Weeks of Supply⑪ Average Backorder Fill Time⑫ Sales Lost Due to Stockouts⑬ Percent Error Pick Rate⑭ Logistics Costs per Unit
MEASUREMENT SPACE and INDICATORS
⑭esd
①om
②esd
③om
④es
⑤em ⑥esm
⑧eom
⑦o
⑨eom
⑩sm⑪m
⑫rs
⑬eom
Dimesionse-efficientr-responsivem-monitoringd-diagnosticso-operationals-strategic

BI FOR HORIZONTAL COOPERATION LITERATURE REVIEW
UNRESTRICTED Page 23
Figure 15: High-level framework to cluster logistics KPI’s (Krauth et al. 2005)
The first dimension, parties’ viewpoints, includes two groups – internal and external measurements. In the internal perspective, the viewpoints of the management and the employees within the company are represented. The external point of view includes the customer and society perspectives. The dimension on parties’ viewpoints is motivated with the argument that often the goals of the different parties are conflicting (Krauth et al. 2005). In order to achieve an effective stakeholder expectation, the needs and desires of the most notable stakeholders should be measured. An illustrative example of such a scenario is the price for logistics services. The management desires higher prices, which will lead to higher profit, the customers’ desires lower prices, the employees are not so much interested in the prices directly but more on the working conditions and finally the society is interested more on the overall economic climate than on anything else.
From the four viewpoint covered in the framework, the management viewpoint is further segmented due to the expectations of Krauth et al. (2005) that large collection of indicators falls in this group, and therefore, will benefit from additional refinement. The management viewpoint is divided in four segments – effectiveness, efficiency, satisfaction, and IT utilization and innovation. The effectiveness measures cover the capabilities of delivering the intended services or products in time and with the desired quality. The efficiency, on the other hand, is concerned with the amount of resources used to accomplish the intended result. The less resources are used, the more efficient the completion of the task. The satisfaction reveals the human factor or the level to which the people accomplish the task with satisfaction and enjoyment. Finally, the future performance of the organization is measured to a great extent by the IT and innovation measurements. In this group, the measurements indicate the long term performance and capability of the company to meet future challenges.
The second dimension of the framework is the time frame in which the indicators are used. According to this dimension there are short term and long term indicators, which are analogous to the operational and strategic endpoints of the measurement focus dimension in the Griffis et al. (2007) framework. The short term indicators are often reported on a weekly or daily basis where the long term indicators are measured over a longer period of time, i.e. months and quarters. The major difference between the Krauth et al. (2005) and the Griffis et al. (2007) framework in relation to this dimension is that, in the latter, there are two end points and degrees in between depending on the context where in the former a given measurement is falling strictly in one of the categories. For example, the complete order fill rate in the Griffis et al. (2007) framework is not considered either a strategic nor operational measure since it can be used for different purposes but in the Krauth et al. (2005) it would be classified as either one of the two.
The Krauth et al. (2005) provides 100+ indicators that are placed in the framework (for a detailed view, please refer to Appendix A-7). In contrast to the 14 indicators given by Griffis et al. (2007) here much larger number of indicators are presented, but this is on the expense of in-depth analysis of

BI FOR HORIZONTAL COOPERATION LITERATURE REVIEW
UNRESTRICTED Page 24
each of the indicators. The validation here is done on the basis of expert opinion for the overall framework where in the other case the positioning of each of the indicators is thoroughly assessed.
Overall Vehicle Effectiveness (OVE) Framework
Another holistic measure for transport effectiveness is Overall Vehicle Effectiveness (OVE) as proposed by Simons et al. (2004). OVE is an aggregated measure that operationalizes the transport activities by identifying all the value adding and wastes inherent in the road freight transport operation. It is an overall performance measure of the vehicle fleets and constructively encourages operational improvement to meet the competitive and sustainable challenges in the industry, and could be a strong indicator of company profitability.
The OVE measure is based on the lean paradigm (Simons et al. 2004) where the activities in any organization fall in three groups (Monden 1993): (1) those that add value for the benefit of the end customer; (2) those that add no value and are “waste” activities; (3) and those that add no value, but are “necessary” activities. The value adding and the waste activities as defined in the OVE framework are summarized in Table 3. The most well-known lean measure is the Overall Equipment Effectiveness (OEE) that is used in a manufacturing environment to gauge the resultant availability, performance and quality of the machines. The OEE is an aggregated measure of effectiveness (Nakajima 1988) that is instrumental to identify areas of wastes to be focused on, leading to improved effectiveness of the machinery. OEE is a measure of the effective use of planned time and is a starting point for the definition of the OVE.
VALUE ADDING ACTIVITIES IN ROAD TRANSPORTATION
Transportation Main activity.
Loading Both loading and unloading are considered as critical steps in a supply chain configuration as they allow product consolidation and assembly at various points between production and consumption. By setting world class loading and unloading standards, the value adding time spent on those activities can be set (e.g., 1 minute per pallet).
Unloading
WASTE ACTIVITIES IN ROAD TRANSPORTATION
Driver breaks Statutory breaks taken during a journey are considered loss. If taken at the end of the journey or when someone else loads/unloads it is not a loss. This would encourage the planning of trips such that local runs terminate inside the 4-hour break interval.
Excess load time
A standard time is allowed to load and unload a vehicle; when loading/unloading time exceeds the standard time this is considered a loss.
Fill loss
Ideally the vehicle will be full (either by weight or volume whichever is the smallest constraint). Fill loss occurs when the vehicle is not fully loaded. This measure could lead to heavies drop to be done last which is not the most cost-effective solution. Therefore, this measure should be used after the best route is identified.
Speed loss The difference between the max attainable speed and the average speed is the speed loss. The max attainable speed is the maximum legal speed on a given road. This would encourage avoidance of busy times of the day.
Quality delays Delays from internal quality failures. Driver losing his way, vehicle break downs, goods damaged in transit or poor/invalid paperwork are examples of quality delays.
Table 3: OVE value adding and waste activities in transport adapted from Simons et al. (2004)
In the OVE three elements are calculated based on the identified wastes – availability, performance and quality. The availability is the comparison between the amount of time the vehicle was actually busy, and the amount of time it was planned to be. The performance rate is a comparison between the real time to transport goods and the vehicle utilization compared to the optimal. Last but not least, the quality is the comparison between the number of deliveries that fit the specification (e.g., available time windows, quality of documentation, number of damaged goods). The precise formulas for calculating the OVE and its components are given in Equation 1 to Equation 4.

BI FOR HORIZONTAL COOPERATION LITERATURE REVIEW
UNRESTRICTED Page 25
100*PlanTime
)ExcessLoad(BreaksPlantyAvailabili
Equation 1: OVE availability
100*imeAvailableT
Speed)(FillAvailableePerformanc
Equation 2: OVE performance
100*eTimePerformanc
aysQualityDelePerformancQuality
Equation 3: OVE quality
Quality*ePerformanc*tyAvailabiliOVE
Equation 4: OVE measure
Comparison between the measurement frameworks
In brief, the Griffis et al. (2007) framework provides a measurement space in which to position individual indicators and assess their applicability in a given situation; the Krauth et al. (2005) framework focus on providing holistic set of indicators for an LSP organization that combined can give a balancing overview of the whole organization; the Overall Vehicle Effectiveness (OVE) framework as proposed by Simons et al. (2004) concentrates on a single aspect of a specific logistics activity, i.e., transportation effectiveness. The framework that is sought out in this research should be measuring the performance preferably only of the transportation activity of logistics. Since the horizontal cooperation is about loads and network sharing, it does not make much sense to measure the performance of any warehousing activities for example. Also the framework should give a rather holistic view of the transportation activity and the relation between the underlying measures should be clear.
From the three presented framework, the OVE meets the criteria the best. This framework measures rigidly the effectiveness of the transportation activity and provides a very clear structure of indicators that can be used to identify improvement gaps by different organizational levels. The OVE framework is a good starting point for the definition of a framework that can assist in the performance measurement of a horizontal cooperation. Nonetheless, the other two frameworks could be very useful still. Although the Griffis et al. (2007) framework do not provide any specific set of indicators it is particularly useful in categorising any indicator according to its purpose. It could proof valuable tool for evaluating the framework designed in this thesis. By knowing were an indicator stands in the measurement space the easier it is to decide when it is most appropriate to use it. Also, the Krauth et al. (2005) framework could be very valuable during the process of selecting the right indicators to combine. This framework not only provides an extensive list of measure but they are also grouped in categories. The main reason that this framework is not as much applicable to horizontal cooperation in transportation is because it is too broad and covers many other activities besides transportation.
2.3 HORIZONTAL COOPERATION
In this subsection, objective O3 will be addressed. Here, the current body of knowledge on horizontal cooperation and how to measure their performance is examined. First, the term horizontal cooperation is defined then the reasons for establishing such cooperation are presented. Finally, some tools for cooperation performance measurement are presented.

BI FOR HORIZONTAL COOPERATION LITERATURE REVIEW
UNRESTRICTED Page 26
2.3.1 DEFINITION
Before defining the term “horizontal cooperation” let us look at inter-organizational cooperation in general. There are multiple definitions for the term cooperation and the close synonyms such as collaboration, partnership and alliance. In this thesis in order to be consistent the term cooperation is used most often, and no semantic difference is made between that term and its synonyms. Here, we adopt the view of Audy et al. (2010) that cooperation “occurs when two or more entities form a coalition and exchange or share resources (including information), with the goal of making decisions or realizing activities that will generate benefits that they cannot (or only partially) generate individually”. This can range from information exchange, joint planning, joint execution, up to strategic alliance (D’Amours et al. 2006).
In the context of a supply chain, the cooperation is differentiated in two types: vertical and horizontal. The two types are illustrated in Figure 16 from the perspective of a focal company. Vertical cooperation occurs with business units belonging to the same supply chain on different levels (J. Audy et al. 2010) such upstream cooperation with customers (area 1 in Figure 16) or downstream with suppliers (area 5 in Figure 16). In contrast, the horizontal cooperation occurs with business units outside the supply chain (J. Audy et al. 2010). Such unit could be a non-competitor company with which the focal company shares production capacity (area 2 in Figure 16) or competitor companies with whom the company can share its network (area 4 in Figure 16). Both vertical and horizontal cooperation can occur within a single company between its own business units (area 3 in Figure 16).
Figure 16: Cooperation types in the supply chain (J. Audy et al. 2010)
The focus of this study is horizontal cooperation between competitors (area 4 in Figure 16). The definition of horizontal cooperation adopted here is the one provided by European Union (2011) that identifies as horizontal cooperation the “joint practices between companies operating at the same level(s) in the market or logistic chain”. The cooperation may be between direct competitors or unrelated suppliers, manufacturers, retailers, receivers or logistics service providers (LSP). The horizontal cooperation can have different intensity and can be divided in three types, i.e., Type I, Type II and Type III (Lambert et al. 1999; Cruijssen 2006). The types vary from arm’s length to horizontal integration. In Type I cooperation, the partners coordinate their activities and planning thought a limited degree with a short term time span. In Type II, the partners go being a basic cooperation and also integrate part of the business planning. Finally, in Type III the participants have integrated their processes to a high level and each company accepts the other as an extension to

BI FOR HORIZONTAL COOPERATION LITERATURE REVIEW
UNRESTRICTED Page 27
itself (Cruijssen 2006). The Type III is also referred to as strategic alliance and in contrast to the other two types in a long term contractual relation. Similar categorization is provided by Zhang et al. (2008) who identify nine types of logistics collaborations separated in three groups that are analogous to Type I, II and III discussed above.
Besides the intensity of integration, the horizontal cooperation could be also characterized by the coordination mechanism. Audy et al. (2010) identifies five different mechanisms that are illustrated in Figure 17, including the flow of information, decision and financials. Each of those mechanisms includes at least two cooperating business units having logistics activities to be coordinated by a plan and their own resources available to achieve the plan. The coordination process ensures the planning of the activities the sharing of benefits. This coordination process can be performed by a third party or by the collaborating entities. The coordination mechanisms can have different main goals; e.g., CM1, CM2, CM3 and CM5 aim at maximizing saving where CM4 concentrates on maximizing profit (J. Audy et al. 2010).
Figure 17: Coordination mechanisms for the logistics activities adapted from Audy et al. (2010)
In this thesis, the case of horizontal cooperation that will be used is the load/network sharing cooperation between logistics companies. In this type of cooperation, the partners make a cooperative planning for their trips and choose the best transport option from the resources of both companies to execute the trip. This case of horizontal cooperation has been illustrated at the Introduction chapter in Figure 2. Beside cooperation for load sharing, other logistics cooperation are possible. Few of the most common examples are factory gate pricing, insinking and joint hub network development (Cruijssen 2006). In the factory gate pricing, the retailer buys the products “at the factory gate” and takes care of the transport on his own account. This encourages the functions of multiple retailers to join forces. In the insinking cooperation the logistics service provider (LSP) initiates the shift of logistics activities from the shipper to the LSP and enforces horizontal cooperation by simultaneously targeting a group of possibly competing shippers. In the joint hub network development, trans-shipment takes place at intermediate facilities (the hubs) between the origin and destination nodes.
2.3.2 REASONS FOR ESTABLISHING HORIZONTAL COOPERATION
The horizontal cooperation is a relationship innovation that is a cheap way for logistics providers to react on the high pressure on transport efficiency and to avoid merges and/or acquisitions (Cruijssen 2006). There are a number of benefits of cooperative transport management. Some of them are reducing transportation costs, increased asset utilization, improved service levels increased visibility, improved end customer satisfaction, and increased revenue (Sutherland 2003; Tella & Virolainen 2005). In addition, Cruijssen (2006) mentions increased productivity and improved market position, as reasons to establish cooperation. Figure 18 provides an overview of the motivation for

BI FOR HORIZONTAL COOPERATION LITERATURE REVIEW
UNRESTRICTED Page 28
3PLs to enter horizontal cooperation. It should be noted that a minimum degree of efficiency and scale are needed before the projected benefits can be realized.
Figure 18: Drivers encouraging 3PLs to consider horizontal cooperation (EyeForTransport 2010)
Although the potential benefits of the horizontal cooperation are quite attractive, in practice they are hard to measure and fairly allocate the gains from those benefits. There are multiple methods to do the gain sharing each with different flaws. The gains can be proportional to the total load shipped, proportional to the number of customers served, proportional to the logistics costs before the cooperation, proportional to the distance travelled for each shipper’s orders, or proportional to the number of orders (Cruijssen 2006). Lehoux et al. (2009) further identifies sharing principles based on economic models including Shapley value, the nucleolus, separable and inseparable costs, shadow prices and volume weights.
2.3.3 MEASURING COOPERATION PERFORMANCE
The literature search on the subject of cooperation performance and related phrases resulted in two sets of topics on which research was available. In the first set, the cooperation performance was measured in a qualitative manner with questionnaires and interviews, and tested for correlations to the internal performance of the company. The second set of publications focused on frameworks for measuring the performance of the total supply chain. In this chapter, the two sets of research are discussed.
Performance measures based on non-operational data
In the measurement of cooperative performance, it is essential to determine the relation between the cooperation intensity and the resulting outcomes. Zacharia et al. (2009) identifies three types of outcomes that are positively influenced by the cooperation. The first group are the operational outcomes that firms typically focus on in a supply chain collaboration such as reduced costs, improved quality, reduced cycle time, improved service or value delivered to customers (Koufteros et al. 2002). The second group are the relational outcomes between the cooperating companies such as trust, credibility and relationship effectiveness. Third, is the performance at the
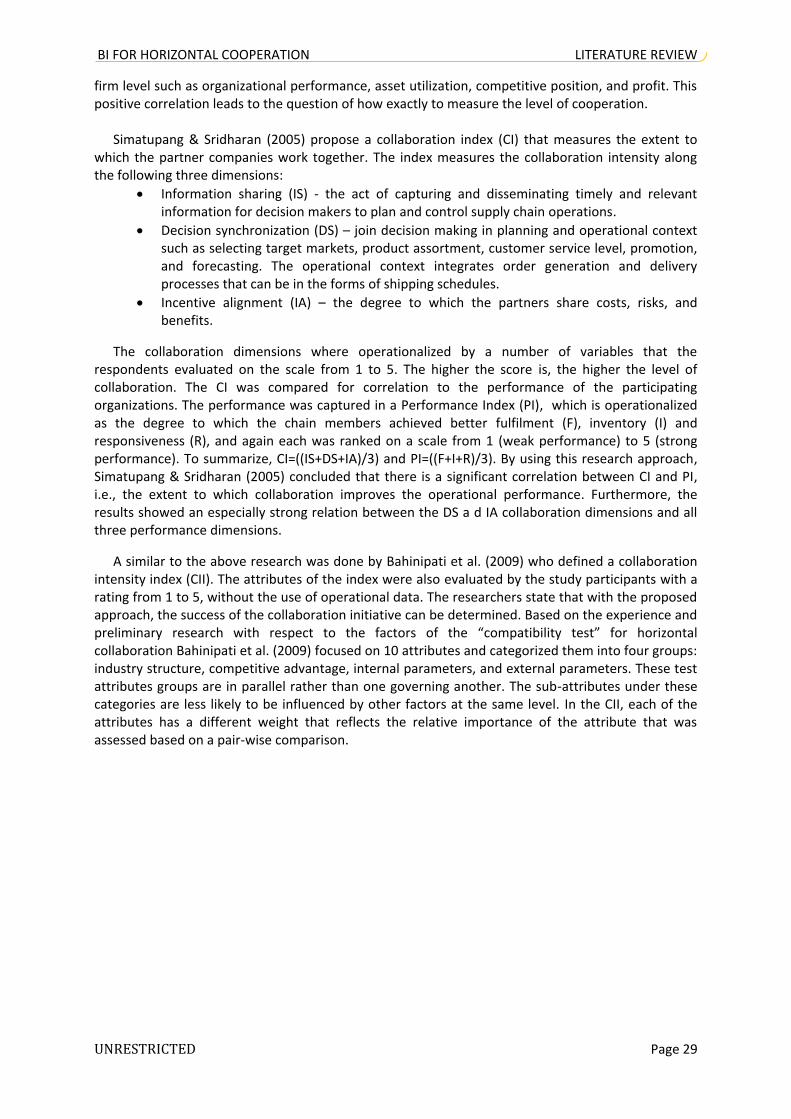
BI FOR HORIZONTAL COOPERATION LITERATURE REVIEW
UNRESTRICTED Page 29
firm level such as organizational performance, asset utilization, competitive position, and profit. This positive correlation leads to the question of how exactly to measure the level of cooperation.
Simatupang & Sridharan (2005) propose a collaboration index (CI) that measures the extent to
which the partner companies work together. The index measures the collaboration intensity along the following three dimensions:
Information sharing (IS) - the act of capturing and disseminating timely and relevant information for decision makers to plan and control supply chain operations.
Decision synchronization (DS) – join decision making in planning and operational context such as selecting target markets, product assortment, customer service level, promotion, and forecasting. The operational context integrates order generation and delivery processes that can be in the forms of shipping schedules.
Incentive alignment (IA) – the degree to which the partners share costs, risks, and benefits.
The collaboration dimensions where operationalized by a number of variables that the respondents evaluated on the scale from 1 to 5. The higher the score is, the higher the level of collaboration. The CI was compared for correlation to the performance of the participating organizations. The performance was captured in a Performance Index (PI), which is operationalized as the degree to which the chain members achieved better fulfilment (F), inventory (I) and responsiveness (R), and again each was ranked on a scale from 1 (weak performance) to 5 (strong performance). To summarize, CI=((IS+DS+IA)/3) and PI=((F+I+R)/3). By using this research approach, Simatupang & Sridharan (2005) concluded that there is a significant correlation between CI and PI, i.e., the extent to which collaboration improves the operational performance. Furthermore, the results showed an especially strong relation between the DS a d IA collaboration dimensions and all three performance dimensions.
A similar to the above research was done by Bahinipati et al. (2009) who defined a collaboration intensity index (CII). The attributes of the index were also evaluated by the study participants with a rating from 1 to 5, without the use of operational data. The researchers state that with the proposed approach, the success of the collaboration initiative can be determined. Based on the experience and preliminary research with respect to the factors of the “compatibility test” for horizontal collaboration Bahinipati et al. (2009) focused on 10 attributes and categorized them into four groups: industry structure, competitive advantage, internal parameters, and external parameters. These test attributes groups are in parallel rather than one governing another. The sub-attributes under these categories are less likely to be influenced by other factors at the same level. In the CII, each of the attributes has a different weight that reflects the relative importance of the attribute that was assessed based on a pair-wise comparison.

BI FOR HORIZONTAL COOPERATION LITERATURE REVIEW
UNRESTRICTED Page 30
A: Industry characteristics (IC) B: Competitive advantage (CA) C: Internal parameters (IP) A1: Industry structure (IS) B1: Product orientation (PO) C1: Strategic parameters (SP)
A11: Decision-making ability B11: Quality of products and services C11: Outsourcing strategies
A12: Level, scope and time horizon B12: Product life cycles C12: Attitude of top management
A13: Previous partnership history B2: General competitive edge (GCE) C2: Tactical parameters (TP)
A2: Financial stability (FS) B21: Market share C21: Communication
A21: Business performance B22: Customers orientation C22: ICT integration
A22: Capital required/available B23: Technology standard/level C23: Speed of decision making
A3: Global reputation (GR) C24: Collaborative planning
A31: Eco friendliness D: External parameters (EP) C3: Operational parameters (OP)
A32: Brand image D1: Product characteristics (PC) C31: Productivity
D11: Demand variability C32: Flexibility
D12: Price elasticity C33: Control
D13: Competitive pressure C34: Lead time
D2: Industry orientation (IO) C35: Reliability
D21: Financial performance C36: Capacity utilization
D22: Profit potential C37: Product size
D23: Resource utilization C38: Inventory turnover
Table 4: Collaboration Intensity Index (CII) attributes (Bahinipati et al. 2009)
The works of Simatupang & Sridharan (2005) and Bahinipati et al. (2009) give valuable insights on how to evaluate the extent of the cooperation, how does it related to intra-organizational performance and to assess how successful is a cooperation. However, they both suffer one significant deficiency; they are based only on qualitative data retrieved by from the participating partners. No operational data is being used, which makes it impractical for organizations to carry through on a regular basis and to take timely decisions based on that. For that reason, they are useful only to a limited degree for the purpose of this thesis.
Supply chain cooperation measurement frameworks
During the search of logistics performance literature, the concept of Supply Chain Management (SCM) often came up. Interestingly the relation between logistics and SCM was often specified in a different way in the various publications. According to Larson et al. (2007) there are four perspectives on the relation between logistics and Supply Chain Management, i.e., traditionalist, unionist, re-labelling, and intersectionist. The four perspectives, as illustrated in Figure 19, vary in terms of breadth of the Supply Chain Management concept. Unionism and intersectionism are broad because these perspectives advocate a multiple function SCM concept. In contrast, traditionalism and re-labelling are narrow since they situation SCM within a single function, logistics. Because of these varying perspectives on the relations, a brief discussion on cooperation performance in SCM is also covered here.
Figure 19: Logistics vs. Supply chain management (SCM) adapted from Larson et al. (2007)
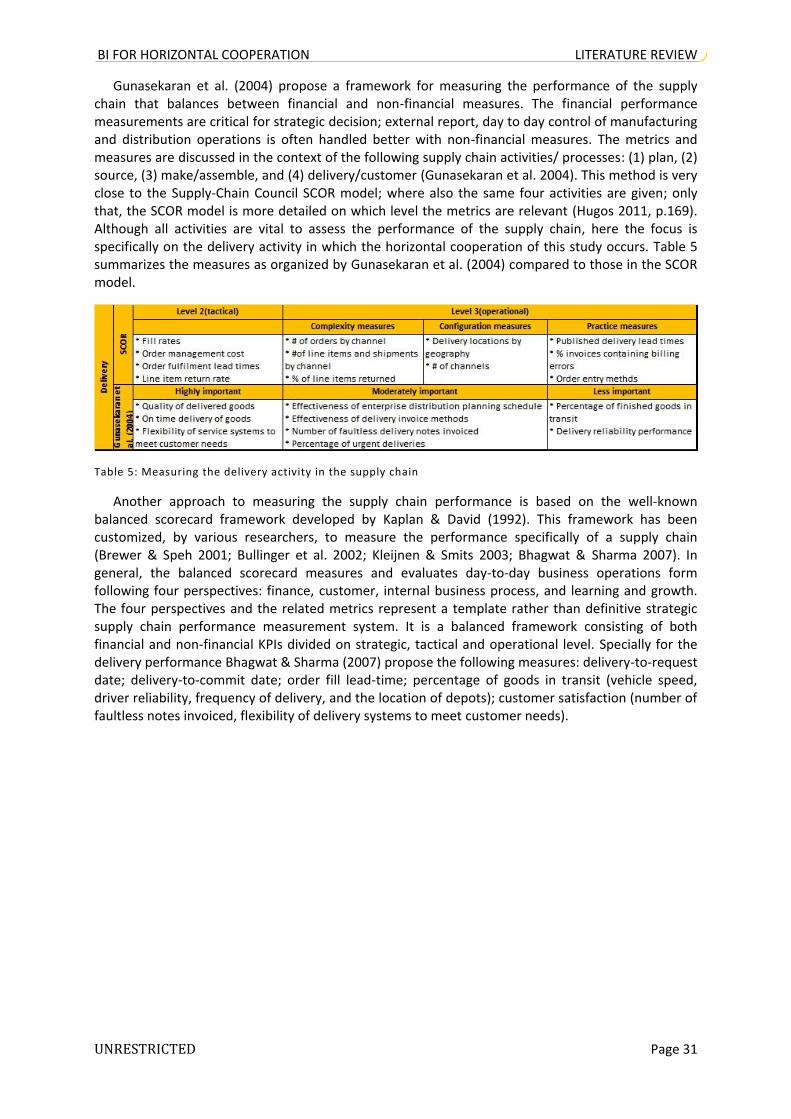
BI FOR HORIZONTAL COOPERATION LITERATURE REVIEW
UNRESTRICTED Page 31
Gunasekaran et al. (2004) propose a framework for measuring the performance of the supply chain that balances between financial and non-financial measures. The financial performance measurements are critical for strategic decision; external report, day to day control of manufacturing and distribution operations is often handled better with non-financial measures. The metrics and measures are discussed in the context of the following supply chain activities/ processes: (1) plan, (2) source, (3) make/assemble, and (4) delivery/customer (Gunasekaran et al. 2004). This method is very close to the Supply-Chain Council SCOR model; where also the same four activities are given; only that, the SCOR model is more detailed on which level the metrics are relevant (Hugos 2011, p.169). Although all activities are vital to assess the performance of the supply chain, here the focus is specifically on the delivery activity in which the horizontal cooperation of this study occurs. Table 5 summarizes the measures as organized by Gunasekaran et al. (2004) compared to those in the SCOR model.
Table 5: Measuring the delivery activity in the supply chain
Another approach to measuring the supply chain performance is based on the well-known balanced scorecard framework developed by Kaplan & David (1992). This framework has been customized, by various researchers, to measure the performance specifically of a supply chain (Brewer & Speh 2001; Bullinger et al. 2002; Kleijnen & Smits 2003; Bhagwat & Sharma 2007). In general, the balanced scorecard measures and evaluates day-to-day business operations form following four perspectives: finance, customer, internal business process, and learning and growth. The four perspectives and the related metrics represent a template rather than definitive strategic supply chain performance measurement system. It is a balanced framework consisting of both financial and non-financial KPIs divided on strategic, tactical and operational level. Specially for the delivery performance Bhagwat & Sharma (2007) propose the following measures: delivery-to-request date; delivery-to-commit date; order fill lead-time; percentage of goods in transit (vehicle speed, driver reliability, frequency of delivery, and the location of depots); customer satisfaction (number of faultless notes invoiced, flexibility of delivery systems to meet customer needs).
BI FOR HORIZONTAL COOPERATION CASE STUDY – 4C4MORE PROJECT
UNRESTRICTED Page 32
3 CASE STUDY – 4C4MORE PROJECT
In this chapter, objective O4 will be addressed. The main selection criterion for the case study used in this thesis is that it forms an exemplary case, standing as an example of a wider group of cases. This selection criterion is one of the recommended by Yin (2003, pp.40–47). The case is supposed to be a representative of cooperation initiative by logistics companies to share loads, in order to reduce the empty kilometres, and increase the load factor of the non-empty trucks that are driving. The companies are supposed to have a relationship where all of them are equal in the cooperation rather than being in a contractor-subcontractor relation.
The case study that was selected for this thesis is from within the 4C4more project. This project is about the research and development of Cross Chain Control Centers (4C). The motivation behind the 4C4more is to provide "economies of scale and scope through inter- and intra-supply-chain cooperation". The economies of scale would be achieved through more efficient use of physical resources, and the economies of scope - through more efficient use of human resources. This project is supposed to result in more efficient production, transport and warehousing processes (Dinalog 2010). It is coordinated by the Dutch Institute for Advanced Logistics (Dinalog); a number of companies and Dutch research institutes also participate in it.
3.1 LOGISTICS COMPANIES INVOLVED
Among the participants of the 4C4more project, are three logistics companies - Kuehne+Nagel (K+N), Nabuurs and Bakker Logistiek. Together the three companies have about 1200 trucks in the Netherlands. All three companies have strong strategic orientation toward sustainability and have launched internal programs for environmental responsibility. Within the 4C4more project, the three companies established a cooperation in order to reduce the empty kilometres and increase the load factor of the driving trucks. The plan is that the three companies will bundle their transport volumes with the support of one common transportation planning tool (Bakker Logistiek Zeewolde 2011). The cooperation is in a pilot stage at the time this thesis was written and will become operational in mid- 2012. In the following three subsections, the three companies are introduced in greater detail.
3.1.1 KUEHNE + NAGEL
K+N are one of the world's leading logistics providers with its 900 offices in over 100 countries and over 60,000 employees. The company was founded in 1890 in Bremen, Germany by August Kühne and Friedrich Nagel. It has grown over the years from a traditional international freight forwarder to a leading global provider of integrated supply chain solutions. K+N provide a wide range of distribution modes. The company is the number 1 global sea freight forwarder; in top 3 global air cargo forwarders; in top 3 global contract logistics providers; and among the top 6 European road & rail logistics providers (Kuehne + Nagel 2011). Some of the key industry sectors to which K+N provides services are Retail, FMCG, Aerospace, Automotive, High Tech, Industrials, Oil & Gas and Pharma & Healthcare.
In the Netherlands, the company operates under the name of Kuehne + Nagel B.V. (Contract Logistics) and Kuehne + Nagel N.V. (Forwarding), whose head office is in Rotterdam. K+N is well established across the country and operates in 27 locations, with workforce of 2,500 employees dedicated to offering integrated and end-to-end supply chain solutions. The company has more than 500,000 m2 of warehousing space rank it among the top five players in contract logistics (Kuehne + Nagel 2011).
BI FOR HORIZONTAL COOPERATION CASE STUDY – 4C4MORE PROJECT
UNRESTRICTED Page 33
Major part of K+N strategy is reducing the negative impact on the environment and promoting sustainability. The company has established an environment policy that ensures sustainable and innovative supply chain solutions. As a result of the environmental strategy, K+N have introduced a Global Facility Carbon Calculator (GFCC) in its warehouse operations. GFCC is a tool that is used to prioritize and monitor initiatives to reduce CO2, waste, and the consumption of fuel, energy and water. Some of the savings activities in the warehouses are automatic light control, energy efficient lighting, reuse of rain water, control and improvement of heating systems and others. In addition to the GFCC, the company follows green standards for new buildings. K+N has implemented in selected buildings solar power, rainwater harvesting and utilization, and greening of roofs and facades (Kuehne + Nagel 2011).
3.1.2 NABUURS
Nabuurs is a family-owned company that was founded in 1962. Presently the company has 23 locations, 1000 employees and an annual turnover of almost 100 million euro. The Nabuurs Group ranks among the top 25 logistics service providers in The Netherlands (Nabuurs Group 2011). There are five divisions within the company - logistics, transport, truck service, freight frame, and retail distribution solutions. The transport division provides transport both in the Benelux region and internationally.
Nabuurs is specialized in logistics services for Fast Moving Consumer Goods (FMCGs) and provides end-to-end distribution solutions for the entire foodservice-distribution supply chain. About 80% of the overall business is from handling ambient goods, i.e., goods that do not need cold storage and can be kept in room temperature. Besides ambient goods, the company is has expertise in the distribution of refrigerated and frozen goods. The company uses a single central database to plan the transportation of about 2 million pallets per year. Some of the leading retailers served by Nabuurs are Albert Heijn and Superunie. Also, the company operates on behalf of multiple producers that ship their products to food and drink wholesalers throughout The Netherlands. Such shippers are Sligro, Lekkerland, Makro and Deli XL (Nabuurs Group 2011).
The company is aiming to provide sustainable logistics solutions that have a minimal impact on the environment. A target of the company is to reduce CO2 by 20% between 2007 and 2012. In order to achieve that a number of measures have been taken among which are "optimizing the load factor, avoiding unnecessary detours, reducing the number of empty kilometres, encouraging a more fuel-economical driving style (economy driving) and utilizing electric and CNG vehicles" (Nabuurs Group 2011).
3.1.3 BAKKER LOGISTIEK
Bakker Logistiek is family-owned transportation company with more than 100 years of history. The company was founded by Egbert Bakker who was succeeded by his son, Dirk Bakker and later on by his grandson Peter Bakker, the current director of the Bakker Logistiek Groep. Initially the company started as transporting spirit goods by boat between Amersfoort and Rotterdam. Throughout the years, Bakker Logistiek expanded significantly and acquired two other family companies - Broersma Logistiek (2003) and Becker Logistiek (2009). Presently the company has more than 300 lorries and about 1100 staff working in 10 locations (Bakker Logistiek Zeewolde 2011). The head office of the Bakker Group is located in Zeewolde.
The company distributes freight over a comprehensive distribution network in Benelux, Germany, Austria and Switzerland. The strategic goal of Bakker Logistiek is to be a leading and sustainable logistics service provider. The company specializes in the transport, warehousing and added value services for food and related products. In the field of conditioned and refrigerated products, Bakker is one of the largest logistics service providers in the Netherlands. They deliver goods of various food

BI FOR HORIZONTAL COOPERATION CASE STUDY – 4C4MORE PROJECT
UNRESTRICTED Page 34
categories to wholesaler and retail distribution centres, but also to industry, hotels and catering and directly to shops. Some of the products that Bakker delivers on a daily basis are wine, canned food, drugs/cosmetics, margarine and sauces, dairy products and pre-packaged meat. Also, various packaging options are available, e.g., pallets, roll containers, roll-in containers, tanks, barrels and casks (Bakker Logistiek Zeewolde 2011).
In order to increase the sustainability of their operations the company launched Bakker Green, a program with concrete objectives and measures. The goal is to reduce the CO2 emissions by 50% and the energy consumption by 30% by 2020. In order to reach those targets, one of the actions the company takes is to bundle transport as much as possible in order to prevent driving empty kilometres. Another action is to implement technical improvements, e.g., more Lorries with clean enhanced environmentally friendly vehicle (EEV) engines. Also, the company has invested in new generation of on-board computers for real-time monitoring of vehicles and a program for staff sustainability awareness. Furthermore, the company participates in the Green Order initiative where based on the distance, volume and weight, the C02 emissions of each delivery are calculated and stated on the delivery note (Bakker Logistiek Zeewolde 2011).
3.2 CURRENT SITUATION
At the beginning of the 4C4More project, the three companies did not have any previous partnership between each other. The initiative to cooperate is motivate by the need to improve the efficiency of the road freight transportation activities in each of the companies (as well as other general reason described in subsection 2.3.2 “REASONS FOR ESTABLISHING HORIZONTAL COOPERATION”). In this cooperation, the companies will consolidate their vehicle fleets and transportation networks. Based on a performed simulation for those particular horizontal cooperation substantial benefits were projected (exact figures not available). The strategic goals of the partnership are to achieve higher sustainability and better profit margins by reducing empty kilometres, improving vehicle utilization, increasing on-time performance.
The three companies have a strong commitment to sustainability and environment preservation. As already mentioned earlier in this chapter K+N have introduced a Global Facility Carbon Calculator in its warehouse operations, Nabuurs has a target to reduce CO2 by 20% between 2007 and 2012, and Bakker’s goal is to reduce the CO2 emissions by 50% and the energy consumption by 30% until 2020. Another common characteristics of the three companies is that they all operate to a large extend on the same market of Fast Moving Consumer Goods (FMCG). The three LSPs have well developed networks within the Netherlands, although the concentration throughout the country is not even. For example, K+N has more developed network in the south, where the other two companies have more extensive network in the north of the country. The similarities and the complementarities in the capabilities of K+N, Nabuurs and Bakker make them good potential partners.
Besides the above enablers for the cooperation, there is still one large impediment; the fact that the three companies are direct competitors for the same customer pool. Due to that, a high level of trust and transparency between the partners is required to make the cooperation successful. This complex situation opens up many issues related to information sharing; therefore, the policies are expected to be more restrictive than liberal, i.e., information will not be shared unless it is vital for the proper functioning of the cooperation. In addition to the information sharing challenges, there are other challenges related to gain sharing. The way the cost and the benefits will be allocated fairly is a hugely critical point to be agreed on between the cooperation partners.
CONFIDENTIAL

BI FOR HORIZONTAL COOPERATION CASE STUDY – 4C4MORE PROJECT
UNRESTRICTED Page 35
In addition to the planning of the order executions, the cooperation partners must monitor the performance of the cooperation and the extent to which the desired benefits are realized. This is related on the issue of information sharing. Each of the companies currently steers their transportation activities on a set of proprietary KPIs. The set of KPIs is probably similar between the companies although some differences are expected due to the distinct strategies and values of each company. However, even if the KPIs are similar still the calculation process is probably quite different. For example, the three companies have measures to track CO2 emissions; however, there are multiple methods to do that and each yielding different results. Same goes for empty kilometre, load factor and on-time performance. If the companies continue to use only their internal performance measures for evaluating the effect of the cooperation, it could be hard to communicate about the effects of the cooperation on the different partners. Furthermore, it could be impossible to track the progress toward the predefined strategic goals.
3.3 DESIRED SITUATION
K+N, Nabuurs and Bakker strongly believe that the cooperative initiative will result in significant benefits for all the participants that will outweigh the extra coordination costs and the inherited risk involved. In the establishment phase, in which the partnership is at the time this thesis is written, the three companies are working hard to build the foundations for a successful cooperation. Top level support and leadership is provided as this is a significant undertaking for all of the partners. They take active steps to ensure that the most appropriate planning tool is implemented, a tool that will give fair treatment to each of the participating companies. Also, considerable attention is placed on the gain sharing method as this will determine at the end what each partner gets from the cooperation. Another important area of concern is how to track the progress of the cooperation when it becomes operational. In the ideal situation, the companies will be able to link the gain sharing method to adapt dynamically based on the on-going progress of the cooperation. The desired situation is to have a successful, long-term and sustainable partnership between the three LSPs where cooperative behaviour is continuously rewarded, and non-cooperative behaviour is discouraged in early stages.
In terms of the performance measurement of the cooperation, the companies would like to be able to get timely information on how trips executed on the sharing platform are performed. They should be able to compare the performance of the own fleets to that of the trips done by the partners. Also of high importance for the assessment of the cooperation progress is to measure the level of harmonization between the three companies. By harmonization it is meant the level of cooperation or how often join trips are executed, how many of them were successful and how many were not. In addition, it should measure the quality of planning, with emphasis on optimizing the efficiency of the used resources; if the trips were executed effectively in accordance to the planned schedule. Moreover, it should be possible to follow the trends over time and establish benchmarks and targets for the cooperation.
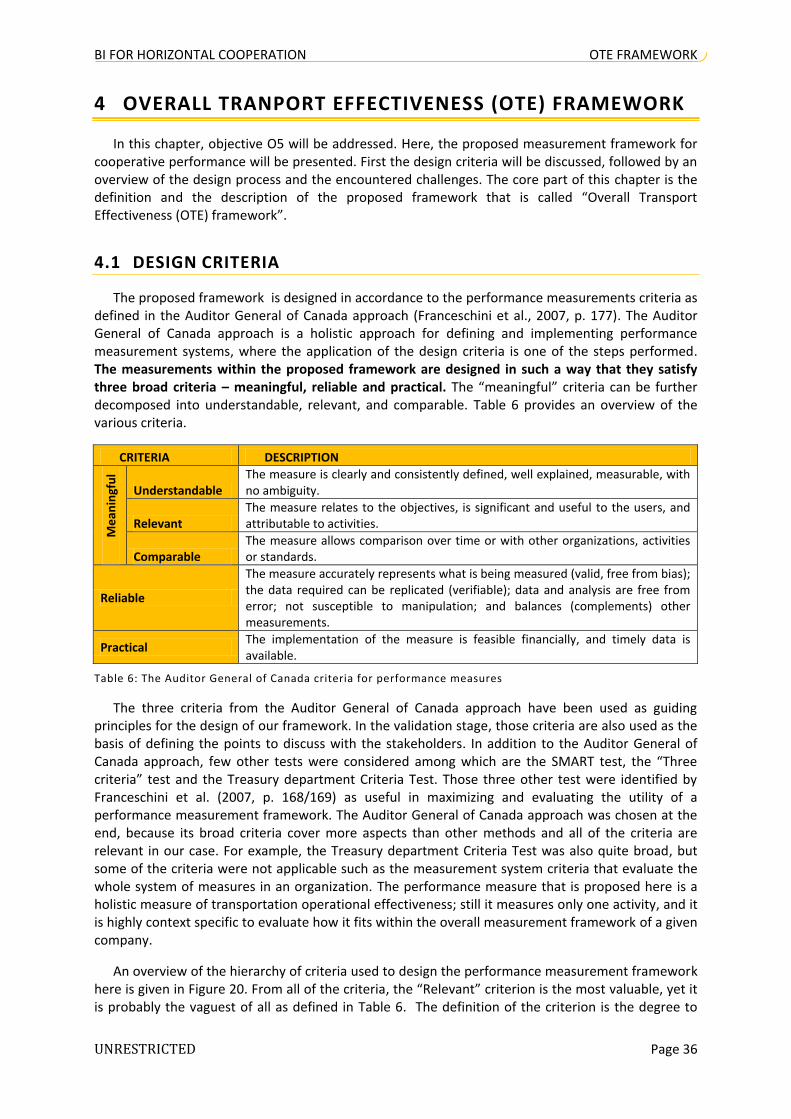
BI FOR HORIZONTAL COOPERATION OTE FRAMEWORK
UNRESTRICTED Page 36
4 OVERALL TRANPORT EFFECTIVENESS (OTE) FRAMEWORK
In this chapter, objective O5 will be addressed. Here, the proposed measurement framework for cooperative performance will be presented. First the design criteria will be discussed, followed by an overview of the design process and the encountered challenges. The core part of this chapter is the definition and the description of the proposed framework that is called “Overall Transport Effectiveness (OTE) framework”.
4.1 DESIGN CRITERIA
The proposed framework is designed in accordance to the performance measurements criteria as defined in the Auditor General of Canada approach (Franceschini et al., 2007, p. 177). The Auditor General of Canada approach is a holistic approach for defining and implementing performance measurement systems, where the application of the design criteria is one of the steps performed. The measurements within the proposed framework are designed in such a way that they satisfy three broad criteria – meaningful, reliable and practical. The “meaningful” criteria can be further decomposed into understandable, relevant, and comparable. Table 6 provides an overview of the various criteria.
CRITERIA DESCRIPTION
Me
anin
gfu
l
Understandable The measure is clearly and consistently defined, well explained, measurable, with no ambiguity.
Relevant The measure relates to the objectives, is significant and useful to the users, and attributable to activities.
Comparable The measure allows comparison over time or with other organizations, activities or standards.
Reliable
The measure accurately represents what is being measured (valid, free from bias); the data required can be replicated (verifiable); data and analysis are free from error; not susceptible to manipulation; and balances (complements) other measurements.
Practical The implementation of the measure is feasible financially, and timely data is available.
Table 6: The Auditor General of Canada criteria for performance measures
The three criteria from the Auditor General of Canada approach have been used as guiding principles for the design of our framework. In the validation stage, those criteria are also used as the basis of defining the points to discuss with the stakeholders. In addition to the Auditor General of Canada approach, few other tests were considered among which are the SMART test, the “Three criteria” test and the Treasury department Criteria Test. Those three other test were identified by Franceschini et al. (2007, p. 168/169) as useful in maximizing and evaluating the utility of a performance measurement framework. The Auditor General of Canada approach was chosen at the end, because its broad criteria cover more aspects than other methods and all of the criteria are relevant in our case. For example, the Treasury department Criteria Test was also quite broad, but some of the criteria were not applicable such as the measurement system criteria that evaluate the whole system of measures in an organization. The performance measure that is proposed here is a holistic measure of transportation operational effectiveness; still it measures only one activity, and it is highly context specific to evaluate how it fits within the overall measurement framework of a given company.
An overview of the hierarchy of criteria used to design the performance measurement framework here is given in Figure 20. From all of the criteria, the “Relevant” criterion is the most valuable, yet it is probably the vaguest of all as defined in Table 6. The definition of the criterion is the degree to
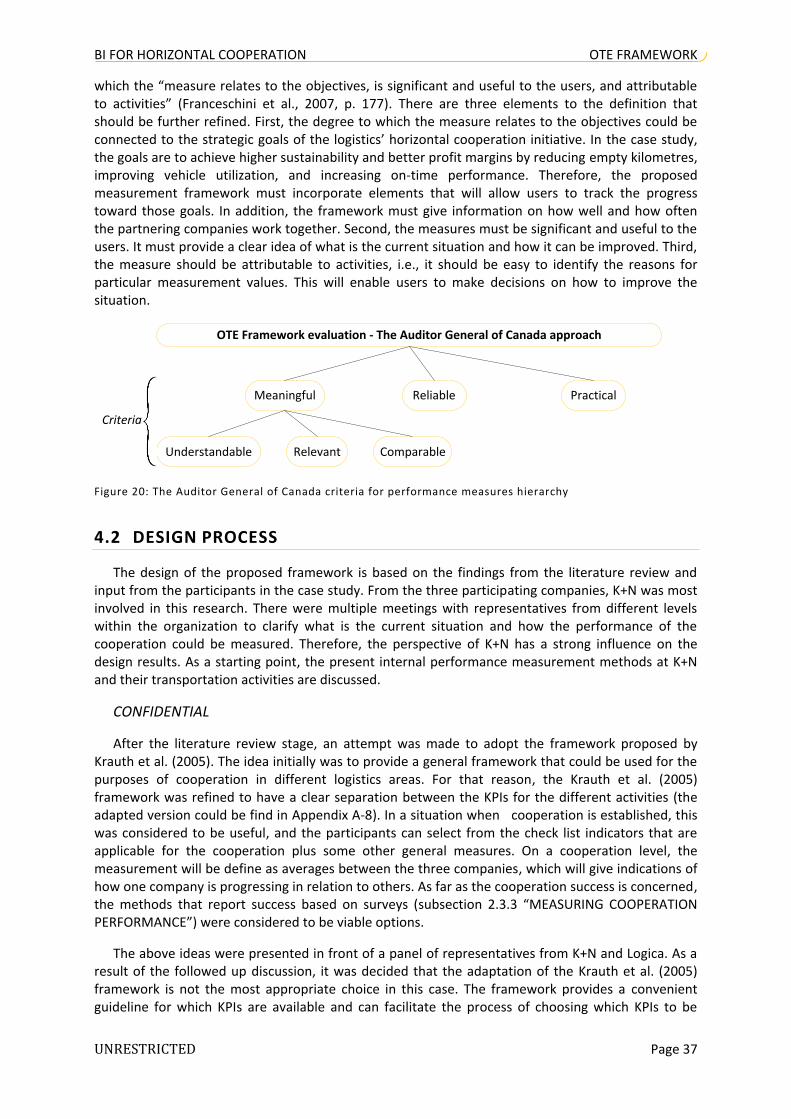
BI FOR HORIZONTAL COOPERATION OTE FRAMEWORK
UNRESTRICTED Page 37
which the “measure relates to the objectives, is significant and useful to the users, and attributable to activities” (Franceschini et al., 2007, p. 177). There are three elements to the definition that should be further refined. First, the degree to which the measure relates to the objectives could be connected to the strategic goals of the logistics’ horizontal cooperation initiative. In the case study, the goals are to achieve higher sustainability and better profit margins by reducing empty kilometres, improving vehicle utilization, and increasing on-time performance. Therefore, the proposed measurement framework must incorporate elements that will allow users to track the progress toward those goals. In addition, the framework must give information on how well and how often the partnering companies work together. Second, the measures must be significant and useful to the users. It must provide a clear idea of what is the current situation and how it can be improved. Third, the measure should be attributable to activities, i.e., it should be easy to identify the reasons for particular measurement values. This will enable users to make decisions on how to improve the situation.
OTE Framework evaluation - The Auditor General of Canada approach
Meaningful PracticalReliable
Understandable Relevant Comparable
Criteria
Figure 20: The Auditor General of Canada criteria for performance measures hierarchy
4.2 DESIGN PROCESS
The design of the proposed framework is based on the findings from the literature review and input from the participants in the case study. From the three participating companies, K+N was most involved in this research. There were multiple meetings with representatives from different levels within the organization to clarify what is the current situation and how the performance of the cooperation could be measured. Therefore, the perspective of K+N has a strong influence on the design results. As a starting point, the present internal performance measurement methods at K+N and their transportation activities are discussed.
CONFIDENTIAL
After the literature review stage, an attempt was made to adopt the framework proposed by Krauth et al. (2005). The idea initially was to provide a general framework that could be used for the purposes of cooperation in different logistics areas. For that reason, the Krauth et al. (2005) framework was refined to have a clear separation between the KPIs for the different activities (the adapted version could be find in Appendix A-8). In a situation when cooperation is established, this was considered to be useful, and the participants can select from the check list indicators that are applicable for the cooperation plus some other general measures. On a cooperation level, the measurement will be define as averages between the three companies, which will give indications of how one company is progressing in relation to others. As far as the cooperation success is concerned, the methods that report success based on surveys (subsection 2.3.3 “MEASURING COOPERATION PERFORMANCE”) were considered to be viable options.
The above ideas were presented in front of a panel of representatives from K+N and Logica. As a result of the followed up discussion, it was decided that the adaptation of the Krauth et al. (2005) framework is not the most appropriate choice in this case. The framework provides a convenient guideline for which KPIs are available and can facilitate the process of choosing which KPIs to be

BI FOR HORIZONTAL COOPERATION OTE FRAMEWORK
UNRESTRICTED Page 38
selected. However, it was too general for the purpose. The focus should be on measures only for transportation effectiveness and cooperation harmonization. The Krauth et al. (2005) framework falls short on cooperation harmonization measurements; it focuses on internal measures and do not take into regard how well the partners work together and how often they do that. At the same time, the survey type methods for collecting information about the progress of the cooperation were considered impractical although they have strong theoretical foundations.
As a result of the panel discussion, it was concluded that another method for logistics cooperation performance measurement should be sought after which not only measures internal performance but also harmonization levels. This concept is illustrated in Figure 21. The figure represents the three companies that have their own reports (performance measures) but with the introduction of the cooperation they may have to change some of those measures and use common definitions. The internal measures would still remain private for the company (may be some will be shared to derive average values). In addition, new harmonization measures that are public for all participants will be introduce. The companies will be able to assess the effect of the cooperation on their internal performance by combining internal and harmonization measures, and hence the success of the cooperation. The internal measures will allow the companies to track the performance trends from before and after the cooperation. From the harmonization measures they will be able to track the extent of the cooperation. Depending on the intensity of cooperation it will have a different impact on the internal performance. For example, if one of the partners share only 5% of the trips on the cooperation platform, the impact will be much smaller compared to a scenario where 35% are shared.
Figure 21: Concept for logistics cooperation performance measurement
In order to define a new measurement framework, a brainstorming session with representatives from K+N was organized. At the session, the adaptation of the Krauth et al. (2005) framework was used as a starting point for the idea generation. During the session each of the participants defined a set of indicators that could be useful, wrote them on a post-it note and later the indicators were classified by the group (end result showed in Appendix A-9). The indicators were classifies according to the management level at which they are used as well as the frequency of reporting. Also, three broad groups were defined which are depicted in Figure 22. As a result of that session, specific harmonization measures were identified. The harmonization measures are: (1) Response time exchange request; (2) Successful exchange request in %; (3) Cost reduction in exchanged drops; (4) Pallets or kms exchanges in %; (5) Empty kms of the cooperating partners; (6) On-time performance of the cooperating partners.

BI FOR HORIZONTAL COOPERATION OTE FRAMEWORK
UNRESTRICTED Page 39
Figure 22: Categories of indicators relevant to cooperation performance
It was particularly challenging to capture the relations between the different indicators and at what level its best to report the cooperation performance. For example, Figure 23 illustrates some of the relationships and cause-effects involved. For those reasons, it was decided that the proposed measurement framework should provide clear hierarchical relations; in addition, to including the most relevant private and public measures.
Figure 23: Example of the complex relations between measures
Following the panel discussion and the brainstorming session, few more meetings were organized where additional details were covered. Simon Dalmolen, one of the supervisors of this thesis, proposed a measurement framework for the logistics cooperation initiative that is based on the lean paradigm and is related to the Overall Vehicle Effectiveness (OVE) framework covered in subsection 2.2.3 “MEASUREMENT FRAMEWORKS”. This framework was refined based on the input from K+N and further defined and adapted by the student writing this thesis.
4.3 OTE FRAMEWORK DEFINITION
The Overall Transport Effectiveness (OTE) framework is a hierarchy of metrics which evaluates and indicates how effectively transportation vehicles are utilized, and/or how effectively transportation tasks are executed compared to the planning. The framework is inspired by the Overall Equipment Effectiveness (OEE) framework which is widely used to measure the utilization of manufacturing equipment and Overall Vehicle Effectiveness (OVE) measures as defined by Simons et al. (2004). The results in the OTE framework are stated in a generic form which allows comparison
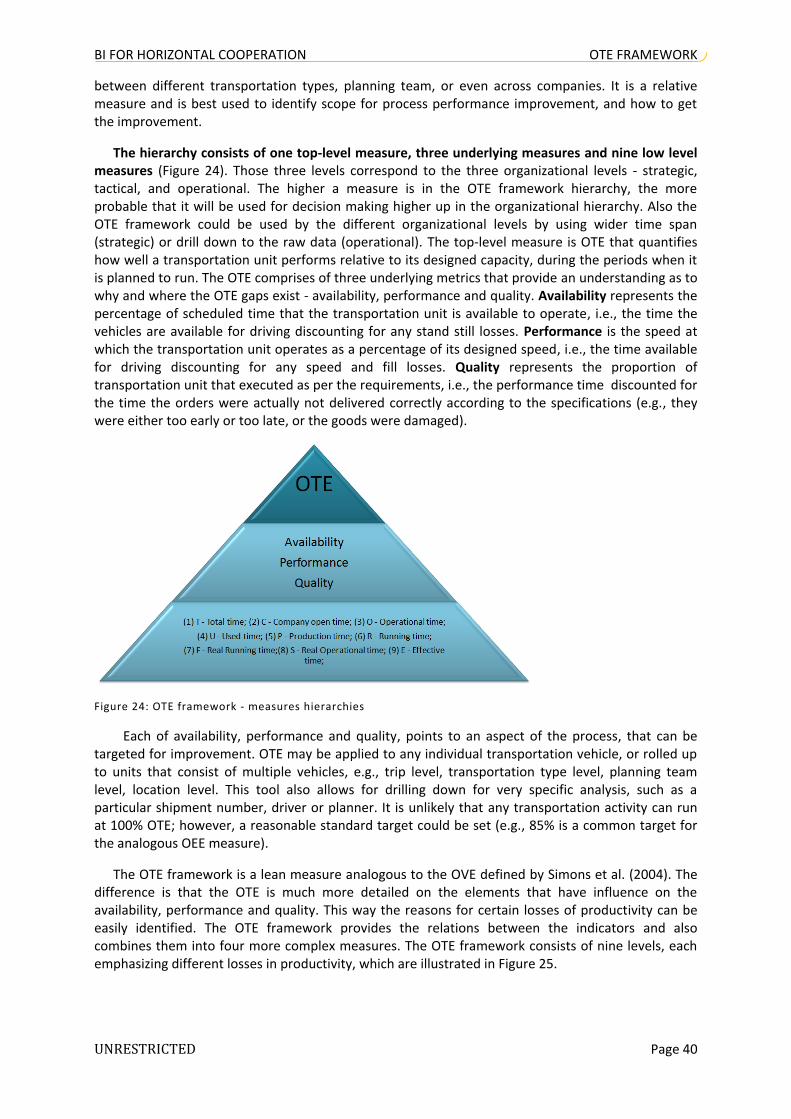
BI FOR HORIZONTAL COOPERATION OTE FRAMEWORK
UNRESTRICTED Page 40
between different transportation types, planning team, or even across companies. It is a relative measure and is best used to identify scope for process performance improvement, and how to get the improvement.
The hierarchy consists of one top-level measure, three underlying measures and nine low level measures (Figure 24). Those three levels correspond to the three organizational levels - strategic, tactical, and operational. The higher a measure is in the OTE framework hierarchy, the more probable that it will be used for decision making higher up in the organizational hierarchy. Also the OTE framework could be used by the different organizational levels by using wider time span (strategic) or drill down to the raw data (operational). The top-level measure is OTE that quantifies how well a transportation unit performs relative to its designed capacity, during the periods when it is planned to run. The OTE comprises of three underlying metrics that provide an understanding as to why and where the OTE gaps exist - availability, performance and quality. Availability represents the percentage of scheduled time that the transportation unit is available to operate, i.e., the time the vehicles are available for driving discounting for any stand still losses. Performance is the speed at which the transportation unit operates as a percentage of its designed speed, i.e., the time available for driving discounting for any speed and fill losses. Quality represents the proportion of transportation unit that executed as per the requirements, i.e., the performance time discounted for the time the orders were actually not delivered correctly according to the specifications (e.g., they were either too early or too late, or the goods were damaged).
Figure 24: OTE framework - measures hierarchies
Each of availability, performance and quality, points to an aspect of the process, that can be targeted for improvement. OTE may be applied to any individual transportation vehicle, or rolled up to units that consist of multiple vehicles, e.g., trip level, transportation type level, planning team level, location level. This tool also allows for drilling down for very specific analysis, such as a particular shipment number, driver or planner. It is unlikely that any transportation activity can run at 100% OTE; however, a reasonable standard target could be set (e.g., 85% is a common target for the analogous OEE measure).
The OTE framework is a lean measure analogous to the OVE defined by Simons et al. (2004). The difference is that the OTE is much more detailed on the elements that have influence on the availability, performance and quality. This way the reasons for certain losses of productivity can be easily identified. The OTE framework provides the relations between the indicators and also combines them into four more complex measures. The OTE framework consists of nine levels, each emphasizing different losses in productivity, which are illustrated in Figure 25.
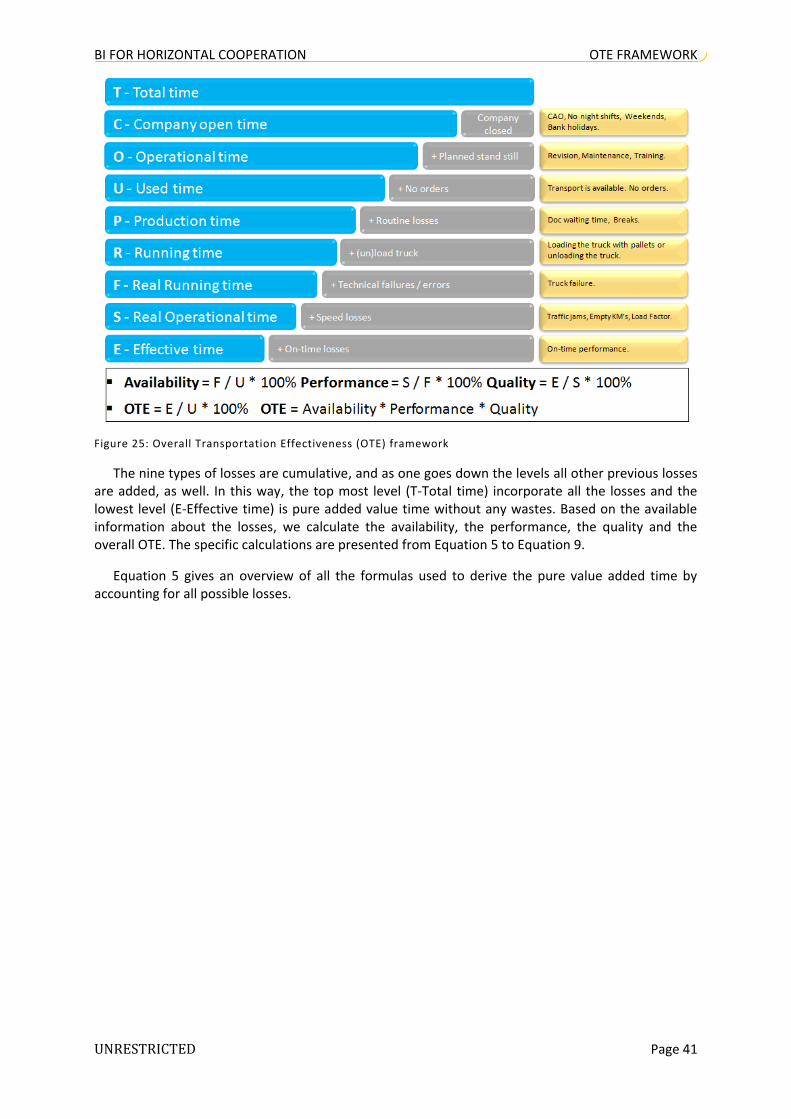
BI FOR HORIZONTAL COOPERATION OTE FRAMEWORK
UNRESTRICTED Page 41
Figure 25: Overall Transportation Effectiveness (OTE) framework
The nine types of losses are cumulative, and as one goes down the levels all other previous losses are added, as well. In this way, the top most level (T-Total time) incorporate all the losses and the lowest level (E-Effective time) is pure added value time without any wastes. Based on the available information about the losses, we calculate the availability, the performance, the quality and the overall OTE. The specific calculations are presented from Equation 5 to Equation 9.
Equation 5 gives an overview of all the formulas used to derive the pure value added time by accounting for all possible losses.

BI FOR HORIZONTAL COOPERATION OTE FRAMEWORK
UNRESTRICTED Page 42
TimeerformanceNotOnTimePLossesLoadFactoreEmptyKmTim
edLossTimeTrafficSpereTimeTruckFailuadingTimeExcessUnloingTimeExcessLoad
BreaksTimeTimeDocWaitingmeTrainingTieTimeMaintenancisionsTimePlannedRev
meNoOrdersTisedTimeCompanyCloTotalTime:TimeEffectiveT:E
LossesLoadFactoreEmptyKmTim
edLossTimeTrafficSpereTimeTruckFailuadingTimeExcessUnloingTimeExcessLoad
BreaksTimeTimeDocWaitingmeTrainingTieTimeMaintenancisionsTimePlannedRev
meNoOrdersTisedTimeCompanyCloTotalTime:TionalTimeRealOperat:S
reTimeTruckFailuadingTimeExcessUnloingTimeExcessLoad
BreaksTimeTimeDocWaitingmeTrainingTieTimeMaintenancisionsTimePlannedRev
meNoOrdersTisedTimeCompanyCloTotalTime:TgTimeRealRunnin:F
adingTimeExcessUnloingTimeExcessLoad
BreaksTimeTimeDocWaitingmeTrainingTieTimeMaintenancisionsTimePlannedRev
meNoOrdersTisedTimeCompanyCloTotalTime:TeRunningTim:R
BreaksTimeTimeDocWaitingmeTrainingTieTimeMaintenancisionsTimePlannedRev
meNoOrdersTisedTimeCompanyCloTotalTime:TTimeProduction:P
meNoOrdersTimeTrainingTiTimeMaitenance
isionsTimePlannedRevsedTimeCompanyCloTotalTime:TUsedTime:U
meTrainingTiTimeMaitenance
isionsTimePlannedRevsedTimeCompanyCloTotalTime:TlTimeOperationa:O
sedTimeCompanyCloTotalTime:TnTimeCompanyOpe:C
Equation 5: OTE levels formulas
Equation 6 shows the formula for calculating the availability. The availability is the time the vehicles are available for driving discounting for any stand still losses.
100*UsedTime:U
reTime)TruckFailuadingTimeExcessUnlo
ingTimeExcessLoadBreaksTimeTimeDocWaiting
meTrainingTieTimeMaintenancevisionsTim(PlannedReUsedTime:U
tyAvailabili
Equation 6: OTE Availability
Equation 7 represents the performance time that is the time available for driving discounting for any speed and fill losses.
100*TimeRealRunnig:F
Losses)LoadFactor
eEmptyKmTimeeedLossTim(TrafficSpTimeRealRunnig:F
ePerformanc
Equation 7: OTE Performance

BI FOR HORIZONTAL COOPERATION OTE FRAMEWORK
UNRESTRICTED Page 43
Equation 8 represents the quality time that is the performance time discounted for the time the orders were actually not delivered correctly according to the specifications, e.g., they were either too early or too late, or the goods were damaged, etc.
100*ionalTimeRealOperat:S
eTime)Performanc(NotOnTimeionalTimeRealOperat:SQuality
Equation 8: OTE Quality
Equation 9 gives the highest level composed measure OTE. This measure combines the availability, the performance and the quality to produce one single figure for effectiveness and efficiency.
Quality*ePerformanc*tyAvailabili
100*UsedTime:U
Time)erformanceNotOnTimePLossesLoadFactor
eEmptyKmTimedLossTimeTrafficSpereTimeTruckFailu
adingTimeExcessUnloingTimeExcessLoadBreaksTimeTimeDocWaiting
meTrainingTieTimeMaintenancevisionsTim(PlannedReUsedTime:U
OTE
Equation 9: OTE formula
Although the OTE measure is named as effectiveness measure (adopted from the names of the measures used in the lean paradigm), it also measures efficiency to a certain extent. Especially in the “Performance” measure this is most visible. The empty kilometres and the load factor give information about efficiency or how well the resources are utilized. If the empty kilometres start to increase or the load factor starts to decrease, then there is loss of efficiency.
4.4 OTE FRAMEWORK USES
The OTE measure can be classified in the performance measurement space as an operational and monitoring measure in the framework defined by Griffis et al. (2007) (subsection 2.2.3 “MEASUREMENT FRAMEWORKS”). Its main use will be identifying losses in the transportation activity and planning corrective actions to reduce such losses in the future. It is a highly flexible framework that allows the losses to be expressed in different ways in addition to time, e.g., the measures can be expressed in € or CO2 depending on the need of the company. Also, it could be used on all three levels of the organization – strategic, tactical and operational. If the time frame and the aggregation level changes, it could easily be transformed from an operational to a strategic KPI. For example, on an operational level the effectiveness could be monitored on a daily basis per planning team per transportation type. At the same time, on a strategic level the OTE measures could be used to track the trends as one aggregated number for a quarter per transportation type.
From the types of measures in Figure 22 (page 39) the OTE is an internal measure that is highly scalable. It could easily be applied for one single planning location as well as for the whole company for every transport that is operated. So in the case of horizontal cooperation an LSP like K+N could have four instances of the OTE framework implemented to monitor the performance of each transportation type, i.e., own vehicles, subcontractors’ vehicles, charter vehicle, and of course, the vehicles used to do cooperative deliveries. However, OTE is a measure about the execution of the trips; it must be combined with measures for the quality of the planning. Such measures could be CO2 emissions or total kilometres driven per trip or per truck. Those measures will show if the planning was done well, and if it was not done just so it exploits weaknesses in the OTE -- to make the OTE figured improve. For example, speed and fill loss occurs when the vehicle is not fully loaded.

BI FOR HORIZONTAL COOPERATION OTE FRAMEWORK
UNRESTRICTED Page 44
An artificial boost in the OTE could be done by planning the heaviest drop to be done last which is not the most cost-effective solution. This will not result in any real increase in effectiveness, but it will only cost more money to the LSP.
In order to make the OTE framework a real measure of logistics cooperation performance and success, it must be used in combination with harmonization measures. Such harmonization measures are: (1) Response time exchange request; (2) Successful exchange request in %; (3) Cost reduction in exchanged drops; (4) Pallets or kms exchanges in %; (5) Empty kms of the cooperating partners; (6) On-time performance of the cooperating partners. By combining OTE with harmonization indicators, the partners will have a clear overview of the operation impact of the cooperation. By using the same definition for the measures in the OTE framework and the harmonization measures, they will be able to communicate the progress of the cooperation. Perhaps also this information could be used for negotiations related to cost and gain sharing discussion. It is an enormous advantage that the OTE framework required extremely limited amount of shared information, easy to comply with the restrictive information sharing policies of the partners.
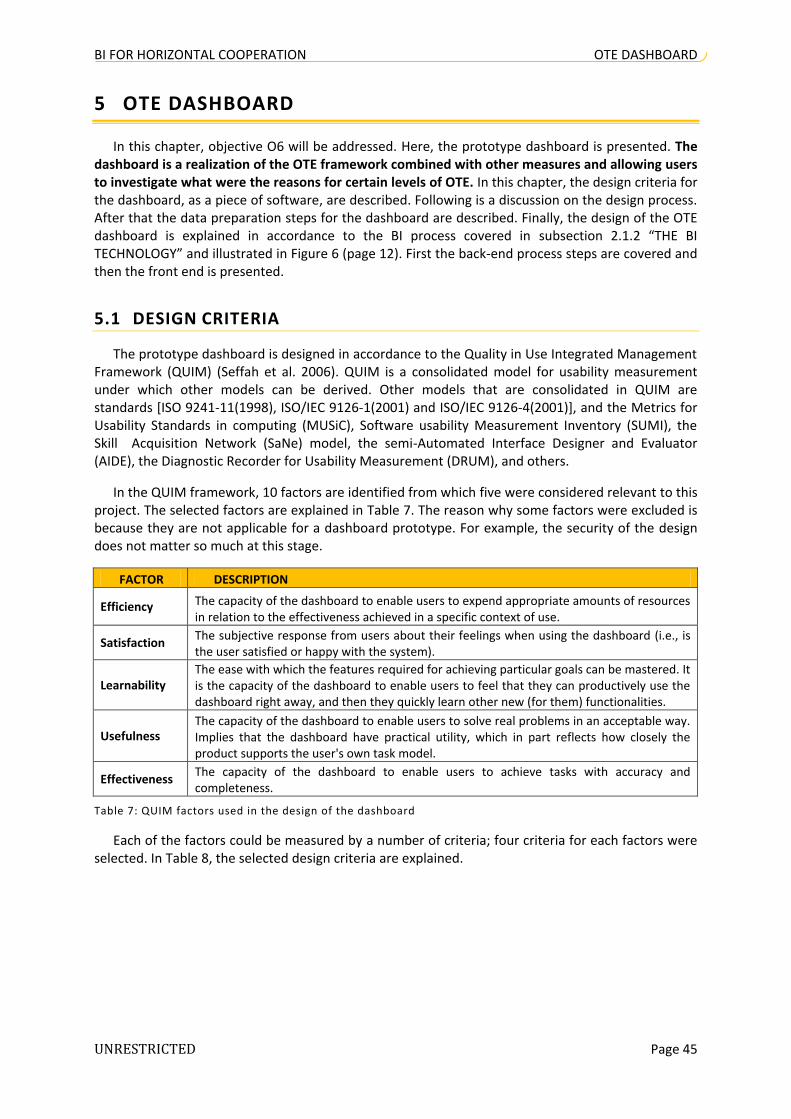
BI FOR HORIZONTAL COOPERATION OTE DASHBOARD
UNRESTRICTED Page 45
5 OTE DASHBOARD
In this chapter, objective O6 will be addressed. Here, the prototype dashboard is presented. The dashboard is a realization of the OTE framework combined with other measures and allowing users to investigate what were the reasons for certain levels of OTE. In this chapter, the design criteria for the dashboard, as a piece of software, are described. Following is a discussion on the design process. After that the data preparation steps for the dashboard are described. Finally, the design of the OTE dashboard is explained in accordance to the BI process covered in subsection 2.1.2 “THE BI TECHNOLOGY” and illustrated in Figure 6 (page 12). First the back-end process steps are covered and then the front end is presented.
5.1 DESIGN CRITERIA
The prototype dashboard is designed in accordance to the Quality in Use Integrated Management Framework (QUIM) (Seffah et al. 2006). QUIM is a consolidated model for usability measurement under which other models can be derived. Other models that are consolidated in QUIM are standards [ISO 9241-11(1998), ISO/IEC 9126-1(2001) and ISO/IEC 9126-4(2001)], and the Metrics for Usability Standards in computing (MUSiC), Software usability Measurement Inventory (SUMI), the Skill Acquisition Network (SaNe) model, the semi-Automated Interface Designer and Evaluator (AIDE), the Diagnostic Recorder for Usability Measurement (DRUM), and others.
In the QUIM framework, 10 factors are identified from which five were considered relevant to this project. The selected factors are explained in Table 7. The reason why some factors were excluded is because they are not applicable for a dashboard prototype. For example, the security of the design does not matter so much at this stage.
FACTOR DESCRIPTION
Efficiency The capacity of the dashboard to enable users to expend appropriate amounts of resources in relation to the effectiveness achieved in a specific context of use.
Satisfaction The subjective response from users about their feelings when using the dashboard (i.e., is the user satisfied or happy with the system).
Learnability The ease with which the features required for achieving particular goals can be mastered. It is the capacity of the dashboard to enable users to feel that they can productively use the dashboard right away, and then they quickly learn other new (for them) functionalities.
Usefulness The capacity of the dashboard to enable users to solve real problems in an acceptable way. Implies that the dashboard have practical utility, which in part reflects how closely the product supports the user's own task model.
Effectiveness The capacity of the dashboard to enable users to achieve tasks with accuracy and completeness.
Table 7: QUIM factors used in the design of the dashboard
Each of the factors could be measured by a number of criteria; four criteria for each factors were selected. In Table 8, the selected design criteria are explained.

BI FOR HORIZONTAL COOPERATION OTE DASHBOARD
UNRESTRICTED Page 46
CRITERIA DESCRIPTION
Minimal action Capability of the dashboard to help users achieve their task in a minimal number of steps.
User guidance Whether the user interface provides context sensitive help and meaningful feedback when errors occur.
Navigability Whether the user can move around in the dashboard in an efficient way.
Minimal memory load
Whether the user is required to keep minimal amount of information in mind in order to achieve a task.
Feedback Responsiveness of the dashboard to user inputs or events in a meaningful way.
Likeability User perception, feelings, and opinion of the product.
Consistency Degree of uniformity among elements of the user interface and whether they offer meaningful metaphors to users.
Accuracy Capability to provide correct results or effects.
Table 8: QUIM criteria used in the design of the dashboard
A given criteria could be an operationalization of one or more factors. Figure 26 provides the map of how factors relate to criteria. The selected criteria were followed in the design of the dashboard, and the goal is to achieve a high level compliance to the factors.
Prototype evaluation – Quality in Use Integrated Measurement (QUIM)
Efficiency Satisfaction EffectivenessUsefulnessLearnability
Likeability AccuracyConsistencyNavigability FeedbackMinimal memory
loadMinimal action
User guidance
Factors
Criteria
Figure 26: Map between the factors and the criteria used in the design of the dashboard
5.2 DESIGN PROCESS
In order to be able to create a dashboard prototype, a dataset from K+N is used. The dataset represent two week data extract from few operational systems on the way trips were planned and executed.
The design of the dashboard to a certain degree is depended on the software that would be used for the implementation. A research was made on the most appropriate tools for dashboard creation, and QlikView was selected as a good option. QlikView is a complete software suite for business analysis (QlikView 2012). It is based on a single architecture, so it covers all types of analysis and reporting needs of an enterprise. QlikView was chosen because of its powerful dashboard creation capabilities, the accessibility of documentation and the possibility to use full functioning software on the personal (free) edition.
Before the dataset provided by K+N could be used, it had to go through a series of data cleansing, enrichment and integration steps. The initial intention was to use only SQL code for that purpose, but soon the amount of code became unmanageable and hard to follow all the incorporated logic. For that reason, a decision was made, by the author of this thesis, to use a commercial data integration tool to prepare the data. After a short survey on the alternatives, Microsoft SQL Server 2008 Integration Services (SSIS) was chosen. SSIS is a platform for building enterprise-level data integration

BI FOR HORIZONTAL COOPERATION OTE DASHBOARD
UNRESTRICTED Page 47
and data transformations solutions (Microsoft 2011). It is used to solve complex business problems by updating data warehouses, cleaning and mining data, and managing data. SSIS can extract and transform data from a wide variety of sources such as XML data files, flat files, and relational data sources, and then load the data into one or more destinations. The development environment includes a rich set of built-in tasks and transformations and tools for constructing packages. SSIS provides a suitable graphical user interface that allows an elegant graphics representation of the data flows as well as flexibility to programmers to create custom tasks.
Overall, the dashboard prototype design and the development process were iterative. The features of the K+N’s source dataset and the specification of the OTE framework were the starting points for the development of the prototype. In order to use the source data into the OTE framework, multiple steps had to be performed. First, a high level design of the dashboard was created. Then, a data warehouse schema that can support this design was defined (the input data for QlikView). From that point, the most difficult task was to transform the source data in such a way that it fits the desired data warehouse schema. In the course of development, new ideas about the prototype were generated which reflected back on the transformation requirements. For example, almost at the end of the dashboard prototype development it was decided to include the travelled distance and the CO2 emissions. This was necessary in order to show how OTE can be combined with other measures of efficiency, which will give a better idea about the quality of the planning and not only the execution. Therefore in order to accommodate that new requirement changes were made to desired database schema used by QlikView. This data was not available in the source dataset; only the origin and destination shipment addresses were available. Therefore in the transformation process implemented in SSIS some enrichment had to be made. In order to get the distance between the two addresses, Microsoft MapPoint was used and for the calculation of CO2 - Ecological Transport Information Tool (EcoTransIT). After the required distance and CO2 data were extracted in the transformation process, the K+N data was enriched.
5.3 BACK END
In this subsection, the preparation process of the data is described. A SSIS package is created to handle the transformations for the sample dataset used for the prototype. However, given any other dataset with the same specifications it could also be processed.
The subsection is structured as follows: first the operational data sources are described followed by a discussion on data quality, then by the data integration and cleansing steps and finally concluding with the target warehouse structure that will be used to feed the QlikView program in which the dashboard is developed.
5.3.1 OPERATIONAL DATA SOURCES
The dataset used in the dashboard consists of five tables that come from three different operational sources. The first source is the planning software, from where the schedule of trips and shipments is created. From the planning system, two tables are available – trips and shipments. One trip can be associated with one or more shipments. In a trip record, general information about a trip is available, i.e., when is the planned start and end time, which is going to execute the trip, which truck and trailer will be used, etc. In a shipment record, more detailed information is given about the origin and destination addresses, the available loading and unloading windows, the route and the goods transported. The second data sources are the on-board units on the trucks. The on-board units record information about the execution of trips and shipments. In the on-board unit, 10 different operations are recorded with their starting and ending times. The operations are: (1) Start shift, (2) End shift, (3) Start trip, (4) End trip, (5) Loading, (6) Unloading, (7) Rest overnight, (8) Rest on route, (9) Rest home, and (10) Unjustifiable. The third source is a truck and trailer inventory database from

BI FOR HORIZONTAL COOPERATION OTE DASHBOARD
UNRESTRICTED Page 48
which two tables are available. This source provides information about the trucks and trailers features; e.g., what is their capacity, what is their make and model, what is their registration plate, who operates them (own or subcontractor), etc. In Figure 27, the available source tables and the relations between them are shown.
CONFIDENTIAL
The dataset consists of approximately 4000 trips and 18000 shipments.
Figure 27: Operational data sources for the dashboard
5.3.2 DATA QUALITY
An important step in the BI process is to verify the quality of the source data and remove any records that could lead to misleading results. Therefore, before the sample dataset was used, it was closely examined for any issues. After the manual data review, it turned out that the data with the most quality problems is the on-board unit data. In practice, some of this data was automatically generated but in most cases was manually entered by the drivers. As a result of the manual data entry, many issues arise.
In order to remove the problematic records, five filters are applied to the on-board unit data. For the prototype, any unnecessary assumptions are avoided, and more restrictive course of action is taken. Therefore, the records that do not comply with the rule are excluded from further consideration. In a real world solution, probably another course of action will be taken to avoid excluding records. Most likely a set of business rules and assumption rules will be defined that will handle anomalies in the data. However, this is more complex to do and not necessary for a dashboard prototype that want to demonstrate the features of the OTE framework. The issues that are addressed in the quality of the on-board unit data are illustrated in Figure 28.
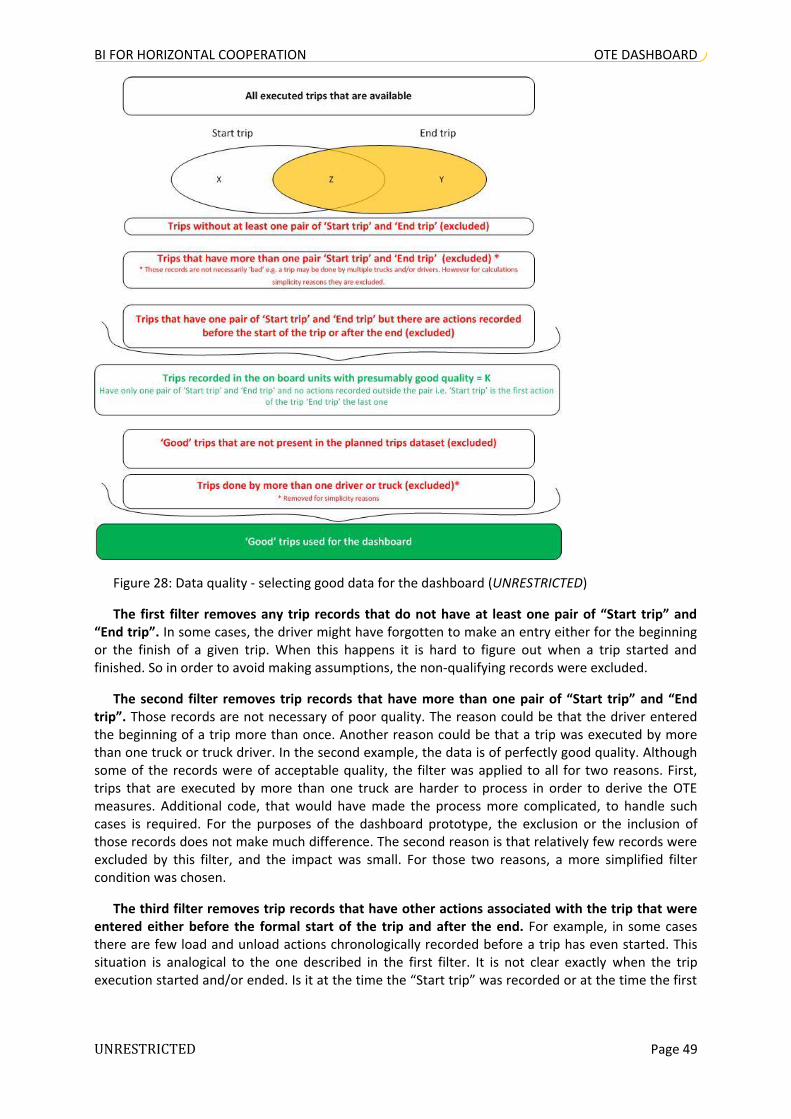
BI FOR HORIZONTAL COOPERATION OTE DASHBOARD
UNRESTRICTED Page 49
Figure 28: Data quality - selecting good data for the dashboard (UNRESTRICTED)
The first filter removes any trip records that do not have at least one pair of “Start trip” and “End trip”. In some cases, the driver might have forgotten to make an entry either for the beginning or the finish of a given trip. When this happens it is hard to figure out when a trip started and finished. So in order to avoid making assumptions, the non-qualifying records were excluded.
The second filter removes trip records that have more than one pair of “Start trip” and “End trip”. Those records are not necessary of poor quality. The reason could be that the driver entered the beginning of a trip more than once. Another reason could be that a trip was executed by more than one truck or truck driver. In the second example, the data is of perfectly good quality. Although some of the records were of acceptable quality, the filter was applied to all for two reasons. First, trips that are executed by more than one truck are harder to process in order to derive the OTE measures. Additional code, that would have made the process more complicated, to handle such cases is required. For the purposes of the dashboard prototype, the exclusion or the inclusion of those records does not make much difference. The second reason is that relatively few records were excluded by this filter, and the impact was small. For those two reasons, a more simplified filter condition was chosen.
The third filter removes trip records that have other actions associated with the trip that were entered either before the formal start of the trip and after the end. For example, in some cases there are few load and unload actions chronologically recorded before a trip has even started. This situation is analogical to the one described in the first filter. It is not clear exactly when the trip execution started and/or ended. Is it at the time the “Start trip” was recorded or at the time the first

BI FOR HORIZONTAL COOPERATION OTE DASHBOARD
UNRESTRICTED Page 50
action related to the trip occurred? Again assumptions are avoided, and the non-qualifying records are excluded from further consideration. Same applies for the “End trip” records.
The fourth filter removes any trip records that are present in the on-board unit dataset but a planning for them is not available. Why such records occur, is not clear. Perhaps for some of the execution records the planning data exists but was not part of the sample dataset. Another explanation could be that the trucks executed trips that were not planned by K+N (especially with the subcontractors this could be a plausible scenario). However, such records would be unusable for the dashboard since no comparison can be made between the planning and the execution, hence to evaluate the trip’s effectiveness. It should be noted here that trips which were planned but not present in the on-board unit data are also excluded for the same reason. Because of that, most trips executed by charters did not make it to the dashboard. Often charters do not share on-board unit data with their clients (K+N in this case). Therefore in order to assess the effectiveness of the charters and to have OTE measures for them probably another approach to data gathering must be adopted.
The fifth filter removes any trip records that have more than one driver. Here, the situation is similar to the one in the second filter. The records are probably of a good quality; there is nothing wrong with a trip made by more than one driver. Nonetheless, the processing of such trips would make calculations more complicated and after all only 7 records fall in this category. To avoid computational and processing complications, the trips with more than one driver are excluded.
CONFIDENTIAL
5.3.3 DATA INTEGRATION AND ENRICHMENT
The data used for the dashboard comes from multiple sources - three LSP operational data sources and four external enrichment sources. The LSP data sources are the planning software, vehicle's on-board units and truck/trailer inventory. The external enrichment sources are - ECOtrasIT (for CO2 emissions), Wikipedia (for postcodes in the Netherlands), Google Maps (for geographical coordinates), and Microsoft MapPoint (for distances between locations). Due to the variation in the data coming from the different source systems, the data integration is a challenging task and Extract Transform Load (ETL) tools are required as discussed in subsection 2.1.2 “THE BI TECHNOLOGY”. The ETL tool used for the data integration for the OTE dashboard is SSIS. The complete data integration, enrichment and cleansing process are shown in Figure 29, and all the steps are described in the paragraphs following the figure.

BI FOR HORIZONTAL COOPERATION OTE DASHBOARD
UNRESTRICTED Page 51
Figure 29: Integration process for the OTE dashboard

BI FOR HORIZONTAL COOPERATION OTE DASHBOARD
UNRESTRICTED Page 52
Data preparation. The source data used for the dashboard prototype was provided in text files and in order to be able to manipulate the data it is imported into a MySQL database. The first step is to delete all relevant tables if they already exist in the database (SSIS task: “SQL - Drop all tables if they already exist from a previous run”); this is in case one data set was already processed, and to avoid any conflicts or incorrect results it is best to start the new load on an empty database. After the database is cleared, the data from the flat files is moved to tables in the database as it is. The field types are all strings, columns that contain dates and numbers are not converted to the proper type (SSIS task: “DFT – Move data from flat files to DB”; Appendix A-10).
01 - Fill staging tables with all data from the sources. In this step, the data from the initial load is replicated and loaded in staging tables. The difference between the original tables and the staging tables is that in the staging tables, the fields that contain data different than text are converted to the proper format. This is necessary in order to be able to perform arithmetic operations on the number fields and date operations on the date fields. The reason the data is first loaded as it is from the flat files to the database and then the fields are converted in a separate step is to ease testing. In this way, it is much easier to check manually if the conversion was successful, and that no precision is lost. For example, in the original file a given date is in the format “M-D-YYYY” (e.g., ‘‘2-26-2012’‘), if it is loaded in the database directly as a type DATE the database will not interpret properly the format of the date text and all of the values will be empty since the default format is ‘‘DD-MM-YYYY’‘. In this case, specific conversion code must be created to make sure the proper format is used, which is easier to do by querying a database table rather than working directly with a flat file.
02 - Select trips for the dashboard prototype (check data quality). After the data is converted to the proper format, it is time to select high quality data to include in the dashboard. A high quality data is data that is presumed to be free of errors, complete and accurate. The detailed process to ensure data quality is described in subsection 5.3.2 "DATA QUALITY". In brief, the trips selected have only one start and end record without any activities before the start or after the end. Furthermore, only trips that are present both in the planning and the execution are select to be used in the OTE dashboard.
03 - Sequence Container - Fill in the address dimension. After the proper dataset for the dashboard is selected, it is time to create the target data warehouse schema that will be used as a source for the dashboard. In order to calculate and visualize the OTE measures in a dashboard the operation source data from the LSP must be restructured, enriched and stored in an easily accessible warehouse containing historic data optimized for the needs of the dashboard. The first step in the creation and the filling of the data warehouse is to create and fill the dimension tables. These tables contain details about the entities (stored in fact tables) for which we want to know more. Here, the address dimension is created and filled. All the combinations of from and to shipment addresses are extracted from the dataset and saved in an external Excel file (Appendix A-11).
After all of the addresses are saved in an Excel file, another program is used to add the longitude and latitude coordinates for each address. This includes tedious work of extracting the geographic coordinates from Google API and manually verifying their correctness. The correctness was checked by checking if the coordinates were in a given range according to the countries in which the address is located. If the longitude or the latitude are not in the expected bounds or are not calculated by the program, they are manually checked in Google Maps (which is about 10% of the addresses). Once all the correct coordinates are selected then there were used to enrich the address data back in the database (Appendix A-12).
In addition to the enrichment with the geo coordinates, the addresses are enriched with the province value; for example, if an address is in Arnhem also it is in the Gelderland province of the Netherlands. This is made possible by manually creating a map of postcode ranges and their corresponding province from the data available on Wikipedia (2011). For each of the provinces, the geo-coordinates are also manually extracted from Google Maps and saved in an Excel spread sheet.
BI FOR HORIZONTAL COOPERATION OTE DASHBOARD
UNRESTRICTED Page 53
Following is the data integration between the ranges of post codes, provinces and province coordinates which are loaded into a database table called “dictionary_nl_post_codes_province” (Appendix A-12). From this table, the province names are looked up to enrich each individual address with a province based on the postal code.
04 & 05 - Create and fill dimension tables. Here, six dimensions are created for transport type, date, transport action, planned trip, planned shipment and executed actions. The primary keys from those dimensions are used as foreign keys in the fact tables.
06 - Create and fill fact table “kn_fct_ote”. Table “kn_fct_ote” is the main and most fundamental fact table in our snowflake data warehouse schema. In multiple steps, the basic OTE measures are calculated which will allow later on in the dashboard calculations of the higher level aggregated measures, i.e., availability, performance, quality and the overall transport effectiveness. Seven of the losses are calculated and recorder on a trip level.
In the first task after the initialization of the fact table, the planned time per trip is calculated. This is simply the difference between the planned end time and the planned beginning time of a given trip.
In the second task, the break time is calculated as a loss. Since the breaks are not directly related to a trip, certain assumptions are made in order to spread the break time over the trips. The time a driver spend in breaks on the road and at home is divided by the number of trips he did over the day. Even portions of the break time are allocated to each trip. For example if a driver made for one day 2 trips and 4x30 min breaks, this makes 2h in breaks, which results in an average of 1h for each trip.
The third and fourth losses are the loading and the unloading time. In the OVE framework, as presented in subsection 2.2.3 "MEASUREMENT FRAMEWORKS", only the excess loading and unloading time are considered as losses. However, no standard times are available for the loading and the unloading activities; therefore, in the calculations we take the whole loading and unloading time as a loss but this could be changed easily to include only the excess time. The calculations for the loading/unloading time are based on the execution data and are the sum of time the driver spent in those activities during a given trip.
The fifth loss is the time of the trip the truck drove empty. Calculating the empty kilometres is a complicated task that requires close integration of planning and execution times. In order to achieve a high precision of calculating the empty time, the locations indicated in the planning should match exactly the locations indicated in the execution records. However, in practice an exact match is not always possible, based on the available data it could be concluded that the execution records are more than the planned shipment records. For that reason, the calculation of the time a truck drove empty is somewhat simplified for the prototype dashboard. The empty time is simply the time between the start of the trip and the first load plus the time between the last unload and the end of the trip. The assumption here is that when the trip started the driver took off to pick up the first load, and after the last unload and the end of the trip the driver drove back to base. In both cases, the truck is empty.
Sixth is the loss of on-time performance. When the loading/unloading did not happen at the defined time window, then there is a loss of on time performance. Every planned shipment has two actions – loading and unloading. If both were executed according to the time constraints, then the “on time performance” (OTP) is 100%; if only one of the two complies with the requirements then the OTP is 50%, and 0% - if none was executed as planned. One trip consists of multiple shipments; the OTP of a given trip is the average OTP of all the included shipments. The exact steps followed in the calculation of the trip’s OTP are given in Equation 10. Ideally, to assess the OTP of a loading/unloading action a match between the planned and executed address and time is required. It is easy enough to check if an execution time fits in a given time window but is not as easy to match

BI FOR HORIZONTAL COOPERATION OTE DASHBOARD
UNRESTRICTED Page 54
on the exact address. In the planning data, a detailed address including the post code and the street number are included, but in the execution data, the lowest detail is the street name. Most often the matching is not exact between the street name in the planning and the execution. For example, there could be spelling differences or the driver stopped on an adjacent street with an entirely different name. In order to calculate the OTP for the dashboard prototype, the lowest level of match on an address is the city name. If in there is an execution record in a given planned city that matches the available time window and the type of activity (loading/unloading), then it is considered as 100% OTP. In practice, if the dashboard is implemented then more rigid matching rule must be used.
trip in shipments#
trip in shipments#
10 else 1 then plannedas executed shipmentif
tionOTP_propor
trip. pern proportioce performantime on Calculate
ndow_to2)planned_windexecuted_e & 2indow_from planned_w start(executed_ OR
ndow_to1)planned_windexecuted_e& 1indow_from planned_w start(executed_ OR
00:00:00ndow_toplanned_window_from2planned_wi
indow_to1 planned_w ndow_from1planned_wi
&
ctionexecuted_a /unload)ction(load planned_a&ity executed_city planned_c&
ountryexecuted_country planned_c& ateexecuted_dteplanned_da
: satisfiedis following the ifOTP 100% has shipmentA execution. with planningCompare
.window_to2 and m2window_fro for Repeat
windows. time in change no Else
30minwindow_to1 window_to1 30min,-m1window_from1window_fro Then
window_to1m1window_fro & 00:00:00 m1window_fro If
windows. time eRecalculat
actions. unloading and loading - records two into shipmentsnedBreak plan
n) proportioce performantime tion(onOTP_propor
4) Step
3) Step
2) Step
1) Step
Equation 10: On-time performance calculation steps
The seventh and final loss included is the load factor which is considered a fill loss. The load factor is calculated based on the planned transportation volumes and the truck used. The assumption is that there are three types of trucks used – standard (26 pallets), combi (30 pallets) and LZV (42 pallets). If the average planned load is less than 26 it is assumed that a standard truck is used, if its more than 26 and less than 30 then a combi, otherwise a LZV. For example, if the average planned load is 13 pallets then the load factor is 50%. This is way too simplified calculation to be used in a real world situation but is sufficient for the prototype. In practice, the truck inventory data will be checked for the exact type of truck used for a given trip, and the average load will be weighted based on the distance travelled with each load.
07 - Enrich with shipments’ distance and CO2 emissions. In order to illustrate the added value of combining the OTE measures with other indicators, the dataset is enriched with the shipments’ distance and CO2 emissions. The distance between the origin and the destination addresses in a given shipment are calculated with Microsoft MapPoint, and the emissions are extracted by an automated program from the website www.ecotransit.org. The data was manually checked for

BI FOR HORIZONTAL COOPERATION OTE DASHBOARD
UNRESTRICTED Page 55
correctness and after that was inserted in to the database (Appendix A-13). Three fact tables are created that hold the total distance and CO2 emissions data on a shipment, trip and truck level respectively.
08 – ETL process statistics. The final step in the ETL process is to check how many rows were loaded in each table and to show them in a message box. By having this information, it could be checked if all of the expected data was loaded successfully, and to identify possible problems.
5.3.4 DATA WAREHOUSE
The data warehouse supporting the OTE dashboard consists of 12 tables – 4 fact and 8 dimension tables. The definitions of the fact and the dimension tables are discussed in subsection 2.1.2 "THE BI TECHNOLOGY". In brief, the dimensions are organized into a hierarchy composed of a number of levels, each of which represents a level of detail, of interest in the analyses to be performed. Facts are the objects that represent the subjects of the desired analyses; they are to be analysed to understand their behaviour. A data warehouse schema could be either a start or a snowflake. This depends on the depth of the hierarchy of dimension levels. If the fact has dimensions that do not have dimensions of their own, then this is start schema. On the contrary, if at least one of the dimensions have dimensions of its own, then we have a snowflake schema. In our case a snowflake schema is designed.
The purpose of the OTE data warehouse is to serve as a middleware that connect the operational data sources and the OTE dashboard. The idea is that the OTE framework and dashboard are used by all LSP partners in the transportation cooperation. All the companies share the definition of how all elements of the OTE dashboard are calculated and implement those unified definitions as they will in the ETL process. Also, the OTE dashboard interface is standardized among the partners. This will make the communication about the progress toward the common goals easier. At the same time, the data that each of the partners sees will be private and the result of their own activities. The only shared data will be that of the trips executed on the cooperative platform and even the details for that can be restricted to a minimum, e.g., the partner that executed the trip will be able to see the OTE for the trip but will not be able to drill down to the customer level. The example OTE data warehouse schema in the prototype includes only the internal operations, but it could easily be extended for a situation with multiple LSP cooperating together.
A generic version of the OTE data warehouse used for the QlikView dashboard is presented in Figure 30.
CONFIDENTIAL
Figure 30: Generic data warehouse snowflake schema for the OTE dashboard
5.4 FRONT END
The front end of the prototype is an interactive dashboard developed in QlikView. The purpose of the dashboard is to show how the OTE framework can be used in combination with other performance measures to track progress toward improvement objectives. There are five applications of the OTE framework that are emphasized with the dashboard. First, the OTE measures can be highly scalable by breaking them down by transportation units, in this case by transportation owner, i.e., own, subcontractor or charter vehicles. Second, the measures in the OTE framework can be used to assess the transportation effectiveness for a snapshot of time or to follow

BI FOR HORIZONTAL COOPERATION OTE DASHBOARD
UNRESTRICTED Page 56
the trends over time. Third, it illustrates how the losses of effectiveness can be identified by drilling down to the planning and execution data. Fourth, it gives an idea of how the OTE measures can be integrated into a geographic map for even greater insight into the effectiveness of the transportation activities. Fifth and final, the dashboard shows how the OTE measures can be used in combination with other measures (in this case efficiency indicators).
In the dashboard, the OTE measures are used together with other efficiency measures such as CO2 emissions per kilometre. This sort of combinations could be used not only to evaluate the internal transportation operation but also horizontal cooperation activities. By combing the OTE figures for the cooperative trips with cooperation harmonization measures, the success of the strategic partnerships could be evaluated. Examples for harmonization measures are: (1) Response time exchange request; (2) Successful exchange request in %; (3) Cost reduction in exchanged drops; (4) Pallets or kms exchanges in %; (5) Empty kms of the cooperating partners; (6) On-time performance of the cooperating partners.
The dashboard prototype consists of nine tabs that provide different information to the user. The purpose for each tab is described in Table 9.

BI FOR HORIZONTAL COOPERATION OTE DASHBOARD
UNRESTRICTED Page 57
Tab Description Screenshot
(Intro) OTE framework
This tab provides information about the OTE framework concept. The framework is described in details, and formulas for all the involved measures are given.
n/a
(Intro) OTE dashboard
This tab provides information about the OTE dashboard prototype. A description of the data and the formulas used is given as well as a brief discussion about the purpose of the prototype. Presented are also two alternatives for calculation the higher level OTE measures - availability, performance, quality and OTE.
n/a
OTE - dashboard
This tab provides an overview snapshot of the values for the high level OTE measures in a given period of time. Three different OTEs are calculated - for own transport, subcontractors and charters. The volumes for each transport owner are also provided. Possible selection: date, week day, month and shift.
Appendix B-1
OTE - trends
This tab provides an overview of the trends in OTE over a period of time. Here, there are multiple views that show the trends in the high level OTE measures per transport owner and the volumes for the given selection. In addition to the effectiveness measures also some planning efficiency measures are shown. Those combinations aim to illustrate how the OTE measures can be used, in conjunction with other indicators, to get more complete information. In a case of horizontal partnerships between LSPs, in this tab the trends of the harmonization measures will also be provided. Possible selection: country, city, NL province, week day and shift.
Appendix B-2
OTE - details
This tab provides the details for the low level OTE measures, i.e., the losses in effectiveness. Here on a trip level the exact value of the time losses can be viewed. Also, the users can select trips that are in specific ranges of availability, performance, quality and OTE. This will facility the investigation of which trips were executed badly and why did that happened. Possible selection: date, trip number, transport type and shift.
Appendix B-3
Trip planned vs. executed
This tab provides an insight into the details of a given trip or multiple trips. Here, the original planning and the subsequent execution could be compared side by side. The data in this tab is of such a fine granularity that it can be useful only of a small number of trips is already selected. An example scenario when the data in this tab can be immensely useful is if a trip with low effectiveness is selected (e.g., in the previous tab) and an investigation must be made into what exactly happened in order to be able to take improvement actions. Possible selection: date, trip number, transport type and shift.
Appendix B-4
OTE- NL province
In this tab, all shipments are grouped according to the province in which they were executed. The bigger the dot on the map of a given province the higher the level of OTE, i.e., the more effective the transportation activities. This tab can be useful in case there are multiple teams making decentralized plans for different provinces. Variations in the effectiveness in different provinces can be spotted easily in this view. Possible selection: date, week day, month, shift, province and map type.
Appendix B-5
Shipments location
In this tab, all individual origin and destination locations can be seen on a map. This view could be useful, for example, in the case where non-effective trips are already selected, and the user wants to check for any geographical patterns of low effectiveness, e.g., in a specific city or for a specific customer. Possible selection: date, week day, month, shift, country, city, Dutch province, address description and map type.
Appendix B-6
OTE - limits properties
In this tab, the specific target limits for each of the high level OTE measures can be set. For each of the availability, performance, quality and OTE the lowest acceptable limit as well as a desirable limit can be set. Bellow the lowest limit it is red, between the lowest and the desirable is yellow and above the desirable is a green area. Those colours are reflected in the ‘‘OTE-dashboard’‘ tab and are also synchronized with the colours of the individual numbers in the ‘‘OTE-detail’‘ table.
Appendix B-7
Table 9: Dashboard tabs description

BI FOR HORIZONTAL COOPERATION OTE DASHBOARD
UNRESTRICTED Page 58
The prototype dashboard demonstrates some of the most intriguing aspects of the OTE framework and its applications. However, the dashboard is not a final design that is meant to be adopted by a LSP. The design process of the prototype was rather informal; the business participants gave multiple suggestions about the desired features, most of which were included in the prototype dashboard. In practice, often there are scarce resources and for features to be implemented must be prioritized. This comes back to the BI added value discussion in subsection 2.1.3 “THE ADDED VALUE OF BI FOR THE BUSINESS”. Based on the situation and the strategic orientation of the LSP, some features of the dashboard will have higher added value than others. Therefore, in order to tailor the proposed dashboard to the own needs to facilitate the decision making process a carefully drawn design is required. The design will be based on a more structured requirements gathering process with a view of the current IT infrastructure and future plans. Also, the design must be fine-tuned in accordance to particular user groups. For example, if the OTE framework is used on all three levels within the organization then different views for the strategic, the tactical and the operational teams are required. The prototype dashboard can be used as it is to show the relevant parties how the OTE framework can be used and to provoke ideas generation.
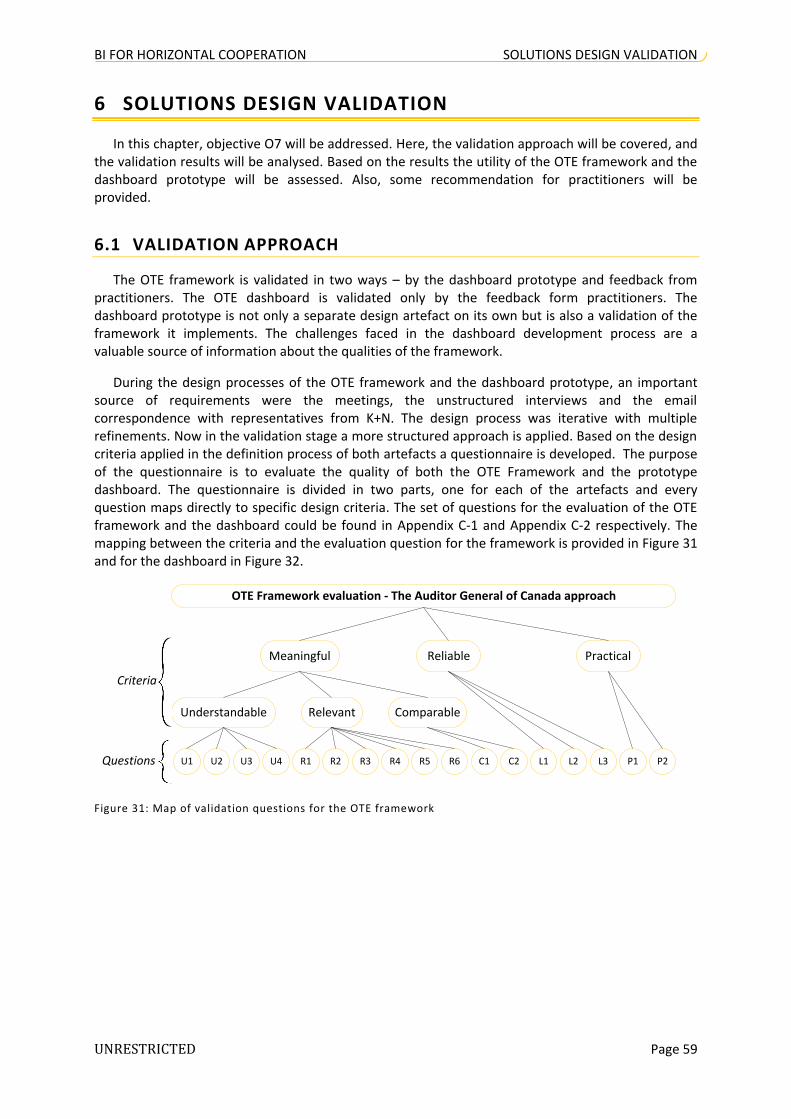
BI FOR HORIZONTAL COOPERATION SOLUTIONS DESIGN VALIDATION
UNRESTRICTED Page 59
6 SOLUTIONS DESIGN VALIDATION
In this chapter, objective O7 will be addressed. Here, the validation approach will be covered, and the validation results will be analysed. Based on the results the utility of the OTE framework and the dashboard prototype will be assessed. Also, some recommendation for practitioners will be provided.
6.1 VALIDATION APPROACH
The OTE framework is validated in two ways – by the dashboard prototype and feedback from practitioners. The OTE dashboard is validated only by the feedback form practitioners. The dashboard prototype is not only a separate design artefact on its own but is also a validation of the framework it implements. The challenges faced in the dashboard development process are a valuable source of information about the qualities of the framework.
During the design processes of the OTE framework and the dashboard prototype, an important source of requirements were the meetings, the unstructured interviews and the email correspondence with representatives from K+N. The design process was iterative with multiple refinements. Now in the validation stage a more structured approach is applied. Based on the design criteria applied in the definition process of both artefacts a questionnaire is developed. The purpose of the questionnaire is to evaluate the quality of both the OTE Framework and the prototype dashboard. The questionnaire is divided in two parts, one for each of the artefacts and every question maps directly to specific design criteria. The set of questions for the evaluation of the OTE framework and the dashboard could be found in Appendix C-1 and Appendix C-2 respectively. The mapping between the criteria and the evaluation question for the framework is provided in Figure 31 and for the dashboard in Figure 32.
OTE Framework evaluation - The Auditor General of Canada approach
Meaningful PracticalReliable
Understandable Relevant Comparable
Criteria
Questions U1 L1C2R6R4 C1R5R3R2R1U4U3U2 L2 L3 P1 P2
Figure 31: Map of validation questions for the OTE framework

BI FOR HORIZONTAL COOPERATION SOLUTIONS DESIGN VALIDATION
UNRESTRICTED Page 60
Prototype evaluation – Quality in Use Integrated Measurement (QUIM)
Efficiency Satisfaction EffectivenessUsefulnessLearnability
Likeability AccuracyConsistencyNavigability FeedbackMinimal memory
loadMinimal action
User guidance
Factors
Criteria
Questions Q1 Q8Q7Q6Q5Q4Q3Q2
Figure 32: Map of validation questions for the dashboard prototype
The validation of the OTE framework and dashboard with the practitioners was done in two phases. In the first step, after the framework was designed it was presented to representatives from K+N and Nabuurs. Its features and quality was discussed as well as improvements were suggested. The suggestions were incorporated in the framework, and only then the design of the prototype began. In the dashboard prototype, the most discussed features are included with an emphasis on its scalability and flexibility as a framework. In the second validation step after the implementation of the dashboard, it was again presented to almost the same panel of experts from the first step. The emphasis, in the second step, was more on the validation of the dashboard. After the last meeting, the four practitioners in the panel of expert were provided with a questionnaire, to evaluate both artefacts. This small sample does not allow for hard conclusions to be made and cannot be used as a sole reliable validation source. In order for the questionnaire results to be more definitive, a higher number of responses are required not only from different levels within one LSP (as K+N in this case) but also the other companies participating in the cooperation initiative. In this research, this was not possible due to the time constrains, a substantial amount of time was spent on the design of the framework/dashboard and a wide spread external validation was out of the scope. Nonetheless, the scores from the questionnaire reflected accurately what was being discussed and the overall opinion of the evaluation group.
6.2 VALIDATION RESULTS
Here, the validation results of the OTE framework and dashboard are presented. The results are described in terms of the design criteria used in the creation of the artefacts.
6.2.1 OTE FRAMEWORK VALIDATION
Understandable. The score from the questionnaire results is 3.75 out of 5. The OTE framework was perceived by the expert panel as clearly and consistently defined, with clear application context and consisting of measurable indicators. However in term of the unambiguity of indicators the experts were more sceptical. There are three levels of indicators in the OTE framework and the calculations for the two top levels (availability, performance, quality and OTE) were relatively easy to agree on. However, the lowest level indicators were more controversial, especially the E-Effective time, the F-Real operational time, R-Running time, and the U-Used time. The losses calculated at those levels are not defined without ambiguity.
BI FOR HORIZONTAL COOPERATION SOLUTIONS DESIGN VALIDATION
UNRESTRICTED Page 61
First, the E-Effective time excludes the on-time performance (OTP) losses. The way the on-time performance losses are calculated is ambiguous. One option is to take the whole amount of time a truck drove for a particular shipment that was not executed as planned (e.g., out of the time window). In this way, the shipments that are on a greater distance will have a higher weight. Another option for calculating the OTP of a trip is to take all the shipments with equal weights. To illustrate the difference here is one simple example. There are two shipments in a trip, from A to B (30min drive) and from B to C (90min drive), the shipment from A to B was too late and missed the unloading time window. If the first calculation method is used, the OTP of the trip will be 75% (loss 30min) since only 30min of the driven time was a “waste”. With the second calculation method, the trip’s OTP will be 50% (loss 60min) since ½ of the shipments in the trip were not executed on time. In the dashboard prototype, the second calculation method was adopted for two reasons. The first reason is that all customers should be treated equally regardless of how long the drive is (since the OTE is also a measure of customer satisfaction). The second reason is that, in practice, multiple shipments start from the same origin; it is hard to calculate the exact time each shipment took and also the manner of calculation could be easily challenged. For example, a trip of 90min has two shipments from A to B (30 min drive) and from A to C (90min drive). So are the whole 90min (0% OTP) a loss or just the 60min (67% OTP) between B and C? For the dashboard implementation we choose the second option.
Second, the F-Real operational time excludes speed losses. The discussion about that measure was centred on how exactly to calculate the losses from traffic jams and should fill loss such as truck utilization (load factor) is included. An agreement on those points was not reached; hence, the ambiguity of the definition. Third, the R-Running time excludes losses from loading and unloading. According to Simons et al. (2004) only the excess loading and unloading time is considered a loss. However in discussion with the expert panel, there were some strong opinions in favour of having the whole loading and unloading time as a loss. Fourth and final, the U-Used time excludes the time in which there are no orders. Here, the controversy was about which time is taken in consideration – planned or executed time. At the end, planned time seemed to be more appropriate since the OTE framework measures the effectiveness of the transport, i.e., the degree to which the execution fits the specification of the planning.
Besides the ambiguities in the OTE framework revealed by discussions with the expert panel, one hugely significant ambiguity was discovered during the implementation of the dashboard prototype. The problem is related to the calculation of all high level measures in the OTE framework, i.e., availability, performance, quality and OTE. There are two methods to do that, (1) “unweighted” and (2) “weighted”. The two methods are presented in Equation 11 and explained bellow.
With the “unweighted” approach first all of the losses per category (e.g., breaks, loading, unloading) are summed up and then divided by one another in order to calculate on of the high level OTE measures over multiple transportation units (e.g., trips, trucks, drivers). In the “weighted” approach the calculations happen the other way around, first the losses and the high level OTE measures are calculated on a transportation unit level and then the average is taken over the complete set of transportation units. From the practice dataset used in the dashboard prototype the difference in the OTE can be as much as 10% between the two methods, which is extremely significant. This number could be even higher for the middle level of OTE measures. In the dashboard, the difference in the OTE could be seen in the last two columns of the ‘‘OTE details’‘ tab (Appendix B-3). The reason for such a significant difference is that, the “unweighted” method produces results that are more exaggerated; since, they are not attributed to a transportation unit, where with the “weighted” method the results are more accurate. For that reason, it could be said that the “unweighted” method produces results that are estimation of the actual result derived with the “weighted”. The calculation process for the “unweighted” is much simpler computationally but the produced results could be misleading if there are many transportation units with extremely good or bad values on the high level OTE measures.

BI FOR HORIZONTAL COOPERATION SOLUTIONS DESIGN VALIDATION
UNRESTRICTED Page 62
required! is ionconsideratcareful A
(2). and (1) approaches from results the between difference nt significabe could There
0.117 | 0.075 0.03 0.2 100*U
E OTE
0.35 | 0.33 0.2 0.5 100*S
EQuality
0.46 | 0.35 0.25 0.67 100*F
SePerformanc
0.635 | 0.65 0.67 0.6 100*U
FtyAvailabili
30 10 20 E
90 50 40 S
260 200 60 F
400 300 100 U
Overall 2 Trip 1 Trip
:Example
records.all forOTE average the take then andlevel letrip/vehic a on calculated OTE Weighted.
.(estimate) divide then and clestrips/vehiall over sumFirsts .Unweighted
OTP*trip_time
emptyunloadloadbreaktrip_timeAVG
AVG(OTP)*trip_time
empty)unloadloadbreak(trip_time
trip_time
AVG(OTP)*empty)unloadloadbreaktrip_time(N)(K OTE
100*U
E 100*
S
E*
F
S*
U
FQuality*ePerformanc*tyAvailabili OTE
(2)(1)
(2)(1)
(2)(1)
(2)(1)
(2)
(1)
(2)
(1)
Equation 11: OTE calculation approaches and anomalies (with an example)
Relevant. The score from the questionnaire results is 3.58 out of 5. The OTE framework was assessed to be a relevant and useful for measuring the transportation effectiveness of a LSP. According to the experts’ panel, the exact activities where the losses in effectiveness occur can be identified easily based on the information provided from the OTE framework. Also, it can be used to identify gaps between the current effectiveness and the desired level, i.e., it is useful for highlighting improvement opportunities.
In terms of tracking the transport effectiveness of the different transportation owners (own, subcontractor or charter), the OTE framework utility was not perceived evenly by the experts. Often the data available for the trips’ execution by subcontractors and charters is much less than for the own transport. Also, it is not as reliable which raises questions about the dependability of the end results shown by the OTE framework. Especially, when charters are involved almost no execution data is available. Those are companies contracted for a single trip for a fixed amount of payment and do not share execution data with the contractor LSP. The value of the OTE framework for measuring the performance of subcontractors and charters is questionable. It is not clear if it is going to be used

BI FOR HORIZONTAL COOPERATION SOLUTIONS DESIGN VALIDATION
UNRESTRICTED Page 63
for diagnostic or monitoring purposes, and what improvement actions could be taken based on the values of the indicators.
As discussed in subsection 2.1.4 “APPLICATION OF BI IN LOGISTICS” there are various uses of BI applications in logistics. From the mentioned options, relevant applications of OTE with respect to the subcontractors and charters are “carriers performance evaluation” and “carriers relationship management”. With the “carriers performance evaluation” application of the OTE, the performance of charter companies can be analysed on various factors. This analysis can be used to assign quality points to the carriers, which can help in selecting the best carriers for future projects. On the other hand, with the “carriers relationship management” application, subcontractor and charter companies can be hold accountable about delivery problems, and their improvement can be tracked over a period of time. This can help in designing Subcontractor Relationship Programs/Subcontractor Excellence Programs that can support in the establishing of mutually profitable relationships. The overall relevance of the OTE framework for an LSP (regarding the subcontractors and the charters) will increase if it is specifically implemented to be used in the above two applications of the BI in logistics.
The combination of the OTE framework with the planning efficiency indicators seems relevant but not as much as expected. The experts were hesitant to agree that this combination provides a clear understanding of the progress toward the objectives of reducing empty kilometres, increasing the on-time performance and increasing the truck utilization. The ability to combine the OTE measures with CO2 emission per kilometre (as well as other efficiency measures) was illustrated in the dashboard, but the experts were uncertain of the interpretation. There are situations when it is clear how to interpret the results, but in most, it may not be as conclusive as desired. For example, if the OTE increases and the CO2/km remains the same or degreases this is a good thing. On the other hand, if the OTE increases and the CO2/km increase as well this is a warning alarm. However, one cannot be certain that the fluctuations of the CO2/km are always directly related to the fluctuations of the OTE. The CO2/km could be decreasing because new more-efficient trucks are used, or more trips are done during the night, for example. An increasing CO2/km could be due to the higher utilization of the vehicles or changing time windows. Therefore, interpreting the combination of different indicators is not always straightforward, and the results from the OTE dashboard, could be used as a reason to further investigate a given phenomenon.
The relevance of the OTE framework for measuring the success of strategic cooperation received mixed opinions. The experts agreed the utility of the framework to be scalable and flexible enough to be used for internal purposes as well as in cooperation situation. It was also indicated that the combination of OTE measures for cooperative trips, with harmonization measures is essential - in order to be able to measure more accurately the performance of the partnership. However, this combination is not a sufficient measure of partnership success. There are many soft factors involved that also indicate the success of cooperation and cannot be deduced from operational data. This finding confirms the ideas discussed in subsection 2.3.3 “MEASURING COOPERATION PERFORMANCE” that in order to be able to evaluate the success of a partnerships one must go beyond the operational data. Even though the OTE framework, in combination with harmonization indicators, is not the ultimate measure of logistics’ cooperation success; it is still immensely relevant for measuring the effectiveness of transport orders executed on a cooperation platform. According to the experts, the biggest challenge to the usefulness of any cooperation measure is the restrictive information sharing policies in a horizontal cooperation setting. The OTE framework fits quite well in such setting since only data on the cooperation trips must be shared. Furthermore, it is also possible that sensitive information such as customer data could be visible only in the own dashboard and not in that of the partners.
Comparable. The score from the questionnaire results is 3.67 out of 5. The experts agreed that the OTE framework allows comparison over time given that the definitions of the measures stay the same. In order for comparison to be more accurate the OTE measures must not be looked in isolation

BI FOR HORIZONTAL COOPERATION SOLUTIONS DESIGN VALIDATION
UNRESTRICTED Page 64
but be used in combination with other efficiency and effectiveness measures. In the dashboard prototype, it is illustrated how this can work and was well accepted from the practitioners. In addition to allowing comparison over time, the OTE framework allows for comparison over different parties, i.e., transportation executed by own, subcontractor, charter or strategic partners. However, this comparison should be done with caution, since the data may not be equally available or reliable.
Reliable. The score from the questionnaire results is 3.5 out of 5. A strong aspect of the OTE framework is that all the measures could be easily verifiable if the raw data and the used formulas are available. Also, the experts agreed that the OTE indicators accurately measure what is being measured and are free from bias to a great degree. In order to reduce the bias of the higher level OTE measures, the “weighted” calculation approach is more suitable. The experts had diverging views on how well the OTE measures compliment other currently used indicators in their company. The degree of complementarity depends to a great extent on the position of the user within the company and probably will vary across organizations. This aspect is an intriguing opportunity for future research and not much can be concluded based on the available validation feedback.
Practical. The score from the questionnaire results is 3 out of 5. The OTE framework appears to feasible from the point of view of available data. A trend for LSPs across Netherlands and Europe is to increase the automation of the data collection in the in-board units. This will lead to more reliable data in ever increasing amounts. However, not all data required for the full implementation of the OTE framework is as easily accessible as the planning and the execution operational data. A challenge will be to find appropriate and trustworthy enrichment sources. A strong side of the OTE framework is that only few of its elements can be initially implemented with high added value. Consecutively, they can be scaled up as needed or as reliable data is available.
Although the OTE framework was perceived feasible from a data point of view, it did not score so well on financial feasibility. Since a business case was not presented to the experts, they were reluctant to give predictions about the investment into the framework hence the low score on this criterion. In order to be able to assess the financial feasibility, a business case must be created and discussed with practitioners. Depending on the BI maturity level of each LSP and the current technologies used the financial feasibility will be perceived differently by the various parties.
Overall. A summary of the questionnaire results for evaluating the OTE framework is presented in Figure 33. The average score for the framework is 3.5 out of 5. The especially strong features of the framework are that it is understandable, comparable and relevant. On the other hand it scored the lowest on practicality.
Figure 33: Evaluation results of the OTE framework
0
1
2
3
4
53.75 3.58 3.67 3.5
3 3.50
Evaluation results of the OTE framework
Score out of 5

BI FOR HORIZONTAL COOPERATION SOLUTIONS DESIGN VALIDATION
UNRESTRICTED Page 65
6.2.2 OTE DASHBOARD VALIDATION
The dashboard is validated by a panel of experts. It was presented to four representatives (from the tactical and strategic levels) from K+N who evaluated the dashboard during a discussion and consecutively by filling in the questionnaire. Here, the results from this evaluation session are presented. In Figure 34, the questionnaire results per evaluation criteria are presented. Based on those scores the usability of the dashboard prototype is evaluated. The factors on which the usability is verified are efficiency, satisfaction, learnability, usefulness, effectiveness and the extent to which the dashboard is a strong realization of the OTE framework. The factors are explained in the following paragraphs.
Figure 34: Evaluation results of the OTE dashboard (criteria)
OTE framework realization. The score from the questionnaire results is 3.75 out of 5. The dashboard was judged to be a good realization of the OTE framework. By interacting with the dashboard, the experts discovered some benefits of the framework that were not apparent from the definition of the framework. Such benefit is the integration of the OTE with geographic data that will allow visualization in the different regions, and it will be useful in identifying areas with ineffective transportation. Also, the dashboard proofed useful in identifying some short comings of the framework. For example, although the framework was designed to be highly scalable to multiple transportation units, in the illustrated case with the transportation owners, it could not be used with exactly the same definition. A reason for that is the difference in the features of the various transportation owners, some of the information that is available and relevant for the own transport is not for the subcontractors and the charters. Such information could be (but is not limited to) company open time, no orders losses, maintenance, traffic jams. This led to the conclusion that the OTE framework has to be customized, and sometimes it does not make sense to use it in its entirety. This does not reduce the value of the framework but merely stresses the importance of tailoring it to the own needs in order to maximize the added value.
The dashboard effectively illustrates how the OTE framework can be used to identify transportation effectiveness gaps and the causes for them. In addition, it showed a good example of how the measures from the OTE framework can be combined with efficiency measures. The possibility to drill down into the planning and the execution data for a given selection of trips proofed useful feature that was well accepted by the experts. In the dashboard prototype, the drill-down option is available from the views with the trend charts (Appendix B-2), the OTE details (Appendix B-3) and the spatial data (Appendix B-5; Appendix B-6). The experts indicated as a desired improvement feature the possibility to drill down from the OTE dashboard itself (Appendix B-1) to
0
1
2
3
4
5 4
3
4
3
4 4
3 2.5
Evaluation results of the OTE dashboard (criteria)
Score out of 5

BI FOR HORIZONTAL COOPERATION SOLUTIONS DESIGN VALIDATION
UNRESTRICTED Page 66
the particular type of losses. This is not yet possible and is not clear what the desired effect is, but is a possibility for improvement.
Efficiency. The score from the questionnaire results is 3.75 out of 5. The efficiency score is derived from the scores of four criteria: minimal action, navigability, minimal memory load and feedback. According to the experts’ panel, the dashboard enables to a great extent the user to expend appropriate amounts of resources in relation to the effectiveness achieved in a specific context of use. The experts opining was that relatively few steps are required to achieve a certain task. For example, it would take only four selections and the change of three tabs to see the planning and execution data of trips on a special date, on the night shift having OTE quality between 0 and 30% and performance between 20% and 70%. The ability to move easily from tab to tab with specific information and the uniform selection of the data throughout all the tabs was considered a substantial benefit. Also, the instant data refresh (without delay) after a selection is made enables users to interact with the dashboard without having to wait for data reload. The only thing that seems to harm the efficiency is the amount of information that must be kept in mind to be able to use the dashboard. Although there is a current selection box at each tab that shows all the applied filters, it does not seem to be enough. The information that the user must keep in mind from tab to tab is different depending on the goals of the user. For example, if one has to compare the OTE values to the CO2/km, looking at a single tab is sufficient (Appendix B-2). However, if one is to compare the empty kilometres to the CO2/km a constant switching between two tabs and/or keeping large amount of information in mind are required which is not the most convenient. Therefore, in order to improve the efficiency of using the dashboard, a list of the most common scenarios should be defined and used to improve the dashboard. Also, it should be noted that the experts evaluating the dashboard were not familiar with it before the evaluation meeting. A validation with more experienced in the dashboard users may provide different results.
Satisfaction. The score from the questionnaire results is 3.5 out of 5. The satisfaction score is derived from the scores of four criteria: minimal action, user guidance, navigability, minimal memory load and likeability. The users have a positive perception about the dashboard prototype in terms of its functionality and interface. Also, the relatively few steps needed to achieve a complex task contributed to the overall satisfaction. However, the satisfaction is hindered by the information that the user must keep in mind while using the dashboard. Also, a feature that was indicated to need improvement is the user guidance. For a new user that has not worked with the dashboard, it is confusing on which tab what information is available. After an hour of interacting with the dashboard, this is not an issue anymore. In order to improve the user satisfaction of new users, more guidance should be provided.
Learnability. The score from the questionnaire results is 3.25 out of 5. The learnability score is derived from the scores of four criteria: minimal action, user guidance, minimal memory load and consistency. To a moderate extent the users find it easy to master working with the dashboard, if it is to achieve a particular goal. By interacting with the dashboard, users feel that they can start using it with only short introduction to the features and the interaction possibilities. The relatively few steps needed to achieve a complex task make the dashboard easy to learn. Nonetheless, there is some room for improvement. The way to a increase the level of learnability with the dashboard prototype is to address the little user guidance provided to new users, the amount of information that must be kept in mind while working with it and the consistency of the design. The uniformity among the elements of the user interface and the metaphors they offer is moderate according to the experts.
Usefulness. The score from the questionnaire results is 3.63 out of 5. The usefulness score is derived from the scores of four criteria: navigability, feedback, consistency and accuracy. The utility of the dashboard is relatively high according to the panel of experts. It enables users to solve practical problems of identifying improvement gaps and causes for ineffectiveness. The dashboard is a useful realization of the OTE framework and its high navigability, reaction to the user input and the overall positive perception of the users make it highly useful. An element that needs improvement in

BI FOR HORIZONTAL COOPERATION SOLUTIONS DESIGN VALIDATION
UNRESTRICTED Page 67
order to increase the perceived usefulness is the accuracy of the dashboard. However, no reason for the perceived low accuracy was given by the experts. A specific reason should be identified by observing users interacting with the dashboard, and giving feedback on values they think are inaccurate. By knowing where the problem is, an appropriate fix can be designed and implemented which will improve the perceived accuracy.
Effectiveness. The score from the questionnaire results is 3.13 out of 5. The effectiveness score is derived from the scores of four criteria: minimal memory load, feedback, consistency and accuracy. The ability to achieve a task with accuracy and completeness was assessed to be average. This result is not entirely dependable since the experts did not have much experience with the dashboard and only few scenarios were presented. Therefore, the judgment of the dashboard’s effectiveness could be particularly biased to the few examples discussed. What seems to hinder the effectiveness is the consistency of the design and the low accuracy.
Overall. In general, the dashboard prototype was well accepted by the panel of experts with a score 3.45 out of 5. There are two particularly strong points of the dashboard. First, the way it realizes the OTE framework. It effectively illustrates the applications and features of the OTE dashboard, the ability to combine the OTE measures with other indicators and the drill-down possibilities. Second, the efficiency of the dashboard allows for easy navigation, few actions required to achieve a task and the meaningful effects from the interactions. On the other hand, perceived usefulness and effectiveness could be improved by making the dashboard design more consistent and results more accurate. One way to increase the consistency will be to have uniform selection options throughout the tabs where this makes sense. The perceived accuracy could be increased by adding detailed description in the help button, which users can consult in case they are not sure of the dependability of certain values. A summary of the questionnaire results for evaluating the OTE framework is presented in Figure 35.
Figure 35: Evaluation results of the OTE dashboard (factors)
6.3 VALIDITY OF THE RESULTS
The presented results in this chapter are based on discussions with LSP professionals. The OTE framework has been validated from multiple meeting with seven representatives from K+N. Both the framework and the OTE dashboard have been more formally validated at the end of the research by a panel of four experts that also provided answers to a structured questionnaire. The threads to the validity of the results in this research are inherent from the thread to the validity of any case study.
0
1
2
3
4
5 3.75 3.75 3.50 3.25 3.63
3.13 3.45
Evaluation results of the OTE dashboard (factors)
Score out of 5

BI FOR HORIZONTAL COOPERATION SOLUTIONS DESIGN VALIDATION
UNRESTRICTED Page 68
The following three subsections will address some of the concerns related to the construct, internal and external validity of this research.
6.3.1 CONSTRUCT VALIDITY
Construct validity requires that the researcher defines “a sufficiently operational set of measures” that preclude “subjective judgments” (Yin 2003, p.35). In other words, this is the degree to which the indicators operationalize a concept correctly. Some threats to construct validity as identified by Wieringa (2011) are (1) to measure only easy things rather than things of interest; (2) wrong measurement scale.
To address the first concern - measuring only easy things, substantial effort was placed in identifying the right measures for the task at hand. The measures used for the validation of the OTE framework and the dashboard prototype come from well accepted models of criteria for the purpose. The models were selected following a thorough literature review on the subject and are compatible with the purposes of the solution designs. In the case with the OTE framework the Auditor General of Canada approach (Franceschini et al., 2007, p. 177) is used to assess the quality of the OTE measurement framework. This is a holistic approach to defining, implementing and testing performance measurement systems (more details in subsection 4.1 "FRAMEWORK DESIGN CRITERIA"). On the other hand, in the evaluation of the dashboard besides the degree to which the dashboard realized the features of the OTE framework, its usability was also evaluated. Testing the usability of a piece of software like the dashboard is a well know problem in information systems research. There are multiple framework and approaches for that purpose. The one that is selected to evaluate the dashboard is the QUIM model that consolidates many of the existent frameworks (more details in subsection 5.1 "DASHBOARD DESIGN CRITERIA”). The criteria for evaluating both the framework and the dashboard are operationalized by the questions in the survey (Appendix C-1 and Appendix C-2).
To address the second concern of using wrong measurement scale, all of the available measurement scales were first reviewed and then after a discussion between the student and the primary supervisor of the research the most appropriate scale was selected. The available measurement scales are Nominal, Ordinal, Interval and Ratio. Interval scale is used in the validation questionnaire that operationalizes the relevant design criteria for both the framework and the prototype. The interval scale is the standard survey scale; the distance between each of the scale elements is, more or less, equal. In the case of this research, a 5 point interval scale is used that asked the reviewer to rate statement regarding the utility of the artefacts on the scale from 1(Strongly disagree) to 5(Strongly agree). Customary for the interval scale is the ability to interpret the differences in the distance along the scale. Also, it is possible to use parametric statistical techniques to summarize the results (Monash University 2010). Example of such techniques are mean and standard deviation; correlation – r; regression; and analysis of variance.
6.3.2 INTERNAL VALIDITY
Internal validity (also referred to as explanatory validity) ensures that the collected evaluation data enables researchers to draw valid conclusions (Creswell 2003). For that reason, notes of the proceedings for each of the discussion meetings were taken during and immediately after the meeting. This was done to reduce the risk of missing out some relevant parts. For the OTE framework, in addition to the evaluation from practitioners, it was also evaluated by the development of the prototype. During the development, certain problems were faced that contributed to the better understanding of the framework's limitations. Another source of validation is the experience of using a large dataset of actual operational data from a LSP to implement the OTE dashboard. This brought up some practical problems that are not obvious from the definition of the theoretical model, such as data quality issues, for example. On the other hand the dashboard was

BI FOR HORIZONTAL COOPERATION SOLUTIONS DESIGN VALIDATION
UNRESTRICTED Page 69
only validated in one way – by four practitioners. By using a triangulation approach the internal validity of the evaluation result is much stronger for the OTE framework, compared to the dashboard.
According to Wieringa (2011), the internal validity of a model (artefact) measures the degree to which this model is implemented correctly and if it contain the expected mechanisms. First, in the case with the OTE framework this means the degree to which the OTE indicators measure what they claim to measure. This includes all three levels of OTE indicators, as well as the claim that by combining them with cooperation harmonization measures they can effectively measure the operational performance of horizontal cooperation. Second, in the case with the dashboard the internal validation is concerned with the degree to which it is a good realization of the OTE framework, can be usable tool to investigate losses in effectiveness, and is it possible to take improvement actions based on the information on the dashboard.
In support of the internal validity of the OTE framework we can offer three arguments. First of all, the OTE framework is an adaptation of a family of lean measures that are widely used in the manufacturing industry. The definition of those measures has been tested thought the years. Their transfer to the logistics industry is not straightforward but not without good foundations. The OVE framework (Simons et al. 2004) covered in the literature review is the first steps toward using lean measures in logistics. This framework was also validated by a case study with promising results. Based on that and the feedback we got from the practitioners in our case study, there are good outlooks that the measures in the OTE framework are well defined and actually measure the effectiveness of transportation. Second, the OTE measures are transparent and explicitly defined in this thesis with all the necessary formulas. The framework consists of measures that are building on top of each other, with increasing the complexity from the bottom level (9 absolute basic measures), through the middle level (3 relative measures), to the top level (relative OTE). Third, during the implementation of the OTE framework in the dashboard it was relatively easy to break down the measure on as many transportation units as needed. In the dashboard prototype we illustrate that by having three units – own fleet, subcontractor and charter. Easily it can be scaled up to include more units such as transportation cooperation platform, or even individual transportation partner units. Also the inclusion and the calculation of the cooperation harmonization measures could be implemented without much effort but with high added value. By combining the extent of the cooperation (harmonization measures) and the effectiveness of the cooperation trips (OTE per partner/s), each of the partner companies can evaluate the operational performance of the tasks they executed in cooperation compared to the own execution of transportation tasks.
This research proposes an approach to measuring the operational performance of horizontal cooperation. The solution is a scalable and flexible framework that can be used initially to measure only the internal performance of an LSP; consecutively, can be scaled up to for the purposes of cooperation by adding an extra object to the dashboard and combining it with harmonization indicators. A benefit of the framework is that it can be used even before the cooperation exists. Later at the establishment stage of cooperation the definitions of the various elements can be synchronized between the parties. In the final stage, the dashboard realizing the framework should be extended to measure the effectiveness of the cooperation transport. In this way, minimal effort is required to start measuring the cooperation's performance, and because of the uniform definition, easy comparison will be possible between the effectiveness of the own transportation units and the partnership trips. What makes the OTE framework especially useful for a logistics cooperation situation is that only minimal amount of information should be shared between the partners, who are at the same time competitors.
During this research, we identified that in order to measure the operational performance of horizontal cooperation in the logistics sector two types of indicators are required – internal operational indicators which values are expected to change from the cooperation and harmonization indicators that will indicate the extent to which the cooperation partners work together. In

BI FOR HORIZONTAL COOPERATION SOLUTIONS DESIGN VALIDATION
UNRESTRICTED Page 70
combination, those indicators give a clear idea if the horizontal cooperation is meeting the required targets. In addition, for assessing the overall success (not only the operational performance) of the cooperation a "softer" approach to evaluation is required. The operational data must be complimented by feedback from people that are involved in the cooperation, and thus to make sure that all aspects of the cooperation progress are taken into account.
6.3.3 EXTERNAL VALIDITY
The external validity addresses the extent to which a study’s results apply to the world in general. A single case study, as the one used in this research, does not establish a general trend (Eisenhardt & Graebner 2007; Lee & Baskerville 2003; Markus et al. 2006). However, it gives a greater insight into an emerging area of research, such as the performance measurement of horizontal cooperation in logistics. As confirmed by the literature review of this research, the existing models and framework for measuring cooperation performance or those that measure only internal performance of LSP organizations are not sufficient and appropriate for the task. Therefore, in order to measure the performance of horizontal cooperation new models and theories are needed. The aim of this research it to make a small first step in this direction, and unfortunately, mostly speculations (and not as much firm conclusions) for a generalization can be made based on the origin of the OTE framework/dashboard and the results from the validation.
The main threat to external validity is that only the point of view of one LSP organization (K+N) was used in the validation of a framework meant to be used for monitoring the performance of logistics cooperation. Therefore, there is a realistic possibility for the results to be biased toward the internal needs of the company rather that what is best in a cooperative situation. A substantial part of this research was focused on the development of a framework and dashboard that no sufficient resources were available to conduct a cross-company validation. One of the discussion meetings involved participants from Nabuurs and their feedback was similar to the one from the K+N. Nonetheless, still more intra-organizational validation is required to make firm conclusions about the applicability of the OTE framework in a horizontal cooperation setting, in transportation.
Another threat to external validity is that only high level managers from K+N (on a strategic and tactical level) were involved in the design and validation of the OTE framework and the dashboard. This may lead to a bias in the results toward strategic and tactical uses and not as much to addressing day-to-day operational needs.
Despite the above mentioned threats to the external validity and the limitation that no sound generalizability from a single case study can be made, still some suggestions and conjectures can be made. There are two types of generalizations - analytic and statistical generalization (Seddon & Scheeper 2012). Clearly in our case we do not have any significant statistical results from the validation. Therefore, the only way is to try to argue some generalizability based on the analytics. We are going to make some case-specific knowledge claims, which are based on the similarity between the causal drivers in the case study and those, likely to exist in other settings. Here, we will provide two strong arguments about the applicability of the OTE framework to measure the effectiveness of the transportation activities of the logistics industry.
According to Seddon & Scheeper (2012), “if the forces within an organization that drove observed behaviour are likely to exist in other organizations, it is likely that those other organizations, too, will exhibit similar behaviour … researchers can provide arguments that their truth is highly likely”. Based on our case study, we can make a probable generalization of the application of the OTE framework throughout all LSP organizations based on the features of K+N; the company that participated in the evaluation of the framework and the supportive dashboard. K+N is a large international company; in their transportation activities, they operate not only own transportation fleet but also manage multiple subcontractors and charters. In this way the company is similar to

BI FOR HORIZONTAL COOPERATION SOLUTIONS DESIGN VALIDATION
UNRESTRICTED Page 71
many large and medium logistics companies, and some of the smaller once will mirror part of the activities of K+N. The smaller logistics companies are likely to have only either own transportation fleet and rarely to use the services of subcontractors and charters. Additional similarity between K+N and other logistics companies is the use of some sort of planning software or, in the worst case scenario, manual recording of planned trips. Also, most of the trucks nowadays have on-board units to record the execution of the trips (either manually or automatically). Since many LSP have similar features to those of the company used in the validation, it could be argued that the evaluation results will be similar; therefore, usefulness of the OTE framework and the dashboard generalizable.
Another reason for suggesting a generalization of the OTE framework is the similarity between the manufacturing industry and the logistics industry. The OTE framework is based on a family of lean measures such as the Overall Equipment Effectiveness (OEE), Overall Factory Effectiveness (OFE) and Overall Plant Effectiveness (OPE). All of those measures are widely used and well accepted in the manufacturing industry. This suggests that they have high utility for the business and if adapted appropriately could be used in the logistics sector, as well. There are two main reasons that support the claim that the OTE can be useful for any LSP organization. First reason, the transport vehicles could be compared to the equipment used in the factories. The vehicles just as any machinery requires maintenance, training for the personnel, could be used suboptimally, could break down or be subject to events that hinder the effectiveness. Second reason, the vehicles that need to execute certain transport orders are scheduled ahead of time just as the equipment that is scheduled to perform certain tasks in a factory. In both cases, an evaluation of the “task was executed as planned” is required, i.e., the effectiveness of the execution must be assessed. Those two reasons underline the similarities of the OTE and the other lean measures. Therefore, based on those similarities, we could predict that the OTE framework can be used by any LSP to measure the internal effectiveness of the transportation activities, as well as those of cooperation activities if combines with the appropriate harmonization indicators.
Also, some claims about the generalization of the OTE framework across LSP organizations in different countries are possible. In Europe and North America specifically the framework could have good changes for generalizability. In addition, one could speculate about a possible application of the framework to measure the effectiveness of distribution companies, e.g., short-distance city distribution.

BI FOR HORIZONTAL COOPERATION CONCLUSION
UNRESTRICTED Page 72
7 CONCLUSION
The main research question of this thesis is: “How to measure the operational performance of horizontal cooperation in the logistics industry with the help of Business Intelligence (BI) solutions?”
This research question has been answered here by two proposed design solutions and their validation. The first design solution is an operational performance measurement framework, named Overall Transport Effectiveness (OTE) that can be used to measure the effectiveness of the transportation activity of any logistics service provider. The OTE framework is a highly scalable and can be used to measure the internal transportation effectiveness as well the effectiveness of the trips executed on a horizontal cooperation platform. However, in order to be able to use the OTE framework in a cooperative context it must be used in combination with harmonization cooperation measures. The second design solution is a BI dashboard prototype that was designed and implemented with the purpose of illustrating the various applications of the OTE framework.
The design of both the OTE framework and dashboard has been evaluated by a panel of experts that confirmed their utility and usefulness in the context of horizontal cooperation. This validation allow us to suggest that the OTE framework in combination with a set of harmonization measures, realized in an interactive dashboard will facilitate the measurement of the transportation effectiveness of any horizontal cooperation in logistics, given a similar setting as the one described in our case study. However, the conclusions of this study should be approached with caution since there are limitations present which could turn to be interesting opportunities for future research. Before proceeding to the limitation and the future research options emerging from the study, we will review how each of the objectives set at the beginning of the research was achieved. Based on the findings a set of contributions to the knowledge as well as for the practice will be defined.
7.1 RESEARCH OBJECTIVES: SUMMARY OF FINDING
Here, a short summary of the findings is provided.
Objective O1: Business Intelligence (BI)
Objective O1: Identify the added value of Business Intelligence (BI) tools and solutions for companies in the logistics sector.
The concept of BI is very broad with numerous definitions. For the purposes of this thesis the BI encompasses the “the processes, technologies, and tools needed to turn data into information, information into knowledge and knowledge into plans that drive profitable business action. BI encompasses data warehousing, business analytics tools and content/knowledge management". Nonetheless, identifying the added value of a BI solution has proved to be a challenging task. This is due to the fact that the business benefits can be intangible, often indirect and difficult to measure in different parts in the organization. The value of BI is created by acting on the information and the knowledge provided to the organization, but BI has no value of its own.
The logistics service providers can take advantage of all BI technologies especially query tools, reporting tools, online analytical processing (OLAP) tools, data visualization and data mining tools. The usage of such tools results in a reduction of the preparation time for reports; ensures a direct and faster access to the information needed to support decision-making; analyses the flow of information across services, clients, regions, currencies, pricing, etc. Specifically for LSPs, the application of BI can add value in three ways. First, it can lead to service improvement by detailed analyses and reports about all the processes and functions involved in the realization of a service, e.g., transport, warehousing, and other value adding services. Second, it can provide information
BI FOR HORIZONTAL COOPERATION CONCLUSION
UNRESTRICTED Page 73
technology based services to clients with specific reports and analyses for their supply chain. This will increase the responsiveness of the clients, increase the transparency and inevitably increase the customer satisfaction. Third, BI can improve the organizational support functions like human resources and accounting by providing support for their decision making processes. In the transportation management, BI can be especially useful in the carrier performance evaluation, the capacity planning, and the routing and scheduling.
The knowledge gained by addressing this research objective is very valuable in identifying which BI tools would be appropriate to use in measuring the performance of horizontal cooperation. From the literature review on the subject, it became clear what steps must be taken to develop a BI solution, and what its purposes should be. Based on the findings, a BI dashboard solution that has an interactive front-end and provides good data visualization seemed to be the most appropriate choice to use. By using a dashboard as a front-end BI application, users will be able to identify quickly root causes and drill down in the data. Since a whole measurement framework will be realized by the BI tool, a dashboard is also a more flexible option because it allows for showing of many indicators at once and there is no requirement that they should fit in a single static report.
Objective O2: Logistics performance measurement
Objective O2: Define how the performance of the logistics activities can be measured.
The literature on performance measurements in logistics can be divided into two categories. The first category is focusing on specific measurements and their qualities; the second on research concerning complete measurement frameworks. The individual measures were researched in order to identify indicators that must be included in the proposed measurement framework. Also, the relationships between them were investigated so it is clear what dependencies are present.
The measurements are often interrelated and influence each other to a varying degree. Particularly interesting are the relations between the operational performance indicators (also referred to as “critical success factors”) and the overall success of the LSP. Also, a large body of research exists on the relationship between efficiency and effectiveness is available. There are multiple publications supporting the view that both can be pursued simultaneously, which are challenged by arguments about the conflicting goal each of them conveys. Virtually all organizations strive to achieve optimal efficiency and effectiveness in concurrence. However, not all achieve that goal, and the large body of research on the topic gives insight into why is that. Based on the reviewed arguments, in this research we adopt the theory that the logistics performance dimensions can be improved concurrently, and there are no significant impediments for a company to strive both for efficiency and effectiveness.
The individual indicators and the complex relations between them are often organised into structured measurement frameworks. Three general frameworks were reviewed, with the objective to select one of them as a basis for the designing something useful in measuring the performance of horizontal cooperation. The framework that is sought out in this research should be measuring the performance preferably only of the transportation activity of logistics. Also, the framework should give a rather holistic view of the transportation activity and the relation between the underlying measures should be clear. From the three presented framework, one of them met the requirements and was further developed to fit for the purpose. One of the other two frameworks was used to position the new measures in a measurement space and the other one was used as a source of indicators.

BI FOR HORIZONTAL COOPERATION CONCLUSION
UNRESTRICTED Page 74
Objective O3: Horizontal cooperation performance measurement
Objective O3: Define how the performance of horizontal cooperation can be measured.
The horizontal cooperation is defined as the “joint practices between companies operating at the same level(s) in the market or logistic chain”. The horizontal cooperation is a relationship innovation that is a cheap way for logistics providers to react on the high pressure on transport efficiency and to avoid merges and/or acquisitions. There are a number of benefits of cooperative transport management. Some of them are reducing transportation costs, increased asset utilization, improved service levels, increased visibility, improved end customer satisfaction, and increased revenue, increased productivity, and improved market position. Such cooperation could be realized by five different coordination mechanisms including the flow of information, decision and financials.
The literature search on the subject of cooperation performance and related phrases resulted in two sets of topics on which research was available. In the first set, the cooperation performance was measured in a qualitative manner with questionnaires and interviews, and tested for correlations to the internal performance of the company. The second set of publications focused on frameworks for measuring the performance of the total supply chain. In this chapter, the two sets of research are discussed.
Neither of those measurement approaches used operational data for evaluating the performance of the horizontal cooperation. This was a considerable drawback. The main purpose for keeping that chapter is because, in order to measure the overall success of cooperation, the operational data is not sufficient, and other aspect must be also be taken in account. Those frameworks could prove useful and can be combined somehow with the proposed framework. This allows us to gain better insight on the overall success of cooperation.
Also, an intriguing question raised by the literature finding on this topic, is if there would be a substantial difference in how the cooperation performance is measured across the different coordination mechanisms. In some of the mechanisms, there are third parties involved that orchestrate the process. In those situations, it may make more sense, to empower, a third party to monitor the performance of the cooperation performance. In other cases, where only the partners are responsible for coordination, it is no clear who would own the data, and where the BI solutions will be hosted.
Objective O4: Case study
Objective O4: What are the current and the desired situation according to the companies from the case study?
The three companies in the case study have strong strategic orientation toward sustainability and have launched internal programs for environmental responsibility. The strategic goals of the partnership are to achieve higher sustainability and better profit margins by reducing empty kilometres, improving vehicle utilization, and increasing on-time performance. Despite that, a main concern regarding the horizontal cooperation in the case study is the fact that the three companies are direct competitors for the same customer pool. This raises issues about information sharing, trust, gain sharing and performance reporting. Each of the companies currently steers their transportation activities on a set of proprietary KPIs. If the companies continue to use only their internal performance measures for evaluating the effect of the cooperation, it could be hard to communicate about the effects of cooperation on the different partners. Furthermore, it could be impossible to track the progress toward the predefined strategic goals.
The desired situation is to have a successful, long-term and sustainable partnership between the three LSPs. To ensure the cooperation is developing as expected, it should be possible to get timely information on how well are the trips executed on the sharing platform. The performance of the own

BI FOR HORIZONTAL COOPERATION CONCLUSION
UNRESTRICTED Page 75
fleet should be comparable to the performance of the trips done by the partners. Also, the level of harmonization must be measured, i.e., the level of cooperation or how often join trips are executed and what portion of them was successful. In addition, the quality of the planning should be measures, and also it should be possible to follow the trends over time and establish benchmarks and targets for the cooperation.
By achieving this objective, we have a better understanding of what are the practical goals of the parties involved in an exemplary horizontal cooperation. This will increase the relevance of the research to the business. And also provides valuable insights. During the case study, three groups of indicators relevant to horizontal cooperation are identified: (1) internal indicators that should not be affected by the cooperation; (2) internal indicators that should be affected by the cooperation; and (3) harmonization cooperation indicators. Only the last two are relevant for measuring horizontal cooperation’s performance. The harmonization measures that indicate the extent which the partners work well together are: (1) Response time exchange request; (2) Successful exchange request in %; (3) Cost reduction in exchanged drops; (4) Pallets or kms exchanges in %; (5) Empty kms of the cooperating partners; (6) On-time performance of the cooperating partners.
Objective O5: OTE framework
Objective O5: Propose a framework of KPIs for horizontal cooperation in the logistics industry (focus on load sharing in the transportation activity).
Based on the findings from the literature and insights from the case study, a framework of indicators for measuring the operational performance of horizontal cooperation is proposed. The proposed framework is given the name Overall Transport Effectiveness (OTE). The OTE framework is a hierarchy of metrics which evaluate and indicate how effectively transportation vehicles are utilized. The hierarchy consists of one top-level measure, three underlying measures and nine low level measures. Those three levels correspond to the three organizational levels - strategic, tactical, and operational. The higher a measure is in the OTE framework hierarchy, the more probable that it will be used for decision making higher up in the organizational hierarchy. The top-level measure is OTE that quantifies how well a transportation unit performs relative to its designed capacity, during the periods when it is planned to run. The OTE comprises of three underlying metrics that provide an understanding as to why and where the OTE gaps exist - availability, performance and quality. The lowest level indicators measure different types of effectiveness losses. In the OTE framework, lower level measures are used to derive higher level measures. The detailed formulas for calculating each measure are provided.
The design criteria that are followed for creating the proposed framework are based on the Auditor General of Canada approach. The measurements within the framework are designed in such a way that they satisfy three broad criteria – meaningful, reliable and practical. The OTE framework by itself is considered to contain a set of internal performance measures that are expected to change due to horizontal cooperation.
The combination of the OTE measures with harmonization measures could be done easily and will enable the measurement of the operational performance of a horizontal cooperation. Also, it is advisable that the OTE framework be used, in combination with planning efficiency measures, to avoid misleading interpretations.
Objective O6: OTE dashboard prototype
Objective O6: Develop a prototype of a BI solution for reporting the performance (e.g., scorecard, dashboard, report) of horizontal cooperation in the logistics industry.
From the available BI solutions we choose to implement the OTE framework in a dashboard, because of its interaction posibilities and scalability. Overall, the dashboard prototype design and the
BI FOR HORIZONTAL COOPERATION CONCLUSION
UNRESTRICTED Page 76
development process were iterative. The features of the source dataset and the specification of the OTE framework were the starting points for the development of the prototype. In order to use the source data into the OTE framework, multiple steps are performed first. In the back end, the data is enriched, integrated and cleaned. For that purpose Microsoft SSIS software is used. Following the ETL process the data is loaded into a target warehouse that is used to feed the QlikView program in which the front-end dashboard was developed.
The purpose of the dashboard is to show how the OTE framework can be used in combination with other performance measures to track progress toward improvement objectives. The prototype dashboard can be used as it is, to show the relevant parties how the OTE framework can be used and to provoke ideas generation.
The dashboard is designed in accordance to the Quality in Use Integrated Management Framework (QUIM) which is a consolidated model for usability measurement under which many other models can be derived. In the QUIM framework, 10 factors are identified from which five were considered relevant to this project. The five factors are: Efficiency, Satisfaction, Learnability, Usefulness, and Effectiveness. The factors are operationalized into more tangible criteria: Minimal action, User guidance, Navigability, Minimal memory load, Feedback, Likeability, Consistency, and Accuracy.
The data used for the dashboard comes from multiple operational sources and four external enrichment sources - ECOtrasIT (for CO2 emissions), Wikipedia (for postcodes in the Netherlands), Google Maps (for geographical coordinates), and Microsoft MapPoint (for distances between locations). Due to unavailability of cooperation data, in the dashboard only the internal performance is presented. However, with the current set up it easy to understand how it can be extended for horizontal cooperation.
In order to ensure high data quality and remove the problematic records, five filters are applied to the available execution data. The first filter removes any trip records that do not have at least one pair of “Start trip” and “End trip”. The second filter removes trip records that have more than one pair of “Start trip” and “End trip”. Those records are not necessary of poor quality. The third filter removes trip records that have other actions associated with the trip that were entered either before the start of the trip and after the end. The fourth filter removes any trip records that are present in the on-board unit dataset but a planning for them is not available. The fifth filter removes any trip records that have more than one driver. Here, the situation is similar to the one in the second filter.
Objective O7: Validation
Objective O7: Validate the framework and the prototype with stakeholders’ feedback.
The validation of the OTE framework and dashboard with the practitioners was done in two phases. In the first step, after the framework was designed it was presented to representatives from K+N and Nabuurs. The emphasis, in the second step, was more on the validation of the dashboard. After the last meeting, the four practitioners in the panel of expert were provided with a questionnaire, to evaluate both artefacts. This small sample does not allow for hard conclusions to be made and cannot be used as a sole reliable validation source. Still, the scores from the questionnaire reflected to a high degree what was being discussed and the overall opinion of the evaluation group.
The criteria on which the OTE measures are evaluated are the extent to which they are understandable, relevant, comparable, reliable and practical. In term of understandability, a surprising finding was to identify an ambiguity related to the calculation of all high level measures in the OTE framework, i.e., availability, performance, quality and OTE. There are two calculation methods which could yield results with up to 10% difference. The OTE framework was assessed to be a relevant and useful for measuring the transportation effectiveness of a LSP. According to the
BI FOR HORIZONTAL COOPERATION CONCLUSION
UNRESTRICTED Page 77
experts’ panel, the exact activities, where the losses in effectiveness occur, can be identified easily based on the information provided from the OTE framework.
The validation indicated the OTE framework, in combination with harmonization indicators, is not the ultimate measure of logistics’ cooperation success. However, it is still highly relevant when it comes to measuring operational success of the horizontal cooperation. The experts agreed that the OTE framework allows comparison over time given that the definitions of the measures stay the same. In order for comparison to be more accurate the OTE measures must not be looked in isolation but be used in combination with other efficiency and effectiveness measures. Regarding the reliability, a strong aspect of the OTE framework is that all the measures could be easily verifiable if the raw data and the used formulas are available. The practicality of the framework was hard to judge due to missing financial information.
The dashboard was presented to four representatives from K+N who evaluated the dashboard during a discussion and consecutively by filling in the questionnaire. Here, the results from this evaluation session are presented. In general, the dashboard prototype was well accepted by the panel of experts. There are two particularly strong points of the dashboard. First, the way it realizes the OTE framework. It effectively illustrates the applications and features of the OTE dashboard, the ability to combine the OTE measures with other indicators and the drill-down possibilities. Second, the efficiency of the dashboard allows for easy navigation, few actions required to achieve a task and the meaningful effects from the interactions. On the other hand, the perceived usefulness and effectiveness could be improved by making the dashboard more consistent and accurate.
No particular limitations were identified in relation to the construct validity and the internal validity of the research. The greatest threats are to the external validity since only a small group of experts from one company evaluated the solution designs, which may lead to misleading results. Nonetheless, two strong analytical arguments are presented about the applicability of the OTE framework for all LSPs.
7.2 RECOMENDATIONS AND CONTRIBUTION TO PRACTICE
The OTE framework should be used to identify losses in effectiveness from the transportation activities, and to plan corrective actions to reduce such losses in the future. The OTE framework is highly flexible and allows the losses to be expressed in different ways in addition to time, e.g., the measures can be expressed in € or CO2 depending on the need of the company. Also, it could be used on all three levels of the organization – strategic, tactical and operational. If the time frame and the aggregation level changes, it could easily be transformed from an operational to a strategic KPI. For example, on an operational level the effectiveness could be monitored on a daily basis per planning team per transportation type. At the same time, on a strategic level the OTE measures could be used to track the trends as one aggregated number for a quarter per transportation type.
The OTE framework measures the transportation effectiveness of a given unit, and is highly scalable. It could easily be applied for one single planning location as well as for the whole company for every transport that is operated. So in the case of horizontal cooperation an LSP could have four instances of the OTE framework implemented to monitor the performance of each transportation type, i.e., own vehicles, subcontractors’ vehicles, charter vehicle, and of course, the vehicles used to do cooperative deliveries. However, OTE is a measure about the execution of the trips; it must be combined with measures for the quality of the planning. Such measures could be CO2 emissions or total kilometres driven per trip or per truck. Those measures will show if the planning is done well, and if it is not done just so it exploits weaknesses in the OTE, so it makes the OTE figures improve. For example, speed and fill loss occurs when the vehicle is not fully loaded. An artificial boost in the OTE could be done by planning the heaviest drop to be done last, which is not the most cost-effective
BI FOR HORIZONTAL COOPERATION CONCLUSION
UNRESTRICTED Page 78
solution. This will not result in any real increase in effectiveness but will only cost more money to the LSP.
In order to make the OTE framework a real measure of logistics cooperation performance and success, it must be used in combination with harmonization measures. By combining OTE with harmonization indicators, the partners will have a clear overview of the operation impact of the cooperation. By using the same definition for the measures in the OTE framework and the harmonization measures, they will be able to communicate the progress of the cooperation. Perhaps also this information could be used for negotiations related to cost and gain sharing discussion. It is an enormous advantage that the OTE framework required extremely limited amount of shared information, easy to comply with the restrictive information sharing policies of the partners.
Two different, legitimate calculation methods for the OTE availability, performance and quality, were identified during the implementation of the dashboard. The two methods are “weighted” and “unweighted”. Depending on the data, the difference can be significant (for example, with our sample data we had a difference of as much as 10%). When the OTE framework is implemented, a careful consideration should be made on which method is chosen, and in a case of a horizontal cooperation, a common definition must be agreed by the partners. Our recommendation is to use the “weighted” approach.
The purpose of the dashboard is to show how the OTE framework can be used in combination with other performance measures to track progress toward improvement objectives. There are five applications of the OTE framework that are emphasized with the dashboard. First, the OTE measures can be highly scalable by breaking them down by transportation units, in this case by transportation owner, i.e., own, subcontractor or charter vehicles. Second, the measures in the OTE framework can be used to assess the transportation effectiveness for a snapshot of time or to follow the trends over time. Third, it illustrates how the losses of effectiveness can be identified by drilling down to the planning and execution data. Fourth, it gives an idea of how the OTE measures can be integrated into a geographic map for even greater insight into the effectiveness of the transportation activities. Fifth and final, the dashboard shows how the OTE measures can be used in combination with other measures.
Based on the situation and the strategic orientation of the LSP, some features of the dashboard will have higher added value than others. Therefore, in order to tailor the proposed dashboard to the own needs to facilitate the decision making process a carefully drawn design is required. The design will be based on a more structured requirements gathering process with a view of the current IT infrastructure and future plans. Also, the design must be fine-tuned in accordance to particular user groups.
7.3 CONTRIBUTION TO KNOWLEDGE
In the introduction of this thesis, two research gaps were identified that the current research can fill. First, it contributes to the body of knowledge about operational consequences and implementation of a horizontal cooperation, and its management in everyday business. Very little research is done in this area. During the literature review, not a single framework was identified that is designed to measure the operational performance of horizontal cooperation. At the same time, the trends show an increasing number of LSPs are considering participation in such cooperation initiatives. This study is the first to directly address the problem of measuring the operational performance of horizontal cooperation in transportation network sharing. The proposed OTE framework is not a complete measure of cooperation performance, but, in combination with harmonization and efficiency measures, it gives a good overall idea of the effectiveness of the shipments executed on a cooperation level.
BI FOR HORIZONTAL COOPERATION CONCLUSION
UNRESTRICTED Page 79
Second, the research addresses the need to use more case studied in the logistics sector. In the development of new models and frameworks, the case studies provide a great insight into the problems practitioners face and the reasons for that. When little theoretical foundation is available, as in this research, the case study is a great source of inspiration and reality check. The results are hard to generalize but are a good starting point. Nonetheless, based on our case study still some generalization claims can be made. We made two case-specific knowledge claims, which are based on the similarity between the causal drivers in the case study and those, likely to exist in other settings. We provided two strong arguments about the applicability of the OTE framework to measure the effectiveness of the transportation activities of the logistics industry. The arguments are summarized in the next two paragraphs.
Based on our case study, we can make a probable generalization of the application of the OTE framework for all LSP organizations by comparing LSPs’ features in general to those of K+N; the company that participated in the evaluation of the framework and the supportive dashboard. K+N is a large international company; in their transportation activities, they operate not only own transportation fleet but also manage multiple subcontractors and charters. In this way the company is similar to many large and medium logistics companies, and some of the smaller once will mirror part of the activities of K+N. Also, most of the trucks nowadays have on-board units to record the execution of the trips (either manually or automatically). Since many LSP have similar features to those of the company used in the validation, it could be argued that the evaluation results will be similar; therefore, usefulness of the OTE framework and the dashboard generalizable.
Another reason for suggesting a generalization of the OTE framework is the similarity between the manufacturing industry and the logistics industry. The OTE framework is based on a family of lean measures such as the Overall Equipment Effectiveness (OEE), Overall Factory Effectiveness (OFE) and Overall Plant Effectiveness (OPE). All of those measures are widely used and well accepted in the manufacturing industry. There are two main reasons that support the claim that the OTE can be useful for any LSP organization. First reason, the transport vehicles could be compared to the equipment used in the factories. The vehicles just as any machinery requires maintenance, training for the personnel, could be used suboptimally, could break down or be subject to events that hinder the effectiveness. Second reason, the vehicles that need to execute certain transport orders are scheduled ahead of time just as the equipment that is scheduled to perform certain tasks in a factory (and later on compared to the execution). Therefore, based on those similarities, we could predict that the OTE framework can be used by any LSP to measure the internal effectiveness of the transportation activities, as well as those of cooperation activities if combined with the appropriate harmonization indicators.
7.4 LIMITATIONS
The main limitation of this study is with regard to the external validity. Only the point of view of one LSP organization (K+N) was used in the validation. Therefore, there is a realistic possibility for the results to be biased toward the internal needs of the company rather that what is best in a cooperative situation. A substantial part of this research was focused on the development of a framework and dashboard, that no sufficient resources were available to conduct a cross-company validation. More intra-organizational validation is required to make firm conclusions about the applicability of the OTE framework in a horizontal cooperation setting. Another limitation of the research is that only high level managers from K+N (on a strategic and tactical level) were involved in the design and validation of the OTE framework and the dashboard. This may lead to a bias in the results toward strategic and tactical uses and not as much to addressing day-to-day operational needs. Also, during the dashboard development no data from horizontal cooperation operations was available and this feature was not included.

BI FOR HORIZONTAL COOPERATION CONCLUSION
UNRESTRICTED Page 80
Besides the limitations to validity, there are also limitations of the designed solutions. For example, the ambiguity of the high level OTE measures depending on the calculation formulas used. Two different, legitimate calculation methods for the OTE availability, performance and quality, were identified during the implementation of the dashboard. The two methods are “weighted” and “unweighted”. With the “unweighted” approach first all of the losses per category (e.g., breaks, loading, unloading) are summed up and then divided by one another in order to calculate one of the high level OTE measures over multiple transportation units (e.g., trips, trucks, drivers). In the “weighted” approach the calculations happen the other way around, first the losses and the high level OTE measures are calculated on a transportation unit level and then the average is taken over the complete set of transportation units. When the OTE framework is implemented, a careful consideration should be made on which method is chosen, and in a case of a horizontal cooperation, a common definition must be agreed by the partners. Our recommendation is to use the “weighted” approach. Also, the chosen approach should be communicated to the users that may otherwise start to believe that the data inaccurate.
7.5 FUTURE RESEARCH
The limitations mentioned in the previous chapter, open interesting opportunities for future research. First of all, the framework could be validated on different levels within the organization. Second, inter-organizational validation would also be very beneficial to increase the internal and the external validity of the framework. Third, the OTE dashboard could be enhanced with additional functionality for demonstrating also the performance of cooperation. In order to achieve this, a dataset should be created. This could be done manually, generated by simulation or retrieved for companies that are already in a horizontal cooperation. Furthermore, one can dive in proving the generalizability across countries or in the distribution sector.
Another intriguing possibility is to research the similarities and the difference between the performance measurements across cooperation initiatives using different coordination mechanisms (five mechanisms). In some of the mechanisms, there are third parties involved that orchestrate the process, and in others, the cooperating LSPs manage everything themselves.
There are also some topics that are related to the further theoretical development of the OTE. For example, its applicability to measuring the performance of subcontractors and charters could be investigated. Also, a business case for the OTE framework could be developed in order to better assess the feasibility of the implementation.
The experts in our case had diverging views on how well the OTE measures compliment other currently used indicators in their company. The degree of complementarity depends to a great extent on the position of the user within the company and probably will vary across organizations. This aspect is an intriguing opportunity for future research and not much can be concluded based on the currently available validation feedback.
Also, there were some aspects of the dashboard that needed improvement. An interesting practical task would be to formally define a set of the most probable interaction scenarios and/or user goals and rearrange the dashboard. The experts from our validation indicated also as a desired improvement feature the possibility to drill down from the OTE dashboard itself (Appendix B-1) to the particular type of losses. This is not yet possible and is not clear what the desired effect is, but is a possibility for improvement.
BI FOR HORIZONTAL COOPERATION REFERENCES
UNRESTRICTED Page 81
REFERENCES
Audy, J. et al., 2010. A framework for an efficient implementation of logistics collaborations. International Transactions in Operational Research.
Bahinipati, B.K., Kanda, A. & Deshmukh, S.G., 2009. Horizontal collaboration in semiconductor manufacturing industry supply chain: An evaluation of collaboration intensity index. Computers & Industrial Engineering, 57(3), pp.880–895.
Bakker Logistiek Zeewolde, 2011. Bakker Logistiek website. Available at: http://www.bakker-logistiek.nl/ [Accessed November 27, 2011].
Bamford, J.D., Gomes-Casseres, B. & Robinson, M.S., 2003. Mastering alliance strategy: a comprehensive guide to design, management, and organization, John Wiley & Sons.
Basak, S., Shapiro, A. & Teplá, L., 2006. Risk Management with Benchmarking. Management Science, 52(4), pp.542 –557.
Bhagwat, R. & Sharma, M., 2007. Performance measurement of supply chain management: A balanced scorecard approach. Computers & Industrial Engineering, 53, pp.43–62.
Biggam, J., 2011. Succeeding With Your Master’s Dissertation: A Step-by-step Handbook, McGraw-Hill.
Bobbitt, L., 2004. An Examination of the Logistics Leverage Process: Implications for Marketing Strategy and Competitive Advantage. Unpublished Ph.D. Dissertation. The University of Tennessee.
Brewer, P. & Speh, T., 2001. Adapting the balanced scorecard to supply chain management. SUPPLY CHAIN MANAGEMENT REVIEW, V. 5, NO. 2 (MAR./APR. 2001), P. 48-56 : ILL.
Brown, A., 2005. IS Evaluation in Practice. Electronic Journal of Information Systems Evaluation, 8(3), 169-178.
Bullinger, H.-J., Kühner, M. & Van Hoof, A., 2002. Analysing supply chain performance using a balanced measurement method. International Journal of Production Research, 40(15), pp.3533–3543.
Cameron, K., 1986. A study of organizational effectiveness and its predictors. Manage. Sci., 32(1), pp.87–112.
Chaudhuri, S., Dayal, U. & Narasayya, V., 2011. An overview of business intelligence technology. Communications of the ACM, 54, p.88.
Chee, T. et al., 2009. Business Intelligence systems: state-of-the-art review and contemporary applications.
Council of Supply Chain Management Professionals, 2010. Glossary of Terms & Definitions. Available at: http://cscmp.org/digital/glossary/glossary.asp [Accessed December 19, 2011].
Creswell, J.W., 2003. Research Design: Qualitative, Quantitative, and Mixed Method Approaches, SAGE.

BI FOR HORIZONTAL COOPERATION REFERENCES
UNRESTRICTED Page 82
Crossland, M. & Smith, D., 2008. Realizing the Value of Business Intelligence. International Federation for Information Processing Digital Library, 274(1).
Cruijssen, F., 2006. Horizontal Cooperation in Transport and Logistics. Tilburg: Tilburg University.
D’Amours, S. et al., 2006. Agent-Based Supply Chain Planning in the Forest Products Industry. In Information Technology For Balanced Manufacturing Systems. Boston, MA: Springer US, pp. 17–26.
Davis, P. & Pett, T., 2002. Measuring organizational efficiency and effectiveness. Journal of Management Research, 2(2), pp.87–97.
Dinalog, 2010. 4C4More - Research & Development Projects - Projects - Dinalog - Dutch Institute for Advanced Logistics. Available at: http://www.dinalog.nl/institute/projects/research-development-projects/4c4more/268 [Accessed November 27, 2011].
Donselaar, K. van, Kokke, K. & Allessie, M., 1998. Performance measurement in the transportation and distribution sector. International Journal of Physical Distribution & Logistics Management, 28(6), pp.434–450.
Eisenhardt, K., 1989. Building Theories from Case Study Research. Academy of Management Review, 14(4), pp.532–550.
Eisenhardt, K. & Graebner, M., 2007. Theory building from cases: Opportunities and challenges. Academy of Management Journal, 50(1), pp.25–32.
European Commission, 2011. Market trends and structure of the road haulage sector in the EU in 2010, European Commission, DG Energy and Transport, Unit D.3 – Land transport.
European Commission, 2008. Statistical coverage and economic analysis of the logistics sector in the EU (SEALS), Basel – Rotterdam – Nürnberg – Denzlingen: European Commission, DG Energy and Transport.
European Union, 2001. Guidelines on the applicability of Article 81 of the EC Treaty to horizontal cooperation agreements. European Commission Notice 2001/C 3/02.
Eurostat, 2011. Eurostat - National annual road transport by group of goods and type of transport. Available at: http://epp.eurostat.ec.europa.eu/portal/page/portal/eurostat/home/ [Accessed October 23, 2011].
EyeForTransport, 2010. European Supply Chain Horizontal Collaboration Report, eyefortransport.
Fisher, M., 1997. What Is the Right Supply Chain for Your Product? Harvard Business Review.
Ford, J.D. & Schellenberg, D.A., 1982. Conceptual Issues of Linkage in the Assessment of Organizational Performance. The Academy of Management Review, 7(1), pp.49–58.
Franceschini, F., Galetto, M. & Maisano, D., 2007. Management by Measurement: Designing Key Indicators and Performance Measurement Systems, Springer Verlag.
Fugate, B.S., Mentzer, J.T. & Stank, T.P., 2010. Logistics Performance: Efficiency, Effectiveness, and Differentiation. Journal of Business Logistics, 31(1), pp.43–62.
BI FOR HORIZONTAL COOPERATION REFERENCES
UNRESTRICTED Page 83
GAO, 2011. Performance Measurement and Evaluation: Definitions and Relationships. Available at: http://www.gao.gov/assets/80/77277.pdf.
Gartz, U. & Raisinghani, M., 2004. Business intelligence in the digital economy: opportunities, limitations and risks Enterprise Information Management., Idea Group Inc (IGI).
Gibson, M., Arnott, D. & Jagielska, I., 2004. Evaluating the Intangible Benefits of Business Intelligence: Review & Research Agenda.
Golicic, S.L., Davis, D.F. & Mccarthy, T.M., 2005. A Balanced Approach to Research in Supply Chain Management. Structural Equation Modeling, pp.15–30.
Griffis, S.E. et al., 2007. Aligning Logistics Performance Measures to the Information Needs of the Firm. Journal of Business Logistics, 28(2), pp.35–56.
Gunasekaran, A., Patel, C. & McGaughey, R.E., 2004. A framework for supply chain performance measurement. International Journal of Production Economics, 87(3), pp.333–347.
Den Hamer, P., 2005. De organisatie van business intelligence,
Hevner, A.R. et al., 2004. Design Science in Information Systems Research. MIS Quarterly, 28(1), pp.75–105.
Hugos, M.H., 2011. Essentials of supply chain management Third., John Wiley and Sons.
Inmon, W.H., 2005. Building the data warehouse, Wiley.
Jensen, C.S., Pedersen, T.B. & Thomsen, C., 2010. Multidimensional Databases and Data Warehousing, Morgan & Claypool Publishers.
Kale, P. & Singh, H., 2009. Managing strategic alliances: what do we know now, and where do we go from here? The Academy of Management Perspectives (formerly The Academy of Management Executive)(AMP), 23(3), pp.45–62.
Kaplan, R.S. & David, P., 1992. The Balanced Scorecard-Measures That Drive Performance. Harvard Business Review, pp.71–79.
Kleijnen, J.P.C. & Smits, M.T., 2003. Performance Metrics in Supply Chain Management. The Journal of the Operational Research Society, 54(5), pp.507–514.
Koufteros, X.A., Vonderembse, M.A. & Doll, W.J., 2002. Examining the Competitive Capabilities of Manufacturing Firms. Structural Equation Modeling: A Multidisciplinary Journal, 9(2), pp.256–282.
Koulikoff-Souviron, M. & Seuring, A. eds., 2005. Using Case Study Methods in Researching Supply Chains. In Research Methodologies in Supply Chain Management. Heidelberg: Physica-Verlag.
Krauth, E., Moonen, H. & Popova, V., 2005. Performance Measurement and Control in Logistics Service Providing.
Kuehne + Nagel, 2011. Kuehne + Nagel website. Available at: http://www.kn-portal.com/ [Accessed November 27, 2011].

BI FOR HORIZONTAL COOPERATION REFERENCES
UNRESTRICTED Page 84
Laarhoven, P. van, Berglund, M. & Peters, M., 2000. Third-party logistics in Europe – five years later. International Journal of Physical Distribution & Logistics Management, 30(5), pp.425–442.
Lambert, D.M., Emmelhainz, M.A. & Gardner, J.T., 1999. Building successful logistics partnerships. Journal of Business Logistics, 20(1), pp.165–182.
Langley, C.J. & Holcomb, M.C., 1992. Creating Logistics Customer Value. Journal of Business Logistics, 13(2), pp.1–27.
Larson, P.D., Poist, R.F. & Halldórsson, Á., 2007. Perspectives on logistics vs. SCM: a survey of SCM professionals. Journal of Business Logistics, 28(1), pp.1–24.
Lee, A.S. & Baskerville, R.L., 2003. Generalizing Generalizability in Information Systems Research. Info. Sys. Research, 14(3), pp.221–243.
Lehoux, N. et al., 2009. Issues and Experiences in Logistics Collaboration. In L. M. Camarinha-Matos, I. Paraskakis, & H. Afsarmanesh, eds. Leveraging Knowledge for Innovation in Collaborative Networks. Berlin, Heidelberg: Springer Berlin Heidelberg, pp. 69–76.
Leitner, R. et al., 2011. Structural concepts for horizontal cooperation to increase efficiency in logistics. CIRP Journal of Manufacturing Science and Technology, 4(3), pp.332–337.
Lieb, R. & Bentz, B., 2005. The Use of Third-Party Logistics Services by Large American Manufacturers:The 2004 Survey. TRANSPORTATION JOURNAL.
Logica BI community, 2009. The BI Framework - How to turn information into a competitive asset, Logica.
Lönnqvist, A. & Pirttimäki, V., 2006. The measurement of business intelligence. Information Systems Management, 23(1), pp.32–40.
Luhn, H., 1958. A Business Intelligence System. IBM Journal of Research and Development, vol. 2, no. 4, pp. 314-319.
Mahoney, T., 1988. Productivity Defined: The Relativity of Efficiency, Effectiveness, and Change. In Productivity in Organizations: New Perspectives from Industrial and Organizational Psychology. J. P. Campbell and R. J. Campbell. San Francisco: Jossey-Bass.
Markus, M.L. et al., 2006. Industry-wide information systems standardization as collective action: the case of the U.S. residential mortgage industry. MIS Q., 30(1), pp.439–465.
McKinney, D. & Fitzer, M., 2010. Reducing Empty Miles through Process Improvement.
Microsoft, 2011. SQL Server Integration Services. Available at: http://technet.microsoft.com/en-us/library/ms141026.aspx [Accessed March 15, 2012].
Monash University, 2010. Research Methods - Measurement scales. Available at: http://www.csse.monash.edu.au/~smarkham/resources/scaling.htm [Accessed April 7, 2012].
Monden, Y., 1993. Toyota production system: an integrated approach to just-in-time, Industrial Engineering and Management Press.

BI FOR HORIZONTAL COOPERATION REFERENCES
UNRESTRICTED Page 85
Moss, L. & Hoberman, S., 2004. The Importance Of Data Modeling As A Foundation For Business Insight | TechRepublic, Teradata.
Nabuurs Group, 2011. Nabuurs Group website. Available at: http://www.nabuurs.eu/en [Accessed November 27, 2011].
Nakajima, S., 1988. Introduction to TPM: total productive maintenance, Productivity Press.
Näslund, D., 2002. Logistics needs qualitative research – especially action research. International Journal of Physical Distribution & Logistics Management, 32(5), pp.321–338.
Ostroff, C. & Schmitt, N., 1993. Configurations of Organizational Effectiveness and Efficiency. The Academy of Management Journal, 36(6), pp.1345–1361.
Petty, G., 2005. National Private Truck Council (NPTC) 2005 Benchmarking Survey. Available at: http://truckinginfo.com/hdt/archives/2005/03/068a0503.asp [Accessed October 26, 2011].
Petty, G., 2008. National Private Truck Council (NPTC) 2008 Benchmarking Survey Reaffirms Private Fleet Value. FleetOwner. Available at: http://fleetowner.com/mag/fleet_nptc_benchmarking_survey/ [Accessed October 26, 2011].
QlikView, 2012. Business Discovery: Business Intelligence For Everyone | QlikView. Available at: http://www.qlikview.com/uk [Accessed March 15, 2012].
Rao, P. & Swarup, S., 2001. Business Intelligence and Logistics. Wipro Technologies.
Seddon, P.B. & Scheeper, R., 2012. Towards the improved treatment of generalization of knowledge claims in IS research : drawing general conclusions from samples. European journal of information systems, 21, pp.6–21.
Seffah, A. et al., 2006. Usability measurement and metrics: A consolidated model. Software Quality Journal, 14(2), pp.159–178.
Selldin, E. & Olhager, J., 2007. Linking products with supply chains: testing Fisher’s model. Supply Chain Management: An International Journal, 12(1), pp.42–51.
Seuring, S., 2005. Case Study Research in Supply Chains – An Outline and Three Examples. Supply Chain Management An International Journal, pp.235–250.
Silvius, A., 2006. Does ROI Matter? Insights into the True Business Value of IT. The Electronic Journal of Systems Evaluation, 9(2), 93 – 104.
Simatupang, T.M. & Sridharan, R., 2005. The collaboration index: a measure for supply chain collaboration. International Journal of Physical Distribution & Logistics Management, 35(1), pp.44–62.
Simons, D., Mason, R. & Gardner, B., 2004. Overall vehicle effectiveness. International Journal of Logistics Research and Applications, 7(2), pp.119–135.
Steers, R.M., 1975. Problems in the Measurement of Organizational Effectiveness. Administrative Science Quarterly, 20(4), pp.546–558.
Stock, G.N., Greis, N.P. & Kasarda, J.D., 1998. Logistics, strategy and structure: A conceptual framework. International Journal of Operations & Production Management, 18(1), pp.37–52.

BI FOR HORIZONTAL COOPERATION REFERENCES
UNRESTRICTED Page 86
Stuart, I. et al., 2002. Effective case research in operations management: a process perspective. Journal of Operations Management, 20(5), pp.419–433.
Sutherland, J., 2003. Collaborative Transportation Management – Creating Value Through Increased Transpor tation Efficiencies,
Tella, E. & Virolainen, V.-M., 2005. Motives behind purchasing consortia. International Journal of Production Economics, 93–94, pp.161–168.
Truck News Canada, 2011. 2011 Business Practice Benchmarking Survey For Canadian Private Carriers, Available at: http://www.trucknews.com/benchmark/ [Accessed October 26, 2011].
Vitt, E., Luckevich, M. & Misner, S., 2002. Business intelligence: making better decisions faster, Microsoft Press.
Voss, C., Tsikriktsis, N. & Frohlich, M., 2002. Case research in operations management. International Journal of Operations & Production Management, 22(2), pp.195–219.
Wieringa, R., 2011. Design Science Methodology (Slides).
Wikipedia, 2011. Postcodes in Nederland. Available at: http://nl.wikipedia.org/wiki/Postcodes_in_Nederland [Accessed April 9, 2012].
Wolfswinkel, J., Furtmueller, E. & Wilderom, C., 2011. Using Grounded Theory as a Method for Rigorously Reviewing Literature. European Journal of Information Systems, forthcoming.
Yin, R.K., 2003. Case study research: design and methods, Sage Publications.
Zacharia, Z.G., Nix, N.W. & Lusch, R.F., 2009. An Analysis of Supply Chain Collaborations and Their Effect on Performance Outcomes. Journal of Business Logistics, 30(2), pp.101–123.
Zhang, C., Yu, H. & Liu, Z., 2008. Logistics Collaboration Supported by Electronic Logistics Marketplaces. In IEEE Symposium on Advanced Management of Information for Globalized Enterprises, 2008. AMIGE 2008. IEEE Symposium on Advanced Management of Information for Globalized Enterprises, 2008. AMIGE 2008. IEEE, pp. 1–5.
Zhao, L. & Huang, X., 2009. Research on the Application of Business Intelligence in Logistics Management. In International Conference on Management and Service Science, 2009. MASS ’09. International Conference on Management and Service Science, 2009. MASS ’09. IEEE, pp. 1–4.
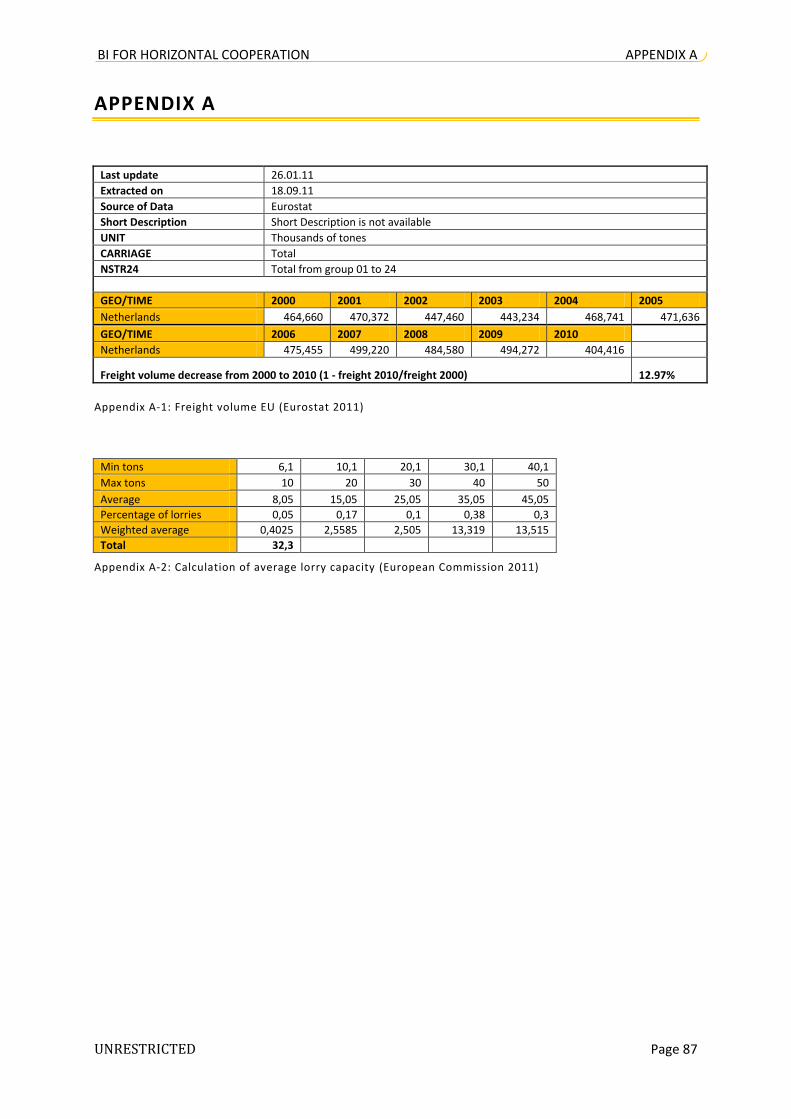
BI FOR HORIZONTAL COOPERATION APPENDIX A
UNRESTRICTED Page 87
APPENDIX A
Last update 26.01.11
Extracted on 18.09.11
Source of Data Eurostat
Short Description Short Description is not available
UNIT Thousands of tones
CARRIAGE Total
NSTR24 Total from group 01 to 24
GEO/TIME 2000 2001 2002 2003 2004 2005
Netherlands 464,660 470,372 447,460 443,234 468,741 471,636
GEO/TIME 2006 2007 2008 2009 2010
Netherlands 475,455 499,220 484,580 494,272 404,416
Freight volume decrease from 2000 to 2010 (1 - freight 2010/freight 2000) 12.97%
Appendix A-1: Freight volume EU (Eurostat 2011)
Min tons 6,1 10,1 20,1 30,1 40,1
Max tons 10 20 30 40 50
Average 8,05 15,05 25,05 35,05 45,05
Percentage of lorries 0,05 0,17 0,1 0,38 0,3
Weighted average 0,4025 2,5585 2,505 13,319 13,515
Total 32,3
Appendix A-2: Calculation of average lorry capacity (European Commission 2011)
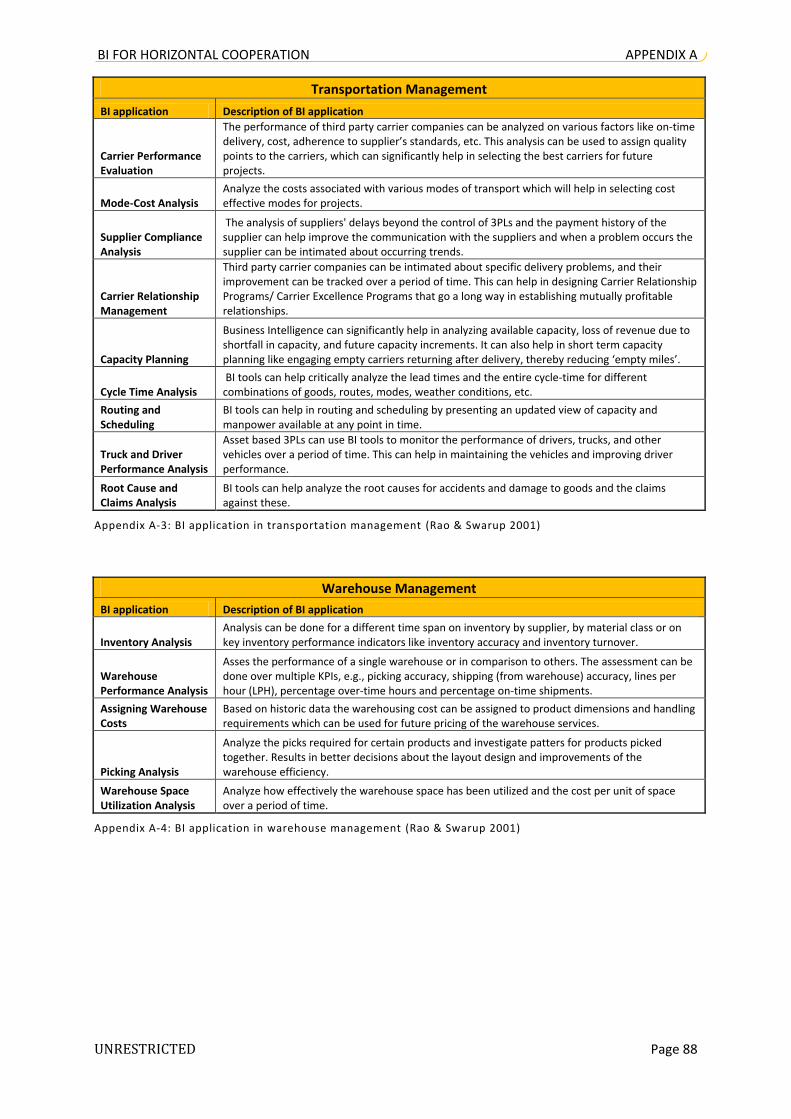
BI FOR HORIZONTAL COOPERATION APPENDIX A
UNRESTRICTED Page 88
Transportation Management
BI application Description of BI application
Carrier Performance Evaluation
The performance of third party carrier companies can be analyzed on various factors like on-time delivery, cost, adherence to supplier’s standards, etc. This analysis can be used to assign quality points to the carriers, which can significantly help in selecting the best carriers for future projects.
Mode-Cost Analysis Analyze the costs associated with various modes of transport which will help in selecting cost effective modes for projects.
Supplier Compliance Analysis
The analysis of suppliers' delays beyond the control of 3PLs and the payment history of the supplier can help improve the communication with the suppliers and when a problem occurs the supplier can be intimated about occurring trends.
Carrier Relationship Management
Third party carrier companies can be intimated about specific delivery problems, and their improvement can be tracked over a period of time. This can help in designing Carrier Relationship Programs/ Carrier Excellence Programs that go a long way in establishing mutually profitable relationships.
Capacity Planning
Business Intelligence can significantly help in analyzing available capacity, loss of revenue due to shortfall in capacity, and future capacity increments. It can also help in short term capacity planning like engaging empty carriers returning after delivery, thereby reducing ‘empty miles’.
Cycle Time Analysis BI tools can help critically analyze the lead times and the entire cycle-time for different combinations of goods, routes, modes, weather conditions, etc.
Routing and Scheduling
BI tools can help in routing and scheduling by presenting an updated view of capacity and manpower available at any point in time.
Truck and Driver Performance Analysis
Asset based 3PLs can use BI tools to monitor the performance of drivers, trucks, and other vehicles over a period of time. This can help in maintaining the vehicles and improving driver performance.
Root Cause and Claims Analysis
BI tools can help analyze the root causes for accidents and damage to goods and the claims against these.
Appendix A-3: BI application in transportation management (Rao & Swarup 2001)
Warehouse Management
BI application Description of BI application
Inventory Analysis Analysis can be done for a different time span on inventory by supplier, by material class or on key inventory performance indicators like inventory accuracy and inventory turnover.
Warehouse Performance Analysis
Asses the performance of a single warehouse or in comparison to others. The assessment can be done over multiple KPIs, e.g., picking accuracy, shipping (from warehouse) accuracy, lines per hour (LPH), percentage over-time hours and percentage on-time shipments.
Assigning Warehouse Costs
Based on historic data the warehousing cost can be assigned to product dimensions and handling requirements which can be used for future pricing of the warehouse services.
Picking Analysis
Analyze the picks required for certain products and investigate patters for products picked together. Results in better decisions about the layout design and improvements of the warehouse efficiency.
Warehouse Space Utilization Analysis
Analyze how effectively the warehouse space has been utilized and the cost per unit of space over a period of time.
Appendix A-4: BI application in warehouse management (Rao & Swarup 2001)
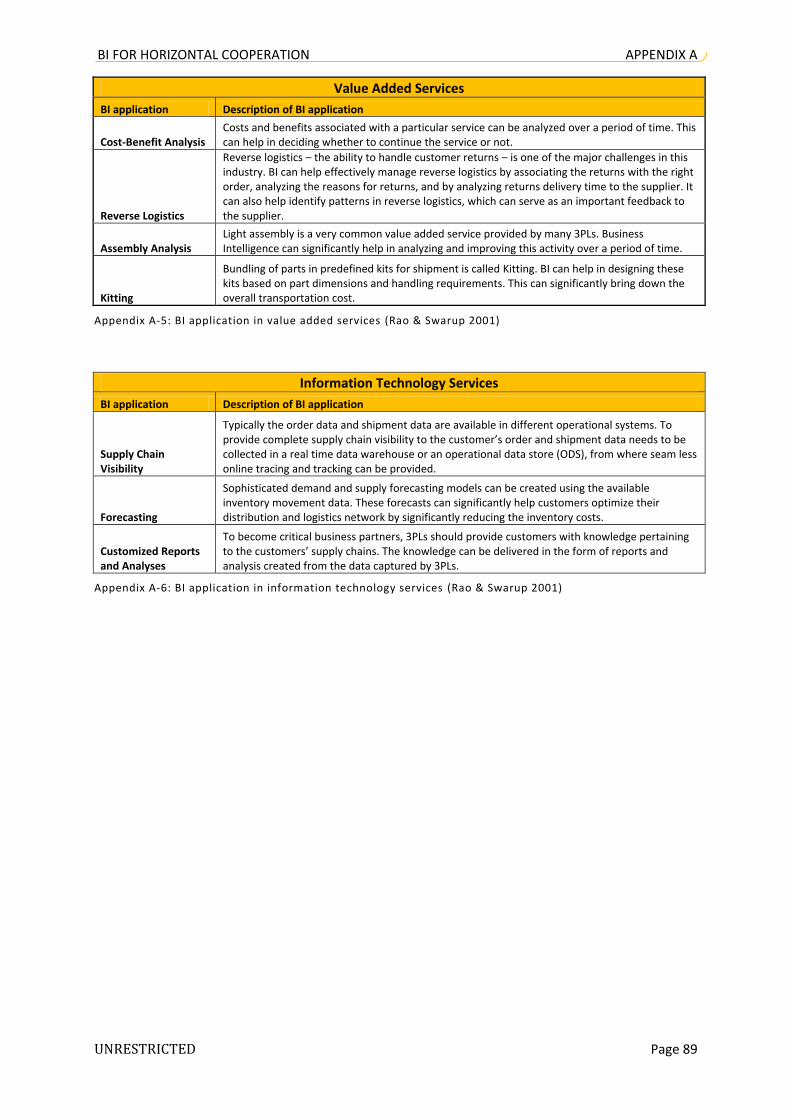
BI FOR HORIZONTAL COOPERATION APPENDIX A
UNRESTRICTED Page 89
Value Added Services
BI application Description of BI application
Cost-Benefit Analysis Costs and benefits associated with a particular service can be analyzed over a period of time. This can help in deciding whether to continue the service or not.
Reverse Logistics
Reverse logistics – the ability to handle customer returns – is one of the major challenges in this industry. BI can help effectively manage reverse logistics by associating the returns with the right order, analyzing the reasons for returns, and by analyzing returns delivery time to the supplier. It can also help identify patterns in reverse logistics, which can serve as an important feedback to the supplier.
Assembly Analysis Light assembly is a very common value added service provided by many 3PLs. Business Intelligence can significantly help in analyzing and improving this activity over a period of time.
Kitting
Bundling of parts in predefined kits for shipment is called Kitting. BI can help in designing these kits based on part dimensions and handling requirements. This can significantly bring down the overall transportation cost.
Appendix A-5: BI application in value added services (Rao & Swarup 2001)
Information Technology Services
BI application Description of BI application
Supply Chain Visibility
Typically the order data and shipment data are available in different operational systems. To provide complete supply chain visibility to the customer’s order and shipment data needs to be collected in a real time data warehouse or an operational data store (ODS), from where seam less online tracing and tracking can be provided.
Forecasting
Sophisticated demand and supply forecasting models can be created using the available inventory movement data. These forecasts can significantly help customers optimize their distribution and logistics network by significantly reducing the inventory costs.
Customized Reports and Analyses
To become critical business partners, 3PLs should provide customers with knowledge pertaining to the customers’ supply chains. The knowledge can be delivered in the form of reports and analysis created from the data captured by 3PLs.
Appendix A-6: BI application in information technology services (Rao & Swarup 2001)

BI FOR HORIZONTAL COOPERATION APPENDIX A
UNRESTRICTED Page 90
Appendix A-7: List of clustered performance indicators for LSPs (Krauth et al. 2005)

BI FOR HORIZONTAL COOPERATION APPENDIX A
UNRESTRICTED Page 91
Internal perspective
External perspective
Customer’s point of viewq Order configuration flexibility
q Possibility to change order details
q Additional services price (priority
transportation)
q Contact points (number of people
to contact)
q Available types of goods
insurance
q Order size flexibility
q Timeliness of goods delivery
q Services variety
q Product variety
q Response time
q Transparency for a customer
q Possible types of communication
q Customer’s point of view
q Transportation price
q Insurance price
q Primary services price
q Goods safety
Activities effectiveness and efficiency (shared in the collaboration)
Other value adding services
(Industrial Packaging, Production Planning/
Scheduling, Procurement, Return Goods
Handling)
Storage(Warehousing, Material
Handling, Inventory Control)
Transportation(Inbound & Outbound)
q Order fill rate
q Line item fill rate
q Scrap rate
q Nº of palets stored in warehouse /
warehouse capacity in Nº palets
q Inventory accuracy
q Inventory turnover
q Service rate
q Nº of orders shipped on time / total
Nº of orders shipped
q Quality of delivery documentation
per truck/driver
q Effectiveness of delivery invoice
methods
q % orders / lines received with correct
shipping documents
q % product transferred without
transaction errors
q Item/Product/Grade changeover time
q Ratio of realized orders vs. requested
orders
q Average delivery planning time
q Capacity utilization
q Km per day
q Turnover per km
q % Empty km/total km
q Number of deliveries
q Benefit per delivery
q Trips per period
q Total loading capacity (for trucks)
q On-time delivery performance
q Total distribution cost
q % of realized km out of planned km
Overall effectivenessq Effectiveness of distribution
planning schedule
q % of orders scheduled to customer
request
q % of supplier contracts negotiated
meeting target terms and
conditions for quality, delivery,
flexibility and cost
q Competitive advantage
q Plan fulfilment
q Long term plans availability /
development
q Market share width
q Number of markets that have
been penetrated
q Successful contacts –% of
successful deals out of the initial
offers
q Number of new customers
q Number of regular customers
q Number of profitable customers
q Customer retention
q Continuous improvement, rate
q Product range
q Revenue
q Profit margins
q Labour productivity
q Price
q Perfect order fulfilment
q Total number of orders
q Number of customers
Overall efficiencyq Information system costs
q Overhead/management/
administrative costs
q Order management costs
q Supply chain finance costs
q Total supply chain costs
q Total time in repair (for trucks)
q Appraisal/Inspection costs
q % of failed orders
q Performance measurements costs
q Human resource costs
q Variable asset costs
q Fixed asset costs
q Customer service costs
q Order management costs
q Inventories
q Marketing costs
q Failure costs
q Prevention costs
q Labour utilization
q Overhead percentage
q Overtime hours
q Absent employees
q Salaries and benefits
q Controllable expenses
q Non-controllable expenses
Employee satisfactionq Weight to (un)load per labour
hour
q Salaries and benefits
q % of orders scheduled to
customer request
q Overall employees satisfaction
q Working conditions
q Number of customer complains
q Overall customer satisfaction
q Km per trip
q Attrition of drivers
q Morale, motivation of personnel
q On-time delivery performance
IT and innovationq % of invoice receipts and
payments generated via EDI
q Average time for new products
development
q Average costs for new product
development
q % of employees with IT training
q Availability of IT equipment
q % of information management
assets used / production assets
q IT training costs
q Number of new products in the
range
q % of information exchange
through IT
q Information system costs
q Up-to-date performance
q Information availability
q Utilization of IT equipment
Society’s point of viewq Care for animals/children around
q Use of innovation technologies
q Development of innovation
technologies
q Cooperation with other companies
q Reputation of a company
q Road maintenance costs
q Number of available work places
q Competition level among similar
companies
q Disaster risk
q Solid particles emission
q Taxes to the national treasury
q Participation in charitable actions
q Level of CO2 emission
q Society satisfaction
q Wasting resources
q Recycling level
q Employees satisfaction
Appendix A-8: Adaptation of the framework proposed by Krauth et al. (2005)

BI FOR HORIZONTAL COOPERATION APPENDIX A
UNRESTRICTED Page 92
Appendix A-9: Results from the brainstorming session at K+N
Appendix A-10: SSIS integration package – DFT: Move data from flat files to DB
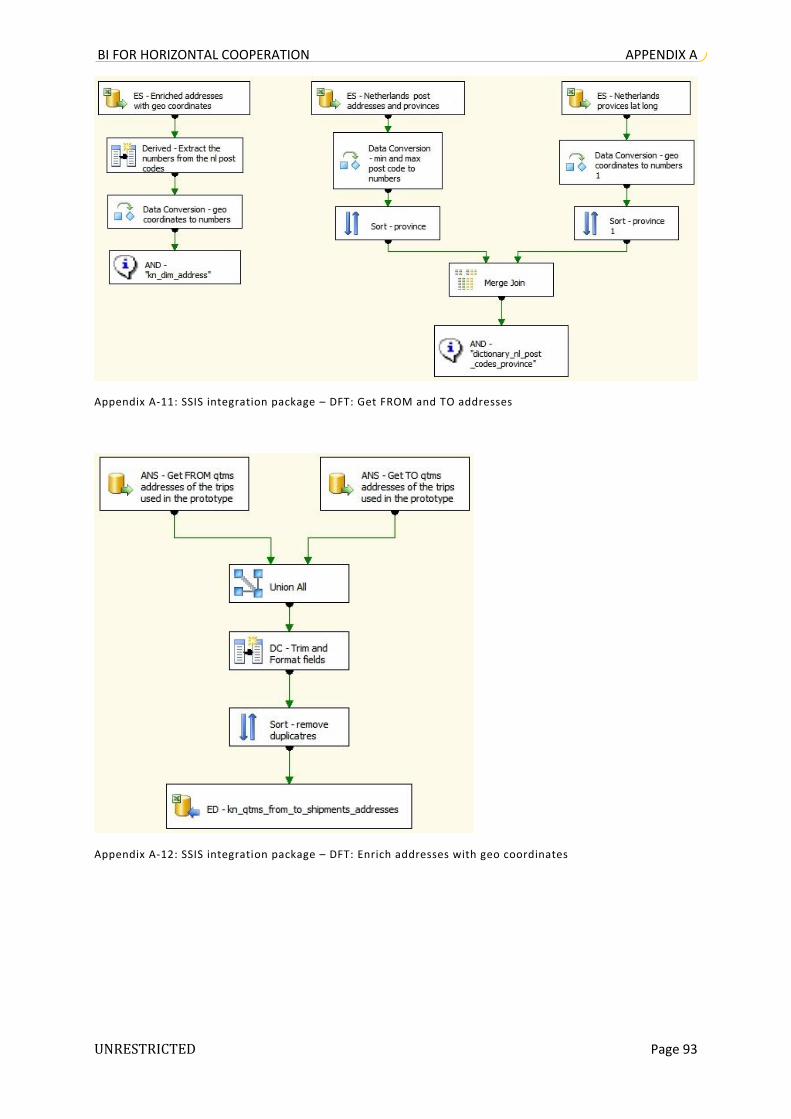
BI FOR HORIZONTAL COOPERATION APPENDIX A
UNRESTRICTED Page 93
Appendix A-11: SSIS integration package – DFT: Get FROM and TO addresses
Appendix A-12: SSIS integration package – DFT: Enrich addresses with geo coordinates
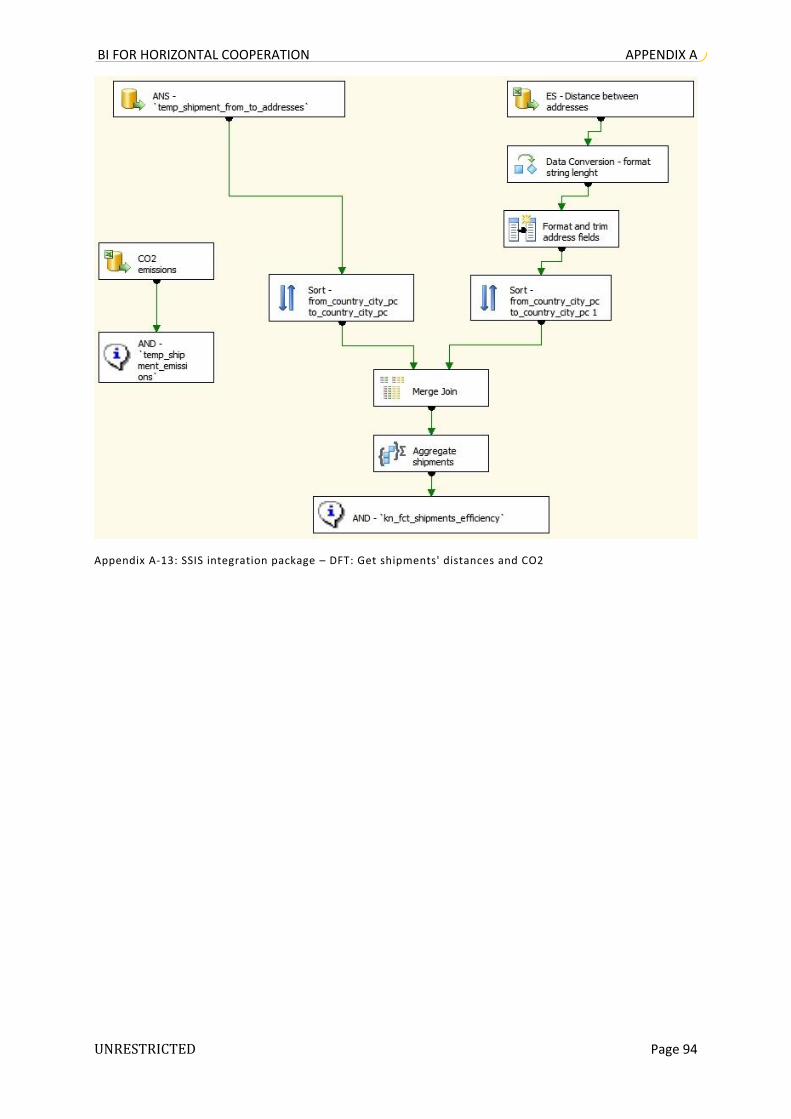
BI FOR HORIZONTAL COOPERATION APPENDIX A
UNRESTRICTED Page 94
Appendix A-13: SSIS integration package – DFT: Get shipments' distances and CO2

BI FOR HORIZONTAL COOPERATION APPENDIX B – DASHBOARD DESIGN
UNRESTRICTED Page 95
APPENDIX B – DASHBOARD DESIGN
Appendix B-1: Dashboard OTE

BI FOR HORIZONTAL COOPERATION APPENDIX B – DASHBOARD DESIGN
UNRESTRICTED Page 96
Appendix B-2: Dashboard OTE trends
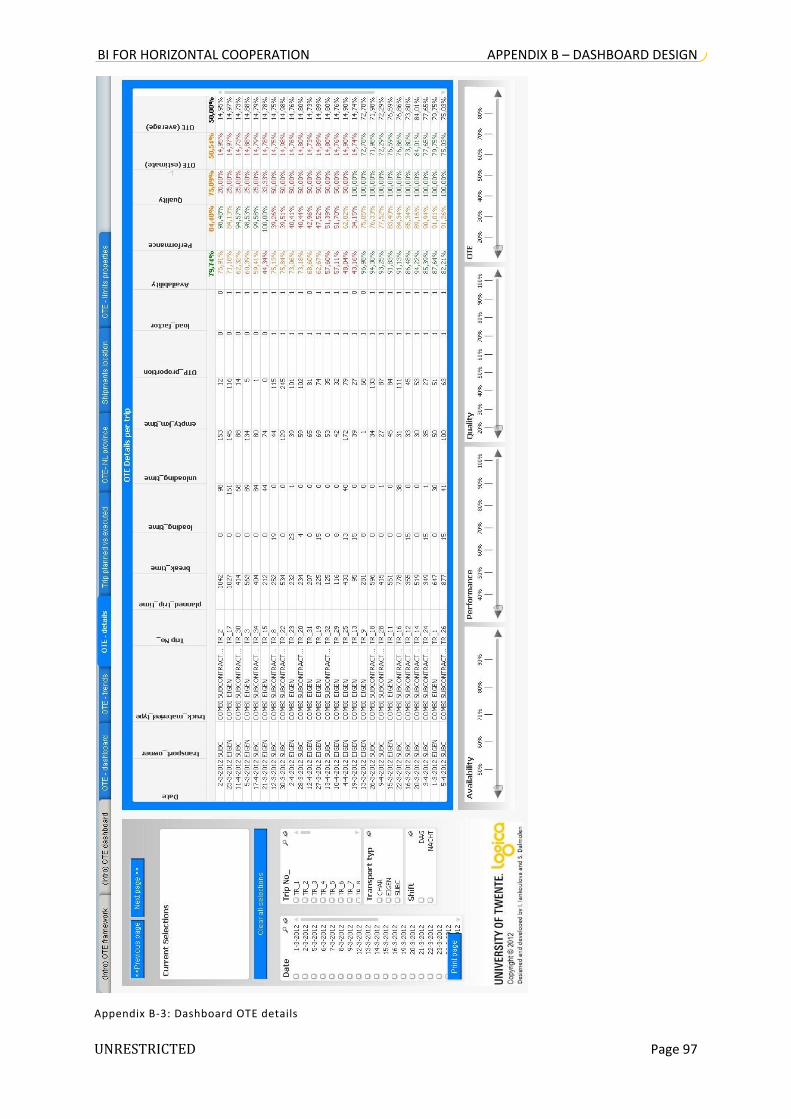
BI FOR HORIZONTAL COOPERATION APPENDIX B – DASHBOARD DESIGN
UNRESTRICTED Page 97
Appendix B-3: Dashboard OTE details
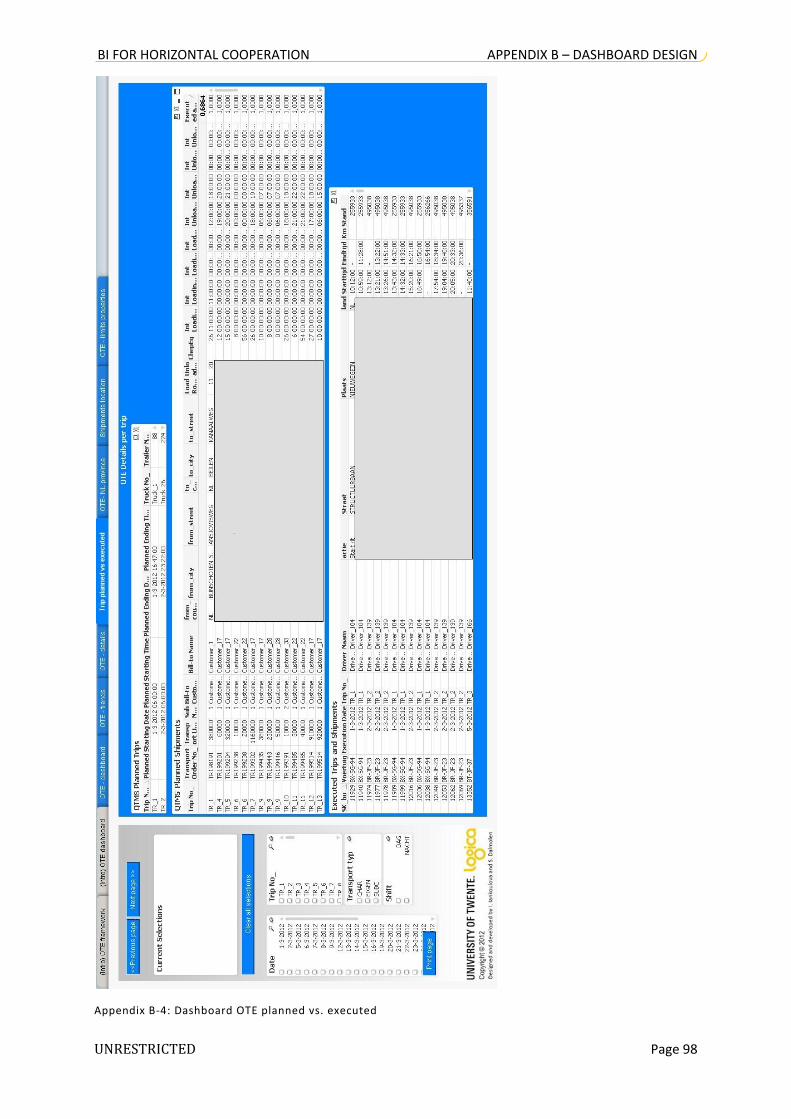
BI FOR HORIZONTAL COOPERATION APPENDIX B – DASHBOARD DESIGN
UNRESTRICTED Page 98
Appendix B-4: Dashboard OTE planned vs. executed
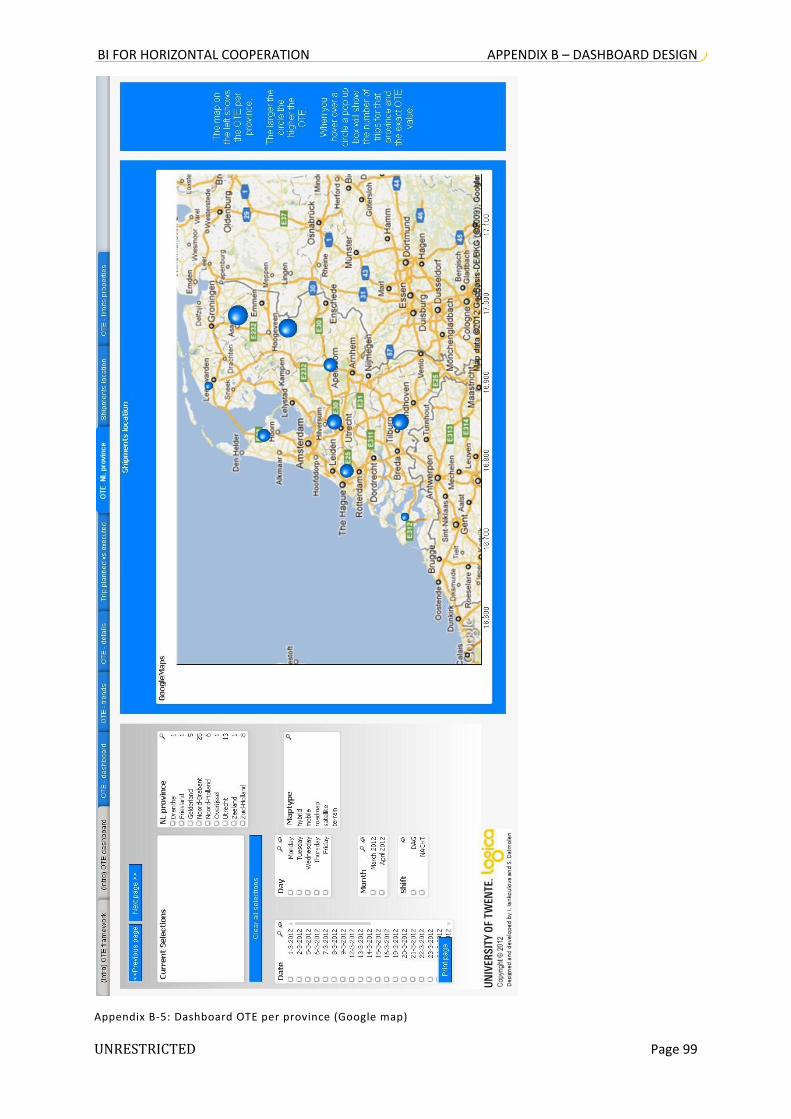
BI FOR HORIZONTAL COOPERATION APPENDIX B – DASHBOARD DESIGN
UNRESTRICTED Page 99
Appendix B-5: Dashboard OTE per province (Google map)

BI FOR HORIZONTAL COOPERATION APPENDIX B – DASHBOARD DESIGN
UNRESTRICTED Page 100
Appendix B-6: Dashboard OTE Google map of shipments

BI FOR HORIZONTAL COOPERATION APPENDIX B – DASHBOARD DESIGN
UNRESTRICTED Page 101
Appendix B-7: Dashboard OTE set limits

BI FOR HORIZONTAL COOPERATION APPENDIX C – QUESTIONNAIRE
UNRESTRICTED Page 102
APPENDIX C – QUESTIONNAIRE
Appendix C-1: Questionnaire OTE framework evaluation
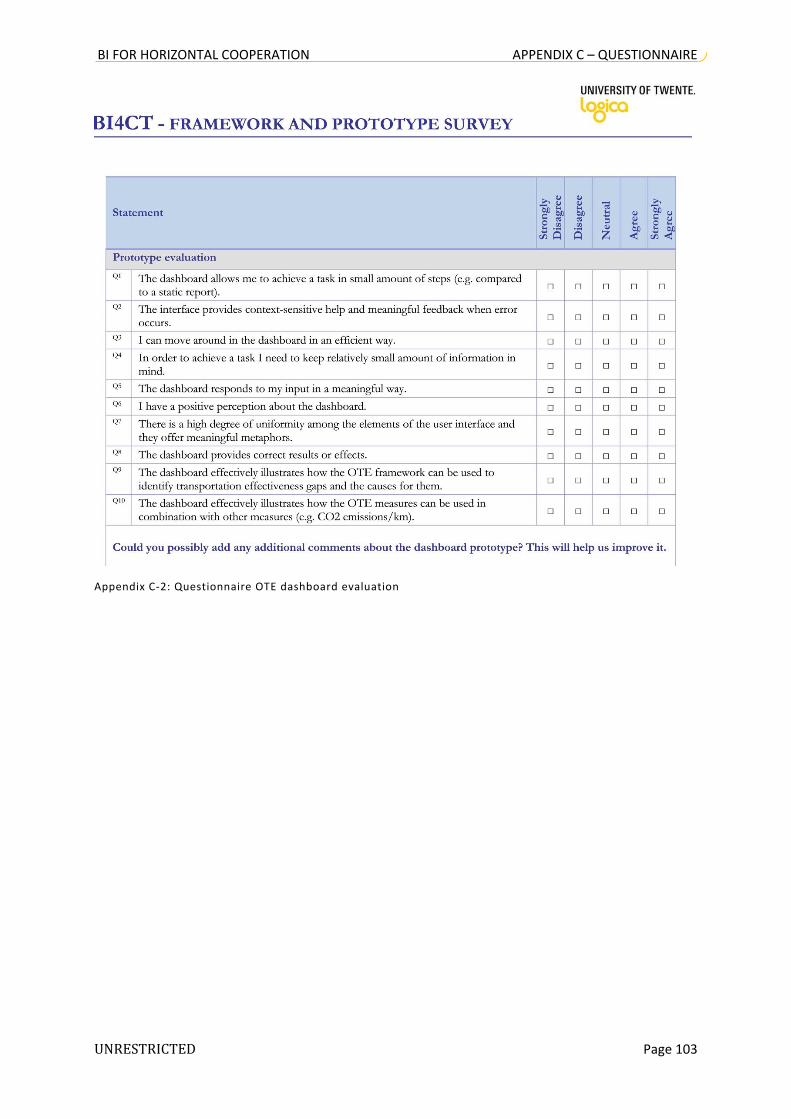
BI FOR HORIZONTAL COOPERATION APPENDIX C – QUESTIONNAIRE
UNRESTRICTED Page 103
Appendix C-2: Questionnaire OTE dashboard evaluation