Embed Size (px)
Citation preview

1 INTRODUCTION
I
DETERMINATION OF VALUABLE AREAS FOR MIGRATORY SONGBIRDS ALONG THE EAST-ASIAN AUSTRALASIAN FLYWAY (EEAF), AND AN APPROACH FOR STRATEGIC
CONSERVATION PLANNING
MASTER THESIS
Maria Beiring
Vienna, July 2013
Submitted to University of Natural Resources and Life Sciences Vienna in partial fulfillment the requirements for the degree of
MASTER OF SCIENCE
Landschaftsplanung & Landschaftsarchitektur

II
Supervisor: Prof. Dr. Andreas Muhar
University of Natural Resources and Life Science, Institute of Landscape
Development, Recreation and Conservation Planning, Vienna (Austria)
Co-Supervisor: Associate Prof. Dr. Falk Huettmann University of Alaska Fairbanks, Institute of Arctic Biology, Fairbanks (USA)
Second examiner: Prof. Dr. Alexander Bruckner, University of Natural Resources and Life Science, Institute of Zoology,
Vienna (Austria)
1 INTRODUCTION
III
SUMMARY
Having valuable high-quality stopover sites available for migratory birds is one of the key factors for the success of migration. However, beside the conservation of breeding and wintering grounds, the actual protection of valuable stopover sites has often been somewhat neglected. Overall 93 of 315 passerine species along the East-Asian Australasian Flyway (EEAF) are declining. That’s the highest overall number of threatened passerines on any known flyway. Additionally, the high human density in South-East Asia and the ongoing degradation of natural resources further poses a serious problem and threat to migratory songbirds and necessitates urgent action. This study aims to identify valuable areas for migratory songbirds along the vast EAAF (China, Japan, Korea, Far Eastern Russia and Alaska) and to develop a first approach for Strategic Conservation Planning. The main methodological framework encompasses predictive modeling (TreeNet, stochastic gradient boosting) and the Strategic Conservation Planning Tool ‘Marxan’. Overall, six models were created by using mistnet data (fall migration) of five selected index species (Arctic Warbler, Yellow Wagtail, Bluethroat, Siberian Rubythroat & Black-faced Bunting) as well as a by developing a ‘Species Richness Index’ (songbirds) and choosing widely used predictive environmental layers. In northern Russia and Alaska, most contiguous areas with a high index of occurrence are concentrated on the coastline of the Pacific Rim with smaller patterns in the interior and differences between their extents. In central-east Asia contiguous areas were found along the coastline stretching deeper inland than for the other regions. For the ‘Species Richness Index’, valuable areas were mostly predicted for the areas along the border of China and Russia, and comprise large parts of the Manchurian forest (deciduous). In general, it’s notable that the characteristics of the predicted hotspots seem to be linked to the habitat preferences of the selected songbirds during the breeding season. At the same time the generally extensive contiguous areas with a high index of occurrence indicate a higher variability in habitat use during fall migration than during the breeding season, too. Moreover the results indicate broad-front migration and putting the concept of a few and narrow migration hotspots in doubt. Nevertheless, the areas with a high index of occurrence have to be seen in view of the actual availability of high-quality staging sites as well. In the framework of Strategic Conservation Planning, five reserve solution scenarios with different focuses (Species Richness, boreal index Species, subboreal index species & all species with consideration of vulnerable areas) were created by using a simulated annealing algorithm implemented in Marxan. In general, only a low percentage (10 -31 %) of the current protection network covers the reserves for the selected index species generated by Marxan. All reserve solutions should be seen as a first approach and public baseline for future conservation planning processes whereby there is a need of further refinement and assessment throughout a stakeholder’s involvement. Nevertheless, because this is the first Top-down approach for the given study area, the results are important to conservation planners for incorporating areas of high conservation value for migratory songbirds.

IV

1 INTRODUCTION
V
ZUSAMMENFASSUNG
Die Verfügbarkeit von qualitativ hochwertigen Zwischenstopps ist ein Schlüsselfaktor für den Erfolg ziehender Singvögel. Neben dem Schutz von Brut- und Überwinterungsgebieten wurde der Schutz solch wertvoller Zwischenstopps jedoch oft vernachlässigt. Insgesamt 93 von 315 Singvogelarten, die entlang des „East-Asian Australasian Flyway“ vorkommen, weisen negative Bestandstrends auf. Das Ziel der vorliegenden Arbeit besteht in der Ermittlung von wertvollen Gebieten ziehender Singvögel entlang eines großen Teils des „East-Asian Australasian Flyways” (China, Japan, Korea, Ostrussland & Alaska). Darüber hinaus wird ein Ansatz für strategische Naturschutzplanung vorgestellt. Der methodische Rahmen umfasst Modellierungen (mithilfe von TreeNet), die Software Marxan (strategische Naturschutzplanung) als auch die Arbeit mit geografischen Informationssystemen. Auf Basis von Fangnetzdaten (Herbstzug) fünf ausgewählter Leitarten (Wanderlaubsänger, Blaukehlchen, Rubinkehlchen, Maskenammer & Schafstelze) und der Entwicklung eines Index des Artenreichtums (Singvögel) wurden insgesamt sechs Modelle erstellt. In Nordrussland und Alaska befinden sich zusammenhängende Gebiete mit einer hohen Wahrscheinlichkeit des Vorkommens der Index Arten vor allen Dingen entlang des Pazifiks. In Zentralostasien finden sich Gebiete mit einem hohen Index ebenfalls entlang der Küste, wobei sie sich weiter ins Inland ausdehnen. Die Modellierung des Artenreichtums zeigt wertvolle Gebiete entlang der Grenze zwischen China und Russland und umfasst große Teile des “Manchurian” Waldkomplex. Generell scheinen die Umweltbedingungen der modellierten Hotspots den Habitatpräferenzen der Arten während der Brutzeit zu ähneln. Die generell großen zusammenhängenden Hotspots weisen jedoch gleichzeitig auf eine größere Variabilität der Habitatnutzung während der Herbstzugs als auch auf Breitenfrontzug hin. Im Rahmen der Entwicklung eines Ansatzes zur strategischen Naturschutzplanung wurden mithilfe des Programms Marxan insgesamt fünf Schutzgebietsszenarien mit jeweils unterschiedlichem Fokus erstellt (Artenreichtum, boreale Leitarten, subboreale Leitarten als auch alle Arten mit besonderer Berücksichtigung von Gebieten bei der von einer höheren Wahrscheinlichkeit von Veränderungen ausgegangen werden kann). Generell deckt nur rein geringer Prozentsatz (10 - 31%) des derzeitigen Schutzgebietsnetzes, die von Marxan generierten Schutzgebietsvorschläge ab. Alle Schutzgebietslösungen sollten als ein erster Ansatz und Grundlage für zukünftige Naturschutzplanungen gesehen werden, wobei ein Bedarf an weiterer Verfeinerung und Bewertung im Rahmen einer Stakeholder-Beteiligung besteht.

VI

1 INTRODUCTION
VII
ACKNOWLEDGEMENT
Each scientific work, especially a Masters thesis, is a product of interactions and stimulations of important insights. First of all I thank my supervisor, Prof. Dr. Andreas Muhar, for trusting in me enough to give me the space to explore scientific work in Alaska while he was always ready for feedback in Austria. Not less I am obliged to Associate Prof Dr. Falk Huettmann in the EWHALE lab of the Institute of Arctic Biology of the University of Fairbanks, Alaska. Without his guidance, commitment and insight this thesis could never have been completed.
Even more so, the same applies for the bird banders in Russia, China, Japan & Alaska. Without their effort and willingness to share the collected data, this work would not exist. Special thanks to: Aleksey Antonov, Mikhail Markovets, Marina Babykina, Katya Mastina, Keisuke Saito, Watanabe, S. Saito, Nakajima, Morohashi, Umemoto, Vladimir Pronkevich, Andrey Averin, Alexander Matsyna, Ekaterina Matsyna, Sergey Surmach, Alexey Druzyakav, Yuri Gerasimov, Falk Huettmann, Nikita Chernetsov, Pavel Kitorov as well as in place of all Alaskan bird bander thanks to the Bird Banding Laboratory of the Patuxent Wildlife Research Center. Their funding bodies are also acknowledged.
I also thank the German Nation Merit Foundation for the financial support as well as Nita, Josh and their 23 sled dogs for giving me a new home for my last weeks and enough silence to finish my thesis while getting a feeling for the real Alaskan way of life. Not least I am very grateful to my family, friends and especially to Josef Maier for their motivation and caring support.

VIII

1 INTRODUCTION
1
TABLE OF CONTENTS
1 INTRODUCTION ............................................................................................................................ 3
1.1 BACKGROUND and OBJECTIVES ............................................................................................... 3
1.2 EAST-ASIAN AUSTRALASIAN FLYWAY (EAAF) ............................................................................ 4
1.2.1 Geography .................................................................................................................... 5
1.2.2 Conservation of migratory birds along the EEAF .................................................... 12
1.3 MIGRATORY SONGBIRDS ........................................................................................................... 14
1.3.1 Avian influenza – current issue on migratory birds .................................................. 17
1.3.2 Index species ............................................................................................................... 18
1.4 SPECIES DISTRIBUTION MODELING ............................................................................................ 23
1.5 STRATEGIC CONSERVATION PLANNING ................................................................................. 24
1.5.1 The need for Strategic Conservation Planning ....................................................... 24
1.5.2 MARXAN (VERSION 1.8.10) – a tool for Strategic Conservation Planning ............ 25
2 METHODS .................................................................................................................................... 27
2.1 DATASET ........................................................................................................................................ 27
2.1.1 Primary data ................................................................................................................ 27
2.1.2 Data integration .......................................................................................................... 28
2.1 PREDICTIVE MODELING .............................................................................................................. 29
2.2.1 Predictor and response variables ............................................................................. 29
2.2.2 TreeNet (Salford Predictive Modeler) ....................................................................... 30
2.2.3 ArcGIS ........................................................................................................................... 31
2.3. IMPLEMENTATION FOR STRATEGIC CONSERVATION PLANNING ....................................... 31
2.3.1 Preparations ................................................................................................................ 31
2.3.2 Scenarios ...................................................................................................................... 36
3 RESULTS ....................................................................................................................................... 42
3.1 PREDICTION: VALUABLE AREAS FOR MIGRATORY SONGBIRDS ......................................... 42
3.1.1 Index species ............................................................................................................... 42
3.2 STRATEGIC CONSERVATION PLANNING WITH MARXAN ...................................................... 66
4 DISCUSSION ............................................................................................................................... 87
4.1 MAIN RESULTS: PREDICTION OF VALUABLE AREAS FOR MIGRATORY SONGBIRDS .......... 87
4.2 SHORTCOMINGS OF PREDICTIVE MODELING OF HOTSPOTS............................................... 89
4.3 MAIN RESULTS: STRATEGIC CONSERVATION PLANNING WITH MARXAN ........................... 90
4.4 SHORTCOMINGS OF STRATEGIC CONSERVATION PLANNING WITH MARXAN ................ 91
4.5 SUGGESTIONS FOR FUTURE RESEARCH & MANAGEMENT RECOMMENDATIONS ............ 93
5 CONCLUSION ............................................................................................................................. 97
REFERENCES ................................................................................................................................. 101

2

1 INTRODUCTION
3
1 INTRODUCTION
1.1 BACKGROUND and OBJECTIVES
Each year millions of birds migrate to their wintering or breeding grounds as part of their annual cycle. Approximately 2274 species of birds are described as being migratory (23 % of all avian species) (CMS definition, GALBRAITH 2011: 16). Migration allows year-round activity through the exploitation of seasonal feeding opportunities elsewhere while living in favorable climates throughout the year (GILL 2007: 273). They sometimes cross entire continents and overcome large distances up to 10.000 kilometers (NEBEL 2007: 1, cf.
MARSHAL EDITIONS 2007). Long-distance migrants are known to use arctic areas as well as temperate and tropical areas and can therefore act as indicators of environmental changes occurring throughout their flyway (NEBEL 2007: 1). Although many migrants are capable of making spectacular nonstop flights over ecological barriers (MOORE et al. 1993) (e.g. Arctic tern as one of the most famous long distance migrant), a lot of other birds use stopover sites for resting and refueling. Hence, the success of migration also depends on the availability of high-quality stopover sites and is an important factor of limiting populations on their breeding or wintering grounds as well (see SHERRY & HOLMES 1995, HUTTO 2000 in MOORE et al. 1993). This is a fact, which has often been neglected and is underlined by the finding that long-distance migratory species are probably the ones with the most serious population declines (BARLEIN & SCHAUB
2009). Even though the importance of stopover sites as part of the entire range of a species should factor into the development of conservation strategies (MOORE et al. 1995 in MOORE
et al. 2005) the current situation is unsatisfactory. Significant proportions of migratory birds are at high risk and have an unfavorable conservation status (cf. IUCN Red List, see appendix 2). Beside land-use changes through economic growth a wide variety of other predictors like illegal hunting, diseases, climate change, invasive species, human disturbance and/or natural system modifications are reasons for the increase of endangered species nowadays (KIRBY 2010: 2, cf. MILLENNIUM ECOSYSTEM ASSESSMENT (ed.) 2005, cf.
BIRDLIFE INTERNATIONAL (ed.) 2003, cf. GALBRAITH 2011: 25). Declines usually come as a multivariate package, but linked with a human driver such as Economic Growth (cf. RESENDIZ 2012). The East-Asian-Australasian Flyway (EEAF) covers 22 nations and has one of the highest human densities worldwide. It also has the highest overall number of threatened migratory birds (KIRBY 2010: 12). The covered protection (through policy agreements) is weakest for passerines and other landbirds, especially in this region (GALBRAITH 2011: 23). While there are efforts for the conservation of migratory waterbirds, songbirds have virtually been neglected over the last decades. One reason might be that the situation for migratory songbirds (in contrast to waterbirds and with exceptions in Europe is nearly uninvestigated (cf. GALBRAITH 2011: 39). Thus, the lack of understanding migrant-habitat relations during migration has prevented the development of comprehensive strategies for their protection along migration routes (PETIT 2000). In general, most of the conservation plans are based upon patterns of habitat use by focal species (PETIT 2000), but lack a wider and more complete view. In recognition of the numerous threats (cf. MILLENNIUM ECOSYSTEM ASSESSMENT (ed.) 2005), conservation of migratory songbirds gains importance especially under the human
4
expansion in eastern Asia and Far Eastern Russia as major areas of one of the world’s largest flyways anywhere. Based on the status quo of migratory birds along the East-Asian-Australasian Flyway and the lack of information of migrant-habitat relations the following goals were defined;
• Determining valuable area predictions for migratory songbirds along the
northern part of the East-Asian-Australasian Flyway based on species distribution
models using mistnet data during fall migration
• Developing a first large-scale proposal for Strategic Conservation Planning
Further goal:
• Clarification and elaboration of the reliability of mistnet data and the effective
use of predictive modeling as a robust contribution for strategic conservation
planning
1.2 EAST-ASIAN AUSTRALASIAN FLYWAY (EAAF)
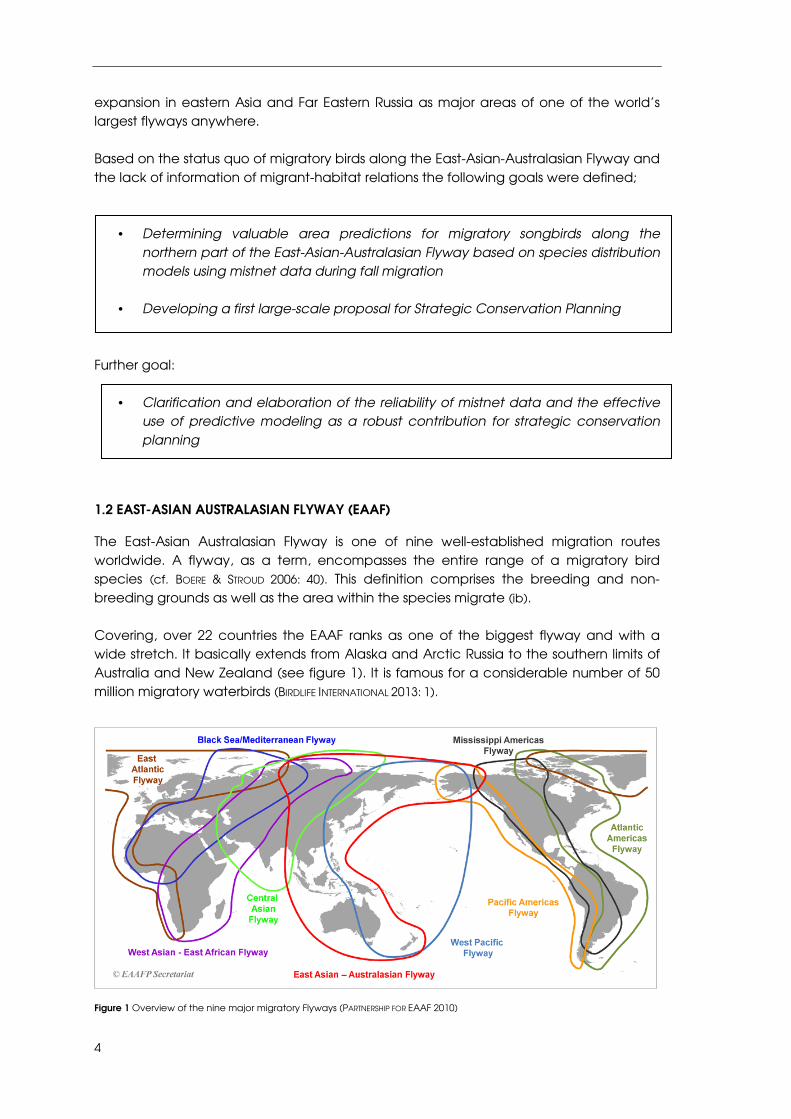
The East-Asian Australasian Flyway is one of nine well-established migration routes worldwide. A flyway, as a term, encompasses the entire range of a migratory bird species (cf. BOERE & STROUD 2006: 40). This definition comprises the breeding and non-breeding grounds as well as the area within the species migrate (ib). Covering, over 22 countries the EAAF ranks as one of the biggest flyway and with a wide stretch. It basically extends from Alaska and Arctic Russia to the southern limits of Australia and New Zealand (see figure 1). It is famous for a considerable number of 50 million migratory waterbirds (BIRDLIFE INTERNATIONAL 2013: 1).
Figure 1 Overview of the nine major migratory Flyways (PARTNERSHIP FOR EAAF 2010)

1 INTRODUCTION
5
The flyway concept and consequently also the determination of the East-Asian-Australasian Flyway is mainly based on the migration of waterbirds (BOERE & STOUD 2006:
43ff). It lacks a good and valuable assessment and applicability for other species such as passerines, which can show a broad-front migration without hotspots (cf. CATRY et al. 2004).
The flyway concept though is popular and has been widely reproduced not least erroneously to describe the movements of all migratory birds. Many land birds do not migrate by flyways as it was assumed earlier, but by the mentioned broad-front and other strategies from breeding to wintering grounds (ZINK 1973 in BUSSE 2001: 5, BOERE & STROUD
2006, cf. NEWTON 2011). Thus, it needs a high caution and evaluation in applying the flyway concept to passerines and in case one wants to pursue a science-based approach. Moreover, there exist real information gaps for Central and East/SE Asian landbirds, for example (or for African wintering grounds, Central and South-America for instance). Hence, the flyway concept can only represent a first rough framework for migratory songbird issues and is to be improved and studied more validity. 1.2.1 GEOGRAPHY Following the movements of birds, next the study area is presented. Due to the locations of the sampling sites (where information of migratory songbirds were available (see compilation/digital appendix) this study focuses on the situation in China, Korea, Japan, Far Eastern Russia and Alaska (see figure 2).
Figure 2 Study area (ArcGIS Basemap)

6
Due to different climate zones the study area offers a range of habitats. The Arctic Tundra, the Amur-Heilong river basin, the Manchurian forest complex, deserts or coastal areas are only a few of many others. The coastline comprises habitats from mud to sand, marshes and mangroves. These habitats are biologically very productive, important for a wide range of biota (especially water birds), provide a range of very valuable ecosystem services and support the livelihoods of large human populations (MACKINNON et al. 2012). Unfortunately, coastal wetlands in East Asia have undergone a rapid decline during the last decades. There was a loss of 51 percent of the wetlands in Mainland China, 40 percent of the wetlands in Japan, 60 percent in Republic of Korea for instance (MACKINNON et al. 2012). The Manchurian forest represents another major habitat complex of main importance for the Asian region (see figure 3). The most diverse forest ecosystem in northeast Asia stretches from the northern part of the Korean Peninsula northward into China and still further north into the Amur- Heilong river basin of the Russian Far East (RFE) (WORLD WILDLIFE
FUND (ed.) 2008). This region is a further area of high conservation priority. The Amur-Heilong is the largest river in northeast Asia and at the same time the border between Russia and China for over 3000km (cf. SIMONOV & DAHMER 2008: 3). While the largest portion of the river basin (about 1 million km²) lies within the Russian Federation further 0.9 million km² cover China. The region contains vast areas of grasslands (farming) and forest, including one of the most biologically diverse temperate forests in the world (see below; Manchurian forest complex).
The Manchurian forest as well as the Amur-Heilong river basin is threatened by ongoing human degradation. Thus, there are still some large forest tracts in remote areas while elsewhere logging has reduced forest cover in recent years (SIMONOV &
DAHMER 2008, cf. BIRDLIFE
INTERNATIONAL 2003). Areas within the Amur-Heilong river basin contain other ecological problems, which are primarily related
to agriculture and resource exploitation as well (SIMONOV & DAHMER 2008: 75). In this context, it is worth to mention that the rapid economic growth in this region leads to high environmental impacts in near future, not least in the RFE. Pipelines are being planned to transport crude oil and natural gas across Sakhalin to refineries in Japan and South Korea. Other pipelines are planned to bring down oil from the Arctic to the southern markets, and also, the railway achieves this in part, already (HUETTMANN pers.
com. Jun. 2013). Further, roads are being built to carry Korean pine, larch, and ash logs to sawmills in China and Japan (NEWELL 2004: 11). Especially the rapid economic growth in China has and will have a huge impact of the RFE (ib).
Figure 3 Manchurian forest (www.eoearth.org)

1 INTRODUCTION
7
The following description of the main countries of the given study is ordered by their location from north to south. Alaska Alaska is the largest of the 50 States of the United States of America. Nevertheless, it has only 732.298 inhabitants (population estimate 2012 (DEPT. OF LABOR AND WORKFORCE DEVELOPMENT
2013). Most of the people live in the south of Alaska while much of the interior is uninhabited wilderness. Approximately 65 % of Alaska is owned and managed by the U.S. federal government as public lands. These public lands include national forests as well as national parks and wildlife refuges. Four different main areas and 28 ecoregions characterize the geography of Alaska. These areas include the Pacific Mountain System in the south, the Rocky Mountain System in the Center of Alaska as well as Central Uplands/Lowlands between these mountain ranges and Arctic Coastal Plain in the north (NSTATE (ed.) 2013). Also considerable for bird migration are the more than 300 small, volcanic islands, which are called the Aleutians. This island chain stretches over 1.900 km into the Pacific Ocean and is almost continuous with the Komandorskie Islands of Russia. The strait itself is so narrow that any small land bird can cross is in a few hours, and many of them do so during spring and autumn migration. Thus, some songbirds that breed in Alaska winter in Asia and even Africa, while others that breed in Russia winter in South America. Although it is well known and documented that birds (which pass in opposite directions) also join the hemisphere, it is still not clarified in what significance it occurs. Beside migratory birds Alaska and Russia share a very large percentage of the marine flora and fauna, too. (PAULSON & BELETSKY 2007) The Alaskan climate is as diverse as its linked landscapes. It is influenced by four distinct climatic regimes: maritime (southern coast an islands), transitional (narrow band in western Alaska), continental (interior), and arctic (north). (PAULSON & BELETSKY 2007) The Alaskan vegetation can be divided into a forested and a non-forested region whereas the non-forested region consists of open and shrubby tundra, both in the lowlands and the mountains, and areas of permanent ice. Due to the short growing season coniferous trees dominate the forests. (PAULSON & BELETSKY 2007) Alaska is rich of oil and petroleum resources, which are mainly found in North Slope (region). While the oil is of great importance to the economy of the USA its access and transportation causes considerable concern among environmentalists. (PAULSON & BELETSKY
2007)
In general, Alaska includes many parks and reserves. The largest refuge is probably the Arctic National Wildlife Refuge, which supports 40 million waterbirds. Overall, 84 % of all ,land, which is designated as national wildlife refuge in the USA, is located in Alaska. The same applies to the national park system. Two-thirds of all land, which is designated as National Park, lies in Alaska. Although a high percentage of the land is covered by different conservation status a study of Alaska’s 28 ecoregions has shown that there is still a lack of sufficient protection of their unique floras and faunas. (PAULSON & BELETSKY
2007)

8
Russian Far East The Russian Far East is described as the most eastern federal district of Russia between Lake Baikal in Eastern Siberia and the Pacific Ocean (see figure 4). With approximately 7 million people and with about 1.1 inhabitants per square km it is one of the world’s least populated regions per capita (FEDERAL STATE STATISTICS SERVICE (Russian census 2002), NEWELL
2004: 6). Most of the population is concentrated in the south where the land is more suitable for agriculture (NEWELL 2004: 7). While most of the people live in urban regions there are some indigenous settlements remaining (approximately 90.000 (FEDERAL STATE
STATISTICS SERVICE (Russian census 1989). Beside the landmasses this region encompasses also the island Sakhalin and the peninsula Kamchatka. The landscape of Far Eastern Russia is characterized by the Arctic tundra, a boreal forest belt, grasslands, wetlands and marine areas as major ecosystems (NEWELL 2004: 4).
The Arctic Tundra along the Arctic Ocean and the adjacent Tundra (which is covering most of the Rest of Chukotka and northern Kamchatka) form a dense carpet of gray lichen, which represents a food basis for animals and migratory birds. Moreover, they classify among the world’s most diverse arctic ecosystems (ib). Taiga and Conifer forests are two other main habitats in RFE. Large masses of boreal forest extend as a broad belt between 70 and 50 degrees latitude. While the North is dominated by Dahurian larch (Larix gemelinii) forests that grow well on permafrost, farther south the forest composition gradually becomes more complex (NEWELL 2004: 5). One example is the conifer-broadleaved forests. They extend along most of Primorsky Krai into southern Khabarovsk Krai (Ussuri Taiga) and just east of the North Korean and Chinese borders. This forest complex supports the majority of the RFE rare and endangered species (NEWELL 2004: 5, cf. DARMAn et al. 2003). Similar forests once covered areas of China, Korea, and Japan but they have largely been destroyed or are heavily modified (NEWELL 2004: 5, cf. HUETTMANN pers. com).
The forest industry presents one of the main industries, not least because the RFE encompasses the most extensive wild areas with 20 % of the remaining forests
worldwide (NEWELL 2004: 29). Due to mountain landscapes and lack of infrastructure forty percent of the forests are inaccessible. In contrast, the timber production is heavily overlogged near railroads and population centers (NEWELL 2004: 8). Examples for those areas are Khabarovsk and Primorsky, Krais, Amur and Sakhalin Oblasts. Especially the mentioned wilderness areas play a crucial role for ecosystem maintenance, e.g. in mitigating climate change, protecting Figure 4 Far Eastern Russia (www.mapsof.net)

1 INTRODUCTION
9
biological biodiversity, and generally ensuring ecosystem function, particularly of the polar arctic (NEWELL 2004: 29). Nowadays, the most pressing threats are coming from promoting economic growth style of development, such as non-sustainable logging, burnings, mining, road construction, oil and gas development, pipelines and clearing for agriculture (NEWELL
2004: 32, DARMAN et al. 2003). The Russian government also continues to combat what is perhaps the most intractable problem: illegal resource harvest (NEWELL 2011: 12). This is for example caused by a rising demand from Japanese plywood industry (NEWELL 2004: 31) and now, demands from China. Beside the forest industry also coal, oil, gas, gold and silver (SIMONOV & DAHMER 2008: 101f,
cf. NEWELL 2004: 8, cf. DARMAN et al. 2003) as well as fish, mushrooms and bee keeping are natural resources of international economic interest (HUETTMANN pers. com Jun. 2013). Mostly in Sakha, a huge potential of billions of tons of coal is located. Oil and gas are found mainly in Sakhalin Island and in Sakha and offshore along most of the coastline. Sakhalin hosts one of the largest LNG (Liquified natural gas) plants in the world with an international demand (including a direct U.S., Japan, Chinese, EU and Indian involvement) (see e.g. EXXON NEFTEGAS LTD., SHELL GLOBAL). Gold and silver reserves are found mainly in the Magadan, Sakha, Chukotka, Khabarovsl, Amur and Kamchatka regions (NEWELL 2004: 8), and rare metals are also pursued now, e.g. in Kamchatka region. In collaboration with the WWF (World Wide Fund for Nature) a Conservation Action Plan, which provides a complete overview of the RFE ecoregion complex, was published in 2003 (see DARMAN et al. 2003). Moreover, this Action Plan encompass an analysis of biodiversity to determine priority territories for conservation and an approach for management of focal species such as the Amur tiger or the far eastern leopard (ib).
China
With a population of 1.349.585,838 inhabitants China represents the country with the highest human population.
China is located in eastern Asia. It’s bordering the East China Sea, the Korea Bay, the Yellow Sea and the South China Sea between North Korea and Vietnam. Also the island of Taiwan is governed by the Republic of China (see figure 5). Because the large extent, China comprises a number of climate regions with a considerable variation, from tropical conditions in the South to a subarctic climate in the North. The same applies for the number of main landscapes. In the West, mountains, high plateaus and deserts mostly characterize
Figure 5 China (CIA World Factbook)

10
Figure 6 Japan (CIA World Factbook)
the terrain. Overall 40 percent of the country is mountainous. In eastern China plains, deltas and hills characterize the landscape. Two of the world’s greatest rivers (Yellow River and the Yangtze River) flow across China whereas the country comprises many lakes as well. (WORLDINFOZONE 2013) During the last decades China has undergone a rapid economic growth. Unfortunately, this came along with further deterioration in the environment, too. Hence, the Chinese government has to deal with issues such as air pollution (and acid rain), soil erosion, water shortages (particularly in the north), deforestation and habitat loss, in general. Moreover, there is an estimated loss of one-fifth of agricultural land since 1949 to soil erosion and economic development. (WORLDINFOZONE 2013)
In 1994, the State Council of China launched a national action plan for biodiversity conservation. A lot of further action plans followed (e.g. marine biodiversity, agriculture, forests, urban flora) (CAREW-REID (ed.) 2002: 71). Nevertheless, there is a need to explore how effective such action plans actual have been in meeting the goals.
Japan Japan is an island chain in eastern Asia. It is located between the North Pacific Ocean and the Sea of Japan (see figure 6). The climate varies from tropical in south to cool temperate in north. Between 70 and 80 % of the terrain is rugged and mountainous (CIA 2013, WORLDINFOZONE 2013) whereas
forests cover much of the country. Thus, most of the areas are unsuitable for classic agricultural or industrial use. Due to the terrain most of the cities are located in the flat lands along the coast (WORLDINFOZONE 2013). A high human density characterizes these habitable areas with overall 127 million people (ib.) and with cities like Tokyo as big as 12 million people. Thus, the availability of habitats to many threatened birds has been greatly reduced, especially in these highly developed lowlands (BIRDLIFE INTERNATIONAL
2003), whereas some forested mountain areas and smaller protected areas exist also.
Japan represents the world’s largest importer of coal and liquefied natural gas and the second largest importer of oil (WORLDINFOZONE 2013.). As largest consumers of fish, rice and tropical timber they contribute to the depletion of these resources in Asia and elsewhere as well. Not least because of the high human density and the proceeding rapid economic development one can find a lot of environmental issues such as air pollution from power plant emissions. This results in acid rain and other contamination contributing to an acidification of lakes and reservoirs, for example (WORLDINFOZONE 2013).
Moreover, the environmental situation of Japan has to be seen in context of current nuclear issues.

1 INTRODUCTION
11
In view of weaknesses of current reserve management (cf. BIRDLIFE INTERNATIONAL 2003) the environmental situation gets even more critical. Because of the infrastructure and the low manpower of reserves a lot of protection areas have to deal with ongoing loss of habitats on many islands, for instance (BIRDLIFE INTERNATIONAL 2003).
Korea (South Korea, North Korea) Korea is a Peninsula located in East Asia and is divided into two sovereign countries (North Korea, South Korea)(see figure 7 & 8). The Peninsula has a typical temperate region. The major ecosystems of Korea are forests, agricultural fields, freshwater (lakes and marshes, streams, estuaries and other inland wetland), coast and marine areas and islands whereas most of the land is mountainous. Considerable is also the high number of islands, which are scattered around the shallow seas. They are mostly extensively used as habitats and breeding grounds by rare species. Moreover, many islands represent habitats for evergreen coniferous forests that are important for biological diversity conservation. (KIM 2001)
Figure 7 North Korea (CIA Factbook) Figure 8 South Korea (CIA Factbook)
There are numerous protected areas such as National Parks, which cover a variety of regions and include six types of areas (Ecosystem Conservation Areas, National Parks, Nature Forests, Wildlife Sanctuaries, Nature Reserves, and Wetland Protected Areas). Nevertheless, the biological diversity in Korea is declining due to rapid economic development over the last decades. (KIM 2001) This development is strongly related to the ‘Economy-First’ Policy of South Korea and the ‘Military-First’ Policy of North Korea. Protected areas and forests are usually just found in mountain areas, which are not productive (HUETTMANN, pers. com, Jun, 2013). Beside ongoing habitat destruction, the protection network as well as environment-related Acts and policies might have not been properly established, too. A fact that is due to lack of recognition of the seriousness of environmental problems. This is moreover underlined by the budget for environmental conservation. This is still relatively low compared with environmentally advanced nations. (KIM 2001)

12
1.2.2 CONSERVATION OF MIGRATORY BIRDS ALONG THE FLYWAY The high population density in some parts of Asia induced that the birds share the EAAF with 45 % of the world's human population (PARTNERSHIP FOR THE EAST ASIAN AUSTRALASIAN FLYWAY
2013). This is an evidence of future challenges in context of conservation planning (see below for an excursus to Avian Influenza). Many of the current 700 sites along the flyway, which are recognized as internationally important for waterbirds, are located adjacent to human settlement and are vulnerable to rapid social and economic development pressures (ib). Moreover, the East-Asian Australasian region in general has the highest proportion of threatened migratory birds (KIRBY 2010: 5). Clearance, conversion and degradation of natural forests, grasslands and wetlands are by far the most important causes of endangerment to birds in Asia (BIRDLIFE INTERNATIONAL 2003) (see figure 9 & 10).
Figure 9 The main threats to globally threatened Asian birds (BIRDLIFE INTERNATIONAL 2003)
Figure 10 Main causes of habitat loss for globally threatened Asian birds (BIRDLIFE INTERNATIONAL 2003)

1 INTRODUCTION
13
In view of the given study, which focuses on songbirds, an ICUN listing of threatened passerines in Asia (south, east, north) can be found in appendix 2. Beyond the statements of the IUCN, regional experts mention a list of further songbirds its populations are declining and might be of equal relevance (see table 1). In general, there is a lack of information of the actual status of a lot of songbirds along the EAAF. Thus, the IUCN status of a lot of species as ‘of least concern’ should be critically scrutinized because it would present an underestimate of reality, or one that is poorly founded (HUETTMANN, pers. com., May 2, 2013). Table 1 Expert based list of passerine species which are of interest and concern for conservation in China and/or Russia (compiled from colleagues by HUETTMANN et al., pers. com, Feb 2013)
Scientific name English name Taxonomic Serial No.
Emberiza jankowskii Rufous-backed Bunting 559885 Emberiza aureola Yellow-breasted Bunting 554225 Luscinia calliope Siberian Rubythroat 179820 Luscinia svecica Bluethroat 179818 Cyanoptila cyanomelana Blue-and-white Flycatcher 559646 Megalurus pryeri Marsh Grassbird 561017 Locustella fasciolata Gray’s Grasshopper Warbler 560836 Urosphena squameiceps Asian Stubtail 563655 Eophona personata Japanese Grosbeak 559922 Emberiza cioides Meadow Bunting 559877 Eophona migratoria Yellow-billed Grosbeak 559921 Dendronanthus indicus Forest Wagtail 559715 Acrocephalus sorgophilus Speckled Reed Warbler 558430 Acrocephalus tangorum Manchurian Reed Warbler 558407
While there are a lot of studies for the situation of migratory waterbirds and their traditional staging sites, the situation of migratory songbirds along the EAAF is nearly uninvestigated (cf. GALBRAITH 2011: 39, cf. BIRDLIFE INTERNATIONAL 2013). This is also reflected by a lack of purposeful and efficient efforts for conservation of migratory songbirds along this flyway. As indicated before, current conservation measurements mainly focused just on the protection of waterbirds (including shorebirds). One of the biggest initiatives for the protection of migratory waterbirds is the informal Partnership for the East-Asian-Australasian Flyway (EEAFP). In the framework of the partnership 15 countries, 3 intergovernmental agencies, 10 international non-government organizations and 1 international business sector are currently endeavored for an international cooperation to develop a Flyway Site Network and collaborative activities to increase knowledge and to build capacity for sustainable management (PARTNERSHIP OF THE EAST-ASIAN-AUSTRALASIAN
FLYWAY 2013). The main strength of the Partnership is the promotion of dialogues between a range of stakeholders including all levels of governments, site managers, UN agencies, non-governmental organizations and technical institutions to name a few (EEAFP 2013: 5). While the focus of the Partnership for the EEAF lies on migratory waterbirds, the situation of migratory songbirds is only indirectly considered and no thorough data exist to achieve such goals, yet The protection of some migratory passerines is partially covered under bilateral agreements, for example JAMBA (Japan-Australia Migratory Bird Agreement), CAMBA (China-Australia Migratory Bird Agreement) and between the Russian Federation and India, but there is no multilateral instrument or initiative for the conservation of migratory passerines in the region (CMS FLYWAY WORKING GROUP 2010: 42). Unfortunately, none of these have any specifically enforcements, budgets or convictions (HUETTMANN, pers. com. Jun

14
2013). See appendix 1 for a regional summary of existing flyway-based instruments for the conservation of migratory birds. Although there are no direct efforts for migratory songbirds their protection might be partially covered by laws, a network of current protection areas and further flyway based instruments such as single-species action plans or private/public partnerships, or voluntary efforts and citizen-science efforts. The current network of protected areas consists of areas with a variety of national and international conservation categories. The Ramsar Convention, the Convention of migratory species, several IUCN Categories or regional Nature Reserves are only a few among many others. Nevertheless, it is needless to say that like everywhere else in the world also, the protected areas along the East-Asian-Australasian Flyway have to cope with budget cuts and our current economic system is not designed to cater the needs of biodiversity, or migratory songbirds. Also, the lack of law enforcement, coupled with extreme poverty and the current disregard for many laws and regulations, for example in parts of Russia and China and many coastal areas, has led to an escalation of illegal logging, poaching, and mining within reserve boundaries (NEWELL 2004: 37, cf. BIRDLIFE
INTERNATIONAL 2003). The actual effectiveness of the current protection management for migratory songbirds will be discussed later (see 4.3) but here it suffices to say that for Russia it is stated that the current reserve system fails to adequate protection of biodiversity and ecosystems (NEWELL 2004: 38f).
The spatial scale of conservation management over an entire flyway presents political and economic difficulties with respect to assigning responsibility for the protection of migratory bird populations. Furthermore, habitat heterogeneity along migratory routes presents ecological difficulties to understand which habitats are most important, where they occur, and how their distribution and abundance are changing as a result of development and land conversion (MOORE et al. 1993, MABEY & WATTS 2000). It is important to address issues as well as a holistic approach for solutions at a wide scale; ideally, as a template for other flyways and as global role model, not least because migratory species don’t recognize borders. In conclusion, to my knowledge there are currently no effective and consistent managers or organizations along the EEAF, which directly address issues of migratory passerines or songbirds at all. In view of ongoing habitat degradation and further future challenges dramatically impacts may be expected. 1.3 MIGRATORY SONGBIRDS
Each year millions of birds migrate to their wintering or breeding grounds as part of their annual cycle. In numbers, approximately 2274 species of birds are migratory (23 % of all avian species) (KIRBY 2010: 5). Migration allows year-round activity through the exploitation of seasonal feeding opportunities while living in favorable climates throughout the year (GILL 2007: 273). Thereby they often cross entire continents and overcome large distances up to 10.000 kilometers (NEBEL 2007: 1, cf. MARSHAL EDITIONS 2007). Many of those long-distance migrants use arctic areas as well as temperate and tropical areas. Therefore they can act as indicators of environmental changes

1 INTRODUCTION
15
occurring throughout their flyway (cf. NEBEL 2007: 1). Moreover, they can be surrogates for biodiversity.
Migration routes and patterns depend, among of a lot of other factors, on the relative locations of summering and wintering grounds, on the abilities to cross large barriers and on the histories of populations (GILL 2007: 274). The strategies vary between species, but also within species (MOORE et al.1993). The main strategies are:
• Narrow-front migration o Narrow geographical band of migration, e.g. many waterbirds which
are restricted to the coastline for instance • Broad-front migration/Parallel migration
o See below • Loop migration
o When birds take different routes during their migration from and to their breeding areas
• Leapfrog migration o When birds from one population overfly another
• Moult migration o When birds move to special areas to moult (e.g. ducks and geese)
(BOERE & DODMAN 2013: 25ff)
Most passerines migrate in a broad front (NEWTON 2011: 509, cf. KIRBY 2010: 73). The term ‘broad-front migration’ encompasses migration across a region with no apparent streaming or concentration by topographic or other features (NEWTON 2011 in BOERE &
DODMAN 2013: 26). In some cases broad-front migrants encountering significant obstacles to movement, such as deserts, seas or mountain ranges, which they cross or bypass, depending on their evolutionary adoptions (KIRBY 2010: 73). However, along their migration route they use many suitable sites for foraging and resting over a large area. This leads to a conservation need at the population or flyway level (BOERE & DODMAN 2013: 26, cf. KIRBY 2010: 73).
Normally migratory birds choose times of the day where travel is least costly, safest and most rapid. Thus, some migrate by day and others by night or at both times. Because the breeding and wintering grounds of migratory songbirds are often separated by thousands of kilometers, successful movements also depend on the quality and availability of suitable stopover sites for refueling but also when continuing migration is temporarily suboptimal for whatever reason (usually due to adverse weather conditions) (CHERNETSOV 2012). Migratory birds spent approximately 90 % of the entire migration time at stopover sites (HEDENSTRÖM & ALERSTAM 1997).
As a rule most of the songbirds typically fly several hundred kilometers and then pause for one to three days of resting and refueling (WINKER et al 1992a, 1992b, CHERNETSOV 2012). Before and just after crossing large ecological barriers, stopover sites can be used up to 20 - 25 days whereas the average of migrants continues migration on the first night after arrival (CHERNETSOV 2012).
The selection of stopover sites is defined by a lot of not finally clarified factors;
• Endogenous preferences and functional morphology (BARLEIN 1983) • Foraging strategy and the spatial distribution of food (HUTTO 1985A, MARTIN & KARR
1986, CHERNETSOV 1998)

16
• Habitat carrying capacity and density of competitors (HUTTO 1985b) • Predation risk (ALERSTAM and LINDSTRÖM 1990, DIERSCHKE 2003, LANK & YDENBERG 2003, SAPIR et
al. 2004)
• Location before/after large barriers (CHERNETSOV 2012) (all cited in CHERNETSOV 2012)
Independent of the actually determining factors, the availability of high-quality stopover sites is one of the crucial factors for the success of bird migrations (cf. GILL 2007:
291) whereas songbirds unlike many waders and waterfowls are not that restricted to scattered patches (continuous stopover opportunity) (cf. PETIT 2000, HOUSTON 1998). The assumption behind this view is that broad-front migrants (like most passerines) have an infinite number of potential stopping places on their migration routes. Therefore perhaps they are less likely to show strong fidelity to particular sites than species (like waterfowls) that have only a small number of possible sites (NEWTON 2011: 509, cf. CATRY et al. 2004).
This current view might be a reason why the importance of landscape context at stopover sites for migrating songbirds has received less attention. However, a more recent study for wood-related species shows that birds tend to lose body mass or to gain mass at a lower rate in sites with less than 10 % of woody habitat cover (cf. KITOROV
et al. 2007). Moreover, pairwise comparisons of coastal and mainland stopover sites based on retrapped birds revealed that fueling was more efficient inland than on the coast (higher woody habitat cover) (ib.). Thus, the consensus that songbirds have continuous stopover opportunities might be an object of discussion. It is necessary to see habitats on a larger scale, especially when optimal habitats are scarce. Unfortunately in the studies of songbird stopover ecology the importance of landscape context is widely underestimated (FREEMARK et al. 1995), and the recognized need for statistical modeling and correction is virtually absent, still. This is a classic problem in RAMSAR site delineation for instance (HUETTMANN, pers. com., May 2013).
Sampling methods During the last century various methods were used to gather bird data according to the specific research target and species. Beside simple point counts, the mapping of breeding territories or radio tracking, and mistnets have been described as an effective method for sampling bird occurrence, abundance, and populations, especially woodland and forest species (DUNN et al. 1997, SILVY 2012: 66). Mistnests are used since around 100 years for mark-recapture studies (bird banding) and the collection of various information. For example, they have been used to study morphometrics, sexual dimorphism, dispersal, social behavior and/or age structure (RALPH & DUNN 2004). They are
placed in suitable locations on a study plot and are operated over several days. Within a short time of capture, birds are extracted from the net and records are taken (see figure 11)(EFFORD &
DAWSON 2013: 2). Throughout the last decades several protocols were developed.
‘EURING’, ‘MAPS’, the ‘North American Shorebird Protocol’ or the ‘National Bird Banding Schema’ are only a few of those.
Figure 11 Bird captured in a mist net (VEREIN AURING)

1 INTRODUCTION
17
The net dimensions and grid size depends on the size of the species targeted for capture and/or the used Protocol. Thus, it is hard to find information about any standard sizes. The same applies to the number of nets and capture days. In New Zealand multiple nets are typically 12 m long and about 2.7 m high (for bird banding) for instance (EFFORD & DAWSON 2013: 2).
The main advantages of mistnets are that it is a standardized sampling method (Protocols), that it includes low observer bias, the ability to detect species that are often missed using other count methods and that it provides the opportunity to examine birds in the hand (RALPH & DUNN 2004: 1). Moreover capture-recapture modelling enables robust statistical inference, including assessment of critical assumptions and estimation of absolute density (EFFORD & DAWSON 2013: 4).
In contrast, there are a lot of disadvantages as well. Mist nets are very time consuming and thus expensive. Moreover, mistnetting is known to be selective and limited in the range of species that are detected with a probability. Thus, there is an undersampling of species, which are active in different vegetations, such as in a high canopy for instance (EFFORD & DAWSON 2013: 4). Furthermore, the method contains a risk of injury and mortality to birds (cf. SPOTSWOOD et al. 2012: 1). Birds can be injured or at risk of death from predators, handling, entanglement or temperature stress (ib).
How efficient mistnet data can be used for spatial distribution modeling, not least in comparison with other methods, will be part of this study. 1.3.1 AVIAN INFLUENZA – CURRENT ISSUE ON MIGRATORY BIRDS Avian influenza (AI), commonly called bird flu, is an infectious viral disease of birds and has many strains. Most Avian Influenza viruses do not infect humans. However some strains, such as H5N1, have caused serious infections in people (WORLD HEALTH ORGANIZATION
2011, cf. GAO et al. 2013), presumably, more can occur. The first big and modern outbreak of the highly pathogenic Avian Influenza (HPAI) H5N1 virus was in 2003 in Asia and was followed by a subsequent spread to Russia, the Middle East, Africa and Europe. It became a global issue. Henceforth, there is a big interest to know more about the role of wild birds in the geographical spread of the influenza virus (MUNSTER & FOUCHIER 2009, cf. OLSEN et al. 2006). In this context, a number of large-scale surveillance programs are ongoing, including for parts of this study area (cf. MUNSTER &
FOUCHIER 2009). In general, migratory birds can carry pathogens, particularly those that do not significantly affect the birds' health status and consequently interfere with migration (OLSEN et al. 2006, cf. HERRICK et al. 2013). For a long time the widely held assumption was that only aquatic birds (Anseriformes, Charadriiformes) act as reservoirs. At the same time there was only little known about influenza prevalence in terrestrial birds (Passeriformes) (FULLER et al. 2010).
A study of FULLER et al. (2010) revealed the assumption that some songbirds and perching birds (order Passeriformes) act as influenza reservoirs in the contiguous US as well. This finding should not least be seen in view of the fact that passerines share the same habitat as poultry and may be more effective transmitters of the disease to

18
Figure 12 Arctic Warbler (M.P. WONG)
humans than aquatic birds (FULLER et al. 2010). Recent outbreaks of AI in China support this view further. In conclusion, virus-infected birds can transmit their pathogens to other populations that subsequently may bring the viruses to new areas (OLSEN et al 2006) and also poses a threat to humans (cf. GAO et al. 2013).
The question, if migratory birds can spread the virus over long distances (cf. LAM et al
2012) or/and are the main vector (cf. MELVILLE & SHORTRIDGE 2006), is not finally clarified. Nevertheless, research on bird migration and stopover ecology of both, aquatic as well as songbirds, become increasingly important in view of Avian Influenza issues and contributes to a clarification. Parts of this mistnet data used here were collected in a wider framework of an AI study, but which is not further considered for the flyway predictions. For some AI details see for instance HERRICK (2013).
1.3.2 INDEX SPECIES Based on extensive mistnet work in the study area, five species were selected to meet criteria such as to differ distinctly in their range and habitat preferences, in their status of threat or regarding the distance of their migration routes. The widespread generalist Arctic Warbler, the widely under studied northern species Bluethroat (with exception of western parts and the EU) and the widespread Yellow Wagtail were chosen as representatives for boreal species. Especially the flyway connection of Bluethroat and Yellow Wagtail between Russia and Alaska is nearly unstudied so that modeling of hotspots of these species can contribute to a deeper understanding. Black-faced Bunting and Siberian Rubythroat were selected to represent subboreal species. Due to regional expert opinions Siberian Rubythroat and Bluethroat represent species of concern for future conservation management (see 1.2.2 table 1). Arctic Warbler (Phylloscopus borealis) TSN: 179843
Avibasis ID: ECFC7E6C1A57A7BE
Arctic Warbler (Phylloscopus borealis) (see figure 12) is a widely spread species of boreal forests. It breeds in bushy areas and near forest edges (KNYSTAUTAS 1993: 192). For Alaska it is stated that the species breeds in willow and medium shrub habitats near streams in tundra zones (PAULSON & BELETSKY 2007: 362, cf. KESSEL 1998). Its range stretches from northern Scandinavia through Siberia to Alaska, south to northern Mongolia, Russian Far East, northeastern most China and Japan (see figure 13 & 14). The Arctic Warbler is one of several numbers of species of Old World birds that have extended their ranges across the Bering Straits to nest in Alaska (PAULSON & BELETSKY 2007: 164).

1 INTRODUCTION
19
Most of the winter grounds are located in Southeast Asia, Indonesia and the Philippines (BARLEIN ET AL 2006; CRAMP & BROOKS (eds.)).
Figure 13 Distribution Arctic Warbler (breeding (dark Figure 14 Alaskan Breeding Range of Arctic Warbler grey), non breeding (light grey)) (LOWTHER & SHARBAUGH 2008) (RIDGELY et al. & BIRDLIFE INTERNATIONAL 2012)
The Arctic Warbler is a species, which strongly migrates across the season. The populations in Far East Asia (and presumably also those from Alaska) migrate southwest and south through islands and easternmost East Asian mainland (CRAMP 1992 cited in
LOWTHER & SHARBAUGH 2008) to the wintering grounds in Southeast Asian tropics (LOWTHER &
SHARBAUGH 2008). Populations breeding in Europe migrate east across Russia and than through Manchuria and east Mongolia to China (LOWTHER & SHARBAUGH 2008). Subspecies exist and the departure time of Arctic Warbler varies throughout its breeding range (ib.). Yellow Wagtail (Motacilla flava or Motacilla tschutschensis) TSN (Taxonomic Serial Number): 178483 (Motacilla flava)
726116 (Motacilla tschutschensis)
Avibasis ID: 1F56DC34CAC3901F (Motacilla flava or tschutschensis)
Yellow Wagtail (Motacilla flava) (see figure 15) is one of the most abundant Palearctic birds. It has a considerable variation within the species. Based on genetic analyses it was split by the American Ornithologist Union (AOU) into Western Yellow Wagtail (Motacilla flava) and Eastern Yellow Wagtail (Motacilla
tschutschensis) in 2004 (BANKS et al. 2004: 8). Beside a lot of other subspecies these are the two main species for
the study area. The BirdLife Taxonomic Working group didn’t follow this treatment though. Also in this study all
Yellow Wagtail species were still pooled together because all may represent species, which are included in Western Yellow Wagtail (Motacilla flava) (cf. BRAZIL 2009: 456). Moreover the habitat of both species cannot be well distinguished. The range of the Yellow Wagtail stretches from western and northern Alaska (mostly confined to coastal uplands (see figure 17) (BADYAEV et al. 1998, KESSEL & GIBSON 1978, BADYAEV
et al. 1998) to the Asian tundra and low mountains in northeast China (BRAZIL 2009: 456)
Figure 15 Yellow Wagtail (N. MOORES)

20
(see figure 16). It is assumed that Yellow Wagtail colonized Alaska from the west (PAULSON
& BELETSKY: 151).
Figure 16 Distribution Yellow Wagtail Figure 17 Alaskan Breeding range Yellow Wagtail (breeding (dark),k nonbreeding (bright)) (BADYAEV et al. 1998) (BIRDLIFE INTERNATIONAL & NATURESERVE 2012)
During their annual migration Yellow Wagtails undertake long nonstop movements (estimated up to 60 - 70 h) over water areas and deserts (BADYAEV et al. 1998). According to its respective breeding range Yellow Wagtail is one of only ten species (with the exception of waders) who regularly migrate from the northern hemisphere all the way to Australasia (BIRDLIFE INTERNATIONAL 2013: 2), mostly as diurnal migrant (BADYAEV et al. 1998). The route contains the coast of western Alaska and the western Aleutians as well as parts of eastern Asia from Japan to Taiwan. The species casually occurs in central and southern coastal Alaska, too (BADYAEV et al. 1998). The wintering grounds lie from southeast Asia and the Philippines to the Greater Sundas and northern Australia (ib). In regard to its habitat preferences Yellow Wagtail shows an affinity for wet meadows, wetland margins and grassy swamps (KNYSTAUTAS 1993: 156, BRAZIL 2009: 456) mostly in tundra with thickets of dwarf willow or birch (BADYAEV et al. 1998). In winter you can find the species in cultivated fields, moist grassy fields and mudflats (BADYAEV et al. 1998). Black-faced Bunting (Emberiza spodocephala)
TSN: 559890
Avibasis ID: 2BB0E1371560B55C
The range of the Black faced-Bunting (Emberiza
spodocephala) (see figure 18) stretches across the Southeast of the RFE to the Sea of Okhotsk with a further breeding range in Central China (see figure 18). BRAZIL
(2009: 231) reports breeding grounds in North and Central Korea and Japan, as well. The wintering grounds lie in Central and South Japan, South Korea, in the South and East of China, Taiwan and Southeast Asia (ib.) (see figure 19)
Figure 18 Black-faced Bunting (R. NEWLIN)

1 INTRODUCTION
21
The habitat preferences of Black-faced Bunting in East Asia encompasses mixed, but only deciduous forests of lowlands and river valleys as well as fringes, scrub, parks, gardens and agricultural land in winter. Particularly, the species is occurs in areas with dwarf bamboo ground cover (ib).
Siberian Rubythroat (Luscinia calliope) TSN: 179820
Avibasis ID: 786B0F98D1EE4C54
Siberian Rubythroat (Luscinia calliope) (see figure 20) is a species within the family of flycatcher (Muscicapidae). Its breeding range stretches from the taiga zone south of the Arctic Circle, from Urals to northeast China and Sea of Okhotsk (BRAZIL 2009: 414) (see figure 21). In Siberia the ground breeder is detectable in lower altitudes in forests with tangled thickets, woodcutting
areas and river floodlands (FLINT 1984).
In China, the species is locally common in mixed-forests near streams (MEYER DE SCHAUENSEE
1984) while one can find the species in Japan from open coastal grasslands with bushes up to alpine thickets of dwarf pine (BRAZIL 1991).
In general, the species is found both in the mountains and lowlands with sparse woods, forest edges and bushy river valleys (KNYSTAUTAS 1993: 201). Moreover, the primary habitat seems to be closely connected to a particular succession stage (early) of disturbed and more ephemeral vegetation (e.g. scrub vegetation with willow or reedgrass) (SEIC 2005:10).
The wintering grounds are located in Southeast China and Taiwan where one can find Siberian Rubythroat in grassy areas with bushes and near wetlands with reeds (BRAZIL 2009: 414). Moreover, there are proofs from Japan where the
Figure 20 Siberian Rubythroat (XJCAN)
Figure 21 Probably extant Siberian Rubythroat (breeding (dark grey), non-breeding (light grey), passage (medium grey) (BIRDLIFE INTERNATIONAL & NATURESERVE 2012)
Figure 19 Distribution Black-faced Bunting (breeding, non-breeding) (BIRDLIFE INTERNATIONAL & NATURESERVE 2012)
22
species was found in low, dense vegetation in agricultural habitats but occasionally also in suburban or even urban areas (BRAZIL 1991). Probably, the species migrates from its breeding grounds through Korea and Eastern China (see figure 21). Beside the Distribution Maps of Birdlife International other sources state that Siberian Rubythroat is a rare fall migrant on western Aleutians, too (NATIONAL GEOGRAPHIC 1999: 344, WALTON et al. 2013). Bluethroat (Luscinia svecica) TSN: 179818
Avibasis ID: AFD6FD811AA7D6A7
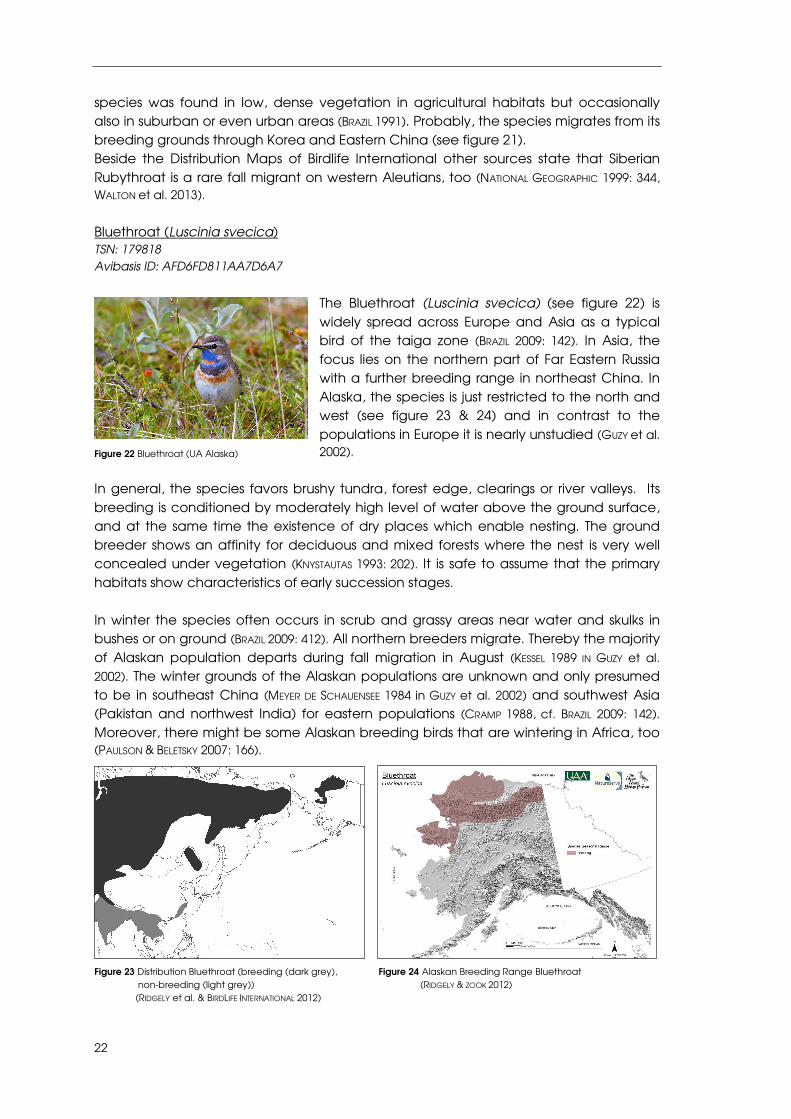
The Bluethroat (Luscinia svecica) (see figure 22) is widely spread across Europe and Asia as a typical bird of the taiga zone (BRAZIL 2009: 142). In Asia, the focus lies on the northern part of Far Eastern Russia with a further breeding range in northeast China. In Alaska, the species is just restricted to the north and west (see figure 23 & 24) and in contrast to the populations in Europe it is nearly unstudied (GUZY et al. 2002).
In general, the species favors brushy tundra, forest edge, clearings or river valleys. Its breeding is conditioned by moderately high level of water above the ground surface, and at the same time the existence of dry places which enable nesting. The ground breeder shows an affinity for deciduous and mixed forests where the nest is very well concealed under vegetation (KNYSTAUTAS 1993: 202). It is safe to assume that the primary habitats show characteristics of early succession stages. In winter the species often occurs in scrub and grassy areas near water and skulks in bushes or on ground (BRAZIL 2009: 412). All northern breeders migrate. Thereby the majority of Alaskan population departs during fall migration in August (KESSEL 1989 IN GUZY et al.
2002). The winter grounds of the Alaskan populations are unknown and only presumed to be in southeast China (MEYER DE SCHAUENSEE 1984 in GUZY et al. 2002) and southwest Asia (Pakistan and northwest India) for eastern populations (CRAMP 1988, cf. BRAZIL 2009: 142).
Moreover, there might be some Alaskan breeding birds that are wintering in Africa, too (PAULSON & BELETSKY 2007: 166).
Figure 23 Distribution Bluethroat (breeding (dark grey), Figure 24 Alaskan Breeding Range Bluethroat non-breeding (light grey)) (RIDGELY & ZOOK 2012) (RIDGELY et al. & BIRDLIFE INTERNATIONAL 2012)
Figure 22 Bluethroat (UA Alaska)

1 INTRODUCTION
23
As well as for the northern populations also the route for southern breeding populations is poorly described. While the species is locally common on its breeding grounds the Bluethroat is quite scarce on migration, not occurring in high concentrations anyway. Hence, it is not well known if they depart directly southwest over Bering Sea, or retrace putative spring migration route across Bering Strait (GUZY et al. 2002). BRAZIL (2009: 412) assumes that the species migrates through Eastern China and is a winter visitor in Japan, Korea and Taiwan as well. 1.4 SPECIES DISTRIBUTION MODELING
Species Distribution Models and Habitat Suitability Models can help us to understand the way in which different factors influence circumstances of interest. More precisely, they quantify the relationship between species and their environment and make predictions of the probability index of occurrence. The quality actually depends on the quality of available data. The most important aspects to consider are that the data is more or less reliable, accurately recorded and the main gradients of environmental and geographic space are involved. (MOILANEN et al. 2009: 83)
An iterative process of model fitting, evaluation and refinement can improve the prediction quality. Caused by the fact that a model is a mathematical simplification of the data, the result will probably never be entirely correct (MOILANEN et al 2009: 81). Nevertheless, it is an approximation and contributes to a rapid and deeper understanding of the ecology and behavior of a species and so it enables us a direct application in conservation planning (cf. MOILANEN et al. 2009: 70ff, cf. OHSE et al. 2009, cf.
RODRIGUEZ et al. 2007). Thus, in this study species models contribute to develop conservation initiatives and management plans that are focused explicitly on migration and the stopover biology of migratory birds (cf. MOORE et al. 2005) TreeNet (machine learning) Here the data-mining tool TreeNet was used to create species distribution models of selected index species (see 2.2.2). TreeNet is a tool of the Salford Predictive Modeler Software and was designed by JEROME FRIEDMAN (1997) to obtain predictive models with high accuracies (SALFORD SYSTEMS 2013: 1). It belongs to the tree-based algorithms in machine learning and is classified as boosted regression trees (‘stochastic gradient boosting’). Some of the main advantages of TreeNet are the general robustness to messy and partially incomplete data, the speed of processing, the handling of classifications as well as of regression problems and exceptional accuracies mentioned before. The software builds its model in stages adding a tree at each stage in an effort to refine performance (SALFORD SYSTEMS 2013: 1). Typically, the first tree yields a modest performance, the second tree improves on it and the third tree improves further, and so on (see figure 25). Thus, each tree is developed to contributing a small portion of the overall model and the resulting prediction is constructed by adding up all of the individual tree contribution (SALFORD SYSTEMS 2005: 52) (‘a set of weak learners creating one very strong learner’). The results are displayed in clear reports and graphs that reveal the core message and predictive content of the model allowing to extract the robust major signals from the data (SALFORD SYSTEMS 2013: 1).

24
Figure 25: Buidling a model in TreeNet (STEINBERG 2009)
1.5 STRATEGIC CONSERVATION PLANNING
1.5.1 THE NEED FOR STRATEGIC CONSERVATION PLANNING The designation of protected areas (setting aside reserves) is one of the most widely used approaches for conserving species and biodiversity in the western world and elsewhere. However, the practice of conservation planning has generally not been systematic (e.g. ad hoc planning) and new reserves have often been located in places that do not necessarily contribute to the representation of biodiversity (MARGULES & PRESSEY
2000, cf. POSSINGHAM 2000). Currently, we mainly just protect ‘rock and ice’ (cf. SCOTT 2010) and areas which were the easiest to take out of production without a wider assessment. It’s therefore not really conspicuous that many current reserves are found on land that is too remote or unproductive to be important economically (LIESKE 2007) or have been selected to protect single flagship species only. Consequently, flat well-drained and fertile land and of high economic importance is rarely conserved for instance (BALL &
POSSINGHAM 2000). Moreover, ecological considerations are typically not the only motivation for designating reserves. Often they do satisfy multiple needs such as recreation, tourism, education or scenic as well. Caused by the fact that a system designed to be optimal for a single species is not likely to satisfy the requirements of all species, or social aspects, the difficulty is to establish a holistic reserve system (ib). This requirement is the base for sustainability though (HUETTMANN, pers. com, May, 2013). Not only in regards to the increasing human pressures on resources and the issue that space gets scarcer there is a necessity for the implementation of a more systematic approach of locating and designing reserves. Moreover, the adequacy of existing
1 INTRODUCTION
25
protected areas is to be assessed. The use of ‘Strategic Conservation Planning’ is one approach for this and is described in the following: From the perspective of nature conservation alone, one simply would attempt to have the largest reserve system possible (POSSINGHAM et al. 2000: 291). However, as implied before, there are limits set by social and economic constraints. It is not feasible on many accounts. Thus, the challenge is to build a reserve network that will conserve effectively as many conservation features as possible within an area constraint and in a democratic fashion with a public buy-in (ib). This is the stage were ‘Strategic Conservation Planning’ starts. It identifies configurations of complementary areas that achieve goals most efficiently and explicit as a specific set of objectives while trying to achieve these objectives at minimum expense to other land-uses (PRESSEY et al. 2007). The process involves a clear and structured approach to priority-setting and it is defensible, accountable and transparent (BALL & POSSINGHAM 2000: 86).
1.5.2 MARXAN (VERSION 1.8.10) - A TOOL FOR STRATEGIC CONSERVATION PLANNING
This study here applies the analytic tool ‘Marxan’ which is one of the most commonly used software packages in context of Strategic Conservation Planning worldwide. See table 2 for further free available Conservation Planning Software. Table 2 Free available Strategic Conservation Planning Software
Name Reference
Marxan 1.8 BALL et al. 2009 Marxan with Zones WATTS et al. 2009 Zonation (Conservation Planning Software) MOILANEN & KUJALA 2006 WorldMap (Conservation Prioritization) WILLIAMS 2008
Marxan (MARine, spatially eXplicit ANnealing) is a software which was created by BALL et al. (2009) to deliver decision support for reserve system design (GAME & GRANTHAM 2008:
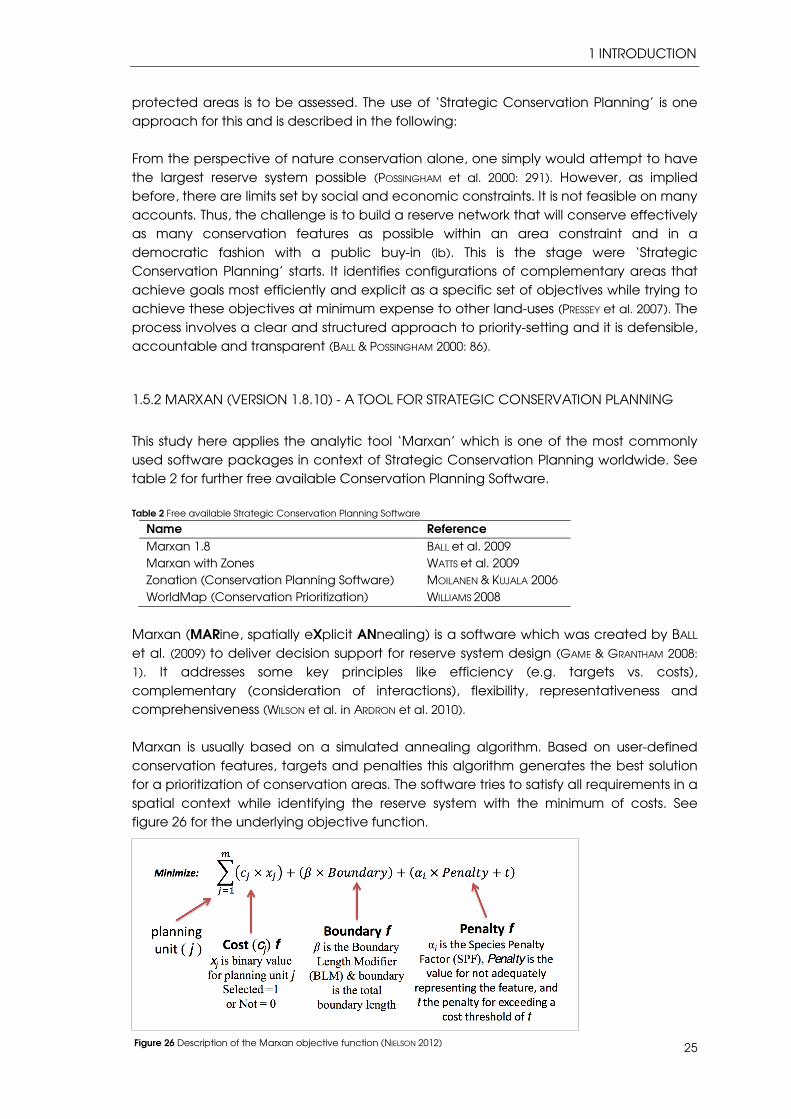
1). It addresses some key principles like efficiency (e.g. targets vs. costs), complementary (consideration of interactions), flexibility, representativeness and comprehensiveness (WILSON et al. in ARDRON et al. 2010). Marxan is usually based on a simulated annealing algorithm. Based on user-defined conservation features, targets and penalties this algorithm generates the best solution for a prioritization of conservation areas. The software tries to satisfy all requirements in a spatial context while identifying the reserve system with the minimum of costs. See figure 26 for the underlying objective function. Figure 26 Description of the Marxan objective function (NIELSON 2012)

26
The exceptional quality is that the solution is spatial and can include several ecological as well as social and economic criteria (e.g. land costs) (ib.) while the transparency is retained and the analyses are repeatable and objective. Due to the common discussion of a ‘Single large or several small’ reserve solution one is able to set constraints concerning the boundary length. However this setting should be used with care. Without some constraints the reserve solution generated by Marxan will be often highly fragmented. While it is sometimes useful to remove fragmentations (e.g. edge effects, economic reasons), generally not overly clustered solutions contribute more to the freedom of planners and when hotspots are more apparent (RUMSEY et al.
2004). A further option when using Marxan is the possibility to lock the current reserve network right into the solution. This option should be used carefully as well, because locked reserves can affect every characteristic of the network solution (from spatial congruence to target achievement). The ‘Best practice’ comprises a stepwise optimization of the reserve solution whereas a high approval should be achieved through the participation of stakeholders (cf. GAME &
GRANTHAM 2008: 3). It should be considered that is not really designed to act as a stand-alone reserve design solution, but rather should be understood as part of a Systematic Conservation Planning process (GAME & GRANTHAM 2008: 4). Thus, it should act as a basis of discussions towards a final plan that incorporates additional political, socio-economic and pragmatic factors (GAME & GRANTHAM 2008: 3). Marxan is available free of charge (http://www.uq.edu.au/marxan/get-marxan-software). During the last years several user interfaces have been developed to assist in running the software. This includes the preparation of input files as well as the visualization of outputs (see table 3). For further Information concerning technical settings see Chapter 2.2. Table 3 Tools and implications, which are compatible/interface with Marxan
Name Reference
P.A.N.D.A (Protected Areas Network Design Application)
RIOLO 2005
CLUZ (Conservation Land-Use Zoning) SMITH 2004 QMarxan 1.0.7 (PlugIn for QGIS) APROPOS INFORMATION
SYSTEMS INC 2013 NatureServe Vista 2.6 NATURE SERVE 2013 Zonae Cogito Decision Support System SEGAN et al. 2011 The C-Plan Conservation Planning System WATTS & PRESSEY 2001

2 METHODS
27
2 METHODS
Figure 27 Scheme of methods and workflow
2.1 DATASET
2.1.1 PRIMARY DATA
The data used in this study consist of a collection of bird banding data as well as several environmental GIS Layers. The bird banding data was compiled and brought together through Falk Huettmann of the Institute of Arctic Biology (University of Alaska Fairbanks). Different bird banders and institutions allocated it from China, Japan, Far Eastern Russia and Alaska (see compilation/digital appendix). They collected these data at overall unique 355 geo-referenced locations over the last 8 years (+ some older data for Alaska). Thereby, many sampling locations have not just one, but many separate individual records during fall and spring migration. From Alaska it was only possible to get presence/absence data of the relevant northern index species Arctic Warbler (Phylloscopus borealis), Yellow Wagtail (Motacilla flava or Motacilla tschutschensis) and Bluethroat (Luscinia svecica). The datasets are part of different research projects (e.g. Avian Influenza surveillance) as well as outcomes of long-term monitoring programs. The given collection might be an outstanding legacy dataset of collected mistnet data for the entire Pacific Rim. It encompasses a high potential for spatial analysis on a wider scale. Not the availability of data but its amalgamation for a clean version of the database was the actual difficulty and an achievement in this study.

28
For the modeling of species distribution maps it was necessary to determine descriptive environmental layers. According to common principles in Species Distribution Modeling overall 10 bioclimatic variables were chosen to act as predictor (see table 4). The given environmental layers have known roles in imposing constraints upon species distribution as a result of well understood and quite general physiological mechanism and are therefore widely and successfully used for species distribution models (cf. GUISAN &
ZIMMERMANN 2000, cf. ELITH & LEATHWICK 2009, cf. WALTHER et al.). As the habitat choice of migrants is also influenced by anthropogenic land transformations (positive and negative) a human influence index was chosen as an additional variable (cf. WALTER et al). Table 4 Data sets used in this study
Dataset name type resolution Year Sources Reference
Environmental Layer
Alt grid 1 sq km 1950-2000
WORLDCLIM ROBERT J. HIJMANS et
al., University of
California Slope grid 1 sq km Derived from alt Aspect grid 1 sq km Derived from alt Min coldest month grid 1 sq km WORLDCLIM Max warmest month grid 1 sq km WORLDCLIM Annual mean temperature grid 1 sq km WORLDCLIM Annual precipitation grid 1 sq km WORLDCLIM Globcover 2009 (landcover) grid 300 m 2009 ESA ESA (ed.) 2010
Distance to Coastline grid 1 sq km Equation tool ArcGIS
Global Human Influence Index
grid 1 sq km 2005 SEDAC WILDLIFE CONSERVATION
SOCIETY, Columbia
University
Other datasets used in this study
EFI (Ecosystem functionality index)
grid 1 sq km 2012 pers. correspondence FREUDENBERG et al.
2012, Eberswalde
Protected areas (national and international)
shape - 2009 UNEP
Bird banding data table - 2004-2012
Compiled by Falk Huettmann and collected colleagues
see digital appendix
(Name of Bird
banders sorted by
location)
Bird distribution maps shape - 2012 Request; Email BIRDLIFE INTERNATIONAL
& NATURSERVE (ed.) 2012
2.1.2 DATA INTEGRATION Different sources (countries, collectors) of bird data induce not only different formatting. There are also differences between the geographic projection of coordinates, species names, methods or bird banding protocols, for example. To have a good basis for further steps it was necessary to establish a consistent and clean dataset during the preliminary stages. Therefore corrupt datasets were removed or corrected and coordinates were transformed into the correct geographic projection. The most common inconsistencies and mistakes were different versions of scientific bird names, mistaken geographic projections (GPS and GIS), repeated entries and wrong species (e.g. sea lions, bears, spiders, bats). The final compilation comprises a unified summary of the most important information listed by each unique sampling location;
• Filename • Name of Location

1 INTRODUCTION
29
• Scientific Species Names • Number of Individuals • Number of Species • Capture days (Effort) • Time Range • Method (dropping, mistnets, mapping) • Collector/Institution • Latitude/Longitude (See compilation, digital appendix)
In a further step, the mistnet data were comprehended into another table. Because there was not always a description of the method that was used it was necessary to define which datasets are mistnet data and which may not (e.g. species presence due to dropping locations for Avian Influenza studies). As an indicator for mistnet data the occurrence of metrics, the effort, the frequency of captured bird species or/and the type of bird were used to verify the methods. For example, most of the shorebirds/waterfowls are usually captured without mistnets. Afterwards, the datasets, which only encompass captures during fall migration, were summarized. The data considered comprises captures between the end of July till the beginning of October. To verify the validity of the provided coordinates and the correct overlay location with the environmental layer it was necessary to map each location in ArcGIS. If necessary, locations which obviously had wrong coordinates (located in the middle of the sea, for example) had been removed and points, which deviated from the environmental layer, were expert-adjusted. Deviations of other layers (especially raster data) can be caused by the inaccuracy of coordinates and coastlines, the geographic projection of the maps or different pixel sizes. When shifting the points to ensure the coverage with the environmental layer the lowest common denominator was chosen. Concerning the subsequent modeling there is a need to mention that smaller changes in data and fuzziness can get buffered by the used algorithm and for a generalization (HUETTMANN, pers. com., March 2013).
2.1 PREDICTIVE MODELING
2.2.1 PREDICTOR AND RESPONSE VARIABLES As variables for the prediction of valuable areas for migratory songbirds the five index species and an index of species richness were used. The species were selected to meet criteria such as difference in their range and habitat preferences or by distance of their migration routes (see 1.3). In the framework of this study it was not possible to consider more species. Nevertheless, the selected species can be seen as umbrella species and templates for a lot of other birds on the flyway. For all species the presence and absence data of each sampling location were derived from the compilation (mistnet locations during fall migration). According to the available data only the presence and absence data during fall migration were used in

30
the modeling. In the given study mistnet data of the time range from the end of July till the beginning of October was considered. The biodiversity of bird species might act as an indicator for the quality of a stopover sites for migratory birds. Therefore an index of species richness was derived by comparing the number of different captured species and the effort in days. To find a function of species by effort it was useful to create a species richness curve (resp. loess curve) first (see figure 28);
Figure 28 Species richness curve (autumn migration songbirds)
y = 3,7748*1,53x (y = Index) r ² (adjusted R-squared) = 0.6569
Function (based on TIBCO Spotfire S+ 8.2)
Although the curve shows characteristics of a square root, a linear function was chosen for simplification and because of a strong affinity with a linear regression, too. To display the results of the modeling in ArcGIS regular lattice points (20 km grid) were created by using the software GME (Geospatial Modeling Environment). An intersection of all variables and the lattice points with the environmental layers was created by using ArcGIS (creating shapefiles) and GME (intersections). 2.2.2 TREENET (Salford Predictive Modeler) The models in this study are based on presence-absence data of index species and the most important environmental predictors. In this context, the benefit of mistnet data in contrast to simple counts is that they encompass confirmed absence data. The underlying table of data consists of columns, which contain species, and predictor data where each row represents a unique site.

1 INTRODUCTION
31
Five final models were developed by using the model algorithm TreeNet (see 1.4). TreeNet modeled the data tables derived from a spatial overlay using environmental data (see 2.1.1). For the modeling process a classification tree and balanced weights were set for modeling of the index species. For the Species Richness index a regression tree was chosen. For all models a number of trees between 300 - 600 were used while making between 10 - 20 Cross Validations (see appendix 5). Finally, the best model was selected by the accuracy of the prediction (cf. SALFORD SYSTEMS 2005: 52). The results comprise spatial maps, plots of the performance of the most important predictor as well as ‘Receiver Operating Characteristic’ (ROC) Curves (for categories) and ‘Gain’ Curves (for regression trees) (ib). The area under the ROC Curve is the most commonly used model criterion in machine learning and is a measure of overall model performance (ib.). The representation of the plots of the performance of the response variables is based on the number of selected trees. Thus, because trees were used the curves are not smooth (step-functions) (cf. SALFORD SYSTEMS 2005: 93ff). 2.2.3 ArcGIS Due to the global scale of the study area and the extent over the Pacific Rim WGS_1984_Mercator was chosen as underlying coordinate system. The map settings following the settings used in HERRICK et al. (2013). To display the models the result was scored in final result tables with lattice points, which were created by using GME. The resulting tables of the predictive modeling were mapped in ArcGIS and smoothed as a grid by using the Interpolation Tool - IDW (resolution of the environmental layer, using defaults) for a better visualization.
2.3. IMPLEMENTATION FOR STRATEGIC CONSERVATION PLANNING
Marxan (see 1.5.1) was used to evaluate which regions are likely to be most important for Strategic Conservation of migratory birds, based on the identification of areas that may include a high index of the occurrence of the index species and areas with potentially high species richness. This approach acts as first proposal for Systematic Conservation Planning along the EAAF for passerines, and is to be reviewed and updated over the years. 2.3.1 PREPARATIONS
Creating planning units Before using Marxan the conservation features that are to be used in this study were determined. Beside the index species and the modeling of the species richness index also an Ecosystem functionality index (FREUDENBERG et al. 2012) was chosen to be included. The Ecosystem Functionality Index (EFI) was developed by FREUDENBERGER et al. in 2012 and reveals areas that are important for biodiversity, resilience to global change, adaptive capacity, energy dissipation and ecosystem service provisioning. Species richness of vascular plant, functional richness of plants, foliage canopy height as well as the topographic heterogeneity and slope act as Indicators for ecosystem complexity and heterogeneity. The Ecosystem functionality Index is not least developed to act as
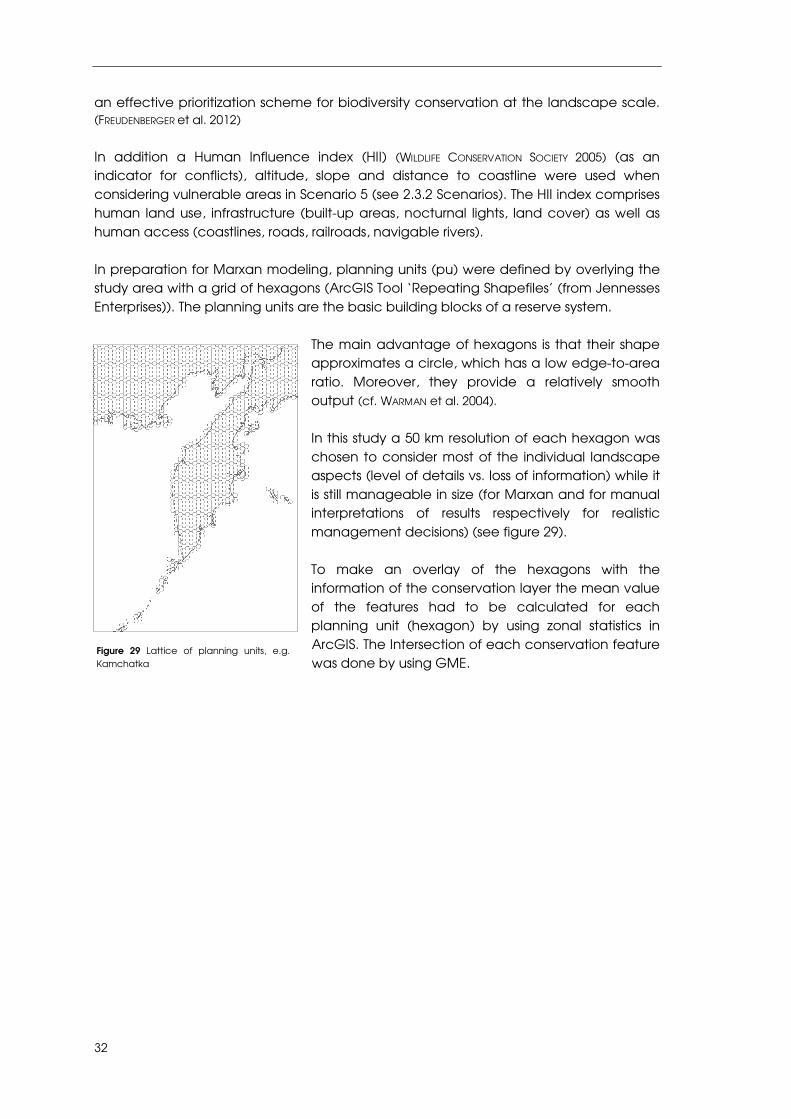
32
an effective prioritization scheme for biodiversity conservation at the landscape scale. (FREUDENBERGER et al. 2012) In addition a Human Influence index (HII) (WILDLIFE CONSERVATION SOCIETY 2005) (as an indicator for conflicts), altitude, slope and distance to coastline were used when considering vulnerable areas in Scenario 5 (see 2.3.2 Scenarios). The HII index comprises human land use, infrastructure (built-up areas, nocturnal lights, land cover) as well as human access (coastlines, roads, railroads, navigable rivers). In preparation for Marxan modeling, planning units (pu) were defined by overlying the study area with a grid of hexagons (ArcGIS Tool ‘Repeating Shapefiles’ (from Jennesses Enterprises)). The planning units are the basic building blocks of a reserve system.
The main advantage of hexagons is that their shape approximates a circle, which has a low edge-to-area ratio. Moreover, they provide a relatively smooth output (cf. WARMAN et al. 2004).
In this study a 50 km resolution of each hexagon was chosen to consider most of the individual landscape aspects (level of details vs. loss of information) while it is still manageable in size (for Marxan and for manual interpretations of results respectively for realistic management decisions) (see figure 29). To make an overlay of the hexagons with the information of the conservation layer the mean value of the features had to be calculated for each planning unit (hexagon) by using zonal statistics in ArcGIS. The Intersection of each conservation feature was done by using GME.
Figure 29 Lattice of planning units, e.g. Kamchatka

1 INTRODUCTION
33
Classifications To be able to set targets in Marxan it is necessary to define a particular range of values where targets are met. Therefore, it was required to make a classification of the conservation values as well as to define where the most important planning units are located. The threshold for the occurrence (presence) of the most important planning units was determined by a statistical comparison of the presence points of each species and the prediction of the model result using TIBCO Spotfire S+ 8.2. The ‘Lower Confidence Mean Value’ of each species was chosen as safe threshold for the assumed presence (see below). The lower confidence interval is described as the likely range of a true value.
Table 5 Classification thresholds
Species LCL Mean
Siberian Rubythroat (Luscinia calliope) 0.5795385 Arctic Warbler (Phylloscopus borealis) 0.7033382 Bluethroat (Luscinia svecica) 0.4216674 Black-faced Bunting (Emberiza
spodocephala) 0.4911707
Yellow Wagtail (Motacilla flava) 0.4987052

34
Targets To set targets in Marxan it was required to count the number of the most important planning units (see classification) of each conservation feature. Afterwards, it is possible to set a target percentage, which should be part of the solution (due to the number of overall counted planning units).
1. Conservation Feature (e.g. Siberian Rubythroat) • Number of planning units with target value (>=0.5795385): 2000 • Target: 10 % = 200 planning units
2. … 3. …
(See 2.3.2 for further scenario settings) Because individual conservation features can begin to dominate the solutions (same target percentage but a higher number of planning units is available for reserve selection process) it is useful to give a higher weight to rarer conservation features or planning units where more targets are met (cf. ARDRON et al. 2010: 89). In this study the target value of Arctic Warbler was adjusted because of the high number of planning units with a high Index of occurrence) (see Scenario 2, 4 & 5).
Input Files Marxan needs a special technical format for the ‘Input-files’. Therefore the obtained information was formatted into ‘dat.’- files. Because the software does not tolerate format mistakes the generation of the files has been done very thoroughly. The following four input files had to be generated for each scenario;
• Spec.dat - Conservation Features File o contains information about each of the conservation features being
considered, such as their name, targets and representation requirements, and the penalty that should be applied if these representation requirements are not met
• Puvspr.dat - Planning Unit versus Conservation Feature File o contains information on the distribution of conservation features in each
of the planning units (‘Marxan’ will assume that conservation features only occur where an amount has been entered)
• Pu.dat - Planning Unit o contains information about the planning units themselves, such as ID
Number, cost, location and status (planning unit = each unit where a value of one or more conservation features occurs).
• Input.dat - Input Parameter File o used to set values for all the main parameters that control the way
‘Marxan’ works, where to find the input data and where to place the output files
(GAME & GRANTHAM 2008: 13f)
Final Software settings A further step included the determination of specific settings to set the number of runs or if the current protection status and the boundary length should be considered.

1 INTRODUCTION
35
Together with the simulated annealing algorithm the software was set to run iteratively to increase the chance of finding the best solution. Furthermore, 50 runs were defined while making 10 iterations. This value was defined as a compromise between computer processing time and reduced prediction variability (cf. PEARCE et al. 2008: 914). Instead of locking the current protection status (to reflect the real situation) the proportion of the single best solution contained within the existing protected areas network was calculated. Hence, one can better illustrate how much of a role current reserve areas play in achieving conservation targets respectively how they represent values of migratory songbirds (cf. PEARCE 2008: 914). Frequently the targets are known to be inefficient, when considered in terms of meeting broader network objectives (ARDRON
et al. 2010: 86). Concerning the resulting boundary length it is to say that the final reserve system will be often highly fragmented and the degree of compactness is arbitrary (see 1.5.1). Thereby the compactness is unrelated to the requirements of any particular process and assumed to benefit population dynamics and other processes and to facilitate management (PRESSEY et al. 2007). Although there is a possibility to set constraints through a boundary length modifier this possibility was not used for now (see 1.5.1) because a clumping of suitable areas in the landscape would basically get at the same question. It remains an interesting topic to be addressed. For now, a wider and general landscape approach was used (not clumped to not exclude landscapes). When all data files were established and the settings were determined Marxan was able to run the scenarios.
Result tables The results are presented in form of ‘txt-files’. The ‘best solution’ as well as the ‘selection frequency’ (irreplacibility) (see 2.3.1) was mapped with ArcGIS after adding the coordinates to the planning units. The most important output file is called ‘best solution’ and includes the result of the run with the ‘best solution’ for a reserve network (lowest objective function score). The ‘single best solution’ gives no direct indication of the importance of each site in terms of the potential to replace it with others in the region (cf. PRESSEY et al. 1994). This might be a problem for planners who do not see if the site is unique in its contribution to targets or whether the management of specific sites is open to negotiation with other interests (CARWADINE et al. 2007) (see 4.2.2). Therefore it can be useful for some planning exercises to display the file called ‘summed solution’ as well (selection frequency). It keeps track of how often each unit was involved in any solution of the given scenario. Thus, the information is a useful way to explore the irreplacibility of units and can therefore be used as a guide to identify key areas (GAME & GRANTHAM 2008: 70). Nevertheless, it can be that frequently selected sites are not necessarily part of the most efficient solution (ARDRON et al. 2010: 100). One reason is that the output does not take into account complementarities (= relationship of the planning units in a solution). Therefore the selection frequency should not be seen as the ‘best solution’ for a reserve network whereas its consideration during choosing priority areas ensures that planning units with rare conservation features are given priority. Thus, this approach helps to guide us and as a first and informative assessment.

36
2.3.2 SCENARIOS
The present Marxan analysis aims to achieve the representation of hotspots of migratory songbirds as well as areas with high species richness (songbirds) while also factoring the level of threat of particular areas and protection of biodiversity in general. The output focuses on priority areas for subsequent finer-scale planning whereby the result should be seen as a ‘Top-down’ approach. Because Marxan does not provide ‘one -stop’ reserve solutions, it is recommended to experiment with the conservation features to match the targets as well as to run the program with several scenarios. In this study overall five scenarios were established to reveal solutions by different conservation features and spatial extents and to compare these solutions with the existing reserve network. The result should be seen as first approach and as a basis for further refinements and extensions throughout a planning process with involvement of important stakeholder. See next page for the target planning units (hotspots1) of all conservation features.
1 Hotspots = pu with value > classification-threshold (table 5)
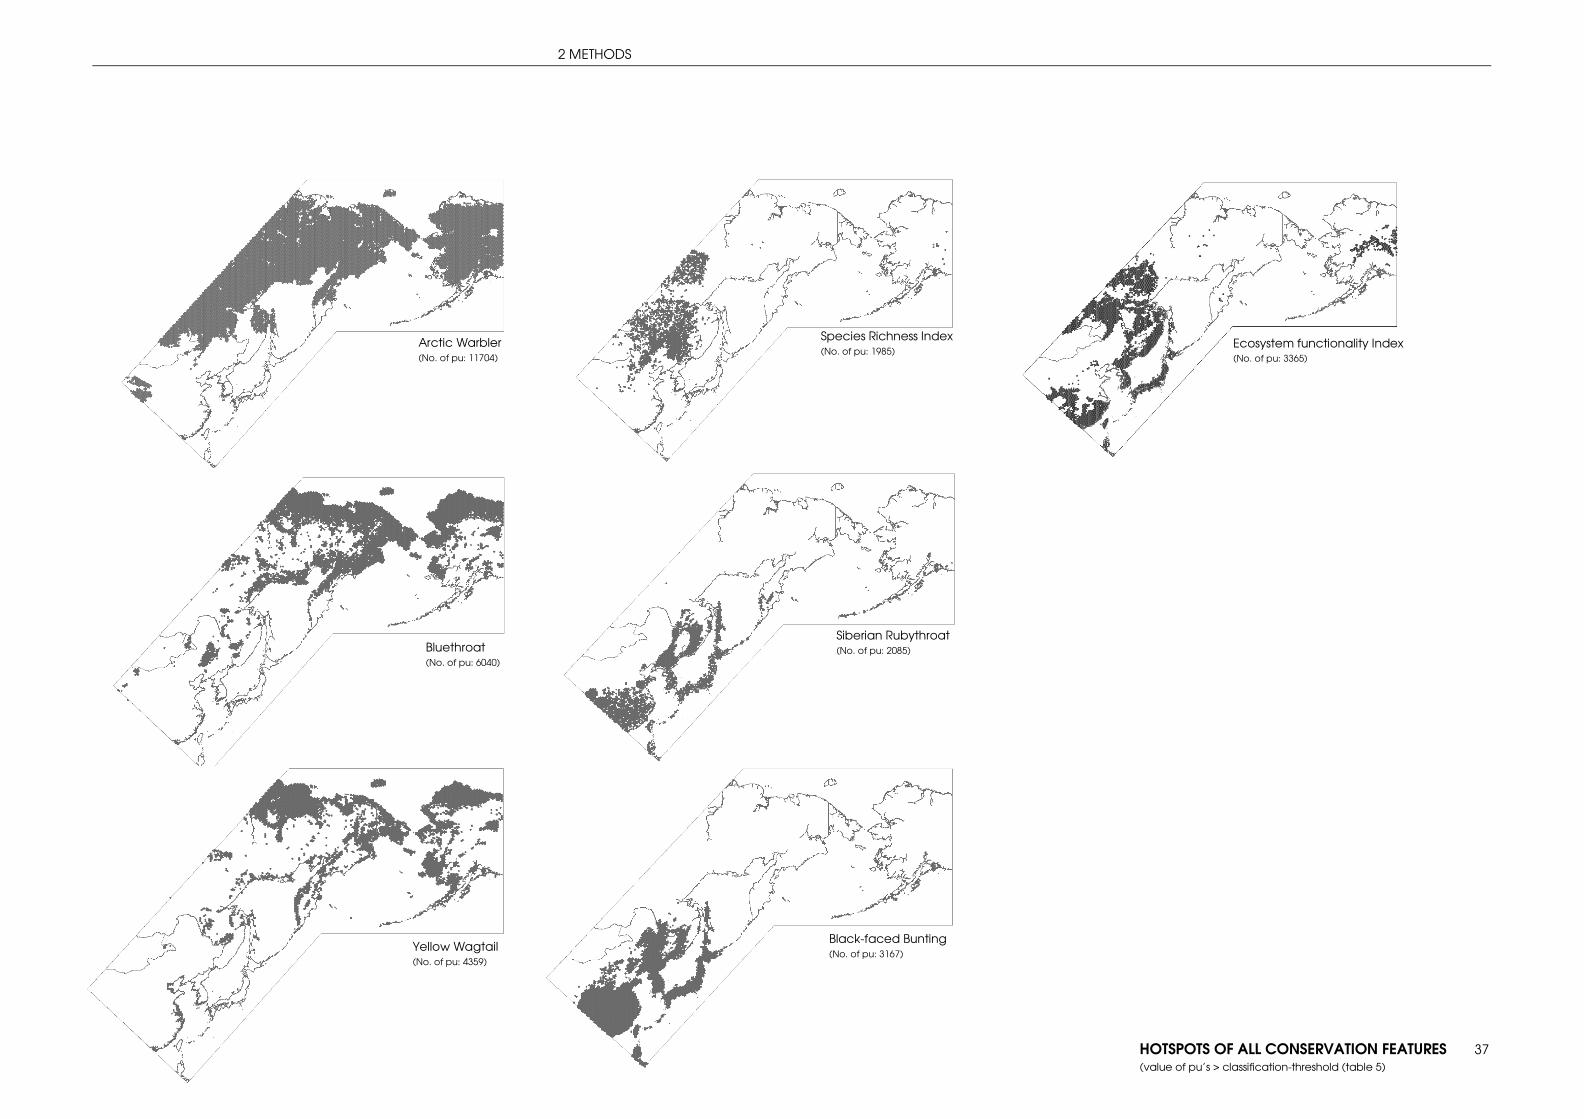
2 METHODS
37
Black-faced Bunting (No. of pu: 3167)
Species Richness Index (No. of pu: 1985)
Ecosystem functionality Index (No. of pu: 3365)
Bluethroat (No. of pu: 6040)
Yellow Wagtail (No. of pu: 4359)
Arctic Warbler (No. of pu: 11704)
Siberian Rubythroat (No. of pu: 2085)
HOTSPOTS OF ALL CONSERVATION FEATURES (value of pu’s > classification-threshold (table 5)

38

2 METHODS
39
Scenario 1: Biodiversity
To run a scenario with the focus on biodiversity aspects the Species Richness Index (songbirds, autumn migration) as well as an Ecosystem Functionality Index (EFI) were chosen as conservation features. Table 6 Target setting scenario 1
Scenario 2: Boreal species
One scenario was run to illustrate the conservation prioritization of hotspots of boreal index species. The target includes the protection of 10 % of the hotspots of Yellow Wagtail and Bluethroat. Because the higher distribution of Arctic Warbler can lead to a domination of this species in the final reserve design the target was set to achieve ‘only’ a protection of 5 % of the hotspots. Table 7 Target setting scenario 2
Scenario 3: Subboreal species
As with the boreal species also for the hotspots of subboreal birds a conservation scenario was generated. So, the rare species Siberian Rubythroat (Luscinia calliope) and the widespread species Black-faced Bunting (Emberiza spodocephala) act as conservation features for the third scenario. For both species a target value of 10 % was defined. Table 8 Target setting scenario 3
Conservation feature Threshold No. pu >
threshold
Target
Ecosystem functionality Index 32.07015243 3365 336 Species Richness Index (songbirds) 126.0398407 1985 198
Conservation feature Threshold No. pu >
threshold
Target
Yellow Wagtail (Motacilla flava) 0.4987052 4359 436 Bluethroat (Luscinia svecica) 0.4216674 6040 604
Arctic Warbler (Phylloscopus borealis) 0.7033382 11704 585
Conservation feature Threshold No. pu >
threshold
Target
Black-faced Bunting (Emberiza spodocephala) 0.4911707 3167 316 Siberian Rubythroat (Luscinia calliope) 0.5795385 2085 209

40
Scenario 4: Boreal and subboreal species + Species Richness Index
Scenario 4 aims a more holistic approach to conservation of migratory birds along the entire study area. Therefore all index species as well as the Species Richness Index (migratory songbirds) act as conservation features. Although there is no direct way to set a particular proportion of land in the reserve solution an area target of approximately 10 % was tried to achieve by setting the targets. This value was chosen according to the United Nations Convention on Biological Diversity (cf. UNEP 2009). To achieve a percentage of 10 % for the area the targets for the conservation features were set to 10 %. See also the result table of the conservation efficiency for each feature. Table 9 Target setting scenario 5
Scenario 5: Boreal and subboreal species + Species Richness Index + consideration of
vulnerability
Scenario 4 has taken all conservation appropriately into consideration. However, the strength of Strategic Conservation Planning is to go one step further. The question where a protection status is likely to be most important is strongly related to human environment interactions. So the goal is to achieve the best conservation of migratory birds while focusing on areas subject to a higher risk of degradation and a higher accessibility. In this study the Human Influence Index was used to describe human population pressure (see 2.3.1). Concerning the vulnerability of areas it can be assumed that lowlands, edge areas of cities/infrastructure and areas close to the coastline are at a higher threat while there are easier to tap, even for building a new reserve. In contrast, areas with a high slope and/or areas far away from infrastructure appear less likely to be exposed by human access and degradation (cf. PEARCE 2008: 920). Even when we are not able to quantify the full range of impacts from all activities on the conservation features it isn’t an excuse for dismissing them from the planning process. In this scenario slope (low), human influence (edge areas) and the distance to coastline act as an indicator for vulnerability (see figure 30 & 31). For that reason hotspots, which lie in such areas, got a higher weight (by cost-setting).
Conservation feature Threshold No. pu >
threshold
Target
Black-faced Bunting (Emberiza spodocephala) 0.4911707 3167 316 Siberian Rubythroat (Luscinia calliope) 0.5795385 2085 209
Yellow Wagtail (Motacilla flava) 0.4987052 4359 436
Bluethroat (Luscinia svecica) 0.4216674 6040 604
Arctic Warbler (Phylloscopus borealis) 0.7033382 11704 585
Species Richness Index (songbirds) 126.0398407 1985 196
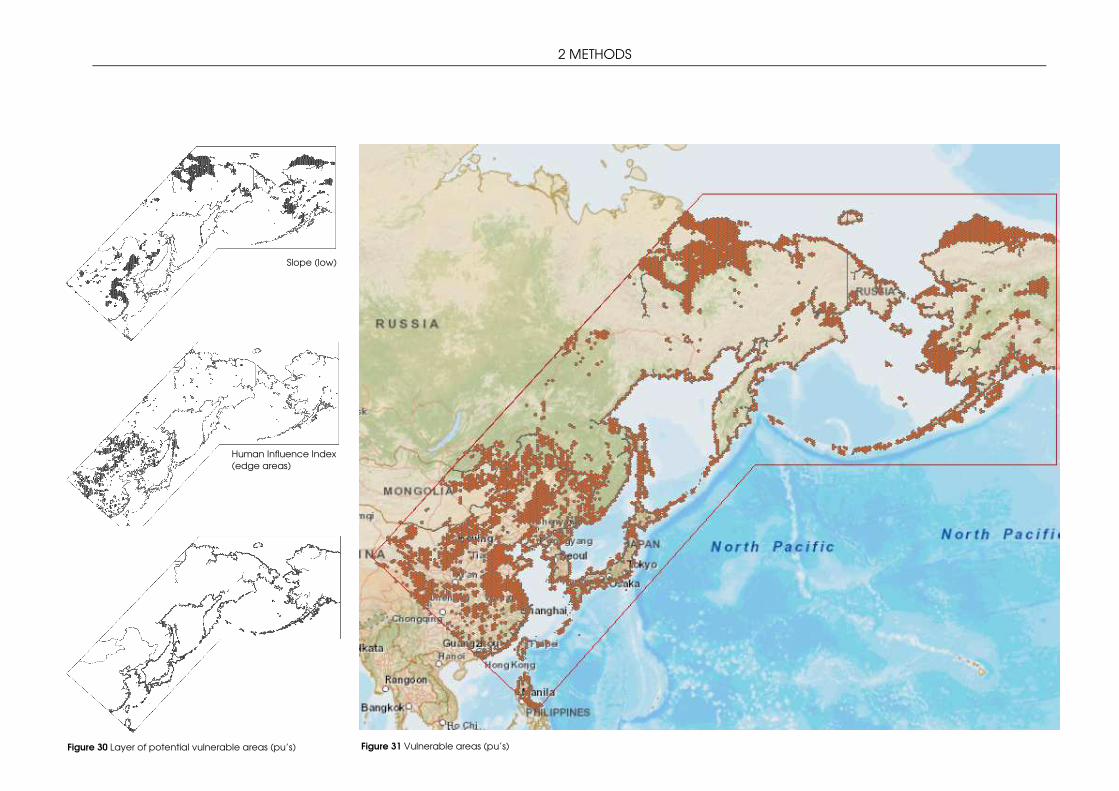
2 METHODS
41
Figure 30 Layer of potential vulnerable areas (pu’s)
Figure 31 Vulnerable areas (pu’s)
Human Influence Index (edge areas)
Slope (low)
Distance to coastline (low)

3 RESULTS
42
0.0
0.2
0.4
0.6
0.8
1.0
0.0 0.2 0.4 0.6 0.8 1.0
Tru
e P
os.
Rat
e
False Pos. Rate
ROC Integral0.97860
3 RESULTS
3.1 PREDICTION: VALUABLE AREAS FOR MIGRATORY SONGBIRDS
3.1.1 INDEX SPECIES Arctic Warbler (Phylloscopus borealis)
The model of Arctic Warbler reflects its characteristic as a widespread species. High predictions in fall stretch from entire Alaska to entire Far Eastern Russia down to the border of China. The prediction index for Japan and China is low though. Only one area in south China shows a high index of occurrence. The comparison of the distribution map of the breeding range with the model results of autumn migrations shows a high coverage whereas the autumn range stretches more over entire Alaska and the relative probability of occurrence during autumn migration is rather low in Japan. Although the wintering grounds of Arctic Warbler are located in the South-East Asian tropics there is only one area in South Asia and interior Alaska with a high prediction outside of the breeding range. The model shows a good performance (see figure 32) and exhibits an accuracy of 94 %. The best determinant for the prediction is annual precipitation (100 %) (see table 10).
The least important variables are the distance to coastline and the Human Influence Index. It is obvious though that the areas with a low probability of occurrence are areas with a high human pressure (e.g. Japan and southeast China). Table 10 Variable importance from model Arctic Warbler
Variable Score
Annual precipitation 100.00 Landcover 61.96 Mean temperature 61.75 Slope 58.73 Max temperature warmest month 45.77 Altitude 45.24 Min temperature coldest month 44.10 Aspect 41.60 Distance to coastline 39.56 Human Influence Index 38.63
Figure 32 ROC Curve Arctic Warbler

3 RESULTS
43
PREDICTED HOTSPOTS OF
ARCTIC WARBLER
1: 45.000.000

44

3 RESULTS
45
-0.2
0.0
0.2
0.4
0.6
200 400 600 800 1000 1200 1400
Pa
rtia
l De
pe
nde
nce
ANNUALPREC
One Predictor Dependence For PHYLLOSCOP = 1
-0.4
-0.2
0.0
0.2
0.4
20 40 60 80 100120 140 160 180200 220
Pa
rtia
l De
pe
nde
nce
LANDCOVER
One Predictor Dependence For PHYLLOSCOP = 1
The predictor ‘annual precipitation’ shows a positive dependence under a value of 750 units (mm rainfall) (see figure 33). Over this value the predictor is negatively correlated. Similar to the habitat preference during the breeding season the landcover curve reveals a highest positive dependence for ‘Closed to open mixed broadleaved and needleleaved forest (100)’, ‘Mosaic Forest-Shrubland/Grassland (110)’ and ‘Mosaic Grassland/Forest-Shrubland (120)’ (see figure 34). The predictor is negatively correlated to open areas and areas, which are regularly or temporary flooded.
Figure 33 Annual precipitation dependence – Figure 34 Landcover dependence - Arctic Arctic Warbler Warbler
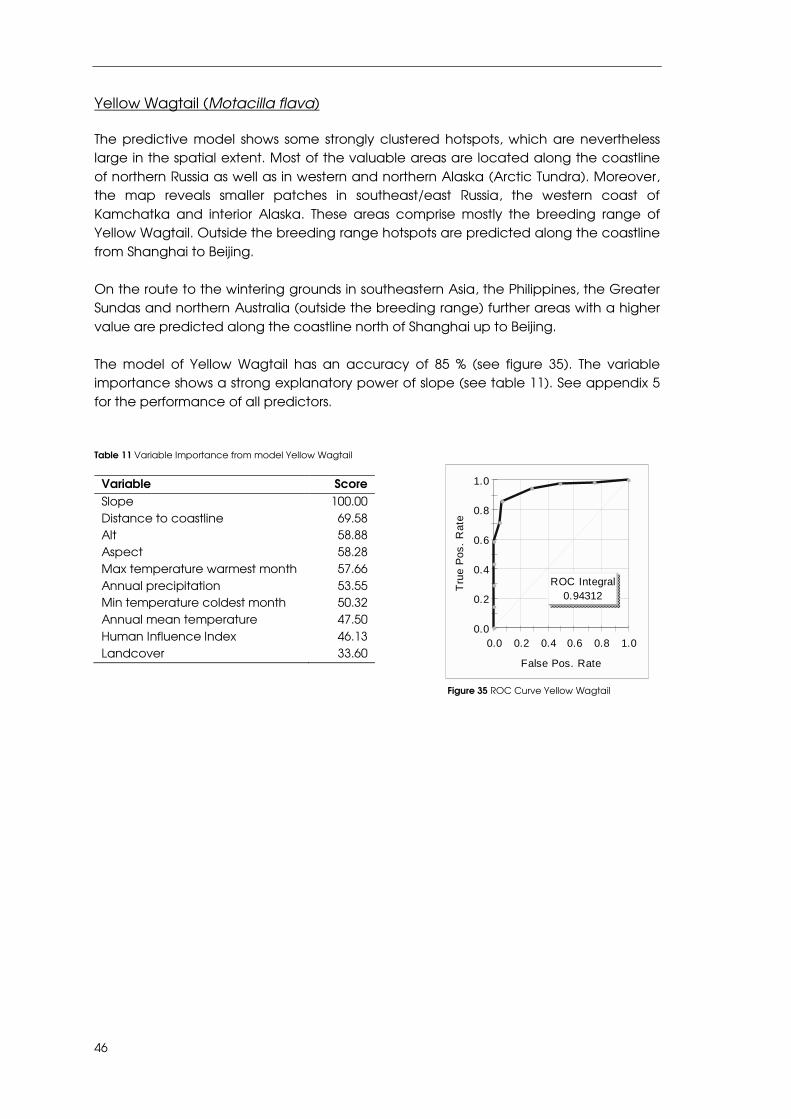
46
0.0
0.2
0.4
0.6
0.8
1.0
0.0 0.2 0.4 0.6 0.8 1.0
Tru
e P
os.
Rat
e
False Pos. Rate
ROC Integral0.94312
Yellow Wagtail (Motacilla flava) The predictive model shows some strongly clustered hotspots, which are nevertheless large in the spatial extent. Most of the valuable areas are located along the coastline of northern Russia as well as in western and northern Alaska (Arctic Tundra). Moreover, the map reveals smaller patches in southeast/east Russia, the western coast of Kamchatka and interior Alaska. These areas comprise mostly the breeding range of Yellow Wagtail. Outside the breeding range hotspots are predicted along the coastline from Shanghai to Beijing. On the route to the wintering grounds in southeastern Asia, the Philippines, the Greater Sundas and northern Australia (outside the breeding range) further areas with a higher value are predicted along the coastline north of Shanghai up to Beijing. The model of Yellow Wagtail has an accuracy of 85 % (see figure 35). The variable importance shows a strong explanatory power of slope (see table 11). See appendix 5 for the performance of all predictors. Table 11 Variable Importance from model Yellow Wagtail
Figure 35 ROC Curve Yellow Wagtail
Variable Score
Slope 100.00 Distance to coastline 69.58 Alt 58.88 Aspect 58.28 Max temperature warmest month 57.66 Annual precipitation 53.55 Min temperature coldest month 50.32 Annual mean temperature 47.50 Human Influence Index 46.13 Landcover 33.60

3 RESULTS
47
PREDICTED HOTSPOTS OF
YELLOW WAGTAIL
1: 45.000.000

48

3 RESULTS
49
0.0
0.5
1.0
1 2 3 4 5
Pa
rtia
l De
pe
nd
en
ce
SLOPE
One Predictor Dependence For YELLOW_WAG = 1
0.2
0.4
500 1000 1500
Pa
rtia
l De
pe
nd
en
ce
ALT
One Predictor Dependence For YELLOW_WAG = 1
Figure 36 shows a strongly dependence at values over 0.4 degree which indicates that Yellow Wagtail prefer areas with a lower slope (=not mountains). The predictor altitude underlines this fact with a positive dependence for flat lowlands (see figure 37). This is conforming to the habitat preference during the breeding season when Yellow Wagtail prefers lowlands with wet meadows, wetland margiere or grassy swamps.
Figure 36 Slope dependence – Yellow Wagtail Figure 37 Altitude dependence – Yellow Wagtail

50
0.0
0.2
0.4
0.6
0.8
1.0
0.0 0.2 0.4 0.6 0.8 1.0
Tru
e P
os.
Rat
e
False Pos. Rate
ROC Integral0.92651
Siberian Rubythroat (Luscinia calliope)
While the breeding grounds stretch from Sakhalin into the north and inland, the spatial focus during autumn migration lies on the coastline from southeast China, Korea and Japan up to the southern part of Kamchatka. Due to the assumption that Siberian Rubythroat occurs as a rare species also on western Aleutians during fall migration there are also some areas at the southern and western coastline of Alaska where the relative probability of occurrence is high. The same applies to high predictions in Korea and Southeast Asia where Siberian Rubythroat probably migrate. According to an accuracy of 88 % the ROC curve shows an acceptable performance (see figure 38). The variable importance shows a strong link with annual precipitation as well as aspect (see table 12)
Table 12 Variable importance from model Siberian Rubythroat
Figure 38 ROC Curve Siberian Rubythroat
Variable Score
Annual precipitation 100.00 Aspect 88.44 Annual mean temperature 78.75 Human Influence Index 73.07 Slope 60.08 Distance to coastline 56.93 Altitude 56.06 Max temperature warmest month 54.18 Min temperature coldest month 50.99 Landcover 48.10

3 RESULTS
51
PREDICTED HOTSPOTS OF
SIBERIAN RUBYTHROAT
1: 45.000.000

52

3 RESULTS
53
-0.5
0.0
0.5
200 400 600 800 1000 1200 1400
Pa
rtia
l De
pe
nd
en
ce
ANNUALPREC
One Predictor Dependence For LUSCINIA_C = 1
-0.2
-0.1
0.1
0.2
0.3
100 200 300 400
Pa
rtia
l De
pe
nd
en
ce
ASPECT
One Predictor Dependence For LUSCINIA_C = 1
Figure 39 shows a positive correlation over a value of 600 mm while a precipitation less than 600 mm shows a strongly negative dependence. Figure 40 shows the dependence of aspect whereas the probability of occurrence is positively correlated over a value of 90 degree. Thus it is to expect that Siberian Rubythroat avoid dry areas with a particular aspect. For all predictors see appendix 5.
Figure 39 Annual precipitation dependence Figure 40 Aspect dependence – Siberian Rubythroat – Siberian Rubythroat

54
0.0
0.2
0.4
0.6
0.8
1.0
0.0 0.2 0.4 0.6 0.8 1.0
Tru
e P
os.
Rat
e
False Pos. Rate
ROC Integral0.96179
Bluethroat (Luscinia svecica)
The predictive model of Bluethroat underlines the fact that it’s a northern species. The emphasis of the relative probability of occurrence lies along the coastline from Northern Kamchatka up to the coast of the East Siberia Sea. In Alaska the focus lies around the coastline with small pattern in interior Alaska, too. The map strongly implies an exchange between the Russian and American populations (see 4.1). Off the breeding range larger areas with a high index of occurrence are only predicted for the northern border of China. The ROC Curve shows a good performance (see figure 41). Hence, the accuracy of the model is at 91 %. Slope as well as the min and mean temperature and the annual precipitation deal as the most important predictor (see table 13).
Figure 41 ROC Curve Bluethroat
Table 13 Variable importance from model Bluethroat
Variable Score
Slope 100.00 Min temperature coldest month 94.64 Annual precipitation 92.20 Annual mean temperature 74.23 Altitude 53.06 Distance to coastline 48.92 Max temperature warmest month 48.06 Landcover 43.89 Aspect 35.68 Human Influence Index 32.56

3 RESULTS
55
PREDICTED HOTSPOTS OF
BLUETHROAT
1: 45.000.000

56

3 RESULTS
57
-0.05
0.00
0.05
0.10
20 40 60 80 100120140160 180200220
Par
tial D
ep
ende
nce
LANDCOVER
One Predictor Dependence For LUSCINIA_S = 1
0.0
0.2
0.4
1 2 3 4 5
Par
tial D
ep
ende
nce
SLOPE
One Predictor Dependence For LUSCINIA_S = 1
-0.1
0.0
0.1
0.2
0.3
200 400 600 800 1000 1200 1400
Pa
rtia
l De
pe
nd
en
ce
ANNUALPREC
One Predictor Dependence For LUSCINIA_S = 1
-0.1
0.0
0.1
0.2
0.3
-300 -200 -100
Pa
rtia
l De
pe
nd
en
ceMIN_MONTH
One Predictor Dependence For LUSCINIA_S = 1
Figure 43 shows that as well as for the Yellow Wagtail the species prefer habitats with a lower slope. The predictor shows a positive dependence under 0.9 degree. Figure 42 reveals that ‘Sparse (<15 %) vegetation’ acts as habitat type with the highest positive correlation whereas there is a positive dependence for closed to open vegetation in general. With due regard to the most important predictor, Bluethroat prefers open to closed vegetation in lowlands with an annual precipitation under 750 mm (see figure 44) and a minimum temperature of the coldest month under -15 °C (see figure 45).
Figure 42 Landcover dependence – Bluethroat Figure 43 Slope dependence - Bluethroat
Figure 44 Annual precipitation dependence - Figure 45 Minimum temperature dependence – Bluethroat
Bluethroat

58
0.0
0.2
0.4
0.6
0.8
1.0
0.0 0.2 0.4 0.6 0.8 1.0
Tru
e P
os.
Rat
e
False Pos. Rate
ROC Integral0.92504
Black-faced Bunting (Emberiza spodocephala)
Areas with a high Index of occurrence of Black-faced-Bunting mostly occur in China and Japan. The range of those areas stretch mostly along the coastline from southeast China to entire Korea and Japan up to the island Sakhalin. Due to the characteristic as a typical farming species (and early succession representative) it’s obvious that the species focus is in areas with high human influence. The index of occurrence in the northern part of the flyway is rather small. Only one small area in southern Alaska -close to Anchorage- includes a high potential of occurrence. This is in interesting fact, because there is no proof of the Black-faced Bunting in Alaska, yet. Presumably, this niche is occupied by a similar species or taxa. The areas with high predictions are closely linked to the wintering grounds, which lie in Central and South Japan, South Korea, in the South and East of China, Taiwan and Southeast Asia. The ROC Curve of the model shows a good performance (see figure 46). The accuracy is at 90.5 %. The maximum and annual mean Temperature play the most important role as predictor while the minimum Temperature as well as the distance to coastline are less important variables (see table 14).
Figure 46 ROC Curve Black-faced Bunting
Table 14 TreeNet Variable importance from model Black-faced Bunting
Variable Score
Max temperature warmest month 100.00 Annual mean temperature 81.76 Altitude 52.97 Annual precipitation 51.51 Landcover 47.38 Human Influence Index 45.34 Slope 44.85 Aspect 39.03 Distance to coastline 29.81 Min temperature coldest month 24.06

3 RESULTS
59
PREDICTED HOTSPOTS OF
BLACK-FACED BUNTING
1: 45.000.000

60

3 RESULTS
61
-0.4
-0.2
0.0
0.2
0.4
200 400 600 800 1000 1200 1400
Par
tial D
ep
end
ence
ANNUALPREC
One Predictor Dependence For EMBERIZA_S = 1
-0.2
0.0
0.2
0.4
0.6
100 200 300
Par
tial D
ep
end
ence
MAX_MONTH
One Predictor Dependence For EMBERIZA_S = 1
-0.2
0.2
0.4
0.6
-100 -50 50 100
Pa
rtia
l De
pe
nd
en
ce
MEAN_TEMP
One Predictor Dependence For EMBERIZA_S = 1
Figure 47 shows a positive correlation over a value of 600 mm precipitation while a precipitation less than 600 mm shows a strongly negative dependence. Figure 48 shows the dependence of the Maximum Temperature of the warmest month whereas the probability of occurrence is strongly positive correlated over 17.5 °C. The mean temperature is strongly positive correlated over 1.25 °C (see figure 49).
Figure 47 Annual precipitation dependence - Figure 48 Maximum temperature dependence - Black-faced Bunting Black-faced Bunting
Figure 49 Annual mean temperature dependence - Black-faced Bunting

62
3.1.2 SPECIES RICHNESS (songbirds)
The map of the predicted Species Richness reveals that the hotspots are mainly located in Central and Northern China as well as in the South of Far Eastern Russia. Furthermore, there are smaller patches up to the North of Far Eastern Russia and interior Alaska. The hotspots in China and Russia encompass big parts of the Manchurian forest complex. Moreover, it becomes clear that the valuable areas are mostly away from areas with a high Human influence Index In contrast to the Human Influence Index the comparison of the Ecosystem functionality Index and the predicted valuable areas shows a high coverage, with the exception of Japan where the high population density might cause a deviation (due to the human impact mentioned before). Because it was not possible to calculate a species Richness Index for the Sampling locations in Alaska, the results for the Alaskan site of the given map have to be treated with care (undersampling). Nevertheless, it indicates that areas with high species richness rather occur in interior Alaska (e.g. as excepted the map reflects that the tundra along the coastline features less species richness). Table 15 TreeNet variable importance from model Species Richness Index (songbirds)
Figure 50 Gain Curve Species Richness
Variable Score
Coastline 100.00 Aspect 98.55 Annual precipitation 94.26 Min temperature coldest month 82.26 Altitude 81.37 Max temperature warmest month 79.97 Human Influence Index 61.25 Annual mean temperature 60.58 Landcover 49.72 Slope 45.56
0
20
40
60
80
100
0 20 40 60 80 100
% T
arge
t
% Population

3 RESULTS
63
PREDICTED HOTSPOTS OF
SPECIES RICHNESS (SONGBIRDS)
1: 45.000.000

64

3 RESULTS
65
The best predictors are distance to coastline, aspect and annual precipitation. Figure 51 reveals that a high Species Richness Index is strongly connected to areas those are not close to the coastline. The predictor aspect shows a positive correlation above 170 (see figure 52). Figure 53 shows a negative correlation at a value of over 790 mm annual precipitation. Thus, it is to expect that a high species richness (songbirds during fall migration) occurs not very close to coastal areas (e.g. wetlands) in regions with a annual precipitation under 790 mm.
Figure 51 Coastline dependence – Species Richness Figure 52 Aspect dependence – Species Richness
Figure 53 Annual precipitation dependence Species Richness
-10
-5
0
5
10
500000 1000000 1500000
Par
tial D
epe
nden
ce COASTAL_L
One Predictor Dependence For SPECIES_IN
-10
0
10
20
100 200 300 400
Pa
rtial
De
pend
ence
ASPECT
One Predictor Dependence For SPECIES_IN
-10
0
10
20
200 400 600 800 1000 1200 1400
Par
tial D
epe
nde
nce
ANNUALPREC
One Predictor Dependence For SPECIES_IN

66
3.2 STRATEGIC CONSERVATION PLANNING WITH MARXAN
Five scenarios were run to reveal different target solutions. In this view it is to say that different conservation features and planning units result in solutions with very different patterns. Nevertheless, the scenarios are similar in the degree of fragmentation and they share a number of planning units. In the following the reserve solutions for each Scenario are presented. Additionally, the selection frequency, which reveals the irreplacibility of the planning units and visualizes core areas, is given as well. The comparison with the existing reserves illustrates how conservation goals for songbirds are currently covered along the EAAF.
This map represents a simple overlay of all target features (hotspots of the five index species and the Species Richness Index) (see figure 54). Thus, the map gives a short overview of the planning units and the number of targets that would be met in a reserve solution. Planning units with the highest number of met targets occur in Russia and encompass boreal and northern temperate forests. However, the given map does not take into account comprehensiveness, compactness or particular constraints of an efficient reserve solution.
Figure 54 Overlay of all target features (hotspots of the five index species and the Species Richness Index)

3 RESULTS
67
Table 16 Target efficiency scenario 1
Species Target Reserve solution
(%) Pu Pu % of Target EFI (10%) 336 336 100 SpecRich (25%) 392 392 100
Scenario 1 comprises the Species Richness Index of songbirds during autumn migration and the Ecosystem functionality Index. Due to the distribution of the conservation feature the highest compactness of the reserve solution is located in northeast China and southeast Russia. App. 15 % of the given solution is covered by the current reserve system. See next page for the irreplacibility of the planning Units.
RESERVE SOLUTION
Scenario 1: Biodiversity

68
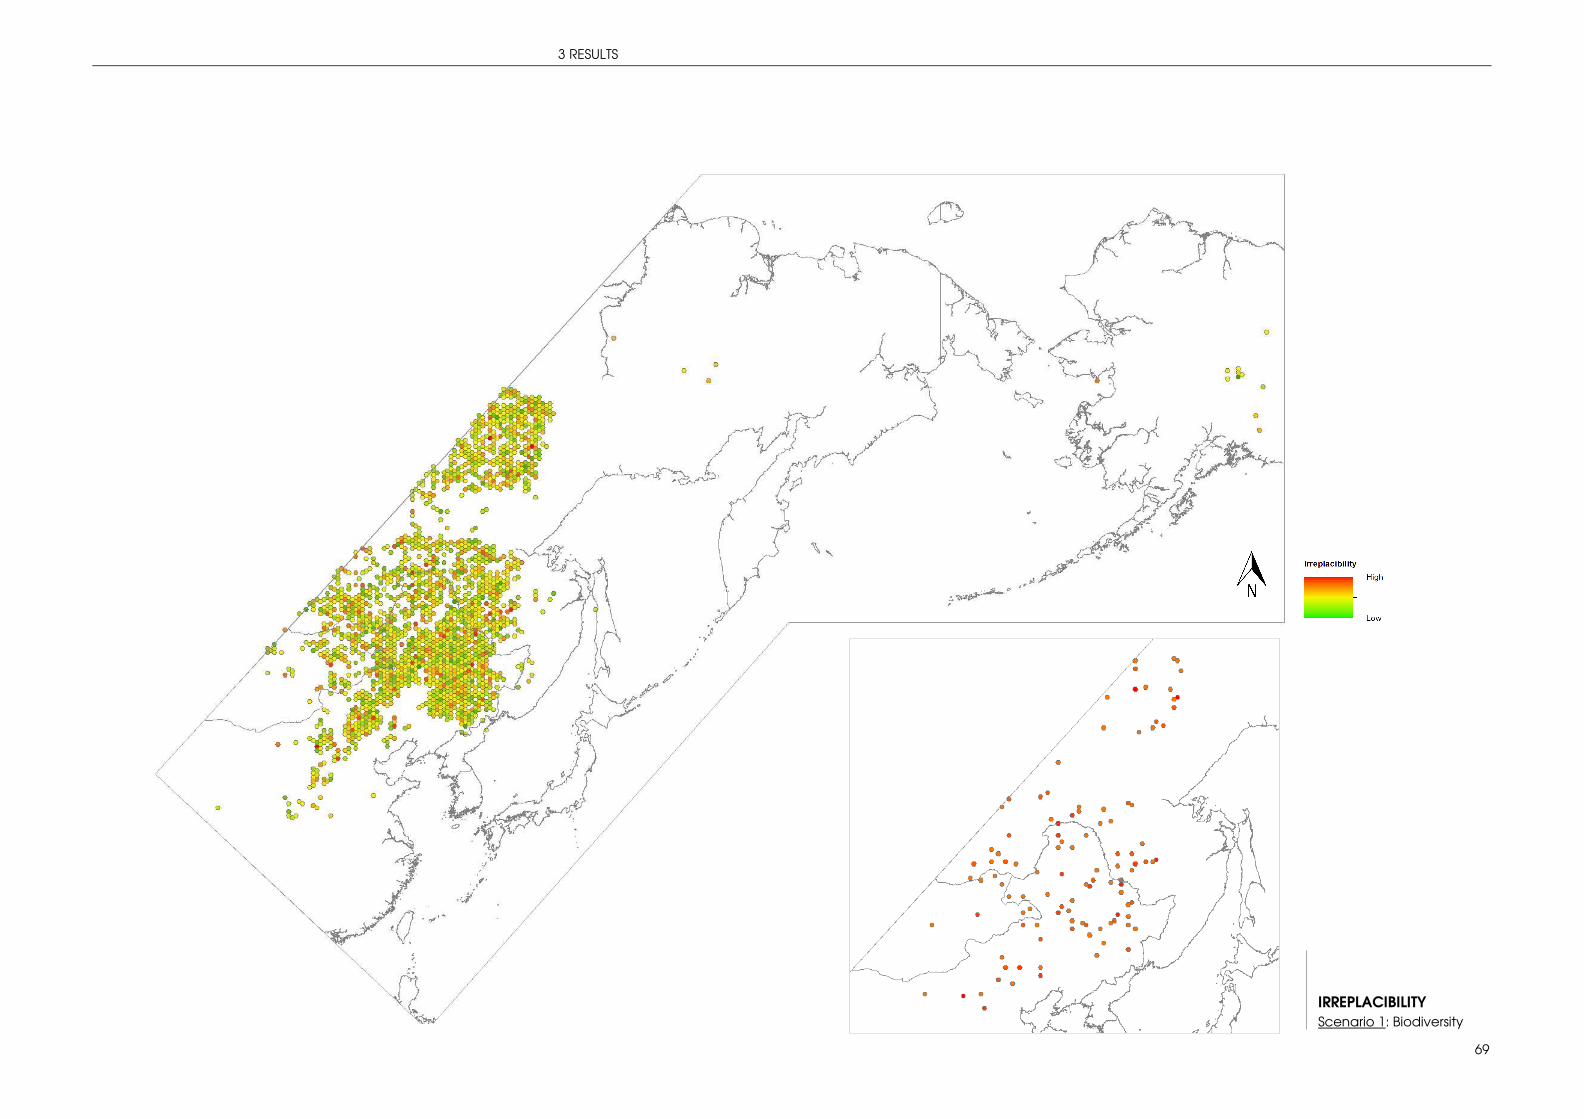
3 RESULTS
69
IRREPLACIBILITY
Scenario 1: Biodiversity
PU with Irreplacibility >= 15

70

3 RESULTS
71
RESERVE SOLUTION
Scenario 2: Boreal species
Table 17 Target efficiency scenario 2
Species Target Reserve solution
(%) & PU PU % of Target
Arctic Warbler (5%) 585 585 100 Bluethroat (10%) 604 604 100 Yellow Wagtail (10%) 436 436 100 Bf Bunting - 18 - Rubythroat - 9 - SpecRich - 34 - Scenario 2 comprises the Hotspots of the
boreal index species Due to the distribution of the conservation feature the highest compactness of the reserve solution is located along the coastline of the Arctic Tundra. App. 31 % of the given solution is covered by the current reserve system. See next page for the irreplacibility of the planning units.

72

3 RESULTS
73
IRREPLACIBILITY
Scenario 2: Boreal species PU with Irreplacibility >=10

74

3 RESULTS
75
Table 18 Target efficiency scenario 3
Species Target Reserve solution
(%) Pu Pu % of Target Arctic Warbler - 8 - Bluethroat - 13 - Yellow Wagtail - 17 - Bf Bunting (10%) 317 317 100 Rubythroat (10%) 209 209 100 SpecRich - 46 -
Scenario 3 comprises the hotspots of the subboreal index species. Due to the distribution of the conservation feature the highest compactness of the reserve solution is located in Japan and along the coastline of eastern China. App. 10 % of the given solution is covered by the current reserve system. See next page for the irreplacibility of the planning units.
RESERVE SOLUTION
Scenario 3: Subboreal species

76

3 RESULTS
77
PU with Irreplacibility >=10
Pu with Irreplacibility >= 10 IRREPLACIBILITY
Scenario 3: Subboreal species

78

3 RESULTS
79
RESERVE SOLUTION
Scenario 4: Boreal and subboreal species + Species Richness Index
Table 19 Target efficiency scenario 4
Species Target Reserve solution
(%) Pu Pu % of Target Arctic Warbler (5%) 585 585 100 Bluethroat (10%) 604 604 100 Yellow Wagtail (10%) 436 436 100 Bf Bunting (10%) 317 317 100 Rubythroat (10%) 209 209 100 SpecRich (10%) 196 196 100
Scenario 4 comprises the Species Richness Index of songbirds during autumn migration and all hotspots of the index species. In general, many small patches are need to achieve the targets. Nevertheless, the highest compactness of the reserve solution is located along the coastline in the arctic tundra and in southeast China. App. 21 % of the given solution is covered by the current reserve system while the solution has an amount of 9.13 % of all planning units. See next page for the irreplacibility of the planning units.

80
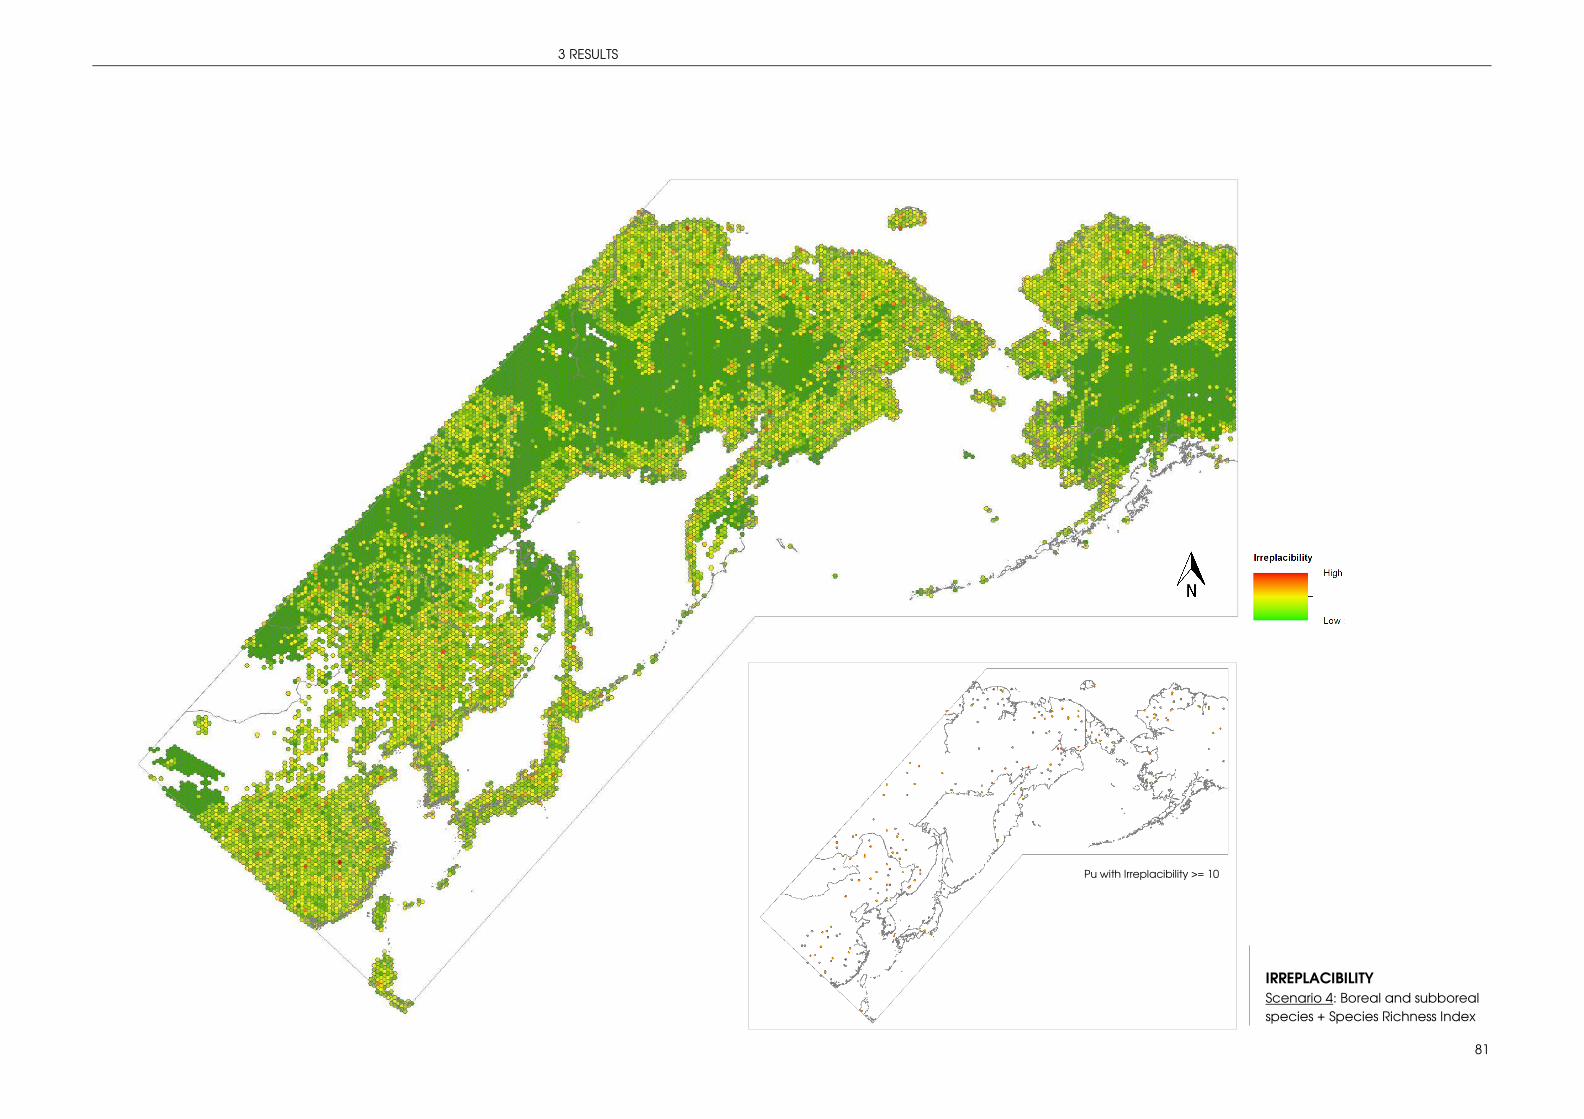
3 RESULTS
81
IRREPLACIBILITY
Scenario 4: Boreal and subboreal species + Species Richness Index
Pu with Irreplacibility >= 10

82

3 RESULTS
83
RESERVE SOLUTION
Scenario 5: All species + Species Richness Index + Vulnerable areas
Table 20 Target efficiency scenario 5
Species Target Reserve solution
(%) Pu Pu % of feature Arctic Warbler (5%) 585 585 100 Bluethroat (10%) 604 604 100 Yellow Wagtail (10%) 436 436 100 Bf Bunting (10%) 317 317 100 Rubythroat (10%) 209 209 100 SpecRich (10%) 196 196 100
Scenario 5 comprises the same conservation features like in scenario 4 but includes the consideration of vulnerable areas as well. Although vulnerable areas were higher weighted there are similar reserve solution patterns like in scenario 4. This indicates that high priority areas for conservation of songbirds often lie in vulnerable areas as well. App. 23 % of the given solution are covered by the current reserve system while the solution has an amount of 6.40 % of all planning units. See next page for the irreplacibility of the planning units.

84

3 RESULTS
85
IRREPLACIBILITY
Scenario 5: All species + Species Richness Index + vulnerable areas
PU with Irreplacibility >= 10

86

4 DISCUSSION
87
4 DISCUSSION
The current protection of migratory songbirds along the East-Asian Australasian Flyway is unsatisfactory. Due to the lack of studies of stopover ecology as well as lacking of direct conservation efforts, overall 35 % of all migratory songbirds along the flyway are endangered. This is the highest overall number of threatened songbirds anywhere in the world. The main assumption that songbirds could use continuous stopover sites (HOUSTON
1998, PETIT 2000) and that they are not restricted to scattered patches might be one reason that the importance of landscape context was so heavily underestimated over the last decades. Moreover, the situation of songbirds along the EAAF is nearly unstudied and hardly any public data exist. The assessment of habitat requirements and the development of a comprehensive strategy for migratory birds is a difficult task because of the spatial scale coupled with the complexity of migration and the variety of habitats the migrants encounter during passages (cf. MOORE et al. 1993). This is uniquely different to protecting breeding and wintering habitats (MOORE et al. 1993, WATTS & MABEY 1994, MOORE et al. 1995, PETIT 2000), but this is also poorly done in the flyway. However, independent from the actual determining factors of birds selecting sites for refueling, the actual availability of high-quality stopover sites during the broad-front migration of most of the passerines is one of the crucial factors for the success of migration of birds. Presumably, it is necessary to have a large landscape-scale approach instead of just a few protected hotspots. In general, there is a need for information on songbirds along the EAAF as a basis for further analysis. Because of long-distance migrants and the necessity for international conservation planning, it is crucial to see habitats on a larger scale. This study demonstrates, for the first time for the EAAF, how data on modeling of songbird hotspots during autumn migration can be used to prioritize broad-scale conservation planning over very large areas. 4.1 MAIN RESULTS: PREDICTION OF VALUABLE AREAS FOR MIGRATORY SONGBIRDS
Six models were created by using mistnet data from China, Japan, Far Eastern Russia and Alaska (USA). These were modeled with TreeNet using mist net data and environmental layers. While other studies have resources to comprehensively research results for many decades, yet, the EAAF as a whole provides only a rudimentary data basis for migratory songbirds, and passerines in general. Nevertheless, the given study worked off an outstanding collection of bird banding data, which represent the best available data on migratory songbirds along the flyway to date. From this compilation the best mistnet data of five index species were extracted for modeling hotspots of migratory songbirds. Predicted Hotspots Although the actual occurrence of a species is likely to be affected by many more processes than can be captured in a static species model (MOILANEN et al. 2009: 75) most of the resulting maps show large but differentiated hotspots (mostly along the coastline
88
regions). In view of the assumption that migratory songbirds have continuous stopover possibilities the given results reveal that this should be seen in the context of differential habitat qualities. KITOROV et al. (2007: 2) describe how the landscape context influences many aspects of songbirds during the breeding season, while the actual importance for the stopover ecology of migratory songbirds has received less attention. The situation gets worse when songbirds are crossing an ecological barrier (e.g. sea or desert) and suitable habitats are scarce (cf. CHERNETSOV 2012, cf. Barlein 1988) The differentiated reflection of the subboreal birds as well as of the boreal birds shows that songbirds that have similar breeding ranges have huge large overlaps of predicted hotspots. The predicted hotspots of the southern species mostly occur outside the breeding range, while the comparison of the breeding range of northern species with its prediction during fall migrations shows a high overlap. However, the characteristics of the most important environmental predictors show positive correlations for typical habitat characteristics of breeding grounds (see 3.1). This fact could indicate that songbirds have similar habitat preferences during migration as during the breeding season. Recent studies reveal that general patterns of habitat use during migration corresponded most closely to patterns of habitat use during the breeding season (PETIT
2000). This could mean that guidelines developed for conservation of songbirds during the breeding season would be also useful for conservation planning during parts of migration and post-breeding dispersal. Nevertheless, other studies describe that species were more variable in their use of habitats during migration than during breeding season. There is a substantial variation in the use of habitats at different locations along migration routes and between spring and fall migration periods. Although the given results are positively correlated to typical habitat characteristics the large expansion of the areas with a high index of occurrence also reveal such variability. A modeling based on data of the breeding season could show more differentiated patches. Due to the common view that the Species Richness is highest in forest habitats, predicted hotspots of the ‘Species Richness Index’ mostly cover the Manchurian forest complex in northern China and southeast Russia. This is a forest complex, which is also stated by BIRDLIFE INTERNATIONAL (2003) to act as key habitat of threatened birds in Asia (see appendix 3) as well as being a priority area for biodiversity conservation in RFE (cf. DARMAN et al. 2003: 71). Migration routes and strategies The predicted hotspots have to be seen in the context of the actual used migration routes. In this view, the prediction of southern species mostly covers the areas assumed to be used during the annual migration. Hotspots of the northern species along the migration route (outside of the breeding range) occur only in ‘smaller’ patches. These small patches and their arrangements should especially be considered when focusing on migratory songbird issues. Nevertheless, one must take into account the fact that an area that acts for one population of a species as a breeding ground can already represent a passage for another population of the same species. Details depend on the spatial distribution of a species. Regardless of migration routes of particular (subpopulations the predicted hotspots have to be seen in the context of broad-front migration aspects as well. Thus, the distribution of the areas with a high index of occurrence strongly indicates broad-front migration rather than narrow front migration

1 INTRODUCTION
89
(e.g. especially the models results of Arctic Warbler). In this context, a widely distributed retention and restoration of suitable staging sites for broad-front terrestrial migrants, such as wildlife-friendly field margins, hedgerows, small copses, wetlands and ponds gains much importance (KIRBY 2010: 68). Implications for bird conservation Although endangered species (due to the IUCN Redlist) have not been considered here, the research work presents an approved method for predicting preferential areas of migratory songbirds on the basis of mistnet data. Moreover, regional experts quote Bluethroat and Siberian Rubythroat thoroughly as species of concern for conservation management, for instance. Furthermore, the selected species represent index species for a lot of endangered birds which status along the flyway is unknown, due to the insufficient data basis (especially for tundra species and species of boreal forests). Thus, the pre-cautionary principle must prevail. This lack of information is critical in view of the high human density in the East-Asian region (cf. WILDLIFE CONSERVATION SOCIETY 2005, cf.
MILLENNIUM ECOLOGY ASSESSMENT 2005). Therefore, such results should urgently be considered when determining high priority areas for conservation planning. Moreover, they might be useful in future research such as climate change and Avian Influenza studies. 4.2 SHORTCOMINGS OF PREDICTIVE MODELING OF HOTSPOTS
To identify hotspots through predictive modeling mistnet data from the last 8 years (older data for Alaska) were used. The high accuracy of all models (85 - 94 %) for the flyway provides evidence that mistnet data are a useful instrument for species distribution modeling. One should consider that most attribute data for the species are not even analyzed, yet, e.g. morphometrics. Nevertheless, there are some weaknesses as well. Beside a proportion of birds avoiding mistnets (JENNI et al. 1996) there is a general lack of standard approaches to mistnetting studies (effectiveness of different mistnetting methods) (RALPH & DUNN 2004) (see 1.3 for further disadvantages). In the given research work the most problems occurred concerning the integrity (effort, metrics, number of used mistnets, net type and net manufactures) and a uniform standardization. A further uncertainty occurs by the fact that overlaps of the predicted hotspots during fall migration and the species distribution maps of the breeding grounds could be also caused by the time range used for the modeling. Fall migration is relatively slow and remains for a while as post-dispersal in breeding habitat regions for some of the species we studied. Depending on the location of the breeding ground Yellow Wagtail sometimes starts to migrate late for instance. Although the models show high accuracies they should still used with caution. Due to the given uneven distributed sampling sites modeling the distribution of birds across the entire flyway can lead to the problem of under-sampled regions (cf. WALTHER et al. 2008). There is a lack of information from further countries. Due to the problem of under-sampled regions the model results can often include overestimates because the maps don’t comprise only the realized but also the potential distribution of the species (e.g. shared by sister taxa etc). Hence, the maps

90
reveal areas where a high index of occurrence is predicted but these areas are not necessary part of the major migration route, which is often determined by historical or spatial reasons (the hotspots of Bluethroat and Yellow Wagtail along the northern coast of Russia are an example). Finally, it would be interesting to compare the model results of the given study with other sources (e.g. mapping data from ebird.org). 4.3 MAIN RESULTS: STRATEGIC CONSERVATION PLANNING WITH MARXAN
The results of this study demonstrate how data on predicted migratory songbird hotspots can be used to prioritize broad-scale conservation planning on a wide scale. A comparable technique could be used for further conservation features and would thus represent a more coherent and holistic, thus achieving, approach to conservation. The given reserve designs should be used as a first ‘Top-Down’ approach because it is not able to use the results additive, yet. This might be a weakness but could also be seen as strength. As the issue of migratory songbirds has to be seen in an international context to meet adequately conservation goals, the entire flyway region is an appropriate area for large scale planning. KIRBY et al. (2007) pointed out that efforts to conserve migratory birds in one part of the range are less effective if unaddressed threats are reducing these species' populations and habitats elsewhere, for instance. International collaboration and coordinated action along migration flyways as a whole are thus key elements in any strategy for the conservation of migratory birds (KIRBY et al. 2007). Reserve solutions in context of social and economic aspects In general, many individually scattered habitat patches (of various sizes) were required to meet the conservation goals. So far, the highest compactness of the reserve solutions is located along the northern coast of Russia and in China. The results should also be observed in the context of social and economic aspects. Thus, in view of habitat destruction and overexploitation, especially governmental organizations in Southeast Asia are encouraged to take urgent action. The sensitivity of farmland birds to habitat changes underlines this need. Nevertheless, considering that arctic areas will become more accessible in the near future (e.g. due to climate change) they should not receive less attention (cf. JENSEN
2008: 1). In general, one should keep in mind that the human influence is strongly increasing in coastal regions (cf. GRAY 1997) whereas the vulnerability of coastal areas is present to both natural and human impacts. In view of biodiversity aspects (see Scenario 1) the given results emphasize that the focus of conservation efforts should furthermore be laid around the areas that character is shaped by the Manchurian forest complex and the Amur-Heilong river basin.
Overall, 23.51 % of the landmass of the study area currently has protection status. However, this area makes for one of the worst places for poaching and violations of many laws (HUETTMANN pers. com, May 2013). While unchecked agricultural and industrial development impacts the region’s biodiversity, governmental organizations (e.g. ministry of natural resources in Russia) partially ignore that the environmental conditions

1 INTRODUCTION
91
in Russia have worsened (see MALESHIN 2004, The Farcical Third All-Russian Congress of Nature
Conservation). Moreover, SIMONOV & DAHMER (2008: 79) say that the economic crisis in Russia, driven by a prolonged period of haphazard governmental reforms, has resulted in chaos in the administration of natural resources. Effectiveness of the current protection network The evaluation of the effectiveness of the current protection network and the reserve solution generated by Marxan shows that a relatively low percentage of important sites for the selected migratory songbirds are currently protected (10 - 31 %). This fact is underlined by the number of threatened songbirds along the EEAF and supports the pressure of implementing aspects of migratory songbirds in future conservation planning processes. Moreover, the results show that reaching a particular percentage of conservation areas however does not guarantee an effective protected area system (cf. MARGULES & PRESSEY 2000, cf. SCOTT 2010). For example, 20 percent of Kamchatka is protected, but much of that area consists of volcanoes, rocks and ice while Kamchatka’s most important conifer forests remain largely unprotected (NEWELL 2004: 39). A further upcoming question is how effective the number of existing flyway based conservation instruments are (see appendix 1). Also the efficiency of different types of national and international protection areas should be discussed. They have to be seen in the context of shrinking natural habitats or standards of management for instance (cf. CAREW-REID (ed.) 2002: 52f).
Implications for future conservation planning processes In conclusion, serious conservation efforts must still be taken, especially in areas that are not yet sufficiently represented in the protected area network. Although many songbirds are also dependent upon wetland resources for breeding, wintering and migration (YONG et al. 1998) current efforts of the East-Asian Australasian Flyway Partnership for migratory waterbirds only partially cover songbird conservation goals, for example. The regions which were identified as meeting songbird conservation goals provide a useful starting point for conservation practitioners and resource managers in prioritizing new core areas for conservation in the East-Asian Australasian region. It would be useful implementing these results in the work of a number of already existing partnerships, working groups as well as national and international agreements.
Because understanding socio-economic conditions is important for developing an effective conservation strategy (SIMONOV & DAHMER 2008: 75) reserve solutions should be thereby part of a broader conservation planning process centered on a stakeholder-developed implementation strategy (SMITH et al. 2009).
4.4 SHORTCOMINGS OF STRATEGIC CONSERVATION PLANNING WITH MARXAN
This study provides a first approach for ‘Strategic Conservation Planning’ in the East-Asian region. Marxan provides a possibility for handling a large amount of data and it provides flexibility through the variety of options while ensuring repeatability and transparency.

92
Nevertheless, the software comprises some disadvantages, too (see for review BAN in
ARDRON et al 2010). Beside an insufficient guidance for adjusting settings also preparing the input files, interpreting results, the user interface and/or the opacity how parameters interact had often lead to problems. Thus, the correct formatting of the ‘input files’ took a few weeks, for example. Metadata are hard to come by, and it appears that the computational basis structure of Marxan was never really improved from earlier versions (HUETTMANN, pers. com. May, 2013). Moreover, the identification of conservation areas based on systematic reserve-selection algorithms is riddled with uncertainties. Before Marxan is able to run scenarios it needs information on spatial distribution of conservation features as well as target settings. Thereby the mostly subjective targets as well as the selection of priority areas of the conservation features (classification) and weightings may affect the distribution and number of sites considered priorities for conservation within the planning area. Especially for assigning weights and setting representative targets no objective method exists to date. Thus, large differences in the distribution of conservation features can lead to the issue that a few conservation features can begin to dominate the solutions generated by Marxan for instance (ARDRON et al. 2010: 89). The only way to defeat such dominations is to run Marxan several times with different settings (costs, penalties, targets) and for finding the best settings. In this context, even in the Marxan good practice Handbook it is written that ‘Setting targets in Marxan is as much an art as a science’ (NICOLSON et al. in ARDRON et al. 2010: 117). Marxan results in context of the spatial scale Strength but simultaneously weakness is that the results generated by Marxan have to be seen as ‘Top-Down’ approach and doesn’t represent one-stop solutions. There is no single best solution but only several nearly optimal solutions which ever have to be seen as a whole (because of the replacability of planning units for instance). In general, beside the run with the ‘single best solution’ there may be several other runs that are virtually as good, for instance (ARDRON et al. 2010: 105). Some ecologists have recognized that especially migration issues cannot be solved on a regional scale and have to be implemented in broad-scale analyses (cf. OSTROM et al.
2011, cf. YOUNG 1998, cf. KIRBY et al. 2008). This makes sense in a theoretical framework but leads to problems in view of the fact that conservation planning and implementation unfortunately usually occur at a regional level (PEARCE et al. 2008). Furthermore, the situation gets worse in the view of the constraints given by the global framework of economy and its institutions (cf. DALY &
TOWNSEND 1993, cf. MACE et al. 1998). Moreover, studies on different scale efficiencies illustrate that selection of sites for inclusion in a reserve network is highly scale-dependent and that different spatial extents may introduce inefficiencies or redundancies in selecting representative protected areas (larger regional extent requires fewer protected areas to meet conservation targets) (WIERSMA 2007). Because any selected set of sites (of the reserve solution) is only one of many possible sets (which also leads to a low congruence on different spatial scales) the given reserve design solutions must be considered with caution (cf. WARMAN et al. 2004).

1 INTRODUCTION
93
While the replacability of planning units results into issues on a broad scale this flexibility could be also seen as an advantage. Thus, stakeholders are able to use the flexibility of the ‘Marxan’ analysis to compare and contrast several conservation options that may address their inherent concerns while meeting ecological objectives (NICOLSON et al. in ARDRON et al. 2010). Moreover, the identification of the irreplacibility of planning units reveals core areas, which are also suitable on regional scales. Eventually, any more area protected must be seen as progress still. Holistic conservation planning In general, it is to consider that the selected Index species in the given study only represent a subset of further species required to meet avian conservation goals. Thus, it is necessary to identify further conservation feature to gain a more holistic and coherent approach. Nevertheless, a clear, consistent and comparable technique could be used for more conservation features. Therefore this study should be seen as starting point for further planning processes. Unfortunately the designation of a protection network will never represent a holistic stand-alone conservation strategy. Due to the broad-front migration of migratory passerines, conservation strategies should additionally take into account appropriate and feasible land management policies, which result in measurements that favour dispersals. Declines in broad - front migrants may be due to wholesale loss or deterioration of farmed, grazed and forest habitats (GALBRAITH 2011: 27). Thus, broad-front migrations will benefit from modifications to extensive land-use (agriculture or forestry practice), for instance (KIRBY 2010: 68). The Convention of Migratory Species pointed out that synergies are needed to develop through scaled up collaborations and to address the drivers of change, with the Convention of Biological Biodiversity and other UN institutions, especially with the Food and Agriculture Organisation (FAO) (GALBRAITH 2011:
28). Presumably, The World Trade Organisation (WTO) and The World Bank, and Asian Bank for Development are to be included, also. 4.5 SUGGESTIONS FOR FUTURE RESEARCH & MANAGEMENT RECOMMENDATIONS
Because of the complexity of ecological processes new developments in all planning stages will progressively reduce, but presumably never eliminate, uncertainties like mentioned above. According to the identified shortcomings of Marxan, the priority areas identified require finer-scale assessments to guide conservation action at the local scale (cf. COWLING et al.
2004: 2). Therefore, the reserve solutions have to ‘step-down’ to smaller manageable landscapes (LANDBIRD STRATEGY COMMITTEE MISSISSIPPI RIVER 2010). As mentioned before, there is a need to identify further conservation features to develop a more holistic and coherent approach. It is necessary to expand the research on migratory songbirds (stopover ecology) along the EEAF on the one hand and to improve collaborations and open data access (exchanges) on the other hand. The status of migratory landbirds (birds of forests and

94
agriculture/grasslands) in Asia, which are believed to be in decline need urgent monitoring data (GALBRAITH 2011: 39). Climate Change Not least conservation issues (especially designating protection areas) should be seen in context of future climate change challenges (see for example MURPHY et al. 2010). A major limitation of a lot of existing approaches is that they remain essential static (POSSINGHAM et al. 2000). Climate change models predict considerable regional variation. This will have different effects on migrating species due to variation in migratory routes and/or spatial variation of species-specific and even population-specific stopover sites (BARLEIN & SCHAUB 2009). In general, there might be also drifts of species distributions when they cannot adapt to climate change and have to move into new areas to survive. Hence, an increase of competition between migratory and non-migratory species is to expect (KIRBY et al. 2008) whereas there is currently little known about migratory species capacity for adaption to climate change (KIRBY 2010: 8). To understand the species-climate interactions better, intensive monitoring and research is needed (ib.). It is important to identify major stopover regions and habitats to understand the consequences of climate change on migratory landbirds, for instance (BARLEIN & SCHAUB
2009, see also MØLLER et al 2004, cf. JONZÉN et al. 2007). Already existing predictive climate change models should be used to reveal different future scenarios of bird distribution changes as well (see for comparison MURPHY et al. 2010.) In context of climate change also the change in human access to the arctic is to be considered (Arctic transport system change) (cf. ARCTIC COUNCIL 2013, cf. COLLINS et al. 2013). Some routes are projected to become fully accessible from July – September (STEPHENSON
et al. 2011: 1, cf. COLLINS et al. 2013: 5). Hence, an expansion of arctic shipping in the near future is to be expected, for instance (JENSON 2008: 1, cf. COLLINS et al. 2013). This finding indicates a probable expansion of habitat degradation in these areas and the need of an adequate sustainable conservation management to achieve under these challenges (cf. HUETTMANN 2012). Avian Influenza Due to the fact migratory birds act as a vector for the distribution of the Avian Influenza virus (H5N1 etc.) any studies on bird migration gain much more importance. In this context, there is a particularly need to find out in which way migratory birds can transmit the virus along migratory routes and to what extent this actually happens. This requires further investigations of staging sites and actual used migration routes for all species of EEAF. Economic growth Many parts of Asia are likely to continue to develop rapidly, with improved infrastructure (and political change) allowing development in areas that are currently inaccessible, e.g. parts of eastern Russia, Mongolia, Kuril Islands (BIRDLIFE INTERNATIONAL 2013). Resources are used for home production as well as for global export. Regional demand for timber is likely to remain high, and for pulp and paper to increase, in part because of the expanding Chinese and Indian economies. Pressure, including illegal logging, is likely to increase on the extensive remaining forests in eastern Russia

1 INTRODUCTION
95
(BIRDLIFE INTERNATIONAL 2013). At the coast future offshore development poses a threat, especially where birds migrate coastal (KIRBY 2010: 53).
A Meta Analysis of RESÉNDIZ (2012) revealed that economic growth is related to declining bird populations. Thus, stopping declines in bird species requires addressing human induced changes caused by economic growth. This must be seen as a real challenge when considering that economic factors most significantly influence decision making processes. In this context, there is a general need for rethinking. During the last years two hardened fronts arose. On one site economists who marginalize the environment and social needs espousing the need for economy growth and then the advocate for a steady state economy on the other site. ‘Steady state economy’ is described as an economy with relative stable, mildly fluctuating product of population and per capita consumption (stable size) (CZECH & DALY 2004). Due to the inherent conflicts between economic growth and wildlife conservation on a finite space it represents a sustainable alternative to economic growth (see HUETTMANN & CZECH 2006). Even when the realization - that we live in an infinite world - will take further years/decades, the conflicts between economic growth and conservation issues as well as the impacts should not been ignored but better illustrated discussed and resolved. For this reason there is a need to give an overview of the current situation, conservation efforts (organizations, agreements) and in a further step to investigate how management of birds in Asia, Alaska and the Pacific Rim is actually done.

4 DISCUSSION
96

5 CONCLUSION
97
5 CONCLUSION
Overall conclusions: Modeling of valuable areas for migratory songbirds � The model results represent first predictive maps of hotspots of migratory
songbirds along the East-Asian Australasian Flyway using mistnet data and machine learning.
� Geo-referenced mistnet data is a suitable basic tool for determination of
hotspots through species distribution modeling in a machine-learning framework.
� The prepared compilation provides an outstanding basis for further analyses. � Characters of hotspots are connected with the habitat preferences of
songbirds during the breeding season, whereas the large extensions of areas with a high index of occurrence indicate a higher variability during fall migration and broad-front migration as well. In conclusion, continuous stopover possibilities have to be seen in context of the respective habitat quality and the availability of suitable staging sites.
Strategic Conservation Management � The currently protected network only covers a low percentage of important
areas for migratory songbirds. � Marxan is an effective tool for a first approach to strategic conservation on a
large scale and basis for subsequently consistent conservation planning processes. Nevertheless, there is a need to implement further conservation features for a more holistic and coherent approach and for more advanced assessments.
� Especially in Southeast Asia where a high level of human expansion (habitat
loss) and degradation poses a threat to important stopover sites for migratory birds, an urgent need to take action exists.
� In terms of broad-front migration of migratory passerines, there is also a need for
appropriate land management policies. Even though there is a lack of certainty around the model results and the presented reserve design solution, the data used in this study represent the best available information to date. Due to the status of threat of a number of migratory songbirds, it is important to act now instead of using the uncertainty of results as an excuse for inaction.

5 CONCLUSION
98

5 CONCLUSION
99
Declaration of independent work
I declare that I have independently written the work presented here, and I have not used any help other than from the stated sources and resources.
date, place of submission signature of the author

5 CONCLUSION
100

REFERENCES
101
REFERENCES
ALERSTAM T., LINDSTRÖM, Å. 1990: Optimal bird migration: the relative importance of time, energy,and safety. In: GWINNER E. (ed.) 1990: Bird migration. Springer, Berlin
APROPOS INFORMATION SYSTEMS INC. (ed.) 2013: QMarxan 1.0.7 (Plugin for QGIS). Retrieved May 15, 2013 from http://plugins.qgis.org/plugins/Qmarxan/
ARCTIC COUNCIL (ed.) 2013: Arctic Resilience Interim Report 2013. Stockholm Environment Institute and the Stockholm Resilience Centre
ARDRON, J. A., POSSINGHAM, H.P. & KLEIN, C.J. (eds.) 2010: Marxan good practices handbook, Version 2. Pacific Marine Analysis and Research Association, Victoria, B.C.
BADYAEV, A. V., KESSEL, B. & GIBSON, D. D. 1998: Yellow Wagtail (Motacilla tschutschensis), The Birds of North America Online (A. Poole, Ed.). Ithaca: Cornell Lab of Ornithology. Retrieved April 26, 2013, from the Birds of North America Online: http://bna.birds.cornell.edu/bna/species/382doi:10.2173/bna.382
BAIRLEIN F. 1983: Habitat selection and associations of species in European passerine birds during southward, post-breeding migrations. Ornis Scand 14: 239 – 245
BARLEIN, F. 1988: How do migratory songbirds cross the Sahara?. In: Trends in Ecology & Evolution. Volume 3, Issue 8: 191–194
BAIRLEIN, F., ALSTRÖM, P., AYMÍ, R., CLEMENT, P., DYRCZ, A., GARGALLO, G., HAWKINS, F., MADGE, S., PEARSON, D. & SVENSSON, L. 2006: Family Sylviidae (Warblers). In: DEL HOYO, J., ELLIOTT, A., CHRISTIE, D. A (ed.) 2006: Handbook of the Birds of the World. Volume 12: 492-709
BARLEIN, F. & SCHAUB, M. 2009: Ringing and the study of mechanism of migration. In: Ringing & Migration 24: 162-168.
BALL, I. & POSSINGHAM, H. 2000: Marxan (v.1.8.2): Marine Reserver Design using Spatially Explicit Annealing. Retrieved, April 26, 2013, from http://www.marineplanning.org/pdf/marxan_manual_1_8_2.pdf
BALL, I. R., POSSINGHAM, H. P., & WATTS, M. 2009. Marxan and relatives: Software for spatial conservation prioritisation. In: MOILANEN, A., WILSON, K. A. & POSSINGHAM, H. P. (eds.) 2009: Spatial conservation prioritisation: Quantitative methods and computational tools. Chapter 14: 185-195. Oxford University Press, Oxford, UK
BAN, N. C. 2010: Results of Marxan User Survey. In: ARDRON, J.A., H.P. POSSINGHAM & C.J. KLEIN (eds.) 2010: Marxan good practices handbook, Version 2. Pacific Marine Analysis and Research Association, Victoria, B.C
BANKS, R.C., CICERO, C., DUNN, J. L., KRATTER, A. W., RASMUSSEN, P.C., REMSEN, J. V., RISING, J. D. & STOTZ, D. F. 2004: Fourty-Fifth Supplement to the American Ornithologists Union – Checklist of North American birds. In: The Auk 121 (3): 985-995
BIRDLIFE INTERNATIONAL (ed.) 2003: Saving Asia’s Threatened Birds - a Guide for Government and Civil Society. Retrieved, May 20, 2013, from http://www.birdlife.org/action/science/species/asia_strategy/downloads.html

102
BIRDLIFE INTERNATIONAL (ed.) 2012. Luscinia svecica. In: IUCN 2012. IUCN Red List of Threatened Species. Version 2012.2. Retrieved, April 10, 2013 from www.iucnredlist.org
BIRDLIFE INTERNATIONAL AND NATURESERVE (ed.) 2012: Bird species distribution maps of the world. Available on request: http://www.birdlife.org/datazone/info/spcdownload
BIRDLIFE INTERNATIONAL (ed.) 2013: East Asia/Australasia Flyway. Retrieved, March 24, 2013, from http://www.birdlife.org/datazone/userfiles/file/sowb/flyways/8_East_Asia_Australasia_Factsheetpdf
BOERE, G.C. & STROUD, D.A. 2006: The flyway concept: what it is and what it isn’t. In: BOERE, G. C., GALBRAITH, C. A. & STROUD, D. A. (eds.): Waterbirds Around the World. 40-47. The Stationery Office, Edinburgh, UK
BOERE, G.C. & DODMAN, T. 2013: Module 1: Understanding the Flyway Approach to Conservation. Retrieved, May 13, 2013 from http://wow.wetlands.org/LinkClick.aspx?fileticket=%2B%2B4YtjlpxlY%3D&tabid=1688&mid=6756&language=en-US
BRAZIL, M. A. 1991: The Birds of Japan. The bath press, Oxford
BRAZIL, M. A. 2009: Birds of East Asia. Eastern china, Taiwan, Korea, Japan, Eastern
Russia. reprint. PRINCETON University Press, London
BUSSE, P. 2001: European passerine migration system. What is known and what is lacking. In: Ring 23 (1-2): 3 - 36
CAREW-REID, J. (ed.) 2002: Biodiversity Planning in Asia. IUCN, Gland Switzerland. Retrieved, 25 Jun, 2013, from http://www.icem.com.au/documents/biodiversity/bioplan/china.pdf
CARWARDINE, J., ROCHESTER, W.A., RICHARDSON, K.S., WILLIAMS, K.J., PRESSEY, R.L. 2007:
Conservation planning with irreplaceability: does the method matter?. In: Biodiversity and Conservation 16: 245–258
CATRY, P., ENCARNCAO, V., ARAÚJO, A., FEARON, P., FEARON, A., ARMELIN, M. & DELALOYLE, P. 2004: Are long-distance migrant passerines faithful to their stopover sites?. In: Journal of Avian Biology 35: 170-181.
CENTRAL INTELLIGENCE AGENCY (CIA) (ed.) 2013: The World Factbook. Retrieved, April 8, 2013, from https://www.cia.gov/library/publications/the-world-factbook/geos/ch.html
CHERNETSOV, N. 2012: Passerine migration. Stopovers and flight. Springer eBook.
CHERNETSOV, N. 1998: Habitat distribution during the post-breeding and post-fledging period in the reed warbler Acrocephalus scirpaceus and sedge warbler A. schoenobaenus depends on food abundance. In: Ornis Svecica 8: 77–82
CMS FLYWAY SCIENTIFIC COUNCIL WORKING GROUP (ed.) 2010: A review of CMS and non-CMS existing administrative/ management instruments for migratory birds globally.

1 INTRODUCTION
103
Retrieved March 26, 2013 from http://www.cms.int/bodies/ScC/global_flyways_wg/review1.pdf
COLLINS, J.F., SFRAGA, M., VIRGINIA, R.A. & YALOWITZ, K.S. 2013: A Euro-Atlantic Action Plan for Cooperation and Enhanced Arctic Security – Conference Report and Recommendations to the Arctic Council and interests parties. Retrieved, May 7, 2013, from http://carnegieendowment.org/files/UArctic_report_full.pdf
CRAMP, S. & BROOKS, J. (eds): The birds of the Western Palearctic. Volume 6 1992: 536-548. Oxford University Press, London, UK
COWLING, R.M., KNIGHT, A.T., FAITH, D.P., FERRIER, S., LOMBARD, A.T., DRIVER, A. & ROUGET, M. 2004: Nature conservation requires more than a passion for species. In: Conservation Biology 18: 1674 - 1676
CZECH, B. & DALI, H.E. 2004: In My Opinion: The steady state economy—what it is, entails, and connotes. In: Wildlife Society Bulletin 2004, 32(2): 598 – 605
DARMAN, Y., KARAKIN, V., MARTYNENKO, A. & WILLIAMS, L. 2003: Conservation Action Plan for the Russian Far East Ecoregion Complex. Part 1. Retrieved, April 12, 2013, from http://www.wwf.ru/resources/publ/book/eng/47
DEPARTMENT OF LABOR AND WORKFORCE DEVELOPMENT (STATE OF ALASKA) (ed.) 2013: Research and Analysis - Alaska Local and Regional Information. Retrieved, May 27, 2013, from http://live.laborstats.alaska.gov/alari/details.cfm?yr=2011&dst=01&dst=03&dst=04&dst=02&dst=06&dst=09&dst=07&r=0&b=0&p=0
DIERSCHKE, V. 2003: Predation hazard during migratory stopover: are light or heavy birds under risk?. In: J Avian Biol 24: 24–29
DUNN, E. H. & RALPH, C. J. 2004: Use of mistnets as a tool for bird population monitoring. In: Studies in Avian Biology 29: 1-9
DUNN, E. H., HUSSEL, D.J.T. & ADAMS, R.J. 1997: Monitoring songbird population change with autumn mistnetting. In: Journal of Wildlife Management 61: 389-396.
EEAFP (ed.) 2013: East-Asian Australasian Flyway Partnership - Information Brochure. Retrieved, Jun 2, 2013, from http://www.eaaflyway.net/documents/publications/2013_EAAFP_Brochure.pdf
EFFORD, M. & DAWSON, D. 2013: Incomplete counts: standardised mist netting. In: Bird inventory and Monitoring. Department of Conservation Te Papa Atawhai. New Zealand. Retrieved Jun 19, 2013 from http://www.doc.govt.nz/publications/science-and-technical/doc-procedures-and-sops/biodiversity-inventory-and-monitoring/birds/
ESA (ed.) 2010: Globcover 2009 (Global Land Cover Map). Retrieved, March 12, 2013, from Due.esrin.esa.int/globcover
FEDERAL STAT STATISTICS SERVICE (RUSSIAN FEDERATION): Russian Census. Retrieved, April 26, 2013, from http://www.perepis2002.ru/index.html?id=87
ELITH, J. & LEATHWICK, J.R. 2009: Species Distribution Models: Ecological Explanation and Prediction Across Space and Time. In: Annu. Rev. Ecol. Evol. Syst. 40: 677-697

104
EXXON NEFTEGAS LTD. (ed.) : Sakhalin 1- Project Operator. Retrieved Jun 17, 2013, from http://www.sakhalin-1.com/Sakhalin/Russia-English/Upstream/default.aspx
DALY, H. & TOWNSEND, K. (eds): Valuing the Earth. In: Economics, Ecology, Ethics. Cambridge und London 1993
FLINT, V.E. 1984: A Field Guide to Birds of the USSR. Princeton University Press, Princeton N.J, USA
FREEMARK, K. E., DUNNING, J. B., HEJL, S.J., PROBST, J. R. 1995: A landscape ecology perspective for research, conservation, and management. In: MARTIN, T. E., FINCH D. M. (eds.): Ecology and management of Neotropical migratory birds: a synthesis and review of critical issues. Oxford University Press, NY
FREUDENBERGER, L., HOBSON, P.R., SCHLUCK, M. & IBISCH, P.L. 2012: A global map of the functionality of terrestrial ecosystems. In: Ecological Complexity 12: 13-22.
FULLER, T., SAATCHI, S.S., CURD, E.E., TOFFELMIER, E., THOMASSEN, H.A., BUERMANN, W., DESANTE, D.F., NOTT, M.P., SARACCO, J.F., RALPH, C.J., ALEXANDER, J.D., POLLINGER, J.P. & SMITH, T.B. 2010: Mapping the risk of avian influenza in wild birds in the US. In: BMC Infectious Diseases 2010 (10): 187
GABRIELSON, I. N. & LINCOLN, F. C. 1959: The birds of Alaska. Stackpole Co., Harrisburg, Pa
GALBRAITH, C.A. (ed.) 2011: CMS Scientific Council Reviews. Policy options for migratory birds flyways - Review 3. Retrieved, May 2, 2013, from http://www.cms.int/bodies/ScC/global_flyways_wg/review3%20final.pdf
GAME, E. T. & GRANTHAM, H. S. 2008: Marxan User Manual: For Marxan version 1.8.10. University of Queensland, St. Lucia, Queensland, Australia, and Pacific
GAO, M.D., CAO, HU, Y., FENG, WANG, D., HU, W., CHEN, JIE & QUI 2013: Human Infection with a Novel Avian-Origin Influenza A (H7N9) Virus. In: The new england journal of medicine
GILL, F. B. 2007: Ornithology. Third Edition. W.H. Freeman and Company, New York
GRAY, J. S. 1997: Marine biodiversity: patterns, threats and conservation needs. In: Biodiversity and Conservation 6: 153-175
GUISAN, A. & ZIMMERMANN, N. E. 2000: Predictive habitat distribution models in ecology. In: Ecological Modelling 135: 147-186.
GUZY, M. J. & MCCAFFERY, B. J. 2002: Bluethroat (Luscinia svecica), The Birds of North America Online (A. Poole, Ed.). Ithaca: Cornell Lab of Ornithology. Retrieved April 26, 2013, from the Birds of North America Online: http://bna.birds.cornell.edu/bna/species/670
HEDENSTRÖM, A. & ALERSTAM, T. (1997) Optimal fuel loads in migratory birds: distinguishing between time and energy minimization. In: Journal of Theoretical Biology 189: 227–234.
HERRICK, K., HUETTMANN, F., LINDGREN, M. A. 2013: A global model of avian influenza prediction in wild birds: the importance of northern regions. In: Veterinary Research 2013 (44): 42
1 INTRODUCTION
105
HOUSTON, A. I. 1998. Models of optimal avian migration: State, time and predation. In: J. Avian Biol. 29: 395–404.
HUETTMANN, F. & CZECH, B. 2006: The steady state economy for global shorebird and habitat conservation. In: Endangered Species Research, 2006, Vol. 2: 89–92
HUETTMANN, F. 2012: Protection of the Three Poles. Springer Verlag, Japan.
HUTTO R. L. 1985a: Seasonal changes in the habitat distribution of transient insectivorous birds in south-eastern Arizona: competition mediated?. In: Auk 102: 120–132
HUTTO R. L. 1985b: Habitat selection by nonbreeding, migratory land birds. In: CODY M.L. (ed.) 1985: Habitat selection in birds. Academic Press, NY
JENNI, L., LEUNBERGER, M., & RAMPAZZI, F. 1996: Capture efficiency of mistnets with comments on their role in the assessment of passerine habitat use. In: Journal of Field Ornithology 67: 263-274.
JENSEN, Ø., 2008: Arctic shipping guidelines: towards a legal regime for navigation safety and environmental protection? In: Polar Record, 2008, 44 (229): 107–114. UK
JIP, C. 2012: Sustainable development in the Korean Peninsula. Retrieved May 23, 2013, from http://www.nyu.edu/classes/keefer/EvergreenEnergy/chunjip.pdf
JONZÉN, N., ERGON, T., LINDÉN, A. & STENSETH, N.C. (2007) Bird migration and climate. In: CR special 17. Climate Research 35: 1–180.
KESSEL, B. 1998. Habitat characteristics of some passerine birds in western North American taiga. In: University of Alaska Press, Fairbanks, AK
KIM, S. 2001: Integration of Biodiversity and Tourism: Korean Case Study - For UNEP’s Biodiversity Planning Support Programme. Retrieved, Jun 2, 2013, from https://www.cbd.int/doc/nbsap/tourism/Korea%28Tourism%29.pdf
KIRBY, J. (ed) 2010: Review 2: Review of Current Knowledge of Bird Flyways, Principal Knowledge Gaps and Conservation Priorities. In: CMS Scientific Council: Flyway Working Group Reviews. UNEP/CMS/ScC16/Doc.10 Annex 2b
KIRBY, J. S., STATTERSFIELD, A. J., BUTCHART, S. H. M., EVANS, M. I., GRIMMETT, R. F. A., JONES, V. R., O’SULLIVAN, J., TUCKER, G. M. & NEWTON, I. 2008. Key conservation issues for migratory land- and waterbird species on the world’s major flyways. In: Bird Conservation International, 2008 (18): 49–73
KITOROV, P., BARLEIN, F. & DUBININ, M. 2007: The importance of landscape context for songbirds on migration: body mass gain is related to habitat cover. In: Landscape Ecology, 2008 (23): 169–179
KNYSTAUTAS, A. 1993: Birds of Russia. HarperCollins Publishers, Hong Kong
LANK, D., YDENBERG, R. 2003: Death and danger at migratory stopovers: problems with ‘predation risk’. In: J Avian Biol (34): 225–228
LAM, T. TY., IP, H. S., GHEDIN, E., WENTWORTH, D. E., HALPIN, R. A., STOCKWELL, T. B., SPIRO, D. J., DUSEK, R. J., BORTNER, J. B., HOSKINS, J., BALES, B. D., YPARRAGUIRRE D. R. & HOLMES, E. C. 2012:
106
Migratory flyway and geographical distance are barriers to the gene flow of influenza virus among North American birds. In: Ecology Letters (15): 24-33.
LOWTHER, P. E. & SHARBAUGH, S. 2008: Arctic Warbler (Phylloscopus borealis), The Birds of North America Online (A. Poole, Ed.). Ithaca: Cornell Lab of Ornithology; Retrieved from the Birds of North America Online: http://bna.birds.cornell.edu/bna/species/590doi:10.2173/bna.590
MACE, G. M., BALMFORD A., & GINSBERG, J. R. (eds.) 1998: Conservation in a Changing World. Cambridge University Press, Cambridge, UK
MALESHIN, N. 2004: The Farcical Third All-Russian Congress of Nature Conservation. In: Russian Conservation News (34): 2-3.
MARGULES C. R., & Pressey, R. L. 2000: Systematic conservation planning. In: Nature (405): 243-253
MARSHAL EDITIONS (ed.) 2007: The Atlas of Bird Migration. Struk Publishers, South Africa
MARTIN T.E. & KARR, J.R. 1986: Patch utilization by migrating birds: resource oriented?. In: Ornis Scand (17): 165–174
MACKINNON, J., VERKUIL, Y. I. & MURRAY, N. 2012. IUCN situation analysis on East and Southeast Asianintertidal habitats, with particular reference to the Yellow Sea (including the Bohai Sea). In: Occasional Paper of the IUCN Species Survival Commission No. 47. IUCN, Gland, Switzerland and Cambridge, UK
MELVILLE, D. S. & SHORTRIDGE, K.F. 2006: Spread of H5N1 avian influenza virus: an ecological conundrum. In: Letters in Applied Microbiology (42): 435–437
MEYER DE SCHAUENSEE, R. 1984: The Birds of China. Oxford University Press, 1984
MILLENNIUM ECOSYSTEM ASSESSMENT (ed.) 2005: Millennium Ecosystem Assessment Synthesis Reports. Retrieved, Jun 17, 2013, from http://matagalatlante.org/nobre/down/MAgeneralSynthesisFinalDraft.pdf
MOILANEN, A., WILSON, K. A. & POSSINGHAM, H. P. 2009: Spatial Conservation Prioritization. Quantitative Methods and Computational Tools. Oxford University Press Inc., New York.
MOILANEN, A. & KUJALA, H. 2006: Zonation spatial conservation planning framework and software v. 1.0. User manual. Edita, Helsinki, Finland
MOORE, F. R., GAUTHREAUX, S. A., KERLINGER, P., & SIMONS, T. R. 1993: Stopover habitat: Management implications and guidelines. In: FINCH, D. M. & STANGEL, P. W. (eds.): Status and management of neotropical migratory birds. 58-69. General Technical Report RM-229. Fort Collins, CO: Rocky Mountain Research Station, Forest Service, U.S. Department of Agriculture
MOORE, F. R., GAUTHREAUX, S. A., KERLINGER, P. & T. R. SIMONS 1995: Habitat requirements during migration: Important link in conservation. In: Martin T. E. & Finch, D. M. (eds.): Ecology and management of neotropical migratory birds: A synthesis and review of critical issues. 121-144. Oxford University Press, NY

1 INTRODUCTION
107
MOORE R. F., WOODREY, M.S., BULER, J.J., WOLTMANN, S. & SIMONS T.R. 2005: Understanding the stopover of migratory birds: A Scale Dependent Approach. Retrieved March 26. 2013, from http://www.fs.fed.us/psw/publications/documents/psw_gtr191/Asilomar/pdfs/684-689.pdf
MØLLER, A. P., FIEDLER, W. & BERTHOLD, P. 2004: Birds and climate change. In: Advances in Ecological Research (35). Elsevier, Amsterdam
MUNSTER, V. J. & FOUCHIER, R.A.M. 2009: Avian influenza virus: Of virus and bird ecology. In: Vaccine (27): 6340-6344
MURPHY, K., HUETTMANN, F., FRESCO, N. & MORTON, J. 2010: Connecting Alaska Landscapes into the future. Results from an interagency climate modeling, land management and conservation project. Final Report. University of Fairbanks, Alaska
NATURE SERVE (ed.) 2013: NatureServe Vista 2.6. Retrieved Jun 2, 2013, from http://www.natureserve.org/prodServices/vista/trial.jsp.
NEBEL, S. 2007: Differential migration of shorebirds in the East Asian-Australasian Flyway. In: Emu (107): 14-18
NEWELL, J. 2004: The Russian Far East. A reference guide for conservation and development. Second Edition. Daniel & Daniel, Publishers, Inc. McKinleyville, California
NEWTON, I. 2011. The Migration Ecology of Birds. Academic Press/Elsevier, London
NICOLSON, D. J., LOETTER, M., LIEBERKNECHT, L., WELLS, R., GERHARTZ, J. L., BAN, N. C., ARDRON, J. A.: Interpreting and Communicating Outputs. IN: ARDRON, J. A., POSSINGHAM, H.P. &
KLEIN, C.J. (eds.) 2010: Marxan good practices handbook, Version 2. Pacific Marine Analysis and Research Association, Victoria, B.C
NIELSON, S. 2012: Introduction to Marxan. RenR 401 Conservation Planning. University of Alberta. Retrieved May 13, 2013, from http://www.ace-lab.org/renr401/2012/RenR401_07Feb12_Lecture.pdf
NSTATE (ed.) 2013: The State of Alaska. Retrieved Jun 18, 2013, from http://www.netstate.com/states/intro/ak_intro.htm
OHSE, B., HUETTMANN, F., ICKERT-BOND, S. M. & JUDAY, G. P. 2009: Modeling the distribution of white spruce (Picea glauca) for Alaska with high accuracy: an open access role-model for predicting tree species in last remaining wilderness areas. In: Polar Biol. (32): 1717-1729
OLSEN, B., MUNSTER, V. J., WALLENSTEIN, A., WALDENSTRÖMS, J., OSTERHAUS, A. & FOUCHIER, R. 2006: Global Patterns of Influenza a Virus in wild birds. In: Science 21, Volume 312, No 5772: 384-388
OSTROM, E., BURGER, J., FIELD, C.B., NORGAARD, R.B. & POLICANSKY, D. 2011: Revisiting the Commons: Local Lessons, Global Challenges. Retrieved, 15 May, 2013, from http://faculty.bennington.edu/~kwoods/classes/global%20change/global_2012/readings/Ostrom%20et%20al.%20%201999%20%20Revisiting%20the%20commons%20local%20lessons,%20global%20chal.pdf
108
PAULSON, D. & BELETSKY, L. 2007: Alaska – Travellers’Wildlife Guides. Interlink Books, Northampton, Massachusetts
PEARCE, J. L., KIRK, D. A., LANE, C. P., MAHR, M. H., WALMSLEY, J., CASEY, D., MUIR, J. E., HANNON, S., HANSEN, A. & JONES, K. 2008: Prioritizing avian conservation areas for the Yellowstone to Yukon Region of North America. In: Biological Conservation (141): 908-924
PETIT, D.R. 2000: Habitat use by landbirds along neoarctic-neotropical migration routes: implications for conservation of stopover habitats. In: Stud Avian Biol (20): 15-33.
PARTNERSHIP FOR THE EAST ASIAN AUSTRALASIAN FLYWAY (ed.) 2013: The Partnership for the East Asian-Australasian Flyway. Retrieved April 26, 2013, from http://www.eaaflyway.net/index.php
POSSINGHAM, H., BALL, I. & ANDELMAN, S. 2000: Mathematical methods for identifying representative reserve networks. In: Ferson, S. & Burgman, M. (eds.): Quantitive methods for conservation biology. 291-305. Springer-Verlag, New York, N.Y.
PRESSEY R. L., CABEZA, M., WATTS, M. E., COWLING, R. M. & WILSON K. A. 2007: Conservation planning in a changing world. In: Trends in Ecology & Evolution (22): 583-592
REMSEN, J. V., JR., & D.A. GOOD 1996: Misuse of data from mist-net captures to assess relative abundance in bird populations. In: Auk (113): 381-398
RALPH, C. J., & DUNN, E. H. (eds.) 2004: Monitoring bird populations using mistnets. In: Studies in Avian Biology (29). Cooper Ornithological Society. University of California Press, Berkeley, USA
RESÉNDIZ, C. G. 2012: Meta-Analysis on the effects of global economic growth on birds in the nations of the three poles. Master’s thesis at the Georg August Universität Göttingen and Lincoln University New Zealand. unpublished.
RIDGELY et al. and BIRDLIFE INTERNATIONAL (eds.) 2012: Digital Distribution Maps of the Birds of the Western Hemisphere, version 5.0. Available on request: http://www.birdlife.org/datazone/info/spcdownload
RIDGELY R. & ZOOK J. 2013 IN: UNIVERSITY OF ALASKA ANCHORAGE 2012: ALASKA NATURAL HERITAGE
PROGRAM. ASRS Species List and Scores. Retrieved Jun 20, 2013, from http://aknhp.uaa.alaska.edu/zoology/wildlife-diversity/asrs/species-list/# content
RIOLO, F. 2005: P.A.N.D.A. Protected Areas Network Design Application for ArcGIS. Retrieved, May 11, from www.mappamondogis.it/panda_en.htm
RODRIGUEZ, J.P., BROTONS, L., BUSTAMANTE, J. & SEOANE, J. 2007: The application of predictive modeling of species distribution to biodiversity conservation. In: Diversity and Distributions (13): 243-251
SALFORD SYSTEMS (ed.)2005: TreeNet – an exclusive implementation if Jerome Friedman’s MART methodology. California, USA
SALFORD SYSTEMS (ed.) 2013: Frequently Asked Questions and Answers about TreeNet Retrieved March 24, 2013, from http://docs.salford-systems.com/TreeNetFAQ.pdf

1 INTRODUCTION
109
SAPIR, N., TSURIM, I., GAL, B. & ABRAMSKY, Z. 2004: The effect of water availability on fuel deposition of two staging Sylvia warblers. In: J Avian Biol (35): 25–32
SCOTT, M. 2010: Beyond Rocks and Ice. Retrieved, May 22, 2013, from http://www.privatelandownernetwork.org/plnBlog/post.aspx?id=37
SEGAN, D. B., GAME, E. T., WATTS, M.E., STEWART, R.R. & POSSINGHAM, H.P. 2011. An interoperable decision support tool for conservation planning. In: Environmental Modelling & Software, Volume 26, Issue 12: 1434-1441
SEIC, SAKHALIN ENERGY INVESTMENT COMPANY (ed.) 2005: EIA Addendum (Environmental Impact Assessment Addendum). Chapter 15: RDB and Migratory Birds. Retrieved, Jun 17, 2013, from http://www.sakhalinenergy.ru/en/documents/doc_lender_eia_15.pdf
SHELL GLOBAL (ed.): The world's largest integrated oil and gas project. Sakhalin-2. Retrieved, Jun 17, 2013, from http://www.shell.com/global/aboutshell/major-projects-2/sakhalin.html
SIMONOV, E.A. & DAHMER, T. D. (eds.) 2008: Amur Heilong River Basin Reader. Ecosystem Ltd., Hong Kong
SMITH, R. J., EASTWOOD, P. D., OTA, Y. & ROGERS, S. I. 2009: Developing best practice for using Marxan to locate Marine Protected Areas in European waters. – ICES Journal of Marine Science (66): 188–194
SMITH, R.J. 2004: Conservation Land-Use Zoning (CLUZ). Retrieved, May 12, from www.mosaic-conservation.org/cluz/marxanI.html
SPOTSWOOD, E. N., GOODMAN, K. R., RENEÉ, J.C., CORMIER, L., HUMPLE, D. L., ROUSSEAU, J., GUERS, S. L. & BARTON, G. G. 2012: How safe is mist netting?. In: Evaluating the risk of injury and mortality to birds. In: Methods in Ecology and Evolution (3): 29-38
STEINBERG, D. 2009: Overview of TreeNet Technology - Stochastic Gradient Boosting. Retrieved, March 26, 2013, from http://www.amstat.org/chapters/northeasternillinois/pastevents/presentations/spring09_Steinberg_D.pdf
STEWART, R. R., BALL, I.R. & Possingham, H.P. 2007: The effect of incremental reserve design and changing reservation goals on the long-term efficiency of reserve systems. In: Conservation Biology (21): 346-354
STEPHENSON, S. R., SMITH, L. C., AGNEW, J. A. 2011: Divergent long-term trajectories of human access to the Arctic. In: Nature Climate Change, Volume 1, No. 3:156-160
THE AMERICAN ORNITHOLOGIST UNION (ed.) 2004: Forty-fifth supplement to the American Ornithologists Union. Checklist of North American Birds. Retrieved, April 10, 2013, from http://www.aou.org/checklist/suppl/AOU_checklist_suppl_45.pdf
UNEP (UNITED NATIONS ENVIRONMENT PROGRAMME) (ed.) 2009: Progress Towards the Convention on Biological Diversity’s2010 and 2012 Targets for Protected Area Coverage. Retrieved, Jun 13, 2013, from http://www.unep-wcmc.org/medialibrary/2010/09/28/abfcdaf3/Towardprogress.pdf

110
WALTHER, B.A., VAN NIEKERK, A., THUILLER, W., BAUMANN, S., DEAN, W.R.J., DE BRUIJN, B., GUTTERIDGE, K., JONES, P.J., NIKOLAUS, G., PEARSON, D.J., ROBINSON, S.P., SALEWSKI, V., SCHÄFFER, N., TAYLOR, P.B., TUSHABE, H., WILLIAMS, P.H. & RAHBEK, C. 2010. A databasis of Western Palearctic birds migrating within Africa to guide conservation decisions. pp. 50–104. In: HAREBOTTLE, D. M., CRAIG, A. J. F. K., ANDERSON, M. D., RAKOTOMANANA, H. &
MUCHAI, M. (eds.). Proceedings of the 12th Pan-African Ornithological Congress, 2008. Cape Town, Animal Demography Unit. ISBN: 978-0-7992-2361-3.
WALTON, K., GOTTHARDT, T. & FIELDS, T. 2013: Alaska Species Ranking System Summary Report – Siberian Rubythroat. Alaska Natural Heritage Program. University of Alaska Anchorage. Retrieved, Jun 18, 2013, from http://aknhp.uaa.alaska.edu/wpcontent/uploads/2013/05/Luscinia_calliope_report.pdf
WARMAN, L. D., SINCLAIR, A. R. E., SCUDDER, G. G. E., KLINKENBERG, B., PRESSEY, R.L., 2004. Sensitivity of systematic reserve selection to decisions about scale, biological data, and targets: case study from southern British Columbia. In: Conservation Biology (18): 655–666
WATTS, B. D. & MABEY, S. E. 1994: Migratory landbirds on the lower Delmarva: Habitat selection and geographic distribution. Final report for the Virginia Coastal Program at DEQ and NOAA
WATTS, M. & PRESSEY, B. 2001: The C-Plan Conservation Planning System. Retrieved, May 15, 2013, from Environmental Decision Group (EDG) http://www.edg.org.au/free-tools/cplan.html
WATTS, M. E, BALL, I. R., STEWART, R. R., KLEIN, C. J., WILSON, K., STEINBACK, C., LOURIVAL, R., KIRCHER, L. & POSSINGHAM, H.P. 2009: Marxan with Zones: software for optimal conservation based land- and sea-use zoning, Environmental Modelling & Software 2009
WIERSMA, Y. F. 2007: The effect of target extent on the location of optimal protected areas networks in Canada. Landscape Ecology (22): 1477–1487
WILDLIFE CONSERVATION SOCIETY (ed.) 2005: Last of the Wild Project, Version 2, 2005 (LWP-2): Global Human Influence Index (HII) Dataset (Geographic). Center for International Earth Science Information Network (CIESIN), Columbia University
WILLIAMS, P.H. 2008: Biodiversity and WorldMap. Retrieved, March 26, 2013, from http://www.nhm.ac.uk/research-curation/research/projects/worldmap/
WILSON, K.J., POSSINGHAM, H.P., MARTIN, T.G., GRANTHAM, H.S. 2010: Key Concepts. In: ARDRON, J.A., H.P. POSSINGHAM & C.J. KLEIN (eds.) 2010: Marxan good practices handbook, Version 2. Pacific Marine Analysis and Research Association, Victoria, B.C.
WINKER, K., WARNER, D.W. & WEISBROD, A.R. 1992a: Migration of woodland birds at a fragmented inland stopover site. In: Wilson Bull. (104): 580-598
WINKER, K., WARNER, D. W. & WEISBROD, A.R. 1992b: Daily mass gains among woodland migrants at an inland stopover site. In: Auk (109): 853-862.
WORLD HEALTH ORGANIZATION (ed.) 2011: Avian Influenza Fact sheet Retrieved, May 16, 2013, form http://www.who.int/mediacentre/factsheets/avian_influenza/en/

1 INTRODUCTION
111
WORLDINFOZONE (ed.) 2013: China Information - Page 1. Retrieved, Jun 17, 2013, from http://www.worldinfozone.com/country.php?country=China
WORLD WILDLIFE FUND (ed.) 2008: Manchurian mixed forests. In: The Encyclopedia of Earth. Retrieved, May 15, 2013 from www.eoearth.org/article/Manchurian_mixed_forests?topic=49597
YONG, W., FINCH, D. M., MOORE, F. R. & KELLY, J. F. 1998: Stopover ecology and habitat use of migratory Wilson’s Warbler. In: Auk (115): 829-842
YOUNG, O. R. (ed.) 1998: Global Governance: Drawing Insights from the Environmental Experience. MIT Press, Cambridge.
ZINK, G. 1973-1985: Der Zug europäischer Singvögel. Ein Atlas der Wiederfunde beringter Vögel 1-4. Möggingen88

REFERENCES
112

APPENDIX
113
APPENDIX
1 Summary of existing flyway-based conservation instruments 2 IUCN Red List: endangered (EN) and critically endangered (CR) passerines in
Asia (south, north, east) 3 Important habitats for threatened birds in Asia 4 Maps of environmental layer 5 Plots of predictive response variables for each index species


APPENDIX
i
Appendix 1
Regional summary of existing flyway-based instruments for the conservation of migratory birds (CMS FLYWAY WORKING GROUP (ed.) 2010)
ASIA – PACIFIC (MULTILATERAL, MULTI-SPECIES) (in chronological order of establishment)
Instrument name
Date
established
Type of instrument
Geographical
scope
Bird species or groups
covered
Governance/Coordination
Website(s)
Asia-Pacific
Migratory
Waterbird
Conservation
Strategy
1996 (initially 1996-2000; updated strategy 2001-2005) and 2006
Non-binding Framework strategy addressed to governments, local people, NGOs, the corporate sector, donor agencies and international conventions
Asia-Pacific region
Migratory waterbirds, especially regional conservation priority species listed in Annex 2 of the 2001-2005 Strategy
Governance Asia-Pacific Migratory Waterbird Conservation Committee Coordination Wetlands International Asia-Pacific
www.environment.gov.au/biodiversity/migratory/publications/asia-pacific/index.html
www.environment.gov.au/archive/biodiversity/migratory/waterbirds/1996-2000/index.html
www.env.go.jp/earth/coop/coop/regional_coop_e.html
Partnership for the
East Asian-
Australasian
Flyway
2006 Informal voluntaryinitiative of governments, government agencies & international NGOs
Asian-Australasian Flyway
– including divers, grebes, pelicans, shearwaters, cormorants, herons, storks, rails, ibises, spoonbills, flamingos, ducks, swans, geese, cranes, waders, skuas, gulls, terns and auks – which cyclically and predictably cross one or more national jurisdictional boundary
Annual Meeting of Partners; advice from technical Working Groups Coordination Full-scale Secretariat established in 2009 in Incheon, Republic of Korea, replacing an interim secretariat in Australia (provided by Wetlands International, Oceania 2007–2009)

ii
ASIA – PACIFIC (BILATERAL, MULTI-SPECIES) (in chronological order of establishment)
Instrument name
Date
established
Type of
instrument
Geographical
scope
Bird species or groups covered
Governance/Coordination
Website(s)
Agreement between the
Government of Australia
and the Government of
Japan for the Protection of
Migratory Birds in Danger
of Extinction and their
Environment (JAMBA)
1974
Bilateral intergovernmental treaty
Australia, Japan
Fifty-nine species; >50% of which are shorebirds, but also some seabirds, ducks, herons, terns & passerines
Australia: Department of the Environment, Water, Heritage and the Arts Japan: Ministry of the Environment
www.environment.gov.au/biodiversity/migratory/waterbirds/bilateral.html
Agreement between
People’s Republic of
China and Japan
1981 Bilateral intergovernmental treaty
People’s Republic of China, Japan
Japan: Ministry of the Environment
www.env.go.jp/en/nature/biodiv/intel.html
Agreement between the
Government of Australia
and the Government of
the People's Republic of
China for the Protection of
Migratory Birds and their
Environment (CAMBA)
1986 Bilateral intergovernmental treaty
Australia, China
Eighty-one species; c.50% shorebirds
Australia: Department of the Environment, Water, Heritage and the Arts China: State Forestry Administration
www.environment.gov.au/biodiversity/migratory/waterbirds/bilateral.html
Agreement between
Japan and Russian
Federation
1988 Bilateral intergovernmental treaty
Russian Federation, Japan
Japan: Ministry of the Environment Russian Federation: Ministry of Natural Resources and Environmental Protection
www.env.go.jp/en/nature/biodiv/intel.html

1 INTRODUCTION
1 APPENDIX
iii
Agreement between
Republic of Korea and
Russian Federation
1994
Bilateral intergovernmental treaty
Republic of Korea, Russian Federation
Republic of Korea: Ministry of Environment Russian Federation: Ministry of Natural Resources and Environmental Protection
Agreement between the
Government of Australia
and the Government of
the Republic of Korea on
the Protection of Migratory
Birds (ROKAMBA)
2006 Bilateral intergovernmental treaty (entry into force 2007)
Australia Republic of Korea
Fifty-nine species; >50% of which are shorebirds, but also some ducks, terns, shearwaters, passerines
Australia: Department of the Environment, Water, Heritage and the Arts Republic of Korea: Ministry of Environment
www.environment.gov.au/biodiversity/migratory/waterbirds/bilateral.html
Agreement between
Republic of Korea and
People’s Republic of
China
2007 Bilateral intergovernmental treaty
Republic of Korea, People’s Republic of China
337 species

APPENDIX
iv
Appendix 2
IUCN Red List: endangered (EN) and critically endangered (CR) passerines in Asia (south, north, east)
Scientific name English name Status
Cissa thalassina Javan Green Magpie CR Colluricincla
sanghirensis Sangihe Shrike-thrush CR
Corvus unicolor Banggai Crow CR Cyornis ruckii Rueck's Blue-flycatcher CR Dicaeum quadricolor Cebu Flowerpecker CR Eurochelidon
sirintarae White-eyed River-martin CR
Eutrichomyias rowleyi Cerulean Paradise-flycatcher CR Garrulax courtoisi Blue-crowned Laughingthrush CR Leucopsar rothschildi Bali Starling CR Monarcha boanensis Black-chinned Monarch CR Oriolus isabellae Isabela Oriole CR `Sturnus
melanopterus Black-winged Starling CR
Zosterops nehrkorni Sangihe White-eye CR Aethopyga
duyvenbodei (Elegant Sunbird) EN
Copsychus cebuensis (Black Shama) EN Corvus florensis (Flores Crow) EN Crocias langbianis (Grey-crowned Crocias) EN Cyornis sanfordi (Matinan Flycatcher) EN Dasycrotapha
speciosa (Flame-templed Babbler) EN
Dicrurus menagei (Tablas Drongo) EN Emberiza jankowskii (Rufous-backed Bunting) EN Ficedula bonthaina (Lompobatang Flycatcher) EN Garrulax yersini (Collared Laughingthrush) EN Ixos siquijorensis (Streak-breasted Bulbul) EN Madanga ruficollis Rufous-throated White-eye) EN Monarcha brehmii (Biak Monarch) EN Monarcha everetti (White-tipped Monarch) EN Monarcha
sacerdotum (Flores Monarch) EN
Myiomela albiventris (White-bellied Blue Robin) EN Myiomela major (Nilgiri Blue Robin) EN Myophonus blighi (Sri Lanka Whistling-thrush) EN Pitta gurneyi (Gurney's Pitta) EN Rhinomyias albigularis (White-throated Jungle-flycatcher) EN Rimator pasquieri (White-throated Wren-babbler) EN Sitta victoriae (White-browed Nuthatch) EN Stachyris nigrorum (Negros Striped-babbler) EN Strophocincla
cachinnans (Black-chinned Laughingthrush) EN

1 INTRODUCTION
v
Appendix 3 Important areas for threatened birds in Asia (BIRDLIFE INTERNATIONAL 2003)

vi

1 INTRODUCTION
vii
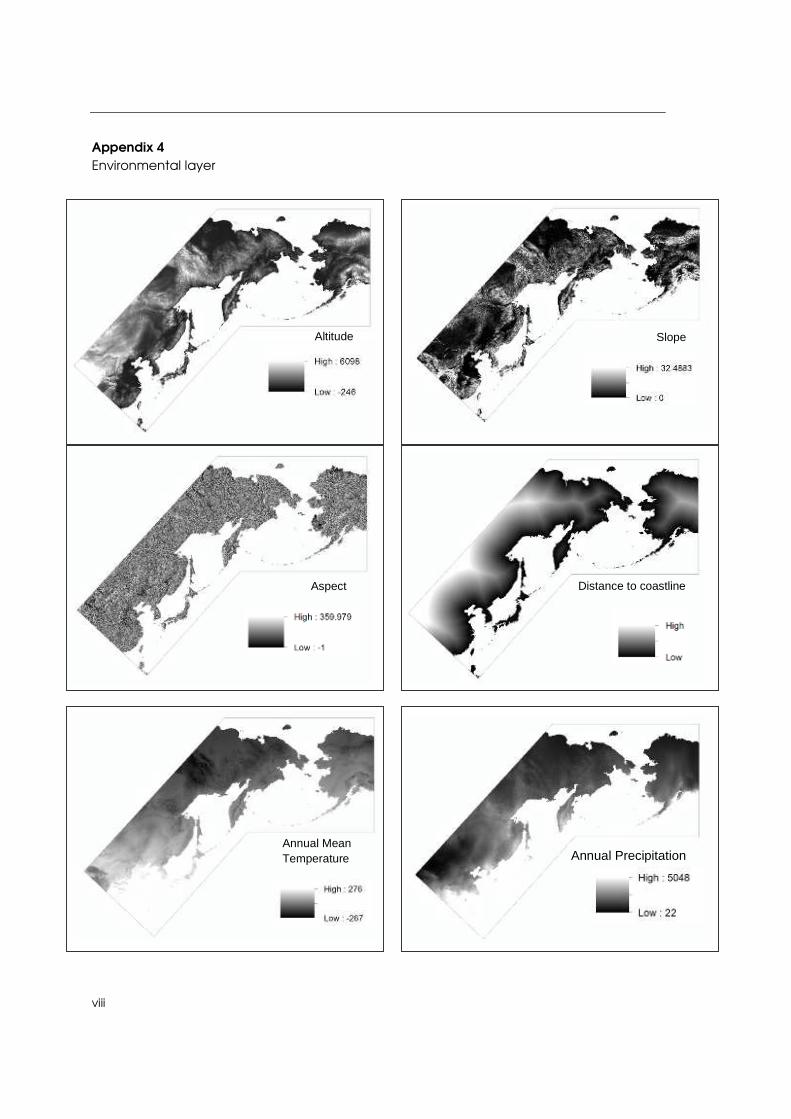
viii
Appendix 4 Environmental layer
Altitude Slope
Aspect Distance to coastline
Annual Mean Temperature Annual Precipitation

APPENDIX
ix
Max Temperature Warmest Month
Min Temperature Coldest Month

APPENDIX
x
0.0
0.5
1.0
1 2 3 4 5
Pa
rtia
l De
pe
nd
en
ce
SLOPE
One Predictor Dependence For YELLOW_WAG = 1
-0.2
0.0
0.2
500000 1000000 1500000
Pa
rtia
l De
pe
nd
en
ce
COASTAL_L
One Predictor Dependence For YELLOW_WAG = 1
0.2
0.4
500 1000 1500
Pa
rtia
l De
pe
nd
en
ce
ALT
One Predictor Dependence For YELLOW_WAG = 1
-0.2
-0.1
0.1
0.2
100 200 300 400
Pa
rtia
l De
pe
nd
en
ce
ASPECT
One Predictor Dependence For YELLOW_WAG = 1
-0.2
0.0
0.2
0.4
100 200 300
Pa
rtia
l De
pe
nde
nce
MAX_MONTH
One Predictor Dependence For YELLOW_WAG = 1
-0.10
-0.05
0.00
0.05
0.10
200 400 600 800 1000 1200 1400
Pa
rtia
l De
pe
nde
nce
ANNUALPREC
One Predictor Dependence For YELLOW_WAG = 1
0.0
0.2
0.4
0.6
0.8
0 100 200 300 400 500 600
Cro
ss E
ntro
py
Number of Trees
TrainTest
0.6910.689
#535 (0.578) #535 (0.578) (0.323)
Appendix 5 Plots of predictive variables for each Index species Predictor: Yellow Waigtail (Motacilla flava or Motacilla tschutschensis)

1 INTRODUCTION
xi
0.0
0.2
0.4
-300 -200 -100
Par
tial D
epe
nd
ence
MIN_MONTH
One Predictor Dependence For YELLOW_WAG = 1
-0.05
0.05
0.10
-100 -50 50 100
Par
tial D
epe
nd
ence
MEAN_TEMP
One Predictor Dependence For YELLOW_WAG = 1
-0.2
0.0
0.2
100 200 300
Par
tial D
epe
nd
ence
HII
One Predictor Dependence For YELLOW_WAG = 1
-0.10
-0.05
0.00
0.05
0.10
20 40 60 80 100120140160 180200220
Par
tial D
epe
nd
ence
LANDCOVER
One Predictor Dependence For YELLOW_WAG = 1
-0.4
-0.2
0.0
0.2
0.4
20 40 60 80 100120 140 160 180200 220
Pa
rtia
l De
pe
nde
nce LANDCOVER
One Predictor Dependence For PHYLLOSCOP = 1
0.0
0.2
0.4
0.6
0.8
0 100 200 300 400 500
Cro
ss E
ntro
py
Number of Trees
TrainTest
0.6880.686
#348 (0.397) #348 (0.397) (0.266)
-0.2
0.0
0.2
0.4
0.6
200 400 600 800 1000 1200 1400
Pa
rtia
l De
pe
nde
nce
ANNUALPREC
One Predictor Dependence For PHYLLOSCOP = 1
Predictor: Arctic Warbler (Phylloscopus borealis)

xii
-0.5
0.5
-100 -50 50 100
Pa
rtia
l Dep
en
den
ce
MEAN_TEMP
One Predictor Dependence For PHYLLOSCOP = 1
-0.4
-0.3
-0.2
-0.1
0.0
0.11 2 3 4 5
Par
tial D
ep
end
en
ce
SLOPE
One Predictor Dependence For PHYLLOSCOP = 1
-0.2
0.0
0.2
100 200 300
Pa
rtia
l Dep
en
den
ce
MAX_MONTH
One Predictor Dependence For PHYLLOSCOP = 1
-0.1
0.1
0.2
500 1000 1500
Pa
rtia
l Dep
en
den
ce
ALT
One Predictor Dependence For PHYLLOSCOP = 1
-0.05
0.00
0.05
0.10
0.15
-300 -200 -100
Pa
rtia
l Dep
en
den
ce
MIN_MONTH
One Predictor Dependence For PHYLLOSCOP = 1
-0.05
0.05
0.10
100 200 300 400
Pa
rtia
l Dep
en
den
ce
ASPECT
One Predictor Dependence For PHYLLOSCOP = 1
-0.10
-0.05
0.00
0.05
0.10
500000 1000000 1500000
Pa
rtia
l Dep
en
den
ce
COASTAL_L
One Predictor Dependence For PHYLLOSCOP = 1
-0.05
0.00
0.05
0.10
0.15
100 200 300
Pa
rtia
l Dep
en
den
ce
HII
One Predictor Dependence For PHYLLOSCOP = 1

1 INTRODUCTION
xiii
-0.5
0.0
0.5
200 400 600 800 1000 1200 1400
Pa
rtia
l De
pe
nde
nce
ANNUALPREC
One Predictor Dependence For LUSCINIA_C = 1
-0.2
-0.1
0.1
0.2
0.3
100 200 300 400P
art
ial D
epe
nd
ence
ASPECT
One Predictor Dependence For LUSCINIA_C = 1
0.10
0.20
-100 -50 50 100
Pa
rtia
l Dep
en
den
ce
MEAN_TEMP
One Predictor Dependence For LUSCINIA_C = 1
-0.1
0.0
0.1
0.2
100 200 300
Pa
rtia
l Dep
en
den
ce
HII
One Predictor Dependence For LUSCINIA_C = 1
-0.05
0.00
0.05
0.10
1 2 3 4 5
Pa
rtia
l Dep
en
den
ce
SLOPE
One Predictor Dependence For LUSCINIA_C = 1
-0.05
0.00
0.05
0.10
500000 1000000 1500000
Pa
rtia
l De
pe
nde
nce
COASTAL_L
One Predictor Dependence For LUSCINIA_C = 1
0.0
0.2
0.4
0.6
0.8
0 100 200 300
Cro
ss E
ntro
py
Number of Trees
TrainTest
0.6910.688
#201 (0.527) #201 (0.527) (0.424)
Predictor: Siberian Rubythroat (Luscinia calliope)

xiv
-0.10
-0.05
0.05
0.10
500 1000 1500
Pa
rtia
l Dep
en
den
ce
ALT
One Predictor Dependence For LUSCINIA_C = 1
-0.02
0.00
0.02
0.04
100 200 300
Pa
rtia
l De
pe
nde
nce
MAX_MONTH
One Predictor Dependence For LUSCINIA_C = 1
-0.05
0.00
0.05
0.10
-300 -200 -100
Pa
rtia
l Dep
en
den
ce
MIN_MONTH
One Predictor Dependence For LUSCINIA_C = 1
0.00
0.05
0.10
20 40 60 80 100120 140160 180200 220
Pa
rtia
l Dep
en
den
ce
LANDCOVER
One Predictor Dependence For LUSCINIA_C = 1
0.0
0.2
0.4
1 2 3 4 5
Pa
rtia
l De
pe
nde
nce
SLOPE
One Predictor Dependence For LUSCINIA_S = 1
-0.1
0.0
0.1
0.2
0.3
-300 -200 -100
Pa
rtia
l De
pe
nde
nce
MIN_MONTH
One Predictor Dependence For LUSCINIA_S = 1
0.0
0.2
0.4
0.6
0.8
0 100 200 300
Cro
ss E
ntro
py
Number of Trees
TrainTest
0.6960.687
#159 (0.578) #159 (0.578) (0.387)
Predictor: Bluethroat (Luscinia svecica)
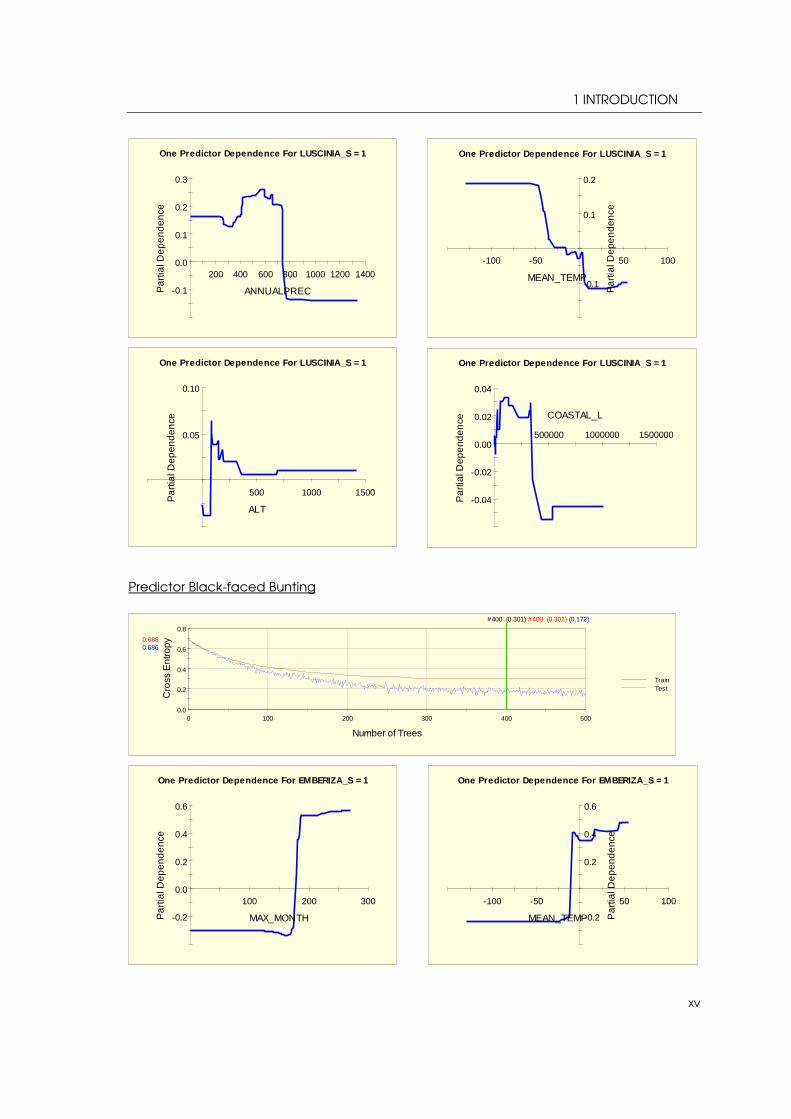
1 INTRODUCTION
xv
-0.1
0.0
0.1
0.2
0.3
200 400 600 800 1000 1200 1400
Pa
rtia
l De
pe
nde
nce
ANNUALPREC
One Predictor Dependence For LUSCINIA_S = 1
-0.1
0.1
0.2
-100 -50 50 100
Par
tial D
epe
nd
ence
MEAN_TEMP
One Predictor Dependence For LUSCINIA_S = 1
0.05
0.10
500 1000 1500
Pa
rtia
l Dep
en
den
ce
ALT
One Predictor Dependence For LUSCINIA_S = 1
-0.04
-0.02
0.00
0.02
0.04
500000 1000000 1500000
Pa
rtia
l De
pe
nde
nce COASTAL_L
One Predictor Dependence For LUSCINIA_S = 1
-0.2
0.0
0.2
0.4
0.6
100 200 300
Pa
rtia
l De
pe
nde
nce
MAX_MONTH
One Predictor Dependence For EMBERIZA_S = 1
-0.2
0.2
0.4
0.6
-100 -50 50 100
Pa
rtia
l De
pe
nde
nce
MEAN_TEMP
One Predictor Dependence For EMBERIZA_S = 1
0.0
0.2
0.4
0.6
0.8
0 100 200 300 400 500
Cro
ss E
ntro
py
Number of Trees
TrainTest
0.6880.686
#400 (0.301) #400 (0.301) (0.172)
Predictor Black-faced Bunting

xvi
-0.2
0.2
0.4
500 1000 1500
Pa
rtia
l Dep
en
den
ce
ALT
One Predictor Dependence For EMBERIZA_S = 1
-0.4
-0.2
0.0
0.2
0.4
200 400 600 800 1000 1200 1400
Pa
rtia
l Dep
en
den
ce
ANNUALPREC
One Predictor Dependence For EMBERIZA_S = 1
0.0
0.1
0.2
0.3
0.4
20 40 60 80 100 120 140 160 180 200 220
Par
tial D
ep
end
en
ce
LANDCOVER
One Predictor Dependence For EMBERIZA_S = 1
0.0
0.2
0.4
100 200 300
Pa
rtia
l Dep
en
den
ce
HII
One Predictor Dependence For EMBERIZA_S = 1
-0.1
0.0
0.1
0.2
0.3
1 2 3 4 5
Pa
rtia
l Dep
en
den
ce
SLOPE
One Predictor Dependence For EMBERIZA_S = 1
-0.1
0.1
0.2
0.3
100 200 300 400
Pa
rtia
l Dep
en
den
ce
ASPECT
One Predictor Dependence For EMBERIZA_S = 1
-0.10
-0.05
0.00
0.05
0.10
500000 1000000 1500000
Pa
rtia
l Dep
en
den
ce
COASTAL_L
One Predictor Dependence For EMBERIZA_S = 1
0.00
0.05
0.10
-300 -200 -100
Pa
rtia
l Dep
en
den
ce
MIN_MONTH
One Predictor Dependence For EMBERIZA_S = 1

1 INTRODUCTION
xvii
Predictor Species Richness Index (songbirds)
-10
0
10
20
100 200 300 400
Pa
rtial
Dep
end
enc
e
ASPECT
One Predictor Dependence For SPECIES_IN
-10
0
10
20
200 400 600 800 1000 1200 1400
Pa
rtial
Dep
end
enc
e
ANNUALPREC
One Predictor Dependence For SPECIES_IN
-10
10
20
100 200 300 400 500 600 700 800
Pa
rtia
l De
pe
nd
en
ce
ALT
One Predictor Dependence For SPECIES_IN
-5
0
5
10
100 200 300
Pa
rtia
l De
pe
nd
en
ce
MAX_MONTH
One Predictor Dependence For SPECIES_IN
-10
-5
0
5
10
500000 1000000 1500000
Pa
rtial
Dep
end
enc
e COASTAL_L
One Predictor Dependence For SPECIES_IN
-2
2
4
6
-60 -40 -20 20 40 60
Pa
rtia
l De
pe
nd
en
ce
MEAN_TEMP
One Predictor Dependence For SPECIES_IN
0
10
20
30
40
50
60
0 100 200 300 400 500
Mea
n A
bsol
ute
Err
or
Number of Trees
TrainTest
48.64847.6
#499 (36.159)#499 (36.159) (22.981)

xviii
-4
-2
0
2
4
6
20 40 60 80 100 120 140 160 180 200 220
Pa
rtia
l De
pe
nd
en
ce
LANDCOVER
One Predictor Dependence For SPECIES_IN
-5
0
5
10
15
-300 -200 -100
Pa
rtial
Dep
end
enc
e
MIN_MONTH
One Predictor Dependence For SPECIES_IN
-5
0
5
10
15
100 200 300
Pa
rtia
l De
pe
nd
en
ce
HII
One Predictor Dependence For SPECIES_IN
-2
0
2
4
6
1 2 3 4 5
Pa
rtia
l De
pe
nd
en
ce
SLOPE
One Predictor Dependence For SPECIES_IN