Embed Size (px)
Citation preview
1
UNIVERSIDADE NOVA DE LISBOA
Faculdade de Ciências Médicas
ATTITUDES TOWARDS MENTALLY ILL IN PROFESSIONALS WORKING IN
NDERA NEUROPSYCIATRIC HOSPITAL IN RWANDA
By
Dr Alfred NGIRABABYEYI
Master's Dissertation in International Mental Health
Supervisor
Professor Julian Leff
King’s College London
February 2012
i
DEDICATION
First of all, I want to dedicate this research to God, and to Jesus Christ, my guiding light
With my deepest love and appreciation to my soul mate, best friend, and wife Rose Marie
Alice UMUBEYI, for her patience, love, encouragement, and tolerance during some of
the most tempestuous and frustrating times during the completion of my research.
To my beloved and wonderful children: Alain Bruno SHEMA, and Aubert Arnaud
HIRWA, for their patience with me while I was struggling to maintain work, family, and
the completion of this research.
ii
ABSTRACT
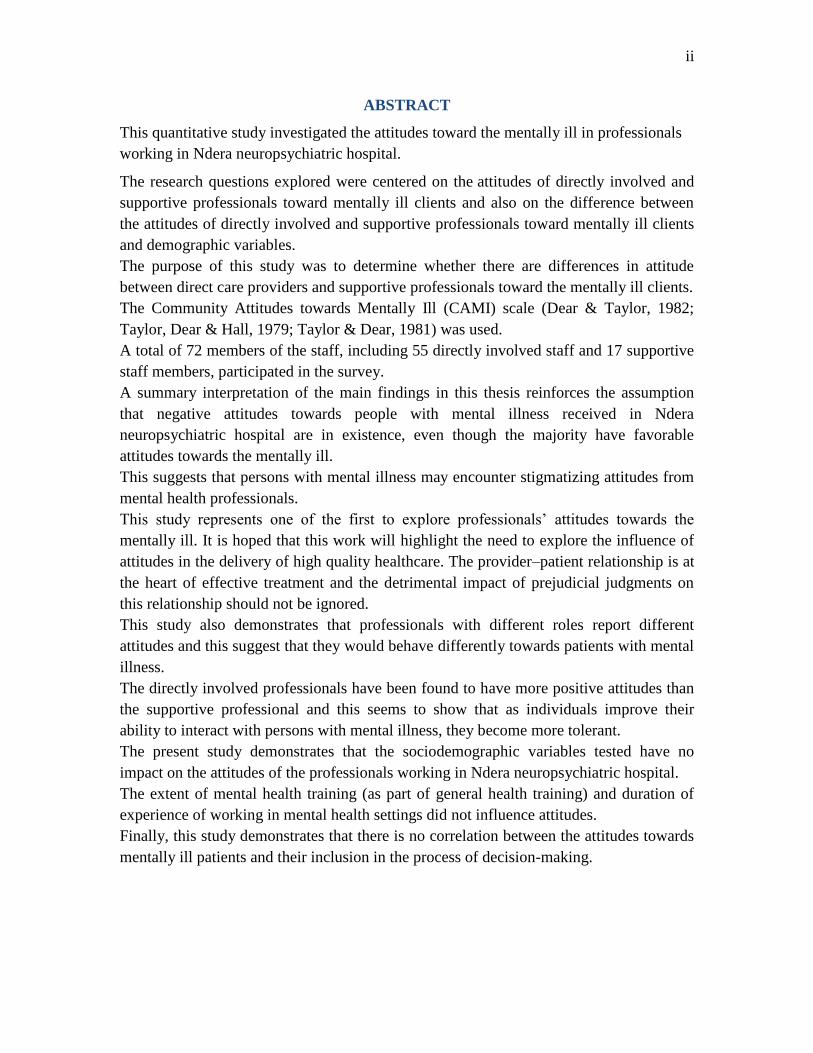
This quantitative study investigated the attitudes toward the mentally ill in professionals
working in Ndera neuropsychiatric hospital.
The research questions explored were centered on the attitudes of directly involved and
supportive professionals toward mentally ill clients and also on the difference between
the attitudes of directly involved and supportive professionals toward mentally ill clients
and demographic variables.
The purpose of this study was to determine whether there are differences in attitude
between direct care providers and supportive professionals toward the mentally ill clients.
The Community Attitudes towards Mentally Ill (CAMI) scale (Dear & Taylor, 1982;
Taylor, Dear & Hall, 1979; Taylor & Dear, 1981) was used.
A total of 72 members of the staff, including 55 directly involved staff and 17 supportive
staff members, participated in the survey.
A summary interpretation of the main findings in this thesis reinforces the assumption
that negative attitudes towards people with mental illness received in Ndera
neuropsychiatric hospital are in existence, even though the majority have favorable
attitudes towards the mentally ill.
This suggests that persons with mental illness may encounter stigmatizing attitudes from
mental health professionals.
This study represents one of the first to explore professionals’ attitudes towards the
mentally ill. It is hoped that this work will highlight the need to explore the influence of
attitudes in the delivery of high quality healthcare. The provider–patient relationship is at
the heart of effective treatment and the detrimental impact of prejudicial judgments on
this relationship should not be ignored.
This study also demonstrates that professionals with different roles report different
attitudes and this suggest that they would behave differently towards patients with mental
illness.
The directly involved professionals have been found to have more positive attitudes than
the supportive professional and this seems to show that as individuals improve their
ability to interact with persons with mental illness, they become more tolerant.
The present study demonstrates that the sociodemographic variables tested have no
impact on the attitudes of the professionals working in Ndera neuropsychiatric hospital.
The extent of mental health training (as part of general health training) and duration of
experience of working in mental health settings did not influence attitudes.
Finally, this study demonstrates that there is no correlation between the attitudes towards
mentally ill patients and their inclusion in the process of decision-making.
iii
ACKNOWLEDGMENTS
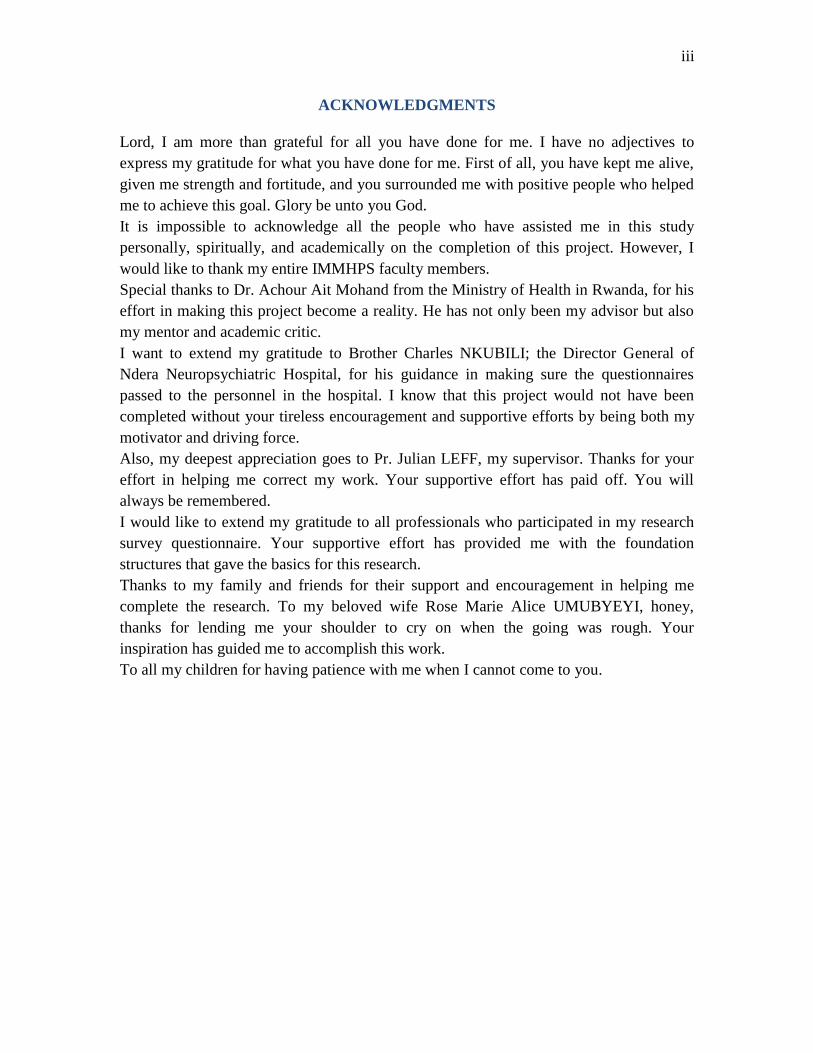
Lord, I am more than grateful for all you have done for me. I have no adjectives to
express my gratitude for what you have done for me. First of all, you have kept me alive,
given me strength and fortitude, and you surrounded me with positive people who helped
me to achieve this goal. Glory be unto you God.
It is impossible to acknowledge all the people who have assisted me in this study
personally, spiritually, and academically on the completion of this project. However, I
would like to thank my entire IMMHPS faculty members.
Special thanks to Dr. Achour Ait Mohand from the Ministry of Health in Rwanda, for his
effort in making this project become a reality. He has not only been my advisor but also
my mentor and academic critic.
I want to extend my gratitude to Brother Charles NKUBILI; the Director General of
Ndera Neuropsychiatric Hospital, for his guidance in making sure the questionnaires
passed to the personnel in the hospital. I know that this project would not have been
completed without your tireless encouragement and supportive efforts by being both my
motivator and driving force.
Also, my deepest appreciation goes to Pr. Julian LEFF, my supervisor. Thanks for your
effort in helping me correct my work. Your supportive effort has paid off. You will
always be remembered.
I would like to extend my gratitude to all professionals who participated in my research
survey questionnaire. Your supportive effort has provided me with the foundation
structures that gave the basics for this research.
Thanks to my family and friends for their support and encouragement in helping me
complete the research. To my beloved wife Rose Marie Alice UMUBYEYI, honey,
thanks for lending me your shoulder to cry on when the going was rough. Your
inspiration has guided me to accomplish this work.
To all my children for having patience with me when I cannot come to you.
iv
TABLE OF CONTENTS
UNIVERSIDADE NOVA DE LISBOA ............................................................................ 1 Faculdade de Ciências Médicas ......................................................................................... 1 ATTITUDES TOWARDS MENTALLY ILL IN PROFESSIONALS WORKING IN
NDERA NEUROPSYCIATRIC HOSPITAL IN RWANDA ............................................ 1
Master's Dissertation in International Mental Health .................................................. 1 DEDICATION ..................................................................................................................... i ABSTRACT ........................................................................................................................ ii ACKNOWLEDGMENTS ................................................................................................. iii
TABLE OF CONTENTS ................................................................................................... iv LIST OF TABLES ............................................................................................................. vi
CHAPTER 1: RESEARCH QUESTION ........................................................................... 1 1.1. Introduction .............................................................................................................. 1 1.2. Statement of the problem ......................................................................................... 1 1.3. Study questions ........................................................................................................ 3
1.3. Hypotheses ............................................................................................................... 3 1.5. Significance of the study .......................................................................................... 3
1.6. Purpose of the study ................................................................................................. 4 1.7. Basic assumptions .................................................................................................... 4 1.8. Limitations of the study ........................................................................................... 4
CHAPTER 2: REVIEW OF THE LITERATURE ............................................................ 5 2.1. Rwanda at a glance .................................................................................................. 5
2.2. Importance of attitude .............................................................................................. 5 2.3. The African Concept of mental health ..................................................................... 6
2.4. Definition of terms ................................................................................................... 6 2.4.1. Mental Health.................................................................................................... 6
2.4.2. Mental Health Problems ................................................................................... 7 2.4.3. Mental Illness .................................................................................................... 7 2.4.4. Mental Disorders ............................................................................................... 7
2.4.5. Rehabilitation .................................................................................................... 7 2.4.6. Stigma ............................................................................................................... 7
2.5. Literature on Attitude ............................................................................................... 8 2.5.1. Attitude Structure .............................................................................................. 8
2.5.2. Attitude Formation ............................................................................................ 9 2.2.4. Stereotype ....................................................................................................... 13
CHAPTER 3: METHODOLOGY .................................................................................... 15
3.1. Research design ..................................................................................................... 15 3.2. Participants ............................................................................................................. 15 3.3. Instruments ............................................................................................................. 16 3.4. Variables ................................................................................................................ 18
3.4.1. Dependent variables ........................................................................................ 18 3.4.2. Independent variables ..................................................................................... 18
3.5. Data collection procedures ..................................................................................... 18 3.6. Data analysis .......................................................................................................... 18
CHAPTER 4: RESULTS ................................................................................................. 20

v
4.1. Attitudes towards the mentally ill patient .............................................................. 22
4.2. Relationship between Attitudes and profile of the participants ............................. 50 4.3. Correlations Between Inclusion And Involvement In Decision-Making .............. 59
CHAPTER 5: DISCUSSION, CONCLUSION, AND RECOMMENDATIONS .......... 64
REFERENCES ................................................................................................................. 70 APPENDIX ....................................................................................................................... 79
vi
LIST OF TABLES
Table 1: Selected Demographics for the participants ....................................................... 21
Table 2: percentage of the respondents agreeing or disagreeing with authoritarian
attitudes ............................................................................................................................. 23 Table 3: Mean scores for authoritarian attitudes............................................................... 24 Table 4: One-way ANOVA for authoritarianism statements ........................................... 26 Table 5: Percentage of the respondents agreeing or disagreeing with social restrictiveness
attitudes ............................................................................................................................. 28 Table 6: Mean scores for social restrictiveness attitudes ................................................. 29 Table 7: One - way ANOVA for social restrictiveness statements of attitudes................ 31 Table 8: Percentage of the respondents agreeing or disagreeing benevolence attitudes .. 33 Table 9: Mean score for benevolence attitudes................................................................. 34
Table 10: One-way ANOVA for the benevolence statements of attitudes ....................... 36
Table 11: Percentage of the respondents agreeing or disagreeing community mental
health ideology attitudes ................................................................................................... 38
Table 12: Mean scores for community mental health ideology attitudes ......................... 39 Table 13:One-way ANOVA for communtiy mental health ideology statements of
attitudes ............................................................................................................................. 41
Table 14: Independent sample T test for authoritarianism ............................................... 43 Table 15: Independent T test for the Social restrictiveness statement of attitudes ........... 45
Table 16: Independent T test for benevolence statements of attitudes ............................. 47 Table 17: Independent T test for community mental health ideology statements of
attitudes ............................................................................................................................. 49
Table 18: Multivariate test for authoritarianism ............................................................... 51 Table 19: Multivariate test for the benevolence attitudes ................................................ 53
Table 20: Multivariate test for social restrictiveness ........................................................ 55 Table 21: Multivariate for community mental health ideology ...................................... 57
Table 22: Beliefs of the respondents about asking patients their preferences .................. 58 Table 23: Beliefs of the respondents on involving the mentally ill in decision-making .. 59 Table 24: Spearman's correlation between authoritarianism and inclusion in decision
making............................................................................................................................... 60 Table 25: Spearmen's correlation between social restrictiveness and inclusion in decision
making............................................................................................................................... 61 Table 26: Spearman's correlation between benevolence and inclusion in the decision
making............................................................................................................................... 62
Table 27: Spearman's correlation between community mental health ideology and
inclusion in decision making ............................................................................................ 63
1
CHAPTER 1: RESEARCH QUESTION
1.1. Introduction
Ndera Neuropsychiatric hospital was founded by the Congregation of Brothers of
Charity, on the July 4th
, 1968.
Before the Nation’s Independence (July 1st 1962), the mentally ill patients were sent to
Bujumbura (Burundi) where a psychiatric unit was functional in Prince Regent Charles
general hospital.
After 1962, Rwandan leadership contacted the Brothers of Charity to find a solution to
the problem of mentally ill who were wandering in the streets of the country. It was in
1968 that a convention was signed and construction started that year. The first patient
was hospitalized in 1972 and the capacity was about 60 beds.
From 1968 to 1994, infrastructures and personnel increased remarkably. An annex has
been created in the south of the country and mobile teams have been created to reach the
patients living in the interior of the country.
During the 1994 genocide against the Tutsi, the hospital and its infrastructure were
demolished, the personnel killed and equipment stolen.
In 1995 and 1996, in collaboration with the Swiss Cooperation, and Belgium
Cooperation, the hospital was rehabilitated, the new personnel trained and the hospital
equipped.
After the hospital restarted its activities in 1996, the number of patients keeps increasing
considerably and new services are being envisioned (Drug abuse unit, child psychiatry,
and clinical psychology, psychiatric HIV Unit…) to respond to the needs of the Rwandan
population which continues to live with the scars of 1994 genocide against the Tutsi.
In addition, the government of Rwanda decided to integrate mental health care in the
general health care. By then, all district hospitals started a mental unit run by a
psychiatric nurse and/or a psychologist. However, patients continue to increase in the
hospital, either in the outpatient department or in the inpatients wards.
1.2. Statement of the problem
Till 1960s, the large institutions were the focus of psychiatric treatment; the reforms in
1960s brought deinstitutionalization which is, in other words, the end to the rigid
regimens and dehumanization of patients associated with many large institutions.
However, in many areas, there have been resistances to establishment of group homes, or
community treatment facilities, for mentally ill patients.
Health care providers have been known to stigmatize patients who use psychiatric
medications or services by offering discouraging advice, disparaging remarks, and
2
rejecting behavior. This form of discrimination may have a negative impact on patients’
self-esteem and the way they seek help or adhere to prescribed medical treatments.
Health care providers, either in the community or in the hospitals, have the opportunity to
influence patients’ perception of their mental illness. Consequently, negative attitudes
that manifest as apprehension or discomfort during patient interactions may lead to
ineffective counseling or the lack of essential medical services.
The knowledge of such attitudes is not only germane to those concerned with the origins
and maintenance of disturbed behavior, but critically important to workers involved in
primary prevention programs, early intervention, and community treatment of psychiatric
patients.
Both administrators and clinicians benefit from acquaintance with public attitudes
towards the presence of psychiatric facilities in their neighborhoods.
In addition, the planners have to know discrepancies between what people say and what
they do.
To our knowledge, no study has directly examined the attitudes of mental health
professionals in Rwanda. There are, hence, no data on the interactions between
psychiatric users and professionals.
Before the 1960s, mental disorders were managed within the community by the
traditional healers and then by the church. This permitted maintenance of the mentally ill
at the level of the community, in their families without being stigmatized.
In 1968, the only psychiatric hospital was established with the mission to treat all
psychiatric cases of the country.
From that time, all the mentally ill patients were referred to Ndera for care. It was
difficult to find a patient treated either in the community or in the district hospitals.
With the 1994 genocide, families have been destroyed, and psychosocial problems
increased in number. The number of people who consulted the services at the Ndera
neuropsychiatric hospital increased as well.
Many attempts to find solutions to the problem of delivery of mental health services to
mentally ill Rwandans have been tried. Mobile teams have been created but with little
success. Psychiatric nurses, psychiatrists and other doctors have been trained.
Nevertheless patients continue to be increasingly hospitalized. Some patients are
hospitalized for long periods, and some are not reintegrated well within the society. In
addition to this, some patients reported the violations of their basic human rights.
3
1.3. Study questions
This research was guided by the following questions:
1. What are the attitudes of directly involved and supportive professionals toward
mentally ill clients?
2. Is there a difference between the attitudes of directly involved and supportive
professionals toward mentally ill clients and demographic variables (including levels of
training, occupation, years of experience, and academic discipline)?
1.3. Hypotheses
1. Directly involved professionals’ attitudes toward the inclusion of persons with
psychiatric disabilities will be more positive than supportive staff's attitudes.
2. Directly involved professionals will have a stronger belief in the need to include
consumers in the decision-making process about their future than the supportive
staff workers.
3. Professional background variables (including academic discipline, levels of
training and experience, amount of contact, and occupation) have an effect on
directly involved and supportive professionals’ attitudes toward mentally ill
patients.
1.4. Specific objectives.
o To establish the attitudes, the views and reactions of the Directly involved
staff (including nurses, doctors and social workers) and those who are not
the part of that category, towards the mentally ill people.
To identify factors which influence the attitude of nurses’ towards the
mentally ill in Ndera Neuropsychiatric Hospital.
1.5. Significance of the study
If attitudes towards the mentally ill by directly involved professionals (including nurses,
doctors and social workers) and those who are not part of that category are significantly
negative then it could be posited that by increasing the availability of resources, services,
and information related to mental health, more mentally ill patients will receive the best
quality of care.
This study focuses on professionals at the Ndera neuropsychiatric hospital in Rwanda.
Such a specialized focus is useful because it provides an opportunity to investigate the
unique mental health attitudes and issues of this population. Even with this narrow focus,
there is still some degree of variability, due to such factors as level of education,
psychiatric background, and working experience in mental health.
4
1.6. Purpose of the study
The purpose of this study was to determine whether there are differences in attitude
between direct care providers and supportive professionals toward the mentally ill clients.
The Community Attitudes towards Mentally Ill (CAMI) scale (Dear & Taylor, 1982;
Taylor, Dear & Hall, 1979; Taylor & Dear, 1981) was used.
1.7. Basic assumptions
Two basic assumptions were made in conducting this investigation.
First,
it was assumed that directly involved staff and supportive professionals who participated
in this study have awareness and understanding of the concept of mental health care.
Second, it was assumed that MH and supportive professionals who participated in this
study would be honest and accurate in their responses to the questionnaire on attitudes.
1.8. Limitations of the study
There are a few limitations expected in this research and they include:
- As with every other survey the fact that participants may not be
very accurate in answering the questionnaires is observed.
- Even though the whole population of 12 doctors, 90 nurses and 15
social workers and 90 support professionals working at Ndera
neuropsychiatric hospital is targeted in the study, a few participants
may not be available during the time of the study.
- Attitude towards the researcher; researcher being a member of the
group proposed for this study, participants may feel hesitant to
reveal true information on the questionnaires for fear of exposure.
5
CHAPTER 2: REVIEW OF THE LITERATURE
2.1. Rwanda at a glance
Rwanda is a small, landlocked country with an area of 10,169 square miles, of which
7,229 square miles are usable. It is located in the heart of Africa with Democratic
Republic of Congo to the west, Uganda to the North, Burundi to the south, and Tanzania
to the east. It enjoys a mild climate, with an average temperature of 64°F. Rwanda’s soil
is generally good for agriculture.
The Rwandan people live in communities that are dispersed over many hills, some of
which are not easily accessible. Rwanda is one of the African countries where the
incidence of HIV/AIDS is reaching alarming proportions and this particularly concerns
mental health services. Mental patients are at risk for HIV/AIDS, while HIV may also be
a factor in the incidence of mental and neurological disorders.
Rwanda knew in 1994, a very serious genocide, during which almost 1,000,000 people
were killed in only 100 days.
One can assume that many people in the population have been exposed to traumatic
events as defined in DSM IV-TR.
These events psychologically affected Rwandans and created several problems for
individuals, their families and also their surroundings. The situation made an impact on
the mental health of the population in Rwanda to the extent that the people consulting the
Ndera neuropsychiatric hospital keep increasing every year.
Conflict between folk (traditional) and scientific (western) treatment views of the
etiology and treatment of mental disorder exists in both developing and industrialized
nations. Briefly, in traditional Rwandan culture, an illness is not simply the result of
malfunctioning of an organ. Nor is it injury to an organ from an outside physical cause. It
is essentially a break in the harmony of one’s life, attributed to either a physical problem
created by a magical power, or an intangible force such as God, local spirits, or ancestral
spirits. In Rwanda , therapeutic rituals are often addressed to Ryangombe, a divinity who
is the source of peace, love and fertility.
In western terms, traditional medical practitioners employ a holistic approach, treating
the patient’s symptoms, as well as looking for causes in the physical and spiritual worlds.
Unlike the western mechanistic model, no distinction is made between somatic and
psychic factors.
2.2. Importance of attitude
The attitude of a person toward a certain object (person, word, or behavior) can be
defined as a subjective evaluation of this object (Herkner, 1993). The subjective value of
an object can be negative, neutral or positive. The objects of a person’s attitude are not
isolated elements; they exist in a complex relationship.
Attitudes –as well as all other cognitions- can therefore be understood as semantic
networks in which singular knots are connected by relationships. An attitude towards a
6
certain object depends on attitudes to other objects related to it. Attitudes include
cognitive and affective components (Herkner, 1993).
The role that attitudes of nondisabled persons play in the lives of people with disabilities
is an important area to understand because negative attitudes might limit the integration
of disabled people in the community. Studying the attitudes of health care professionals is
important because the presence of negative attitudes might present barriers to treatment
services as well as negatively affect the social developmental process for persons who are
disabled.
2.3. The African Concept of mental health
Africa is a continent that is culturally diversified. Although there are cross-cultural and
ethnic differences amongst the people of Africa, there is nonetheless a general belief
among Africans that both physical and mental diseases originate from various external
causes such as a breach of a taboo or custom, disturbances in social relations, hostile
ancestral spirits, spirit possession, demonic possession, evil machination, evil eye,
sorcery, natural causes, and affliction by God or gods (Betancourt et al., 2000; Gaines,
1998; Idemudia, 2004; Okafor, 2009; Thomas, 2008). According to Taussing (1980), the
most important thing about society is the relationship between people, and as a result we
need to recognize the human relationship embodied in symptoms, signs, and therapy.
Pearce (1989) also argues “it is too simplistic to see disease as something physical, which
attacks the body”. According to him, disease causation can be due to “things we see and
things we don’t see.” Many of the things we do not see are included in the African belief
system such as cultural and social values, philosophies, and expressions. The common
element in the African belief system is simply that physical and mental illness are the
result of distortions or disturbances in the harmony between an individual and the
cosmos, which may mean family, society, peers, ancestors, or a deity.
2.4. Definition of terms
2.4.1. Mental Health
Though many elements of mental health may be identifiable, the term is not easy to
define. The meaning of being mentally healthy is subject to many interpretations rooted
in value judgments, which may vary across cultures. Mental health should not be seen as
the absence of illness, but more to do with a form of subjective well-being, when
individuals feel that they are coping, fairly in control of their lives, able to face
challenges, and take on responsibility. Mental health is a state of successful performance
of mental function, resulting in productive activities, fulfilling relationships with other
people, and the ability to adapt to change and to cope with adversity specific to the
individual’s culture.
7
2.4.2. Mental Health Problems
The vast majority of mental health problems are relatively mild, though distressing to the
person at the time, and if recognized can be alleviated by support and perhaps some
professional help. Work and home life need not be too adversely affected if the
appropriate help is obtained. In the analysis of situations, the terms mental health
problems and mental health difficulties are used interchangeably.
2.4.3. Mental Illness
Mental illness refers collectively to all diagnosable mental health problems which
become “clinical,” that is where a degree of professional intervention and treatment is
required. Generally, the term refers to more serious problems, rather than, for example, a
mild episode of depression or anxiety requiring temporary help.
The major psychotic illnesses, such as endogenous depression, schizophrenia, and manic
depressive psychosis, would fall in this category and would be seen less often in the
workplace. Mental illness is sometimes referred to as psychiatric disability. This term is
used primarily in the United States.
2.4.4. Mental Disorders
Mental disorders are health conditions characterized by alterations in thinking, mood or
behavior (or some combination thereof) associated with distress and /or impaired
functioning. Mental disorders are associated with increased mortality rates.
The risk of death among individuals with a mental disorder is several times higher than in
the population as a whole.
2.4.5. Rehabilitation
A process aimed at enabling persons with disabilities to regain and maintain their optimal
physical, sensory, intellectual, psychiatric, and/or social functional levels, by providing
them with tools to change their lives towards a higher level of independence.
Rehabilitation may include measures to provide and/or restore functions or compensate
for the loss or absence of a function or for a functional limitation. The rehabilitation
process does not involve initial medical care. It includes a wide range of measures and
activities from more basic and general rehabilitation to goal-oriented activities, for
instance vocational rehabilitation
2.4.6. Stigma
Stigma can be defined as a mark of shame, disgrace, or disapproval, which results in an
individual being shunned or rejected by others. The stigma associated with all forms of
mental illness is strong but generally increases the more an individual’s behavior differs
from that of the ‘norm.’
8
2.5. Literature on Attitude
2.5.1. Attitude Structure
Historically, scientific study of attitude has focused on the general relationship between
attitude and behavior. Though attitude is not observable and hence, difficult to be
defined, it is important to study and understand attitudes because 1) Attitudes guide our
thoughts, 2) Attitudes influence our feelings, and 3) Attitudes affect our behavior (Myers,
1990, p.90 cited by J.E., Bullock, 2002, p.14)
The structural model of attitude that will be used in this research is the Theory of
Reasoned Action (TRA). This model was developed by Fishbein (1980), and the theory is
based on the idea that the proximal cause of behavior is intention to behave, which is
caused by attitude and subjective norms... (p. 47). Fishbein further states that attitude is
the target person’s opinion about whether the behavior is positive or negative, and a
subjective norm is the target person’s perception of social pressure from significant
others to perform the behavior they ought to do. (p.47). Attitudes and subjective norms
are determined by beliefs about the consequences of the behavior and beliefs about the
opinions of specific importance to others.
The TRA model builds on a history of attitude research that occurred in three phases: 1)
issues of measurement and relation to behaviors; 2) dynamics of individual attitude
change; and 3) understanding the structure and function of attitudes (Hogg & Terry,
2000).
Other researchers have contributed to the expansion of the TRA model by adding the
tenet that behavior can result from less intentional processes such as previous behavior,
habit, and perceived behavior control (Ajzen, 1988; Bentler and Speckart, 1981).
However, Fishbein (1980) and others (e.g., Ajzen, 1988; Bentler & Specart, 1981;
Triandis, 1980) have demonstrated numerous times that the two key components in
determining behavior are attitudes and subjective norms. According to Trafinow and
Fishbein (1994), in the TRA model, most behaviors can be classified under attitudinal
control (AC) and to an extent under normative control for most people. (p.51). Trafinow
and Frishbein go on to state that attitudes are global judgments about behavior (positive
or negative), and subjective norms are the target person’s judgments about what others
who are important think he or she should do. Bagozzi, Baumgartner, & Yi (1992)
conducted a study demonstrating that action-oriented people have greater tendencies
toward attitudinal control. Action-oriented people are those who decide what they want to
do, and then do it. Conversely, normative control (NC) people tend to go along with what
other people want to do. Whether action-oriented or normative control, people differ in
the degree to which they are under attitudinal control or normative control.
Finally, several researchers (Fishbein & Ajzen, 1975; Rosenberg & Hoveland, 1960;
Triandis, 1971) introduce the tripartite components (affect, cognitive, behavior) that build
9
on the idea that beliefs affect the formation of attitudes and subjective norms in the TRA
model.
According to Ajzen (1993), the tripartite components develop from beliefs that people
have about the object of the attitude. The cognitive component of attitude refers to the
individual’s ideas, beliefs, or opinions about the attitude referent. The affective
component of attitude refers to the feeling or emotional underpinnings of the attitude. The
behavioral component refers to the individual’s intent or readiness to behave in a certain
manner with respect to the attitude object. (Joseph Edward Bullock, Jr., 2002)
2.5.2. Attitude Formation
Numerous theoretical propositions regarding this topic of attitude formation exist in the
literature. For example Fishbein & Ajzen (1975) stated that attitudes are formed by
information processing and they develop from those beliefs that people have about the
attitude object. Later, another researcher, Arvey, demonstrated the genetic basis of
attitudes after finding that identical twins raised in different environments had similar
attitudes (Arvey, 1989). According to Myers in 1990, attitudes are learned through mere
exposure, conditioning, and socialization. This theory is more widely accepted by
psychologists and social scientists. Socialization refers to acquisition of language, values
and attitudes gradually through reinforcement, observation and learning processes
(Forsyth, 1995). Attitudes can also be acquired from others through social learning in the
form of classical conditioning, modeling, and direct experience.
Baron & Byrne (1994) described that classical conditioning can be defined as “learning
through association process”. This occurs when one stimulus regularly precedes another.
The one that occurs first may soon become a signal for the one that occurs second (Baron
& Byrne, 1994).
Banduras (1969) developed the “social learning theory”. This theory states that behaviors
and attitudes are acquired by observing and imitating the actions displayed by parents and
peers.
Finally, according to Bornstein (1989), direct experience can be acquired from exposure
to a particular object. Direct experience repeated over time results in a preference for or
against that object as compared to objects experienced less frequently. The more familiar
the object or task, the more we generally like it (Bornstein, 1989). In another example,
Fazio & Zanna (1981) demonstrated that attitudes that are experience-based are more
readily accessed in memory.
They went on to say that direct experience produces a well-defined and certain attitude.
These, in turn, enhance that attitude’s capacity to predict later behavior.
The area of attitudes toward persons with disabilities has also become a focus in research.
Livneh (1982) reported that some researchers went a step further by seeking a specific
cause for negative attitudes toward disability. Subsequently, a plethora of empirical work
has been focused on the goal of supporting a specific cause or root basis for negative
10
attitudes toward persons with disabilities. According to Nagler (1993) the process of
forming attitudes toward persons with disabilities is related to biases, stereotypes, and
stigma (1993).
Work on attitudes towards people with disabilities appears not to have begun until after
disability rights laws were enacted in the early seventies (Nagler, 1993). Moreover, much
of the early work focused on relationships between contact (with nondisabled persons)
and reaction. Others, such as Rabkin (1975), focused on the perceived roots of prejudicial
attitudes toward the disabled by developing classification systems. Gellman (1959), for
example, perceived the roots of prejudicial attitudes as belonging in the following
categories: 1) social customs and norms; 2) child-rearing practices; 3) recurrence of
childhood fears in frustrating/anxiety-provoking situations; and (4) discrimination-
provoking behavior by persons with disabilities. Rabkin (1975) later developed a fourfold
classification system he categorized as follows: 1) psychodynamic factors; 2) situational
factors; 3) sociocultural factors; and (4) historical factors. These and other models
contributed to a growing focus on attitude formation in the area of attitudes toward
persons with disabilities.
The research results of several studies (e.g., Heinemann, Pellander, Vogelbusch, &
Wojtek, 1981; Yuker, Block, & Young, 1970) demonstrated a link between degree of
contact or proximity to disabled persons and attitudes toward them. The term contact can
be narrowly defined as a situation in which interaction has actually taken place between
disabled and nondisabled persons (Makas, 1993).
Makas (1993) went on to say that the critical flaw in past research regarding persons with
disabilities was the lack of a clear definition for contact as well as researchers’
inattentiveness to factors associated with contact. In order to develop a full understanding
of the impact of contact between nondisabled and disabled persons, the type of contact
needs to be clearly defined. For example, Makas (1989) reviewed studies that attempted
to assess the relationship between contact and attitude and found that most of the
questions about contact “were primitive and based on a priori assumptions”. (p. 124).
As mentioned earlier, contact has been recognized as a powerful influence on attitude
formation, and high levels of contact are generally associated with positive attitudes.
However, contact is not necessarily positive in and of itself. In fact, a number of studies
suggest that unguided contact (distress and deficiencies highlighted) with persons with
disabilities has resulted in no attitude change or negative attitudes (Gething, 1982; Lyons
& Haynes, 1993). One explanation for the relationship between contact with people with
disabilities and attitude formation is a concept called in-group individuation and
stereotyping of out-group members.
Makas (1993, p. 129) espoused the idea that “negative attitudes may be the result of
illusory correlations between deviant persons and deviant behaviors”.
Furthermore, she described the concept of in-group individuation as follows:
11
Individuals seek to increase identification with their own group and to distance
themselves from other groups. This unconscious behavior can lead to contrast
and assimilation biases in cognitive processing in which people fail to
acknowledge differences that exist between groups. The contrast and assimilation
biases work together to allow an individual to strengthen her/his feelings of
cohesiveness with the “in-group” and distance from the “out-group” (p. 129).
Another investigator (Wills, 1978) found that professionals (e.g., social workers,
rehabilitation counselors, medical professionals) have obvious contrast and assimilation
biases toward their clients. Wills reported that a majority of studies on this topic (e.g.,
Elliott, 1990; Yuker, 1988) found that professional helpers hold more negative attitudes
toward people with disabilities than does the general public. Wills attributed this finding
to the service providers’ need to perceive two entirely separate groups - the helpers and
the clients-in order to assure the cohesiveness of their (the service providers) own group
(p. 129).
Livneh (1982) describes a more complex origin of negative attitudes toward persons with
disablilities. According to Livneh (1982), sources of negative attitudes toward persons
with disabilities occur along six dimensions that include sociocultural-psychological,
affective-cognitive, conscious-unconscious, past experience-present situation, internally
originated-externally originated, and theoretical-empirical. Examples of the sociocultural
dimension include perceptions of the physical body, personal appearance, personal
achievement, and productivity in employment.
But Livneh (1982) states that the biggest factor for the sociocultural dimension is “status
degradation to being disabled” (pg. 36).
Status degradation is most often drawn from the stigma of having a disability and being
treated as an outsider. Opposite to the sociocultural dimension are characteristics
typically used to describe the psychological dimension. Examples of the sociocultural
dimension include the association of many unrelated negative attributes to a person who
has one specific physical or mental disability characteristic. The psychological dimension
might also include associations related to a nondisabled person’s expectation that the
disabled person mourns or grieves the loss of a body function or part in order to
safeguard her or his own (the nondisabled group’s) values about the importance of a
“whole and functioning body”(Livneh, 1982).
However, the area most investigated in this dimension is the perception held by
nondisabled people that a disability is a form of punishment for personal or ancestral sins
and transgressions, thereby associating responsibility with the disability (Livneh, 1982).
The affective-cognitive dimension is another area of attitude formation theory that has
been heavily investigated. The affective domain is characterized as the emotional feelings
of anxiety and guilt experienced by nondisabled persons when in the presence of persons
with physical or mental disabilities. According to Livneh (1982), these emotional
12
reactions tend to be aversions to aesthetics at the sight of certain body deformities or
observed odd behavior. Livneh (1982) goes on to state that “the source most frequently
cited is the threat to one’s intact body image when in the presence of a person with a
disability” (pg. 39).
On the other hand, the cognitive aspects of this dimension include a disruption in social
rules for interaction between nondisabled and disabled persons and typically present
aspects of a fertile opportunity for all sorts of misconceptions, beliefs, and worries.
Livneh (1982) states that the “unfamiliarity and disruption often leads to avoidance or
withdrawal from the situation” (pg. 39).
While all six domains have significant influence in the development of attitudes toward
the disabled, the four remaining dimensions of Livneh’s (1982) model can be
summarized as follows:
1. Consciousness-Unconsciousness: full awareness of attitudes; associating personal
responsibility vs. childhood experiences; childrearing practices; threats to body image.
2. Past Experience-Present Situation: specific negative experience; social/moral belief vs.
ambivalence triggered by conflicts of sympathy and aversion toward the disabled person.
3. Internally Originated-Externally Originated: demographic and personality attitude
variables vs. prejudice-provoking behaviors by persons with disabilities.
4. Theoretical Sources-Empirical Sources: majority of determinants for negative attitudes
vs. growing body of research evidence associating negative attitudes and
situational/personal variables (pp. 38-45).
Other investigators (e.g., Yuker, 1988) believe that training is a key component in the
strong association between negative professional attitudes and people with disabilities.
Yuker reports that training that emphasizes the central role of the disability and the
competence of the professional in contrast to the incompetence of the person with the
disability tends to predispose one toward negative attitudes. (p. 195).
In summary, it appears that attitude formation among helping professionals can be
associated with multiple sources and multiple dimensions. The possibility that helping
professionals can develop group membership attitudes in addition to negative personal
experiences might be the foundation for stigma, bias, and stereotyping toward persons
with physical and mental disabilities.
2.5.3. Stigma
People with disabilities, as a minority group, are involved in the same struggles as other
minority groups in terms of overcoming discrimination, prejudice, and the stigma
associated with negative labels. Entering into and interacting with mainstream society has
led many with disabilities to challenge the way others view disabilities as well as combat
their own negative self-perception about their disability. For professional helpers, a
13
counselor’s feelings and attitude toward their clients may either enhance or destroy the
potential for establishing a therapeutic relationship. According to Marshall (1992),
“Uniform positive attitudes are necessary to the development and the maintenance of a
successful therapeutic relationship with the patient” (pg. 12).
The discussion on the concept of stigma can begin with the work of Erving Goffman
(1963), which is considered to be classic in numerous studies. Stigma can be defined as a
visible mark used to disgrace, shame, condemn, or ostracize. Goffman (1963) has defined
stigma as an attribute that is deeply discrediting and as an undesired differentness.
Goffman has identified six general dimensions of social stigmas relevant to people with
disabilities:
a) Concealability – the extent to which a condition is hidden or apparent to others;
b) Disruptiveness - the degree of interference with social interactions and relationships;
c) Aesthetics - how others react to the condition with dislike or disgust;
d) Origin - the responsibility attributed for causing or maintaining the stigmatized
condition;
e) course - the degree to which the condition is alterable or progressively degenerative;
and f) peril - whether the condition will physically, socially, or morally contaminate
others. Therefore, the concept of stigma includes both cognitive and behavioral
components. People who are characterized by these dimensions are subject to the adverse
effects of social stigmas and related prejudices. While these dimensions may be clear
enough, Allison-Bolger (1999) says that the true meaning of a concept may only emerge
through use and gives this example:
“The attitudes we normals have toward a person with a stigma. The key phrase
here is,a person with a stigma. This implies stigma is something a person has,
which is attached to, but somehow separate from, him or her” (p. 627).
This example highlights the fact that stigma is considered both an attitude and an
attribute.
Allison-Bolger further observed that regardless of the concept applied, stigma is separate
from the individual.
2.2.4. Stereotype
According to Bogdan & Biklen (1993), Belief and assumptions about people with
disabilities that promote the differential and unequal treatment practices are usually
because of apparent or assumed physical, mental, or behavioral differences. (p. 69).
Two terms that point ultimately to discrimination are prejudice and stereotype.
14
The topic of prejudice has been highly researched, and the generally agreed-upon
description is that of a negative bias or disliking of people because they belong to a
particular group one dislikes.
The group is often an ethnic, racial, or other social category (Wasserman & Mahowald,
1998). Bogdan & Biklen (1993) define the term prejudice as any over generalized or
oversimplified belief about the characteristics of a group or category of people. (p. 69).
Prejudiced assumptions directed toward the disabled include such statements as: they are
incapable; they are naturally inferior and I thank God I’m not them; and they have more
in common with each other than with nondisabled persons (Bogdan & Biklen, 1993).
These are the types of assumptions and beliefs that enable preconceptions and negative
reactions toward people with disabilities.
Among professional helpers, some studies have already demonstrated that helping
professionals have attitudes toward the disabled that are consistently lower than expected
(Yuker, 1988). Wicas and Carluccio go further by stating: It would be erroneous to
assume that an accumulation of credits in a counselor training program will alter deep-
rooted attitudes, prejudices, and beliefs held by counselor trainees. (pg. 26).
As mentioned earlier, the subject of prejudice is a widely researched topic, and several
theories have evolved from this research.
These theories include the ego-defense theory; scapegoating, or believing that people will
blame frustration and setbacks on others (Forsyth, 1995); and cognitive theories
suggesting that prejudice stems from the tendency of people to categorize others into
groups, particularly groups of “us” and “them” (Myers, 1990).
Although most theorists will probably agree that no one theory can be accountable for the
complex interaction of numerous factors, the cognitive theory will be discussed further.
According to Myers (1990), the cognitive theory for the causes of prejudicial attitudes
builds on the categorization concepts mentioned earlier.
15
CHAPTER 3: METHODOLOGY
The purpose of this investigation was to determine whether there were
differences between Doctors and Nurses’ attitudes and supportive staff’s attitudes toward
the mentally ill and whether academic discipline, levels of training and experience,
occupation, and background affect the attitudes of these professional groups. Three
hypotheses, which are listed below, were formulated for this study
1. Doctors and nurses’ attitudes toward the inclusion of persons with psychiatric
disabilities will be more positive than supportive staff's attitudes.
2. Staff workers in professional positions will have a stronger belief in the need to
include consumers in the decision-making process about their future than the
paraprofessional workers.
3. Professional background variables (including academic discipline, levels of
training and experience, and occupation) have an effect on MH and SA
professionals’ attitudes toward dually diagnosed clients.
This chapter, which is divided into five sections, will delineate the methodology used to
conduct this study. Section one presents the research design used in this study. Section
two presents the sample population along with the criteria for participation. Section three
presents the instruments used in this study. Sections four and five present the data
collection procedure and analysis.
3.1. Research design
The most common type of non experimental study is the survey research method, which
was used in this study.
Survey research involves any measurement procedure that asks questions of respondents.
Surveys pertain to almost any topic and can be divided into two broad categories: the
questionnaire and the interview (Rea & Parker, 1997).
After receiving permission from the Director General of Ndera Neuropsychiatric hospital,
the researcher administered a Likert-type rating scale instrument for the purpose of
determining professional attitudes toward the mentally ill patients.
3.2. Participants
The participants for this study consisted of staff professionals employed at Ndera
Neuropsychiatric hospital, a referral hospital in mental health located in a Kigali city.
A convenience sample consists of any participants who happen to be available at the time
of data collection.
The criteria for participation in this study included:
16
1) Meeting all the guidelines for employment as a mental health care
provider or supportive staff.
2) Accepting to participate in the research
Of the 103 mental health care professionals targeted for the study, 72 volunteered to
participate in the study. All 72 survey forms were complete and were included in the data
analysis. Of the 72 participants, 55 identified themselves as mental health direct care
providers and 17 identified themselves as supportive professionals.
3.3. Instruments
3.3.1. Demographic questionnaire
This was developed by the researcher to collect demographic data
3.3.2. The Community Attitudes towards the Mentally Ill (CAMI) Scale
The Community Attitudes towards the Mentally Ill (CAMI) is a 40-item questionnaire
developed by Taylor et al. (1979). Four separate scales designed to measure attitudes
towards the mentally ill were created. These scales represent specific dimensions:
authoritarianism, benevolence, social restrictiveness, and community mental health
ideology.
Authoritarianism refers to a view of the mentally ill person as someone inferior who
requires coercive handling. Social restrictiveness refers to the belief that the mentally ill
patients are a threat to society and should be avoided. Benevolence corresponds to a
paternalistic and sympathetic view of the mentally ill patient. Community mental health
ideology concerns the acceptance of mental health services and mentally ill patients in
the community.
Taylor and Dear (1981) selected these four dimensions from existing scales to create a
scale which “discriminates between those who accept and those who reject the mentally
ill in their community”.
Their questionnaire is in parts a modification of two other questionnaires: The Opinion
about Mental Illness questionnaire (Cohen & Struening, 1962) and The Community
Mental Health Ideology questionnaire (Baker & Schulberg, 1967)
Each dimension in the CAMI scale is measured by 10 statements of which an equal
number are worded positively and negatively. A Likert-type scale measures attitudes on a
scale of five points, from “strongly agree” (1) to “strongly disagree” (5).
Taylor et al. (1979) reported the alpha coefficient for each of the four scales from a data
set of 1,090 subjects residing in Toronto (Canada), which varied from 0.68 to 0.88
(community mental health ideology, 0.88; social restrictiveness, 0.80; benevolence, 0.76;
17
authoritarianism, 0.68). They also reported data about external validity, using factor
analysis. Their results showed a four-factor orthogonal solution, accounting for 42% of
the variance. In addition, the authors reported a positive correlation between a priori
scales and factor scales.
Many authors have used the CAMI scale (Dulac et al. 1988; Tefft et al. 1988; Mahatane
& Johnston, 1989; Wahl & Lefkowits, 1989; Côté et al. 1992; 1993a, 1993b, 1993c;
Brockington et al. 1993; Wolff et al. 1996a, 1996b).
Dulac et al. (1988), Tefft et al. (1988), Côté et al. (1992) and Brockington et al. (1993)
worked with large data sets to measure the attitudes of English and Canadian populations
towards the mentally ill using a modified and/or short version of the CAMI scale. Most of
these authors modified the original version of the questionnaire.
Dulac et al. (1988) conducted a survey about attitudes towards the mentally ill in
Montreal (Canada) using a short, 24-item version of the CAMI on a sample of 571
subjects. They found a five-factor orthogonal solution accounting for 47% of the
cumulative variance. This analysis partly confirms the results of Taylor et al. (1979).
Tefft et al. (1988) used a shorter, 21-item, version of the CAMI on a sample of 548
subjects from Winnipeg (Canada). They administered this version and other
questionnaires about perception about the mentally ill. Their 21-item version contained
only those items that loaded at 0.50 or higher on a single factor in the Taylor and Dear
(1981) analysis. Their data indicated an alpha coefficient range from 0.55 to 0.75 for the
four scales. Factor analysis confirmed the four dimensions of Taylor and Dear (1981)
about attitudes towards the mentally ill: the four factors accounted for 52% of the
variance. One limitation of this study is the fact that the subjects’ responses were simply
“agree” or “disagree”; which reduced the variance.
Recently Brockington et al. (1993) used a modified version of the CAMI scale (31 items)
to measure attitudes about mental illness of around 2,000 subjects from two areas in
England (Malvern and Bromsgrove). The factor analysis revealed three dimensions
(authoritarianism, benevolence, and fear of the mentally ill), partly confirming the
findings of Taylor and Dear (1981).
Côté et al. (1993a) used the CAMI scale (see also Côté et al. 1992, 1993b) to measure
attitudes towards the mentally ill of professionals working in a large number of
psychiatric institutions. These authors worked with a version of the CAMI scale that was
composed of ten items with a Likert-type scale of six points. The alpha coefficient was
very high at 0.91.
In general, their results indicated that psychiatrists and social workers had less negative
attitudes towards the mentally ill than did the doctors and auxiliary nurses.
18
3.4. Variables
Two set of data were collected
3.4.1. Dependent variables
Community Attitudes towards the Mentally Ill (CAMI) is a 40-item questionnaire
developed by Taylor et al. (1979). The four factors derived from their analysis are:
Authoritarianism
Social Restrictiveness
Benevolence
Community Mental Health Ideology
3.4.2. Independent variables
Gender
Age
Academic Discipline:
Training and Experience:
Occupation
3.5. Data collection procedures
After receiving permission, the questionnaire was distributed to the staff members who
satisfied the criteria and were available at the time of the research.
Every staff member was met personally and was given his/her questionnaire to ensure
that he/she responded to it.
The respondents were asked to indicate the extent to which they agreed or disagreed with
the statements in the CAMI Scale on a five-point scale, ranging from 1=strongly agree to
5= strongly disagree.
3.6. Data analysis
A total of 72 respondents participated in the study. After the data were collected, they
were entered into SPSS 16.0 for Windows. When all data had been entered and cleaned,
the hard copy of the data was destroyed.
19
Descriptive statistics were computed first to ensure that all of the data were entered
properly and to check for missing data. Descriptive statistics were also explored initially
to observe the patterns in the data as well as examine the normality of the dependent
variables.
Also, descriptive analysis was performed on the last demographic question regarding
different views on the decision-making.
Multiple analyses were conducted to determine the relationships between the independent
variables, demographics, and the CAMI scale.
Bivariate analyses were performed initially to examine the predictive ability of each
demographic variable in relation to each of the dependent variables.
These bivariate analyses also provided justification for the use of multivariate analysis of
covariance which controls for the influence of covariates on the dependent variables.
Thus, if the covariates did not indicate any predictive ability on the dependent measures,
it would have been more appropriate to conduct a multivariate analysis of variance.
Multivariate analysis of variance (MANOVA) was utilized to determine if a difference
exists between groups of the independent variables on a linear combination of the
dependent variables.
MANCOVA also controlled for the demographic covariates which may affect the
dependent variables.
20
CHAPTER 4: RESULTS
The main purpose of this study was to determine whether there are differences in
attitudes between directly involved and supportive professionals toward the mentally ill
clients received in the Ndera Neuropsychiatric hospital.
The secondary purpose was to determine whether higher levels of education and/or more
experience in the field would have an impact on the professional’s attitudes towards
mental illness.
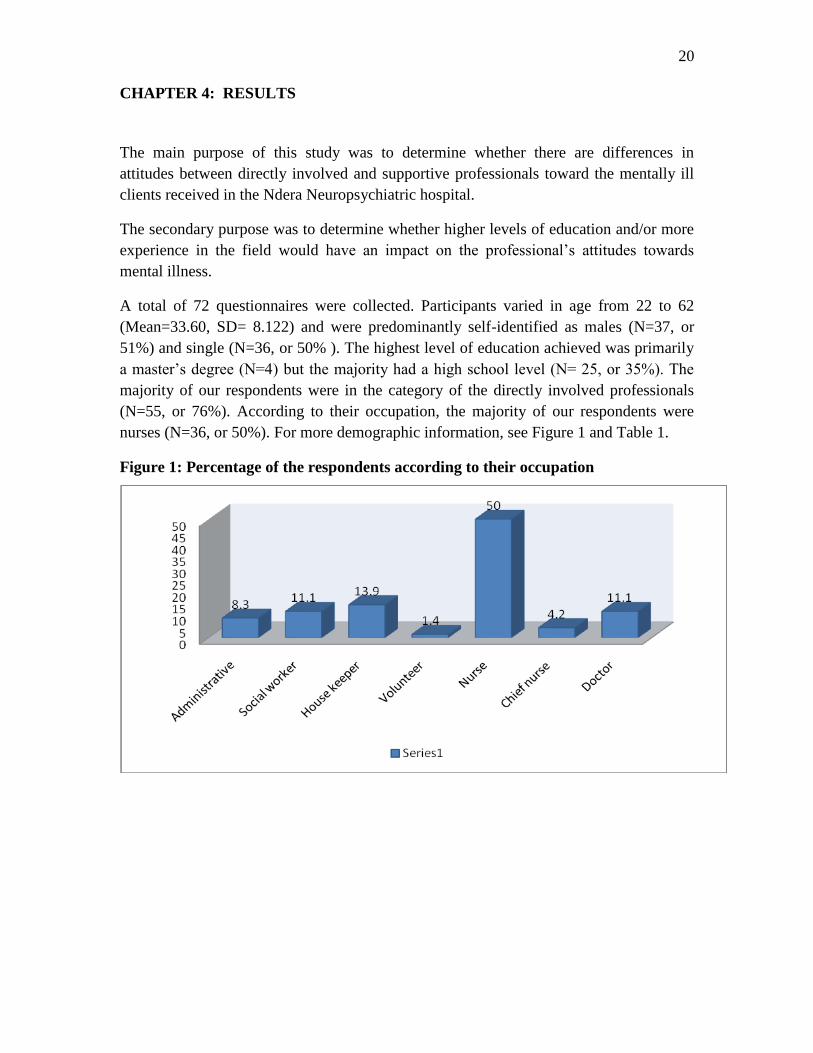
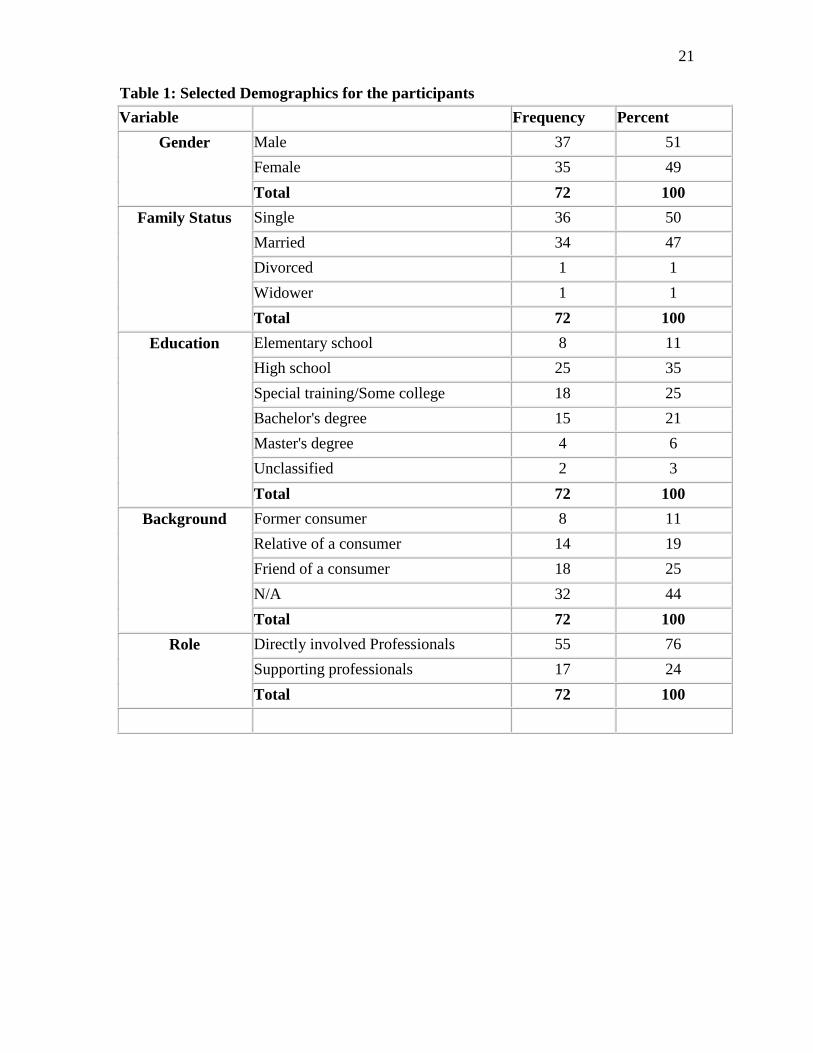
A total of 72 questionnaires were collected. Participants varied in age from 22 to 62
(Mean=33.60, SD= 8.122) and were predominantly self-identified as males (N=37, or
51%) and single (N=36, or 50% ). The highest level of education achieved was primarily
a master’s degree (N=4) but the majority had a high school level (N= 25, or 35%). The
majority of our respondents were in the category of the directly involved professionals
(N=55, or 76%). According to their occupation, the majority of our respondents were
nurses (N=36, or 50%). For more demographic information, see Figure 1 and Table 1.
Figure 1: Percentage of the respondents according to their occupation
21
Table 1: Selected Demographics for the participants
Variable Frequency Percent
Gender Male 37 51
Female 35 49
Total 72 100
Family Status Single 36 50
Married 34 47
Divorced 1 1
Widower 1 1
Total 72 100
Education Elementary school 8 11
High school 25 35
Special training/Some college 18 25
Bachelor's degree 15 21
Master's degree 4 6
Unclassified 2 3
Total 72 100
Background Former consumer 8 11
Relative of a consumer 14 19
Friend of a consumer 18 25
N/A 32 44
Total 72 100
Role Directly involved Professionals 55 76
Supporting professionals 17 24
Total 72 100
22
4.1. Attitudes towards the mentally ill patient
As indicated in tables 2, 3, 4, and 5; the majority agreed with the positive attitudes and
disagreed with the negative ones.
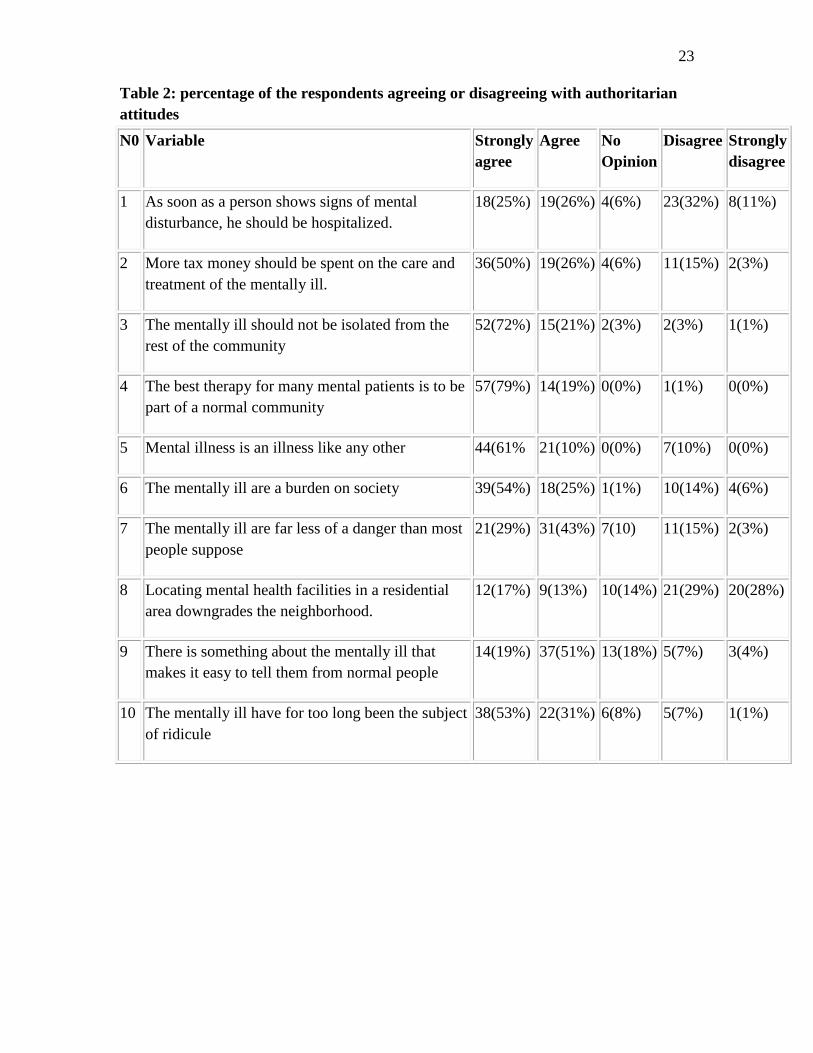
Regarding the attitudes of the Authoritarianism subscale of the CAMI scale, the majority
of the respondents agreed with the positive attitudes.
55 respondents or 76% of our respondents agreed that more tax money should be spent
on the care and treatment of mentally ill patients.
71 or 98% of the respondents agreed that the best therapy for many mental patients is to
be part of the normal community.
When it comes to the negative attitudes, within this subscale, the majority of our
respondents disagreed with them. 41 or 57% of the respondents don’t think that locating
mental health facilities in a residential area downgrades the neighborhood.
However, 37 or 51% of the respondents think that as soon as a person shows signs of
mental disturbances, he should be hospitalized.
This may be due to the fact that mental health services in the community are not
organized well enough; there is only one psychiatric nurse who is based at the district
hospital level and this one is unable to provide care to all mental health service seekers in
the district.
The mean score for all the items is 3.98. All details can be seen on the table 2 and 3.
23
Table 2: percentage of the respondents agreeing or disagreeing with authoritarian
attitudes
N0 Variable Strongly
agree
Agree No
Opinion
Disagree Strongly
disagree
1 As soon as a person shows signs of mental
disturbance, he should be hospitalized.
18(25%) 19(26%) 4(6%) 23(32%) 8(11%)
2 More tax money should be spent on the care and
treatment of the mentally ill.
36(50%) 19(26%) 4(6%) 11(15%) 2(3%)
3 The mentally ill should not be isolated from the
rest of the community
52(72%) 15(21%) 2(3%) 2(3%) 1(1%)
4 The best therapy for many mental patients is to be
part of a normal community
57(79%) 14(19%) 0(0%) 1(1%) 0(0%)
5 Mental illness is an illness like any other 44(61% 21(10%) 0(0%) 7(10%) 0(0%)
6 The mentally ill are a burden on society 39(54%) 18(25%) 1(1%) 10(14%) 4(6%)
7 The mentally ill are far less of a danger than most
people suppose
21(29%) 31(43%) 7(10) 11(15%) 2(3%)
8 Locating mental health facilities in a residential
area downgrades the neighborhood.
12(17%) 9(13%) 10(14%) 21(29%) 20(28%)
9 There is something about the mentally ill that
makes it easy to tell them from normal people
14(19%) 37(51%) 13(18%) 5(7%) 3(4%)
10 The mentally ill have for too long been the subject
of ridicule
38(53%) 22(31%) 6(8%) 5(7%) 1(1%)
24
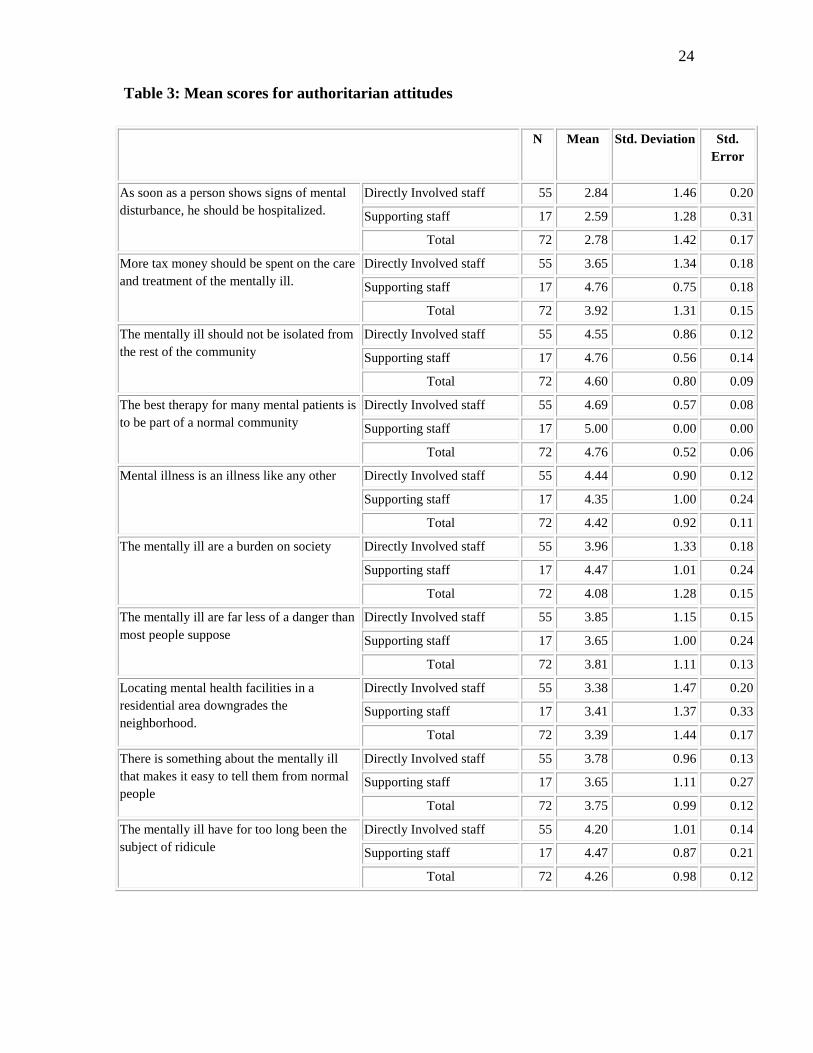
Table 3: Mean scores for authoritarian attitudes
N Mean Std. Deviation Std.
Error
As soon as a person shows signs of mental
disturbance, he should be hospitalized.
Directly Involved staff 55 2.84 1.46 0.20
Supporting staff 17 2.59 1.28 0.31
Total 72 2.78 1.42 0.17
More tax money should be spent on the care
and treatment of the mentally ill.
Directly Involved staff 55 3.65 1.34 0.18
Supporting staff 17 4.76 0.75 0.18
Total 72 3.92 1.31 0.15
The mentally ill should not be isolated from
the rest of the community
Directly Involved staff 55 4.55 0.86 0.12
Supporting staff 17 4.76 0.56 0.14
Total 72 4.60 0.80 0.09
The best therapy for many mental patients is
to be part of a normal community
Directly Involved staff 55 4.69 0.57 0.08
Supporting staff 17 5.00 0.00 0.00
Total 72 4.76 0.52 0.06
Mental illness is an illness like any other Directly Involved staff 55 4.44 0.90 0.12
Supporting staff 17 4.35 1.00 0.24
Total 72 4.42 0.92 0.11
The mentally ill are a burden on society Directly Involved staff 55 3.96 1.33 0.18
Supporting staff 17 4.47 1.01 0.24
Total 72 4.08 1.28 0.15
The mentally ill are far less of a danger than
most people suppose
Directly Involved staff 55 3.85 1.15 0.15
Supporting staff 17 3.65 1.00 0.24
Total 72 3.81 1.11 0.13
Locating mental health facilities in a
residential area downgrades the
neighborhood.
Directly Involved staff 55 3.38 1.47 0.20
Supporting staff 17 3.41 1.37 0.33
Total 72 3.39 1.44 0.17
There is something about the mentally ill
that makes it easy to tell them from normal
people
Directly Involved staff 55 3.78 0.96 0.13
Supporting staff 17 3.65 1.11 0.27
Total 72 3.75 0.99 0.12
The mentally ill have for too long been the
subject of ridicule
Directly Involved staff 55 4.20 1.01 0.14
Supporting staff 17 4.47 0.87 0.21
Total 72 4.26 0.98 0.12
25
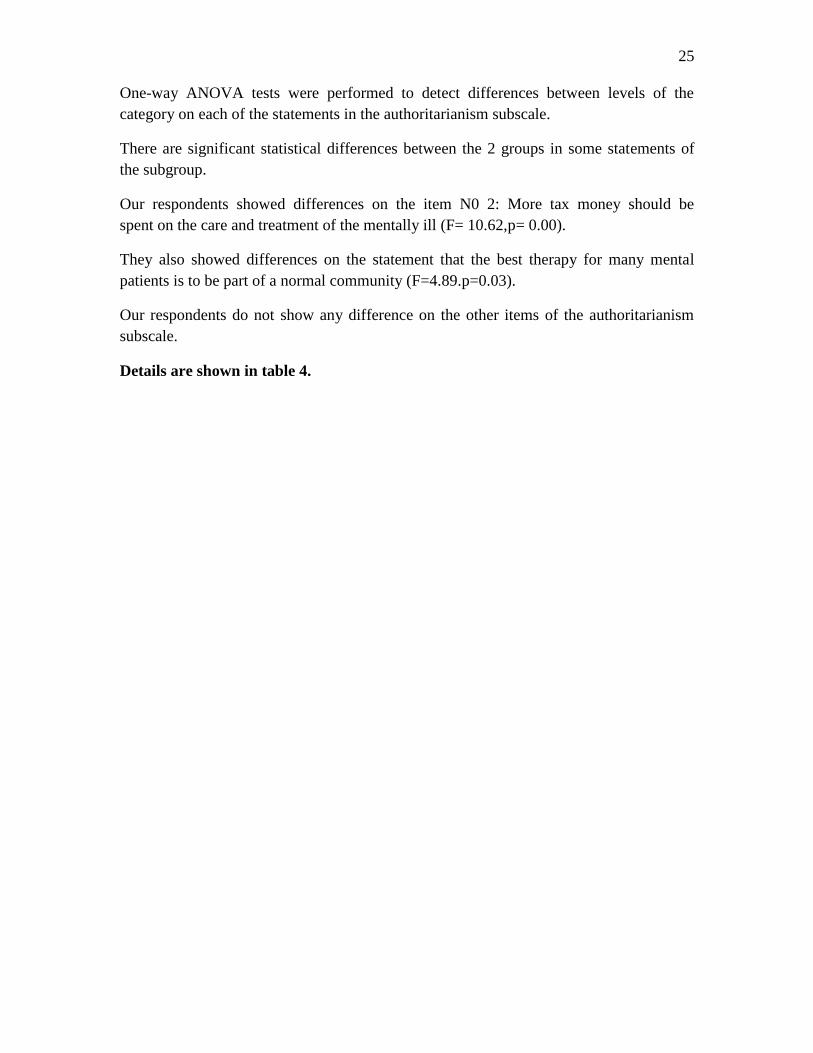
One-way ANOVA tests were performed to detect differences between levels of the
category on each of the statements in the authoritarianism subscale.
There are significant statistical differences between the 2 groups in some statements of
the subgroup.
Our respondents showed differences on the item N0 2: More tax money should be
spent on the care and treatment of the mentally ill (F= 10.62,p= 0.00).
They also showed differences on the statement that the best therapy for many mental
patients is to be part of a normal community (F=4.89.p=0.03).
Our respondents do not show any difference on the other items of the authoritarianism
subscale.
Details are shown in table 4.
26
Table 4: One-way ANOVA for authoritarianism statements
Sum of
Squares
df Mean
Square
F Sig.
As soon as a person shows signs of mental
disturbance, he should be hospitalized.
Between Groups 0.80 1 0.80 0.40 0.53
Within Groups 141.64 70 2.02
Total 142.44 71
More tax money should be spent on the care and
treatment of the mentally ill.
Between Groups 16.00 1 16.00 10.62 0.00
Within Groups 105.50 70 1.51
Total 121.50 71
The mentally ill should not be isolated from the
rest of the community
Between Groups 0.62 1 0.62 0.98 0.33
Within Groups 44.70 70 0.64
Total 45.32 71
The best therapy for many mental patients is to
be part of a normal community
Between Groups 1.24 1 1.24 4.89 0.03
Within Groups 17.75 70 0.25
Total 18.99 71
Mental illness is an illness like any other Between Groups 0.09 1 0.09 0.11 0.75
Within Groups 59.41 70 0.85
Total 59.50 71
The mentally ill are a burden on society Between Groups 3.34 1 3.34 2.08 0.15
Within Groups 112.16 70 1.60
Total 115.50 71
The mentally ill are far less of a danger than
most people suppose
Between Groups 0.56 1 0.56 0.45 0.50
Within Groups 86.72 70 1.24
Total 87.28 71
Locating mental health facilities in a residential
area downgrades the neighborhood.
Between Groups 0.01 1 0.01 0.01 0.94
Within Groups 147.10 70 2.10
Total 147.11 71
There is something about the mentally ill that
makes it easy to tell them from normal people
Between Groups 0.24 1 0.24 0.24 0.63
Within Groups 69.26 70 0.99
Total 69.50 71
The mentally ill have for too long been the
subject of ridicule
Between Groups 0.95 1 0.95 0.99 0.32
Within Groups 67.04 70 0.96
Total 67.99 71
27
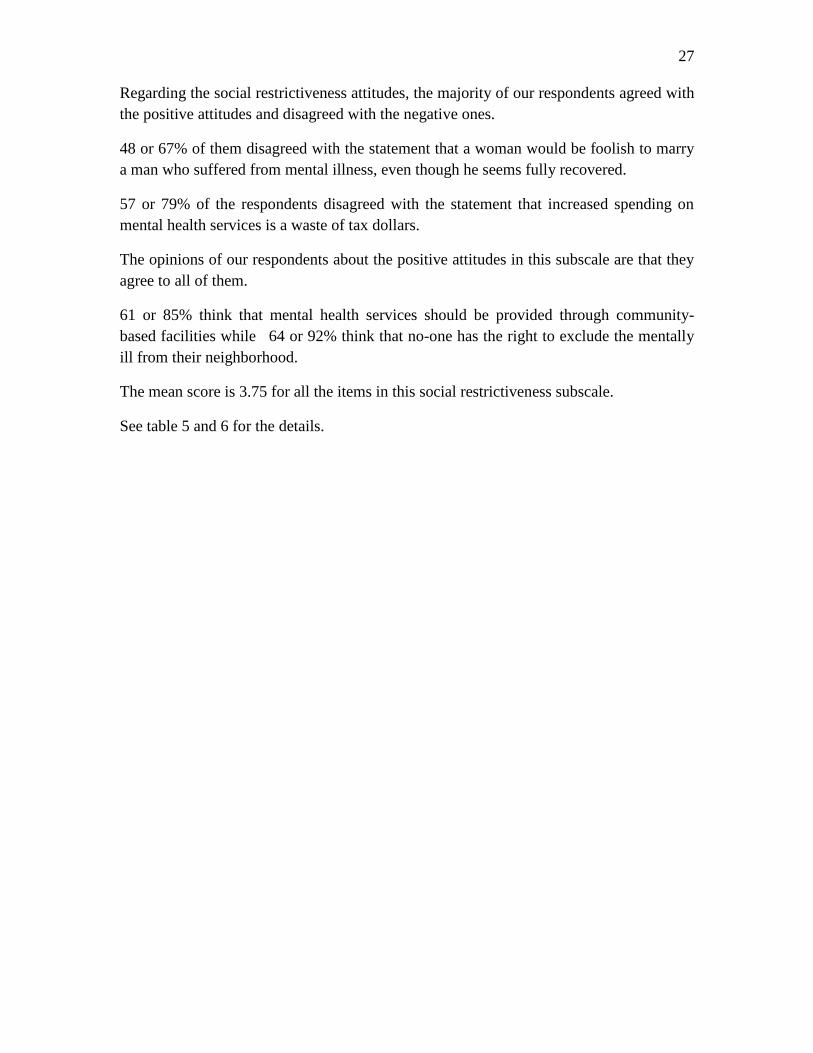
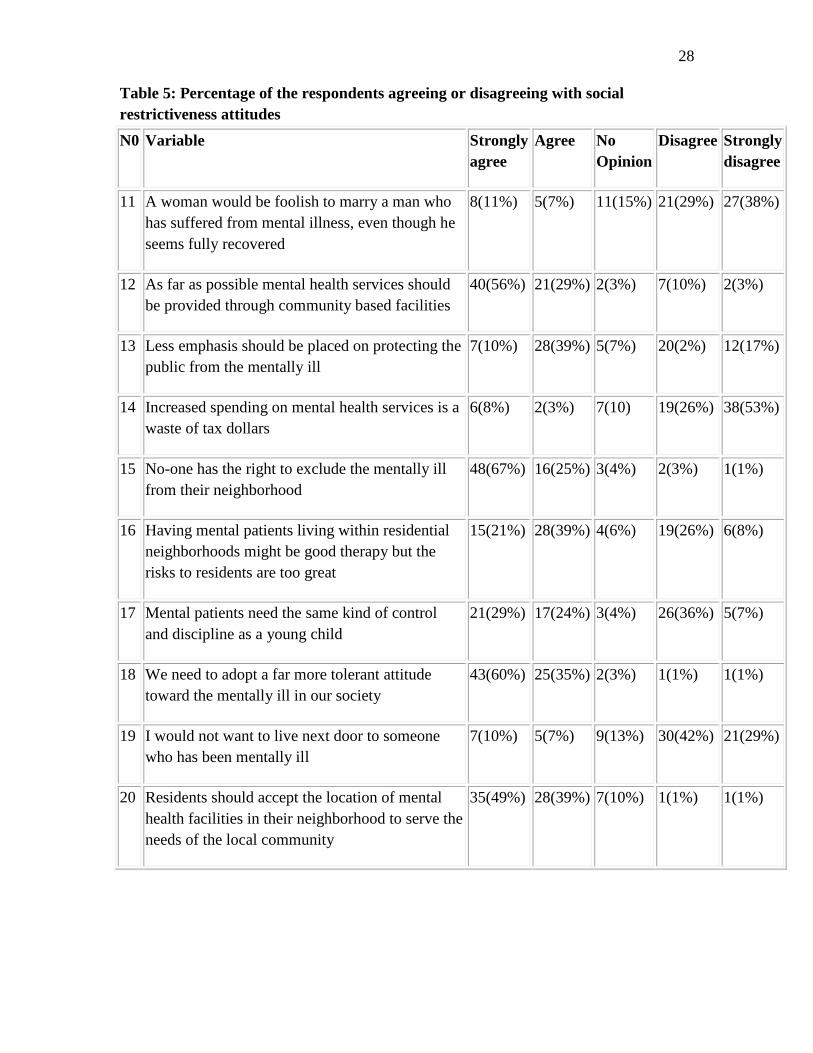
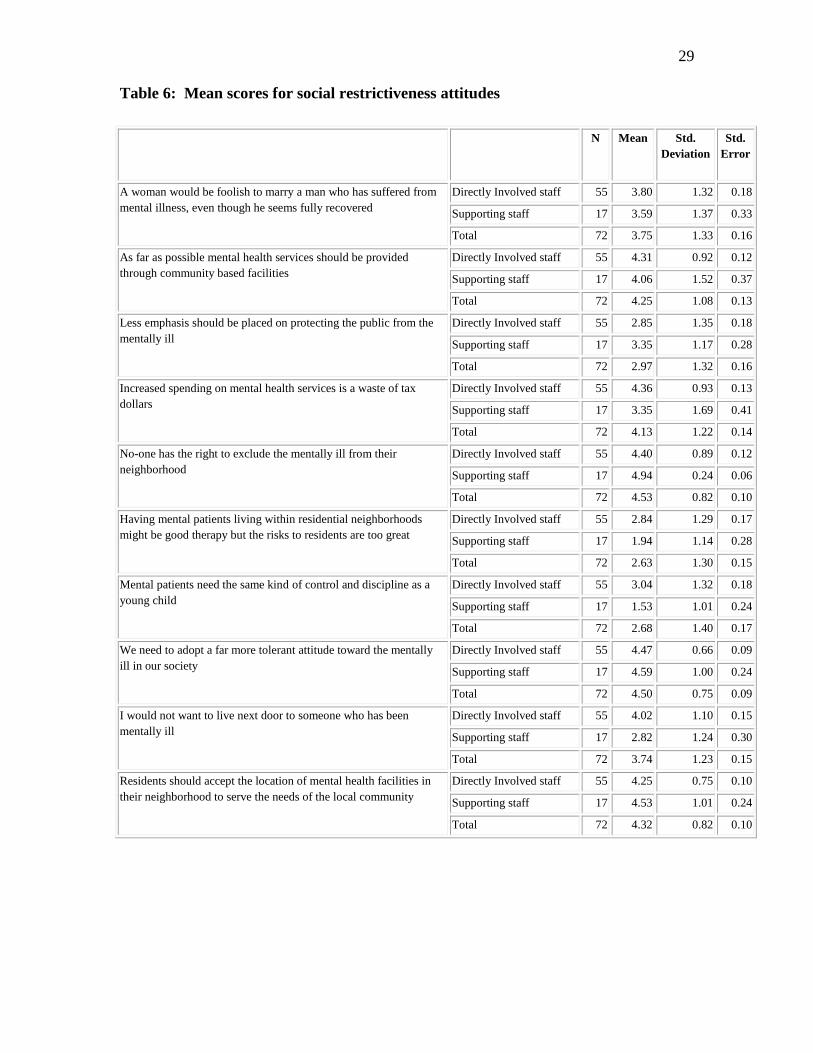
Regarding the social restrictiveness attitudes, the majority of our respondents agreed with
the positive attitudes and disagreed with the negative ones.
48 or 67% of them disagreed with the statement that a woman would be foolish to marry
a man who suffered from mental illness, even though he seems fully recovered.
57 or 79% of the respondents disagreed with the statement that increased spending on
mental health services is a waste of tax dollars.
The opinions of our respondents about the positive attitudes in this subscale are that they
agree to all of them.
61 or 85% think that mental health services should be provided through community-
based facilities while 64 or 92% think that no-one has the right to exclude the mentally
ill from their neighborhood.
The mean score is 3.75 for all the items in this social restrictiveness subscale.
See table 5 and 6 for the details.
28
Table 5: Percentage of the respondents agreeing or disagreeing with social
restrictiveness attitudes
N0 Variable Strongly
agree
Agree No
Opinion
Disagree Strongly
disagree
11 A woman would be foolish to marry a man who
has suffered from mental illness, even though he
seems fully recovered
8(11%) 5(7%) 11(15%) 21(29%) 27(38%)
12 As far as possible mental health services should
be provided through community based facilities
40(56%) 21(29%) 2(3%) 7(10%) 2(3%)
13 Less emphasis should be placed on protecting the
public from the mentally ill
7(10%) 28(39%) 5(7%) 20(2%) 12(17%)
14 Increased spending on mental health services is a
waste of tax dollars
6(8%) 2(3%) 7(10) 19(26%) 38(53%)
15 No-one has the right to exclude the mentally ill
from their neighborhood
48(67%) 16(25%) 3(4%) 2(3%) 1(1%)
16 Having mental patients living within residential
neighborhoods might be good therapy but the
risks to residents are too great
15(21%) 28(39%) 4(6%) 19(26%) 6(8%)
17 Mental patients need the same kind of control
and discipline as a young child
21(29%) 17(24%) 3(4%) 26(36%) 5(7%)
18 We need to adopt a far more tolerant attitude
toward the mentally ill in our society
43(60%) 25(35%) 2(3%) 1(1%) 1(1%)
19 I would not want to live next door to someone
who has been mentally ill
7(10%) 5(7%) 9(13%) 30(42%) 21(29%)
20 Residents should accept the location of mental
health facilities in their neighborhood to serve the
needs of the local community
35(49%) 28(39%) 7(10%) 1(1%) 1(1%)
29
Table 6: Mean scores for social restrictiveness attitudes
N Mean Std.
Deviation
Std.
Error
A woman would be foolish to marry a man who has suffered from
mental illness, even though he seems fully recovered
Directly Involved staff 55 3.80 1.32 0.18
Supporting staff 17 3.59 1.37 0.33
Total 72 3.75 1.33 0.16
As far as possible mental health services should be provided
through community based facilities
Directly Involved staff 55 4.31 0.92 0.12
Supporting staff 17 4.06 1.52 0.37
Total 72 4.25 1.08 0.13
Less emphasis should be placed on protecting the public from the
mentally ill
Directly Involved staff 55 2.85 1.35 0.18
Supporting staff 17 3.35 1.17 0.28
Total 72 2.97 1.32 0.16
Increased spending on mental health services is a waste of tax
dollars
Directly Involved staff 55 4.36 0.93 0.13
Supporting staff 17 3.35 1.69 0.41
Total 72 4.13 1.22 0.14
No-one has the right to exclude the mentally ill from their
neighborhood
Directly Involved staff 55 4.40 0.89 0.12
Supporting staff 17 4.94 0.24 0.06
Total 72 4.53 0.82 0.10
Having mental patients living within residential neighborhoods
might be good therapy but the risks to residents are too great
Directly Involved staff 55 2.84 1.29 0.17
Supporting staff 17 1.94 1.14 0.28
Total 72 2.63 1.30 0.15
Mental patients need the same kind of control and discipline as a
young child
Directly Involved staff 55 3.04 1.32 0.18
Supporting staff 17 1.53 1.01 0.24
Total 72 2.68 1.40 0.17
We need to adopt a far more tolerant attitude toward the mentally
ill in our society
Directly Involved staff 55 4.47 0.66 0.09
Supporting staff 17 4.59 1.00 0.24
Total 72 4.50 0.75 0.09
I would not want to live next door to someone who has been
mentally ill
Directly Involved staff 55 4.02 1.10 0.15
Supporting staff 17 2.82 1.24 0.30
Total 72 3.74 1.23 0.15
Residents should accept the location of mental health facilities in
their neighborhood to serve the needs of the local community
Directly Involved staff 55 4.25 0.75 0.10
Supporting staff 17 4.53 1.01 0.24
Total 72 4.32 0.82 0.10
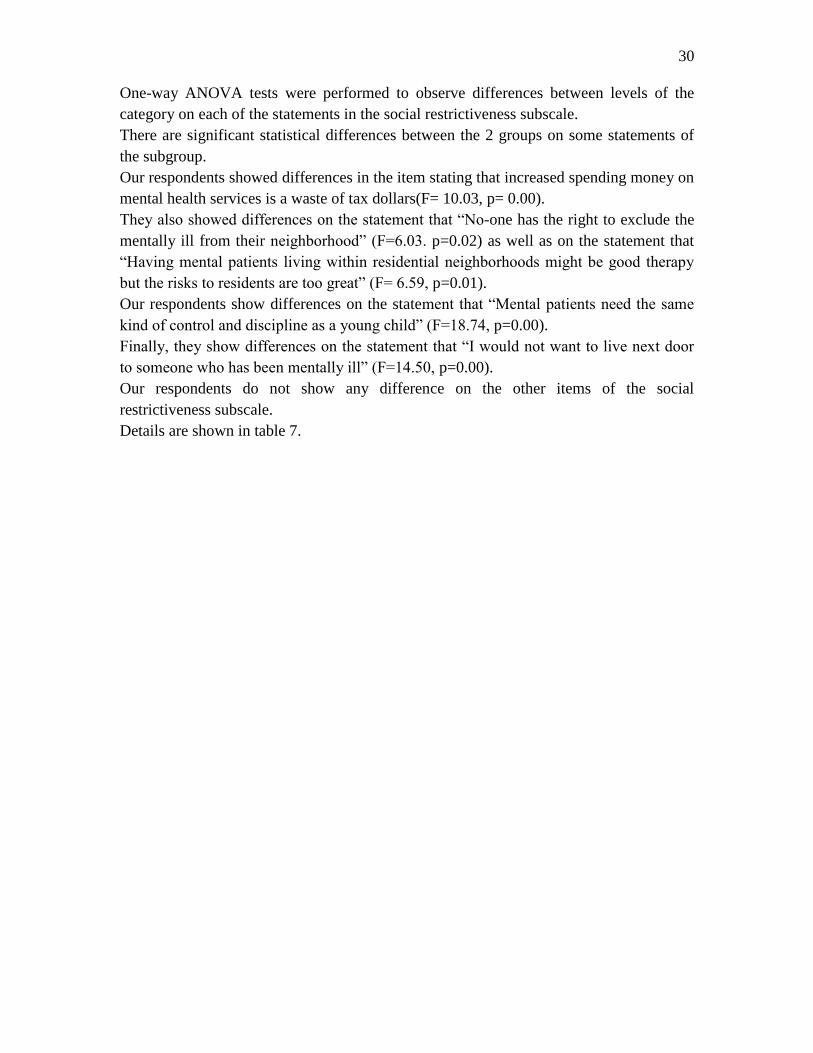
30
One-way ANOVA tests were performed to observe differences between levels of the
category on each of the statements in the social restrictiveness subscale.
There are significant statistical differences between the 2 groups on some statements of
the subgroup.
Our respondents showed differences in the item stating that increased spending money on
mental health services is a waste of tax dollars(F= 10.03, p= 0.00).
They also showed differences on the statement that “No-one has the right to exclude the
mentally ill from their neighborhood” (F=6.03. p=0.02) as well as on the statement that
“Having mental patients living within residential neighborhoods might be good therapy
but the risks to residents are too great” (F= 6.59, p=0.01).
Our respondents show differences on the statement that “Mental patients need the same
kind of control and discipline as a young child” (F=18.74, p=0.00).
Finally, they show differences on the statement that “I would not want to live next door
to someone who has been mentally ill” (F=14.50, p=0.00).
Our respondents do not show any difference on the other items of the social
restrictiveness subscale.
Details are shown in table 7.
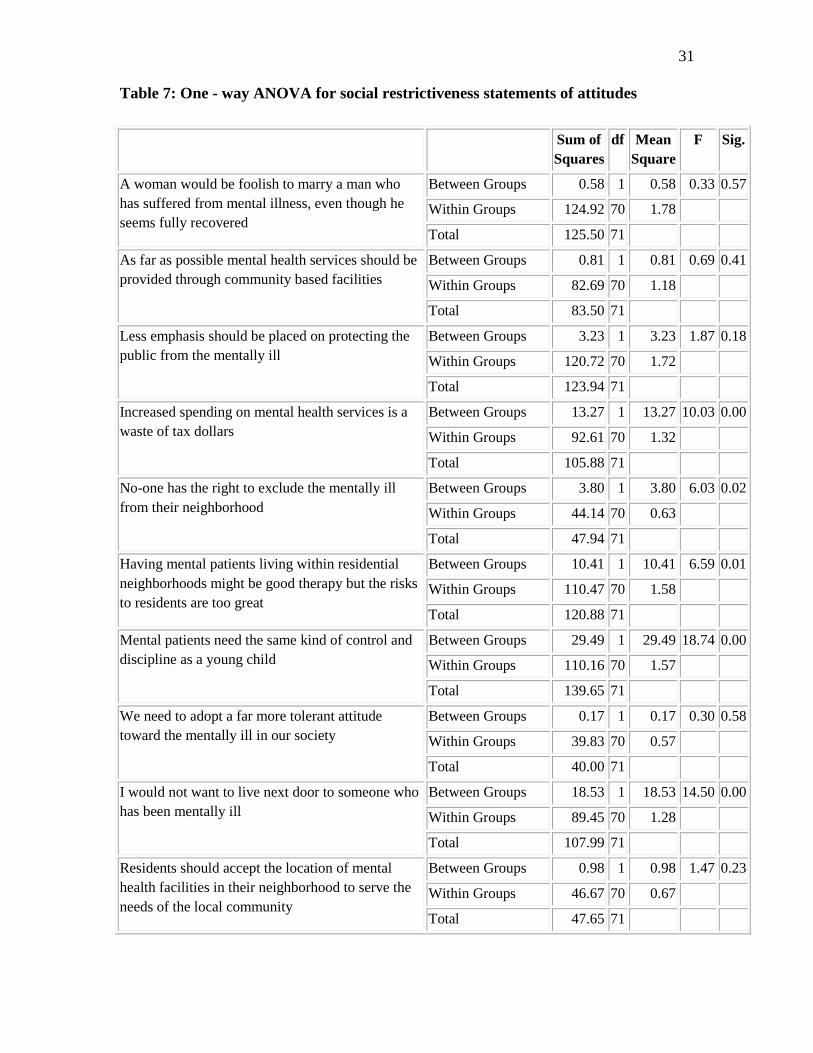
31
Table 7: One - way ANOVA for social restrictiveness statements of attitudes
Sum of
Squares
df Mean
Square
F Sig.
A woman would be foolish to marry a man who
has suffered from mental illness, even though he
seems fully recovered
Between Groups 0.58 1 0.58 0.33 0.57
Within Groups 124.92 70 1.78
Total 125.50 71
As far as possible mental health services should be
provided through community based facilities
Between Groups 0.81 1 0.81 0.69 0.41
Within Groups 82.69 70 1.18
Total 83.50 71
Less emphasis should be placed on protecting the
public from the mentally ill
Between Groups 3.23 1 3.23 1.87 0.18
Within Groups 120.72 70 1.72
Total 123.94 71
Increased spending on mental health services is a
waste of tax dollars
Between Groups 13.27 1 13.27 10.03 0.00
Within Groups 92.61 70 1.32
Total 105.88 71
No-one has the right to exclude the mentally ill
from their neighborhood
Between Groups 3.80 1 3.80 6.03 0.02
Within Groups 44.14 70 0.63
Total 47.94 71
Having mental patients living within residential
neighborhoods might be good therapy but the risks
to residents are too great
Between Groups 10.41 1 10.41 6.59 0.01
Within Groups 110.47 70 1.58
Total 120.88 71
Mental patients need the same kind of control and
discipline as a young child
Between Groups 29.49 1 29.49 18.74 0.00
Within Groups 110.16 70 1.57
Total 139.65 71
We need to adopt a far more tolerant attitude
toward the mentally ill in our society
Between Groups 0.17 1 0.17 0.30 0.58
Within Groups 39.83 70 0.57
Total 40.00 71
I would not want to live next door to someone who
has been mentally ill
Between Groups 18.53 1 18.53 14.50 0.00
Within Groups 89.45 70 1.28
Total 107.99 71
Residents should accept the location of mental
health facilities in their neighborhood to serve the
needs of the local community
Between Groups 0.98 1 0.98 1.47 0.23
Within Groups 46.67 70 0.67
Total 47.65 71
32
Regarding the benevolence attitudes from the CAMI scale, the majority of our
respondents agreed to the positive attitudes.
As an example, 70 or 97% agreed to the fact that mentally ill patients should be
encouraged to assume the responsibilities of normal life and 50 or 79% think that locating
mental health services in residential neighborhoods does not endanger local residents.
Our respondents disagreed with the negative statements of this subscale.
60 or 94 % disagreed with the statement that the best way to handle the mentally ill is to
keep them behind locked doors, and 56 or 78% disagreed with the statement that anyone
with a history of mental problems should be excluded from taking public office.
When one analyses the table on the mean scores for this subscale, the result is that our
respondents have higher scores and this means their attitudes are in favor of mentally ill
patients. The mean score is 3.88.
Details are shown in the table 8 and 9.
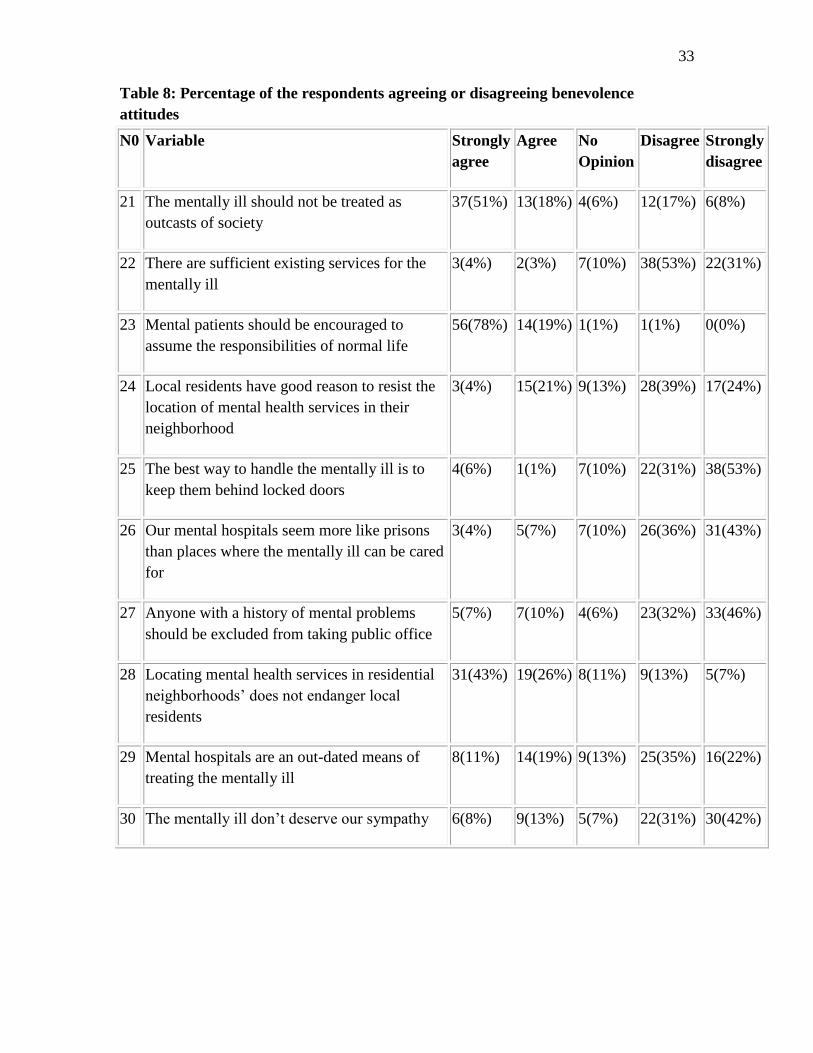
33
Table 8: Percentage of the respondents agreeing or disagreeing benevolence
attitudes
N0 Variable Strongly
agree
Agree No
Opinion
Disagree Strongly
disagree
21 The mentally ill should not be treated as
outcasts of society
37(51%) 13(18%) 4(6%) 12(17%) 6(8%)
22 There are sufficient existing services for the
mentally ill
3(4%) 2(3%) 7(10%) 38(53%) 22(31%)
23 Mental patients should be encouraged to
assume the responsibilities of normal life
56(78%) 14(19%) 1(1%) 1(1%) 0(0%)
24 Local residents have good reason to resist the
location of mental health services in their
neighborhood
3(4%) 15(21%) 9(13%) 28(39%) 17(24%)
25 The best way to handle the mentally ill is to
keep them behind locked doors
4(6%) 1(1%) 7(10%) 22(31%) 38(53%)
26 Our mental hospitals seem more like prisons
than places where the mentally ill can be cared
for
3(4%) 5(7%) 7(10%) 26(36%) 31(43%)
27 Anyone with a history of mental problems
should be excluded from taking public office
5(7%) 7(10%) 4(6%) 23(32%) 33(46%)
28 Locating mental health services in residential
neighborhoods’ does not endanger local
residents
31(43%) 19(26%) 8(11%) 9(13%) 5(7%)
29 Mental hospitals are an out-dated means of
treating the mentally ill
8(11%) 14(19%) 9(13%) 25(35%) 16(22%)
30 The mentally ill don’t deserve our sympathy 6(8%) 9(13%) 5(7%) 22(31%) 30(42%)
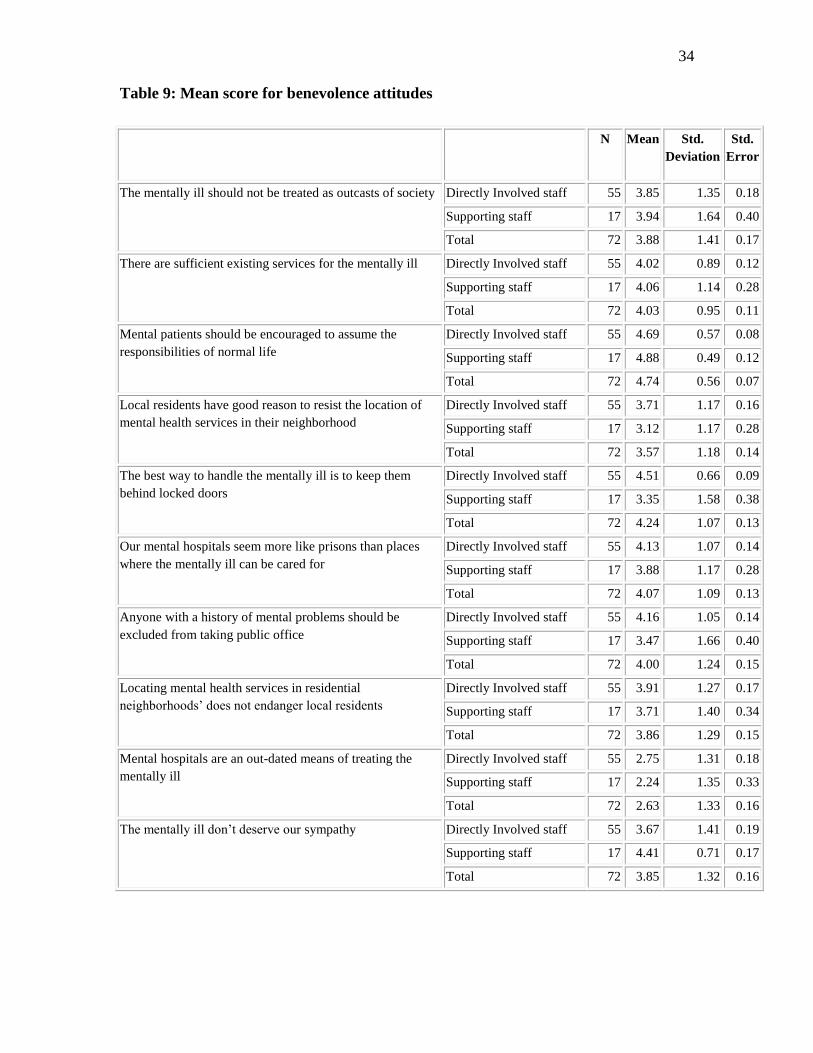
34
Table 9: Mean score for benevolence attitudes
N Mean Std.
Deviation
Std.
Error
The mentally ill should not be treated as outcasts of society Directly Involved staff 55 3.85 1.35 0.18
Supporting staff 17 3.94 1.64 0.40
Total 72 3.88 1.41 0.17
There are sufficient existing services for the mentally ill Directly Involved staff 55 4.02 0.89 0.12
Supporting staff 17 4.06 1.14 0.28
Total 72 4.03 0.95 0.11
Mental patients should be encouraged to assume the
responsibilities of normal life
Directly Involved staff 55 4.69 0.57 0.08
Supporting staff 17 4.88 0.49 0.12
Total 72 4.74 0.56 0.07
Local residents have good reason to resist the location of
mental health services in their neighborhood
Directly Involved staff 55 3.71 1.17 0.16
Supporting staff 17 3.12 1.17 0.28
Total 72 3.57 1.18 0.14
The best way to handle the mentally ill is to keep them
behind locked doors
Directly Involved staff 55 4.51 0.66 0.09
Supporting staff 17 3.35 1.58 0.38
Total 72 4.24 1.07 0.13
Our mental hospitals seem more like prisons than places
where the mentally ill can be cared for
Directly Involved staff 55 4.13 1.07 0.14
Supporting staff 17 3.88 1.17 0.28
Total 72 4.07 1.09 0.13
Anyone with a history of mental problems should be
excluded from taking public office
Directly Involved staff 55 4.16 1.05 0.14
Supporting staff 17 3.47 1.66 0.40
Total 72 4.00 1.24 0.15
Locating mental health services in residential
neighborhoods’ does not endanger local residents
Directly Involved staff 55 3.91 1.27 0.17
Supporting staff 17 3.71 1.40 0.34
Total 72 3.86 1.29 0.15
Mental hospitals are an out-dated means of treating the
mentally ill
Directly Involved staff 55 2.75 1.31 0.18
Supporting staff 17 2.24 1.35 0.33
Total 72 2.63 1.33 0.16
The mentally ill don’t deserve our sympathy Directly Involved staff 55 3.67 1.41 0.19
Supporting staff 17 4.41 0.71 0.17
Total 72 3.85 1.32 0.16
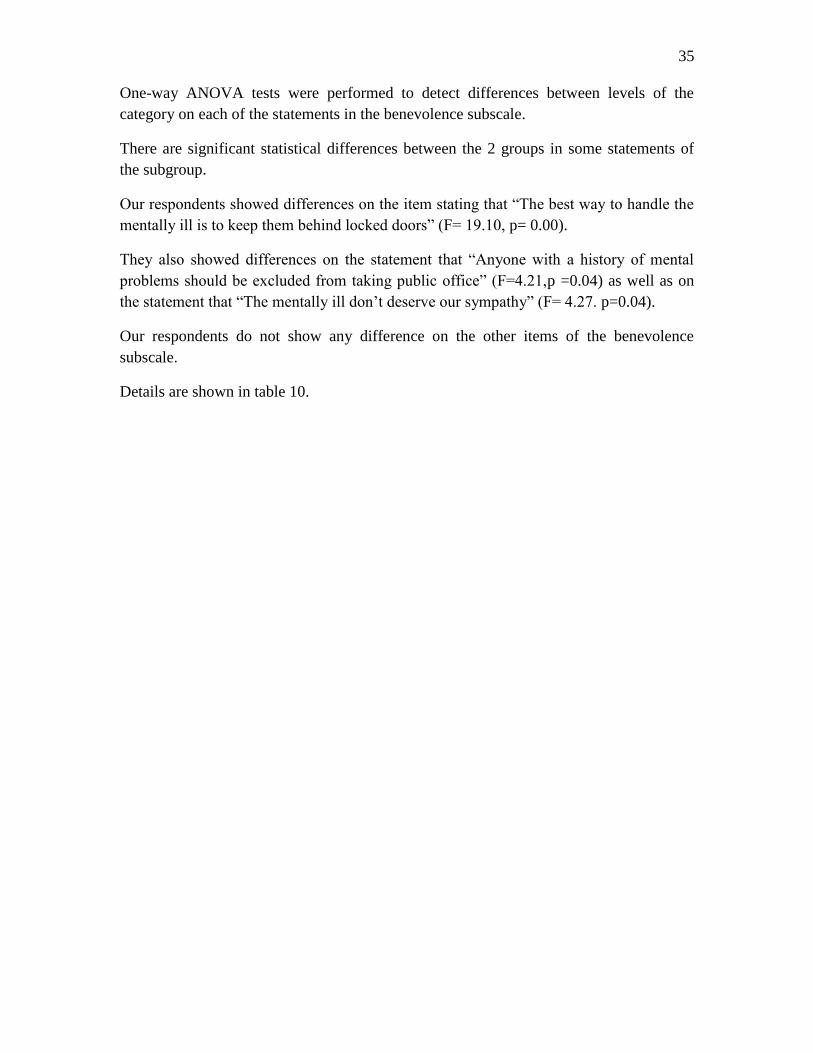
35
One-way ANOVA tests were performed to detect differences between levels of the
category on each of the statements in the benevolence subscale.
There are significant statistical differences between the 2 groups in some statements of
the subgroup.
Our respondents showed differences on the item stating that “The best way to handle the
mentally ill is to keep them behind locked doors” (F= 19.10, p= 0.00).
They also showed differences on the statement that “Anyone with a history of mental
problems should be excluded from taking public office” (F=4.21,p =0.04) as well as on
the statement that “The mentally ill don’t deserve our sympathy” (F= 4.27. p=0.04).
Our respondents do not show any difference on the other items of the benevolence
subscale.
Details are shown in table 10.
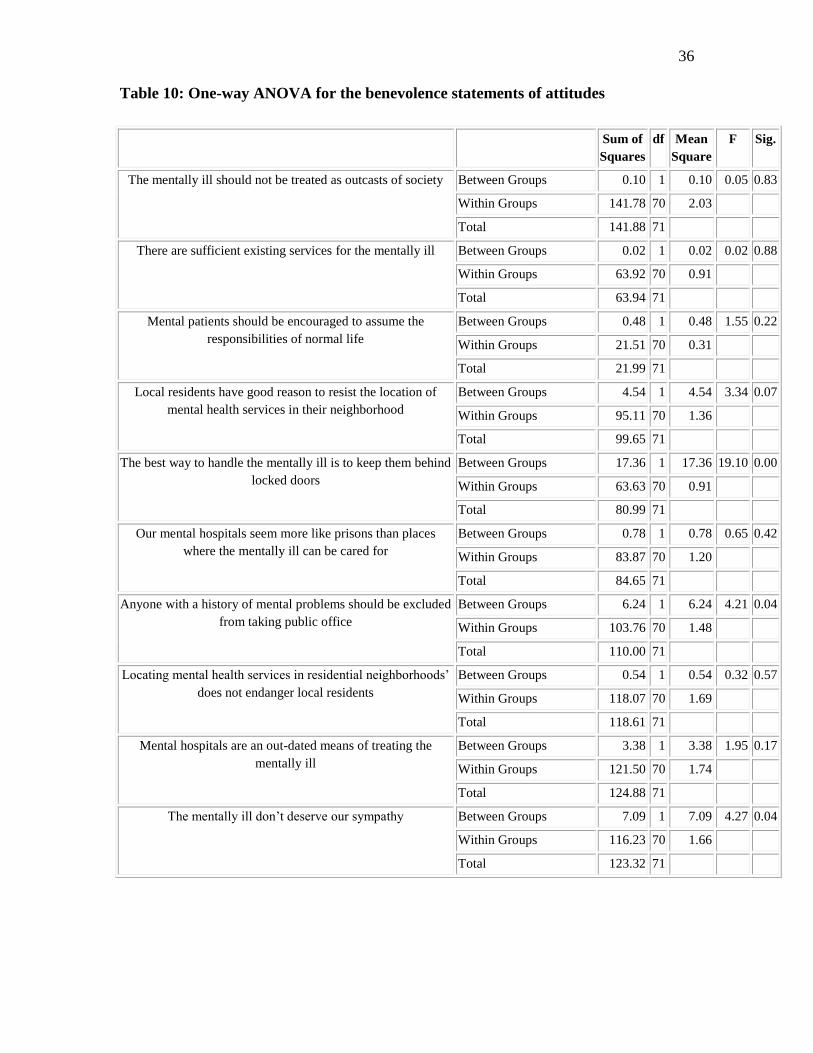
36
Table 10: One-way ANOVA for the benevolence statements of attitudes
Sum of
Squares
df Mean
Square
F Sig.
The mentally ill should not be treated as outcasts of society Between Groups 0.10 1 0.10 0.05 0.83
Within Groups 141.78 70 2.03
Total 141.88 71
There are sufficient existing services for the mentally ill Between Groups 0.02 1 0.02 0.02 0.88
Within Groups 63.92 70 0.91
Total 63.94 71
Mental patients should be encouraged to assume the
responsibilities of normal life
Between Groups 0.48 1 0.48 1.55 0.22
Within Groups 21.51 70 0.31
Total 21.99 71
Local residents have good reason to resist the location of
mental health services in their neighborhood
Between Groups 4.54 1 4.54 3.34 0.07
Within Groups 95.11 70 1.36
Total 99.65 71
The best way to handle the mentally ill is to keep them behind
locked doors
Between Groups 17.36 1 17.36 19.10 0.00
Within Groups 63.63 70 0.91
Total 80.99 71
Our mental hospitals seem more like prisons than places
where the mentally ill can be cared for
Between Groups 0.78 1 0.78 0.65 0.42
Within Groups 83.87 70 1.20
Total 84.65 71
Anyone with a history of mental problems should be excluded
from taking public office
Between Groups 6.24 1 6.24 4.21 0.04
Within Groups 103.76 70 1.48
Total 110.00 71
Locating mental health services in residential neighborhoods’
does not endanger local residents
Between Groups 0.54 1 0.54 0.32 0.57
Within Groups 118.07 70 1.69
Total 118.61 71
Mental hospitals are an out-dated means of treating the
mentally ill
Between Groups 3.38 1 3.38 1.95 0.17
Within Groups 121.50 70 1.74
Total 124.88 71
The mentally ill don’t deserve our sympathy Between Groups 7.09 1 7.09 4.27 0.04
Within Groups 116.23 70 1.66
Total 123.32 71
37
The last category of the questions asked of our participants was the attitudes that are
related to the community mental health ideology.
As it has been shown with the above statements, the majority agreed with the positive
attitudes and disagreed with the negative ones.
60 or 83 % agreed with the statements that the mentally ill should not be denied their
individual rights and 69 or 96% agreed that we have a responsibility to provide the best
possible care for the mentally ill.
In addition, 60 or 84% disagreed that the mentally ill should not be given any
responsibility. The mean score is 3.87.
Details are shown in table 11.
38
Table 11: Percentage of the respondents agreeing or disagreeing community mental
health ideology attitudes
N0 Variable Strongly
agree
Agree No
Opinion
Disagree Strongly
disagree
31 The mentally ill should not be denied their
individual rights
44(61%) 16(22%) 1(1%) 8(11%) 3(4%)
32 Mental health facilities should be kept out of
residential neighborhoods
10(14%) 11(15%) 4(6%) 30(42%) 17(24%)
33 One of the main causes of mental illness is a lack
of self-discipline and will power
2(3%) 11(15%) 9(13%) 30(42%) 20(28%)
34 We have a responsibility to provide the best
possible care for the mentally ill
53(74%) 16(22%) 0(0%) 1(1%) 2(3%)
35 The mentally ill should not be given any
responsibility
5(7%) 3(4%) 4(6%) 33(46%) 27(38%)
36 Residents have nothing to fear from people
coming into their neighborhood to obtain mental
health services.
35(49%) 25(36%) 3(4%) 5(7%) 3(4%)
37 Virtually anyone can become mentally ill 40(56%) 23(32%) 5(7%) 2(3%) 2(3%)
38 It is best to avoid anyone who has mental
problems.
10(14%) 7(10%) 4(6%) 26(36%) 25(35%)
39 Most women who were once patients in a mental
hospital can be trusted as baby sitters.
15(21%) 20(28%) 6(8%) 19(26%) 12(17%)
40 It is frightening to think of people with mental
problems living in residential neighborhoods’
6(8%) 17(24%) 10(14%) 30(42%) 9(13%)
39
Table 12: Mean scores for community mental health ideology attitudes
N Mean Std.
Deviation
Std.
Error
The mentally ill should not be denied their
individual rights
Directly Involved staff 55 4.16 1.18 0.16
Supporting staff 17 4.65 1.00 0.24
Total 72 4.28 1.15 0.14
Mental health facilities should be kept out of
residential neighborhoods
Directly Involved staff 55 3.89 1.10 0.15
Supporting staff 17 2.06 1.25 0.30
Total 72 3.46 1.37 0.16
One of the main causes of mental illness is a
lack of self-discipline and will power
Directly Involved staff 55 3.62 1.08 0.15
Supporting staff 17 4.24 1.09 0.26
Total 72 3.76 1.11 0.13
We have a responsibility to provide the best
possible care for the mentally ill
Directly Involved staff 55 4.62 0.76 0.10
Supporting staff 17 4.65 1.00 0.24
Total 72 4.63 0.81 0.10
The mentally ill should not be given any
responsibility
Directly Involved staff 55 4.09 0.99 0.13
Supporting staff 17 3.82 1.47 0.36
Total 72 4.03 1.11 0.13
Residents have nothing to fear from people
coming into their neighborhood to obtain
mental health services.
Directly Involved staff 55 4.16 1.01 0.14
Supporting staff 17 4.24 1.30 0.32
Total 72 4.18 1.08 0.13
Virtually anyone can become mentally ill Directly Involved staff 55 4.29 0.90 0.12
Supporting staff 17 4.53 1.07 0.26
Total 72 4.35 0.94 0.11
It is best to avoid anyone who has mental
problems.
Directly Involved staff 55 3.87 1.33 0.18
Supporting staff 17 3.06 1.48 0.36
Total 72 3.68 1.40 0.17
Most women who were once patients in a
mental hospital can be trusted as baby sitters.
Directly Involved staff 55 2.91 1.40 0.19
Supporting staff 17 3.71 1.40 0.34
Total 72 3.10 1.44 0.17
It is frightening to think of people with mental
problems living in residential neighborhoods’
Directly Involved staff 55 3.47 1.05 0.14
Supporting staff 17 2.59 1.42 0.34
Total 72 3.26 1.20 0.14
40
One-way ANOVA tests were performed to observe differences between levels of the
category on each of the statements in the community mental health ideology subscale.
There are significant statistical differences between the 2 groups in some statements of
the subgroup. Our respondents showed differences on the item stating that “Mental health
facilities should be kept out of residential neighborhoods” (F= 33.79, p= 0.00).
They also showed differences on the statement that “One of the main causes of mental
illness is a lack of self-discipline and will power” (F=4.22, p=0.04) as well as on the
statement that “It is best to avoid anyone who has mental problems” (F= 4.59, p=0.04).
There are significant differences on the statement that “Most women who were once
patients in a mental hospital can be trusted as baby sitters.” (F= 4.18, p=0.04) as well as
the statement that “It is frightening to think of people with mental problems living in
residential neighborhoods’” (F= 7.74, p=0.01).
Our respondents do not show any difference on the other items of the community mental
health ideology subscale.
Details are shown in table 13.
41
Table 13:One-way ANOVA for communtiy mental health ideology statements of
attitudes
Sum of
Squares
df Mean
Square
F Sig.
The mentally ill should not be denied their
individual rights
Between Groups 3.03 1 3.03 2.32 0.13
Within Groups 91.41 70 1.31
Total 94.44 71
Mental health facilities should be kept out of
residential neighborhoods
Between Groups 43.59 1 43.59 33.79 0.00
Within Groups 90.29 70 1.29
Total 133.88 71
One of the main causes of mental illness is a lack of
self-discipline and will power
Between Groups 4.95 1 4.95 4.22 0.04
Within Groups 82.04 70 1.17
Total 86.99 71
We have a responsibility to provide the best
possible care for the mentally ill
Between Groups 0.01 1 0.01 0.02 0.90
Within Groups 46.86 70 0.67
Total 46.88 71
The mentally ill should not be given any
responsibility
Between Groups 0.93 1 0.93 0.75 0.39
Within Groups 87.02 70 1.24
Total 87.94 71
Residents have nothing to fear from people coming
into their neighborhood to obtain mental health
services.
Between Groups 0.07 1 0.07 0.06 0.81
Within Groups 82.59 70 1.18
Total 82.65 71
Virtually anyone can become mentally ill Between Groups 0.74 1 0.74 0.84 0.36
Within Groups 61.58 70 0.88
Total 62.32 71
It is best to avoid anyone who has mental problems. Between Groups 8.60 1 8.60 4.59 0.04
Within Groups 131.05 70 1.87
Total 139.65 71
Most women who were once patients in a mental
hospital can be trusted as baby sitters.
Between Groups 8.24 1 8.24 4.18 0.04
Within Groups 138.07 70 1.97
Total 146.32 71
It is frightening to think of people with mental
problems living in residential neighborhoods’
Between Groups 10.16 1 10.16 7.74 0.01
Within Groups 91.83 70 1.31
Total 101.99 71
42
Independent T-tests were also conducted on each of the five factor variables to determine
if the scores in one condition do not vary significantly more than the scores in the second
condition. The aim was to see whether the variability in the two conditions is or not
significantly different.
As illustrated in Table 15, results from the Levene's Test for Equality of Variances
indicate that, for the majority of the items in the authoritarianism subscale, the variability
in our 2 groups is about the same. This means that the scores in the group of directly
involved staff do not vary much more than the scores in the supporting staff (p>0.05).
T-test for Equality of Means showed no statistically significant difference between our 2
groups in many of the items of the authoritarianism subscale.
However, there is a significant difference of means on the item no. 2. “More tax money
should be spent on the care and treatment of the mentally ill”.
The scores (T= -3.26, p= 0.00) show that the mean score for the directly involved is
greater than the score of the supportive staff for this item.
The directly involved staff also have a higher mean score on the item “The best therapy
for many mental patients is to be part of a normal community” (T= -1.67, p= 0.00).
Details are shown in table 14.
43
Table 14: Independent sample T test for authoritarianism
Levene's
Test for
Equality of
Variances
t-test for Equality of Means
F Sig. t df Sig. (2-
tailed)
Mean
Difference
Std. Error
Difference
95%
Confidence
Interval of the
Difference
Lower Upper
ASSOON Equal variances assumed 3.33 0.07 0.63 70 0.53 0.25 0.4 -0.54 1.04
Equal variances not assumed 0.68 30.12 0.5 0.25 0.37 -0.5 1
TAX Equal variances assumed 15.69 0.00 -3.26 70 0.00 -1.11 0.34 -1.79 -0.43
Equal variances not assumed -4.33 48.69 0.00 -1.11 0.26 -1.63 -0.6
ISOLATED Equal variances assumed 2.57 0.11 -0.99 70 0.33 -0.22 0.22 -0.66 0.22
Equal variances not assumed -1.23 40.95 0.23 -0.22 0.18 -0.58 0.14
BEST Equal variances assumed 27.72 0.00 -2.21 70 0.03 -0.31 0.14 -0.59 -0.03
Equal variances not assumed -4 54 0.00 -0.31 0.08 -0.46 -0.15
MENTAL Equal variances assumed 0.17 0.69 0.33 70 0.74 0.08 0.26 -0.43 0.59
Equal variances not assumed 0.31 24.58 0.76 0.08 0.27 -0.47 0.64
BURDEN Equal variances assumed 1.76 0.19 -1.44 70 0.15 -0.51 0.35 -1.21 0.19
Equal variances not assumed -1.67 34.97 0.1 -0.51 0.3 -1.12 0.11
DANGER Equal variances assumed 0.1 0.75 0.67 70 0.5 0.21 0.31 -0.41 0.82
Equal variances not assumed 0.72 30.245 0.48 0.21 0.29 -0.38 0.79
DOWNGRAD Equal variances assumed 1.15 0.28 -0.07 70 0.94 -0.03 0.4 -0.83 0.77
Equal variances not assumed -0.08 28.34 0.94 -0.03 0.39 -0.82 0.76
EASYTOTE Equal variances assumed 0.624 0.43 0.49 70 0.63 0.14 0.28 -0.41 0.69
Equal variances not assumed 0.45 23.74 0.66 0.14 0.3 -0.48 0.75
RIDICULE Equal variances assumed 0.36 0.55 -1 70 0.32 -0.27 0.27 -0.81 0.27
Equal variances not assumed -1.07 30.31 0.29 -0.27 0.25 -0.79 0.24
44
The results from the 2 groups regarding the social restrictiveness statements of attitudes
have also been compared, using the T-test .
As illustrated in Table 16, results from the Levene's Test for Equality of Variances
indicate that, for the majority of the items in the social restrictiveness subscale, the
variability in our 2 groups is about the same.
The two groups have equal mean scores for the following items: “A woman would be
foolish to marry a man who has suffered from mental illness, even though he seems fully
recovered” (T= 0.57, p= 0.57), “As far as possible mental health services should be
provided through community based facilities” (t=0.64, p= 0.53), “Less emphasis should
be placed on protecting the public from the mentally ill” (t= -1.37, p=0.18), “Residents
should accept the location of mental health facilities in their neighborhood to serve the
needs of the local community (t= -1.04, p=0.31) and “We need to adopt a far more
tolerant attitude toward the mentally ill in our society”(t=-0.55, p=0.58).
Directly involved staffs show greater mean score than the supportive staff in the
following items: “Increased spending on mental health services is a waste of tax dollars”
(t-2.35, p=0.03), “No-one has the right to exclude the mentally ill from their
neighborhood (t= -4.03, p= 0.03), “Having mental patients living within residential
neighborhoods might be good therapy but the risks to residents are too great” (t=2.74,
p=0.01), “Mental patients need the same kind of control and discipline as a young child”
(t=4.99, p=0.00) and “I would not want to live next door to someone who has been
mentally ill” (t=3.57, p=0.00).
Details are shown in table 15
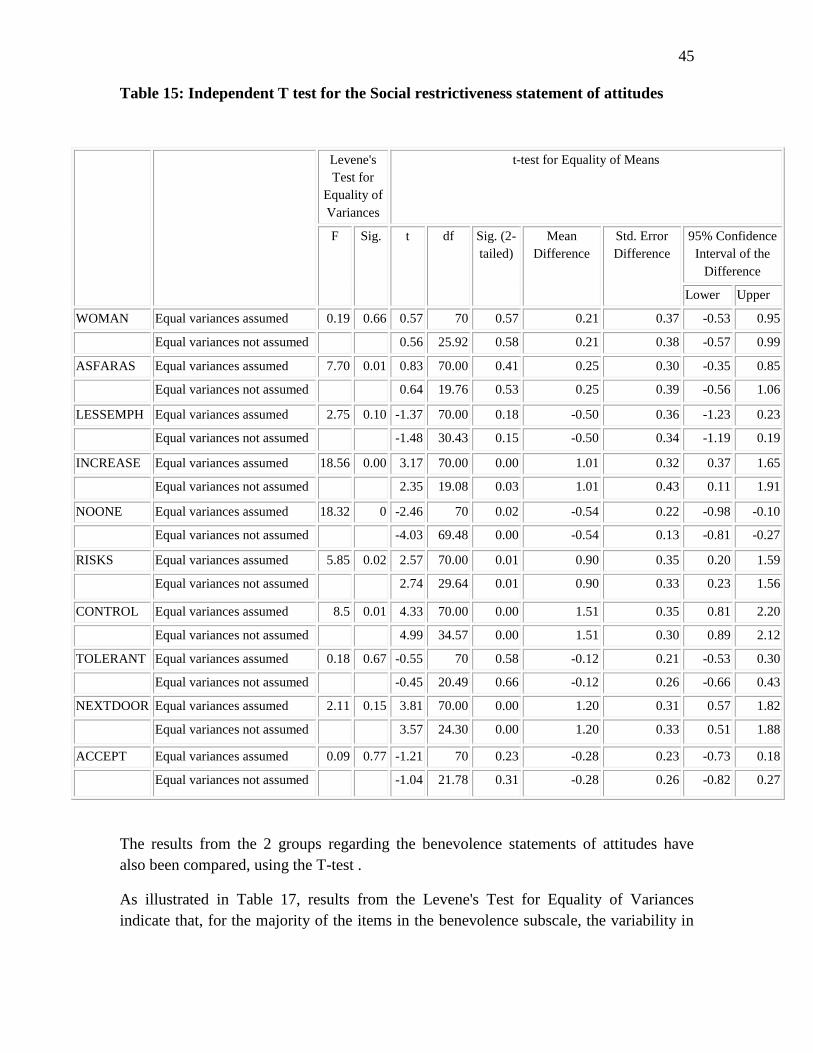
45
Table 15: Independent T test for the Social restrictiveness statement of attitudes
Levene's
Test for
Equality of
Variances
t-test for Equality of Means
F Sig. t df Sig. (2-
tailed)
Mean
Difference
Std. Error
Difference
95% Confidence
Interval of the
Difference
Lower Upper
WOMAN Equal variances assumed 0.19 0.66 0.57 70 0.57 0.21 0.37 -0.53 0.95
Equal variances not assumed 0.56 25.92 0.58 0.21 0.38 -0.57 0.99
ASFARAS Equal variances assumed 7.70 0.01 0.83 70.00 0.41 0.25 0.30 -0.35 0.85
Equal variances not assumed 0.64 19.76 0.53 0.25 0.39 -0.56 1.06
LESSEMPH Equal variances assumed 2.75 0.10 -1.37 70.00 0.18 -0.50 0.36 -1.23 0.23
Equal variances not assumed -1.48 30.43 0.15 -0.50 0.34 -1.19 0.19
INCREASE Equal variances assumed 18.56 0.00 3.17 70.00 0.00 1.01 0.32 0.37 1.65
Equal variances not assumed 2.35 19.08 0.03 1.01 0.43 0.11 1.91
NOONE Equal variances assumed 18.32 0 -2.46 70 0.02 -0.54 0.22 -0.98 -0.10
Equal variances not assumed -4.03 69.48 0.00 -0.54 0.13 -0.81 -0.27
RISKS Equal variances assumed 5.85 0.02 2.57 70.00 0.01 0.90 0.35 0.20 1.59
Equal variances not assumed 2.74 29.64 0.01 0.90 0.33 0.23 1.56
CONTROL Equal variances assumed 8.5 0.01 4.33 70.00 0.00 1.51 0.35 0.81 2.20
Equal variances not assumed 4.99 34.57 0.00 1.51 0.30 0.89 2.12
TOLERANT Equal variances assumed 0.18 0.67 -0.55 70 0.58 -0.12 0.21 -0.53 0.30
Equal variances not assumed -0.45 20.49 0.66 -0.12 0.26 -0.66 0.43
NEXTDOOR Equal variances assumed 2.11 0.15 3.81 70.00 0.00 1.20 0.31 0.57 1.82
Equal variances not assumed 3.57 24.30 0.00 1.20 0.33 0.51 1.88
ACCEPT Equal variances assumed 0.09 0.77 -1.21 70 0.23 -0.28 0.23 -0.73 0.18
Equal variances not assumed -1.04 21.78 0.31 -0.28 0.26 -0.82 0.27
The results from the 2 groups regarding the benevolence statements of attitudes have
also been compared, using the T-test .
As illustrated in Table 17, results from the Levene's Test for Equality of Variances
indicate that, for the majority of the items in the benevolence subscale, the variability in
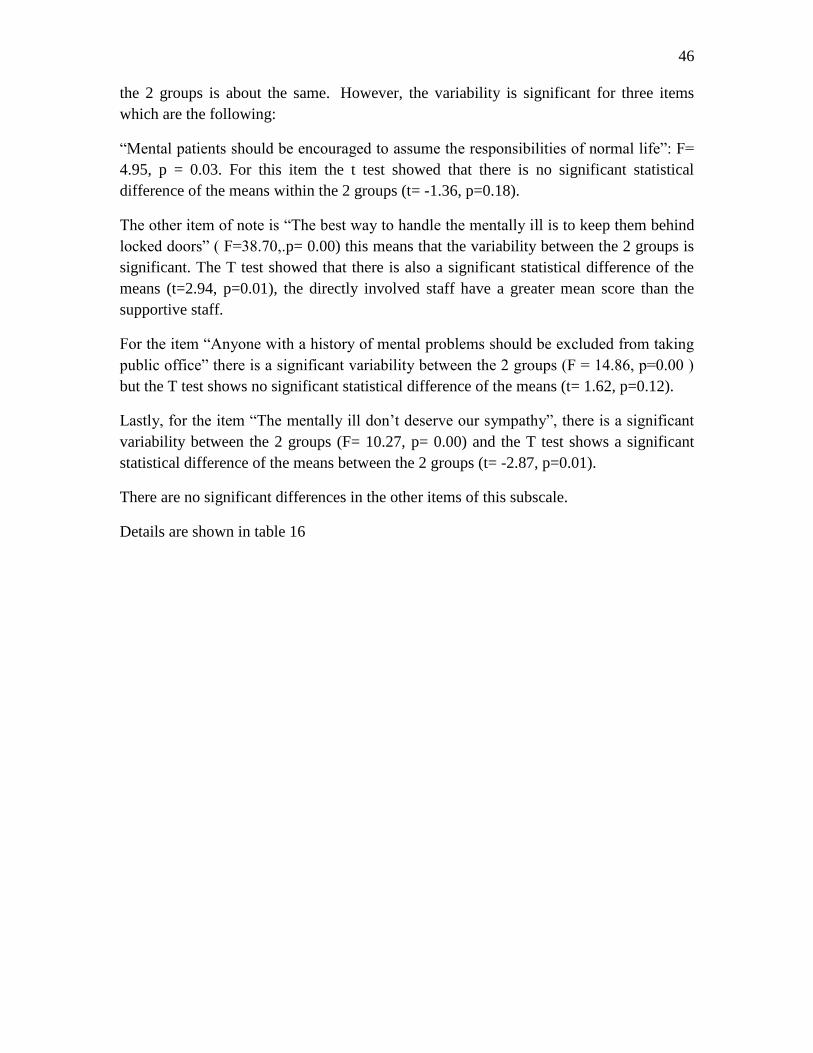
46
the 2 groups is about the same. However, the variability is significant for three items
which are the following:
“Mental patients should be encouraged to assume the responsibilities of normal life”: F=
4.95, p = 0.03. For this item the t test showed that there is no significant statistical
difference of the means within the 2 groups (t= -1.36, p=0.18).
The other item of note is “The best way to handle the mentally ill is to keep them behind
locked doors” ( F=38.70,.p= 0.00) this means that the variability between the 2 groups is
significant. The T test showed that there is also a significant statistical difference of the
means (t=2.94, p=0.01), the directly involved staff have a greater mean score than the
supportive staff.
For the item “Anyone with a history of mental problems should be excluded from taking
public office” there is a significant variability between the 2 groups (F = 14.86, p=0.00 )
but the T test shows no significant statistical difference of the means (t= 1.62, p=0.12).
Lastly, for the item “The mentally ill don’t deserve our sympathy”, there is a significant
variability between the 2 groups (F= 10.27, p= 0.00) and the T test shows a significant
statistical difference of the means between the 2 groups (t= -2.87, p=0.01).
There are no significant differences in the other items of this subscale.
Details are shown in table 16
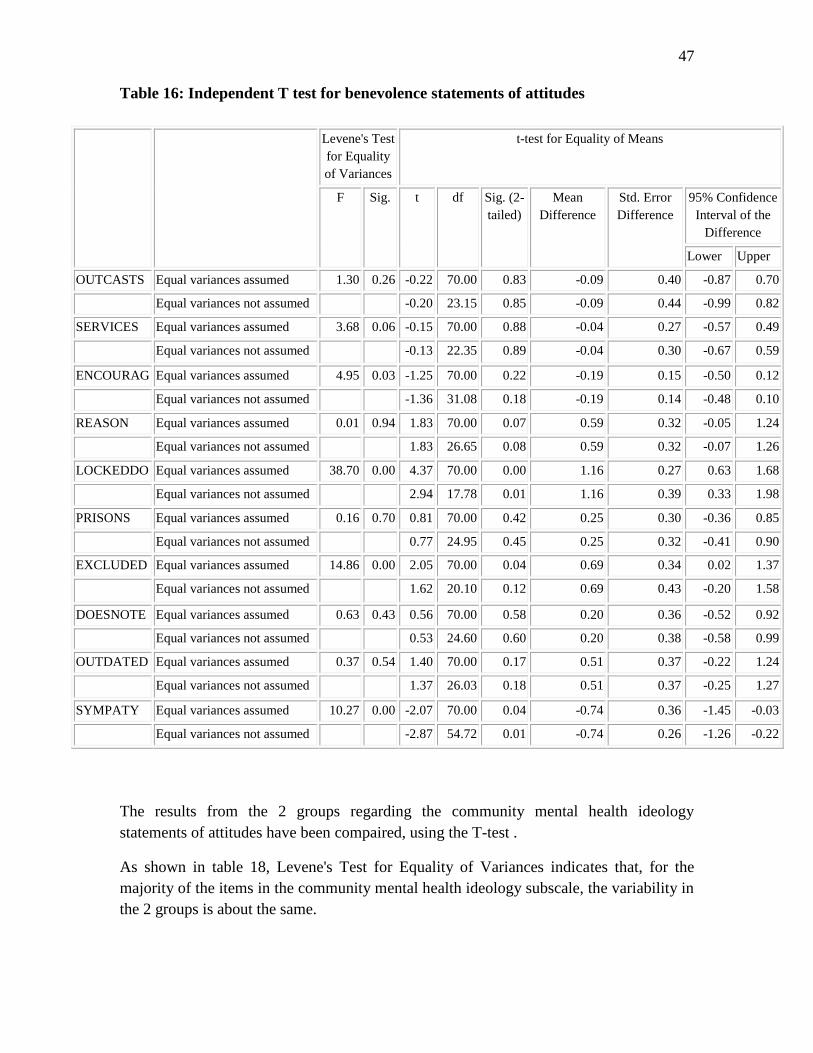
47
Table 16: Independent T test for benevolence statements of attitudes
Levene's Test
for Equality
of Variances
t-test for Equality of Means
F Sig. t df Sig. (2-
tailed)
Mean
Difference
Std. Error
Difference
95% Confidence
Interval of the
Difference
Lower Upper
OUTCASTS Equal variances assumed 1.30 0.26 -0.22 70.00 0.83 -0.09 0.40 -0.87 0.70
Equal variances not assumed -0.20 23.15 0.85 -0.09 0.44 -0.99 0.82
SERVICES Equal variances assumed 3.68 0.06 -0.15 70.00 0.88 -0.04 0.27 -0.57 0.49
Equal variances not assumed -0.13 22.35 0.89 -0.04 0.30 -0.67 0.59
ENCOURAG Equal variances assumed 4.95 0.03 -1.25 70.00 0.22 -0.19 0.15 -0.50 0.12
Equal variances not assumed -1.36 31.08 0.18 -0.19 0.14 -0.48 0.10
REASON Equal variances assumed 0.01 0.94 1.83 70.00 0.07 0.59 0.32 -0.05 1.24
Equal variances not assumed 1.83 26.65 0.08 0.59 0.32 -0.07 1.26
LOCKEDDO Equal variances assumed 38.70 0.00 4.37 70.00 0.00 1.16 0.27 0.63 1.68
Equal variances not assumed 2.94 17.78 0.01 1.16 0.39 0.33 1.98
PRISONS Equal variances assumed 0.16 0.70 0.81 70.00 0.42 0.25 0.30 -0.36 0.85
Equal variances not assumed 0.77 24.95 0.45 0.25 0.32 -0.41 0.90
EXCLUDED Equal variances assumed 14.86 0.00 2.05 70.00 0.04 0.69 0.34 0.02 1.37
Equal variances not assumed 1.62 20.10 0.12 0.69 0.43 -0.20 1.58
DOESNOTE Equal variances assumed 0.63 0.43 0.56 70.00 0.58 0.20 0.36 -0.52 0.92
Equal variances not assumed 0.53 24.60 0.60 0.20 0.38 -0.58 0.99
OUTDATED Equal variances assumed 0.37 0.54 1.40 70.00 0.17 0.51 0.37 -0.22 1.24
Equal variances not assumed 1.37 26.03 0.18 0.51 0.37 -0.25 1.27
SYMPATY Equal variances assumed 10.27 0.00 -2.07 70.00 0.04 -0.74 0.36 -1.45 -0.03
Equal variances not assumed -2.87 54.72 0.01 -0.74 0.26 -1.26 -0.22
The results from the 2 groups regarding the community mental health ideology
statements of attitudes have been compaired, using the T-test .
As shown in table 18, Levene's Test for Equality of Variances indicates that, for the
majority of the items in the community mental health ideology subscale, the variability in
the 2 groups is about the same.
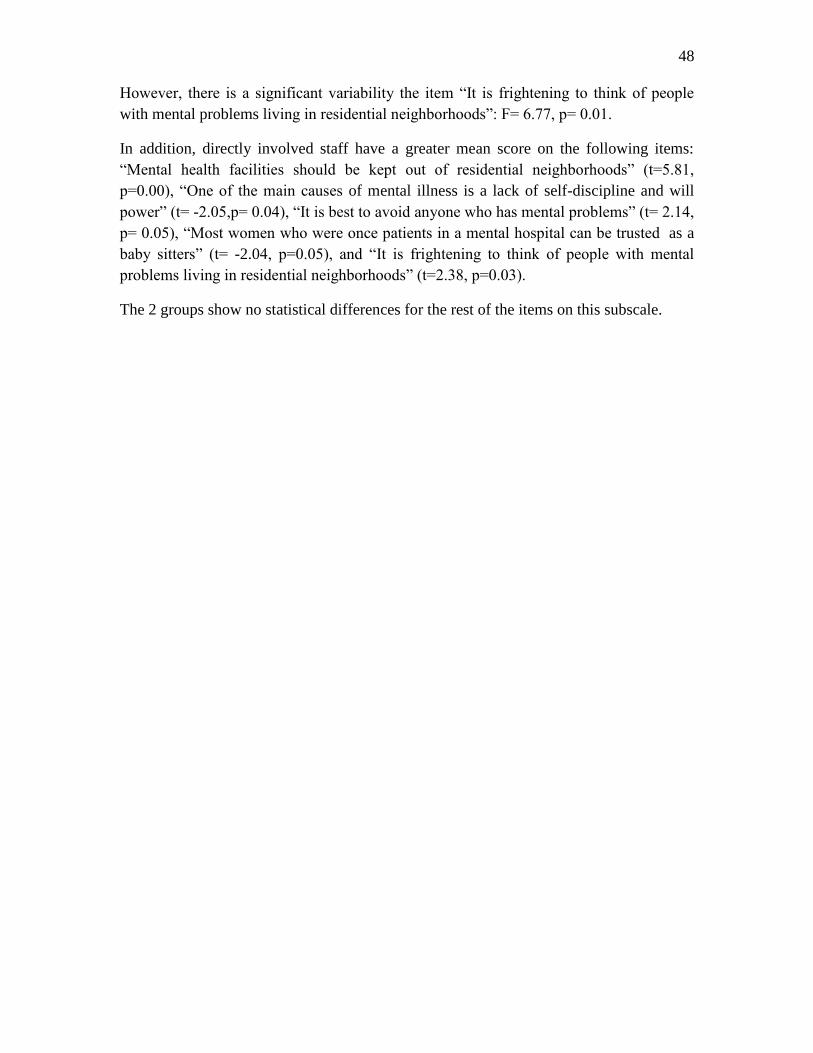
48
However, there is a significant variability the item “It is frightening to think of people
with mental problems living in residential neighborhoods”: F= 6.77, p= 0.01.
In addition, directly involved staff have a greater mean score on the following items:
“Mental health facilities should be kept out of residential neighborhoods” (t=5.81,
p=0.00), “One of the main causes of mental illness is a lack of self-discipline and will
power” (t= -2.05,p= 0.04), “It is best to avoid anyone who has mental problems” (t= 2.14,
p= 0.05), “Most women who were once patients in a mental hospital can be trusted as a
baby sitters” (t= -2.04, p=0.05), and “It is frightening to think of people with mental
problems living in residential neighborhoods” (t=2.38, p=0.03).
The 2 groups show no statistical differences for the rest of the items on this subscale.
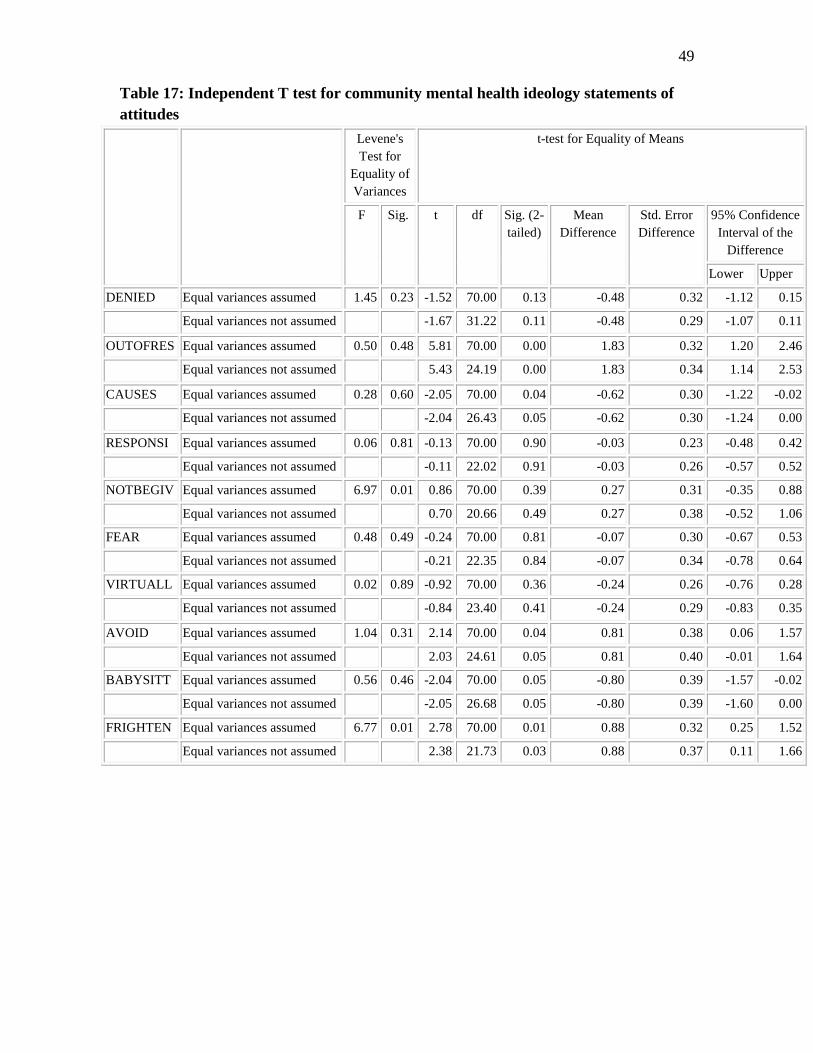
49
Table 17: Independent T test for community mental health ideology statements of
attitudes
Levene's
Test for
Equality of
Variances
t-test for Equality of Means
F Sig. t df Sig. (2-
tailed)
Mean
Difference
Std. Error
Difference
95% Confidence
Interval of the
Difference
Lower Upper
DENIED Equal variances assumed 1.45 0.23 -1.52 70.00 0.13 -0.48 0.32 -1.12 0.15
Equal variances not assumed -1.67 31.22 0.11 -0.48 0.29 -1.07 0.11
OUTOFRES Equal variances assumed 0.50 0.48 5.81 70.00 0.00 1.83 0.32 1.20 2.46
Equal variances not assumed 5.43 24.19 0.00 1.83 0.34 1.14 2.53
CAUSES Equal variances assumed 0.28 0.60 -2.05 70.00 0.04 -0.62 0.30 -1.22 -0.02
Equal variances not assumed -2.04 26.43 0.05 -0.62 0.30 -1.24 0.00
RESPONSI Equal variances assumed 0.06 0.81 -0.13 70.00 0.90 -0.03 0.23 -0.48 0.42
Equal variances not assumed -0.11 22.02 0.91 -0.03 0.26 -0.57 0.52
NOTBEGIV Equal variances assumed 6.97 0.01 0.86 70.00 0.39 0.27 0.31 -0.35 0.88
Equal variances not assumed 0.70 20.66 0.49 0.27 0.38 -0.52 1.06
FEAR Equal variances assumed 0.48 0.49 -0.24 70.00 0.81 -0.07 0.30 -0.67 0.53
Equal variances not assumed -0.21 22.35 0.84 -0.07 0.34 -0.78 0.64
VIRTUALL Equal variances assumed 0.02 0.89 -0.92 70.00 0.36 -0.24 0.26 -0.76 0.28
Equal variances not assumed -0.84 23.40 0.41 -0.24 0.29 -0.83 0.35
AVOID Equal variances assumed 1.04 0.31 2.14 70.00 0.04 0.81 0.38 0.06 1.57
Equal variances not assumed 2.03 24.61 0.05 0.81 0.40 -0.01 1.64
BABYSITT Equal variances assumed 0.56 0.46 -2.04 70.00 0.05 -0.80 0.39 -1.57 -0.02
Equal variances not assumed -2.05 26.68 0.05 -0.80 0.39 -1.60 0.00
FRIGHTEN Equal variances assumed 6.77 0.01 2.78 70.00 0.01 0.88 0.32 0.25 1.52
Equal variances not assumed 2.38 21.73 0.03 0.88 0.37 0.11 1.66
50
4.2. Relationship between Attitudes and profile of the participants
Each of the demographic or control variables was initially examined to determine the
relationship between each predictor and the dependent variables.
This allowed the researcher to observe early patterns in the data before employing more
rigorous analyses.
4.2.1. Authoritarianism
The demographic variables gender, age, family status, role, category, education,
background and experience did not significantly account for variance in the model with
each of the individual predictors and authoritarianism as the dependent variable at
p>0.05.
As indicated in the following table, all the tests performed do not show any significance
(P>0.05).
Tests of Between-Subjects Effects have been conducted and showed no significance as p
is always greater than 0.05.
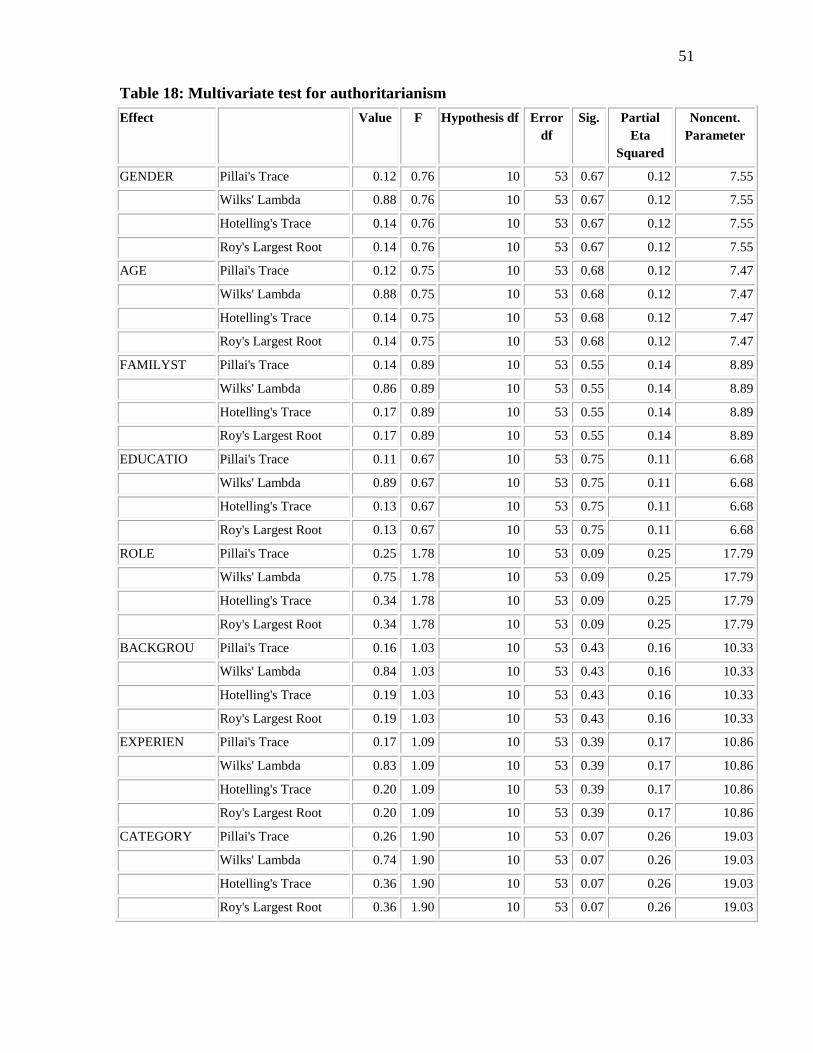
51
Table 18: Multivariate test for authoritarianism
Effect Value F Hypothesis df Error
df
Sig. Partial
Eta
Squared
Noncent.
Parameter
GENDER Pillai's Trace 0.12 0.76 10 53 0.67 0.12 7.55
Wilks' Lambda 0.88 0.76 10 53 0.67 0.12 7.55
Hotelling's Trace 0.14 0.76 10 53 0.67 0.12 7.55
Roy's Largest Root 0.14 0.76 10 53 0.67 0.12 7.55
AGE Pillai's Trace 0.12 0.75 10 53 0.68 0.12 7.47
Wilks' Lambda 0.88 0.75 10 53 0.68 0.12 7.47
Hotelling's Trace 0.14 0.75 10 53 0.68 0.12 7.47
Roy's Largest Root 0.14 0.75 10 53 0.68 0.12 7.47
FAMILYST Pillai's Trace 0.14 0.89 10 53 0.55 0.14 8.89
Wilks' Lambda 0.86 0.89 10 53 0.55 0.14 8.89
Hotelling's Trace 0.17 0.89 10 53 0.55 0.14 8.89
Roy's Largest Root 0.17 0.89 10 53 0.55 0.14 8.89
EDUCATIO Pillai's Trace 0.11 0.67 10 53 0.75 0.11 6.68
Wilks' Lambda 0.89 0.67 10 53 0.75 0.11 6.68
Hotelling's Trace 0.13 0.67 10 53 0.75 0.11 6.68
Roy's Largest Root 0.13 0.67 10 53 0.75 0.11 6.68
ROLE Pillai's Trace 0.25 1.78 10 53 0.09 0.25 17.79
Wilks' Lambda 0.75 1.78 10 53 0.09 0.25 17.79
Hotelling's Trace 0.34 1.78 10 53 0.09 0.25 17.79
Roy's Largest Root 0.34 1.78 10 53 0.09 0.25 17.79
BACKGROU Pillai's Trace 0.16 1.03 10 53 0.43 0.16 10.33
Wilks' Lambda 0.84 1.03 10 53 0.43 0.16 10.33
Hotelling's Trace 0.19 1.03 10 53 0.43 0.16 10.33
Roy's Largest Root 0.19 1.03 10 53 0.43 0.16 10.33
EXPERIEN Pillai's Trace 0.17 1.09 10 53 0.39 0.17 10.86
Wilks' Lambda 0.83 1.09 10 53 0.39 0.17 10.86
Hotelling's Trace 0.20 1.09 10 53 0.39 0.17 10.86
Roy's Largest Root 0.20 1.09 10 53 0.39 0.17 10.86
CATEGORY Pillai's Trace 0.26 1.90 10 53 0.07 0.26 19.03
Wilks' Lambda 0.74 1.90 10 53 0.07 0.26 19.03
Hotelling's Trace 0.36 1.90 10 53 0.07 0.26 19.03
Roy's Largest Root 0.36 1.90 10 53 0.07 0.26 19.03
52
4.2.2. Benevolence
Similar to the non-significant predictors on the dependent variable authoritarianism, the
variables gender, age, family status, experience, category, education, role and background
did not significantly account for the variance in benevolence.
Box's Test of Equality of Covariance Matrices was performed and showed that the
variances are equal within the groups.
Also the Tests of Between-Subjects Effects did not highlight any significant relationship
between the benevolence attitudes and the profile of the participants.
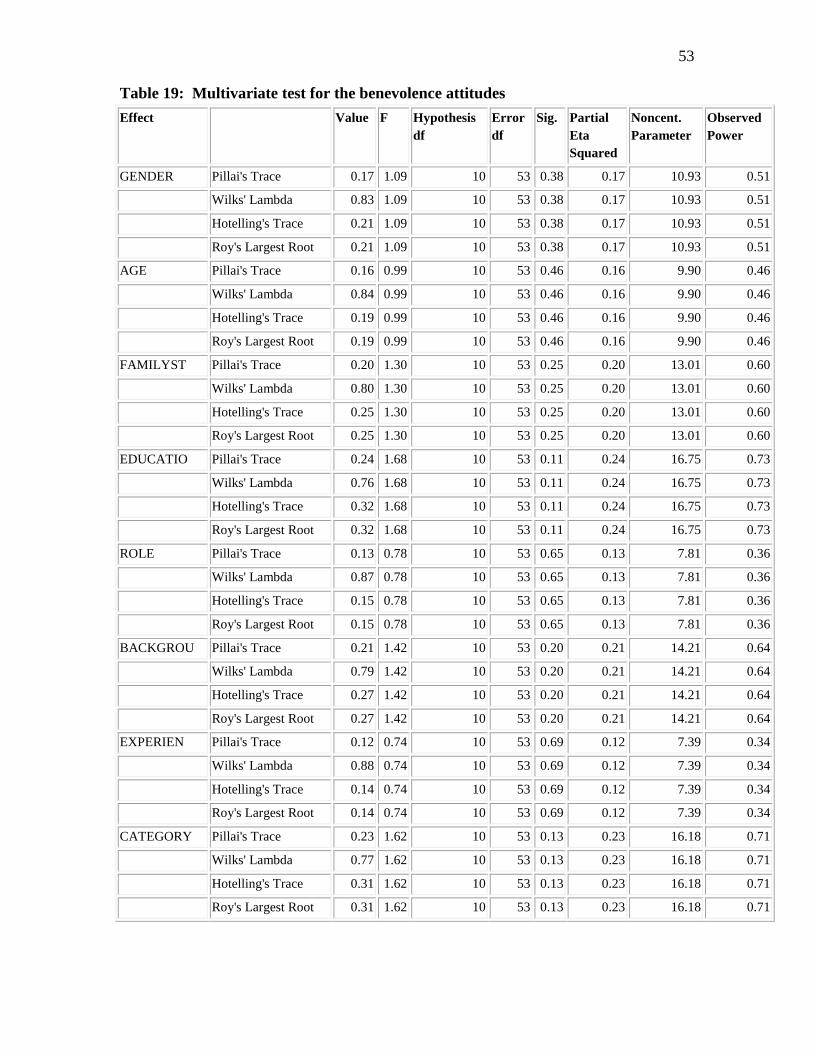
53
Table 19: Multivariate test for the benevolence attitudes
Effect Value F Hypothesis
df
Error
df
Sig. Partial
Eta
Squared
Noncent.
Parameter
Observed
Power
GENDER Pillai's Trace 0.17 1.09 10 53 0.38 0.17 10.93 0.51
Wilks' Lambda 0.83 1.09 10 53 0.38 0.17 10.93 0.51
Hotelling's Trace 0.21 1.09 10 53 0.38 0.17 10.93 0.51
Roy's Largest Root 0.21 1.09 10 53 0.38 0.17 10.93 0.51
AGE Pillai's Trace 0.16 0.99 10 53 0.46 0.16 9.90 0.46
Wilks' Lambda 0.84 0.99 10 53 0.46 0.16 9.90 0.46
Hotelling's Trace 0.19 0.99 10 53 0.46 0.16 9.90 0.46
Roy's Largest Root 0.19 0.99 10 53 0.46 0.16 9.90 0.46
FAMILYST Pillai's Trace 0.20 1.30 10 53 0.25 0.20 13.01 0.60
Wilks' Lambda 0.80 1.30 10 53 0.25 0.20 13.01 0.60
Hotelling's Trace 0.25 1.30 10 53 0.25 0.20 13.01 0.60
Roy's Largest Root 0.25 1.30 10 53 0.25 0.20 13.01 0.60
EDUCATIO Pillai's Trace 0.24 1.68 10 53 0.11 0.24 16.75 0.73
Wilks' Lambda 0.76 1.68 10 53 0.11 0.24 16.75 0.73
Hotelling's Trace 0.32 1.68 10 53 0.11 0.24 16.75 0.73
Roy's Largest Root 0.32 1.68 10 53 0.11 0.24 16.75 0.73
ROLE Pillai's Trace 0.13 0.78 10 53 0.65 0.13 7.81 0.36
Wilks' Lambda 0.87 0.78 10 53 0.65 0.13 7.81 0.36
Hotelling's Trace 0.15 0.78 10 53 0.65 0.13 7.81 0.36
Roy's Largest Root 0.15 0.78 10 53 0.65 0.13 7.81 0.36
BACKGROU Pillai's Trace 0.21 1.42 10 53 0.20 0.21 14.21 0.64
Wilks' Lambda 0.79 1.42 10 53 0.20 0.21 14.21 0.64
Hotelling's Trace 0.27 1.42 10 53 0.20 0.21 14.21 0.64
Roy's Largest Root 0.27 1.42 10 53 0.20 0.21 14.21 0.64
EXPERIEN Pillai's Trace 0.12 0.74 10 53 0.69 0.12 7.39 0.34
Wilks' Lambda 0.88 0.74 10 53 0.69 0.12 7.39 0.34
Hotelling's Trace 0.14 0.74 10 53 0.69 0.12 7.39 0.34
Roy's Largest Root 0.14 0.74 10 53 0.69 0.12 7.39 0.34
CATEGORY Pillai's Trace 0.23 1.62 10 53 0.13 0.23 16.18 0.71
Wilks' Lambda 0.77 1.62 10 53 0.13 0.23 16.18 0.71
Hotelling's Trace 0.31 1.62 10 53 0.13 0.23 16.18 0.71
Roy's Largest Root 0.31 1.62 10 53 0.13 0.23 16.18 0.71

54
4.2.3. Social Restrictiveness
All the independent variables studied were not significant as the significance was greater
than 0.05 in all the cases.
This indicates that the variables age, gender, education, category, family status, role,
experience and background do not have influence on the attitudes of the personnel.
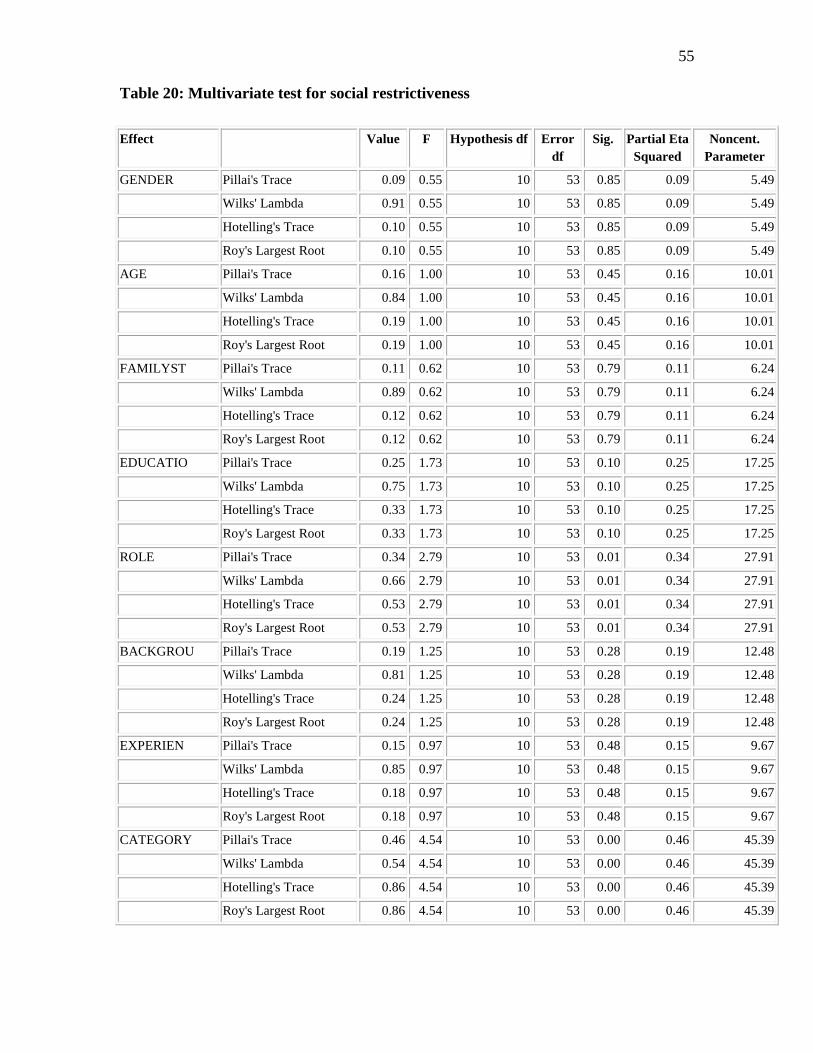
55
Table 20: Multivariate test for social restrictiveness
Effect Value F Hypothesis df Error
df
Sig. Partial Eta
Squared
Noncent.
Parameter
GENDER Pillai's Trace 0.09 0.55 10 53 0.85 0.09 5.49
Wilks' Lambda 0.91 0.55 10 53 0.85 0.09 5.49
Hotelling's Trace 0.10 0.55 10 53 0.85 0.09 5.49
Roy's Largest Root 0.10 0.55 10 53 0.85 0.09 5.49
AGE Pillai's Trace 0.16 1.00 10 53 0.45 0.16 10.01
Wilks' Lambda 0.84 1.00 10 53 0.45 0.16 10.01
Hotelling's Trace 0.19 1.00 10 53 0.45 0.16 10.01
Roy's Largest Root 0.19 1.00 10 53 0.45 0.16 10.01
FAMILYST Pillai's Trace 0.11 0.62 10 53 0.79 0.11 6.24
Wilks' Lambda 0.89 0.62 10 53 0.79 0.11 6.24
Hotelling's Trace 0.12 0.62 10 53 0.79 0.11 6.24
Roy's Largest Root 0.12 0.62 10 53 0.79 0.11 6.24
EDUCATIO Pillai's Trace 0.25 1.73 10 53 0.10 0.25 17.25
Wilks' Lambda 0.75 1.73 10 53 0.10 0.25 17.25
Hotelling's Trace 0.33 1.73 10 53 0.10 0.25 17.25
Roy's Largest Root 0.33 1.73 10 53 0.10 0.25 17.25
ROLE Pillai's Trace 0.34 2.79 10 53 0.01 0.34 27.91
Wilks' Lambda 0.66 2.79 10 53 0.01 0.34 27.91
Hotelling's Trace 0.53 2.79 10 53 0.01 0.34 27.91
Roy's Largest Root 0.53 2.79 10 53 0.01 0.34 27.91
BACKGROU Pillai's Trace 0.19 1.25 10 53 0.28 0.19 12.48
Wilks' Lambda 0.81 1.25 10 53 0.28 0.19 12.48
Hotelling's Trace 0.24 1.25 10 53 0.28 0.19 12.48
Roy's Largest Root 0.24 1.25 10 53 0.28 0.19 12.48
EXPERIEN Pillai's Trace 0.15 0.97 10 53 0.48 0.15 9.67
Wilks' Lambda 0.85 0.97 10 53 0.48 0.15 9.67
Hotelling's Trace 0.18 0.97 10 53 0.48 0.15 9.67
Roy's Largest Root 0.18 0.97 10 53 0.48 0.15 9.67
CATEGORY Pillai's Trace 0.46 4.54 10 53 0.00 0.46 45.39
Wilks' Lambda 0.54 4.54 10 53 0.00 0.46 45.39
Hotelling's Trace 0.86 4.54 10 53 0.00 0.46 45.39
Roy's Largest Root 0.86 4.54 10 53 0.00 0.46 45.39
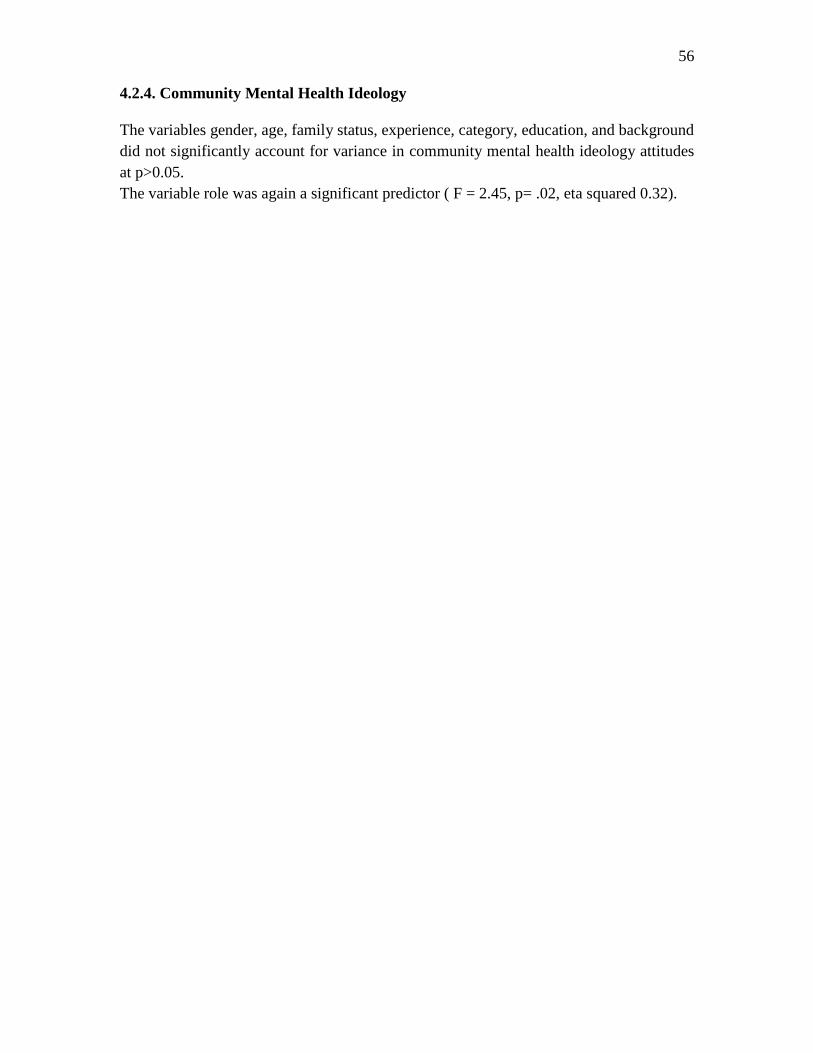
56
4.2.4. Community Mental Health Ideology
The variables gender, age, family status, experience, category, education, and background
did not significantly account for variance in community mental health ideology attitudes
at p>0.05.
The variable role was again a significant predictor ( F = 2.45, p= .02, eta squared 0.32).
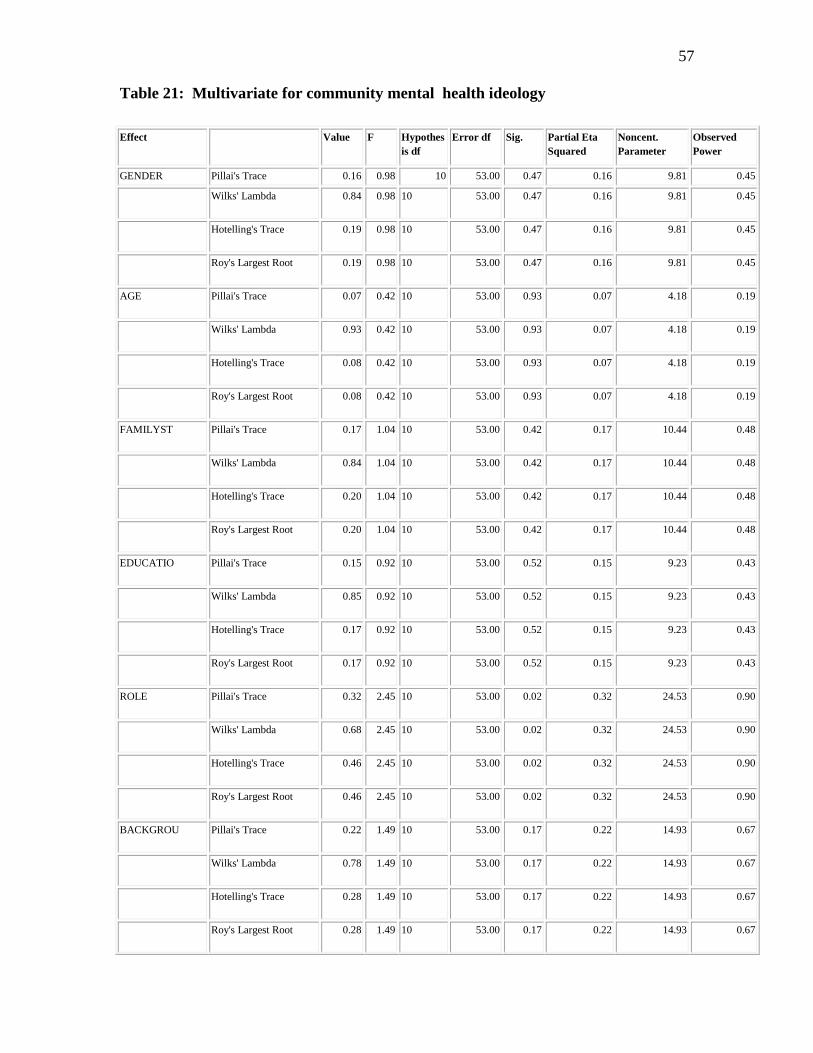
57
Table 21: Multivariate for community mental health ideology
Effect Value F Hypothes
is df
Error df Sig. Partial Eta
Squared
Noncent.
Parameter
Observed
Power
GENDER Pillai's Trace 0.16 0.98 10 53.00 0.47 0.16 9.81 0.45
Wilks' Lambda 0.84 0.98 10 53.00 0.47 0.16 9.81 0.45
Hotelling's Trace 0.19 0.98 10 53.00 0.47 0.16 9.81 0.45
Roy's Largest Root 0.19 0.98 10 53.00 0.47 0.16 9.81 0.45
AGE Pillai's Trace 0.07 0.42 10 53.00 0.93 0.07 4.18 0.19
Wilks' Lambda 0.93 0.42 10 53.00 0.93 0.07 4.18 0.19
Hotelling's Trace 0.08 0.42 10 53.00 0.93 0.07 4.18 0.19
Roy's Largest Root 0.08 0.42 10 53.00 0.93 0.07 4.18 0.19
FAMILYST Pillai's Trace 0.17 1.04 10 53.00 0.42 0.17 10.44 0.48
Wilks' Lambda 0.84 1.04 10 53.00 0.42 0.17 10.44 0.48
Hotelling's Trace 0.20 1.04 10 53.00 0.42 0.17 10.44 0.48
Roy's Largest Root 0.20 1.04 10 53.00 0.42 0.17 10.44 0.48
EDUCATIO Pillai's Trace 0.15 0.92 10 53.00 0.52 0.15 9.23 0.43
Wilks' Lambda 0.85 0.92 10 53.00 0.52 0.15 9.23 0.43
Hotelling's Trace 0.17 0.92 10 53.00 0.52 0.15 9.23 0.43
Roy's Largest Root 0.17 0.92 10 53.00 0.52 0.15 9.23 0.43
ROLE Pillai's Trace 0.32 2.45 10 53.00 0.02 0.32 24.53 0.90
Wilks' Lambda 0.68 2.45 10 53.00 0.02 0.32 24.53 0.90
Hotelling's Trace 0.46 2.45 10 53.00 0.02 0.32 24.53 0.90
Roy's Largest Root 0.46 2.45 10 53.00 0.02 0.32 24.53 0.90
BACKGROU Pillai's Trace 0.22 1.49 10 53.00 0.17 0.22 14.93 0.67
Wilks' Lambda 0.78 1.49 10 53.00 0.17 0.22 14.93 0.67
Hotelling's Trace 0.28 1.49 10 53.00 0.17 0.22 14.93 0.67
Roy's Largest Root 0.28 1.49 10 53.00 0.17 0.22 14.93 0.67
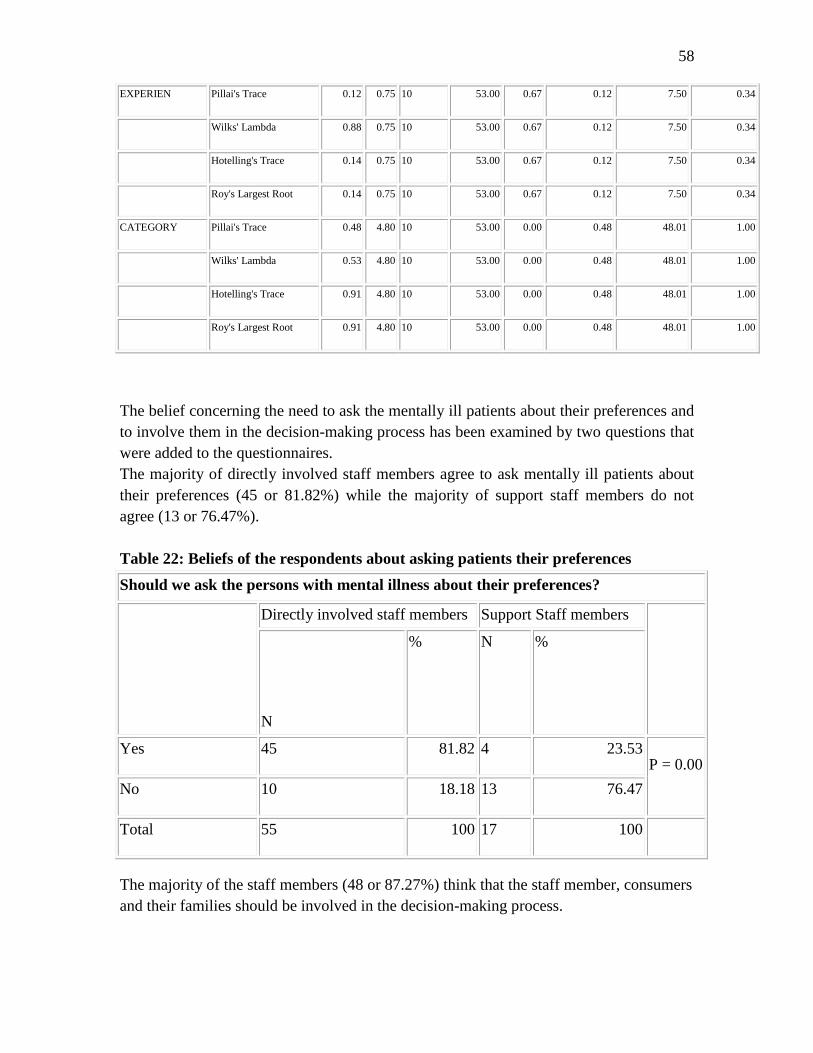
58
EXPERIEN Pillai's Trace 0.12 0.75 10 53.00 0.67 0.12 7.50 0.34
Wilks' Lambda 0.88 0.75 10 53.00 0.67 0.12 7.50 0.34
Hotelling's Trace 0.14 0.75 10 53.00 0.67 0.12 7.50 0.34
Roy's Largest Root 0.14 0.75 10 53.00 0.67 0.12 7.50 0.34
CATEGORY Pillai's Trace 0.48 4.80 10 53.00 0.00 0.48 48.01 1.00
Wilks' Lambda 0.53 4.80 10 53.00 0.00 0.48 48.01 1.00
Hotelling's Trace 0.91 4.80 10 53.00 0.00 0.48 48.01 1.00
Roy's Largest Root 0.91 4.80 10 53.00 0.00 0.48 48.01 1.00
The belief concerning the need to ask the mentally ill patients about their preferences and
to involve them in the decision-making process has been examined by two questions that
were added to the questionnaires.
The majority of directly involved staff members agree to ask mentally ill patients about
their preferences (45 or 81.82%) while the majority of support staff members do not
agree (13 or 76.47%).
Table 22: Beliefs of the respondents about asking patients their preferences
Should we ask the persons with mental illness about their preferences?
Directly involved staff members Support Staff members
N
% N %
Yes 45 81.82 4 23.53 P = 0.00
No 10 18.18 13 76.47
Total 55 100 17 100
The majority of the staff members (48 or 87.27%) think that the staff member, consumers
and their families should be involved in the decision-making process.
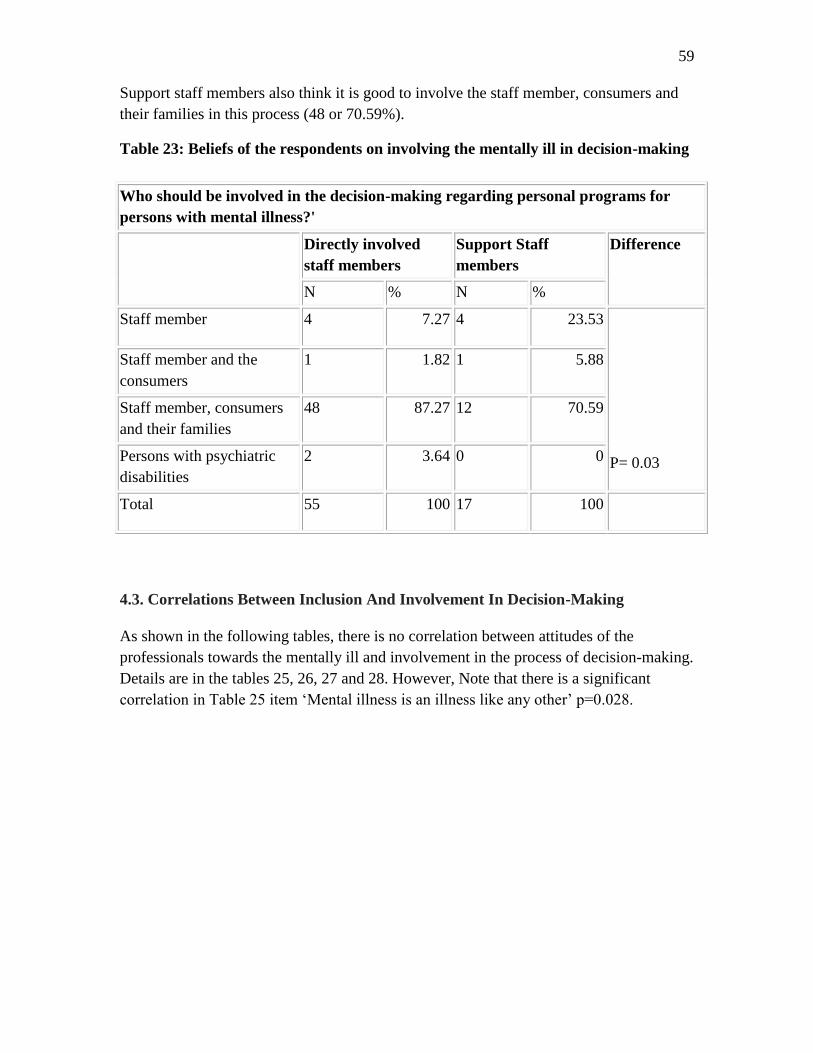
59
Support staff members also think it is good to involve the staff member, consumers and
their families in this process (48 or 70.59%).
Table 23: Beliefs of the respondents on involving the mentally ill in decision-making
Who should be involved in the decision-making regarding personal programs for
persons with mental illness?'
Directly involved
staff members
Support Staff
members
Difference
N % N %
Staff member 4 7.27 4 23.53
P= 0.03
Staff member and the
consumers
1 1.82 1 5.88
Staff member, consumers
and their families
48 87.27 12 70.59
Persons with psychiatric
disabilities
2 3.64 0 0
Total 55 100 17 100
4.3. Correlations Between Inclusion And Involvement In Decision-Making
As shown in the following tables, there is no correlation between attitudes of the
professionals towards the mentally ill and involvement in the process of decision-making.
Details are in the tables 25, 26, 27 and 28. However, Note that there is a significant
correlation in Table 25 item ‘Mental illness is an illness like any other’ p=0.028.
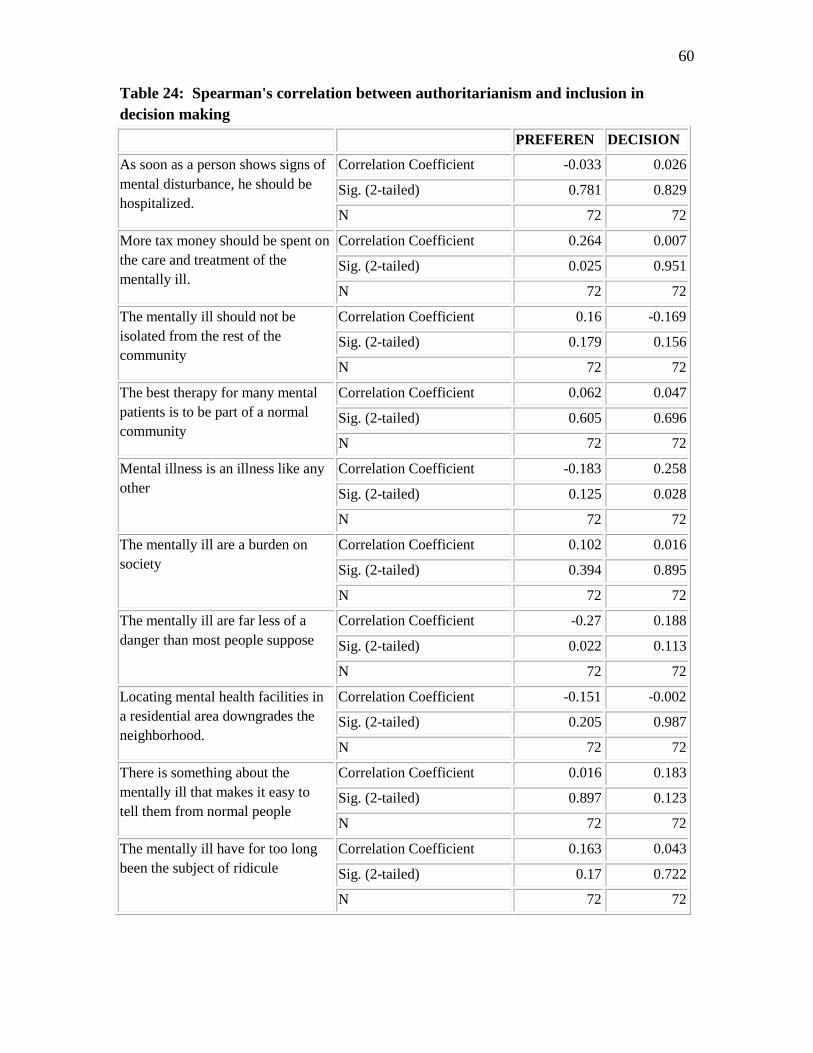
60
Table 24: Spearman's correlation between authoritarianism and inclusion in
decision making
PREFEREN DECISION
As soon as a person shows signs of
mental disturbance, he should be
hospitalized.
Correlation Coefficient -0.033 0.026
Sig. (2-tailed) 0.781 0.829
N 72 72
More tax money should be spent on
the care and treatment of the
mentally ill.
Correlation Coefficient 0.264 0.007
Sig. (2-tailed) 0.025 0.951
N 72 72
The mentally ill should not be
isolated from the rest of the
community
Correlation Coefficient 0.16 -0.169
Sig. (2-tailed) 0.179 0.156
N 72 72
The best therapy for many mental
patients is to be part of a normal
community
Correlation Coefficient 0.062 0.047
Sig. (2-tailed) 0.605 0.696
N 72 72
Mental illness is an illness like any
other
Correlation Coefficient -0.183 0.258
Sig. (2-tailed) 0.125 0.028
N 72 72
The mentally ill are a burden on
society
Correlation Coefficient 0.102 0.016
Sig. (2-tailed) 0.394 0.895
N 72 72
The mentally ill are far less of a
danger than most people suppose
Correlation Coefficient -0.27 0.188
Sig. (2-tailed) 0.022 0.113
N 72 72
Locating mental health facilities in
a residential area downgrades the
neighborhood.
Correlation Coefficient -0.151 -0.002
Sig. (2-tailed) 0.205 0.987
N 72 72
There is something about the
mentally ill that makes it easy to
tell them from normal people
Correlation Coefficient 0.016 0.183
Sig. (2-tailed) 0.897 0.123
N 72 72
The mentally ill have for too long
been the subject of ridicule
Correlation Coefficient 0.163 0.043
Sig. (2-tailed) 0.17 0.722
N 72 72
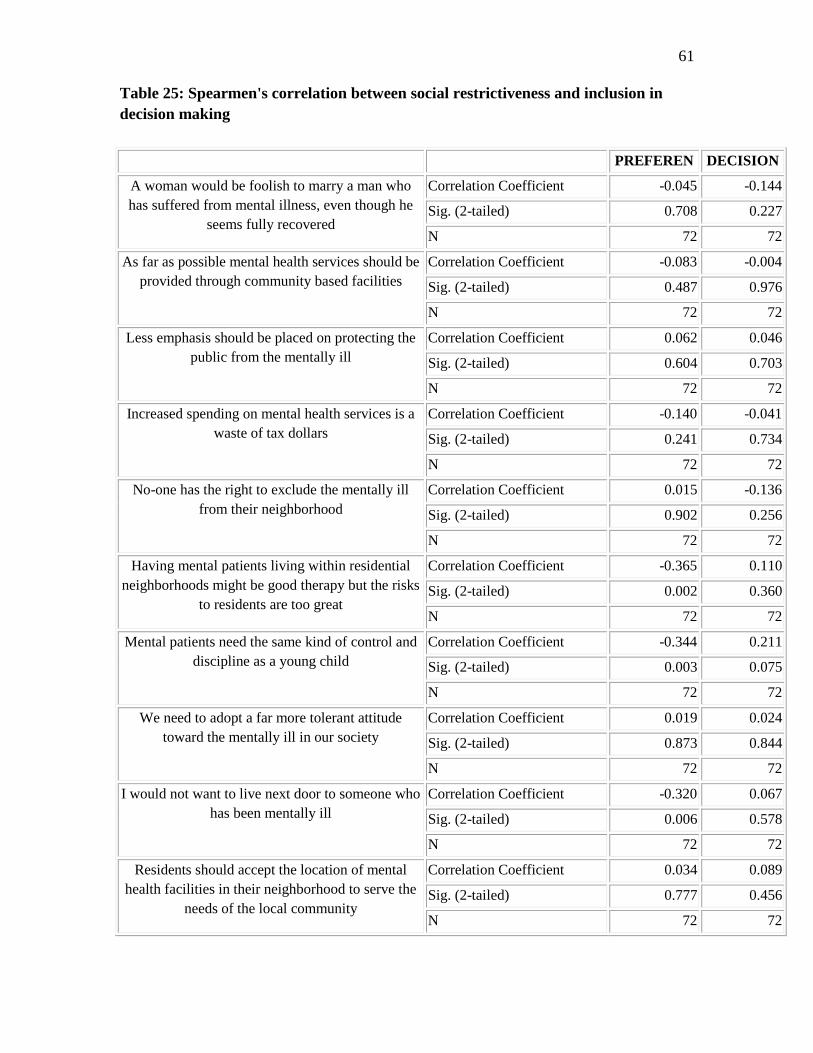
61
Table 25: Spearmen's correlation between social restrictiveness and inclusion in
decision making
PREFEREN DECISION
A woman would be foolish to marry a man who
has suffered from mental illness, even though he
seems fully recovered
Correlation Coefficient -0.045 -0.144
Sig. (2-tailed) 0.708 0.227
N 72 72
As far as possible mental health services should be
provided through community based facilities
Correlation Coefficient -0.083 -0.004
Sig. (2-tailed) 0.487 0.976
N 72 72
Less emphasis should be placed on protecting the
public from the mentally ill
Correlation Coefficient 0.062 0.046
Sig. (2-tailed) 0.604 0.703
N 72 72
Increased spending on mental health services is a
waste of tax dollars
Correlation Coefficient -0.140 -0.041
Sig. (2-tailed) 0.241 0.734
N 72 72
No-one has the right to exclude the mentally ill
from their neighborhood
Correlation Coefficient 0.015 -0.136
Sig. (2-tailed) 0.902 0.256
N 72 72
Having mental patients living within residential
neighborhoods might be good therapy but the risks
to residents are too great
Correlation Coefficient -0.365 0.110
Sig. (2-tailed) 0.002 0.360
N 72 72
Mental patients need the same kind of control and
discipline as a young child
Correlation Coefficient -0.344 0.211
Sig. (2-tailed) 0.003 0.075
N 72 72
We need to adopt a far more tolerant attitude
toward the mentally ill in our society
Correlation Coefficient 0.019 0.024
Sig. (2-tailed) 0.873 0.844
N 72 72
I would not want to live next door to someone who
has been mentally ill
Correlation Coefficient -0.320 0.067
Sig. (2-tailed) 0.006 0.578
N 72 72
Residents should accept the location of mental
health facilities in their neighborhood to serve the
needs of the local community
Correlation Coefficient 0.034 0.089
Sig. (2-tailed) 0.777 0.456
N 72 72
62
Table 26: Spearman's correlation between benevolence and inclusion in the decision
making
PREFEREN DECISION
The mentally ill should not be treated as
outcasts of society
Correlation Coefficient -0.102 -0.040
Sig. (2-tailed) 0.392 0.739
N 72 72
There are sufficient existing services for the
mentally ill
Correlation Coefficient 0.065 -0.002
Sig. (2-tailed) 0.584 0.989
N 72 72
Mental patients should be encouraged to
assume the responsibilities of normal life
Correlation Coefficient 0.003 -0.128
Sig. (2-tailed) 0.980 0.285
N 72 72
Local residents have good reason to resist
the location of mental health services in
their neighborhood
Correlation Coefficient -0.183 -0.135
Sig. (2-tailed) 0.125 0.258
N 72 72
The best way to handle the mentally ill is to
keep them behind locked doors
Correlation Coefficient -0.252 0.023
Sig. (2-tailed) 0.033 0.849
N 72 72
Our mental hospitals seem more like
prisons than places where the mentally ill
can be cared for
Correlation Coefficient -0.100 0.018
Sig. (2-tailed) 0.404 0.883
N 72 72
Anyone with a history of mental problems
should be excluded from taking public
office
Correlation Coefficient -0.028 0.148
Sig. (2-tailed) 0.813 0.215
N 72 72
Locating mental health services in
residential neighborhoods’ does not
endanger local residents
Correlation Coefficient 0.018 0.128
Sig. (2-tailed) 0.880 0.285
N 72 72
Mental hospitals are an out-dated means of
treating the mentally ill
Correlation Coefficient -0.166 -0.081
Sig. (2-tailed) 0.164 0.496
N 72 72
The mentally ill don’t deserve our sympathy Correlation Coefficient 0.114 -0.082
Sig. (2-tailed) 0.342 0.493
N 72 72
63
Table 27: Spearman's correlation between community mental health ideology and
inclusion in decision making
PREFEREN DECISION
The mentally ill should not be denied their
individual rights
Correlation Coefficient 0.165 -0.143
Sig. (2-tailed) 0.167 0.232
N 72 72
Mental health facilities should be kept out
of residential neighborhoods
Correlation Coefficient -0.287 0.002
Sig. (2-tailed) 0.014 0.988
N 72 72
One of the main causes of mental illness is
a lack of self-discipline and will power
Correlation Coefficient 0.172 -0.101
Sig. (2-tailed) 0.148 0.401
N 72 72
We have a responsibility to provide the
best possible care for the mentally ill
Correlation Coefficient 0.003 -0.146
Sig. (2-tailed) 0.981 0.222
N 72 72
The mentally ill should not be given any
responsibility
Correlation Coefficient -0.258 0.186
Sig. (2-tailed) 0.029 0.117
N 72 72
Residents have nothing to fear from
people coming into their neighborhood to
obtain mental health services.
Correlation Coefficient 0.006 0.013
Sig. (2-tailed) 0.958 0.916
N 72 72
Virtually anyone can become mentally ill Correlation Coefficient 0.082 0.007
Sig. (2-tailed) 0.494 0.957
N 72 72
It is best to avoid anyone who has mental
problems.
Correlation Coefficient -0.287 -0.050
Sig. (2-tailed) 0.015 0.674
N 72 72
Most women who were once patients in a
mental hospital can be trusted as baby
sitters.
Correlation Coefficient 0.063 -0.054
Sig. (2-tailed) 0.597 0.650
N 72 72
It is frightening to think of people with
mental problems living in residential
neighborhoods’
Correlation Coefficient -0.307 0.112
Sig. (2-tailed) 0.009 0.349
N 72 72
64
CHAPTER 5: DISCUSSION, CONCLUSION, AND RECOMMENDATIONS
Discussion
The primary goal of the health professionals is to provide care for all individuals
irrespective of their personal circumstance.
Important findings emerged from studies examining the public attitudes toward people
with mental illness. One of them is that the public perceives people with mental illness as
violent, unstable, and socially undesirable.
In addition to this, many arguments against the placement of community mental health
facilities revolve around issues of safety, such as risks posed to young children (Cowan,
1999).
The CAMI scale has been a popular measure to examine community attitudes, and it has
been frequently administered and even modified to use internationally.
The present study showed that for the authoritarianism, which refers to a view of the
mentally ill person as someone inferior who requires coercive handling, our respondents
agreed with the positive statements and disagreed with the negative ones. This means that
they did not believe that the mentally ill are inferior.
They, however, think that as soon as a person shows signs of mental disturbances, he
should be hospitalized (51%). The reason for this may probably be the fact that their
hospital is the only in the country that can hospitalize patients for a long time and the
mental health services in the general hospitals are at the early stage of development,
hence, not yet well organized. Psychotropic medications are not fully available
throughout the community and the resources are scarce. Probably this reflects the general
view on mentally illness in the general population.
For the social restrictiveness subscale, our respondents agreed with the positive
statements and disagreed with the negative ones. The majority think that no one has the
right to exclude the mentally ill from the community, but they show differences on the
items “ increased spending money on mental health services is a waste of tax dollars,
“Having mental patients living within residential neighborhoods might be good therapy
but the risks to residents are too great”, “Mental patients need the same kind of control
and discipline as a young child”, and “I would not want to live next door to someone who
has been mentally ill”. This may be due to the fact that they receive the patients who are
mainly abandoned and neglected in the streets. As there are scarce interventions in the
community, the patients who are brought to Ndera hospital are those with neglected
hygiene, with agitation and aggressivity and other conditions not easy to be with as they
think. In general, our respondents do not think that the mentally ill patients are a threat to
the society; they think that they should not be avoided.
65
The majority of our respondents showed a paternalistic and sympathetic view of the
mentally ill patient. With the mean score of 3.88, they show an orientation toward care in
general. The conclusion is that our respondents hold favorable attitudes towards mentally
ill patients.
Concerning the acceptance of mental health services and mentally ill patients in the
community, the mean score (3.87) showed that the majority of our respondents agreed
with the positive attitudes and disagreed with the negative ones. All are convinced that
they have a responsibility to provide the possible best care for the mentally illl patients.
In fact, the study conducted by Aghukwa Chikaodiri N. (2009) found many hospital
workers, especially females, expressed anticipatory fears towards letting psychiatric
patients obtain admission for treatment within a general hospital setting. This view was
very likely caused by many workers not wishing their place of work to be close to the
psychiatric wards. From this study, many nurses, administrators, hospital support staff
and laboratory scientists would support resisting provision of such an inpatient care
facility inside the hospital because of the communities' attribution of dangerousness to
people with mental illness, because of occasional violent behaviour by them.
This differs from the results from our study, due to the fact that the professionals at the
psychiatric hospital have more time to spend together with the patients and to discuss
with them and this means that they have more compassion compared to the other health
professionals in general hospitals.
Although the majority of our respondents thought the best therapy for mentally ill should
be organized in the community, they also thought that as soon as a patient shows mental
disturbance signs, he should be hospitalized. This discrepancy might perhaps be related to
the scarcity of resources and the presence of the treatment gap with regard to mental
illness, especially at the community level.
Our findings support the previous work of Antonia Barke and collaborators in Ghana
(Barke A. et al., 2010), who showed that regarding the society’s attitude towards
mentally ill patients, benevolent views tended to prevail and the responsibility of
providing the best possible care was acknowledged by a large majority.
The first hypothesis for the current study was that directly involved professionals’
attitudes toward the inclusion of persons with psychiatric disabilities would be more
positive than supportive staff's attitudes.
The results showed that for the majority of the items in the authoritarianism subscale, the
scores of the group of directly involved staff do not vary significantly from the scores of
the supporting staff (p.>0.05).
66
However, there is a significant difference of means on the item “More tax money should
be spent on the care and treatment of the mentally ill”. The comparison of the 2 groups
showed that the mean score for the directly involved is greater than the score of the
supportive staff for this item.
The directly involved professionals also have a higher mean score on the item “The best
therapy for many mental patients is to be part of a normal community”.
This means that the directly involved professionals are more in favor of increasing tax
money on the care and treatment of the mentally ill, and in organising the best therapy in
the community.
Directly involved staff showed greater mean scores on positive attitudes than the
supportive staff for the following items from the social restrictiveness subscale:
“Increased spending on mental health services is a waste of tax dollars”, “No-one has the
right to exclude the mentally ill from their neighborhood, “Having mental patients living
within residential neighborhoods might be good therapy but the risks to residents are too
great”, “Mental patients need the same kind of control and discipline as a young child”
and “I would not want to live next door to someone who has been mentally ill”.
Directly involved professionals showed greater mean scores on positive attitudes for the
items “Mental patients should be encouraged to assume the responsibilities of normal
life”, “The best way to handle the mentally ill is to keep them behind locked doors”,
“Anyone with a history of mental problems should be excluded from taking public
office” and “The mentally ill don’t deserve our sympathy”,
In addition, directly involved staff have greater mean scores on positive attitudes for the
following items: “Mental health facilities should be kept out of residential
neighborhoods”, “One of the main causes of mental illness is a lack of self-discipline and
will power”, “It is best to avoid anyone who has mental problems”, “Most women who
were once patients in a mental hospital can be trusted as a baby sitters”, and “It is
frightening to think of people with mental problems living in residential neighborhoods”.
The general finding is that our hypothesis is confirmed, the directly involved
professionals’ attitudes towards mental illness are more positive than the support
professionals’ attitudes.
This support the previous findings, for example those from Mitsuko Yamada et al.
(2001)who investigated nursing students’ attitudes toward people with mental disorders
and showed that nursing students having the experience of contact with people with
mental disorders had positive attitudes toward them.
This is surely the reason why directly involved professionals are more positive than the
support professionals at Ndera neuropsychiatric hospital.
67
A study by Nikolaos Kazantzis (2009), found that respondents with high levels of prior
contact with people who have a mental illness were more comfortable in interacting with
people who have a mental illness.
Prior research has consistently reported that contact with people with mental illness
influences positive attitudes, as well as increases the level of comfort in interacting with
people with mental illness (e.g., Arens, 1993; Beckwith & Mathews, 1994; Gething &
Wheeler, 1992).
In an international comparative study of nurses’ attitudes towards mental illness,
Chambers et al. (2009) showed that nurses working in mental health settings from
Lithuania expressed more negative attitudes than those from Finland, Italy, Portugal and
Ireland. The authors suggest these negative attitudes are the result of social, cultural or
organizational factors.
Another objective was to identify possible factors which influence the attitude towards
mentally ill people in Ndera Neuropsychiatric hospital.
The findings suggest that the demographic variables gender, age, family status, role,
category, education, background and experience did not significantly account for
variance in the model with each of the individual predictors and the subscales of the
CAMI scale.
This indicates that all these demographic variables background do not exert an influence
on the attitudes of the personnel.
The last hypothesis was that directly involved professionals will have a stronger belief in
the need to include consumers in the decision-making process about their future than the
supportive staff workers.
This assumption was supported by our results, as the majority of directly involved staff
members agree to ask mentally ill patients about their preferences while the majority of
support staff members do not agree.
Conclusions
Health care professionals should be explicitly made aware of the impact their judgments
of disadvantaged groups can have on their caring role.
By drawing attention to these often ingrained or subconscious judgments, they may be
able to overcome any inherent prejudice and meet the demands of their patients
irrespective of individual circumstance.
This study represents one of the first to explore professionals’ attitudes towards the
mentally ill. It is hoped that this work will highlight the need to explore the influence of
attitudes in the delivery of high quality healthcare. The provider–patient relationship is at
the heart of effective treatment and the detrimental impact of prejudicial judgments on
this relationship should not be ignored.
68
A summary interpretation of the main findings in this thesis reinforces the assumption
that negative attitudes towards people with mental illness received in Ndera
neuropsychiatric hospital are in existence, even though the majority have favorable
attitudes toward the mentally ill.
This study also demonstrates that professionals with different roles report different
attitudes, and this suggest that they would behave differently towards patients with
mental illness. The directly involved professionals have been found to have more positive
attitudes than the supportive professional and this seems to show that as individuals
improve their ability to interact with persons with mental illness, they become more
tolerant.
The present study demonstrates that the sociodemographic variables tested have no
impact on the attitudes of the professionals working in Ndera neuropsychiatric hospital.
The extent of mental health training (as part of general health training) and duration of
experience of working in mental health settings did not influence attitudes.
Training influences could be expected to be minimal because most respondents had
received only limited mental health training during their undergraduate education.
Finally, this study demonstrates that there is no correlation between the attitudes towards
mentally ill patients and their inclusion in the process of decision-making.
Recommendations
i. As the professionals have different views on the mental illness, activities aiming
the fight against stigma and negative attitudes towards the mentally ill should
be organized frequently in the hospital.
ii. There are still many areas to explore within the field of attitudes to mental illness
and persons with mental illness in Rwanda:
o Since mental health services are not well organized in the community,
there is a need for further research on the attitudes towards mentally ill in
the general population
o It would be of interest to explore what people with mental illness
themselves consider, regarding these research findings as well as their
experiences of contact with the public.
o More research is needed to shed light on the relationship between
attitudes towards persons with mental illness and the respondent’s actual
behavior and actions against them.
It is hard to know if the displayed attitude is in accordance with the
respondent’s inner belief or if it is an idealized description, so called
‘Beautiful Painting’ in order to position oneself as politically correct.

69
Therefore it is of interest to explore if it is possible to adapt the CAMI
scale to the Rwandan population
70
REFERENCES
ABDURRAHMAN ALTINDAG, Effects of an antistigma program on medical students’
Attitudes towards people with schizophrenia, Psychiatry and Clinical Neurosciences
(2006), 60, 283–288
Aghukwa, N.C., Attitude of health workers to the care of psychiatric patients, Annals of
General Psychiatry 2009, 8:19
A.M. Aish et al., Measuring Attitudes of Mental Health Care Staff Toward Suicidal
Patients, Archives of Suicide Research, 6:309^323, 2002
Amanda M. Stone and Lisa J. Merlo, Attitudes of college students toward mental illness
stigma and the misuse of psychiatric medications,J Clin Psychiatry. 2011 February ;
72(2): 134–139
Angermeyer MC, Matschinger H, The stigma of mental illness: effects of labelling on
public attitudes towards people with mental disorder, Acta Psychiatr Scand 2003: 108:
304–309
Baello, J., Asian Values Adherence and Psychological Help-Seeking Attitudes of
Filipino American Journal of Multicultural, Gender and Minority Studies, Volume 1,
Issue 1, 2007
Baba A Issa et al., Attitudes of Medical Students to Psychiatry at a Nigerian Medical
School, Hong Kong J Psychiatry 2009; 19:72-7
Baba A Issa,et al., Caregivers’ Knowledge of Etiology of Mental Illness in a Tertiary
Health Institution in Nigeria, Iranian Journal of Psychiatry and Behavioral
Sciences (IJPBS), Volume 2, Number 1, Spring and Summer 2008: 43-49.
BARBARA W. and SIMON W., Personality and social attitudes in chronic fatigue
syndrome, Journal of Psychosomatic Research, Vol. 47, No. 4, pp. 385–397, 1999
Barke A., Nyarko S, Klecha D., The stigma of mental illness in Southern Ghana: attitudes
of the urban population and patients’ views, Soc Psychiat Epidemiol, 2010
Bayram Mert Savrun., et al., Gender Effect onAttitudes Towards theMentally Ill:
A Survey of Turkish University Students, Isr J Psychiatry Relat Sci Vol 44 No. 1 (2007)
57–61
Bedel C.T. et al., Family Attitudes Reported in Youth as Potential Predictors of
Cancer, Psychosomatic Medicine Vol. 41, No. 4 (June 1979)
71
Borinstein A.B., Public attitudes toward persons with mental illness, Health Affairs, 11,
no.3 (1992):186-196
Bresssoud E. (2002), La force de l’attitude: clarification conceptuelle et impact au sein du
processus comportemental, Actes des XVIèmes Journées Nationales des IAE, Paris.
David T. Browne, ATTITUDES OF MENTAL HEALTH PROFESSIONALS TOWARD
MENTAL ILLNESS: COMPARISONS AND PREDICTORS, David T. Browne, Thesis,
Smith College School for Social Work Northampton, Massachusetts, 2010
Campbell Research & Consulting, Community Attitudes towards Palliative Care
Integrated Report, A report funded by the Australian Government Department of Health
and Ageing, Commonwealth of Australia 2006
Carlyle London, Stigma and mental illness: a comparative study of attitudes and personal
constructs; Thesis, School of health science and social care, Brunel University, January
2010.
Caroline Roberts, Mental Health Professionals' Attitudes towards Legal Compulsion:
Report of a National Survey, International Journal of Forensic Mental Health 2002, Vol.
1, No. 1, pages 71-82
Carlos Nordt, Attitudes of Mental Health Professionals Toward People With
Schizophrenia and Major Depression, Schizophrenia Bulletin vol. 32 no. 4 pp. 709–714,
2006
American Medical Association, Attitudes toward Mental Illness— 35 states, District
of Columbia, and Puerto Rico, 2007, JAMA, July 14, 2010—Vol 304, No. 2
Barbara Lopes Cardozo, et al., Mental Health, Social Functioning, and Attitudes of
Kosovar Albanians Following the War in Kosovo, JAMA, August 2, 2000—Vol 284, No.
5
CHIKOMO, J.G, Knowledge and attitudes of the Kinondoni community towards mental
illness, Thesis, STELLENBOSCH UNIVERSITY, MARCH 2011
Christopher Ryan Locke, Public attitudes toward mental illness: an experimental design
examining the media‘s impact of crime on stigma, unpublished thesis, Ohio University,
2010.
Clayfield, C.J., Fletcher, K.E., Assessing Police Attitudes about Persons with Mental
Illness, Center for Mental Health Services Research, University of Massachusetts
Medical School, April 2006, Vol 3, Issue 4
72
Collins, C.W., Attitude toward a Handicap, Journal Of The National Medical
Association, VOL. 48, No. 3
Daniel le Grange, Eating Attitudes and Behaviors in 1,435 South African Caucasian and
Non-Caucasian College Students, (Am J Psychiatry 1998; 155:250–254)
Deris, J.A., A SEMANTIC DIFFERENTIAL MEASUREMENT OF CAREGIVERS'*
ATTITUDES TOWARD THE ALCOHOLIC, Thesis, May, 1973
DUPRAS A., Les réactions du personnel soignant au comportement de masturbation des
patients psychiatriques, Revue québécoise de psychologie, vol. 17, n° 2, 199 6
Edgerton, J.V., Bentz, K.W., Attitudes and opinions of rural people about
mental illness and program services, Rural mental health services, MARCH, 1969,
VOL. 59, NO. 3, A.J.P.H.
ERLANGER A. TURNER, Attitudes toward Child Mental Health Services: Adaptation
and Development of an Attitude Scale, Thesis, Office of Graduate Studies of Texas A&M
University, August 2006
Ewhrudjakpor, C.Knowledge, Beliefs and Attitudes of Health Care Providers towards the
Mentally Ill in Delta State, Nigeria, Ethno-Med, 3(1): 19-25 (2009)
Feifel, D., Attitudes toward Psychiatry as a Prospective Career among Students Entering
Medical School, Am J Psychiatry 1999; 156:1397–1402)
Filipcic I.et al.: Attitudes Towards Schizophrenic Patient, Coll. Antropol. 27 (2003) 1:
301–307
Gen Kanayama, Body Image and Attitudes Toward Male Roles in Anabolic-Androgenic
Steroid Users, Am J Psychiatry 2006; 163:697–703)
Gene Tremblay, Assessing Employer Attitudes Toward Hiring Individuals With Mental
Disabilities, Thesis, The Graduate College, University of Wisconsin-Stout, May 2001
Gibson RC, Abel WD, White S, Hickling FW. Internalizing stigma associated with
mental illness: findings from a general population survey in Jamaica. Rev Panam Salud
Publica. 2008; 23(1):26–33.
Godan, A., The Attitudes and Sterotypes of Supporting Fields towards the Persons with
Disabilities, Coll. Antropol. 32 (2008) 3: 783–791
73
Gökhan Özer and Emine Yilmaz, Comparison of the theory of reasoned action and the
theory of planned behavior: An application on accountants’ information technology
usage, African Journal of Business Management Vol. 5(1), pp. 50-58, 4 January, 2011
GORO TANAKA, Effects of an educational program on public attitudes towards mental
illness, Psychiatry and Clinical Neurosciences (2003), 57, 595–602
Hani Hamed Dessoki, Tamer M.S., Beliefs about Mental Illness among University
Students in Egypt, Europe’s Journal of Psychology 1/2009
Harasym, M.T., The golden section and attitudes towards mental illness: how does
stigma influence golden section ratings? Thesis, The state university of New York at new
Paltz, 2008
Helen Lazaratou, et al., Parental attitudes and opinions on the use of psychotropic
medication in mental disorders of childhood, Annals of General Psychiatry 2007, 6:32
Helle Wessel Andersson, The effects of individual factors and school environment on
mental health and prejudiced attitudes among Norwegian adolescents, Soc Psychiat
Epidemiol, DOI 10.1007/s00127-009-0099-0
Henry C, Gay C: Maladie maniaco-dépressive ou troubles bipolaires. Encyclopédie
Orphanet, janvier 2004
Jacinta OA Tan , Psychiatrists' attitudes towards autonomy, best interests and
compulsory treatment in anorexia nervosa: a questionnaire survey, Child and Adolescent
Psychiatry and Mental Health 2008, 2:40
Jennifer Hill, Attitudes Toward Mental Disorders Among College Students, UW-L
Journal of Undergraduate Research VIII (2005)
John P. Gass, The knowledge and attitudes of mental health nurses to electro-convulsive
therapy, Journal of advanced nursing 1998, 27, 83-90
JOHN N. CHAPPEL,et al., Physician Attitudes Toward Distressed Colleagues, West J
Med 134:175-180, Feb 1981
Joseph Edward Bullock, Jr, Mental Health and Substance Abuse Professionals. Attitudes
Toward Dually Diagnosed Clients in a Community-Based Treatment Center, Thesis,
Virginia Polytechnic Institute and State University, Northern Virginia Campus
Falls Church, Virginia, March 21, 2002
Kapungwe, A. et al., Mental illness - stigma and discrimination in Zambia, African
Journal of Psychiatry 2010;13:192-203Psy
74
Karlawish, J., Older Adults’ Attitudes Toward Enrollment of Noncompetent Subjects
Participating in Alzheimer’s Research, Am J Psychiatry 2009; 166:182–188 201
Karolinska Institutet, PUBLIC ATTITUDES TOWARDS MENTAL ILLNESS AND
PEOPLE WITH MENTAL ILLNESS LIVING IN SWEDEN, Torbjörn Högberg,
20100;13:192-203
Kazantzis, N. et al.: Public attitudes toward people with mental illness in New Zealand,
1995-1996. Australian Journal of Rehabilitation Counselling Volume 15 Number 2 2009
pp. 74–91
KAZUYOSHI YAMAMOTO, et al., Attitudes of medical students towards persons with
mental disorders: A comparative study between Japan and Thailand, Psychiatry and
Clinical Neurosciences(1996), 50, 171-180
Kelly N. Gable , A Mental Health Elective to Improve Pharmacy Students’ Perspectives
on Mental Illness, American Journal of Pharmaceutical Education 2011; 75 (2) Article 34
Kohn, R., Attitudes towards mental illness in the Commonwealth of Dominica, Rev
Panam Salud Publica/Pan Am J Public Health 7(3), 2000
Lam et al. Mental health first aid training for the Chinese community in Melbourne,
Australia: effects on knowledge about and attitudes toward people with mental illness
International Journal of Mental Health Systems 2010, 4:18
Lambert, E.G., David N.Baker, Ventur,L. A, Preliminary Study of Views toward the
Mentally Ill and the Criminal Justice System: A Survey of College Students. Journal of
Criminology and criminal Justice Research and Education, Volume 2, Issue 1, 2008
LAUREL A. ALEXANDER1 & BRUCE G. LINK, The impact of contact on
stigmatizing attitudes toward people with mental illness, Journal of Mental Health (June
2003) 12, 3, 271 – 289
Lesley M. Roberts,Andrea Roalfe, Effects of Exposure to Mental Illness in Role-Play on
Undergraduate Student Attitudes, Fam Med 2008;40(7):477-83
Linden M.A., Redpath S.J., A comparative study of nursing attitudes towards young male
survivors of brain injury: A questionnaire survey, International Journal of Nursing
Studies 48 (2011) 62–69
Lisa Mori et al., Perceptions of Mental Illness and Psychotherapy in a Sample of
Asian, Hispanic, and White American College Students, Journal of Psychiatry,
psychology and mental health, Volume 1, Issue 2, 2007
75
M. ten Have, Are attitudes towards mental health help-seeking associated with service
use? Results from the European Study of Epidemiology of Mental Disorders, Soc
Psychiat Epidemiol (2010) 45:153–163
Mackenzie C.S. et al., Older Adults’ Help-Seeking Attitudes and Treatment Beliefs
Concerning Mental Health Problems, Am J Geriatr Psychiatry 2008; 16:1010–1019
Magliano, L., Beliefs About Schizophrenia in Italy: A Comparative Nationwide Survey
of the General Public, Mental Health Professionals, and Patients’ Relatives, Can J
Psychiatry, Vol 49, No 5, May 2004
Mahlalele, S. M. & Osiki, J. O., A Survey Study on the Stigmatization of the
Mentally-ill: The case of HA Leqele, Lesotho, Southern Africa , Ozean Journal of
Social Sciences 2(3), 2009
Malcolm Boyle, et al., Attitudes Towards Patients by Undergraduate Health Students
MARY TUCK AND DAVID RILEY,The Theory of Reasoned Action:A Decision
Theory of Crime
Mas,A. , A Hatim, Stigma in Mental Illness: Attitudes of Medical Students Towards
Mental Illness, Med J Malaysia Vol 57 No 4 December 2002
MASAYO UJI, Egalitarian sex role attitudes among Japanese human service
professionals: Confirmatory factor analytic study, Psychiatry and Clinical Neurosciences
(2006), 60, 296–302
MASAYO UJI, Rape Myth Scale: Factor structure and relationship with gender
egalitarianism among Japanese professionals, Psychiatry and Clinical Neurosciences
(2007), 61, 392–400
MATTHIAS C. ANGERMEYER, Emotional reactions to people with mental illness,
Epidemiologia e Psichiatria Sociale, 19, 1, 2010
Health Service Executive, Mental Health in Ireland: Awareness and Attitudes, 2007
MICHAEL PARROTT, NEWS FRAMES AND ATTITUDES TOWARD MENTAL
ILLNESS, A THESIS, The University of Alabama, 2010
Michelle L. West. Et al., Prevalence of Internalized Stigma among Persons with Severe
Mental Illness, Stigma Research and Action, Vol 1, No 1, 54–59 2011
76
Minas, H. et al., Attitudes of Malaysian general hospital staff towards patients with
mental illness and diabetes, BMC Public Health; 2011, 11:317
Mohammed Kabir, et al., Perception and beliefs about mental illness among adults in
Karfi village, northern Nigeria, BMC International Health and Human Rights, 2004, 4:3
Moradi, B., Risco C., Perceived Discrimination Experiences and Mental Health of
Latina/o American Persons, Journal of Counseling Psychology 2006, Vol. 53, No. 4,
411–421
NAOKO ISHIGE, AND NAOKI HAYASHI, Occupation and social experience: Factors
influencing attitude towards people with schizophrenia, Psychiatry and Clinical
Neurosciences (2005),59, 89–95
Nazish Imran, et al., A survey of public familiarity, knowledge and attitude towards
epilepsy in Lahore, Pakistan, Pak J Neurol Sci 2011; 6(1): 1 – 6
Husband, N., Digby Tantam, Attitudes to self-injury within a
group of mental health staff, British Journal of Medical Psychology (2000), 73, 495–504
Mehta, N., et al., Public attitudes towards people with mental illness in England and
Scotland, 1994 -2003 , The British Journal of Psychiatry (2009) 194, 278–284.
Gureje, O., et al., Community study of knowledge of and attitude to mental illness in
Nigeria, British Journal Of Psychiatry (2005), 186 : 436-441.
Paquin L., Attitudes du personnel soignant à l’egard des personnes atteintes du SIDA :
impact d’un programme de sensibilisation, Santé mentale au Québec, vol. 19, n° 2, 1994,
p. 191-209.
Pinar, Ay, et al., Does stigma concerning mental disorders differ through medical
education? A survey among medical students in Istanbul, Soc Psychiatry Psychiatr
Epidemiol (2006) 41: 63–67
Rabkin, J., Public attitudes toward mental illness: a review of the literature,
SCHIZOPHRENIA BULLETIN, ISSUE NO. 10, FALL 1974
Ryoko, S., Knowledge and attitude towards suicide among medical students in Japan:
Preliminary study, Psychiatry and Clinical Neurosciences (2006), 60, 558–562
Sadik S.et al., Public perception of mental health in Iraq, International Journal of Mental
Health Systems 2010, 4:26
77
Segal, D.L., Beliefs about mental illness and willingness to seek help: A cross-sectional
study, Aging & Mental Health, July 2005; 9(4): 363–367
Sévigny, R., et al., Attitudes Toward the Mentally Ill in a Sample of Professionals
Working in a Psychiatric Hospital in Beijing(China), Int J Soc Psychiatry 1999 45: 41
Sakamoto, S., Sociopsychological factors relating to suicide prevention in a Japanese
rural community: Coping behaviors and attitudes toward depression and suicidal ideation,
Psychiatry and Clinical Neurosciences (2006), 60, 676–686
Stacy, A.W., et al., Attitudes and Health Behavior in Diverse Populations: Drunk
Driving,
Alcohol Use, Binge Eating, Marijuana Use, and Cigarette Use, Health Psychology
1994, Vol. 13, No. 1, 73-85
Surgenor L.J., Attitudes toward seeking professional psychological help, New Zealand
Journal of Psychology, 1985, 14, 27-33
SU£EK J. et al. Attitude toward alcoholics and their families, JOURNAL OF
PHYSIOLOGY AND PHARMACOLOGY 2006, 57, Supp 4, 349.358
Tadashi Haraguchi, Attitudes of Japanese psychiatrists toward forensic mental health as
revealed by a national survey, Psychiatry and Clinical Neurosciences 2011; 65: 150–157
Tan,Susan MK Does Clinical Exposure to Patients in Medical School Affect Trainee
Doctors' Attitudes Towards Mental Disorders and Patients? · A Pilot Study. Med J
Malaysia Vol 60 No 3 August 2005
Taylor S.M., Michael J. Dear, Scaling Community Attitudes Toward the Mentally III,
SCHIZOPHRENIA BULLETIN, VOL. 7, NO. 2, 1981
Toshiyuki Kurihara, Public attitudes towards the mentally ill: A cross-cultural study
between Bali and Tokyo, Psychiatry and clinical Neurosciences (2000), 54, 547 – 552
Tsang, H. W. H., Chan, F., & Chan, C. C. H. (2004). Factors influencing occupational
therapy students’ attitudes toward persons with disabilities: A conjoint analysis.
American Journal of Occupational Therapy, 58, 426–434.
Tsvi Fischel, Does a Clerkship in Psychiatry Contribute to Changing Medical Students’
Attitudes Towards Psychiatry?, Academic Psychiatry 2008; 32:147–150
ÜÇOK ALP, Attitudes of psychiatrists toward patients with Schizophrenia, Psychiatry
and Clinical Neurosciences (2004), 58, 89–91
78
ÜÇOK ALP, The impact of antistigma education on the attitudes of general practitioners
regarding schizophrenia, Psychiatry and Clinical Neurosciences (2006), 60, 439–443
Wagner, L.C. et al. Mental health care: perceptions of people with schizophrenia and
their carers, Ciência & Saúde Coletiva, 16(4):2077-2087, 2011
YAMADA M.,et al., Investigation of nursing students’ attitudes toward people with
mental disorders, A comparative study of Thailand and Japan, 山梨医大紀要
第18巻,69-75(2001)
Yeap R, Low W Y, Mental health knowledge, attitude and help-seeking tendency: a
Malaysian context, Singapore Med J 2009; 50(12): 1169-1176
Wolff G., Community attitudes to mental illness, British Journal of Psychiatry (1996),
168, 183-190
Ymara Lúcia Camargo Vitoloa, ET AL., Parental beliefs and child-rearing attitudes
and mental health problems among school children, Rev Saude Publica 2005; 39(5)
Yosjio Mino, et al., Effects of Medical education on attitudes towards mental illness
among medical students: a five-year Follow-up study, Acta Med Okayama 2000; 54(3):
127 - 132
Zahid Javed et al., Attitude of the university students and teachers towards mentally ill, in
Lahore, Pakistan, J Ayub Med Coll Abbottabad 2006; 18(3)
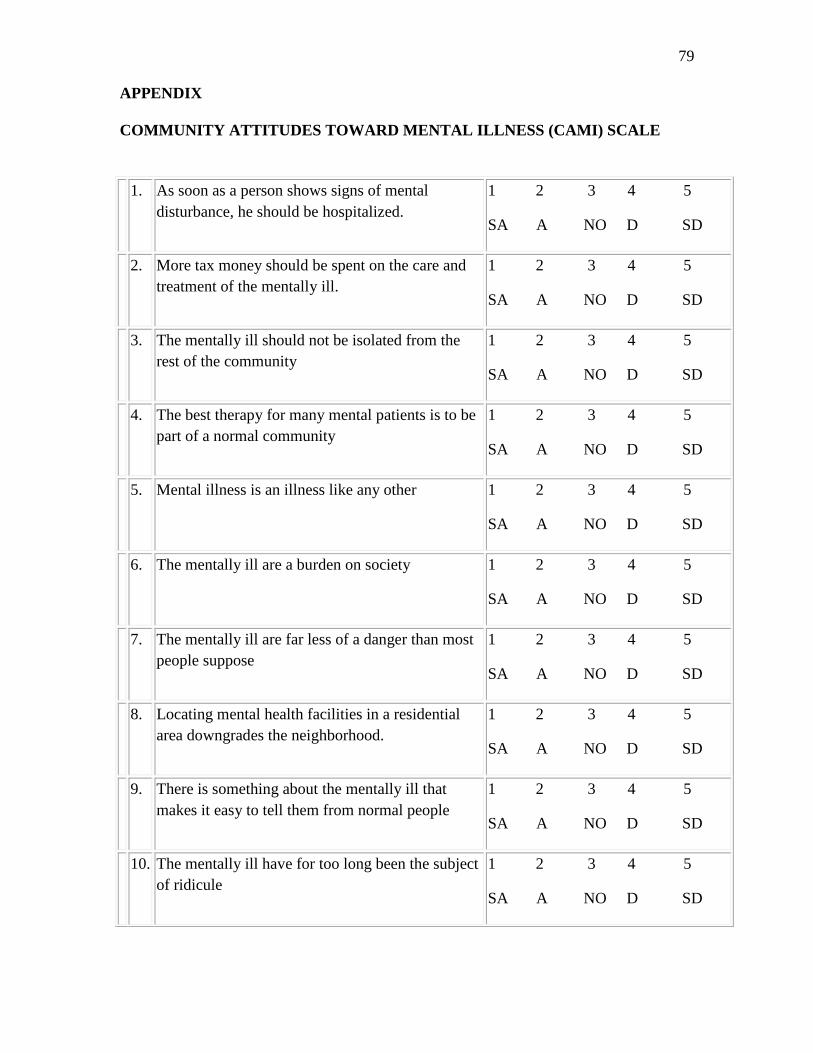
79
APPENDIX
COMMUNITY ATTITUDES TOWARD MENTAL ILLNESS (CAMI) SCALE
1. As soon as a person shows signs of mental
disturbance, he should be hospitalized.
1 2 3 4 5
SA A NO D SD
2. More tax money should be spent on the care and
treatment of the mentally ill.
1 2 3 4 5
SA A NO D SD
3. The mentally ill should not be isolated from the
rest of the community
1 2 3 4 5
SA A NO D SD
4. The best therapy for many mental patients is to be
part of a normal community
1 2 3 4 5
SA A NO D SD
5. Mental illness is an illness like any other 1 2 3 4 5
SA A NO D SD
6. The mentally ill are a burden on society 1 2 3 4 5
SA A NO D SD
7. The mentally ill are far less of a danger than most
people suppose
1 2 3 4 5
SA A NO D SD
8. Locating mental health facilities in a residential
area downgrades the neighborhood.
1 2 3 4 5
SA A NO D SD
9. There is something about the mentally ill that
makes it easy to tell them from normal people
1 2 3 4 5
SA A NO D SD
10. The mentally ill have for too long been the subject
of ridicule
1 2 3 4 5
SA A NO D SD
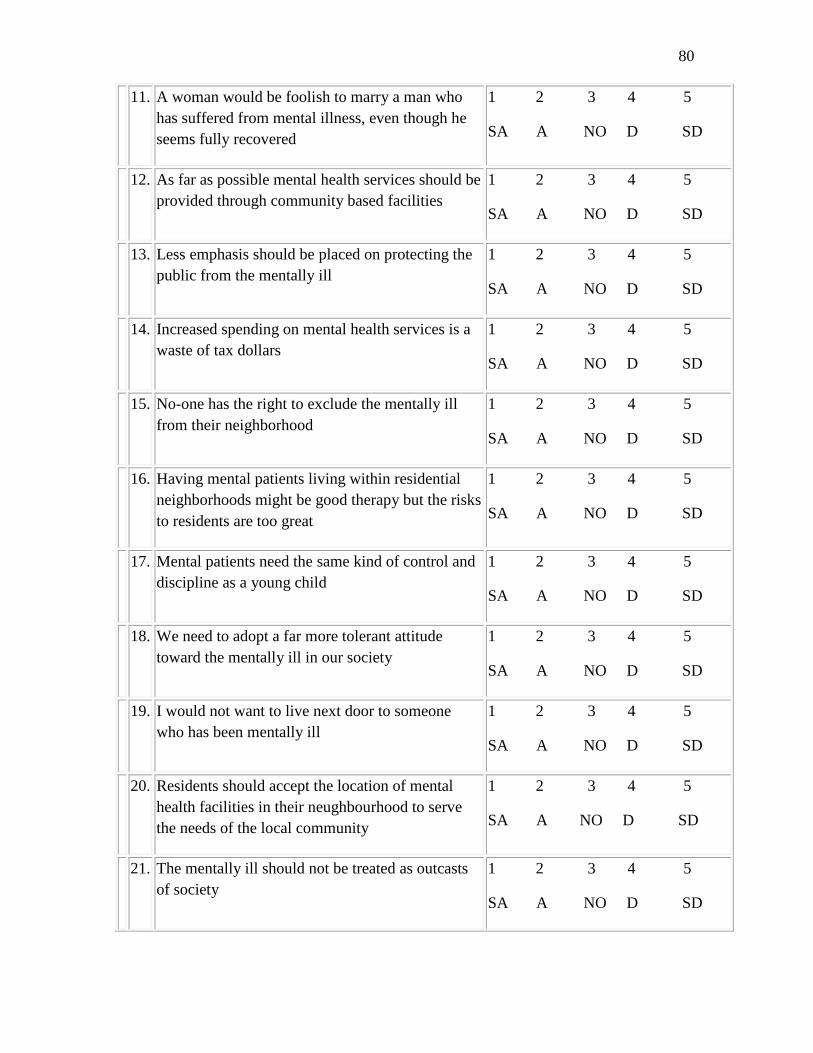
80
11. A woman would be foolish to marry a man who
has suffered from mental illness, even though he
seems fully recovered
1 2 3 4 5
SA A NO D SD
12. As far as possible mental health services should be
provided through community based facilities
1 2 3 4 5
SA A NO D SD
13. Less emphasis should be placed on protecting the
public from the mentally ill
1 2 3 4 5
SA A NO D SD
14. Increased spending on mental health services is a
waste of tax dollars
1 2 3 4 5
SA A NO D SD
15. No-one has the right to exclude the mentally ill
from their neighborhood
1 2 3 4 5
SA A NO D SD
16. Having mental patients living within residential
neighborhoods might be good therapy but the risks
to residents are too great
1 2 3 4 5
SA A NO D SD
17. Mental patients need the same kind of control and
discipline as a young child
1 2 3 4 5
SA A NO D SD
18. We need to adopt a far more tolerant attitude
toward the mentally ill in our society
1 2 3 4 5
SA A NO D SD
19. I would not want to live next door to someone
who has been mentally ill
1 2 3 4 5
SA A NO D SD
20. Residents should accept the location of mental
health facilities in their neughbourhood to serve
the needs of the local community
1 2 3 4 5
SA A NO D SD
21. The mentally ill should not be treated as outcasts
of society
1 2 3 4 5
SA A NO D SD
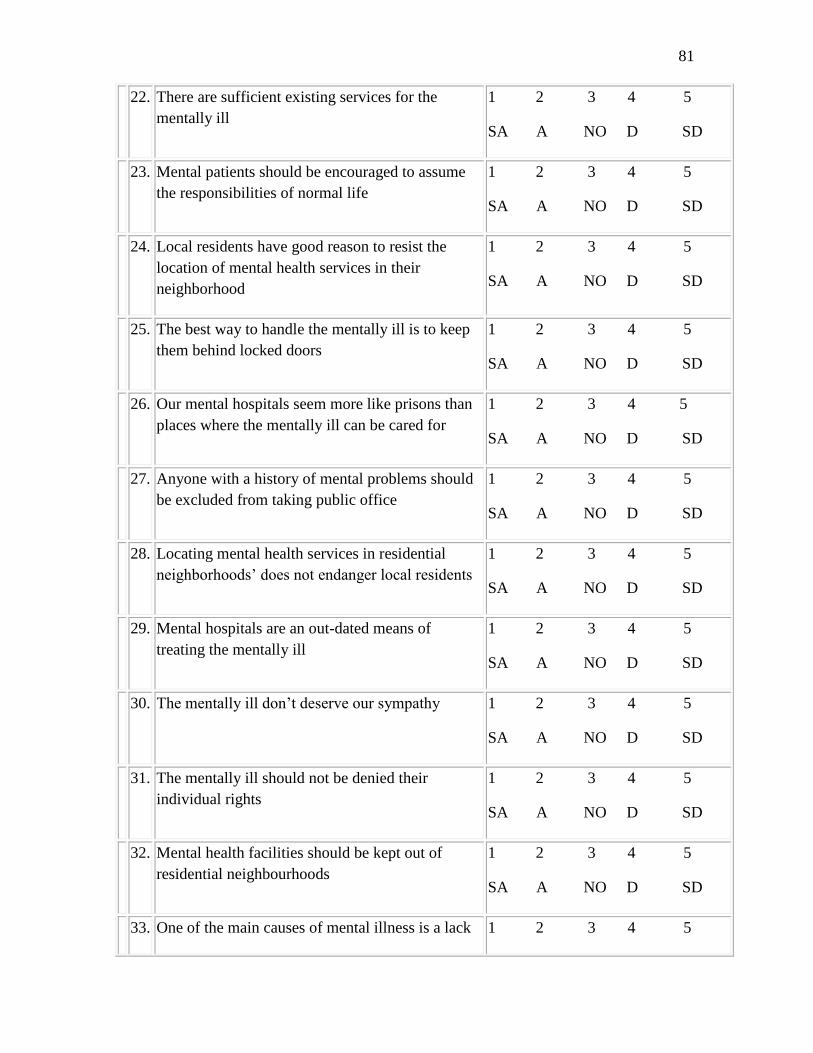
81
22. There are sufficient existing services for the
mentally ill
1 2 3 4 5
SA A NO D SD
23. Mental patients should be encouraged to assume
the responsibilities of normal life
1 2 3 4 5
SA A NO D SD
24. Local residents have good reason to resist the
location of mental health services in their
neighborhood
1 2 3 4 5
SA A NO D SD
25. The best way to handle the mentally ill is to keep
them behind locked doors
1 2 3 4 5
SA A NO D SD
26. Our mental hospitals seem more like prisons than
places where the mentally ill can be cared for
1 2 3 4 5
SA A NO D SD
27. Anyone with a history of mental problems should
be excluded from taking public office
1 2 3 4 5
SA A NO D SD
28. Locating mental health services in residential
neighborhoods’ does not endanger local residents
1 2 3 4 5
SA A NO D SD
29. Mental hospitals are an out-dated means of
treating the mentally ill
1 2 3 4 5
SA A NO D SD
30. The mentally ill don’t deserve our sympathy 1 2 3 4 5
SA A NO D SD
31. The mentally ill should not be denied their
individual rights
1 2 3 4 5
SA A NO D SD
32. Mental health facilities should be kept out of
residential neighbourhoods
1 2 3 4 5
SA A NO D SD
33. One of the main causes of mental illness is a lack 1 2 3 4 5
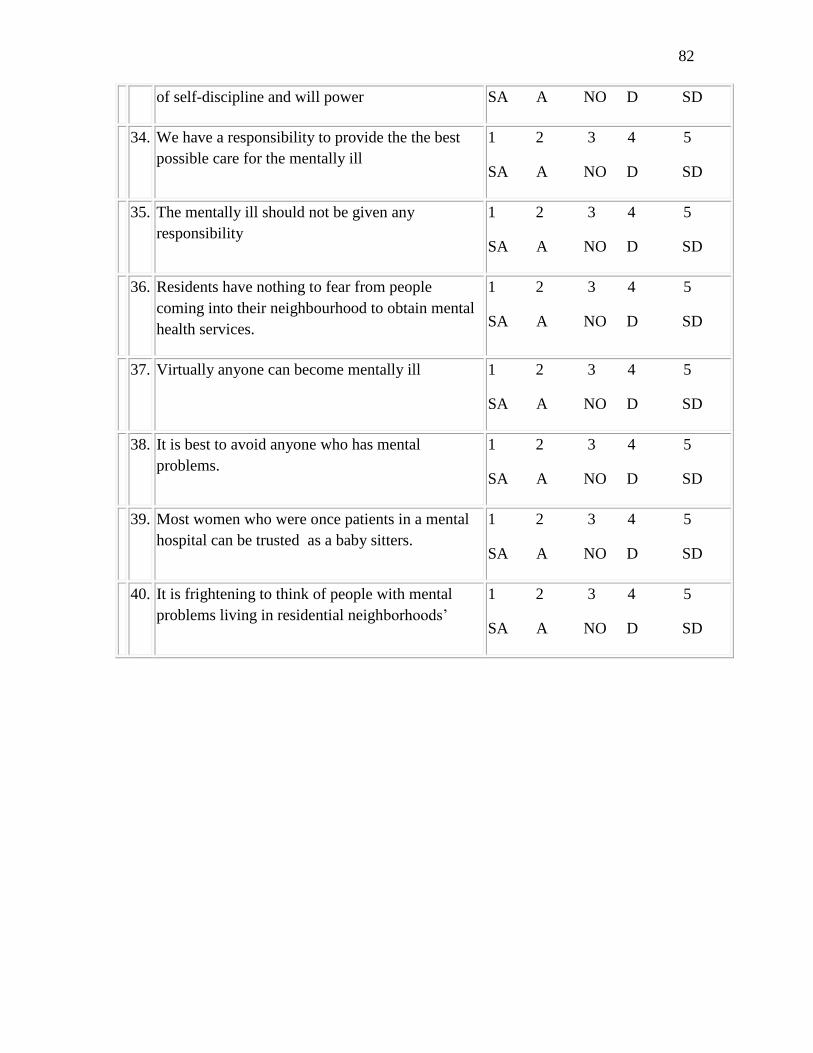
82
of self-discipline and will power SA A NO D SD
34. We have a responsibility to provide the the best
possible care for the mentally ill
1 2 3 4 5
SA A NO D SD
35. The mentally ill should not be given any
responsibility
1 2 3 4 5
SA A NO D SD
36. Residents have nothing to fear from people
coming into their neighbourhood to obtain mental
health services.
1 2 3 4 5
SA A NO D SD
37. Virtually anyone can become mentally ill 1 2 3 4 5
SA A NO D SD
38. It is best to avoid anyone who has mental
problems.
1 2 3 4 5
SA A NO D SD
39. Most women who were once patients in a mental
hospital can be trusted as a baby sitters.
1 2 3 4 5
SA A NO D SD
40. It is frightening to think of people with mental
problems living in residential neighborhoods’
1 2 3 4 5
SA A NO D SD
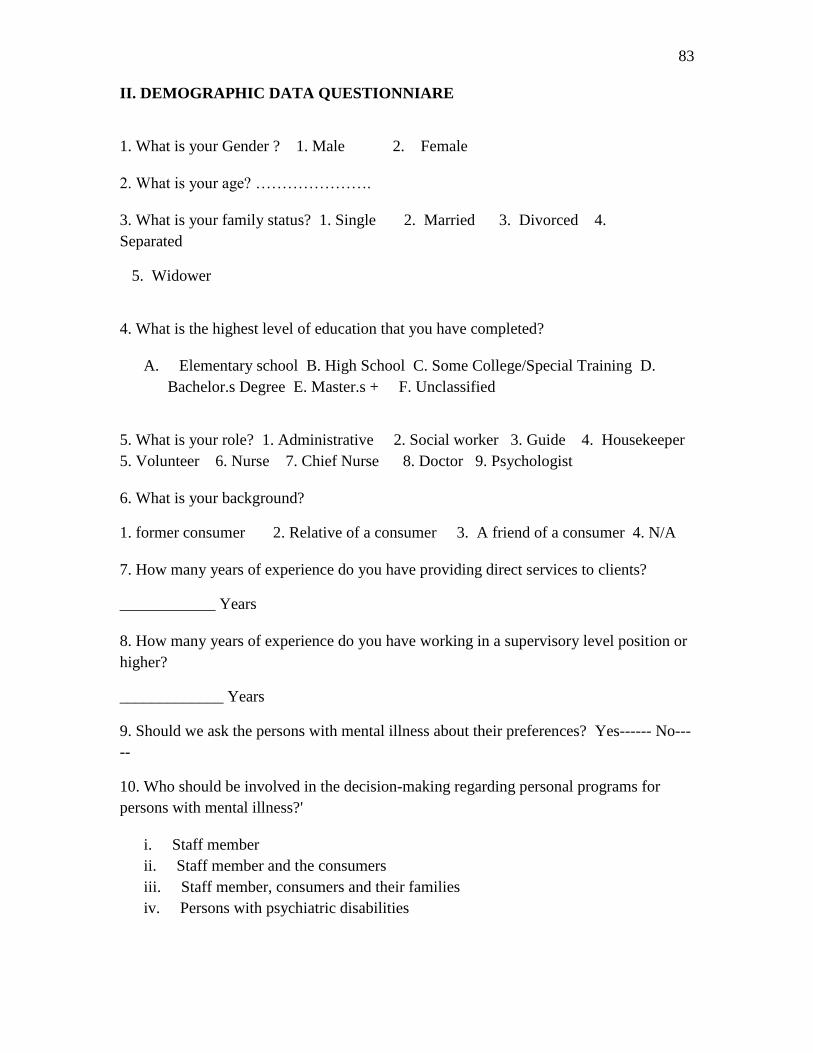
83
II. DEMOGRAPHIC DATA QUESTIONNIARE
1. What is your Gender ? 1. Male 2. Female
2. What is your age? ………………….
3. What is your family status? 1. Single 2. Married 3. Divorced 4.
Separated
5. Widower
4. What is the highest level of education that you have completed?
A. Elementary school B. High School C. Some College/Special Training D.
Bachelor.s Degree E. Master.s + F. Unclassified
5. What is your role? 1. Administrative 2. Social worker 3. Guide 4. Housekeeper
5. Volunteer 6. Nurse 7. Chief Nurse 8. Doctor 9. Psychologist
6. What is your background?
1. former consumer 2. Relative of a consumer 3. A friend of a consumer 4. N/A
7. How many years of experience do you have providing direct services to clients?
____________ Years
8. How many years of experience do you have working in a supervisory level position or
higher?
_____________ Years
9. Should we ask the persons with mental illness about their preferences? Yes------ No---
--
10. Who should be involved in the decision-making regarding personal programs for
persons with mental illness?'
i. Staff member
ii. Staff member and the consumers
iii. Staff member, consumers and their families
iv. Persons with psychiatric disabilities