Embed Size (px)
Citation preview

Developing statistical literacy with students and
teachers in the secondary mathematics
classroom
A thesis submitted in partial fulfilment of the requirements for the degree of
Masters in Education
at
The University of Waikato
by
Philip Doyle
The University of Waikato
2008
Developing statistical literacy with students and teachers in the secondary mathematics classroom i
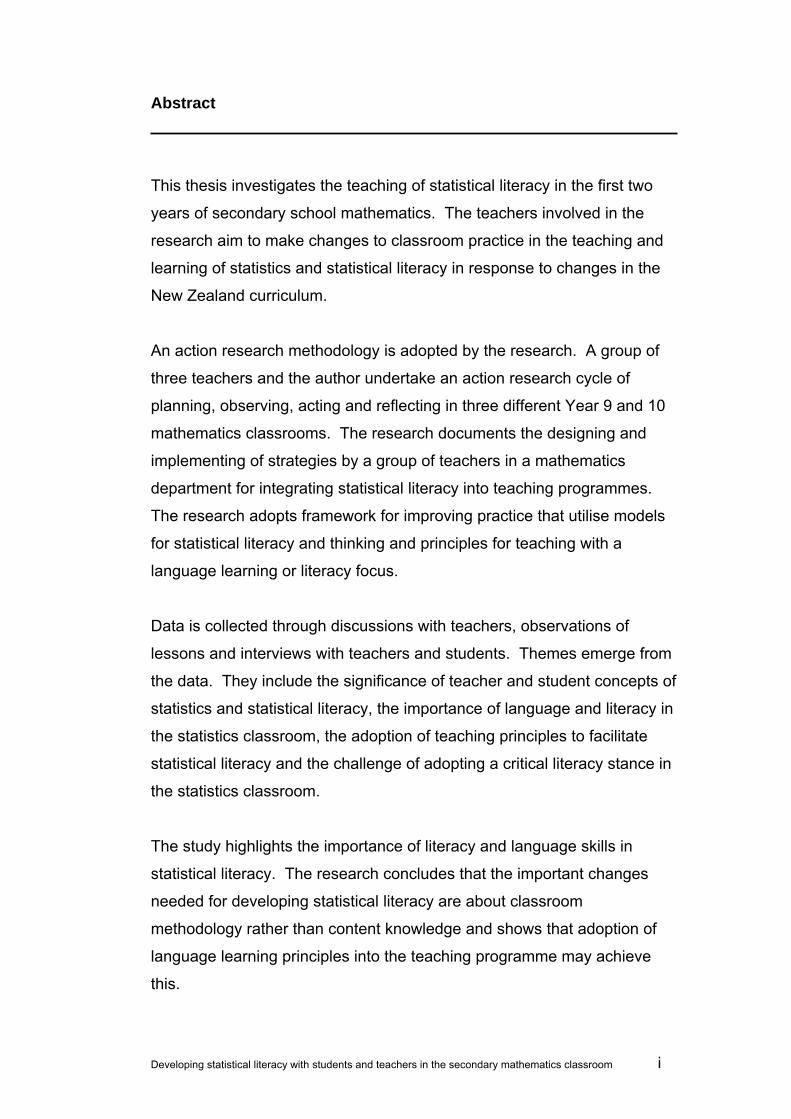
Abstract
This thesis investigates the teaching of statistical literacy in the first two
years of secondary school mathematics. The teachers involved in the
research aim to make changes to classroom practice in the teaching and
learning of statistics and statistical literacy in response to changes in the
New Zealand curriculum.
An action research methodology is adopted by the research. A group of
three teachers and the author undertake an action research cycle of
planning, observing, acting and reflecting in three different Year 9 and 10
mathematics classrooms. The research documents the designing and
implementing of strategies by a group of teachers in a mathematics
department for integrating statistical literacy into teaching programmes.
The research adopts framework for improving practice that utilise models
for statistical literacy and thinking and principles for teaching with a
language learning or literacy focus.
Data is collected through discussions with teachers, observations of
lessons and interviews with teachers and students. Themes emerge from
the data. They include the significance of teacher and student concepts of
statistics and statistical literacy, the importance of language and literacy in
the statistics classroom, the adoption of teaching principles to facilitate
statistical literacy and the challenge of adopting a critical literacy stance in
the statistics classroom.
The study highlights the importance of literacy and language skills in
statistical literacy. The research concludes that the important changes
needed for developing statistical literacy are about classroom
methodology rather than content knowledge and shows that adoption of
language learning principles into the teaching programme may achieve
this.

Developing statistical literacy with students and teachers in the secondary mathematics classroom. ii
Dedication
For Toni and our most wonderful daughters Millie and Isabel.

Developing statistical literacy with students and teachers in the secondary mathematics classroom. iii
Acknowledgement
First of all I would like to thank the other participants in this research. I am
indebted to all the teachers and students involved for their honesty,
openness and willingness to share.
To the teachers involved I would like to further express my admiration and
respect for their unwavering commitment to improving practice, for
showing the benefits of collegiality and for their limitless generosity of time
and ideas.
I would like to express my gratitude to my supervisors Dr Sashi Sharma
and Judy Bailey. I thank them for their constant support, thoughtful advice
and endless encouragement.
I would like to also acknowledge the Ministry of Education for their support
in the form of a study award granted as part of the Secondary and Area
Schools Collective Agreement study award scheme.
My sincere thanks go to Team Solutions advisors; Jenni Bedford [ESOL],
Tjitske Hunter [ESOL] and Pip Arnold [Mathematics], for their help with
ideas and materials. Thanks also to ESOL online, the ARB from NZCER,
Census@schools and Numeracy in the News for resources.
Thanks to Br. Peter Thompson for all his support, not only the technical
assistance but also for the countless cups of tea.
Finally, I would like to thank my family for all their love, support and
patience.
Developing statistical literacy with students and teachers in the secondary mathematics classroom. iv
Table of Contents
Abstract i
Dedication ii
Acknowledgement iii
Table of Contents iv
List of Tables ix
List of Figures x
Chapter 1: Introduction 11
1.1 Rationale 11
1.2 Research question 13
1.3 Overview of the thesis 14
Chapter 2: Review of the Literature 15
2.1 Introduction 15
2.2 Statistics education 15
2.2.1 International trends 16
2.2.2 The New Zealand situation 18
2.3 Mathematics and statistics debate 18
2.3.1 Difference as context 19
2.3.2 Difference as multiple solutions 20
2.3.3 Difference as statistical literacy 20
2.3.4 Difference as teaching methods 21
2.3.5 Difference as language 22
2.4 Mathematics and statistics education in New Zealand 22
2.4.1 The current mathematics curriculum and its review 23
2.4.2 1992 curriculum reform in New Zealand 25
2.4.3 Evidence of current statistics education practice 26
2.4.4 Unpacking statistics 28
2.5 Statistical literacy 28 2.5.1 Definitions 28
Developing statistical literacy with students and teachers in the secondary mathematics classroom. v
2.5.2 Statistical literacy, statistical reasoning and statistical
thinking 30
2.5.3 My stance on statistical literacy 33
2.6 Statistical literacy frameworks 34
2.6.1 The components of statistical literacy 35
2.6.2 A statistical literacy construct 35
2.6.3 Framework for statistical thinking in empirical enquiry 38
2.6.3 Being critical 41
2.7 Literacy and language in the mathematics classroom 42
2.7.1 Language demands in the mathematics classroom 43
2.8 Critical literacy and the mathematics classroom 46
2.8.1 Descriptions of critical literacy 46
2.8.2 Critical literacy frameworks 47
2.8.3 Critical mathematical frameworks 49
2.8.4 A critical statistical literacy 50
2.8.5 Equity issues and critical literacy 52
2.8.6 Links between critical literacy and statistical literacy 53
2.9 Implications for classroom practice 53
2.9.1 New Zealand classrooms 54
2.9.2 Teacher professional development 54
2.9.3 Other models for teacher professional development 57
2.9.4 Models for professional development in New Zealand 58
2.10 Conclusions and focus for study 61
Chapter 3: Methodology 64
3.1 Introduction 64
3.2 Action research 64
3.2.1 Key components of action research 65
3.2.2 Benefits of action research 67
3.3 Trustworthiness 68
3.3.1 Validity 69
3.4 Data collection 71
Developing statistical literacy with students and teachers in the secondary mathematics classroom. vi
3.4.1 Interviews 71
3.4.2 Classroom Observations 73
3.4.3 Artefacts 73
3.4.4 Triangulation 74
3.5 Data Analysis 74
3.6 My place in the research 76
3.7 Research design and method for this thesis 78
3.7.1 Focus of this thesis 78
3.7.2 Participants 79
3.7.3 The background of the school 80
3.7.4 The background of the teachers 81
3.7.5 The background of the students and the classrooms 82
3.7.6 Data collection methods 82
3.7.7 Data collection phases 83
3.7.8 Interviews with teachers 84
3.7.9 Classroom Observations 85
3.7.10 Interviews with students 86
3.7.11 Artefacts 87
3.7.12 Ethical issues 87
3.7.13 Approval from University of Ethics Committee 88
3.7.14 Informed consent from the teachers and students 88
Chapter 4: Analysis and results 91
4.1 Introduction 91
4.2 Themes emerging from Initial meeting 92
4.2.1 Concepts of statistics 92
4.2.2 Concepts of statistical literacy 98
4.2.3 Adoption of teaching principles 100
4.3 Themes emerging from the planning of the unit 101
4.3.1 Language and literacy in the statistics classroom 102
4.3.2 Critical literacy and the statistics classroom 104
4.4 Classroom observations and data 105
4.4.1 Concepts of statistics 106
Developing statistical literacy with students and teachers in the secondary mathematics classroom. vii
4.4.2 Concepts of statistical literacy 111
4.4.3 Adoption of teaching principles 117
4.4.4 Language and literacy in the statistics classroom 119
4.4.5 Critical literacy in the statistics classroom 125
4.5 Student interviews 127
4.5.1 Concepts of statistics 128
4.5.2 Concepts of statistical literacy 131
4.5.3 Adoption of teaching principles 131
4.5.4 Language and literacy in the statistics classroom 132
4.5.5 Critical literacy in the statistics classroom 133
4.6 Teachers interview 134
4.6.1 Concepts of statistics 134
4.6.2 Concepts of statistical literacy 135
4.6.3 Adoption of teaching principles 137
4.6.4 Language and literacy in the statistics classroom 138
4.6.5 Critical literacy in the statistics classroom 139
5.1 Introduction 141
5.2 Concepts of statistics 141
5.2.1 Statistics as skills 141
5.2.2 Statistics as process 142
5.2.3 Statistics as context 143
5.2.4 Statistics as statistical literacy 143
5.3 Concepts of statistical literacy 144
5.4 Adoption of teaching principles 146
5.5 Language and literacy in the statistics classroom 147
5.6 Adopting a critical statistical literacy 149
5.7 The research process 152
Chapter 6: Implications and recommendations 155
6.1 Introduction 155
6.2 Research questions 156
6.3 Limitations 160
6.4 Wider implications and further research 161

Developing statistical literacy with students and teachers in the secondary mathematics classroom. viii
6.5 Final words 163
References 164
Appendix A Introductory letter to the Principal 179
Appendix B Participant Information Sheet 180
Appendix C Participant Information Sheet 181
Appendix D Consent form Teacher 182
Appendix E Consent form Student and Parent/Caregiver 183
Appendix F Focus Interview Questions and Themes 184
Appendix H Census at Schools data card activity 186
Appendix I Schemes 187

Developing statistical literacy with students and teachers in the secondary mathematics classroom. ix
List of Tables
Table 1 Ethnicity of students 80
Table 2 Student participants 86

Developing statistical literacy with students and teachers in the secondary mathematics classroom. x
List of Figures
Figure 1 Curriculum Development - Brunning and Neill (2007) 24
Figure 2 Draft Level 4 Achievement Objectives 24
Figure 3 Level 5 Achievement Objectives 24
Figure 4 delMas’ perspectives on statistical literacy 32
Figure 5 delMas' three instructional domains 33
Figure 6 A statistical literacy construct - Watson and Callingham 37
Figure 7 Statistical thinking in empirical enquiry – Wild and
Pfannkuch 39
Figure 8 The four resources model – Freebody and Luke 48
Figure 9 Multiliteracies pedagogy - Kalantzis and Cope 48
Figure 10 Frankenstein’s criticalmathematical literacy curriculum 50
Figure 11 Principles from “Making language and learning work 1” 61
Figure 12 Action research cycle 66
Figure 13 I wonder… sheet 109
Figure 14 Student investigations – comparing data. 110
Figure 15 Student investigations – summarising data. 110
Figure 16 Teacher A teaching support material 112
Figure 17 Student A2 114
Figure 18 Student A1 115
Figure 19 Student B3 115
Figure 20 Student C2 116
Figure 21 Teacher A vocabulary focus. 119
Figure 22 Board layout 21 August 121
Figure 23 Board Layout 23 August 121
Figure 24 Vocabulary – arrangement 1. 122
Figure 25 Vocabulary – arrangement 2 123
Developing statistical literacy with students and teachers in the secondary mathematics classroom. 11
Chapter 1: Introduction
1.1 Rationale
The initial concern that triggered this research was an assumed lack of
preparedness of a group of high school mathematics teachers in the face of
looming curriculum change in the statistics strand in the Mathematics and
Statistics Learning Area of the New Zealand Curriculum. The aim of the
teachers involved in this research was to make changes to classroom
practice in the teaching and learning of statistics and statistical literacy at the
Year 9 and 10 levels in response to the current curriculum, proposed draft
and now new curriculum.
My own journey and experiences as a secondary school mathematics
teacher in New Zealand have also largely determined the focus and direction
taken by this thesis. I began teaching in the early 1990’s during a period of
reform or re-voicing in the New Zealand school curriculum. The Mathematics
in the New Zealand Curriculum (Ministry of Education, 1992) was central to
my pre-service training and beginning-teacher professional development.
The 1992 curriculum, and its guiding principles both explicit and implicit,
greatly influenced my development as a teacher.
As a teacher I have come to value lessons where learners, actively engaged
in the learning process, build their knowledge through experience and
negotiation of meaning through interaction with others. I believe that
students need to be given opportunities to reflect on their learning and
evaluate their own understanding.
As a mathematics teacher I see it as essential that we provide a broad based
mathematics curriculum for all students so they are able to become active,
knowledgeable and critical citizens in society. As a statistics teacher I want
to prepare all students to be able to participate in decision making in the
world around them based on data. I also want to share with students my
enjoyment of learning and doing mathematics and statistics.

Developing statistical literacy with students and teachers in the secondary mathematics classroom. 12
The other major influence on my development as a teacher has been my
study into literacy and language in the mathematics classroom, with both
ESOL1 students and the mainstream. As a teacher in a multicultural
Auckland high school I consider that the different levels of literacy and the
enormously varied literacies that students bring to learning is one of the
biggest challenges in education. However, I have also come to believe that
the linguistic and cultural diversity of our students and teachers is in fact an
advantage and a resource rather than a hindrance to learning in the
classroom.
And now as I prepare this thesis we are undergoing a national curriculum
review and implementation. Just as I have developed as a teacher, the
curriculum also develops. There will be the introduction of new pedagogical
principles and the modification or re-emphasis of others. Again the new
curriculum, and its guiding principles both explicit and implicit, will influence
each school’s curriculum and finally what actually happens in the classroom.
I am interested in how we can prepare our students and ourselves as
teachers for the new [or re-emphasized] demands of The New Zealand
Curriculum: Draft for consultation 2006 and the Mathematics and Statistics
Achievement Objectives. I am particularly interested in investigating the
teaching and learning statistical literacy and the demands that it will place on
students and teachers.
I am especially interested in investigating the teaching and learning of
statistical literacy in schools that are like my own. In such schools statistical
literacy will be taught in classrooms where there is a wide diversity in the
language and literacy skills of learners. I am interested in finding ways of
how this diversity can be used to help students learn.
Many of the issues, about pedagogy, curriculum change, literacy and equality
for students are shared by the teachers in this research. This research is in
response to those concerns.
1 ESOL – English for Speakers of Other Languages.

Developing statistical literacy with students and teachers in the secondary mathematics classroom. 13
1.2 Research question
There is research available, both internationally and from New Zealand on
the nature of statistics and statistical literacy. There also exists excellent
New Zealand research into teacher professional development and curriculum
development projects for the teaching of statistics and statistical
investigations. Some investigation has been made into the teaching of
statistical literacy in New Zealand. However, I do not believe that links
between statistics education, statistical literacy and literacy have been fully
explored in the research.
Therefore, the main research question addressed in this study is:
How can we help students and teachers develop statistical literacy in
the secondary mathematics classroom?
In answering this main research question the following questions may
hopefully also be answered:
What are teachers and students views about the nature of statistics
and statistical literacy in the Mathematics [and Statistics] curriculum?
What is needed to facilitate the development of statistical literacy with
students and teachers in secondary mathematics classrooms?
How can we assess statistical literacy with our students?
How can using language learning principles help students and
teachers to develop statistical literacy in secondary mathematics
classrooms?
How can using the ‘principles of effective teaching for learners from
diverse language and cultural backgrounds’2 help students and
2 Taken from ESOL online and the DVD Making Language and Learning Work 1: Integrating Language and
Learning in Secondary Maths and Science

Developing statistical literacy with students and teachers in the secondary mathematics classroom. 14
teachers to develop statistical literacy in the secondary mathematics
classroom?
What are the appropriate professional development strategies for
teachers to use in this context?
1.3 Overview of the thesis
This opening chapter presents the research question for this inquiry. Chapter
2 reviews the literature on statistical literacy. The chapter begins with a
description of statistics education and statistical literacy. The chapter then
explores the links between statistical literacy, literacy and critical literacy.
The next section attempts to link the teaching principles for statistical literacy
to the teaching and learning principles of literacy by investigating possible
frameworks and models for instruction. Finally the literature review explores
the implications for the classroom and professional development for
teachers. Chapter 3 describes the methodology used for collecting and
analysing the data. Chapter 3 also outlines clearly the context of the study
and how the research was planned and undertaken. The initial results and
analysis from the first cycle of the research are presented in Chapter 4. The
chapter documents the experiences of teachers and students in the teaching
and learning of a unit of work on statistics and statistical literacy. The
findings are discussed in Chapter 5. The limitations of the study, implications
and recommendations for further research are discussed in Chapter 6.

Developing statistical literacy with students and teachers in the secondary mathematics classroom. 15
Chapter 2: Review of the Literature
2.1 Introduction
This chapter is a review of the literature about the notion of statistical literacy
and its place in the secondary mathematics classroom. Many teachers and
education researchers, both in New Zealand and internationally, consider
statistical literacy to be an integral part of an effective school mathematics
programme. However, there are a range of conceptualisations of statistical
literacy and what statistical literacy means for secondary school mathematics
teachers and students. Different experts have theorised about statistical
literacy and different teachers, schools, states and nations have implemented
programmes for developing statistical literacy into their curricula statements.
The intention of this literature review is to explore some of these issues
particularly in relation to the research questions posed.
Section 2.2 gives a brief history of statistics education both internationally
and in New Zealand. Section 2.3 investigates the perceived differences
between mathematics and statistics. In section 2.4 the development of
mathematics and statistics education in New Zealand is examined. In
section 2.5 an attempt is made to define what is meant by statistical literacy.
Section 2.6 describes the theoretical models or frameworks for statistical
literacy that are used by teachers and researchers to discuss statistical
literacy in the mathematics classroom. Links between statistical literacy and
literacy education are explored in section 2.7. Section 2.8 examines notions
of literacy with respect to critical literacy, including the possibility of a critical
statistical literacy. The implications for teachers and their classrooms in a
statistical literacy classroom are considered in section 2.9. The place of
teacher professional models, such as reflexive action, or action research in
improving practitioners’ [own] practice through evaluation and action are
investigated. Section 2.10 concludes the Chapter by restating the focus of
study.
2.2 Statistics education

Developing statistical literacy with students and teachers in the secondary mathematics classroom. 16
It has long been recognised that the subject of statistics
has been badly taught and not well learned....
(Stuart, 2005, p.1)
As teachers, we hope that we can help our students develop into statistically
educated citizens. However, Stuart (2005) contends the reality may be
somewhat different. It is therefore important to try and track the development
of statistics education so that we can reach a greater understanding of why
things may or may not be happening in our classrooms and how we might
look for ways to foster statistical literacy and the ability to think statistically
with our students.
2.2.1 International trends
There is a significant body of literature regarding statistics and the
development of statistics education in schools both from New Zealand and
from around the world. Watson (2006), focusing on the predominately
English speaking countries of Australia, United Kingdom, New Zealand and
the United States, documents the development of statistics education in
schools. She describes the work of pioneers such as Radhakrishna Rao and
Peter Holmes in the United Kingdom during the 1970’s and 1980’s who
pushed for the inclusion of statistics into secondary school mathematics
curricula. Holmes’ (1986) framework for statistics instruction comprises five
components - data collection, data tabulation and representation, data
reduction, probability and interpretation and inference and was seen as the
basis for a statistics curriculum. Watson (2006) also traces the development
of statistics in the school curriculum back to initiatives in the United States,
led by groups like the American Statistical Association [ASA] the Quantitative
Literacy3 movement and the subsequent National Council of Teachers of
Mathematics [NCTM] principles and standards set out in 1989. Updated in
2000, the NCTM principles and standards classify statistics as data analysis
3Quantitative Literacy is a term used predominately in the United States instead of the term Numeracy. However
there could be some room for misunderstanding as the aims of Quantitative Literacy are perhaps much broader
than what could be considered the goals of say numeracy in the Ministry of Education’s National Education Goals in
New Zealand. The Quantitative Literacy projects of the NCTM and ASA advocated for a greater emphasis on
statistics and probability, communicating and problem solving in real-life contexts.

Developing statistical literacy with students and teachers in the secondary mathematics classroom. 17
and probability. The data analysis and probability content standards were to
encourage instructional programmes that would enable all students to be
able to; formulate questions that can be addressed with data and collect,
organize and display relevant data to answer them, select and use
appropriate statistical methods to analyse data, develop and evaluate
inferences and predictions, and reason with probability (NCTM, 2000).
There appears to be widespread agreement about the nature of statistical
inquiry and the requirements for statistics education around the world. This
is evident in curricula, policy statements and curriculum analysis from
countries such as Australia (Australian Education Council, 1991), New
Zealand (Ministry of Education, 1992), China (Li, 2004), Italy (Ottaviani &
Luchini, 2005) and the United States (NCTM, 2000). The experience of
these countries appears similar. In each case statistical organisations and
mathematics and statistics educators have got together to be advocates for
change and have worked to develop school curricula (Barbieri & Giacché,
2006). However, as Watson (2006) points out, the official implementation of
statistics into school curricula in countries like Australia, New Zealand, United
Kingdom and United States only started in the early 1990’s. Remarkably,
this means that the adoption of statistics and probability in many state and
national curricula around the world has occurred only in the last 20 years.
Despite statistics education’s relative newness as a discipline there is ample
statistics education research regarding statistical thinking and statistical
literacy (Chance, 2002; Gal. 2002; Garfield & Gal, 1999; Graham, 2006;
Schield, 2005b; Stuart, 2005; Utts, 2003, Watson, 1997; Watson &
Callingham, 2005; Wild & Pfannkuch, 1999) and how statistics should be
expressed in curriculum statements (Begg; 2005; Begg, Pfannkuch, Camden,
Hughes, Noble & Wild, 2004; Holmes; 1986; NCTM, 2000).
New Zealand is well placed in the statistics education discourse. Overseas
researchers (Watson cited in Begg et al., 2004), have commented on the
strength of the New Zealand curriculum with respect to the teaching of
statistics. Perhaps this perceived strength is because of the relatively early
adoption of statistics into school curricula compared to other countries or

Developing statistical literacy with students and teachers in the secondary mathematics classroom. 18
maybe because statistics had been adopted into an official national school
curriculum. Whatever the reason, a positive consequence of this situation is
that New Zealand researchers are well represented in the research literature.
In addition New Zealand researchers and educators are well represented in
international organisations for promoting statistics education such as the
International Association of Statistical Education [IASE].
2.2.2 The New Zealand situation
The need for statistically literate students in New Zealand schools is
highlighted very early in the 1992 curriculum document, Mathematics in the
New Zealand Curriculum [MiNZC] (Ministry of Education, 1992). The MiNZC
states, in the general aims for mathematics education, that the curriculum
must “...help students to achieve the mathematical and statistical literacy
needed in a society which is technologically oriented and information rich”
(Ministry of Education, 1992, p.8). While I would argue that the majority of
New Zealand secondary mathematics teachers find this a perfectly
reasonable goal to make in a mathematics curriculum document, I believe
that there is still little evidence of (or guidance provided for) the effective
teaching of statistical literacy.
The latest description of statistics education in New Zealand in the 2007
curriculum gives us a new definition of mathematics and statistics. The
learning area statement is at pains to differentiate between statistics and
mathematics. The New Zealand curriculum (Ministry of Education, 2007b)
states that “these two disciplines are related but different ways of thinking
and of solving problems” (Ministry of Education, 2007b, p. 26).
2.3 Mathematics and statistics debate
Both in New Zealand (Begg et al., 2004) and internationally (Gal & Garfield,
1997; Watson; 2006) there is debate amongst educationalists and curriculum
developers on the nature of statistics and mathematics and best practice for
instruction. In fact Begg et al. go further to describe a debate about whether
statistics should be placed in the mathematics curriculum at all. However,

Developing statistical literacy with students and teachers in the secondary mathematics classroom. 19
whatever the position taken all researchers attempt to describe the
differences between statistics and mathematics.
Many researchers (Begg et al., 2004; Gal & Garfield, 1997; Holmes, 1986;
Watson, 2006) attempt to contrast the deterministic nature of mathematics,
with its precision and exactness, against the stochastic nature of statistics,
with its probability and variation. Begg et al. characterise the differences as
mathematics being ‘concerned with reasoning with certainty’ while ‘statistics
is concerned with reasoning with uncertainty’. Gal and Garfield distinguish
between mathematics and statistics by arguing that statistics is a
mathematical science but is not a branch of mathematics.
In the following sections I attempt to classify the differences and points of
differentiation between mathematics and statistics described in statistics
education research.
2.3.1 Difference as context
Researchers (Chance, 2002; delMas, 2002; Gal & Garfield, 1997) describe
the difference between mathematics and statistics as being the importance of
context or the “‘messiness’ or context-boundness of statistics” (Gal &
Garfield, 1997, p6). To some extent I feel that this is overstated, as
mathematics problems are similarly situated in context and can be just as
messy. However, statistics does require all learners to put the numbers and
data from statistical problems into context and any attempt to remove the
context makes the activity meaningless. Stuart (2005) believes that
statistical problem solving “requires the statistician to become involved in the
context of the problem at all stages” (Stuart, 2005, p.12). This is a more
compelling argument for me. Whereas we often seek to generalise
mathematical problems by de-contextualising the situation, statistical
problems stop having any real meaning outside of their context. Removing
the “noise” of a problem to abstract it into a mathematically concise form may
be one of the strengths of mathematical thinking. However, removing the
context does not work in statistics because the solution lies in the context.
Developing statistical literacy with students and teachers in the secondary mathematics classroom. 20
2.3.2 Difference as multiple solutions
Gal and Garfield (1997) also believe that one of the major differences
between mathematics and statistics is that the “fundamental nature of many
statistical problems is that they do not have a single mathematical solution”
(Gal & Garfield, 1997, p6). Statistics problems can have multiple answers
and often have no right or wrong answers (Gal & Garfield, 1997). The
researchers state that students are then expected to use mathematical and
statistical tools to give “judgments, inferences and opinions” (Gal & Garfield,
1997) about data and that an answer to a statistics problem may involve
students constructing an argument and then defending their position. While I
am attracted to this explanation because of its focus on the literacy
capabilities and communication skills of students I still think that this is only
part of any description of the differences between mathematics and statistics.
Mathematical problems can often have a variety of solutions and
mathematics can also demand that students make judgements and
arguments.
2.3.3 Difference as statistical literacy
Graham (2006) suggests that the present location of statistics within
mathematics teaching has “…created a very technique-based topic, with little
emphasis on context or problem solving” (Graham, 2006, p221) because
teachers teach students to solve statistical problems like they would solve
mathematical problems. Similarly, Stuart (2005) argues that mathematical
thinking has dominated statistical teaching in the classroom. Stuart (2005)
believes that mathematical thinking “emphasises mathematical models,
methods and procedures” (p.12) and that the application of these techniques
takes on more importance than dealing with the initial problem or context.
Stuart (2005) gives an example of the limitation of mathematical thinking with
the particular example of probability and distributions. He argues that
traditional mathematical thinking assumes that probability theory is
fundamental to statistics. However, Stuart (2005) believes that variation is the
fundamental statistical concept and that probability theory is not essential in

Developing statistical literacy with students and teachers in the secondary mathematics classroom. 21
coming to an understanding of variation and elementary methods of
statistical inference, rather probability serves as an excellent model for
statistical variation. He describes how teachers often start with the
mathematical model – probability – rather than addressing the statistical
concept of variation. Stuart (2005) claims that teachers simplify the
conceptually difficult probability theory to make it more palatable for students,
removing the students even further from understanding the problem in the
original context. Stuart (2005) does not deny the importance of mathematics
and mathematical thinking in statistics but rather claims that it is not essential
in coming to an understanding of elementary methods of statistical inference.
In a similar vein, Schield (2005a) characterises the differences between
mathematics and statistics in terms of methods of reasoning. Schield
characterises mathematics, probability and statistics as examples of
deductive thinking where an argument is either true or false. He then argues
that statistical literacy is an example of inductive (and some deductive)
thinking. An explanation of inductive reasoning is reasoning that judges an
argument on a continuum and that the stronger the argument the greater the
chance that its conclusions are accepted as true. Schield (2005a) states that
for students to be statistically literate students have to ask whether a claim
could be true rather than if it is true. Schield has complicated the issue
somewhat by differentiating between statistics [as mathematical models and
processes] and statistical literacy [as statistical thinking and reasoning].
Statistical literacy will be discussed in much greater detail in section 2.5.
2.3.4 Difference as teaching methods
The conflicts between mathematics and statistics education may exist not
because of differences in content but because of pedagogical differences.
Mvududu (2005) argues that while the word ‘constructivism’ may not have
been stated explicitly in many of the developments in statistics education,
researchers have advocated many of the elements of constructivist teaching,
like active learning, scaffolding learning, sharing power with students, and
helping them solve problems in context. In my opinion this view of learning,
while widely held by mathematics teachers, is still at odds with what actually

Developing statistical literacy with students and teachers in the secondary mathematics classroom. 22
goes on in the classrooms. Watson (2006) claims that “if mathematics was
taught as it should be – for reasoning rather than mastery of algorithms -
there would be little need for a distinction” (Watson, 2006, p.11) between
statistics and mathematics.
2.3.5 Difference as language
Gal (2000) focuses on the difference between mathematics and statistics in
terms of language stating that an understanding of the terminology of
statistics is critical because so many everyday phrases adopt technical
meanings in statistics. Gal and Garfield (1997) go further stating that
communication is crucial because “most students will be ‘consumers’ of
statistics rather than ‘producers” (p.4). The importance of language in the
study of statistics is central to this thesis. While I agree with many of the
characterisations of statistics education and the descriptions of the
differences between mathematics and statistics, it is the significance of
language that resonates most with my own experiences as a teacher. The
importance of language will be discussed in greater detail in section 2.7 on
literacy and language in the mathematics classroom. The following section
briefly outlines the development of statistics education in the New Zealand
context.
2.4 Mathematics and statistics education in New Zealand The Effective Pedagogy in Mathematics/Pāngarau Best Evidence Synthesis
Iteration [BES] (Anthony & Walshaw, 2007) states that “the current academic
view in New Zealand is that the mathematics taught and learned in schools
should provide a foundation for working, thinking and acting like
mathematicians and statisticians” (Anthony & Walshaw, 2007, p7). The
inclusion of acting like a statistician in their definition of what constitutes the
teaching and learning of mathematics is significant. As outlined earlier in
section 2.2.2, the development of the teaching and learning of statistics in
New Zealand schools appears to have followed a similar path to other
countries. Again, New Zealand’s place in the development of statistics
education in schools is one of early adoption with Begg (2005) and Begg et

Developing statistical literacy with students and teachers in the secondary mathematics classroom. 23
al. (2004) both giving descriptions of the development of statistics education
going back to very early beginnings in primary schools fifty years ago,
through to the early 1970’s and up to the curriculum reform in 1992.
2.4.1 The current mathematics curriculum and its review
The 1992 mathematics curriculum clearly outlines the requirements for the
study of statistics in schools. The statistics strand in Mathematics in the New
Zealand Curriculum (Ministry of Education, 1992) is divided into three groups
of achievement objectives where students are expected to; develop the skills
of collecting, organising, and analysing data under the theme statistical
investigations, as well as interpret data under the theme interpreting
statistical reports and finally deal with probability under the theme of
exploring probability (Ministry of Education, 1992).
New Zealand is currently undertaking a review of all of the curriculum
documents implemented in the 1990’s. The most obvious change in The
New Zealand Curriculum (Ministry of Education, 2007b) is the name change
for the learning area from Mathematics to Mathematics and Statistics4.
However, the accompanying Mathematics and Statistics Achievement
Objectives (Ministry of Education, 2007c) remain remarkably unchanged.
The Statistics strand with three renamed achievement objectives for
statistics. However, I believe that these small changes in titles give much
better descriptions to the three sets of achievement objectives with the use of
statistical investigation [thinking]5, statistical literacy and probability. The links
and progression from the Mathematics in the New Zealand Curriculum
(Ministry of Education, 1992) to The New Zealand Curriculum (Ministry of
Education, 2007c) are shown in figure 1.
4 In light of the international debate about whether statistics should be placed in the mathematics curriculum or
taught as a separate subject entirely it is interesting to see that the New Zealand Curriculum Draft for Consultation
2006 (Ministry of Education, 2006a) recommends that they remain combined as a discipline but that mathematics
be renamed to mathematics and statistics to differentiate between mathematical and statistical thinking 5 It is of interest to see the dropping of the bracketed word [thinking] after statistical investigation from the draft
document to the new curriculum in the achievement objective statistical investigation.
Developing statistical literacy with students and teachers in the secondary mathematics classroom. 24
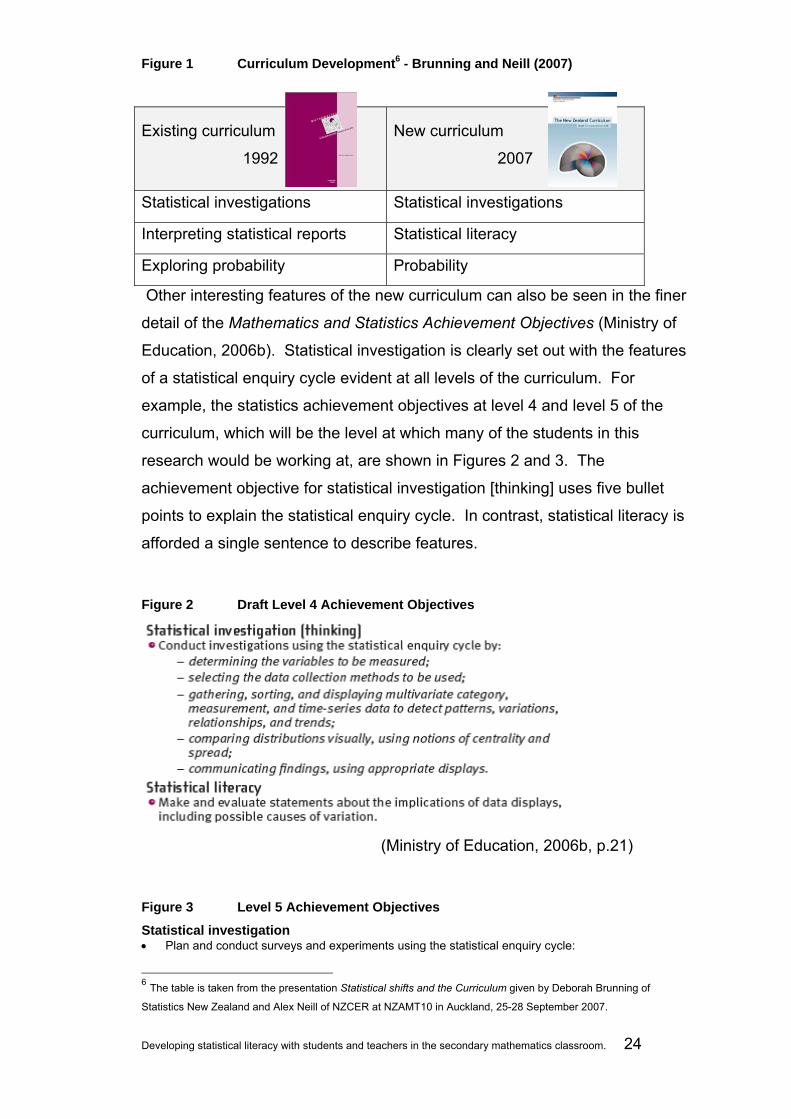
Figure 1 Curriculum Development6 - Brunning and Neill (2007)
Existing curriculum
1992
New curriculum
2007
Statistical investigations Statistical investigations
Interpreting statistical reports Statistical literacy
Exploring probability Probability
Other interesting features of the new curriculum can also be seen in the finer
detail of the Mathematics and Statistics Achievement Objectives (Ministry of
Education, 2006b). Statistical investigation is clearly set out with the features
of a statistical enquiry cycle evident at all levels of the curriculum. For
example, the statistics achievement objectives at level 4 and level 5 of the
curriculum, which will be the level at which many of the students in this
research would be working at, are shown in Figures 2 and 3. The
achievement objective for statistical investigation [thinking] uses five bullet
points to explain the statistical enquiry cycle. In contrast, statistical literacy is
afforded a single sentence to describe features.
Figure 2 Draft Level 4 Achievement Objectives
(Ministry of Education, 2006b, p.21)
Figure 3 Level 5 Achievement Objectives
Statistical investigation • Plan and conduct surveys and experiments using the statistical enquiry cycle:
6 The table is taken from the presentation Statistical shifts and the Curriculum given by Deborah Brunning of
Statistics New Zealand and Alex Neill of NZCER at NZAMT10 in Auckland, 25-28 September 2007.

Developing statistical literacy with students and teachers in the secondary mathematics classroom. 25
• determining appropriate variables and measures • considering sources of variation • gathering and cleaning data • using multiple displays, and re-categorising data to find patterns, variations, relationships, and
trends in multivariate data sets • comparing sample distributions visually, using measures of centre, spread, and proportion • presenting a report of findings. Statistical literacy • Evaluate statistical investigations or probability activities undertaken by others, including data
collection methods, choice of measures, and validity of findings.
(Ministry of Education, 2007c, p.22)
While the sections reproduced above are rather arbitrary and anecdotal, I
believe they illustrate how the curriculum document is much more
comfortable expressing the concept of statistical investigation than the
concept of statistical literacy. Obviously the document is not a battle of text
length. However, there is much more detail presented in the draft document
for statistical investigation [thinking] than for statistical literacy. It will be
interesting to see how teachers use these designations and definitions as
they develop teaching and learning programmes for their students.
The draft curriculum (Ministry of Education, 2006a) and the accompanying
draft achievement objectives (Ministry of Education, 2006b), and now the
new curriculum (Ministry of Education, 2007c), are obviously important steps
in the evolution of mathematics and statistics education in New Zealand.
2.4.2 1992 curriculum reform in New Zealand
Despite the setting of clear goals and objectives for statistics education in the
Mathematics in the New Zealand Curriculum (Ministry of Education, 1992)
the implementation of the statistics curriculum in New Zealand schools doe
not appear unproblematic. Begg et al. (2004) describe how approaches and
initiatives in New Zealand secondary schools were not fully implemented or
failed to be adopted often due to teachers being trained in mathematics
rather than statistics. Begg et al. echo similar observations made by
overseas researchers (Garfield & Gal, 1999; Watson, 2006) who assert that
probability and calculating statistics were often taught as a part of pure
mathematics or arithmetic course of study and that the teaching of statistical
investigations and statistical literacy were often skipped over or ignored.

Developing statistical literacy with students and teachers in the secondary mathematics classroom. 26
With reference to senior secondary school reforms in New Zealand, Begg et
al. (2004) how the introduction of a greater amount of teaching and learning
of statistics was a challenge for many teachers. They refer specifically to the
introduction of internally assessed project work in the Year 13 Mathematics
with Statistics course and state that “…some teachers were not sympathetic
to this and undermined the curriculum intention” (Begg et al., 2004, p.3).
Watson (2006) believes that because statistics 7 is a relatively recent addition
to the school curriculum schools and teachers believe that statistics cannot
be as important as other, more traditional areas of the curriculum. As has
been my experience in New Zealand schools, Watson states that it “is not at
all unusual to find the units on data and chance to be placed in the timetable
at the end of the academic year, to fill in time with activity when students and
teachers are winding down, or to be deleted as unnecessary if more time is
needed for other topics such as algebra or trigonometry” (Watson, 2006, p.8).
2.4.3 Evidence of current statistics education practice Despite all of the difficulties, the teaching of statistics has become a core
component of mathematics education in New Zealand. We have a recent
indication of the attitudes of New Zealand teachers towards statistics in the
curriculum from the responses to the draft curriculum such as The New
Zealand Curriculum Draft for Consultation 2006 Analysis of Long
Submissions (Watson et al, 2006). While there were some responses from
teachers and educational groups that still questioned the need for an
emphasis on statistics or queried the difference between statistical thinking
and mathematical thinking, the majority of respondents valued the place and
emphasis of statistics in the curriculum.
7 I have used the term statistics where Watson (2006) uses the terms data and chance. As an Australian
researcher/educator, Watson could be using the terms data and chance as is used to describe strands in Australian
mathematics curriculum documents. The equivalent strand in MiNZC is statistics. However, the statistics strand in
MiNZC is then broken down into interpreting statistical reports, statistical investigations and exploring probability.
However, Watson may also be using the terms data and chance because the terms offer more to readers than the
term statistics which can have multiple meanings such as the wider study of statistics or as summary statistics such
as the mean or median.
Developing statistical literacy with students and teachers in the secondary mathematics classroom. 27
We also have some indication of the success of schools and teachers in
teaching the mathematics and statistics curriculum. In Learning for
Tomorrow’s World: Programme for International Student Assessment (PISA)
2003 (Ministry of Education, 2005) we have an analysis of a large sample of
New Zealand 15 year olds performance in the second cycle of PISA testing
which had a special focus on mathematical literacy. PISA results compare
results within and between 41 countries, the majority of who are in the
Organisation for Economic Cooperation and Development [OECD]. The New
Zealand student mean score in mathematics placed New Zealand within the
group of second highest performing countries for each subject area, along
with countries such as Australia, Canada and Japan.
In the 2003 PISA8 study mathematical literacy is described using four scales
– quantity, uncertainty, shape and space and change and relationships. New
Zealand students showed stronger performance on the uncertainty scale
than on the other three scales, whereas they showed the weakest
performance on the quantity scale. The researchers state that the “relative
performance of countries in the four mathematics content areas provides an
insight into potential strengths and weaknesses of each country’s intended
curricula and the effectiveness with which these curricula are delivered”
(Ministry of Education, 2005, p4).
Significantly, the PISA researchers also found that New Zealand had one of
the widest distributions of achievement in mathematics or within-country
variations for student performance in mathematics (Ministry of Education,
2005). The PISA researchers go on to assert “that educational programmes,
schools and teachers may not be appropriately addressing the wide range of
student knowledge and skills that exists within the New Zealand education
system” (Ministry of Education, 2005, p4).
Although this is not a comment on the efficacy of statistics teaching but of
wider mathematics teaching in New Zealand, it does give an indication of the
8 PISA assesses the mathematical literacy of students using a test consisting of questions derived from four scales
– quantity [Number], uncertainty [Statistics and Probability], shape and space [Geometry] and change and
relationships [Algebra]. Interestingly the study gives an example on page 7 from the uncertainty scale that would be
an excellent example of a statistical literacy task.

Developing statistical literacy with students and teachers in the secondary mathematics classroom. 28
link between curriculum goals and what is actually going on in classrooms.
There is evidence that there is a real strength in the curriculum policy and
development of statistics education in New Zealand. This can be shown in
international comparisons of student performance such as PISA. However,
one interpretation of the PISA results is that, the strengths in curriculum
policy and development are not necessarily matched in the pedagogical
practices of all teachers.
2.4.4 Unpacking statistics As mentioned in section 2.4.2 the statistics and statistics education discourse
is a relatively recent one. There appears to be enough evidence that thinking
and doing statistics is sufficiently different from thinking and doing
mathematics for statistics to be treated differently in the classroom. It is clear
that teachers need to unpack what is meant by statistics education and
understand the implications of statistical thinking, probability and statistical
literacy for teaching and learning in their classrooms.
2.5 Statistical literacy
Because the focus of this thesis is about developing statistical literacy in the
secondary mathematics classroom it is important to determine what statistical
literacy is defined as.
2.5.1 Definitions
’Statistical literacy’ is the ability to understand and
critically evaluate statistical results that permeate our
daily lives – coupled with the ability to appreciate the
contributions that statistical thinking can make in public
and private, professional and personal decisions.
(Wallman, 1993, p.1)
We see in Wallman’s (1993) definition both a personal and a societal need
for our students to develop statistical literacy skills. Similarly Gal (2002)
defines statistical literacy as a basic principle for participation in society and
Developing statistical literacy with students and teachers in the secondary mathematics classroom. 29
the “key ability expected of citizens in information-laden societies” (Gal, 2002,
p.1) where decision-making is based on critical skills from statistical literacy
Likewise, Watson (2006) sees statistical literacy as the “meeting point of the
chance and data curriculum and the everyday world, where encounters
involve unrehearsed contexts and spontaneous decision-making based on
the ability to apply statistical tools, general contextual knowledge, and critical
literacy skills” (Watson, 2006, p.11)
Chick, Pfannkuch and Watson (2005) describe statistical literacy as
‘transnumerative thinking’ where students will be able to make sense of and
use different representations of data to make sense of the world around
them. Gal and Garfield (1997) see statistical literacy as the need for students
to be able interpret results from studies and reports and to be able to “pose
critical and reflective questions” about those reports because “most students
are more likely to be consumers of data than researchers” (p.4) of statistics.
In New Zealand, Begg et al. (2004) have called for a greater emphasis to be
placed on statistical literacy in the curriculum so that students can become
active and critical citizens. As stated previously, the use of the term statistical
literacy is much more explicit in the 2007 curriculum with the addition of
statistical literacy achievement objectives (Ministry of Education, 2006b).
The 2007 curriculum also goes to great lengths to delineate between
mathematical thinking and statistical thinking.
Overseas researchers describe the promotion of statistical literacy in their
countries. For example, Barbieri and Giacché (2006) in Italy and Araujo
(2006) in Latin America describe the same tensions between mathematics
curricula and the goals of statistical literacy that have characterised
developments in other countries. Barbieri and Giacché state that Italian
citizens are unfamiliar with the language and the concepts of statistics and
that “they are not able to understand precisely the meaning of the figures
measuring economic and social phenomena, even if the decisions of people,
business and administrations are growingly based on statistics “ (Barbieri &
Giacché, 2005, p.2)
Developing statistical literacy with students and teachers in the secondary mathematics classroom. 30
All of the previous researchers share common themes for statistical literacy
such as interpreting data in context and developing statistical citizenship in a
data-rich world. However, there appears to be some conflict with
researchers and educators about the definitions of, and distinctions between,
statistical literacy, statistical reasoning, and statistical thinking in the
discipline of statistics. Many researchers appear to use the phrases
statistical thinking, statistical reasoning and statistical literacy
interchangeably.
2.5.2 Statistical literacy, statistical reasoning and statistical thinking
For some researchers (Ben-Zvi & Garfield, 2004; Rumsey, 2002) statistical
literacy involves understanding and using the basic language and tools of
statistics. In these terms statistical literacy is a procedural literacy or what
Rumsey calls statistical competency. This definition may be used to
distinguish the understanding of statistical concepts from the numerical
manipulation and graphing of data. However, with the increased use of
technology there is much less need for “number crunching” (Garfield, 2002)
and such a definition may be limiting. Rumsey does include thinking critically
and making decisions in a much broader definition of statistical literacy.
However, for the purpose of exploring and understanding the links between
statistical literacy, reasoning and thinking Rumsey’s simpler statistical
competency will be used as an initial definition for statistical literacy.
In comparison, statistical reasoning may be defined as the way people
reason with statistical ideas to make sense of statistical information (Garfield
& Gal, 1999). Ben-Zvi and Garfield (2004) describe statistical reasoning as
interpretation of data and its different representations. Garfield (2002)
describes a five level hierarchy for statistical reasoning that ranges from
idiosyncratic reasoning, where students have little or no understanding of
words, symbols and concepts, through to integrated process reasoning
where students have a complete understanding of a statistical process.
Understanding and using statistical language is seen as significant.

Developing statistical literacy with students and teachers in the secondary mathematics classroom. 31
Interestingly, Garfield suggests that critiquing media reports may be one way
to assess statistical reasoning.
Both Ben-Zvi and Garfield (2004) and Chance (2002) describe statistical
thinking as an understanding of why and how statistical investigations are
conducted. This includes recognising how, when, and why inferences can be
made, and using the context to plan and evaluate and to draw conclusions.
Context is core to Chance’s definition of statistical thinking.
DelMas (2002) discusses the competing goals of statistical literacy,
reasoning and thinking in statistics instruction. He succinctly encapsulates
the conflict by presenting two models. In the first model of instruction, each
domain [statistical literacy, statistical reasoning, and statistical thinking] is
independent of the other two, but with some overlap. In the second model
statistical literacy is the all-encompassing goal of instruction and statistical
reasoning and thinking no longer have independent content. The two models
are represented as Venn Diagrams in Figure 4.
DelMas (2002) characterises statistical literacy in the first model as the
“development of basic skills and knowledge” (Section 4, ¶ 3) that are needed
to develop statistical reasoning and thinking. In the second model there are
no parts of the domains separate from statistical literacy. In this model
statistical reasoning and statistical thinking become “sub-goals within the
development of the statistically competent citizen” (delMas, 2002, Section 4,
¶ 4).

Developing statistical literacy with students and teachers in the secondary mathematics classroom. 32
Figure 4 delMas’ perspectives on statistical literacy
Independent domains with some overlap Reasoning and thinking within literacy
(delMas, 2002)
In both of delMas’ (2002) models statistical literacy can be seen as the
foundation [A stretch perhaps in the first diagram with overlapping domains,
though literacy is at the bottom]. In the ‘reasoning and thinking within literacy’
diagram statistical literacy is also presented as the goal of instruction.
However, delMas then proceeds to question his own models when he points
out that in advanced courses in statistics, “it is not difficult to imagine
statistical thinking as the overall goal that encompasses and is supported by
a foundation in statistical literacy and reasoning” (delMas, 2002, Section 4, 
5).
The interrelatedness of statistical literacy, statistical reasoning, and statistical
thinking does potentially make it difficult for teachers to design lessons or
assessments that would meet all the competing goals. DelMas (2002)
makes a final attempt to describe the features of statistical literacy, statistical
reasoning, and statistical thinking by focusing not on the context or content of
problems but what teachers ask students to do with the context or content.
DelMas outlines in Figure 5 assessment questions that are asked in tasks for
statistical literacy, reasoning and thinking that would involve students being in
“one domain more so than in another” (delMas, 2002, Section 5, ¶ 2).

Developing statistical literacy with students and teachers in the secondary mathematics classroom. 33
Figure 5 delMas' three instructional domains
BASIC LITERACY REASONING THINKING
Identify
Describe
Rephrase
Translate
Interpret
Read
Why?
How?
Explain
(The Process)
Apply
Critique
Evaluate
Generalize
(delMas, 2002)
Again it appears here that delMas (2002) is attempting to limit statistical
literacy to a procedural literacy. Statistical reasoning appears to be the
‘doing’ of statistics and statistical thinking the ‘questioning’. While this may
be attractive as a description we must contrast the attempts by delMas and
Rumsey (2002) to characterise statistical literacy as statistical, graphical or
technical competency with researchers and educators (Gal, 2002, Schield,
2005a; Watson, 2006) who characterise statistical literacy as a much wider
analytical and critical literacy. In this definition statistical literacy focuses on
understanding what is being presented, asking good questions and then
evaluating arguments, As Schield asserts; “statistical literacy is more about
questions than answers” (Schield, 2005a, p.6)
2.5.3 My stance on statistical literacy
It is clear that there is some debate about the nature of statistical literacy and
that there are overlaps in definitions. However, I see part of the conflict as
another illustration of the wider tension in education between traditional
behaviourist or developmental perspectives [with phrases like basic skills and
knowledge] and constructivist or emergent perspectives where students are
asked to become critical and analytical.
For this thesis, I have chosen to use a definition of statistical literacy in the
spirit of Schield (2005a) that is about asking good questions. It is the much
wider definitions of statistical literacy, such as the critical literacy described
by Gal (2002) and Schield or delMas’ (2002) model of statistical reasoning

Developing statistical literacy with students and teachers in the secondary mathematics classroom. 34
and thinking as part of a wider statistical literacy, rather than Rumsey’s
(2002) statistical competency. I have also chosen to use the term statistical
literacy instead of statistical reasoning or statistical thinking because much of
the literature focused on the areas of statistical thinking and reasoning is
about students doing statistics or completing investigations rather than
responding to the statistics of others. This positioning may create a certain
amount of difficulty when talking to other teachers and when designing
lessons and unit plans and schemes of work.
There are further challenges in using the term statistical literacy. Statistical
literacy situates the discussion in literacy. For many secondary mathematics
teachers this relates to the work undertaken in New Zealand secondary
schools to raise literacy levels and all the teacher experiences and attitudes
associated with such interventions. For some [mathematics] teachers the
term statistical literacy also alludes to a statistical literacy as one of the many
multiliteracies needed by students. For others statistical literacy leads to
conceptions of a critical literacy where students bring critical thinking skills to
analyse and evaluate the work of others. We can see here that there are
difficulties in using relatively new terms like statistical literacy without
unpacking or declaring meanings.
2.6 Statistical literacy frameworks
Despite the challenges of the terminology it is generally accepted that
statistical literacy is an important notion in statistics education. In the
following section I will attempt to describe features of statistical literacy as
presented by researchers. I will describe two frameworks or models that
attempt to represent the features of statistical literacy and one framework that
attempts to describe statistical thinking. The first framework is from Gal’s
(2002) research into the understanding of statistics by adults. The second
model is the Statistical Literacy construct from Watson and Callingham
(2005). Finally I will look at the work of Wild and Pfannkuch (1999) who have
developed their framework for statistical thinking in empirical enquiry.
Developing statistical literacy with students and teachers in the secondary mathematics classroom. 35
2.6.1 The components of statistical literacy
Gal (2002) suggests there are two components to statistical literacy in his
research of adults’ statistical practices. The components of statistical literacy
are:
a) the ability to interpret and evaluate critically statistical information
in a variety of contexts and when relevant.
b) the ability to discuss or communicate this understanding in a
fashion that can have an impact on decision-making.
(Gal, 2002, p.2-3)
According to Gal (2002) there are five interrelated knowledge bases that
must be used to exhibit these components of statistical literacy
a) mathematical knowledge
b) statistical knowledge
c) knowledge of the context
d) literacy skills
e) and critical questions
(Gal, 2002, p.4)
Gal (2002) also notes the need for dispositions or associated attitudes and
beliefs that would motivate citizens to be critical thinkers with statistics. Also
significant is that Gal separates literacy and being critical in his model. Both
of these issues will be discussed in greater detail later in this section and in
sections 2.7 and 2.8.
2.6.2 A statistical literacy construct
The Statistical Literacy construct from Watson and Callingham (2005) builds
on previous work by Watson (1997) where she uses the SOLO taxonomy of
Biggs and Collis (1982) from developmental psychology to categorise
statistical thinking into a three tier hierarchy. Here again we have statistical
thinking as inseparable from statistical literacy. In the first tier of Watson’s
model students develop an understanding of the basic statistical and
probability terms. In the second tier students are developing an
Developing statistical literacy with students and teachers in the secondary mathematics classroom. 36
understanding of statistical terms and concepts in context. At the most
sophisticated level students are developing a questioning attitude and using
critical thinking.
Subsequently, Watson and Callingham (2005) have developed this three
tiered view into their Statistical Literacy construct. Watson and Callingham’s
model is a six level hierarchy that represents increasingly sophisticated
thinking starting from idiosyncratic through to critical mathematical. At the
Idiosyncratic (Level 1) and Informal (Level 2) levels students are only merely
interacting with the language and meanings of statistical terms. For the
Inconsistent (Level 3) and Consistent Non-critical (Level 4) levels of the
construct students are beginning to engage with the context and uncover the
statistics embedded in the context. In the last two levels of the classification,
Critical (Level 5) and Critical Mathematical (Level 6), students are able to be
critical and challenge claims made in statistical reports and data. The levels
of the Watson and Callingham Statistical Literacy construct are shown in
Figure 6.
Interestingly Watson and Callingham (2005) felt that traditional text book
questions could fulfil the requirements of levels 1 and 2 but that the same
types of questions were unlikely to fulfil the need of ‘providing motivating
contexts to challenge students’ critical thinking’ and that teachers would have
to seek out contexts that engaged students in the media.
Developing statistical literacy with students and teachers in the secondary mathematics classroom. 37
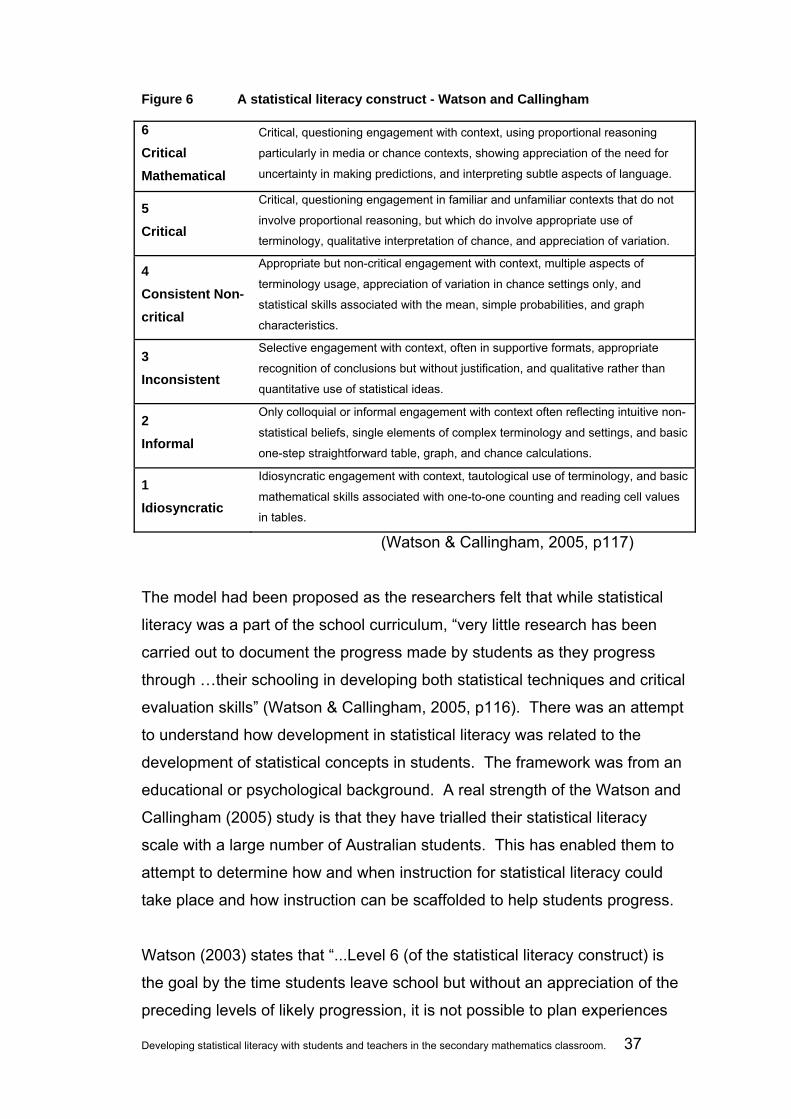
Figure 6 A statistical literacy construct - Watson and Callingham
(Watson & Callingham, 2005, p117)
The model had been proposed as the researchers felt that while statistical
literacy was a part of the school curriculum, “very little research has been
carried out to document the progress made by students as they progress
through …their schooling in developing both statistical techniques and critical
evaluation skills” (Watson & Callingham, 2005, p116). There was an attempt
to understand how development in statistical literacy was related to the
development of statistical concepts in students. The framework was from an
educational or psychological background. A real strength of the Watson and
Callingham (2005) study is that they have trialled their statistical literacy
scale with a large number of Australian students. This has enabled them to
attempt to determine how and when instruction for statistical literacy could
take place and how instruction can be scaffolded to help students progress.
Watson (2003) states that “...Level 6 (of the statistical literacy construct) is
the goal by the time students leave school but without an appreciation of the
preceding levels of likely progression, it is not possible to plan experiences
6 Critical Mathematical
Critical, questioning engagement with context, using proportional reasoning
particularly in media or chance contexts, showing appreciation of the need for
uncertainty in making predictions, and interpreting subtle aspects of language.
5 Critical
Critical, questioning engagement in familiar and unfamiliar contexts that do not
involve proportional reasoning, but which do involve appropriate use of
terminology, qualitative interpretation of chance, and appreciation of variation.
4 Consistent Non-critical
Appropriate but non-critical engagement with context, multiple aspects of
terminology usage, appreciation of variation in chance settings only, and
statistical skills associated with the mean, simple probabilities, and graph
characteristics.
3 Inconsistent
Selective engagement with context, often in supportive formats, appropriate
recognition of conclusions but without justification, and qualitative rather than
quantitative use of statistical ideas.
2 Informal
Only colloquial or informal engagement with context often reflecting intuitive non-
statistical beliefs, single elements of complex terminology and settings, and basic
one-step straightforward table, graph, and chance calculations.
1 Idiosyncratic
Idiosyncratic engagement with context, tautological use of terminology, and basic
mathematical skills associated with one-to-one counting and reading cell values
in tables.
Developing statistical literacy with students and teachers in the secondary mathematics classroom. 38
that will assist students to the higher levels of understanding” (p. 3). Watson
does not attempt to align year levels with the levels of development
observed, however she does observe that “by the end of compulsory
schooling9, many students are not performing at the highest levels described
above” (p. 3). This has major implications for this research study. The
students involved are all in Years 9 and 10. If Watson is correct it may too
difficult a task to achieve any level of statistical literacy with these students.
There are some obvious differences between Gal’s (2002) approach and that
taken by Watson and Callingham (2005). Gal presents a full definition of
statistical literacy along with the necessary components that are needed.
However, Watson and Callingham differentiate between hierarchical levels of
statistical literacy. As mentioned earlier, the different approaches can be
understood by the contexts of their studies into adults and students
respectively. Regardless, the essence of both Gal’s and Watson and
Callingham’s descriptions are very similar. Both emphasise a need for
statistical knowledge and skills, the ability to communicate ideas, the
centrality of context, and the need to be critical.
2.6.3 A framework for statistical thinking in empirical enquiry
Alternatively, Wild and Pfannkuch (1999) have developed a framework for
statistical thinking called the framework for statistical thinking in empirical
enquiry. They have identified four dimensions: an investigative cycle, types of
thinking, an interrogative cycle, and dispositions [see Figure 7].
9 For Watson in Australia this is Grade 10 equivalent to Year 11 in New Zealand.

Developing statistical literacy with students and teachers in the secondary mathematics classroom. 39
Figure 7 Statistical thinking in empirical enquiry – Wild and Pfannkuch
(Wild & Pfannkuch, 1999, p.226)
The investigative cycle or PPDAC cycle (problem, plan, data, analysis and
conclusion) describes the process of statistical investigation. Wild and
Pfannkuch’s second dimension states that there are five fundamental types
of statistical thinking: recognition of the need for data, transnumeration (or
using different representations of data to give better understanding),
understanding variation, using statistical models and integrating the statistical
with the contextual (Wild & Pfannkuch, 1999). The interrogative cycles
(generate, seek, interpret, criticise, and judge) describes the thinking process
Developing statistical literacy with students and teachers in the secondary mathematics classroom. 40
that statisticians use when dealing with the problem and the data. Finally,
Wild and Pfannkuch describe the dispositions that statisticians require for
statistical problem solving. Wild and Pfannkuch’s dimensions are non-
hierarchical. However, the investigative cycle and the interrogative cycle are
sequential.
We get a good description of what is needed by students to become
statistical literate in the dispositions. Wild and Pfannkuch’s (1999)
dispositions are scepticism, imagination, curiosity, awareness, openness,
propensity to seek deeper meaning, being logical, being engaged and
persevering. In scepticism Wild and Pfannkuch see the need to ‘adopt a
critical eye’. Some of the statisticians that Wild and Pfannkuch researched
believed that the dispositions could not be taught but Wild and Pfannkuch are
more positive about this. They describe how the investigative cycle and the
interrogative cycle for example can be used as thinking tools to prompt
students to address certain issues. Both Gal (2002), with his attitudes and
beliefs, and Watson and Callingham (2005) describe a need for similar
dispositions in their models.
While the Watson and Callingham (2005) framework comes out of the work
of statistics educators working in classrooms with students, the Wild and
Pfannkuch (1999) framework comes from the researchers researching from
the statistician’s viewpoint and looking at what statisticians believe they do.
Wild and Pfannkuch do not attempt to describe the progression or
development in statistical literacy or the development of statistical concepts
in students but rather outline what statisticians actually do. The focus is on
describing a much wider framework for statistical thinking. I can see some
difficulties for teachers in using the framework to help students learn as while
desirable outcomes are outlined no pathway or progression is described to
follow. This was clearly not the intention of the researchers. Wild and
Pfannkuch do not see statistical thinking or statistical literacy as separate
entities but rather that there is “holistic thinking informed by statistical
elements” (Wild & Pfannkuch, 1999, p.244).
Developing statistical literacy with students and teachers in the secondary mathematics classroom. 41
These three frameworks are by no means the only frameworks available for
describing statistical thinking or statistical literacy. Reading (2002) suggests
a ‘profile for statistical understanding’ based on the SOLO taxonomy across
five areas of statistics: data collection; data tabulation and representation;
data reduction; probability; and interpretation and inference. The Reading
(2002) framework is again from an educator’s perspective as is informed by
studying what students were doing in Australian classrooms. The framework
does not specifically mention statistical literacy and as it is similar to the
hierarchical framework of Watson and Callingham (2005) that I have not
expanded on it here.
2.6.3 Being critical
In both the Watson and Callingham (2005) and Gal (2002) descriptions of
statistical literacy and Wild and Pfannkuch’s (1999) framework for statistical
thinking there are clear references to ‘being critical’. Being critical also
appears in the statistics literacy achievement objectives of the New Zealand
curriculum. In the draft Mathematics and Statistics Achievement Objectives
(Ministry of Education, 2006b) students at Level 610 are asked to ‘critically
evaluate statistically based information’ as part of the statistical literacy
objectives. While the word ‘critically’ is no longer present in the final version
of the Mathematics and Statistics Achievement Objectives (Ministry of
Education, 2007c), critical thinking and critical literacies are present across
the statements for key competencies, values and descriptions of learning
areas in the new curriculum..
Gal (2005) has further explored critical literacy, where statistical literacy [or
probability literacy or computer literacy] is more than acquiring basic skills.
Gal broadens the definition to where statistical literacy is a much wider
concept of critical analysis and is linked closely to metacognition. Similarly,
Watson (2006) makes direct links from statistical literacy to literacy by
10 Interestingly, in the draft Mathematics and Statistics Achievement Objectives (Ministry of Education, 2006b) for
statistical literacy, students at Level 5 are asked to only ‘evaluate the statistical processes of others’. It is not until
Level 6 and beyond that students are asked to “critically evaluate the statistical processes of others’. Perhaps the
curriculum developers have adopted Watson’s (2003) view that students are not ready to be fully statistically literate
until potentially their last year of mathematics study.
Developing statistical literacy with students and teachers in the secondary mathematics classroom. 42
discussing the multiliteracies pedagogy of Kalantzis and Cope (1999).
Statistical literacy is then an opportunity to call on all the research and good
practice available in the field literacy, rather than literacy being a problem that
stops students doing statistics.
As a teacher of ESOL students or students who have English as another
language [EAL] I have been exposed to some of the research around
language learning and language acquisition. While there is ample research
concerned with notions of critical literacy (Kalantzis & Cope, 1999; Knobel &
Healy, 1998; Pennycook, 2001; Wright & Lather, 2006) research linking
literacy, language and statistics is harder to find. Some researchers such as
Thornton and Hogan (2001) have attempted to describe mathematics and
mathematics teaching as a critical mathematics literacy that works to
empower students to become critical citizens in modern society. I believe
that much of the language and linguistics research sits comfortably with the
definitions of statistical literacy given by statistics educators. In the next
section I will to investigate literacy and language in the classroom before
returning to this notion of critical literacy.
2.7 Literacy and language in the mathematics classroom
“Language plays a central role.”
(Anthony & Walshaw, 2007)
The centrality of language in the teaching and learning of mathematics and
statistics is clearly stated in research and policy. The importance of
language has long been signalled in New Zealand curriculum documents.
The interpretation and communication of mathematical ideas is present
throughout the Mathematical Processes strand of the MiNZC (Ministry of
Education, 1992). I would suggest that while the curriculum explicitly links
statistical and literacy skills the situation at school level is very different.
Many teachers, who are good at manipulating symbols in traditional
mathematics, struggle with the teaching of the reading, interpreting and
writing skills demanded by the curriculum. It is still common to hear
secondary mathematics teachers bemoan assessment questions and

Developing statistical literacy with students and teachers in the secondary mathematics classroom. 43
problems that are presented in context as unfair on students. Similarly, many
teachers share a belief that the lack of literacy skills in their students is
holding many a good mathematician back.
The importance of literacy in statistical literacy is clearly stated in research.
One of the five inter-related knowledge bases in Gal’s (2002) model of
statistical literacy is literacy. Gal states that unless a student has good
comprehension skills there is no chance of students understanding statistical
reports, graphical representations or data. Further, students can have
relatively high levels of numerical or statistical skill, but then be held back by
written work that is unexpectedly poor.
2.7.1 Language demands in the mathematics classroom
Teachers and researchers have long identified these concerns with the wider
literacy levels of students. Responses to the draft curriculum questioned
whether average students have the mature language skills and training to be
able to express the ideas of the mathematics curriculum (Watson et al.,
2006). Others queried a possible mismatch between the level of logic and
communication needed in statistics and the corresponding levels of students’
English. Meaney and Flett (2006) suggest that New Zealand students
entering high school are “likely to have difficulty extracting relevant
information from material …” (p.10).
Many researchers (Huferd-Ackles, Fuson & Sherin, 2004; Kalantzis & Cope,
1999; Moschkovich, 2002; Nation, 1989) in the language learning and
language acquisition fields express the view that the learning of English and
content should be simultaneous. Some researchers (Doerr & Tinto, 2000;
Turner, Dominguez, Maldonado & Empson, 2005) go further to say that a
language focus in a content classroom is beneficial for all learners.
Turner et al. (2005) describe an after-school mathematics programme with
bilingual students in the United States where students can ‘incrementally gain
access’ to mathematical discourse practices when given repeated
opportunities to participate fully in the mathematics classroom. They state

Developing statistical literacy with students and teachers in the secondary mathematics classroom. 44
that teachers should provide access to multiple resources and
representations and give students models of using mathematical language
and thinking. Again with reference to mathematics classrooms in the United
States, Khisty and Chval (2002) believe that students can gain control of the
mathematical discourse even when there is a mismatch between the
language proficiency of the student, class and teacher. Khisty and Chval
restate the need for students to have repeated opportunities to participate in
mathematical discussion and argue that teachers are critical in providing the
right climate.
While some acknowledge using academic mathematical language is a
difficulty for all students -“helping students to articulate mathematical thinking
can be a challenge even in monolingual classrooms” (Turner et al., 2005,
p.8) - the focus of all the research highlighted is about English language
learners in mainstream classrooms. In the research it is noted that learners
have the challenge of not only learning mathematical language but academic
language, conversational language and the mathematics as well. Despite
these challenges many of the researchers, like Moschkovich (2002), believe
that linguistic diversity is a resource in the mathematics classroom.
Central to all of these researchers is their belief that understanding the
language is vital to making sense of the mathematical tasks and that
language learning and mathematical learning are part of the same process.
In all of this research it is stated that the teacher is the key to the success of
learning in the classroom.
In the New Zealand context there are a number of teachers and researchers
investigating the place of language in the mathematics classroom (Latu,
2005; Meaney & Flett, 2006; Woodward & Irwin, 2005). While some of the
research has focused on language in mathematics in general, the majority of
the research focuses on particular groups such as English language learners.
Some of this research has also been disseminated to the wider teaching
profession through initiatives and professional development like the Learning
through Language programme in the 1990’s and the work of ESOL online.

Developing statistical literacy with students and teachers in the secondary mathematics classroom. 45
Irwin and Woodward (2005) analysed the discourse in classrooms involved in
the Numeracy Development Project [NDP]. The researchers were working in
New Zealand primary and intermediate classrooms where the teachers had
adopted the NDP pedagogy of questioning and listening. Irwin and
Woodward describe how teachers who adopt the NDP pedagogy develop
skills in asking questions about student thinking and listening and state that
“students should also adopt some aspects of the same discourse” (Irwin &
Woodward, 2005, p.69). Irwin and Woodward recommend that more
emphasis be placed “on the use of the mathematics register, both terms and
the discourse of premise and consequence, rather than colloquial terms and
conversational conventions” (Irwin & Woodward, 2005, p.73). Irwin and
Woodward see this as potentially being in conflict with the curriculum
statement, Mathematics in the New Zealand Curriculum (Ministry of
Education, 1992) that instructs teachers to use everyday language with their
students before using mathematical language. Irwin and Woodward believe
that the issue is even more important for students that have emerging or
limited proficiency in English. This research was done in the context of
Numeracy Development Project.
Latu (2005) investigates the language issues for Pasifika students in senior
secondary mathematics classrooms. Latu believes that if students are going
to solve language rich mathematics tasks “students need to be strong in both
general and mathematical language” (Latu, 2005, p.489) and that it does not
necessarily matter in what language that strength lays - either English or their
first language. Latu reminds teachers that code-switching is an important
tool for students to gain understanding. Code-switching is when an EAL11
student or teacher switches between their first language and English to find
meaning or express ideas. However, he cautions that if students have not
learnt mathematics in their home or first language students may not have
access to the mathematical discourse in their first language. Latu also notes
that some mathematical vocabulary and concepts may exist or may be
emerging in the student’s first language. Latu does not specifically mention
statistical concepts here. However, he does offer the example of Tongan
11 Latu prefers to use EAL – students for whom English is an Additional Language - rather than ESOL.

Developing statistical literacy with students and teachers in the secondary mathematics classroom. 46
teachers finding it “difficult to distinguish between the meanings of non-
equivalent terms such as ‘very likely’, ‘probable’ and almost certain’ when
expressed through the Tongan language” (Latu, 2005, p.484)
In this section I have attempted to show that there is a need for mathematics
teachers and researchers to address literacy and language in their
classrooms. An understanding of potential frameworks for teaching and
learning or pedagogical principles that can be applied in the classroom to
affect change will be discussed in section 2.8.
2.8 Critical literacy and the mathematics classroom
My understanding of critical literacy comes largely from my study into
language learners in the mathematics classroom. It is taken from the work of
researchers such as Kalantzis and Cope (1999) and Knobel and Healy
(1998) who encouraged teachers to not just focus on language acquisition
but also to encourage readers to question texts. The critical literacy research
also characterises a much wider definition of literacy and a much wider
definition of a text. This broader definition allows us to include statistical
literacy and the statistical practices of our students into literacy practices. In
this critical discourse we can then be comfortable with Schield’s (2005b)
definition of statistical literacy where “statistical literacy should be viewed as
is critical thinking about everyday arguments in which statistics are used as
evidence” (p.2).
2.8.1 Descriptions of critical literacy
Researchers (Kalantzis & Cope, 1999; Knobel & Healy, 1998; Pennycook,
2001) assert that literate practices are situated where the students are. They
show the literacies to be ‘multiple, dynamic and changing’ (Kalantzis & Cope,
1999). They state that the best place to learn language can be in a content
classroom where the student has a need or desire to learn. Moschkovich
(2002) also takes a situated or socio-cultural perspective of learning in
describing language learners’ experiences in mathematics classrooms.
Moschkovich asserts that aiding English language learner’s participation in
Developing statistical literacy with students and teachers in the secondary mathematics classroom. 47
mathematical discussion and problem solving is achieved by giving students
repeated opportunities to communicate in real mathematics and problem
solving roles “…and that these multiple meanings for representations and
inscriptions are negotiated through conversations” (Moschkovich, 2002,
p.197). There are links here to Watson (2006) who states that “context is a
very significant component of statistical literacy” (p.249).
Pennycook (2001) states that classrooms are ‘situated in political and
ideological worlds’ and that classrooms are the interactional spheres for
power relations of both the societal and local or classroom contexts. In other
words, pedagogy is both political and ideological in nature, and one cannot
deny the reproduction of social and cultural conditions taking place in
schools. This is clearly a challenge to teachers to address the issue of
language in their classrooms and to be accountable for whether or not their
classroom is a classroom where social and cultural inequalities are
reproduced.
Just as I have discussed models and frameworks for the teaching and
learning of statistics and statistical literacy I would like to explore a selection
of models and frameworks used by teachers and researchers in literacy and
language learning. I would also like to explore frameworks used by teachers
and researchers focused on literacy practices in mathematics classrooms. I
will then look for similarities and links between statistical literacy frameworks
and the critical literacy frameworks and also for points of difference.
2.8.2 Critical literacy frameworks
In the same way we have the Statistical Literacy scale of Watson and
Callingham (2005) and the framework for statistical thinking in empirical
enquiry of Wild and Pfannkuch (1999) we have well established models for
discussing critical literacy in the classroom. All of the critical literacy
frameworks I describe come from a socio-cultural or socio-linguistic
perspective. I believe that this is consistent with the constructivist or social-
constructivist stance that I take when investigating statistics and statistical
literacy in the classroom.
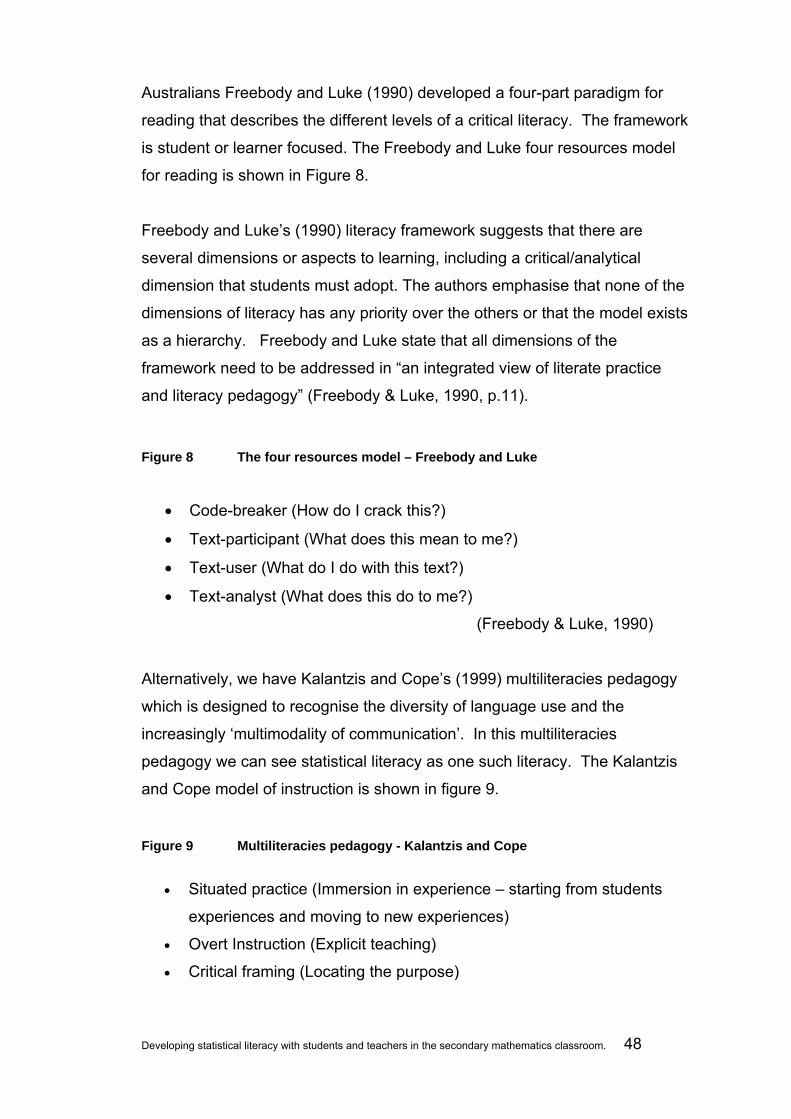
Developing statistical literacy with students and teachers in the secondary mathematics classroom. 48
Australians Freebody and Luke (1990) developed a four-part paradigm for
reading that describes the different levels of a critical literacy. The framework
is student or learner focused. The Freebody and Luke four resources model
for reading is shown in Figure 8.
Freebody and Luke’s (1990) literacy framework suggests that there are
several dimensions or aspects to learning, including a critical/analytical
dimension that students must adopt. The authors emphasise that none of the
dimensions of literacy has any priority over the others or that the model exists
as a hierarchy. Freebody and Luke state that all dimensions of the
framework need to be addressed in “an integrated view of literate practice
and literacy pedagogy” (Freebody & Luke, 1990, p.11).
Figure 8 The four resources model – Freebody and Luke
• Code-breaker (How do I crack this?)
• Text-participant (What does this mean to me?)
• Text-user (What do I do with this text?)
• Text-analyst (What does this do to me?)
(Freebody & Luke, 1990)
Alternatively, we have Kalantzis and Cope’s (1999) multiliteracies pedagogy
which is designed to recognise the diversity of language use and the
increasingly ‘multimodality of communication’. In this multiliteracies
pedagogy we can see statistical literacy as one such literacy. The Kalantzis
and Cope model of instruction is shown in figure 9.
Figure 9 Multiliteracies pedagogy - Kalantzis and Cope
• Situated practice (Immersion in experience – starting from students
experiences and moving to new experiences)
• Overt Instruction (Explicit teaching)
• Critical framing (Locating the purpose)
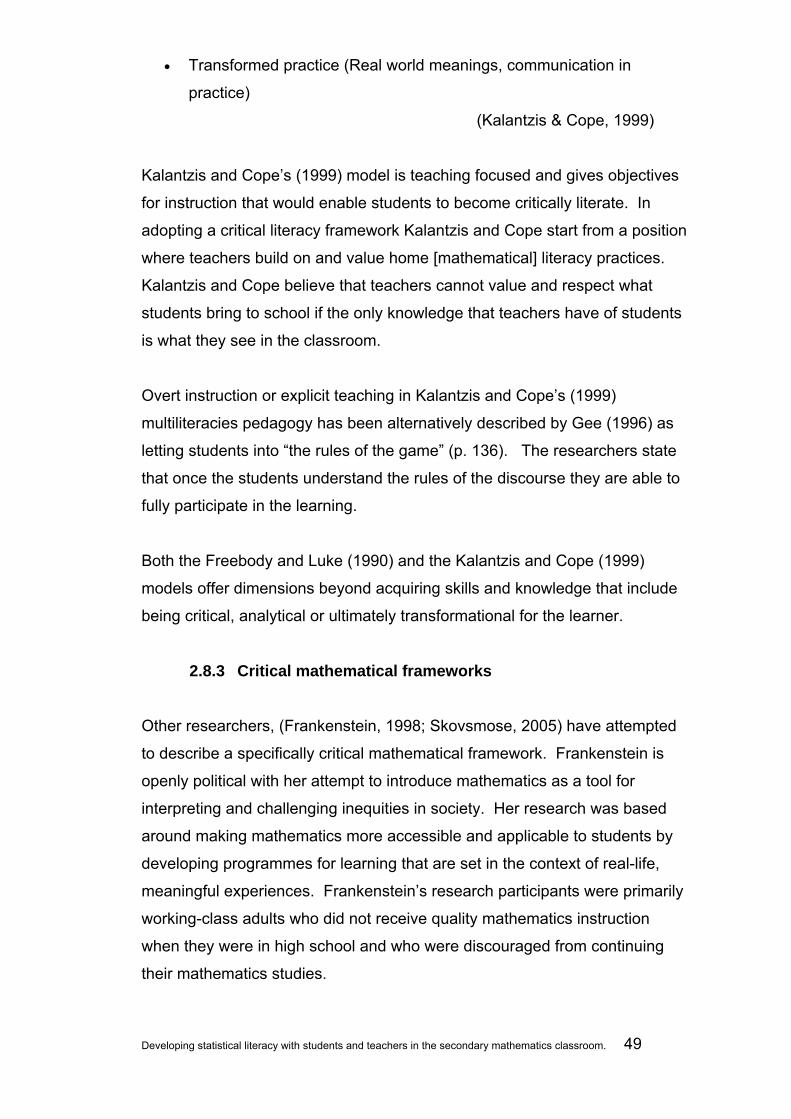
Developing statistical literacy with students and teachers in the secondary mathematics classroom. 49
• Transformed practice (Real world meanings, communication in
practice)
(Kalantzis & Cope, 1999)
Kalantzis and Cope’s (1999) model is teaching focused and gives objectives
for instruction that would enable students to become critically literate. In
adopting a critical literacy framework Kalantzis and Cope start from a position
where teachers build on and value home [mathematical] literacy practices.
Kalantzis and Cope believe that teachers cannot value and respect what
students bring to school if the only knowledge that teachers have of students
is what they see in the classroom.
Overt instruction or explicit teaching in Kalantzis and Cope’s (1999)
multiliteracies pedagogy has been alternatively described by Gee (1996) as
letting students into “the rules of the game” (p. 136). The researchers state
that once the students understand the rules of the discourse they are able to
fully participate in the learning.
Both the Freebody and Luke (1990) and the Kalantzis and Cope (1999)
models offer dimensions beyond acquiring skills and knowledge that include
being critical, analytical or ultimately transformational for the learner.
2.8.3 Critical mathematical frameworks
Other researchers, (Frankenstein, 1998; Skovsmose, 2005) have attempted
to describe a specifically critical mathematical framework. Frankenstein is
openly political with her attempt to introduce mathematics as a tool for
interpreting and challenging inequities in society. Her research was based
around making mathematics more accessible and applicable to students by
developing programmes for learning that are set in the context of real-life,
meaningful experiences. Frankenstein’s research participants were primarily
working-class adults who did not receive quality mathematics instruction
when they were in high school and who were discouraged from continuing
their mathematics studies.

Developing statistical literacy with students and teachers in the secondary mathematics classroom. 50
Frankenstein (1998) has developed a framework for discussing the ideas of
critical literacy and mathematics. Students examine data and questions
through the four goals of Frankenstein’s criticalmathematical literacy
curriculum shown in Figure 10 below.
Figure 10 Frankenstein’s criticalmathematical literacy curriculum
1. Understanding the mathematics.
2. Understanding the mathematics of political knowledge.
3. Understanding the politics of mathematical knowledge.
4. Understanding the politics of knowledge.
(Frankenstein, 1998)
Similarly, Skovsmose (2005), whose ideas were influenced by his work with
mathematics educators in post-apartheid South Africa, believes that if
mathematics education “…can be organised in such a way that it challenges
undemocratic features in society, we can call it critical mathematical
education” (Skovsmose, 2005, p.208). Just as Freebody and Luke (1990)
and Kalantzis and Cope (1999) expressed in their frameworks, Skovsmose
and Frankenstein (1998) see mathematics as more than acquiring a set of
well defined competencies.
2.8.4 A critical statistical literacy
I believe that these frameworks are a perfect starting point for examining a
possible critical literacy pedagogy for statistics and statistical literacy that can
link statistics teaching with the real world. I wonder whether the adoption of
such a framework can also begin the process of understanding and resolving
issues such as the (in)equity in distributing the benefits of mathematics and
statistics to all.
A critical statistical literacy would involve having a sound knowledge and
understanding of a significant part of school mathematics and statistics. This
is like the code breaker from Freebody and Luke’s (1990) framework or
understanding the mathematics as in Frankenstein (1998) and could be
achieved by the overt instruction of Kalantzis and Cope (1999). It can be

Developing statistical literacy with students and teachers in the secondary mathematics classroom. 51
argued that many teachers have often only focused on this component of the
framework. Despite curriculum changes, much of the secondary
mathematics programme is still skill-based learning largely removed from any
real world context (Begg, 2005).
The text participant in Freebody and Luke’s (1990) framework would involve
students being able to confidently use the statistical skills to solve problems
in context. Mathematics teachers have responded to this by attempting to
contextualise school statistics by using problems and contexts that appear to
be relevant to the students. However, despite teachers’ best efforts many of
these ‘real world problems’ are contrived and the real parts are removed so
as not to completely obscure the primary purpose of teaching school
statistics. We do not have to look far to find examples of this in popular
textbooks used in secondary schools.
The next important skill is applying statistical knowledge independently to
pose and solve problems in a wide variety of contexts. This involves finding
out any missing facts or acquiring any skills needed in the process and in
evaluating solutions critically like in the text user of Freebody and Luke’s
(1990) framework or Frankenstein’s (1998) understanding the mathematics
of political knowledge and understanding the politics of mathematical
knowledge. It would seem that if students are to learn to use mathematics
outside the mathematics classroom then that is where they need to
experience using mathematics. This is quite challenging for secondary
mathematics teachers who control the teaching of statistics in secondary
schools. However, Thornton and Hogan (2001) argue that adopting such
features of a critical mathematical literacy framework would enable students
to more fully participate in society by investigating real issues of interest.
Finally, adopting such a critical pedagogy would require students to interpret,
evaluate, and critique the statistics placed in a social and political setting [e.g.
from advertisements and media reports to government decision-making and
the distribution of the resources in society]. This can be seen like the text
analyst in Freebody and Luke’s (1990) framework, Kalantzis and Cope’s
(1999) transformed practice or Frankenstein’s (1998) understanding the

Developing statistical literacy with students and teachers in the secondary mathematics classroom. 52
politics of knowledge. In this setting statistics cannot be removed from the
culture just like language cannot be removed from the culture and therefore
statistics becomes not only a tool for critique but also an object of critique.
2.8.5 Equity issues and critical literacy
Knobel and Healy (1998) believe that teachers should be very clear about
why they are doing critical literacy in their classrooms. Knobel and Healy
challenge that if teachers are going to embark on a critical literacy journey
they will have to pay attention to all four corners of the critical literacy
framework. A critical (statistical) literacy is not possible where the teachers
themselves are aware of all practices yet where the teachers only teach
students become ‘code breakers’. I believe the particular challenge in
adopting a critical literacy pedagogy in the classroom is in implementing the
dimension that Freebody and Luke’s (1990) call ‘the text analyst’ or what
Kalantzis and Cope (1999) refer to as transformed practice into mathematics
and statistics teaching.
If teachers continue to focus on just ‘doing’ statistics and not ‘thinking’
statistics and do not address the different literacies required for success in
the 21st century, then not being statistically literate will become another
equity issue in the classroom and society. I believe that this inequity will be
even more pronounced in classrooms where there are a greater number of
students with low literacy levels. However, after some years of literacy
interventions in secondary schools New Zealand mathematics teachers are
becoming more comfortable with the world of literacy and are prepared to, in
the language of Kalantzis and Cope (1999), use situated practice and overt
instruction and even critical framing to provide a more holistic learning
environment. Both Kalantzis and Cope and Freebody and Luke (1990) state
that there may be little value in making these changes if we never include the
analysis and evaluation of the text analyst or transformed practice’.
However, adopting such a stance could be very difficult for teachers in the
classroom. To do so could see much greater control going to the students to
decide what is studied in the classroom. I am unsure how mathematics
Developing statistical literacy with students and teachers in the secondary mathematics classroom. 53
teachers will respond to such challenges and criticism from students that
their teaching may be reproducing inequalities.
2.8.6 Links between critical literacy and statistical literacy
There are links between the models of statistical literacy and critical literacy.
Gal’s (2002) definition of statistical literacy, with the knowledge bases of
mathematical knowledge, statistical knowledge, literacy skills, knowledge of
context and critical questioning, is consistent with the concepts of critical
literacy. Critical mathematical is the final goal in Watson and Callingham’s
(2005) statistical literacy construct. Watson (2006) makes the direct
connection between statistical thinking and literacy using Freebody and
Luke’s (1990) critical literacy model. Watson calls for students to be
challenged to not only to develop mathematical skills but to develop critical
literacy skills, where students will not only have to be able to communicate
mathematically but to also be able to communicate meaning in the contexts
given and link findings to everyday experience (Watson, 2006, p.287).
The themes of critical literacy have implications for teaching. In the next
section I will explore the possibilities of affecting change in teacher practice
and what possible protocols and procedures that could be adopted to make
that change
2.9 Implications for classroom practice
Research in New Zealand and overseas has consistently acknowledged the
importance of the teacher in student learning. The Quality Teaching for
Diverse Students in Schooling: Best Evidence Synthesis (Alton-Lee, 2003)
state “that both the subject matter knowledge and pedagogical knowledge of
teachers are critical to their effectiveness” (Alton-Lee, 2003, p.10). The
Effective Pedagogy in Mathematics/Pāngarau Best Evidence Synthesis
Iteration (Anthony & Walshaw, 2007) quote the NCTM which state that
“[e]ffective mathematics teaching requires understanding what students know
and need to learn and then challenging and supporting them to learn it well”
(Anthony & Walshaw, 2007, p.7).
Developing statistical literacy with students and teachers in the secondary mathematics classroom. 54
2.9.1 New Zealand classrooms
New Zealand secondary mathematics teachers appear well placed in terms
of subject knowledge as an aspect of an effective teacher. Anthony and
Walshaw (2007) report that a 2001 census of New Zealand secondary
schools teachers found that “the proportion of teachers with a third year
university or postgraduate qualification in a given subject area to be higher
for mathematics than for any other curriculum area” (p.128). However, Begg
et al. (2004) point out that “teachers vary considerably in their statistical
knowledge, their mathematical knowledge, and in their confidence and
experience in teaching statistics” (p.18) and that this variation has not been
considered when planning curriculum implementation. In addition to the
teachers’ knowledge and teaching experience, Begg et al. outline other
aspects that influence teaching such as age, position, tradition and
expectations and that these beliefs may make something like an investigative
approach as wholly inappropriate for some teachers.
These views are not restricted to just researchers. In response to proposed
changes to NCEA Achievement Standards, compiled by mathematics advisor
Louise Addison, teachers from the Southern Cluster of the Auckland
Mathematics Association expressed concerns about changes to statistics
assessments. Teachers felt that a lot of training, ongoing professional
development and resources would be required before teachers could feel
confident about students being able to do the ‘new’ work in statistics. Some
teachers still remain sceptical of any changes and even claimed that the
changes were a complete new way of looking at statistics (Addison, personal
communication, June 2007).
2.9.2 Teacher professional development
Given the magnitude of teacher and classroom effect,
and our diverse student population, the project of
seeking to improve policy and practice through
synthesising the evidence-base for quality teaching for
diverse students, and developing access to, and use of,
Developing statistical literacy with students and teachers in the secondary mathematics classroom. 55
this knowledge, is a pressing one for New Zealand
education.
(Alton-Lee, 2003, p.3)
…change is a long process that may start with
rearranging seats.
(Auerbach, 1995, p.30)
As stated by Alton-Lee, quality professional development based on the best
evidence available is an urgent need for all teachers. However, as Auerbach
alludes the actual process may be a long and tortuous one.
Some New Zealand researchers have attempted to work with teachers to
implement change. Merriman (2006) has undertaken research into statistical
literacy in New Zealand by using media reports in the classroom. Merriman’s
analysis uses Watson and Callingham’s (2003) hierarchy to examine Year 10
student’s responses. She found a positive linear correlation between English
ability and ability in statistical literacy. Merriman goes on to assert that “when
students are supported in their discussions in the classroom and encouraged
to be open, with a healthy dose of scepticism, along with a persistence of
effort, then they will begin to make inroads into interpreting statistical
information” (Merriman, 2006, p. 4). However, Merriman does not discuss
how students are to be supported in their learning
Pfannkuch and Horring (2005) describe an ongoing project to help teachers
change their practice in the teaching and learning of statistics. The
motivation for change was a response to assessment and curriculum
changes. In this study, the researchers plainly state that any “curriculum
development necessitates professional development and resource
development” (Pfannkuch & Horring, 2005, p.205). It will be interesting to
see if this voice of reason will be heard in New Zealand’s current curriculum
implementation.
In the professional development model employed in the Pfannkuch and
Horring (2005) project, teachers participate actively in the change process

Developing statistical literacy with students and teachers in the secondary mathematics classroom. 56
from inception to implementation. Pfannkuch & Horring describe this as a
method of curriculum development where the “teachers must become fully
conversant with the theory to participate in the research process” (p.205).
For Pfannkuch and Horring the teachers are central to the process, and the
changes draw on their own experience.
There are other excellent examples of research in New Zealand into
mathematics and statistics instruction where the research study authors have
endeavoured to describe good practice for teacher professional
development. Kensington-Miller (2004) describes a long term study of the
professional development of mathematics teachers in several low socio-
economic secondary schools in Auckland. She describes a range of
strategies trialled to change the practice of teachers. In this study the
interventions are not linked to any single goal of the mathematics curriculum
such as statistics. Like Pfannkuch and Horring (2005), Kensington-Miller
describes how change can occur with proper allocation of resources and
support of teachers.
Kensington-Miller (2004) describes four different strategies trialled to change
the practice of teachers from a predominately transmission style of teaching
and classroom control to a more constructivist approach to teaching. The
strategies involved meetings with teachers, peer mentoring, one-to-one
mentoring and reading literature. A key finding was that all the teachers
involved believed in the importance of ongoing professional development.
However, the efficacy of the intervention was questioned as to whether it
produced any real or long term changes to teaching. Kensington-Miller
describes “the enormity of implementing professional development and the
problems associated” (p. 326) but does not stop from suggesting that the
difficulties should be addressed and that progress can be made when greater
support can be given to teachers.
The importance of the teacher is also a central theme in Anthony and
Walshaw’s (2007) Best Evidence Synthesis. They cite Muijs and Reynolds
(2001) who emphasise: “All the evidence that has been generated in the
school effectiveness research community shows that classrooms are far
Developing statistical literacy with students and teachers in the secondary mathematics classroom. 57
more important than schools in determining how children perform at school”
(Anthony & Walshaw, 2007, p.4). Anthony and Walshaw go on to state that
“quality teaching is not simply a matter of ‘knowing your subject’ or ‘being
born a teacher” (p.4) and that there is a need for quality professional
development in secondary schools to make sure that good practice occurs in
as many classrooms as possible.
2.9.3 Other models for teacher professional development
With the importance of the teacher in the learning process established it is
necessary to look at possible models for how teachers actually change. One
such model from Kazemi and Franke (2004) focuses on teachers
investigating the thinking processes of students.
In their research study Kazemi and Franke (2004) document key changes or
shifts that occurred for teachers during the course of a year of monthly
workgroups. Their research uses Cognitively Guided Instruction (CGI), a
research and professional development programme that a number of
researchers (Carpenter & Fennema, 1992; Carpenter, Fennema, Franke,
Levi, & Empson, 1999) have used in different educational research settings.
In their work with teachers, Kazemi and Franke found that the most powerful
change occurred when their research teachers were engaged in
investigations into students’ thinking. Kazemi and Franke describe a
framework of five levels that they used in the observations of teachers
engaging with students’ mathematical thinking. The Kazemi and Franke
hierarchy shows differing degrees of pedagogical aptitude in juggling
instructional approaches, teaching principles, and students’ contributions.
The Kazemi and Franke approach fits with the constructivist viewpoint
described by Mvududu (2005) where “statistics instructors need to (a) study
how students think about the particular statistics topics they teach and (b)
work to understand their students’ thinking at a level deeper than everyday
communication.” (p.54)
At Level 1 on Kazemi and Franke’s (2004) scale the teacher does not believe
that the students in his or her classroom can solve the problems unless they

Developing statistical literacy with students and teachers in the secondary mathematics classroom. 58
have been taught how and does not provide opportunities for solving
problems or bother to ask the students how they solved problems. At level 2
the teacher begins to view students as bringing mathematical knowledge to
learning situations and talks about the value of a variety of solutions. By
level 3 of the Kazemi and Franke model the teacher is able to provide a
variety of different problems for students to solve and is able to then give
students opportunities to discuss their solutions because they want to listen
to students talking about their thinking. Teachers operating at Level 4A of the
Kazemi and Franke hierarchy believe that students’ mathematical thinking
should determine the evolution of the curriculum and the ways in which the
teacher individually interacts with students. Kazemi and Franke finally
describe Level 4B where the teacher can describe in detail individual
students’ thinking. These teachers create opportunities to build in students’
mathematical thinking and use “what he or she learns about individual
students’ mathematical thinking to drive instruction” (Franke & Kazemi.,
2001, p. 662).
Researchers (Fennema et al., 1996; Franke & Kazemi, 2001) have shown
that movement through the levels requires a supportive community who will
pose questions about students’ thinking for teachers to reflect upon and
where after awhile the teachers begin to initiate this questioning themselves
and it becomes part of their own pedagogical practice. Teachers in the
Kazemi and Franke (2004) research, who engaged in reflection-in-action,
were able to change their teaching in ways that were both sustainable and
self-generative which led to an enhancement in the quality of mathematical
interactions.
2.9.4 Models for professional development in New Zealand
Researchers in New Zealand have also been attempting to get mathematics
teachers to be more responsive to their students by focusing on their
thinking. I am particularly interested in research carried out by Woodward
and Irwin (2005) because of its links and similarities to my own context. In
the Woodward and Irwin study they report about how opportunities for
students to explain and justify solutions were given. The context for the study

Developing statistical literacy with students and teachers in the secondary mathematics classroom. 59
was two classes of primary school classes involved in the Numeracy Project
where the majority of students were Pasifika. The researchers describe how
a teacher involved in this study made a significant contribution to students’
mathematical development by listening attentively to her students’ queries
and explanations. In a description comparable to Kazemi and Franke’s
(2004) CGI higher level operation, the teacher asked them to justify their
answers and held back with her own explanations.
Woodward and Irwin (2005) focus on the discourse practices of the
mathematics classroom. They cite the Khisty and Chval (2002) research
quoted earlier in this literature review that argues that students need to have
repeated opportunities to participate in mathematical discussion. Khisty and
Chval’s method, of using the correct mathematical terms with students rather
than avoiding the academic vocabulary, is suggested by Woodward and Irwin
as a way in which teachers can improve the academic achievement of ESOL
students where they provide a climate for this to happen in the classroom.
While the Woodward and Irwin (2005) research focused on language,
statistics just happened to be the topic that the teachers were teaching when
researched. There is other research available in New Zealand that focuses
on statistics teaching and learning in secondary schools. Pfannkuch and
Horring (2005) investigated the professional development of teachers by
focusing on a specific goal of the statistics curriculum. Their research
explored the use of statistical investigations to teach statistics with Year 11
students. Pfannkuch and Horring outline a methodology for research that
has the teacher and researcher at the centre. To use their paradigm for
changing practice there would be a need to understand the notion of
statistical literacy in the current situation with respect to current teaching and
learning. Secondly, the researcher and teacher collaborate by “envisioning
how the current situation might be changed” (Pfannkuch & Horring, 2005,
p.205) and by designing and trialling a unit of work that the teachers believe
could enhance students’ statistical literacy. Thirdly, the researcher and
teachers evaluate the process of trialling and implementing changes in
teaching, learning, and assessment. Finally, in Pfannkuch and Horring’s
process the researcher takes the knowledge gained through the curriculum
Developing statistical literacy with students and teachers in the secondary mathematics classroom. 60
development activity to “ultimately abstract a theoretical base for the
development of statistical literacy in instruction” (p.205).
Finally, from the area of language and learning for ESOL and language
learners we have another model for professional development. In a series of
DVD’s produced for the Ministry of Education we see how teachers can
effectively integrate content teaching and language learning. The Making
Language and Learning Work 1: Integrating Language and Learning in
Secondary Maths and Science DVD (Ministry of Education, 2007a) features
science and mathematics teachers exemplifying good practice. The
professional development model also includes support and facilitation from
school advisors and from notes on the internet. The basis for the programme
is seven principles that underpin the integration of content and language
learning. The principles are outlined in Figure 11.
A combination of these research methods and principles would I believe form
the basis of a good intervention for changing practice in the mathematics
classroom. All the approaches highlighted are steeped in the research.
However, Pfannkuch and Horring’s (2005) model for implementation and the
Ministry of Education’s principles appeal most as possible methods for
research because of their closeness to the context of this study. Although
the two approaches do not explicitly mention critical literacy or statistical
literacy both the Pfannkuch and Horring’s model for implementation and the
Ministry of Education’s ESOL and language learners’ principles for teaching
appear to be situated in a similar discourse.

Developing statistical literacy with students and teachers in the secondary mathematics classroom. 61
Figure 11 Principles from “Making language and learning work 1”
Principle 1: Know your learners - their language background, their language
proficiency, their experiential background.
Principle 2: Identify the learning outcomes including the language demands of the
teaching and learning.
Principle 3: Maintain and make explicit the same learning outcomes for all the
learners.
Principle 4: Begin with context embedded tasks which make the abstract concrete.
Principle 5: Provide multiple opportunities for authentic language use with a focus on
students using academic language.
Principle 6: Ensure a balance between receptive and productive language.
Principle 7: Include opportunities for monitoring and self-evaluation.
(Ministry of Education, 2007a)
The merits of the approaches will be discussed further in Chapter 3 when
considering methodology.
2.10 Conclusions and focus for study
There appears to be a commonly held definition of statistical literacy that
consists of students being able to understand and critically evaluate the
statistics in the context of the world around them. However, there may be a
match/mismatch between the stance taken by the curriculum towards
statistical literacy and what teachers understand of statistical literacy.
There are models and frameworks available for statistics teachers to use to
discuss statistical literacy. Some of the frameworks have emerged from
mathematics and statistics educators while others have come from
statisticians. The frameworks describe how students’ statistical thinking or
Developing statistical literacy with students and teachers in the secondary mathematics classroom. 62
statistical literacy can be effectively analysed. Similarly, there are good
models available on how statistical literacy can be developed and assessed.
There also appears to be particular ways of teaching that can elicit the
specific types of thinking identified in the statistical literacy frameworks.
However, as stated by Anthony and Walshaw (2007) there is limited research
about effective teaching of mathematics in New Zealand secondary schools.
I believe that there is even less research into the effective teaching of
statistical literacy. The Effective Pedagogy in Mathematics/Pāngarau Best
Evidence Synthesis Iteration [BES] also states that there is only a small
amount of reported research that focuses on quality teaching for Pasifika
students.
There appears to be very strong links between researchers working with
statistical literacy and those researchers focused on literacy. However,
despite a significant intersection between the goals of statistical literacy and
[critical] literacy there does not appear to be research about how secondary
mathematics teachers could integrate statistical literacy and language in the
classroom. Statistics focused researchers like Gal (2002; 2005) and Watson
(2006) concentrate on the statistics while language focused researchers like
Kalantzis and Cope (1999), Khisty and Chval (2002) and Moschkovich (2002)
focus on the language especially for language learners and ESOL students.
It is my conviction that both these groups need to come closer together if
practical help is to be given to teachers working in classrooms.
There are good teacher professional models for improving practice that could
be adopted to improve the teaching of statistical literacy. Kazemi and Franke
(2004) research provides a model where teachers engage in investigations
into students’ thinking. The New Zealand research of researchers such as
Kensington-Miller (2004) and Pfannkuch and Horring (2005) signal ways that
teachers can work effectively together to change practice. However, there
does not appear to be much research that describes how the development of
statistical literacy can be supported. An example is the Making Language
and Learning Work 1: Integrating Language and Learning in Secondary
Maths and Science DVD (Ministry of Education, 2007a) which gives
teachers ways that they can effectively integrate content teaching and

Developing statistical literacy with students and teachers in the secondary mathematics classroom. 63
language learning. It is hoped that these initiatives can be used to help
teachers make the links between the language and statistics that I see as so
important.
In all of these approaches the teacher is central to effective teaching and
learning of statistics and statistical literacy. Here I will restate the position of
the Effective Pedagogy in Mathematics/Pāngarau Best Evidence Synthesis
Iteration (Anthony & Walshaw, 2007) which strongly asserts that it is
teacher’s pedagogical knowledge and expertise that helps students learn.
Anthony and Walshaw stress that “the teacher’s expertise is also related to
the role he or she assumes as earnest listener and co-learner” (p.77).

Developing statistical literacy with students and teachers in the secondary mathematics classroom. 64
Chapter 3: Methodology
3.1 Introduction In this chapter I wish to discuss the methodological issues of this research
study. In section 3.2 there is a description of the action research process
chosen. In section 3.3, issues of trustworthiness are investigated. In section
3.4, there is a description of and justification for the qualitative data collection
procedures selected for research in such a setting. Issues around data
analysis are examined in section 3.5. In section 3.6 I attempt to give an
outline of my own philosophical standpoint and how that informs and
influences the research. Finally, in section 3.7 there is a description of the
methodology in practice. There is an in-depth description of the participants
involved, the context and structure of the research and a description of the
practicalities of the data collection techniques used in this qualitative
practitioner enquiry.
3.2 Action research
This research project is concerned with improving the teaching and learning
of statistical literacy with three teachers in three classrooms of Year 9 and 10
students. There is no intention by the teachers involved in this research to
leave the current situation undisturbed. Many researchers (Burns, 1994;
Cohen, Manion & Morrison, 2000; Doerr & Tinto, 2000; Kemmis &
McTaggart, 1988; Murray & Lawrence, 2000) state that action research is a
suitable approach for studying such a context. Therefore, an action research
model has been chosen as appropriate for this project
Action research is, above all, a method for simultaneously doing what the
name says - action and research. The benefits of action research are that it
is a process where change and understanding can be pursued at the same
time (Kemmis & McTaggart, 1988) and because it can be done by a group of
people to improve their practice (Cohen et al., 2000). Burns (1994) states
that:
Developing statistical literacy with students and teachers in the secondary mathematics classroom. 65
Action-research is a total process in which a ‘problem
situation’ is diagnosed, remedial action planned and
implemented, and its effect monitored,… It is both an
approach to problem solving and a problem-solving
process.
(Burns, 1994, p.294)
Unlike more positivistic or experimental research models, action research is
focused on practice. Action research is a methodological approach that is
more about guiding practitioners towards ‘practical next steps’ (Doerr & Tinto,
2000) than generating theories of learning. Action research is adaptive,
tentative and evolutionary (Burns, 1994).
As with all research in education there are different interpretations and
definitions of action research. Action research is alternatively called
reflective enquiry, reflective practice, critical reflection, participatory
practitioner research, emancipatory research, practitioner-based enquiry or
collaborative action research. Each interpretation of the action research
process places the researcher in the research epistemology and
methodology discourse. It is hoped that the following sections enable
readers to locate the methodology of this research.
3.2.1 Key components of action research Action research is usually described as cyclic; with action and critical
reflection taking place in turn (Burns, 1994; Hughes & Seymour-Rolls, 2000).
In the planning phase the teacher or teachers develop a plan of critically
informed action to improve their current practice. Another advantage of
action research is that the plan can be flexible to allow adaptation for
unforeseen effects or constraints (Kemmis & McTaggart, 1988).
Action research can be effective because it adapts to the situation (Cohen et
al., 2000). Action research operates in a reflective spiral or cycle. Kemmis
and McTaggart (1988) describe a cycle of plan, act, observe and reflect
shown in Figure 12 below. Each turn of the cycle integrates theory and
practice, understanding and action, and informs the next turn (Hughes &
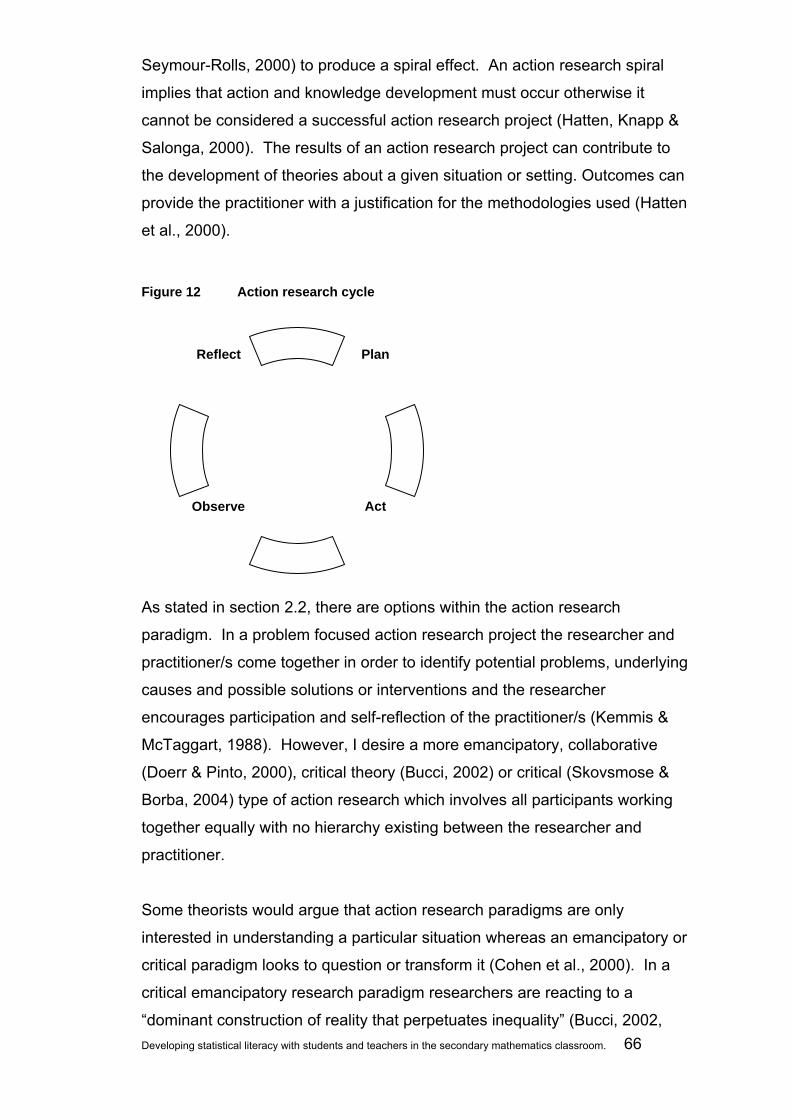
Developing statistical literacy with students and teachers in the secondary mathematics classroom. 66
Seymour-Rolls, 2000) to produce a spiral effect. An action research spiral
implies that action and knowledge development must occur otherwise it
cannot be considered a successful action research project (Hatten, Knapp &
Salonga, 2000). The results of an action research project can contribute to
the development of theories about a given situation or setting. Outcomes can
provide the practitioner with a justification for the methodologies used (Hatten
et al., 2000).
Figure 12 Action research cycle
As stated in section 2.2, there are options within the action research
paradigm. In a problem focused action research project the researcher and
practitioner/s come together in order to identify potential problems, underlying
causes and possible solutions or interventions and the researcher
encourages participation and self-reflection of the practitioner/s (Kemmis &
McTaggart, 1988). However, I desire a more emancipatory, collaborative
(Doerr & Pinto, 2000), critical theory (Bucci, 2002) or critical (Skovsmose &
Borba, 2004) type of action research which involves all participants working
together equally with no hierarchy existing between the researcher and
practitioner.
Some theorists would argue that action research paradigms are only
interested in understanding a particular situation whereas an emancipatory or
critical paradigm looks to question or transform it (Cohen et al., 2000). In a
critical emancipatory research paradigm researchers are reacting to a
“dominant construction of reality that perpetuates inequality” (Bucci, 2002,
Reflect
Act
Plan
Observe

Developing statistical literacy with students and teachers in the secondary mathematics classroom. 67
p.76) and researchers are ‘researching possibilities’ (Skovsmose & Borba,
2004, p.223) to make transformations in the classroom.
It is an intention of this research to go beyond just trialing different ways of
teaching of statistics in the classroom and to look at how teaching and
learning of statistics can be transformed. In such a setting the research
hopes to be more than just quality assurance of the teaching of a curriculum
topic.
3.2.2 Benefits of action research
There is some evidence for the wider benefits to teachers undertaking such
action research. Kemmis and McTaggart (1988) maintain that emancipatory
action research facilitates reflective discussion between practitioners and that
the discussion allows participants to identify underlying problems and
assumptions with the area of concern. Action research can involves all
participants acting equally with no hierarchy existing between the researcher
and practitioner, such as Doerr and Tinto’s (2000) collaborative action
research where the teacher is central to the whole process and takes a full
part in posing questions, collecting data and drawing conclusions. The
researcher aims to decrease the distance between the actual problems
identified by the practitioner and the theory used to explain and resolve the
problems. Adopting this type of emancipatory action research assists the
researcher to become a collaborative member of the group and less of a
researcher (Kemmis & McTaggart, 1988, p.12).
Hatten et al. (2000) state that one of the benefits of an action research
project undertaken by a group of teachers is that it is not essential that all
participants have a well developed level of professional knowledge around
the topic of study as long as some members need to have this for the group
to function. Importantly, Hatten et al. emphasise that all members bring their
own knowledge developed from their personal experiences to the action
research process.
Differing levels of knowledge in the group members dictate the nature of the
negotiation process which occurs in the development of the plan of action.

Developing statistical literacy with students and teachers in the secondary mathematics classroom. 68
There are advantages associated with such a negotiation. Skovsmose and
Borba (2004) state that the very fact that the researcher is exploring
possibilities with others in a collaborative research project means that the
researcher can not do research on someone but must research with
someone. However, the collaborative nature of the action research may also
mean that setting and achieving researcher set outcomes is not possible.
This has been described as the ’chaos of practice’ (McCormack, Illman,
Culling, Ryan & O’Neill, 2002). In such a ‘chaos of practice’ the description
of clearly defined research phases is replaced with a description of a much
wider journey from problem to outcome.
Ultimately, researchers hope that the action research process can benefit the
teachers involved beyond the boundaries of a short research project. As Van
Zoest (2006) states; “there is no question that engaging in inquiry about
teaching and learning mathematics is an important form of professional
development that enhances teachers’ knowledge, skill and understanding”
(xvii). Van Zoest goes further to state that for teachers “…engaging in self-
critical systematic inquiry is transformative and professionally life-changing”
(xvii).
3.3 Trustworthiness
Whatever the form the research takes, trustworthiness is always an issue in
research. Trustworthiness is often described in terms of validity and
reliability in research. However, there are a large number of meanings and
definitions given for validity and reliability in educational research literature.
Two commonly used descriptions of validity are internal validity and external
validity. Internal validity can be seen as the ability of the data gathered to
support the claims made by the research (Cohen et al., 2000) whereas
external validity can be expressed as the ability of the results of research to
be generalised to the wider population.
The terms reliability, external and internal validity may all be problematic in
the context of qualitative emancipatory action research. Achieving a notion
of internal validity may be possible because multiple pieces of evidence from
Developing statistical literacy with students and teachers in the secondary mathematics classroom. 69
multiple sources can be used to uncover findings. In action research the
researcher also has the opportunity for prolonged engagement in the
research situation. However, researchers must use the designated data
gathering tools systematically and properly in collecting the evidence (Burns,
1994).
External validity and reliability may be more difficult outcomes to achieve or
explain in this study. Because an action research process has been used
there may be no way that the findings of this study can be generalised
beyond the school situation. However, it is hoped that reliability can be
addressed by ensuring that the procedures used are well documented and
can be repeated (Cohen et al., 2000). It is also hoped that giving a detailed
description of the research and the showing an understanding of my role as
researcher/ participant will help provide validity and reliability. Likewise, I will
attempt to show how any inferences made from the data collected have been
affected by the theoretical perspectives that I have taken in this thesis.
3.3.1 Validity
To achieve this openness and awareness in the research I have looked to
researchers who have attempted to describe validity in an action research
setting. Anderson, Herr and Nihlen (1994) have suggested five different
criteria that can be used to assess validity in action research; democratic
validity, outcome validity, process validity, catalytic validity and dialogic
validity.
Democratic validity is when stakeholders in the research have participated in
the research and are part of the intervention planning, data collection and
analysis. This is central to this research project. According to Skovsmose
and Borba (2000) the quality of any participatory research can be assessed
in terms of the co-operation between participants and I believe that the
selection of an emancipatory action research paradigm works to facilitate
this.

Developing statistical literacy with students and teachers in the secondary mathematics classroom. 70
Outcome validity is where there has been a successful resolution of the
research problem. Process validity is where an appropriate theoretical and
methodological approach has been taken in the research. This has been
addressed in part by the previous research that I have done into statistics,
statistical literacy and language learning. The selection of an action research
approach has been a considered one. Process validity may therefore be
achieved because the researchers are using appropriate measures for the
concepts being studied. Interviews, classroom observations and the
collection of artefacts all seem suitable data collection methods for a study
investigating statistical literacy and the use of language learning principles in
the secondary mathematics classroom.
Catalytic validity is about the force for change that the research creates.
Again, by adopting an emancipatory action research model it is hoped that
the research will start an ongoing process of change in the teaching of
statistical literacy as further cycles of action research are undertaken.
Beyond this the emancipatory action research model also seeks to empower
the participants not only to change teaching practices but to also facilitate
wider collaboration between teachers.
Finally, dialogic validity can be addressed by sharing the research findings,
initially by a participant debriefing and leading to wider dissemination of
findings. The first and most important use of the research is that it informs
the future teaching and learning of statistics in the school. However,
information may also be presented in future teacher professional
development sessions or submitted to a journal. When completed, this thesis
and a summary of this thesis will be made available in my school for
teachers, students and their parents to read if they wish. Other ways in
which the information may be used will be subject to a process of
consultation with participants. There are some issues here about the status
and prominence that this affords me over the other participants of the
research. I have discussed this further in the section ethical considerations.

Developing statistical literacy with students and teachers in the secondary mathematics classroom. 71
3.4 Data collection
The action research cycle resonated with the teacher participants in this
research because of the similarities between action research and the PPDAC
statistical investigation cycle of Wild and Pfannkuch (1999). However, the
reflection, plan, action, observation and reflection of the action research cycle
uses data collection methods that are very different to the statistical methods
used in the classroom.
For teachers researching their own practices and where the teachers take
the place of ‘participant observer’ (Cohen et al., 2000; Hatch & Shiu, 1998)
there is a basic need to produce a record such as interview notes, video,
transcripts, anecdotes, and journals to provide data. Similarly, qualitative
research concentrates on the words and observations found in these records
to express reality and attempts to describe people in natural situations.
Because it is not in the spirit of action-research for the principal researcher to
be overly prescriptive or definitive (Cohen et al., 2000; Hughes & Seymour-
Rolls, 2000), it must be emphasized that the data collection methods
described were revised collaboratively as participants began focusing their
attention on the questions identified. This idea is again central to the
descriptions of data collection methods throughout this chapter.
3.4.1 Interviews
Interviews are an important part of an action research project as they provide
an opportunity for the researcher to investigate ideas and beliefs of teachers
further and to gather data which may not have been obtained by other
methods such as observation or survey (Cohen et al., 2000).
Where group interviews are used, the principal researcher can direct the
interaction and inquiry in an unstructured manner (Denzin & Lincoln, 1994).
One technique described is to order questions from the more general to the
more specific, with questions of greater importance asked early. Denzin and
Developing statistical literacy with students and teachers in the secondary mathematics classroom. 72
Lincoln believe that this interview approach (from general to specific) is one
way of engaging the interest of participants quickly.
In documenting action research the interviews can take place during various
parts of the cycle from the initial planning phase to the reflection phase of the
action research. Action researchers state that reflection in interviews can aid
in the group reconstruction of the meaning of the situation and provide help
with the next cycle of planning for action. These steps are carried out in a
more careful, systematic and rigorous way than that which usually occurs in
daily practice (Kemmis & McTaggart, 1988; Zuber-Skerritt, 1992)
Researchers also state there are interviewer attributes that may contribute to
successful interviews. Glesne and Peshkin (1992) feel that a good
interviewer is anticipatory; alert to establishing rapport; naive; analytic;
paradoxically bilateral (dominant but also submissive); nonreactive;
nondirective and patiently probing. Glesne and Peshkin also describe time
management as another essential skill of the interviewer, in particular, noting
when a topic has been exhausted and further discussion will yield little new
information.
Glesne and Peshkin (1992) suggest that interviewing more than one person
at a time sometimes proves very useful; and that some young people may
need company to be emboldened to talk, and some topics are better
discussed by a small group of people who know each other.
There are some specific issues with regards to interviews in the school
context. The interpersonal conditions (Murray & Lawrence, 2000) of the
classroom and department may be compromised by the privileged position
the researcher holds and may be a source of bias and contamination of data.
Trust and respect are also key issues in the research, especially with Pasifika
research participants (Anae, Coxon, Mara, Wendt-Samu & Finau, 2001).
Finally, language is also an issue as participants in the research have
English as a second language.
Developing statistical literacy with students and teachers in the secondary mathematics classroom. 73
Data can be collected using video and note taking. Glesne and Peshkin
(1992) state that note taking should not interfere with the discussion and that
notes should be complete and useable in the event the video is not working.
Roschelle (2000) states that videoing allows multiple opportunities to observe
an event.
3.4.2 Classroom Observations
Classroom observations can be used in research to get a picture of what is
occurring in the classroom as lessons and strategies are trialled. The
observations enable there to be a clearer understanding of trends and
patterns over time (Cohen et al., 2000). Another benefit of the observations
being over an extended period of time is that there will be less of a chance of
those selective observations being purely anecdotal and that “thick
descriptions” (Cohen et al., 2000, p.311) of the situation are possible.
The observations can be unstructured. In unstructured observations the
situation is observed before decisions are made about directions for
research. However, in this case the research questions will mean that the
observations are more structured and selective. Trustworthiness can be
increased by the use of a combination of observation techniques such as
video and observation notes and logs. The observations can also be shared
with the other teacher participants to get a wider picture of events or an
explanation of particular events (Roschelle, 2000).
3.4.3 Artefacts
Teacher generated and student generated artefacts can also play a part in
the research. Student artefacts can take the form of assignments, tests,
work from exercise books and journals while teacher artefacts can be lesson
plans, notes and teacher generated materials (Hendricks, 2006). Artefacts
can be original documents, facsimiles or even photographs of items.
The collection of artefacts gives the teacher participants materials to focus on
when discussing what happened in the study in follow-up interviews. At the

Developing statistical literacy with students and teachers in the secondary mathematics classroom. 74
same time, using materials from students “...can help determine the
effectiveness of an intervention continuously throughout the study”
(Hendricks, 2006, p.74). This is particularly useful to this study because it
allows the teachers to alter and refine the intervention during the unit of work.
3.4.4 Triangulation
All of the aforementioned data collection methods have been chosen to give
the research a chance to describe the complexity of the situation. This
process is sometimes characterised as triangulation. This research has
embraced an action research paradigm. Therefore, no attempt has been
made to triangulate the research by choosing alternative theoretical
standpoints or methodologies. However, triangulation has been attempted
through the collection and analysis of multiple forms of data (Cohen et al.,
2000; Hendricks, 2006).
The data collection methods of student interview, teacher interview and
observation will hopefully allow for data from various perspectives. However,
there are obvious limitations to this approach. Much of the theorising has
been done by me as the principle researcher. Likewise, the majority of the
analysis will be completed by me. Therefore, triangulation is not used as the
sole provider of reliability and validity in this research but may work towards
satisfying some of the democratic validity and process validity concerns
described by Anderson et al. (1994).
3.5 Data Analysis
As already alluded to, action research can involve using multiple sources and
techniques in the data gathering process (Cohen et al., 2000). Tools to
collect data can include interviews, documentation review, observation, and
even the collection of physical artefacts. The selection of appropriate data
collection methods can help towards ensuring validity for the study.
However, another important part of the action research process is the
analysis and evaluation of the data.
Developing statistical literacy with students and teachers in the secondary mathematics classroom. 75
A feature of action research is that the analysis phase can begin concurrently
with the data collection (Cohen et al., 2000). A real strength of an
emancipatory action research model is that much of the data analysis is
collaborative. Working together not only enables the teachers involved to
generate knowledge about their setting but also makes it possible for the
action research to become educational for the teachers involved.
With action research the data can be analysed using an open ended
approach. In such an open ended approach the data can be analysed with
respect to the questions and the theories posed by the researcher as well as
theories of what is occurring that can come out of the data itself. This is a
grounded theory approach (Cohen et al., 2000) where the analysis of the
data comes from looking at the data. Again, with emancipatory action
research there is a possibility that theories can come from any of the
participants. The discussion between teachers is therefore very important
and can go a long way to ensuring process validity.
Grounded theory data analysis can be done by a comparison to a number of
factors. This is called a constant comparative approach (Cohen et al., 2000).
The data can be analysed by comparing between the differing views of
participants, between lessons, comparisons of change over time for teachers
and students in terms of practice, knowledge and achievement and
comparisons between data and the theories.
A constant comparison approach to data analysis looks to discover key and
recurrent themes that may emerge from the data (Cohen et al., 2000). The
themes can then be used to find, classify and compare incidents the data so
a clear account can be given of the research.
The analysis and evaluation of the data must be concerned with
trustworthiness. By using a grounded theory approach it is hoped that the
‘real story’ can emerge from the research. However, these theories and
themes are already present in my own investigations. It has to be
acknowledged that this thesis remains my telling of the situation and that my
story is not the whole story.

Developing statistical literacy with students and teachers in the secondary mathematics classroom. 76
The analysis of the different data collection strategies also has implications
for the research. The information collected from meetings, interviews and
discussion is raw data. The principal researchers' task is to prepare a
statement regarding the collected data. The first step is to transcribe the
entire interview. This will provide a complete record of the discussion and will
facilitate analysis of the data. However, the next critical step is the analysis of
the content. The aim of this analysis is to look for trends and patterns that
reappear within either a single events or in multiple events in the data. The
emphasis or intensity of the respondents' comments should be considered.
3.6 My place in the research
…we are each always already positioned and yet have
agency to (re)position ourselves in the theory, practice
and discourse of educational research.
(Wright & Lather, 2006, p7)
I too am positioned in the discourse of educational research. In this research
I focus on the experiences of teachers and students in three mathematics
classes in a high school mathematics department. The goals of the teachers
involved in this study were to make changes to their classroom practice
towards more effective teaching of statistics and statistical literacy at the
Year 9 and 10 levels.
In the review of the literature in Chapter 2, I attempted to describe how these
goals could be met inside a statistics education discourse. However, the
school is a low decile, co-educational secondary school in Auckland and the
school population is culturally and linguistically diverse. Therefore, I have
attempted to discuss ways of achieving the set goals in terms of literacy
theory and practice. I have also attempted to describe a critical discourse,
with strong links to critical literacy theories from a language acquisition
background (Kalantzis & Cope, 1999; Freebody & Luke, 1990; Knobel &
Healy, 1998) and more tentative links to a critical mathematical literacy
(Frankenstein, 1998; Skovsmose & Borba, 2000). Finally, I have investigated
possible pedagogical approaches and principles that could be adopted by
Developing statistical literacy with students and teachers in the secondary mathematics classroom. 77
teachers to develop statistical literacy with students (Kazemi & Franke, 2004;
Ministry of Education, 2007a).
Ultimately the research is affected by my core beliefs about education. My
reason for undertaking this research, and the reason why I believe the other
teachers participated in the research, is the belief that education is
fundamentally about relationships between teachers and learners. This
research hopes to investigate aspects of those relationships.
In contrast to a naturalistic perspective, I am also a mathematics teacher who
has been trained in the scientific method. Mathematics is often described as
being situated in a realist, positivist paradigm. Therefore, for a group of
mathematics teachers undertaking research in the mathematics classroom
research could become a process where a hypothesis is adopted around
statistical literacy, the hypothesis is tested against predominately quantitative
data collected and conclusions drawn. In fact the statistical enquiry cycle of
Wild and Pfannkuch (1999) described in this thesis is a case in point. The
statistical enquiry cycle was a much more recognisable process for us as
mathematics teachers than the qualitative action research approach that was
used. It took some effort to resist adopting some statistical procedure to test
the efficacy of interventions with control groups and random selection. All of
this could be achieved without developing or nurturing any of the
relationships in the classroom.
However, ontologically it is my belief that knowledge gained from research in
the classroom is dependent on the context, the participants and that the
process is what Cohen et al. describe as “personal, subjective and unique”
(Cohen et al., 2000, p.6). Therefore, adopting a positivist, scientific, or even
a solely quantitative research paradigm or methodology such as those used
in the study of mathematics and science does not fit with my notion of
research in the classroom. Epistemologically I see any knowledge gained is
constructed personally and in interactions with others. I am not interested in
a study where the object of study is independent of the researchers or where
knowledge is discovered and verified through measurements and
observation from afar.
Developing statistical literacy with students and teachers in the secondary mathematics classroom. 78
I believe that the nature of research questions suggest an in-depth study of
the situation. Any attempts to use a scientific research paradigm, such as
having control classes excluded from any intervention to quantify progress,
were quickly rejected on both ethical and philosophical grounds. Since the
teachers involved are undertaking this project to improve the situation the
idea of excluding students from any possible benefits seems unethical
regardless of whether any benefits could be shown or not.
Implicit in an action research methodology is the notion of a cycle of problem
definition, data collection, analysis and planning, monitored action, reflection
leading to a phase of redefinition that restarts the cycle (Burns, 1994). Such
a cycle is suited to the exploratory nature of this project and its essential
open-endedness. The adoption of an action research framework is also in
keeping with a desire to enhance teacher professionalism by according the
teachers the role of reflective and collaborative generators of their own
professional knowledge.
3.7 Research design and method for this thesis
The following sections outline the particular setting of this research and its
participants. There is an explanation of the data collection methods chosen
and how they operated in the research context.
3.7.1 Focus of this thesis The focus of this research is developing statistical literacy in the secondary
mathematics classrooms within an action research cycle. The main research
question adopted by the teachers in this research project was:
How can we help students and teachers develop statistical literacy in
the secondary mathematics classroom?
This main research question created other supplementary questions that we,
the teachers, also felt were necessary to consider. The supplementary
questions include;

Developing statistical literacy with students and teachers in the secondary mathematics classroom. 79
What are teachers and students views about the nature of statistics
and statistical literacy in the Mathematics [and Statistics] curriculum?
What is needed to facilitate the development of statistical literacy with
students and teachers in secondary mathematics classrooms?
How can we assess statistical literacy with our students?
How can using language learning principles help students and
teachers to develop statistical literacy in secondary mathematics
classrooms?
How can using the ‘principles of effective teaching for learners from
diverse language and cultural backgrounds’12 help students and
teachers to develop statistical literacy in the secondary mathematics
classroom?
What are the appropriate professional development strategies for
teachers to use in this context?
As mentioned earlier, the research questions have an influence over the
research design and methods of data collection. The study explores both
teachers’ and students’ views about the nature of statistics and statistical
literacy. The research hopes to find ways to facilitate the development of
statistical literacy with students and teachers in secondary mathematics
classrooms and will signal possible professional development strategies for
teachers to use in similar contexts. Therefore, an understanding of both the
students and teachers in the research is needed.
3.7.2 Participants
The participants are the key to success in this research. This action research
project involves self-selecting teachers. I am describing myself as the 12 Taken from ESOL online and the DVD Making Language and Learning Work 1: Integrating Language and
Learning in Secondary Maths and Science
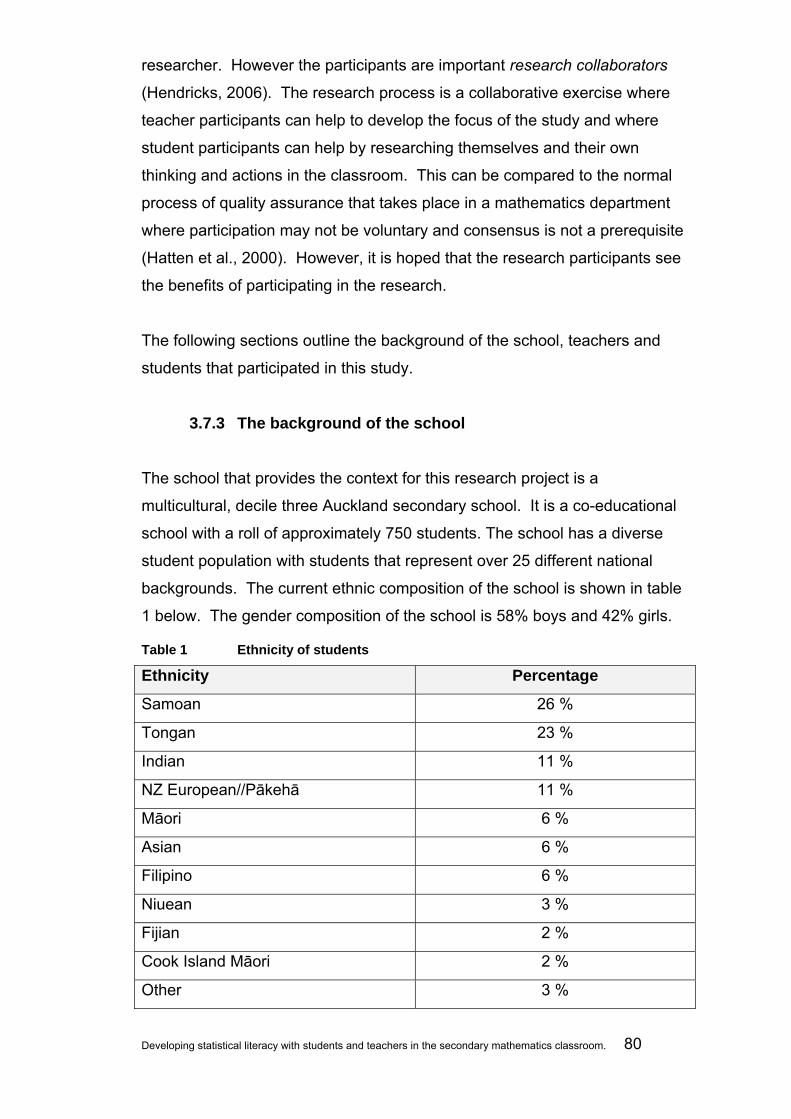
Developing statistical literacy with students and teachers in the secondary mathematics classroom. 80
researcher. However the participants are important research collaborators
(Hendricks, 2006). The research process is a collaborative exercise where
teacher participants can help to develop the focus of the study and where
student participants can help by researching themselves and their own
thinking and actions in the classroom. This can be compared to the normal
process of quality assurance that takes place in a mathematics department
where participation may not be voluntary and consensus is not a prerequisite
(Hatten et al., 2000). However, it is hoped that the research participants see
the benefits of participating in the research.
The following sections outline the background of the school, teachers and
students that participated in this study.
3.7.3 The background of the school
The school that provides the context for this research project is a
multicultural, decile three Auckland secondary school. It is a co-educational
school with a roll of approximately 750 students. The school has a diverse
student population with students that represent over 25 different national
backgrounds. The current ethnic composition of the school is shown in table
1 below. The gender composition of the school is 58% boys and 42% girls.
Table 1 Ethnicity of students
Ethnicity Percentage
Samoan 26 %
Tongan 23 %
Indian 11 %
NZ European//Pākehā 11 %
Māori 6 %
Asian 6 %
Filipino 6 %
Niuean 3 %
Fijian 2 %
Cook Island Māori 2 %
Other 3 %

Developing statistical literacy with students and teachers in the secondary mathematics classroom. 81
3.7.4 The background of the teachers
There are approximately 50 teachers working in the whole school. Almost as
diverse as the student population, the teacher population represents people
from over a dozen different national backgrounds. There are seven teachers
in the mathematics department. The teacher profile of the department is just
as multicultural as the rest of the school. All teachers in the mathematics
department have mathematics qualifications and teaching qualifications.
Interestingly, no teacher, including myself, has statistics as their major
mathematics qualification.
Three teachers in the department participated in this research. I believe that
the teachers agreed to participate in the research because they wanted to
change their practice in the teaching of statistics and statistical literacy. I
believe that this was especially true after the signalling by the Ministry of
Education of curriculum change. Teachers in the department had
participated in department discussions on the implications of the curriculum
reform and had made submissions to the draft curriculum project in 2006.
Teacher A is an experienced teacher. He is a teacher of statistics in the
senior school and holds a position of responsibility in the department.
Teacher A was born and educated in Fiji. He moved to New Zealand in the
1990’s. Teacher A has been teaching for over 10 years.
Teacher B is also an experienced teacher. Teacher B was born and raised in
Tonga. Like all the teachers that participated in the research, he is
multilingual and has a keen interest in helping students deal with the
language demands of teaching and learning mathematics.
Teacher C is new to the New Zealand education system. She began her
teaching career in Tonga before moving to New Zealand. Teacher C has
been teaching 3 years.

Developing statistical literacy with students and teachers in the secondary mathematics classroom. 82
3.7.5 The background of the students and the classrooms
The student participants in this study were in Years 9 and 10. The students
range in age from 12 to 15 years old. Mathematics is compulsory for all
students in Years 9 and 10 with students having four 50 minute periods of
instruction per week. The school broadly bands students by ability at Years 9
and 10. The school uses language focused tests to band students on entry
into Year 9. The results from a series of asTTle [Assessment tool for
teaching and learning] diagnostic tests in English and mathematics are used
to reassess class composition in Year 10. The students involved in this study
represent a cross section of the school population with a learning support
class, middle band class and an extension class.
Mathematics is generally taught in the same block of classrooms in the
school where two of the four classrooms have pods of five computers with
access to the internet. Because classrooms are shared the arrangement of
classrooms and desks are very similar with desks in pairs facing the board at
the front of the room.
Teacher A’s class was a Year 10 extension class of 32 students. Teacher
B’s class was a Year 9 learning support class of 24 students. Teacher C has
a middle band class of 28 students.
3.7.6 Data collection methods
The planning for this research project involved evaluating the participant
teachers and my, understanding and capabilities in statistics and statistical
literacy. We attempted to map the demands of statistics and statistical
literacy on students and teachers. I specifically looked at the research and
accounts of studies that reported on ways in which statistical literacy could be
integrated in literacy-related teaching and learning. I reported this research
back to the other teachers involved and then we analysed gaps between
possible practices and current capabilities and what we agreed would be an
achievable target for instruction. We identified needs in terms of materials
and resources as well as professional development needs. We then
Developing statistical literacy with students and teachers in the secondary mathematics classroom. 83
attempted to design classroom interventions and customised professional
development to address these gaps.
The data collection for this research project involved:
• Interviews with teachers
• Interviews with students
• Observations of lessons
• The collection of artefacts from both teachers and students
As per an action research methodology, preliminary data analysis occurred
throughout the research study. Reflection, redefinition and conclusions
involved identifying what worked and what did not work in the classroom.
This enabled the group of teachers to identifying some implications for future
units and possible teacher professional development in respect of statistical
literacy and literacy teaching and learning. We also endeavoured to reflect
on the challenge posed by the task of designing and implementing strategies
for integrating statistical literacy into our secondary school Mathematics
programmes. Finally, the publication possibilities to disseminate findings of
the research undertaken were considered.
3.7.7 Data collection phases
The teachers started by first analysing their own notion of statistical literacy in
the current situation with respect to teaching and learning and then redefined
this understanding to create a new mutually shared understanding of
statistical literacy. Secondly, the researcher collaborated with the teachers in
designing and trialling a series of lessons intended to enhance students’
statistical literacy. Next, the teachers evaluated the process of
implementation with respect to teaching and learning to help design future
units for the development of statistical literacy and hopefully a method of
changing practice in instruction. This research methodology can be seen as
an adaptation of the work of Pfannkuch and Horring (2005). However, this
study documents only one cycle of planning and implementation whereas the
Pfannkuch and Horring study of Year 11 statistics teaching and learning
spanned 3 years.
Developing statistical literacy with students and teachers in the secondary mathematics classroom. 84
3.7.8 Interviews with teachers
The interviews with teachers were used to document both the initial problem
and planning phases of the action research and to document the first cycle of
reflection and evaluation.
Teachers participating in the research were requested to attend an initial
meeting of approximately two hours. It was hoped that this meeting and
subsequent follow-up interviews could be accommodated in normal non-
contact time in the school day or during normally scheduled meeting times.
Notes were taken by me as principal researcher as part of the data collection
for this research. However, this meeting was not particularly different than
any other planning meetings that normally take place in the department. One
of the ethical concerns of this research was the overburdening or overloading
of already busy teachers. Hence, special effort was taken to not place any
extra burden onto teacher participants in terms of time or workload. The
questions and themes addressed in this initial meeting can be found in
Appendix F.
The interview methodology was chosen to give opportunities for the principal
researcher and the teacher participants to talk about whatever arose during
this initial meeting. The intent was that the conversation would flow freely,
without the intrusion of a formal interview structure. It was hoped that the
teachers would see no distance between researcher and participant and that
they would see that they had control over the direction and focus of
conversations. This was very important as it was a central part of the
research that the teachers involved became to see themselves as teacher-
researchers themselves.
At the end of the unit of work a follow-up interview took place with all the
teacher participants meeting in the department offices. Again, the interviews
were able to take place during normal non-contact or professional
development, appraisal and meeting times. However, because of the
limitations of the school timetable one teacher was unable to attend without
having a class covered by another teacher. Special thanks must also go to
Developing statistical literacy with students and teachers in the secondary mathematics classroom. 85
other members of the department who covered this lesson. It is
acknowledged that this was an imposition and we were thankful for their
support of our endeavours. The interview questions and themes can be
found in Appendix G.
The information collected from the group interviews was raw data. Notes
were taken during the initial interview while the final interview was videoed.
Afterwards the final interview was transcribed from video and from notes
taken. Hopefully, this provides a complete record of the discussion and
facilitates analysis of the data. The aim of the analysis is to look for trends,
themes and patterns that reappear within the data.
3.7.9 Classroom Observations
Classroom observations were undertaken for one or two lessons per week
per class over approximately a six week period. The lessons took place
during the third term of the school year. Some selection of classes was done
so that there was time before or after the lesson to talk with the teacher about
what was happening. However, the timetable structure did not always allow
this to happen.
I spoke to all observed classes before video recording at the start of the
consent process. When observations began I again spoke to the class and
spent some time allowing them to become comfortable with the presence of
another teacher and researcher. My role as Head of Department [HOD] for
Mathematics in the school made this easy with Year 10 students because
most of the students were used to seeing me in their classrooms in the
previous year. It was somewhat more problematic with Year 9 students
where I had to rely much more on the teacher to help develop a comfortable
and trusting working relationship. I was aware that it was important for the
teachers to be in control of what is going on in their classrooms and for the
teachers themselves to determine the best possible learning experiences for
their students. Therefore I took the lead from the teacher about when and
where I could video.
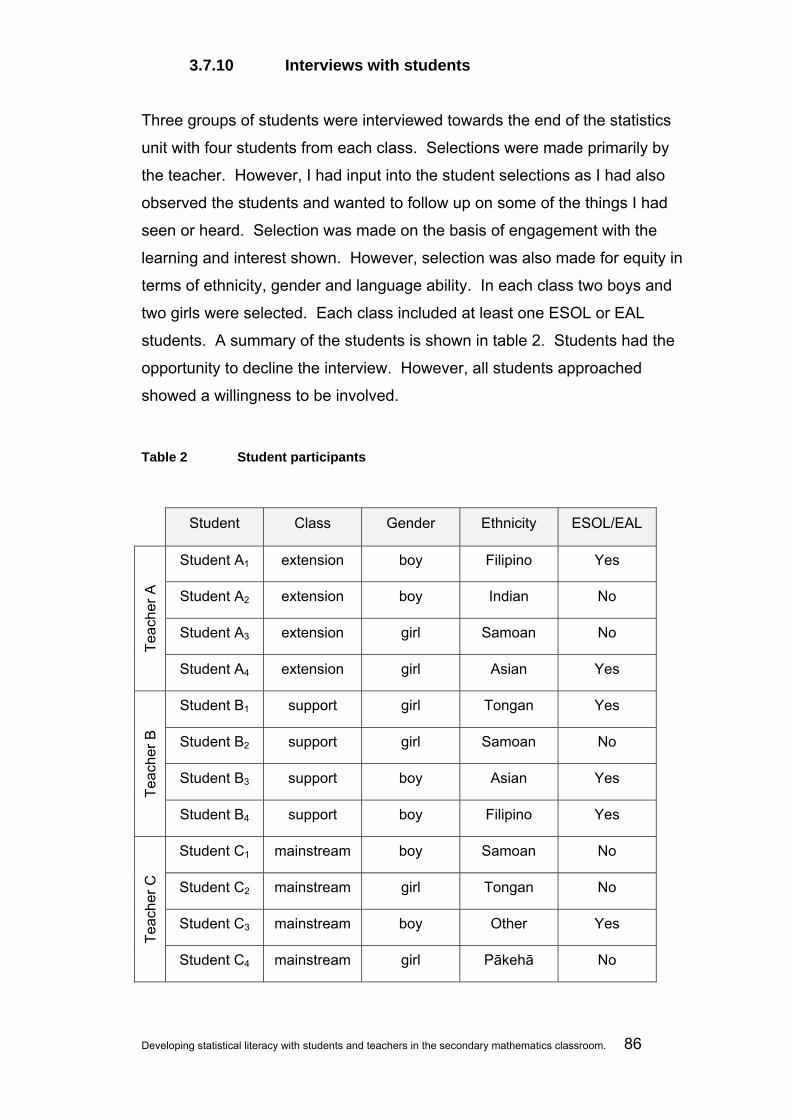
Developing statistical literacy with students and teachers in the secondary mathematics classroom. 86
3.7.10 Interviews with students
Three groups of students were interviewed towards the end of the statistics
unit with four students from each class. Selections were made primarily by
the teacher. However, I had input into the student selections as I had also
observed the students and wanted to follow up on some of the things I had
seen or heard. Selection was made on the basis of engagement with the
learning and interest shown. However, selection was also made for equity in
terms of ethnicity, gender and language ability. In each class two boys and
two girls were selected. Each class included at least one ESOL or EAL
students. A summary of the students is shown in table 2. Students had the
opportunity to decline the interview. However, all students approached
showed a willingness to be involved.
Table 2 Student participants
Student Class Gender Ethnicity ESOL/EAL
Teac
her A
Student A1 extension boy Filipino Yes
Student A2 extension boy Indian No
Student A3 extension girl Samoan No
Student A4 extension girl Asian Yes
Teac
her B
Student B1 support girl Tongan Yes
Student B2 support girl Samoan No
Student B3 support boy Asian Yes
Student B4 support boy Filipino Yes
Teac
her C
Student C1 mainstream boy Samoan No
Student C2 mainstream girl Tongan No
Student C3 mainstream boy Other Yes
Student C4 mainstream girl Pākehā No
Developing statistical literacy with students and teachers in the secondary mathematics classroom. 87
Student interviews took place during lesson time. Lesson time was seen as
critical for learning by the teachers involved and it was acknowledged that
interviews in class time would be disruptive to students. However, because
the teachers include time for student evaluation in their normal teaching the
time taken for interviews was accepted. Every effort was made to minimize
disruption to student participant’s class work and preparation for
assessments. This was done in consultation with the classroom teachers
and students involved. The interviews took no longer than one lesson of
class time. The interviews took place in empty teaching spaces and were
videoed.
3.7.11 Artefacts
Examples of student work were also gathered, along with teacher produced
materials. This collection of artefacts tended to occur after particular
incidents in the classroom that I or the classroom teacher had noticed. Both
teacher and student artefacts are identified in the research by the teacher’s
class that they came from.
3.7.12 Ethical issues
There were a range of ethical concerns raised by this research. Care was
taken not to overburden or overload already busy students and teachers. A
reason for choosing Year 9 and 10 classrooms for the investigation was that
there are no external assessment pressures such as National Certificate of
Educational Achievement [NCEA]. However, lesson time was seen as critical
for learning and every effort was made to minimize disruption to teacher and
student participants.
The research site is a diverse school with a strong Pasifika flavour.
Reference was made to the Pasifika Education Research Guidelines; Final
Report (Anae et al., 2001) which state that it is important to allow participants
the opportunity to view transcripts, audiotapes and videotapes so that
participants can build trust in the researcher and the integrity of the research.
I believe this sits well with an Action Research model that seeks to be
collaborative as well as self reflective.
Developing statistical literacy with students and teachers in the secondary mathematics classroom. 88
Many students have English as a second [or third/fourth] language. Care
was taken to make sure that all students understood the research information
and consent process. This was achieved by using peer translators and the
teachers themselves. With videoing lessons I made rearrangements to
normal classroom seating plans and organisation to ensure that no non-
consenting student in the class was included in video footage.
3.7.13 Approval from University of Waikato Ethics Committee
The ethical procedures set down in the Human Research Ethics Regulations
(The University of Waikato, 2005) were followed in this study. Application
was made to the University Of Waikato School Of Education Ethics
Committee for ethical approval for this supervised Postgraduate research
project. Approval was granted for the project.
3.7.14 Informed consent from the school, teachers and students
Consent was initially sought from the Principal for research to take place in
the school. An information letter and consent form was given to the Principal
[Appendix A] to gain consent from the school. Teachers [Appendices B and
D] and students [Appendices C and E] in the classes involved were also
given an information letter and consent form to take home. As some of the
possible participants were under the age of 16 at the time of the study I also
asked for parental consent.
The consent outlined that the content of any interviews, video or recording
remain confidential to the researcher and my academic supervisors and to
the research participants. Permission and consent was sought for use of any
artefacts. Participants were informed that readers of the research study or of
any reports resulting from the study will be unable to identify individual
students, teachers, classes or the school involved and that pseudonyms
would be used so that no teacher, student or school name will appear in any
publicly available report or article without the agreement of the respective
Developing statistical literacy with students and teachers in the secondary mathematics classroom. 89
student, teacher or the school. The consent forms stated that participation
was voluntary and that consent could be withdrawn at any time without
reason.
There were three issues that caused concern and discussion during the
consent process. The first was my role as principal researcher and the
conflicts that this had with my usual role as HOD in the department. For
example, one of my responsibilities as HOD of the mathematics department
was the lead in the appraisal and attestation processes for other members of
the department. That process had already begun in 2007 before I left on
study leave. I was aware that a potential unequal power relationship could
exist between teachers and HOD as in the relationship between appraiser
and appraisee where the appraiser is also the HOD. Participation and
responses may have been affected by this relationship. However, there were
factors that mitigated the situation. The fact that I was on study leave from
the school was important. The teachers involved could see that I was
interested in what was going on in the classroom with statistical literacy. The
appraisal and attestation duties were completed by the acting HOD while I
was on study leave. Finally and most importantly, it had not been a feature
of the relationships with my department colleagues in the past.
Secondly, there was the issue of my own place in the research. There was
an acknowledgment that while it was hoped that the research would benefit
the students, the research would also be of personal benefit for me in my
studies. It was important that the teachers felt that there was no pressure on
them to gather data just for me, as I was using the research towards my own
personal qualification. This was mitigated somewhat by the teachers own
desire to change practice and professional learning.
The final issue raised during the research was anonymity and confidentiality.
There was a hope that the action research would result in some positive
changes to the teaching of statistical literacy. Some of the teachers
expressed an interest in sharing their results with a wider audience than the
group itself. It was conceded that if this was the case it may be difficult to
ensure anonymity for teacher participants in the future as participants that

Developing statistical literacy with students and teachers in the secondary mathematics classroom. 90
chose to remain anonymous may be identifiable through association with
those participants that wished to have their real names used in any future
published materials. However, as the consent agreement states [see
Appendix C] there will be no way a reader of the research study or of any
reports resulting from the study will be able to identify the responses of
individual participants.
These consent issues were addressed throughout the research process,
from the ethics approval process to the consent process both in the initial
phases and throughout the research process.

Developing statistical literacy with students and teachers in the secondary mathematics classroom. 91
Chapter 4: Analysis and results
4.1 Introduction
The initial results and analysis from the first cycle of the action research are
presented in this chapter. For organisational purposes the findings have
been documented chronologically. The timeline is taken from the parts of the
action research cycle: problem, planning, action and reflection. The first
sections, 4.2 and 4.3 expand on the problem and planning phases where a
plan of critically informed action was developed to improve practice. Section
4.2 explores the data collected in the initial planning meeting with the other
teacher participants. Section 4.3 describes the planning phase for the
statistics unit for the Year 9 and 10 mathematics classes. Sections 4.4 and
4.5 of this chapter attempt to document the action phase of the action
research. Section 4.4 looks at data collected from classroom observations
during the statistics unit as well as data from other sources such as student
and teacher artefacts and discussion with teachers gathered during the
action phase. The last two sections in this chapter document the reflection
phase. Section 4.5 looks at the students’ perceptions of statistics and
statistical literacy as well as their response to the teaching programme.
Section 4.6 is an analysis of the data collected in the teachers’ interview
undertaken at the end of the statistics unit.
At the same time as documenting the different phases of the action research
cycle I have attempted to describe the dominant themes that have emerged
from the data. As mentioned in the methodology chapter, these themes
emerged during my initial research and literature review as well as in
response to discussions and observations between teachers during the
actual teaching and learning interventions. Most of the themes came from
the research questions posed. Further themes emerged when I looked at the
data collected. The dominant themes highlighted in this chapter are:
• The concepts of statistics held by students and teachers,
• The concepts of statistical literacy held by students and teachers,

Developing statistical literacy with students and teachers in the secondary mathematics classroom. 92
• The adoption of particular teaching principles as an aid to teaching
statistical literacy,
• The importance of language and literacy in statistics, and
• The difficulties of adopting a critical literacy stance in the statistics
classroom.
4.2 Themes emerging from Initial meeting The initial planning meeting took place at the end of term two in 2007. I met
with the other participating teachers in a normal Mathematics department
meeting time after Monday after school. The first part of the meeting was an
explanation about the intent of the research and how I wanted to document
the teaching of statistics and statistical literacy by a group of teachers in our
department. I then presented some ideas about statistics and statistical
literacy to the group. My presentation of statistical resources and models of
teaching led to a discussion around teachers’ views on the nature of statistics
and statistical literacy. These views were then examined in relation to: our
current programme, the current and proposed Mathematics and Statistics
curriculum, literacy practices in the school, and teaching styles.
4.2.1 Concepts of statistics
As this was our first formal meeting for the action research I felt some
obligation to set the scene for the research. While meetings to discuss
scheme planning are a normal occurrence I did feel it necessary to try and
advance, and advocate for, many of the ideas about statistics and statistical
literacy that I had found during the research and literature review process.
As an action research project there was also the need to introduce materials
that could bring about change in the teaching of statistics. I therefore bought
a wide range of materials to the meeting to encourage discussion.
These included curriculum materials, our current scheme and unit plans,
materials gathered from out of school professional development sessions
hosted by the mathematics advisor, web based materials from Census at

Developing statistical literacy with students and teachers in the secondary mathematics classroom. 93
Schools13, Numeracy in the News14 , Assessment Resource Bank [ARB]15
materials and a video clip taken from www.TED.com of Hans Rosling16.
I had clearly brought my own perspectives about statistics and statistical
literacy to the meeting. However, it quickly became apparent that there were
different attitudes towards statistics and a variety of conceptions of statistical
literacy amongst the group.
All the teachers involved were generally positive about the teaching and
learning of statistics. I have not always found this to be the case with
secondary mathematics teachers.
Teacher A was generally very positive about statistics teaching in the
classroom. However, teacher A had changed his attitude towards teaching
statistics over time.
Teacher A I didn’t really use to enjoy teaching statistics. But now after teaching the
Statistics and Modelling course17 I understand what we are doing and where
we are going. I used to not like the lack of exact answers [in statistics] but
now it is some of the most enjoyable stuff I do.
Teacher B was extremely positive about the statistics part of the mathematics
programme and looked forward to the statistics topic.
Teacher B Statistics is a chance for the students to get more involved. I want them to
do investigations.
As a teacher new to the New Zealand school system, Teacher C was unsure
what was expected from students at the Year 9 and 10 levels. She was
interested in the research project as a way to come to grips with the New
Zealand curriculum.
13 The Census at Schools is a biannual census and further teaching and learning resources for the classroom. 14 Numeracy in the News is a web-based resource of statistically related newspaper articles. Numeracy in the
news is based in Australia http://ink.news.com.au/mercury/mathguys/mercindx.htm. 15 The Assessment Resource Banks [ARB’s] are collections of assessment materials available on-line for use in
schools. The ARB’s are hosted by the New Zealand Council for Educational Research [NZCER] 16 Hans Rosling is a public health medical researcher from Sweden who argues passionately for the better use of
statistics to inform people about key issues. 17 The Statistics and Modelling course is a NCEA Level 3 subject taken by Year 13 students.

Developing statistical literacy with students and teachers in the secondary mathematics classroom. 94
Teacher C This will be good for me as I need to know what you do here and how it
compares with what we do in Tonga.
We started the meeting by viewing the Hans Rosling video clip. In the clip,
Hans Rosling uses different data representations to tell stories about world
health and population data. Rosling uses technology to bring the statistics
alive. There is extensive use of scatterplots and graphs of distributions to
look further into the data. There was a lot of discussion in response to the
clip. The clip was seen as inspirational for the teachers rather than
aspirational for students. The initial reactions were that the subject matter
was beyond most students and that the approach was too difficult and
unrealistic for use with Year 9 and 10 students. While the content involved
was within the curriculum objectives of the scheme and the software used
were available to the group the teachers felt that trying to tailor similar
activities for Year 9 and 10 students would not be possible. Teacher B’s
comment summed up the mood of the meeting.
Teacher B My students couldn’t do that.
However, there was some agreement about the potential for motivation and
engagement by using such a statistical literacy approach. For example;
Teacher A But that is what my class would want to do – if they could spend the whole
period arguing they would.
My reason for including the Hans Rosling clip was that it fit with my definition
of statistical literacy where statistical reasoning and thinking are a part of a
wider statistical literacy. The clip focuses on real-life data and engages with
the viewer with contexts that demand more that just statistical competency.
The clip is a wonderful example of how the analysis of data requires not only
an understanding of statistics but general knowledge and an understanding
of context as well.
Here a difference in beliefs about teaching statistics amongst the group was
highlighted. The move from teaching statistical skills to teaching statistical
literacy or critical thinking skills was seen as a real challenge for both the
teachers and students. For example Teacher C typified much of the
discussion when she commented.
Developing statistical literacy with students and teachers in the secondary mathematics classroom. 95
Teacher C When will we teach them how to calculate the statistics?
Questions and responses such as the one above showed how persistent the
idea that statistics could be taught as transmitting of a range of arithmetic or
mathematical skills. This concept is further discussed in the planning phase
in Section 4.3.
There was a tension within the group between statistics as a set of
techniques and statistics as a tool for change. Teachers felt that it was their
responsibility to teach statistics first before they attempted to teach general
knowledge. The responsibility for teaching the wider contexts was seen as
the responsibility of other learning areas. As Teacher B states;
Teacher B That is more like Social Studies.
Teacher B also felt that using data in such a way was value laden and could
leave us open to criticism as teachers for pushing particular points of view
about social issues.
Both sides of the debate were articulated by the teachers. Both Teacher B
and C teachers were interested in developing units of work that focused on
mathematical processes and thinking as well as delivering content. There
were various reasons given for wanting this. A key reason was the belief that
students did not understand the concepts behind the skills and that by
contextualising problems it would be possible for students to gain greater
understanding of the statistical ideas. Teacher B’s comment was typical of
the discussion.
Teacher B The students often do stuff that they don’t understand. They can give you
the right answer but don’t have any idea what it means.
The impact of information technology was also seen as a major influence on
how statistics could be taught or learnt. Teachers felt that the availability of
appropriate technology had made many of the skills and techniques
previously taught obsolete. With time free in the unit to focus on more than
calculations and graphing, teachers felt lessons could be filled with tasks that
dealt with greater amounts of data and more time for analysis.
Developing statistical literacy with students and teachers in the secondary mathematics classroom. 96
Teacher A The computer can do all that [calculating statistics, drawing graphs] for you
now anyway.
Teachers also expressed concerns about the suitability of using real-life
contexts and data in classes and the maturity of students. While the
teachers admitted that they were personally interested in wider issues, such
as those exemplified in the Hans Rosling clip, they did not see it as a
necessary part of a Year 9 and 10 statistics scheme.
We looked at the Census at Schools online questionnaire and the large
amount of associated materials taken from www.censusatschool.org.nz.
Teacher A and Teacher B had both taken part in the Census at Schools
programme in 2005. Census at Schools was seen as a positive addition to
the programme. Both Teacher A and B were keen to explain to Teacher C,
who had no experience of the resource, features of the Census at Schools
programme.
Positive features of Census at Schools were seen as wide and varied. The
teachers focused on the novelty of the resource, the greater motivation and
engagement of students, the real-life nature of the data and the potential for
linking across the subject and subjects.
Teacher B The students enjoy something different.
Teacher A It’s something real to have a go at. They can use their measurement skills
as well.
Teacher B It is real life data and it takes the kids heads out of the classroom.
This was in complete contrast to the previous conversation following the
Hans Rosling clip. Teachers A and B felt much more comfortable with the
resource because they were at the students’ level.
It was agreed that all students would participate in the online survey. Of
particular interest during the meeting was the data analyser function on the
website which enables users to create a variety of different graphical
representations to summarise and compare data. Some of the tools for
manipulating data on the website had not been extensively used in the
previous years.
Developing statistical literacy with students and teachers in the secondary mathematics classroom. 97
Computer use in the classroom highlighted two major concerns about using
the Census at School materials. Firstly, it was felt that there was a major
problem accessing computers in classrooms. As noted, there are a small
number of computers available in some of the mathematics classrooms. It
was felt that there would be classroom management difficulties if teachers
were expected to complete the parts of the unit with students working solely
on the computer. Secondly, teachers felt that they needed more time to
familiarise themselves with the program and support materials. In the
meeting the availability of computers was seen as the most pressing issue.
However, on reflection I am not sure if concerns about access to computers
were secondary to our lack of knowledge on how to integrate the use of
computers and computer applications into the classroom.
Much more palatable to the group was the Census at Schools activity Being
Typical18. This activity involved students going through a statistical
investigation cycle using data provided to them. The multivariate data is
taken directly from the Census at Schools database. The data is presented
on cards that can be manipulated by the students. There is scope in the
activity for students to develop a wide variety of questions using the same
data set. Watson and Callingham (1997) give a description of similar
activities. I had previously attended some professional development
sessions on how the activities could be used in class.
The focus of the data card activity from the Census at Schools was the
investigations cycle rather than evaluating statistics. However, it was agreed
that there were lots of opportunities for students to evaluate the work of
others in the class. There was an enthusiasm amongst the teachers for the
activity because it was seen that there would be more time to spend on
explaining and analysing of data.
Teacher B The kids will do less busy work from the textbook and spend more time on
the writing.
Teacher A This is making them [students] do more.
18 The Being Typical activity uses Census at School data from the 2005 round. I had had some excellent
professional development on using the Census at Schools data from sessions run by the Auckland mathematics
advisor, Pip Arnold.

Developing statistical literacy with students and teachers in the secondary mathematics classroom. 98
4.2.2 Concepts of statistical literacy
Throughout the research there was a tension between statistical literacy as
competency with data and statistical literacy as being critical with text. The
next resource that we looked at during this meeting was the Numeracy in the
News. The Numeracy in the News website uses newspaper articles taken
from Australia. On the site, there are a number of full-text newspaper articles
from The Mercury in Hobart, and other newspapers throughout Australia.
Most articles have linked questions for students and discussions for teachers.
The Numeracy in the News resources are overtly about statistical literacy.
The Numeracy in the News materials require the use of basic statistical skills
and literacy skills to interpret real life situations and contexts and make
judgments.
In the current school scheme the only identifiable achievement objectives for
statistical literacy were ‘discuss and recognise misleading graphs’. This had
previously been a one or two lesson exercise looking at textbook graphs that
showed how data could be displayed to mislead. The focus was on graphic
literacy.
There was some concern that too much time would be spent on this one
particular aspect. It was here that I tried to explain my position that this could
be in fact the core of the unit of work. This tended to stop the conversation
and discussion. In hindsight, I would see this as one of the many times
where my colleagues humoured me and out of politeness and chose not to
give their honest opinions.
However, concerns were raised about the use of the Numeracy in the News
articles. There were concerns in the group about the amount of text involved,
the reading levels of the text and the reading levels of students. These
concerns were voiced by all teachers.
Teacher C There is a lot of writing in some of these articles.
Teacher B Too advanced for Year 9 and 10 students at levels 3 or 5 [MiNZC
curriculum].

Developing statistical literacy with students and teachers in the secondary mathematics classroom. 99
There was also a concern that we, as mathematics teachers, may not have
enough skills to use such materials in class. This was typified by Teacher B.
Teacher B We don’t want to have to teach them to read.
Teacher A was much more comfortable about the materials and the
consequences for teaching. This may have been because of his experience
with literacy techniques gained as part of his involvement the school literacy
programme.
Teacher A We can use the Pasifika literacy stuff.
What the discussion of literacy showed was that there was an understanding
amongst the group that there were wider issues impacting on students than
just mathematical or statistical ones. A number of comments were made in
relation to this, including literacy skills, thinking skills, student motivation and
classroom management. The whole school focus on literacy was referred to
frequently as was the work done by the school’s Special Needs Coordinator
about lesson structure. These are described more in Section 4.3.
The differing response by the group to the Census at Schools data card
activity and the Numeracy in the News materials appeared to highlight the
mismatch between my concept of statistical literacy and the concept of
statistical literacy held by the other participants. I was pleased that the
Census at Schools investigation activity was warmly received. However, I
was disappointed about the lack of enthusiasm for the Numeracy in the News
materials. Again, this seemed to illustrate that my concept of statistical
literacy may have been inconsistent with the group definition of statistical
literacy. The other teacher participants were comfortable with teaching
statistics as the investigation process but were less comfortable with
statistics instruction as evaluating and critiquing statistical data and
information of others.
Developing statistical literacy with students and teachers in the secondary mathematics classroom. 100
4.2.3 Adoption of teaching principles
The discussion on how to introduce activities such as the Census at Schools
and Numeracy in the News resources led to a discussion of possible
pedagogical approaches. An article from Kazemi and Franke (2004) and the
principles from the Making Language and Learning Work 1: Integrating
Language and Learning in Secondary Maths and Science (Ministry of
Education, 2007a) resource were introduced. My hope was that they could
be looked at to see how they may integrate into the teaching of the statistics
unit.
The cognitive guided instruction model of Kazemi and Franke (2004) was
abandoned quickly by the teachers. It was felt that it was poorly introduced
and not particularly well understood. In hindsight, this was a key point where
the other participating teachers were able to bring the focus back to the
planning of the scheme. The teacher focus was on the teaching and learning
of statistics and not on my research interests. However, positive comments
were made about any focus on what students were thinking.
In contrast, the principles described in the DVD were seen as a good
template for teaching and particularly useful for teaching statistical literacy.
Again there was a certain amount of ‘being nice’ because the teachers could
obviously see that I had participated in the DVD resource. However, my own
interests’ aside, I believe that the principles in the DVD resonated with all the
teachers in the research. All the teachers articulated a conviction that
language was a key to success for their students.
Another perceived strength of the DVD resource was that all of the teachers
had participated in some whole school professional development looking at
the principles. How the principles were to be enacted in the scheme is
discussed in the following section.

Developing statistical literacy with students and teachers in the secondary mathematics classroom. 101
4.3 Themes emerging from the planning of the unit
In the final part of the first meeting/ interview the teachers undertook the
planning of the unit. We discussed the present scheme and its links to the
national curriculum document. We looked at the time allocation and
assessment for the unit of work. We then looked at the proposed curriculum
draft and discussed the implications. The group expressed a level of
frustration of the present statistics programme.
Teacher B You know, each idea, like mean median, range is straightforward. But our
students find it difficult to put it altogether. Teacher A It is because of the way that we teach it
Teacher B We teach it all too much lesson by lesson. I think we need longer
investigations to show the whole process is all connected.
This theme was revisited repeatedly in the meeting as in Teacher B’s
comment.
Teacher B It’s taught separately and students never link it to making decisions about
data and the question that you are trying to answer.
There were concerns expressed about teacher workload due to the
implementation of the new curriculum. All teachers voiced some trepidation
about the implications of curriculum changes in relation to statistics. In one
exchange all three teachers voiced concerns about the new curriculum.
Teacher A Does the new curriculum mean that ⅓ of what we do will have to be
statistics and probability? What will leave out? How will we allocate the
time to each topic?
Teacher B Not enough time already to complete everything at present
Teacher C We are very busy completing work now.
Time was an issue in the planning meeting. A decision was made that we
would take our existing scheme and modify in light of our discussions. The
meeting decided that I would make the alterations to the scheme documents
and present back to the group for comment. Both the existing scheme and
new scheme are shown in Appendix H.

Developing statistical literacy with students and teachers in the secondary mathematics classroom. 102
Most noticeable in the revised scheme of work was the move from skill based
activities and lessons to problem or task based lessons. However, the
scheme was not overly prescriptive as the scheme was to be used for
teaching as well as the research. Several suggestions were given for
resources that could be used, but teachers were free to find, create or use
their own resources.
It was established that there would be a shift from the existing scheme that
was focused on students as producers of statistics only to the proposed
scheme where students would aim to work as both consumers (and
evaluators) of statistics and as well as producers of statistics.
It was agreed that all the classes would participate in the Census at School
online questionnaire and that this would be the starting point for the unit of
work on statistics. All classes would also trial the Being Typical activity.
Finally all classes would trial some of the Numeracy in the News articles.
4.3.1 Language and literacy in the statistics classroom
The adoption of the language learning principles allowed literacy to be a key
focus for the statistics unit. The scheme included language objectives
alongside statistical objectives. This was seen as formalising in the scheme
document what had already been occurring in many classrooms.
Because of the importance placed on language, the teachers were open to
adopting some of the strategies and methods explored in the Making
Language and Learning Work 1: Integrating Language and Learning in
Secondary Maths and Science DVD (Ministry of Education, 2007a) and
accompanying resources available on-line. The teachers felt that the
principles could be used to aid the planning of the scheme. However, there
was a desire for some guidance on how to incorporate some strategies into
lessons. The principles are;
• Knowing the learner and their language background, their language
proficiency.
Developing statistical literacy with students and teachers in the secondary mathematics classroom. 103
• Identify the learning outcomes including the language demands
of the teaching and learning.
• Be explicit about the learning outcomes with the students.
• Using context embedded tasks which make the abstract
concrete.
• Provide multiple opportunities for authentic language use with
a focus on students using statistical language.
• Balance receptive and productive language
• Include opportunities for self-evaluation.
Other changes to practice were also identified in response to the principles.
Identifying the language demands of the lesson was to be done by all
teachers. The teachers agreed to write language aims as well as content
aims on the board at the start of lessons. Similarly, ‘Do it now’ tasks, tasks
for students to complete at the start of the lesson on entering the classroom,
were chosen to focus on particular language skills and language
interpretation. Resources were shared between teachers.
I believe that the emphasis placed on language and literacy in the planning of
the statistics unit was very significant. Remarkably, over the following weeks
each teacher offered examples of language focused tasks and scaffolding
materials from a wide variety of resources from reference books, off the shelf
literacy materials, internet resources, teacher handbooks and teacher
generated materials. While there was a prominence of vocabulary activities
teachers were also trialling language focused tasks to teach mathematical
content. Again, the agreement was that I would edit the scheme of work and
pass to teachers for comment and discussion. Many of these materials can
be seen in the scheme in Appendix H.
The scheme also provided more opportunities for authentic language use
with a focus on students completing their own investigations and analysing
statistics. The balance between receptive and productive language was
addressed by the scheme expecting students to focus on thinking and doing
statistics rather than focusing on content. Teachers were to be explicit about
language and modelling tasks. There was a commitment to use appropriate
Developing statistical literacy with students and teachers in the secondary mathematics classroom. 104
statistical vocabulary correctly in the classroom. It was hoped that with the
repeated usage of terms, statistical vocabulary and some of the concepts
associated with them could become a part of the students’ own statistical
language.
The investigations and activities to be completed by students were to be
supported by the extensive use of cloze activities, writing frames, exemplars
and templates to help students with writing. Many of the activities were
taken from publications such as the Effective Learning Strategies in Years 9
to 13: A Guide for Teachers Ministry of Education (2004a).
4.3.2 Critical literacy and the statistics classroom
While a consensus was reached for what would be included in the statistics
scheme, I personally felt that we had not gone far enough. While the
statistics unit did include much more analysis and evaluation of statistics I did
feel that we had not moved appreciably towards adopting a critical literacy
focus. I felt that the statistical investigation part of the scheme was
dominating the statistical literacy part. I also felt that an emphasis on
statistical investigation would allow a process view of statistics to persevere.
I wanted the students to have more opportunities to respond to statistical
data rather than generate. This is not because I do believe that statistical
investigation
We did all agree that more time would be needed for language tasks and real
life context problems. Hopefully students would spend more time evaluating
their own and others work including appropriateness of methods, data
displays and conclusions drawn from data. This was encouraging to me as
this seemed more like a notion of critical literacy.
Adaptation of materials was also an issue. For example, the Numeracy in
the News articles and questions are not designated for particular year or
curriculum levels. The articles range across data reduction, data
representation and data collection and sampling. The data reduction articles
look at how statistics are used to support conclusions. The data
Developing statistical literacy with students and teachers in the secondary mathematics classroom. 105
representation articles explore whether different graphical representation of
the same data tell the same story. Both of these are features of the
achievement objectives of the curriculum. The data collection and sampling
articles look at sampling from the population. However, sampling was not a
feature of the New Zealand curriculum at this level. Many of the articles had
a range of questions and applications. We needed to check the articles and
questions to find those that we thought were appropriate for particular
students and classes.
It was agreed that I would source the materials and organise for the other
teachers. This was no different than a normal unit of work where a teacher
would take responsibility for resources.
A recurring theme in the planning of the scheme was the availability and
training in the use of new resources. Any resource that provided teaching
materials or student materials was viewed with enthusiasm. The limitations
of the available textbook were acknowledged. However, the lack of any
replacement materials was seen as even more damaging to the good
teaching of the unit of work.
4.4 Classroom observations and data
Classroom observations were undertaken over six weeks of term 3 of the
school year. Classes were at different stages in the year plan. Teacher A’s
class was first to start the statistics unit. Teacher B and C started the unit of
work a week later. Over the six week period I observed eight lessons of
Teacher A, and six lessons of Teacher B and Teacher C. Data collection
was undertaken by all teachers. All the teacher participants observed
lessons of the other teachers at least once.
As the statistics unit progressed it became apparent to me that the data
collected by video not as useful as I had hoped. My lack of skills at using
video for observations meant that the video was often a distraction in the
class. Also my role as a participant observer was also a factor. My presence
in the class was difficult for some students. Despite the prolonged nature of

Developing statistical literacy with students and teachers in the secondary mathematics classroom. 106
the observations, the presence of the video camera never stopped being a
source of fascination and distraction for some students
Other data collection techniques such as photos, artefacts and notes became
just as important in documenting the research. As the project progressed
more and more of the artefacts came from the teachers as they noticed
student work changing or where they wanted to illustrate the pleasure or
frustration with student responses to activities.
Other important data collection occurred in the conversations between
teachers that happened straight after lessons. These spontaneous
conversations were not recorded. However, as the statistics unit progressed
I made an attempt to be more structured in these discussions and take notes.
4.4.1 Concepts of statistics
Initial comments from teachers about the statistics unit were very positive.
Participating teachers preferred the teaching unit to the traditional approach.
Importance was placed on the opportunity in the classroom for discussion
between teachers and students (Teachers A, B and C); on the more practical
real-life situations (Teachers A and B); and the view that it was a more
statistical way of teaching (Teachers A, B and C). The general agreement
was, as Teacher B stated after three lessons;
Teacher B It is better than just teaching skills.
All of the teachers felt that the students engaged more with the topic. There
were different theories suggested for this. Teacher B thought that students
were responding to something that was new. Teacher A felt that his students
liked the way of working.
As the statistics unit progressed teachers said that they were learning a lot.
All the teachers commented that there was a need for ongoing professional
development on things such as managing classroom discussions, reading
and writing. These comments were often made after lessons where the
teacher had attempted something new or different to their normal practice.

Developing statistical literacy with students and teachers in the secondary mathematics classroom. 107
All the teachers agreed that students were forced to use higher level thinking
skills often commenting that the students were operating at a higher
curriculum level than they would normally expect. Comparisons were made
with the demands made on students completing NCEA assessments in
Years 11 to 13.
In a data cards lesson, where students used writing prompts to help draw
conclusions about the data, Teacher A commented;
Teacher A This feels much more like what we would do with Year 12 and 13 students.
Similarly, Teacher C and Teacher B both commented about an activity on
writing summary and comparison questions
Teacher C This is very similar to AS 1.5. I could easily use these things with my
12MAB class.
Teacher B Really good preparation for NCEA Level 1
My own observation was that the work produced by these Year 9 students
was indeed better than some of the work achieved by Year 11 students.
During one lesson I shared this comment with Teacher B. Teacher B shared
this with his students who took it with some pride.
What was obvious was that the activities were well designed and provided
good hints for teachers on how to support students. The Census at Schools
data card activity is shown in Appendix I.
Both teachers and students commented on the success of the Census at
Schools data card activity. Teacher A remarked that the cards met many
good teaching principles such as concrete materials and working with
kinesthetic learners.
Teacher A Students want to touch cards.
There were some concerns expressed that the unit of work was pitched too
high. Teacher A commented;
Teacher A I would not normally give students so much data
Developing statistical literacy with students and teachers in the secondary mathematics classroom. 108
Teacher A changed this view later in the statistics unit. He commented that
more statistics was being done than previously because there was a focus on
both competency of statistical skills and statistical thinking.
Teacher A It felt that students could do two things at once.
This was backed up by the students. Students enjoyed using the data cards.
Students from Teacher B’s class commented that;
Student B2 The cards were really helpful. There was a lot of information.
Student B3 Having the data cards is easier than having to read the paragraphs or
books.
and in Teacher A’ class.
Student A2 The data is more vast this year than compared to last year. We got to do
more.
Again the success of the actual data cards was evident to both teachers and
students. However, there was evidence that much of the strength of the
activity was the use of language learning principles that enabled students to
produce much more writing than they would normally do. The activity
encouraged the use of “I notice …” and “I wonder …” sentence starters. The
teachers adapted these ideas into materials that could be used by students
working in pair and group activities.
In Teacher A’s class students wrote out a whole page of questions as “I
wonder…” statements. The students then swapped them with partners to
classify them into summary, comparison and relationship questions. In
Teacher C’s class the students worked in pairs to refine questions. In
Teacher B’s class the questions were collated and then used by the whole
class. An example of the “I wonder …” sheet used in Teacher B’s class is
shown in figure 13 below.
Some students were surprised at the amount of writing expected in this
activity. However, the use of scaffolds and pair tutoring did result in
significantly more being completed.

Developing statistical literacy with students and teachers in the secondary mathematics classroom. 109
Figure 13 I wonder… sheet
Teacher A commented that by expecting students to make multiple “I
wonder…” and “I notice...” statements meant that students had multiple
opportunities to practice skills that they would have previously only do once
or twice in the unit of work.
Pair and whole class sharing of questions were important ways of sharing
expectations with all students. Teacher C commented that much of the work
was being done by the students themselves and the pressure had gone off
her to provide all the guidance. There was evidence of students modifying
their own statements to meet the class expectation of an acceptable question
or statement.
Technology was not used extensively in the statistics unit. However, the
cards shown in Figure 14 and 15 below allowed students to quickly construct
different graphs and data representations to answer questions. All three
teachers felt that this was a positive feature as it allowed the students to
focus on what the data was showing rather than the skill of graph making.

Developing statistical literacy with students and teachers in the secondary mathematics classroom. 110
Time was still spent on graph construction in all three classrooms. However,
it was agreed that this was a lot less than what occurred in previous years.
Figure 14 Student investigations – comparing data.
Figure 15 Student investigations – summarising data.
The move away from graphing and calculating statistics allowed time for
preparing to write and writing statistical statements. The teacher had to
prepare for these activities. The teachers commented that this resulted in a
lot more time being spent preparing resources and teaching materials. While
this was seen as a negative and a hindrance to teaching in this way, the
teachers did see benefits to this as well.

Developing statistical literacy with students and teachers in the secondary mathematics classroom. 111
Teacher B The students are getting through more work. I am spending more time
discussing with students and asking questions.
The preparation of materials was a feature of the action research. Teachers
noticed that students needed different resources and support in the statistics
unit. The teachers then responded to those needs by providing additional
resources for the next lesson. These resources and ideas were shared
between teachers in the Mathematics Department Office after and between
lessons.
Activities and tasks were similarly critiqued and evaluated. Teacher A
completed the unit of work before the others. Lessons learnt were freely
shared as well as frustrations and failures.
4.4.2 Concepts of statistical literacy
There was a shift in students’ understanding of statistical literacy tasks that
involved the reading of data.
There were a range of responses to articles and reports used in the
classroom. Three boys in Teacher A’s class gave the following responses to
a Numeracy in the News task about shark attacks in Australia. The article
compared the small number of shark attacks to the huge number of car
accidents and questioned whether there was hysteria around the issue of
Great White Sharks that was unwarranted.
Student What’s this about?
Student Dunno.
Student Must be about sharks, look at the picture.
Student Do we have to copy the graph?
Student Dunno. Sir what do we have to do?
Teacher A Have you read the article yet?
Students No!
While there was a promising literacy strategy being used, with the student
referring to the picture, there was very little engagement with the task. If
these responses were to be assessed using Watson and Callingham’s (2005)
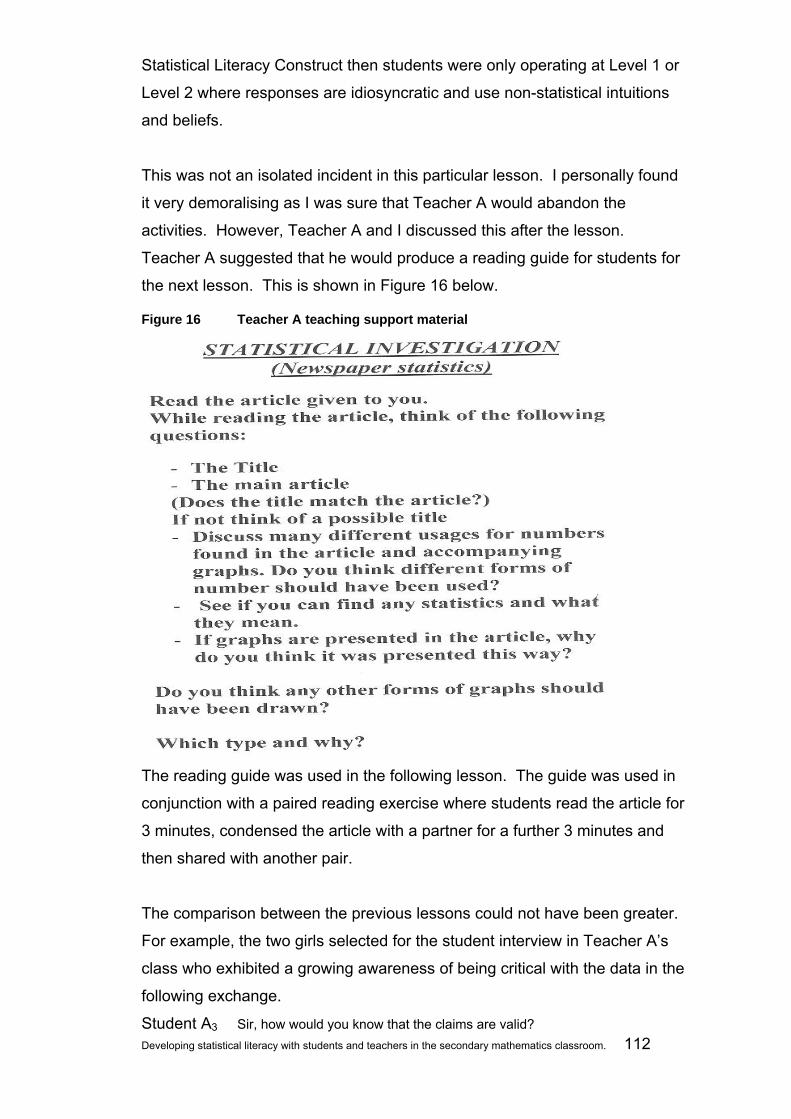
Developing statistical literacy with students and teachers in the secondary mathematics classroom. 112
Statistical Literacy Construct then students were only operating at Level 1 or
Level 2 where responses are idiosyncratic and use non-statistical intuitions
and beliefs.
This was not an isolated incident in this particular lesson. I personally found
it very demoralising as I was sure that Teacher A would abandon the
activities. However, Teacher A and I discussed this after the lesson.
Teacher A suggested that he would produce a reading guide for students for
the next lesson. This is shown in Figure 16 below.
Figure 16 Teacher A teaching support material
The reading guide was used in the following lesson. The guide was used in
conjunction with a paired reading exercise where students read the article for
3 minutes, condensed the article with a partner for a further 3 minutes and
then shared with another pair.
The comparison between the previous lessons could not have been greater.
For example, the two girls selected for the student interview in Teacher A’s
class who exhibited a growing awareness of being critical with the data in the
following exchange.
Student A3 Sir, how would you know that the claims are valid?
Developing statistical literacy with students and teachers in the secondary mathematics classroom. 113
Teacher A You have to take it from the information that they give you….Do they tell you
where the information came from
Student A3 [scanning article] …Kiwi Global USA 2004.
Teacher A Right… So….
Student A4 Right. So we could go and check that data. Compare that to the advert that
says ‘Clinical tests show’.
Student A3 Yeah, you don’t know what tests they mean.
Student A4 [to Student A3] So, do we trust this article? We don’t know how many
people were asked.
Student A3 Is this an article or an ad?
Student A4 It’s both.
Teacher A What do they call those?
Students together An advertorial
In the above exchange the students were discussing an advertisement from
a teen magazine. Students were familiar with the content and engaged with
the topic. Later, Teacher A discussed with me and Teacher B about the
suitability of some of the articles chosen by us to use in the unit. Teacher A
questioned whether they were in fact de-motivating for students because
they were too far out of their own experience and not of interest to the
students. It was decided that the students would be asked to bring in their
own media reports and statistical data to analyse, similar to the material used
by Student A3 and Student A4..
In the following lesson Teacher B set a homework task for the students to
collect articles that contained statistics for the following week’s lessons.
Student A2 reviewed an article about the television watching habits of
Americans. His notes are shown below.

Developing statistical literacy with students and teachers in the secondary mathematics classroom. 114
Figure 17 Student A2
Student A2 was able to identify concerns about how the survey had been
conducted with regard to both sampling and analysis. Sampling was not a
feature of the scheme. However, Student A2 displayed a clear understanding
of the context and how issues such as sample size or sampling method could
influence the data. Student A2’s responses were assessed using Watson
and Callingham’s (2005) Statistical Literacy Construct. We came to the
conclusion that this work fulfilled the requirements of Level 5 or Level 6
where students are able to respond to both the context and the statistical
concepts.
Student A1 was able to make similar statement about the same article. Both
students were interested in the reason for the survey reported and
questioned both its methodology and analysis. Student A1’s responses are
shown below.
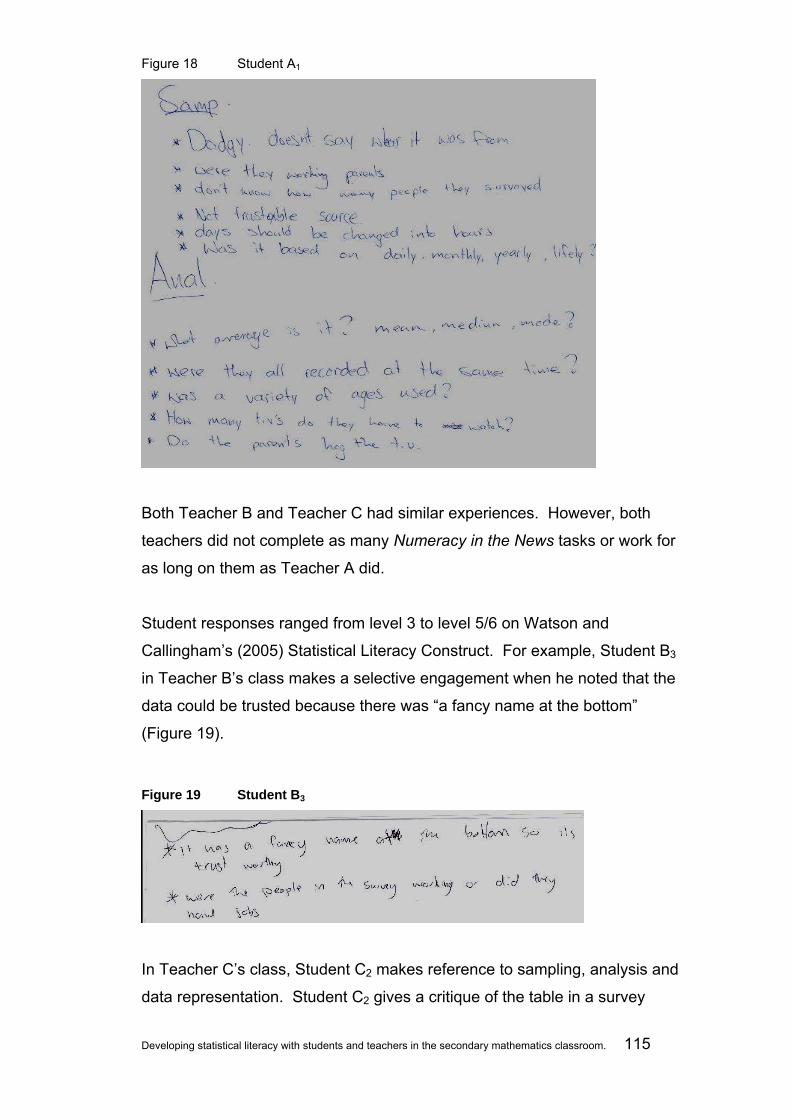
Developing statistical literacy with students and teachers in the secondary mathematics classroom. 115
Figure 18 Student A1
Both Teacher B and Teacher C had similar experiences. However, both
teachers did not complete as many Numeracy in the News tasks or work for
as long on them as Teacher A did.
Student responses ranged from level 3 to level 5/6 on Watson and
Callingham’s (2005) Statistical Literacy Construct. For example, Student B3
in Teacher B’s class makes a selective engagement when he noted that the
data could be trusted because there was “a fancy name at the bottom”
(Figure 19).
Figure 19 Student B3
In Teacher C’s class, Student C2 makes reference to sampling, analysis and
data representation. Student C2 gives a critique of the table in a survey
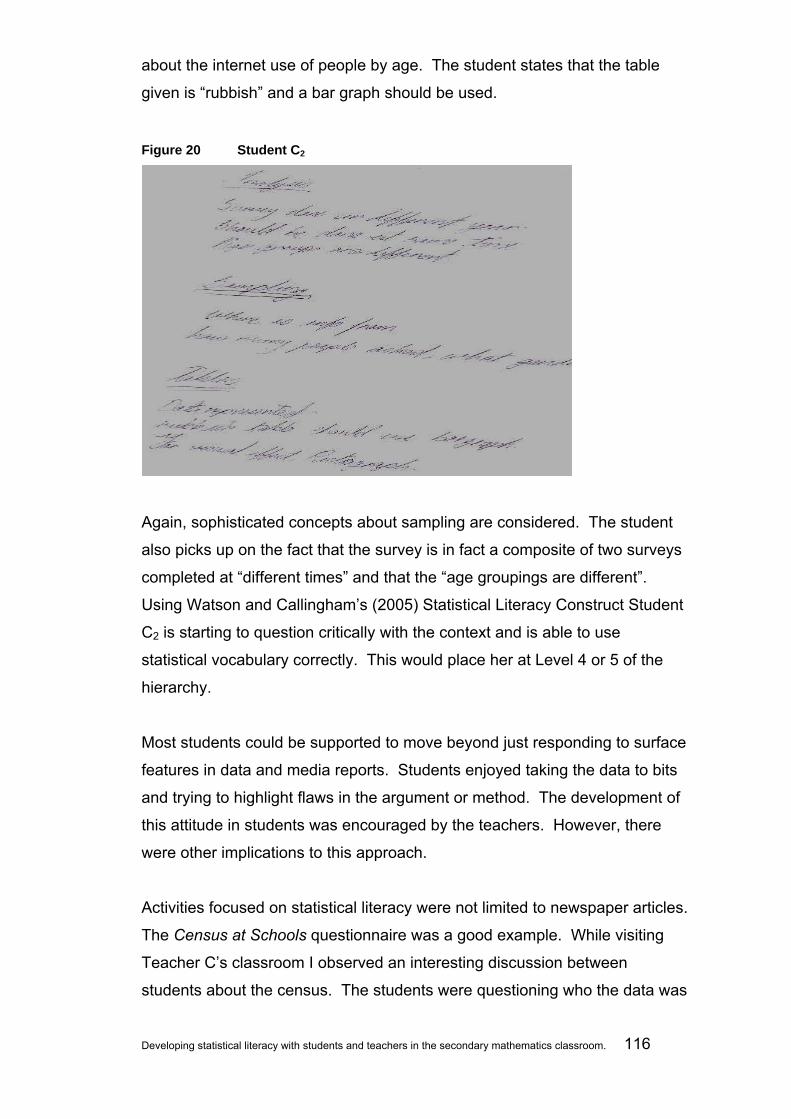
Developing statistical literacy with students and teachers in the secondary mathematics classroom. 116
about the internet use of people by age. The student states that the table
given is “rubbish” and a bar graph should be used.
Figure 20 Student C2
Again, sophisticated concepts about sampling are considered. The student
also picks up on the fact that the survey is in fact a composite of two surveys
completed at “different times” and that the “age groupings are different”.
Using Watson and Callingham’s (2005) Statistical Literacy Construct Student
C2 is starting to question critically with the context and is able to use
statistical vocabulary correctly. This would place her at Level 4 or 5 of the
hierarchy.
Most students could be supported to move beyond just responding to surface
features in data and media reports. Students enjoyed taking the data to bits
and trying to highlight flaws in the argument or method. The development of
this attitude in students was encouraged by the teachers. However, there
were other implications to this approach.
Activities focused on statistical literacy were not limited to newspaper articles.
The Census at Schools questionnaire was a good example. While visiting
Teacher C’s classroom I observed an interesting discussion between
students about the census. The students were questioning who the data was
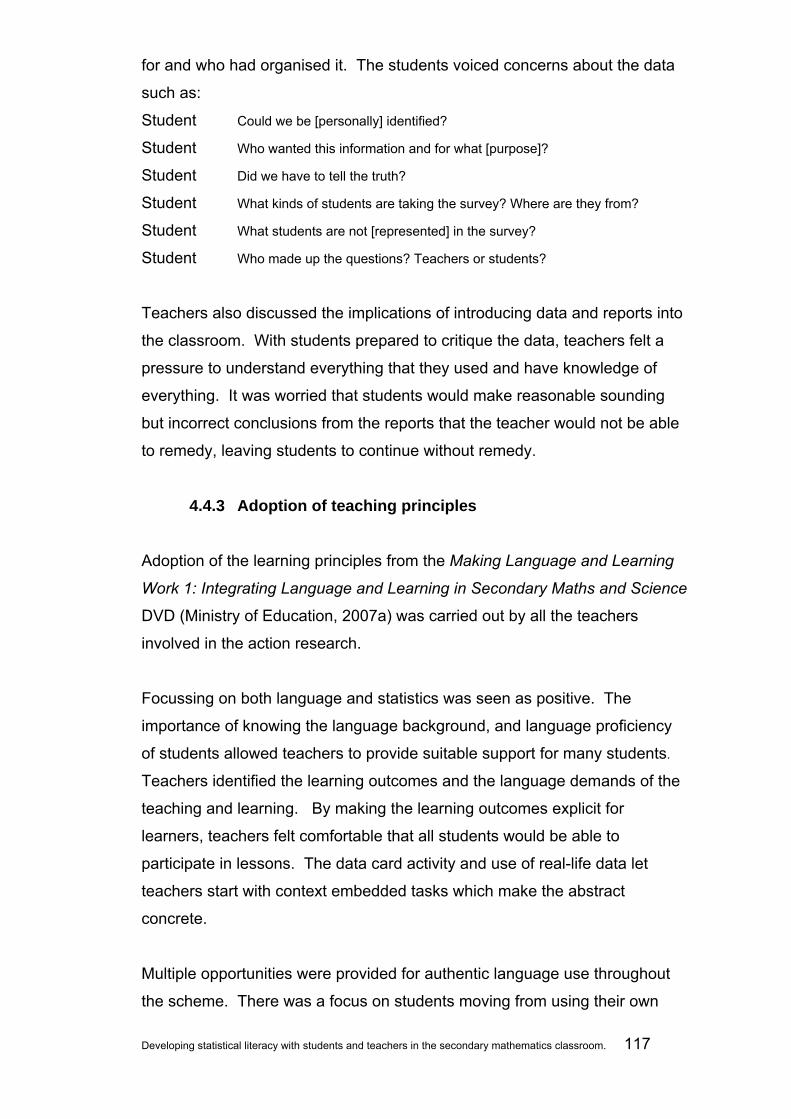
Developing statistical literacy with students and teachers in the secondary mathematics classroom. 117
for and who had organised it. The students voiced concerns about the data
such as:
Student Could we be [personally] identified?
Student Who wanted this information and for what [purpose]?
Student Did we have to tell the truth?
Student What kinds of students are taking the survey? Where are they from?
Student What students are not [represented] in the survey?
Student Who made up the questions? Teachers or students?
Teachers also discussed the implications of introducing data and reports into
the classroom. With students prepared to critique the data, teachers felt a
pressure to understand everything that they used and have knowledge of
everything. It was worried that students would make reasonable sounding
but incorrect conclusions from the reports that the teacher would not be able
to remedy, leaving students to continue without remedy.
4.4.3 Adoption of teaching principles
Adoption of the learning principles from the Making Language and Learning
Work 1: Integrating Language and Learning in Secondary Maths and Science
DVD (Ministry of Education, 2007a) was carried out by all the teachers
involved in the action research.
Focussing on both language and statistics was seen as positive. The
importance of knowing the language background, and language proficiency
of students allowed teachers to provide suitable support for many students.
Teachers identified the learning outcomes and the language demands of the
teaching and learning. By making the learning outcomes explicit for
learners, teachers felt comfortable that all students would be able to
participate in lessons. The data card activity and use of real-life data let
teachers start with context embedded tasks which make the abstract
concrete.
Multiple opportunities were provided for authentic language use throughout
the scheme. There was a focus on students moving from using their own

Developing statistical literacy with students and teachers in the secondary mathematics classroom. 118
terminology to using correct academic and statistical language when solving
problems. By using a variety of tasks, including investigation and evaluation
tasks, teachers felt they were able to ensure a balance between receptive
and productive language. A deeper description of some of the tasks used is
included in Section 4.4.4.
Opportunities for monitoring and self-evaluation were included in the scheme.
The focus was on diagnostic and formative assessment. The teachers also
felt that there was a need to look at assessment in general in the statistics
scheme. It is hoped that assessment will become a focus for further
investigation in subsequent cycles of the action research.
A positive aspect of action research carried out with a group of teachers is
that the teachers are able to share their experiences. This was a key
outcome of the research. The teachers were all at different stages in
statistics unit. Therefore teachers were able to visit to other classrooms to
observe teaching in progress.
For example, Teacher C observed in a lesson in Teacher A’s class that he
was being much more explicit about referring to the PPDAC investigation
cycle. Teacher A made a point at the start of the lesson to return to the
acronym PPDAC. He made the students chant out loud what each letter
stood for and wrote them on the board. Teacher C commented after the
lesson that she could see the benefit in continually reminding students of the
‘big picture’ of investigations so students understood that the investigation
was the sum of all the parts and could not be divided up and intended to
replicate the same in her classroom.
On another occasion, Teacher B observed Teacher A using a vocabulary
lesson starter where students matched meanings. In the activity students
grouped vocabulary into words they considered to be high frequency words
that needed clear definitions and words that the students needed to know but
not necessarily would have to use every lesson. A snapshot of the board in
Teacher A’s classroom is shown in figure 21 below.
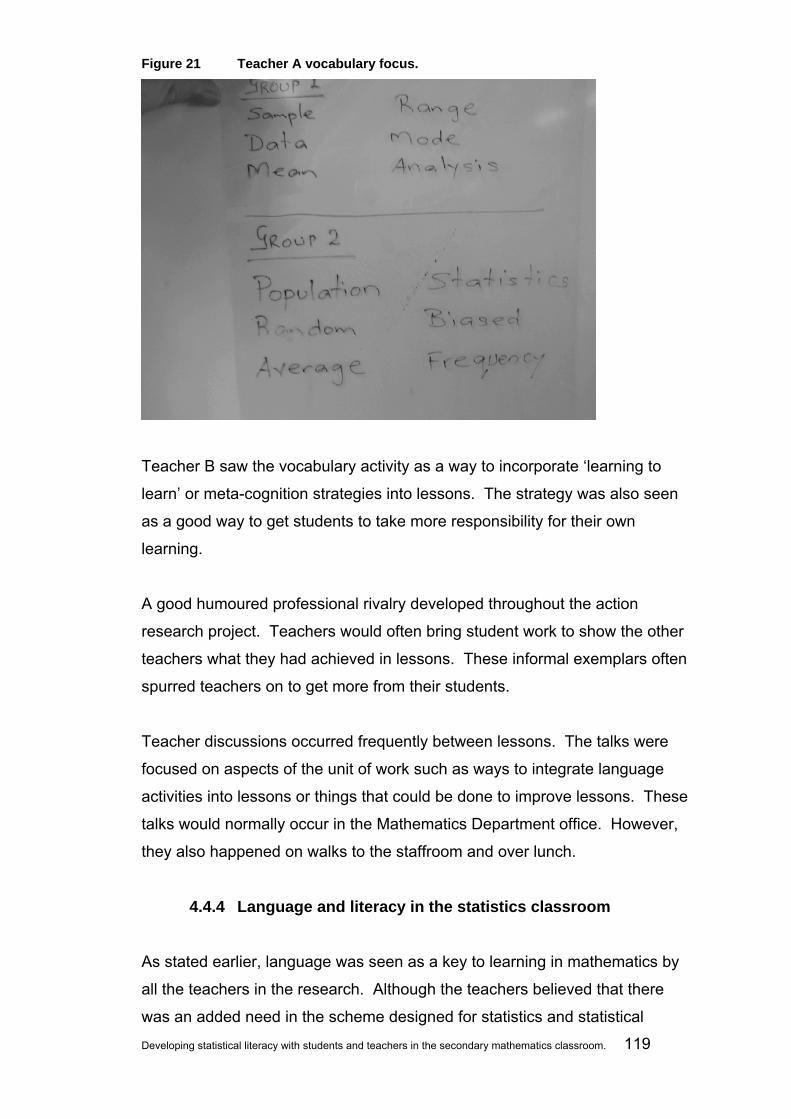
Developing statistical literacy with students and teachers in the secondary mathematics classroom. 119
Figure 21 Teacher A vocabulary focus.
Teacher B saw the vocabulary activity as a way to incorporate ‘learning to
learn’ or meta-cognition strategies into lessons. The strategy was also seen
as a good way to get students to take more responsibility for their own
learning.
A good humoured professional rivalry developed throughout the action
research project. Teachers would often bring student work to show the other
teachers what they had achieved in lessons. These informal exemplars often
spurred teachers on to get more from their students.
Teacher discussions occurred frequently between lessons. The talks were
focused on aspects of the unit of work such as ways to integrate language
activities into lessons or things that could be done to improve lessons. These
talks would normally occur in the Mathematics Department office. However,
they also happened on walks to the staffroom and over lunch.
4.4.4 Language and literacy in the statistics classroom
As stated earlier, language was seen as a key to learning in mathematics by
all the teachers in the research. Although the teachers believed that there
was an added need in the scheme designed for statistics and statistical

Developing statistical literacy with students and teachers in the secondary mathematics classroom. 120
literacy to focus on language and language structures the teachers believed
that a focus on language was important whether or not the topic was
statistics.
All the teachers used the ‘making language features explicit’ principle from
The Making Language and Learning Work 1: Integrating Language and
Learning in Secondary Maths and Science DVD (Ministry of Education,
2007a) a part of their teaching. Initially, I was surprised by this. However, in
reflection I believe that there are a number of reasons for the teachers’
actions and attitudes.
Although I did not discuss with the teachers directly, the fact that all the
teachers involved in the research had been bilingual learners themselves did
come out in observations of lessons. I observed Teacher B say to his class
during a vocabulary exercise that learning the vocabulary had been important
to him as a student learning mathematics. Both Teacher A and C used
anecdotes about students learning in Fiji and Tonga respectively in their
lessons.
Secondly, the diverse student population of the school made it very difficult
for teachers to ignore the language needs of many of the students. The
school was involved in a school wide Pasifika literacy programme to help the
high proportion of Pasifika and ESOL students in the school. Other student
focused programmes included work done by the specialist classroom teacher
[SCT] and the special needs coordinator in the school. Both the student
need and the school responses to those needs meant that teachers involved
in the research were aware of the language issues and actively engaged in
finding solutions.
For example the special needs coordinator had worked with teachers to
develop a consistent whiteboard layout in all classrooms across the school.
The layout for two days in Teacher A’s class are shown in figures 22 and 23
below. The use of such a layout was to encourage the use of effective
teaching practices. In the case of the research it made the adoption of
language learning principles such as ‘identifying the learning and language

Developing statistical literacy with students and teachers in the secondary mathematics classroom. 121
outcomes’ and ‘making explicit outcomes for students’ very easy for teachers
to accomplish. The use of the PPDAC acronym can also be seen in Figure
22.
Figure 22 Board layout 21 August
Figure 23 Board Layout 23 August

Developing statistical literacy with students and teachers in the secondary mathematics classroom. 122
The Pasifika literacy programme also had an effect on what was going on in
the classroom. The school wide Pasifika literacy programme was funded in
part by the Ministry of Education and had been led by an external facilitator
from the advisory service. Both Teacher A and I had attended the
professional development sessions during the previous year. Teacher A had
developed a range of skills in using literacy and language learning
techniques. He had also feed many of the ideas and materials back to the
department in professional development sessions. As a result all teachers
focused on vocabulary in the statistics unit of work.
One product from the research was a resource that included all the key
vocabulary printed onto magnetic paper. Teachers then used these in
lessons. The words were used for a wide number of activities. The words
were used as titles, prompts, graphical organisers and for revision. Two
arrangements of the words are shown in Figure 24 and Figure 25.
Teacher C’s arrangement is shown in Figure 24. Her arrangement was
made to show steps and language used in the investigation cycle. Later in
the same day Teacher B used the same classroom and rearranged the
words to focus on data representation and calculating statistics.
Figure 24 Vocabulary – arrangement 1.
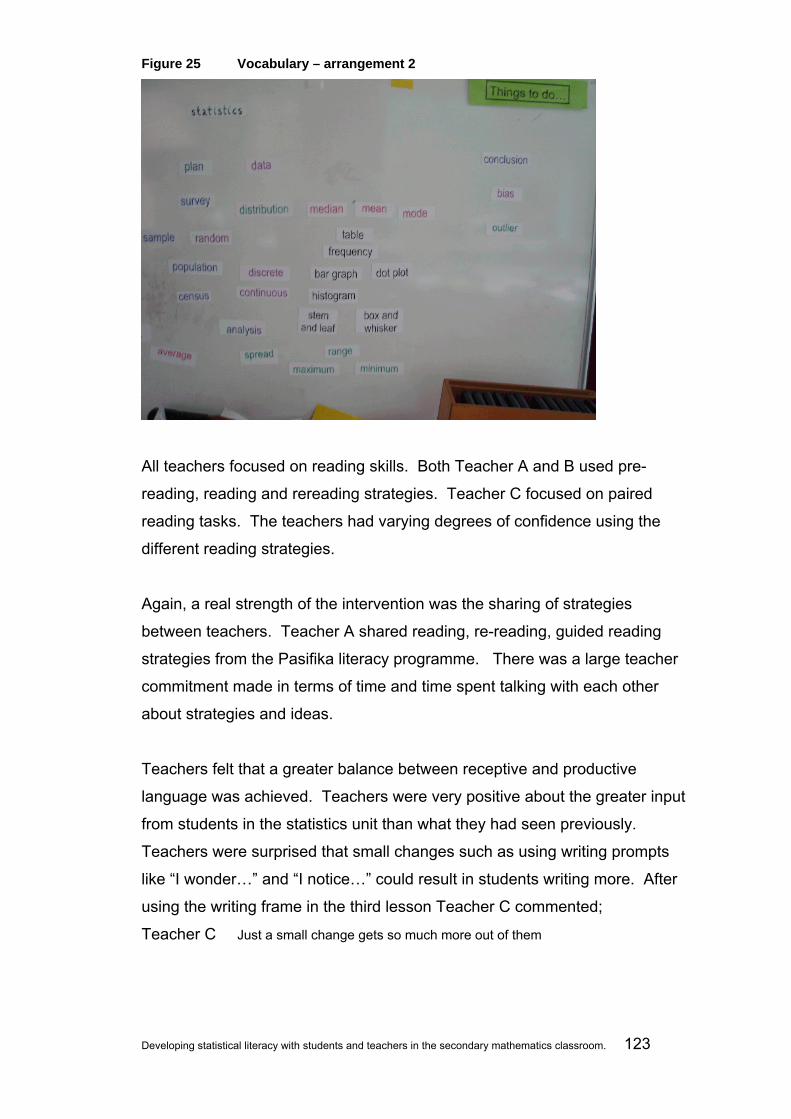
Developing statistical literacy with students and teachers in the secondary mathematics classroom. 123
Figure 25 Vocabulary – arrangement 2
All teachers focused on reading skills. Both Teacher A and B used pre-
reading, reading and rereading strategies. Teacher C focused on paired
reading tasks. The teachers had varying degrees of confidence using the
different reading strategies.
Again, a real strength of the intervention was the sharing of strategies
between teachers. Teacher A shared reading, re-reading, guided reading
strategies from the Pasifika literacy programme. There was a large teacher
commitment made in terms of time and time spent talking with each other
about strategies and ideas.
Teachers felt that a greater balance between receptive and productive
language was achieved. Teachers were very positive about the greater input
from students in the statistics unit than what they had seen previously.
Teachers were surprised that small changes such as using writing prompts
like “I wonder…” and “I notice…” could result in students writing more. After
using the writing frame in the third lesson Teacher C commented;
Teacher C Just a small change gets so much more out of them

Developing statistical literacy with students and teachers in the secondary mathematics classroom. 124
Modelling and the use exemplars for writing generated a lot of discussion.
Teacher A and C both felt that modelling was a challenge as they were often
unsure of their own writing.
Teacher C I would like more exemplars of the writing.
Teacher A also advocated for an extending of the practice into other classes
and levels.
Teacher A Should do this more at NCEA level 1, 2 and 3.
Teachers attempted to share good examples of writing. This did result in
more preparation work for teachers. At times there was also a concern that
too much was being given to students. After a lesson with Teacher C we
discussed how the lesson had gone.
Teacher C It feels like I am doing all the work and just giving students the answers.
Likewise after a lesson, Teacher A expressed some concern about using
exemplars for supporting students writing. After a lesson where Teacher A
had modelled the task on the board he commented;
Teacher A How much is too much?
In lessons Teacher A had made it explicit to students the particular sentence
structures that he used. There was extensive use of writing frames and
scaffolded writing. However, Teacher A was disappointed that the students
then repeated the exact same structure back in their own responses. A goal
for future action was to collate good exemplars for teachers to use across
classes in the future.
Students in the classes observed did have difficulty with terms used in
statistics. However, a clear intention of the scheme was to introduce the
statistical language to students as early as possible to help students with
their statistical thinking. Techniques teachers used included re-voicing
student answers using correct statistical terms and expecting students to use
them in their own answers. The teachers reported that this put extra
demands on them where there were ESOL students in the class.
Developing statistical literacy with students and teachers in the secondary mathematics classroom. 125
4.4.5 Critical literacy in the statistics classroom
The attempt to introduce critical literacy or critical thinking tools into the
scheme was the most challenging part of the whole unit of work. Because of
the negotiated scheme adopted by the teachers each class attempted slightly
different lessons or activities from the scheme to meet the same content and
language objectives.
All classes completed the Being Typical investigation from Census at
Schools. The investigation was completed over an average of six lessons.
Teacher A class spent the most time on Numeracy in the News articles with
five lessons. Teacher B spent three lessons on the Numeracy in the News
and Teacher C spent two lessons. The remainder of the unit of work was
spent on other tasks such as skills development using the textbook and other
investigations such as the Cookie Investigation from the Lovitt and Lowe’s
(1993) Chance and Data Investigations; Volume 1.
It appeared that the key to the success of the Numeracy in the News
activities was the use of good reading strategies. Initially, it appeared that
Teacher A’s class had been the most successful because the students were
in a higher ability grouping. However, subsequently it was shown that
Teacher A incorporated the greatest amount of reading strategies into his
lessons. While Teacher B and C also used some reading strategies \,
Teacher A was also the most explicit about the strategies. For example, in a
lesson Teacher A prompted students to think about a particular reading
strategy when they are reading a piece of text.
Teacher A Remember we used “skim and scan”. What was that?
Regardless of the reading support given, all the teachers felt that it was
possible for students to become critical with text and data. It was noted that
initially students would take data at face value. However, when supported
students could operate at Levels 5 and 6 of Watson and Callingham’s (2005)
Statistical Literacy Construct.
Developing statistical literacy with students and teachers in the secondary mathematics classroom. 126
Teachers also felt that it would be useful to develop a poster, like the PPDAC
‘data detective’ poster used for investigations, that could be used to prompt
students to ask questions about the data and data representations given to
them. It was thought that ideas like Gal’s (2002) ‘worry questions’ or an
expansion on the interrogative cycle of Wild and Pfannkuch (1999).
There was discussion about the suitability of articles used in lessons.
Teacher A felt strongly that many of the articles that were used were not that
interesting to students. However, the articles selected were articles that had
teaching materials and language support already developed and were
therefore easy to use. Using writing or data that was more engaging for
students was seen as more desirable. However, it was felt that this would
make more work and more worry for teachers if they had to find new articles.
It was suggested that students should be made responsible for collecting
their own writing and data.
Of interest to me were the reasons for introducing materials into the
classroom. Teachers referred to students’ engagement and motivation as
reasons for trying to source materials. However, the reasons for wanting to
be critical were not a feature of discussions. The adopting of a critical
pedagogy would require students to interpret, evaluate, and critique the
statistics placed in their social and political setting. There was still a
tendency to see the statistics instruction as removed from the wider world.
There was an opportunity to use the statistical literacy skills like Luke and
Freebody’s (1990) text analyst, Kalantzis and Cope’s (1999) transformed
practice or Frankenstein’s (1998) understanding the politics of knowledge. In
this way the learning of statistics could be a way of looking at issues of
disparity and inequity in student’s lives. Students did offer topics of interest
to them during the statistics unit. Statistics used in the media that
characterised their own communities (often in a bad light), economic
disparities in society as well as differences in educational opportunities all
emerged as possible topics in discussions with students. The possibility that
these topics could be used to not only teach statistics but provide students
opportunities to think about ways they could challenge ideas was intriguing
but unfulfilled.
Developing statistical literacy with students and teachers in the secondary mathematics classroom. 127
4.5 Student interviews
The three student interviews took place towards the end of the unit of work
for each class. Four students were selected from each class with students
A1, A2, A3 and A4 from Teacher A’s class, students B1, B2, B3 and B4 from
Teacher B’s class and students C1, C2, C3 and C4 from Teacher C’s class.
As discussed earlier, the methodology used is an unstructured group
interview with questions moving from more the general to more specific. In
practice the interviews followed a similar format each time where the
interview started with questions about the nature of statistics moving onto
questions about what had happened in the statistics unit. The focus points,
which can be found in Appendix G, included reflecting on what students
enjoyed about the unit of work and what they did not like about the unit.
Students were selected because of incidents observed in the classroom both
by myself and the participant teachers. This enabled questions to be asked
to expand on specific incidents that occurred in the classroom. Some of the
questions were about metacognition or about what students thought helped
them learn.
The interviews themselves offered another illustration of the teaching
principles for language learners that we hoped to adopt in our action
research. The intent of the interviews was for them to be a place where
students could express their own thinking and explanation of events.
However, in the first student interview transcription with Teacher C’s class it
was noticeable how much I had dominated the discussion and how I had
allowed very few periods of silence or thinking. Similarly, I had not made the
interview process easy for the ESOL students selected in each group. In
subsequent interviews I did attempt to limit my input in discussions and give
some written materials to students to try and support the questioning.
There were differences between classes. Teacher A’s extension class
students were the most comfortable group discussing their work with the
other two groups being much more reticent. Putting my abilities as an
interviewer aside, it was noticeable that the students for Teacher A’s class
were much more comfortable discussing their learning. All the students

Developing statistical literacy with students and teachers in the secondary mathematics classroom. 128
found it challenging to discuss their own learning, teaching styles and
aspects of metacognition. This was often disappointing as I felt unable to
triangulate student attitudes and opinions with those of their teachers and
what I had observed in the classroom. I am unsure if this inability to express
some of the ideas was a factor of the students’ age, the interview process or
the students’ lack of exposure to considering metacognition. These factors
are not explored any further in this research. However, the teacher
participants expressed an interest in student thinking and metacognition
could be a feature of future cycles of action research in this department.
4.5.1 Concepts of statistics
The first question asked was about their definition of what statistics at school.
Many of the initial comments were about the collecting and displaying of data
and the calculating of summary statistics such as the mean median mode.
This procedural view of statistics was common to all classes. However, in
Teacher C’s class the responses given were solely on statistics as a process
and Teacher B’s class also focused on the collecting and sorting of data.
Student C1 Statistics is collecting data to investigate a question.
Student C4 It means collecting numbers and putting them into graphs. I think scientists
use it and lots of other people.
Student C2 There is lots of things that have to do with it. There are pie graphs and plots
and box and whiskers and getting the mean and median and range.
Student B4 Normally in maths you just plus everything. In statistics you are gathering
stuff, sorting it out where it is supposed to be.
Student B1 You have lots of different bits of information.
Student A1 You just need mean, median, mode and how to do stem and leaf graphs
and how to do a box and whisker.
Initially this was distressing as the interviews took place after a series of
lessons that hoped to develop statistical literacy. However, further
discussion yielded other notions about the nature of statistics. Students
talked about statistics as research.

Developing statistical literacy with students and teachers in the secondary mathematics classroom. 129
Student A1 In statistics you need information from other people where in other maths
you can do it yourself.
Student A2 You need to research stuff.
The realness of the data and contextual nature of statistics was seen as
important by other students.
Student A3 It’s not like graph line work where you go “x + 3 = whatever”. There are a
whole bunch of ideas and perspectives in statistics.
Student A4 We are given everyday stuff to use.
Student A2 Yeah. Statistics is about real information and like what people do.
Students in Teacher A’s class frequently referred to the subjective nature of
statistical analysis. The multiplicity of answers and was also a feature of the
discussion.
Student A4 It’s more subjective and maths isn’t really subjective usually.
Student A3 In maths it is like this is the answer, the one answer.
Student A2 Sometimes no wrong answer.
The need for analysis and evaluation in statistics was also a feature of
responses. The importance of literacy skills was acknowledged by almost all
students interviewed from all the classes.
Student A4 Statistics is kind of scary because everyone is used to mathematics being
black and white and then all of a sudden you have to write conclusions and
explain different options.
Student A3 It’s like an English lesson in maths.
Student A1 I am good at maths – suck at English.
Student A3 Sometimes I wish I could just solve a quick problem. But it [statistics] is a bit
cooler because it helps to link your subjects more.
Different ways of working in statistics were also identified as significant.
Group work, discussion and argument were all seen as important features of
a successful statistics lesson. In an exchange with students in Teachers A’s
class the students attempt to explain the differences in working in a statistics
lesson.
Student A1 You need to work together.
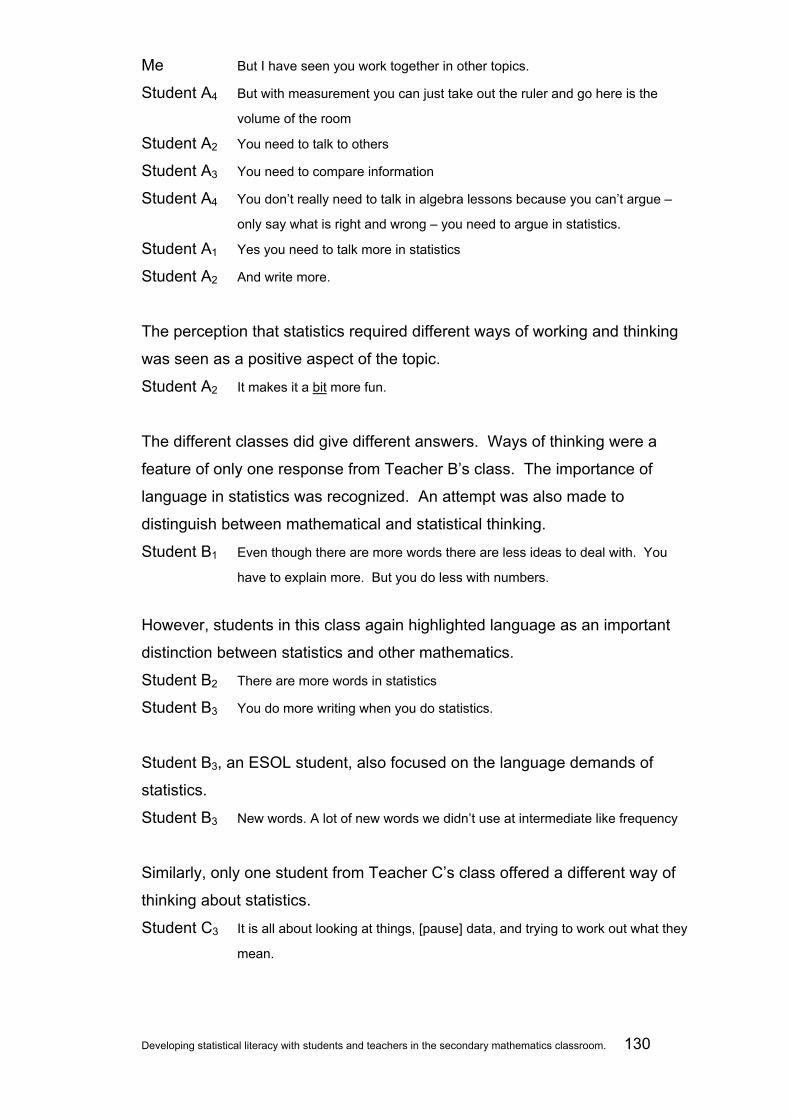
Developing statistical literacy with students and teachers in the secondary mathematics classroom. 130
Me But I have seen you work together in other topics.
Student A4 But with measurement you can just take out the ruler and go here is the
volume of the room Student A2 You need to talk to others
Student A3 You need to compare information
Student A4 You don’t really need to talk in algebra lessons because you can’t argue –
only say what is right and wrong – you need to argue in statistics. Student A1 Yes you need to talk more in statistics
Student A2 And write more.
The perception that statistics required different ways of working and thinking
was seen as a positive aspect of the topic.
Student A2 It makes it a bit more fun.
The different classes did give different answers. Ways of thinking were a
feature of only one response from Teacher B’s class. The importance of
language in statistics was recognized. An attempt was also made to
distinguish between mathematical and statistical thinking.
Student B1 Even though there are more words there are less ideas to deal with. You
have to explain more. But you do less with numbers.
However, students in this class again highlighted language as an important
distinction between statistics and other mathematics.
Student B2 There are more words in statistics
Student B3 You do more writing when you do statistics.
Student B3, an ESOL student, also focused on the language demands of
statistics.
Student B3 New words. A lot of new words we didn’t use at intermediate like frequency
Similarly, only one student from Teacher C’s class offered a different way of
thinking about statistics.
Student C3 It is all about looking at things, [pause] data, and trying to work out what they
mean.

Developing statistical literacy with students and teachers in the secondary mathematics classroom. 131
All three groups of students talked about statistics in terms of an investigative
cycle where you collect and analyse data. Eight of the twelve students
mentioned the PPDAC cycle in a response. This was regardless of year
level, class or ability grouping. Two of the three groups also mentioned
language as an important concept when defining statistics. Both the high
ability students from Teacher A’s class and low ability students from Teacher
B’s class cited language as important. Only the high ability class mentioned
ways of working as a difference in statistics.
4.5.2 Concepts of statistical literacy
Statistical literacy was seen as knowing what graph to use and what statistic
was the most appropriate. This appeared to match the position taken by the
teacher participants of statistical literacy as a competency rather than a way
of thinking about data or text.
The questions asked during the interviews of students were heavily
influenced by my own investigation into possible definitions of statistical
literacy. However, many of the ideas were outside the experience of
students. In hindsight I needed to frame questions in a way that allowed
students to discuss their ideas rather than forcing them to try and decipher
my conceptualisations of statistical literacy.
4.5.3 Adoption of teaching principles
Student recognition of the use of teaching principles used by their teachers in
lessons was minor. Even when students were prompted about individual
lessons or incidents they found it hard to give examples of strategies used.
Teacher A’s class did comment in general about teaching styles.
Student A3 What makes it easy is having something explained to you first and then
going outwards.
Student A4 It’s easy because [Teacher A] is not talking the whole lesson. He’s not up
the front going “this, this, this”
Student A2 Most teachers just keep talking and you can’t learn.
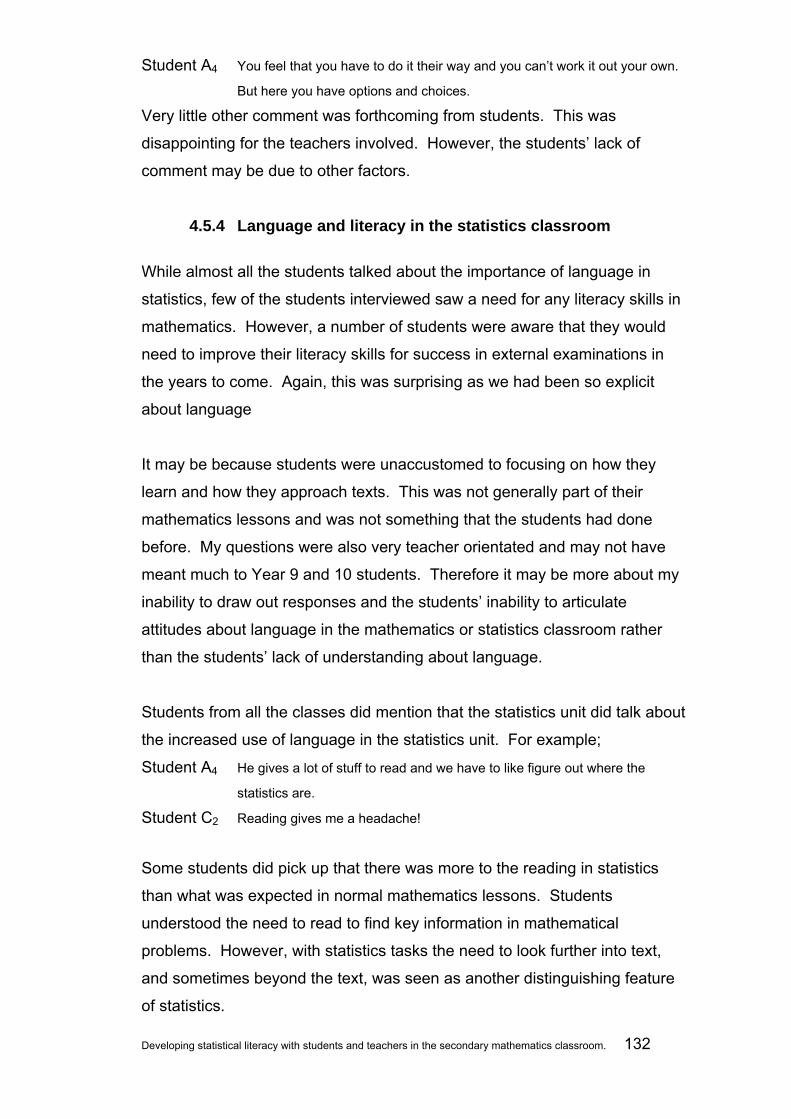
Developing statistical literacy with students and teachers in the secondary mathematics classroom. 132
Student A4 You feel that you have to do it their way and you can’t work it out your own.
But here you have options and choices.
Very little other comment was forthcoming from students. This was
disappointing for the teachers involved. However, the students’ lack of
comment may be due to other factors.
4.5.4 Language and literacy in the statistics classroom While almost all the students talked about the importance of language in
statistics, few of the students interviewed saw a need for any literacy skills in
mathematics. However, a number of students were aware that they would
need to improve their literacy skills for success in external examinations in
the years to come. Again, this was surprising as we had been so explicit
about language
It may be because students were unaccustomed to focusing on how they
learn and how they approach texts. This was not generally part of their
mathematics lessons and was not something that the students had done
before. My questions were also very teacher orientated and may not have
meant much to Year 9 and 10 students. Therefore it may be more about my
inability to draw out responses and the students’ inability to articulate
attitudes about language in the mathematics or statistics classroom rather
than the students’ lack of understanding about language.
Students from all the classes did mention that the statistics unit did talk about
the increased use of language in the statistics unit. For example;
Student A4 He gives a lot of stuff to read and we have to like figure out where the
statistics are.
Student C2 Reading gives me a headache!
Some students did pick up that there was more to the reading in statistics
than what was expected in normal mathematics lessons. Students
understood the need to read to find key information in mathematical
problems. However, with statistics tasks the need to look further into text,
and sometimes beyond the text, was seen as another distinguishing feature
of statistics.

Developing statistical literacy with students and teachers in the secondary mathematics classroom. 133
Student A3 You can use a newspaper article in normal maths but in statistics you learn
to look into it more.
Writing as well as reading was seen as an important feature of statistics by
students. The following exchange between Student A1 and the ‘devils
advocate’ Student A2 illustrates the significance students put on writing in the
scheme.
Student A1 You grow up thinking maths is one thing. If you know the rules and you can
do the calculations right than you can do it (mathematics). Then with
statistics there is all this lingo and jargon…all this language used.
Student A2 There is heaps of jargon in maths too!
Student A1 Yeah but you need to write…you have to explain everything and justify it
and there’s heaps of writing.
Student A2 You have to justify in normal maths too!
Student A3 I hate all the writing
Student A1 Yeah but the explanation is the answer in statistics. It shows you
understand. You need to look at it from different perspectives.
4.5.5 Critical literacy in the statistics classroom
There was evidence that students believed that they needed different skills
than normal mathematics to gain success in statistics. Students
acknowledged that reading was difficult and that more effort in terms of
‘thinking’ was required. Students also talked about the need for background
information to assist their reading and sense making. Students commented
that the readings in the statistics lessons had been about a lot of different
things.
Students had become more aware of the statistics found in articles and
advertisements. When asked, students commented on how they had learnt:
to ask questions about the things they read; to be aware of how graphs and
text can mislead; about questioning about sampling and variation.
Being critical in the critical literacy sense was a difficulty. There was a
perception that data was sacred and that if it was used in the classroom it
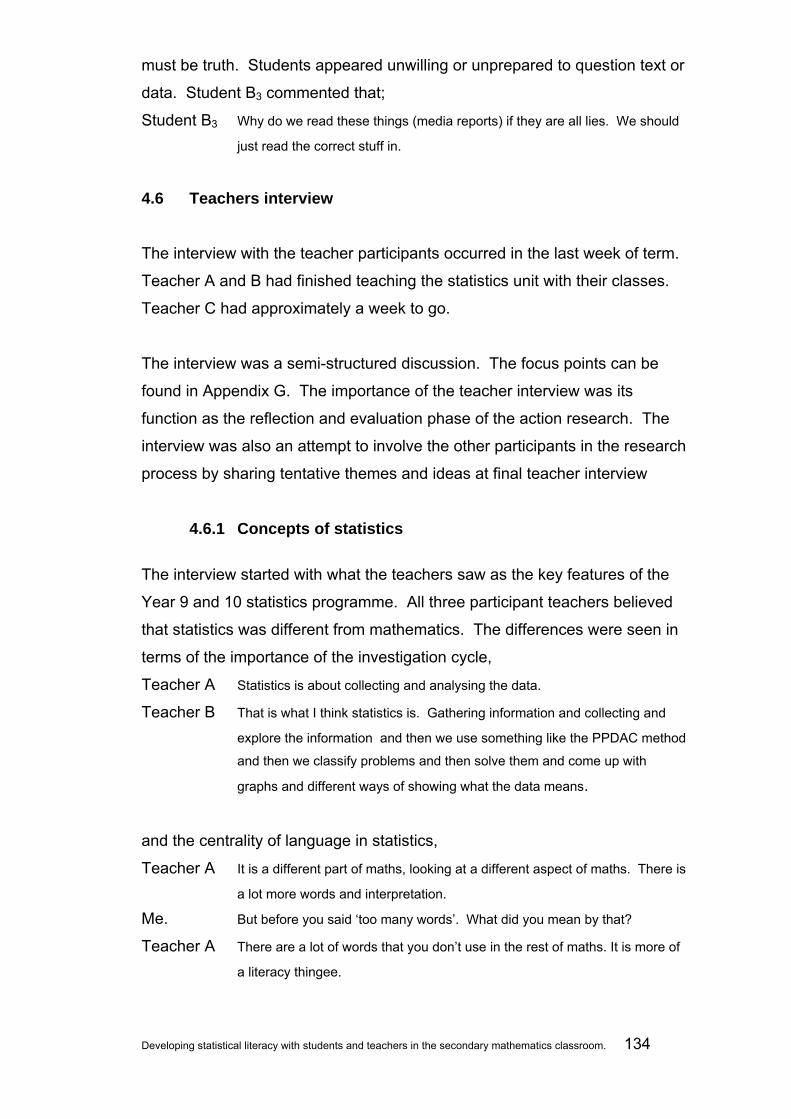
Developing statistical literacy with students and teachers in the secondary mathematics classroom. 134
must be truth. Students appeared unwilling or unprepared to question text or
data. Student B3 commented that;
Student B3 Why do we read these things (media reports) if they are all lies. We should
just read the correct stuff in.
4.6 Teachers interview The interview with the teacher participants occurred in the last week of term.
Teacher A and B had finished teaching the statistics unit with their classes.
Teacher C had approximately a week to go.
The interview was a semi-structured discussion. The focus points can be
found in Appendix G. The importance of the teacher interview was its
function as the reflection and evaluation phase of the action research. The
interview was also an attempt to involve the other participants in the research
process by sharing tentative themes and ideas at final teacher interview
4.6.1 Concepts of statistics The interview started with what the teachers saw as the key features of the
Year 9 and 10 statistics programme. All three participant teachers believed
that statistics was different from mathematics. The differences were seen in
terms of the importance of the investigation cycle,
Teacher A Statistics is about collecting and analysing the data.
Teacher B That is what I think statistics is. Gathering information and collecting and
explore the information and then we use something like the PPDAC method
and then we classify problems and then solve them and come up with
graphs and different ways of showing what the data means.
and the centrality of language in statistics,
Teacher A It is a different part of maths, looking at a different aspect of maths. There is
a lot more words and interpretation.
Me. But before you said ‘too many words’. What did you mean by that?
Teacher A There are a lot of words that you don’t use in the rest of maths. It is more of
a literacy thingee.

Developing statistical literacy with students and teachers in the secondary mathematics classroom. 135
Statistics was seen as a more holistic topic than other topics in the
mathematics curriculum. Teacher B described
Teacher B We need a clear picture of what statistics is. A major point is that we are
looking at for kids to understand the big picture, the overall picture of what
statistics is. Statistics is not just calculating the mean or drawing a graph.
There was a consensus that it was important for the statistics unit to illustrate
to students that statistics was more than calculations or graphing data. The
importance of ‘doing statistics’ was still emphasized.
Teacher B Statistics is a really good chance for not giving them the answer but giving
them work to do.
Teacher A Do you mean investigations?
Teacher B Yes, investigation. Rather than giving them as exercise and saying right do
this exercise? What is the mean? What is the mode? Which is the traditional
way? The way I did. Where we just went: Find the median! Find the mean! It
doesn’t make sense to the students. But by completing their own
investigations they got to see why they were doing things.
The investigative process was seen as a good way of introducing students to
statistical thinking. Teacher B commented on the strength of the PPDAC
cycle being that it took students through the complete process of a statistical
investigation.
Me The PPDAC cycle is quite a long process
Teacher B Yes, a long process. At this age the students want to work on a one to one
basis. They want to answer the questions and then move on. They go from
step one to step two and then will stop and will not stop to look at the overall
thing [makes big circle in air with arm]. Whereas the PPDAC encourages
them to look at the whole process
There was a shift in teachers’ perceptions of statistics from the start of the
action research to the end. No teacher made a comment about constructing
graphs or calculating statistics when defining or discussing statistics.
4.6.2 Concepts of statistical literacy
Even after the unit of work, the ‘doing of statistics’ was seen as more
important than the ‘responding to statistics’ by the teachers. However, the

Developing statistical literacy with students and teachers in the secondary mathematics classroom. 136
statistical literacy aims were adopted by the group to get students to spend
more time on evaluation and interpretation of results. The evaluating
statistical reports or statistical literacy component of the scheme was hoped
to be covered when students discussed their own and peers work as well as
when students completing separate statistical literacy tasks.
However, at the end of the unit of work the evaluation and interpretation
components of the statistics topic were still considered to be too difficult for
many students to do.
Teacher A It’s [evaluating statistical reports] like the excellence part of level 1 [NCEA].
The evaluation is normally what the better kids do at the end.
Teacher B Yes, it is hard for many students to do.
Teacher C You have to give a lot more prompting with the class to get them to question
the information. They do not see it as the first thing to do. They would
rather spend time answering the questions.
The evaluation of the activities used in the statistics scheme was clear. The
teachers believed that the materials used were superior to those used in
previous years or classes.
Teacher B The activities were much more useful than what I may have used in the
past.
Teacher C Yes, better than I thought.
Teacher A Better than the textbook.
Teacher C I felt they understood more.
Teacher A With the activities I felt that you could do more, get more done, in the time
frame. If we went through the textbook I think it would take longer and not
be as enjoyable.
Teacher B It is also my evaluation that the class has done heaps of things, more than if
I had done my traditional way of teaching statistics.
Teacher C Yes. I think the activities show the students the practical work of actually
doing statistics. I mean by the end they have done pretty much everything.
A limitation of the resources and reservation for the scheme was that too
much of the data was provided. An essential step was being left out where
students would see the need for data. Students seeing the need for data
was seen as another way to start get students to be critical learners.
Teacher B commented;
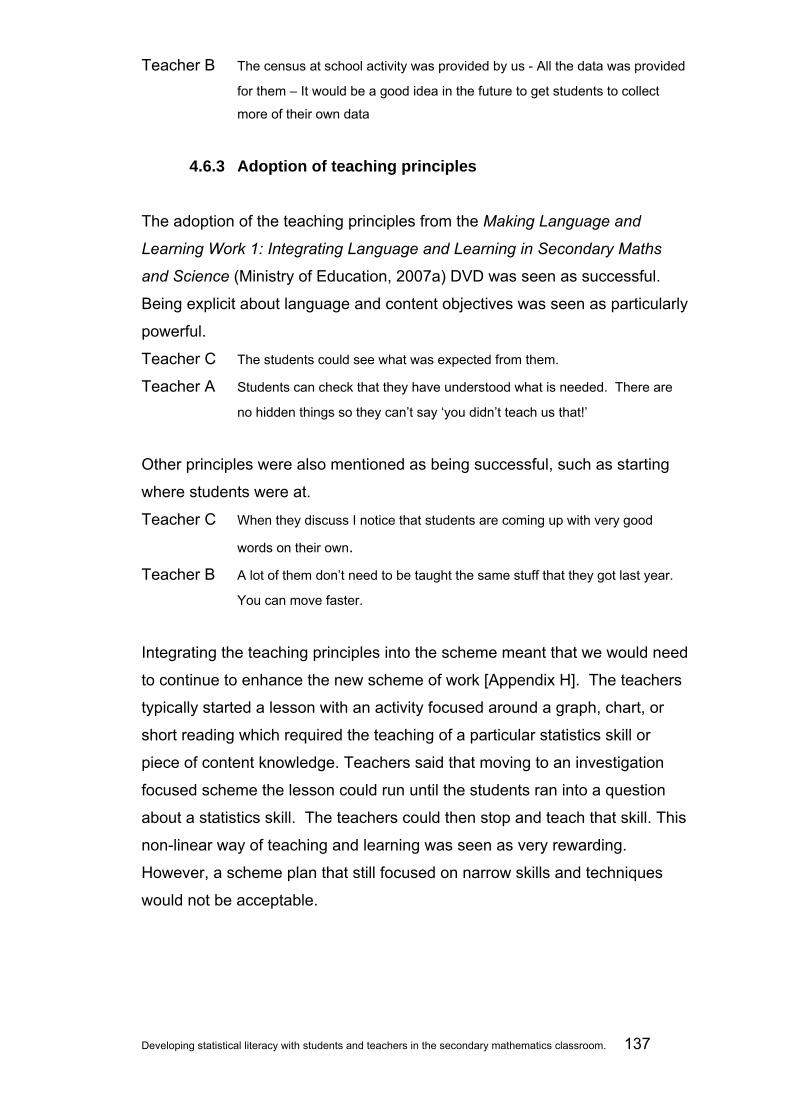
Developing statistical literacy with students and teachers in the secondary mathematics classroom. 137
Teacher B The census at school activity was provided by us - All the data was provided
for them – It would be a good idea in the future to get students to collect
more of their own data
4.6.3 Adoption of teaching principles
The adoption of the teaching principles from the Making Language and
Learning Work 1: Integrating Language and Learning in Secondary Maths
and Science (Ministry of Education, 2007a) DVD was seen as successful.
Being explicit about language and content objectives was seen as particularly
powerful.
Teacher C The students could see what was expected from them.
Teacher A Students can check that they have understood what is needed. There are
no hidden things so they can’t say ‘you didn’t teach us that!’
Other principles were also mentioned as being successful, such as starting
where students were at.
Teacher C When they discuss I notice that students are coming up with very good
words on their own.
Teacher B A lot of them don’t need to be taught the same stuff that they got last year.
You can move faster.
Integrating the teaching principles into the scheme meant that we would need
to continue to enhance the new scheme of work [Appendix H]. The teachers
typically started a lesson with an activity focused around a graph, chart, or
short reading which required the teaching of a particular statistics skill or
piece of content knowledge. Teachers said that moving to an investigation
focused scheme the lesson could run until the students ran into a question
about a statistics skill. The teachers could then stop and teach that skill. This
non-linear way of teaching and learning was seen as very rewarding.
However, a scheme plan that still focused on narrow skills and techniques
would not be acceptable.

Developing statistical literacy with students and teachers in the secondary mathematics classroom. 138
4.6.4 Language and literacy in the statistics classroom
When asked what was particularly helpful or useful from a language learning
standpoint teachers talked about a variety of activities and strategies used.
Teacher C The writing prompts were very good. They didn’t realise that they could
write a whole lot of things about one question. Like, if the question was
about heights, instead of answering ‘Who is the tallest?’ they could describe
the data much more.
Giving students multiple opportunities to write was seen as beneficial, such
as the “I notice …” and “I wonder” [Figure 13] worksheets.
Teacher C The students would ask ‘Do you have to write only one thing here or do you
have to fill all the gaps and they could write lots of things.
Modelling tasks and using exemplars was seen as good tools to use by all
the teachers.
Teacher C I would point out the statistics words and sentences and then they could
start writing things down…which was very good.
Teachers were also asked what was not useful or unsuccessful about the
scheme. The literacy demands of the topic and the need to use literacy
strategies that the teachers felt they were not expert in using continued to be
the most challenging aspect of the research.
Me What didn’t work?
Teacher A For me it was the article lessons [Numeracy in the News] because it wasn’t
working. When I asked the students about the literacy…the literacy
strategies…they couldn’t see how they were useful. The couldn’t link the
strategies that they had used say in English class with what we were doing
and bring it to a maths class or a stats class. There was no linkage.
According to the English department they were using the reading strategies,
they are doing the literacy programme but the students wouldn’t bring it to
the maths class.
Me That surprised me as well. You wrote the strategies on the board. You
modelled the exercise with them. You explained to them that it was the
same strategy and they still didn’t get it.
The planning demands were also highlighted as an obstacle to teachers
changing practice.

Developing statistical literacy with students and teachers in the secondary mathematics classroom. 139
Me If we were to continue this way of teaching the statistics unit next year what
will we need to do and what support would be needed. Teacher B I think we should continue to teach it this way. What we need to do is keep
developing new activities, similar to what we have done. I think we should
keep making and sharing resources because I think more needs to be
based on hands on things for the students.
4.6.5 Critical literacy in the statistics classroom
The challenges of getting students to be critical about the data were
acknowledged. The teachers saw the different thinking skills that students
needed for analysis and critique. However, getting students to change was
seen as a difficult task.
Teacher B It is difficult to get students to think about the data or writing.
Teacher A Especially to think deeply about what they are reading.
Teachers were particularly aware of a need for further support and
professional development with using materials such as the Numeracy in the
News articles. The teachers understood the direction and intent of lessons
but at times felt hesitant about how to achieve their objectives.
Teacher C I know what I want to do but I am unsure how to do it with the class
Adopting a critical stance was still seen as difficult for teachers in the
classroom. Teachers continued to be worried about how to manage giving
more control to the students over what is studied in the classroom. While
teachers were interested in looking at issues of interest to the students they
worried about ‘getting out of the depth’ and having to discuss or research
issues that they knew little about.
Students’ lack of general knowledge and lack of experience asking critical
questions was also seen as a problem. Teacher A described the range of
student responses after an activity where students had to question the claims
in a statistical report. He saw that their response really was dependent on
what they already knew rather than them being able to question the data.
Developing statistical literacy with students and teachers in the secondary mathematics classroom. 140
Teacher A For me the strategies were really important. But how the students answered
the questions was quite different. It really varies from person to person. I
think that their background knowledge causes that.
While the students may have the statistical knowledge and the literacy skills
the teachers felt that they lacked knowledge of context and hence were
unable too engage in critical questioning.
The teachers were unsure if why the students found the critiquing of data
difficult. Age was seen as a possible factor;
Teacher B These guys are only Year 9 so they don’t really question it.
Other teachers felt that the students were not asked to question information
as they had been asked to in their mathematics class and that it was a skill
that needed to be practiced. The process of change was seen as long term
goal that would not necessarily be achievable in a few lessons.
Teacher B Some students got it at the end. However, some students found it very
difficult to look beyond the data, to evaluate it, to look for bias. We need to
spend time on that
Developing statistical literacy with students and teachers in the secondary mathematics classroom. 141
Chapter 5: Discussion
5.1 Introduction
Important and recurring themes that surfaced in the teaching and learning of
statistics and statistical literacy during the action research project are
discussed in this chapter. Section 5.2 explores definitions of statistics seen
in the research. Section 5.3 looks at notions of statistical literacy. Section
5.4 evaluates the success of teaching principles including the use of the
language learning principles. Sections 5.5 examine the language demands
further while Section 5.6 explores the results of trying to be critical with data
and text. As well as themes that emerged from the data there is also an
examination of the research process itself. Section 5.7 looks at the
implications and conclusions from the action research methodology.
5.2 Concepts of statistics
There were a range of positions taken by teachers and students on the
nature of statistics evident in this research. The approaches taken by the
teachers appear to have had some effect on the attitudes of students and
what occurred in the classroom.
5.2.1 Statistics as skills
Teachers attempted to adopt an approach of teaching statistics that was
more than passing on a set of skills or algorithms to students. While
teachers in the research admitted that this had been a feature of statistics
teaching in previous years, there was considerable evidence in the
comments made and observations during lessons that teachers were actively
trying to develop their teaching beyond a skills based programme. There did
continue to be some lessons based on the teaching of skills and the
practising of procedures. However, these generally occurred in response to
lessons more focused on investigation or interpreting reports.
Despite the teachers’ stance, a group of students still held views that
statistics was a set of skills to be learnt. Both observations and follow-up
Developing statistical literacy with students and teachers in the secondary mathematics classroom. 142
interviews showed that at least some students still wanted single or short
answers to questions posed or tasks provided.
What is not clear from the research is whether the beliefs held by students in
this group were due to the message not being clear from teachers or whether
it was due to other factors. Wider issues about the nature of mathematics
and statistics or the nature of learning may be more important. Graham
(2006) states that teaching statistics as a set of mathematical skills impacts
on the attitudes and beliefs of students. If students are ever to see statistics
as investigating data or critiquing statistical reports then teachers will have to
model that in their teaching programmes.
5.2.2 Statistics as process
All of the teachers in the research embraced the notion of statistics as an
investigation process. The adoption of the PPDAC statistical investigation
cycle from Wild and Pfannkuch (1999) was seen as a real success. The
importance of PPDAC cycle and statistical investigations was central to the
teachers’ definition or redefining of the nature of statistics.
Similarly, the majority of students incorporated the PPDAC cycle into their
definitions of statistics. The ‘data detective’ poster and the use of the
PPDAC acronym were frequently mentioned.
The definition of statistics as the investigation process was the dominant
definition adopted by teachers and students in this research. This was in
conflict with my own definition of statistics which was heavily influenced by
my research in the literature review and previous work with literacy and
language. For example, Wild and Pfannkuch’s (1999) model for statistical
thinking encompasses four dimensions that include the investigation cycle,
interrogative cycle, ways of thinking and dispositions. The other three
dimensions are not generally expressed by teachers and students. Similarly,
Gal (2002) and Watson (2006) both describe a wider definition of statistical
enquiry that includes dispositions, ‘worry questions’ and being critical with
data as well as investigating data.

Developing statistical literacy with students and teachers in the secondary mathematics classroom. 143
Teachers initially voiced some misgivings about the amount of data that
students would be able to deal with when undertaking an investigation.
However, over the period of the statistics unit teachers became more
comfortable with larger data sets. The scheme focussed predominately on
teaching with data provided. There were some activities where the data was
generated by the students. However, as time progressed teachers
expressed a greater desire to use data collected by the students themselves.
5.2.3 Statistics as context Both teachers and students saw the importance of context in the study of
statistics. The move away from textbook activities towards the use of real
data in the statistics unit was noticeable. This was consistent with what Best
(2004) characterises as the ‘social construction’ of statistics. Best (2004)
states that statistics do not exist independent of people and that an
understanding of who collects what data and why is important.
5.2.4 Statistics as statistical literacy
Students were much more comfortable than teachers with concepts of
statistical literacy. Including real data and media reports in the classroom
was motivating for some students.
All students were able to attempt open-ended, unfamiliar and challenging
tasks with support. However, students in Teacher A’s extension class
appeared more comfortable attempting tasks that involved analysing and
evaluating than students in Teacher B’s support or Teacher C’s mainstream
classes. Both Anthony and Walshaw (2007) and Alton-Lee (2003) cite
research that illustrates similar situations where top stream classes are more
inclined to tackle tasks requiring a higher level of literacy because students
would have the prerequisite skills to analyse the tasks already. The research
goes further to state that lower ability students often do not get to attempt
cognitively challenging tasks because teachers believe students will have too
many difficulties completing tasks. Unless an attempt is made to change the
teaching and learning of statistics this inequity between students will be

Developing statistical literacy with students and teachers in the secondary mathematics classroom. 144
made worse. Zevenbergen (2005) echoes this sentiment claiming that many
current practices in mathematics teaching are far from empowering for
learners and instead encourage disengagement with the subject.
The provision of good tasks should be seen as related to teacher knowledge
and pedagogy and not perceptions of student ability. Alton-Lee (2003) states
“the teacher’s ability to scaffold learning and to create a learning environment
that scaffolds a student’s understandings is crucial to teaching effectiveness”
(Alton-Lee, 2003, p. 75).
5.3 Concepts of statistical literacy The reason for the scheme focusing on statistical literacy was that statistical
literacy is for data consumers; statistical competence is for data producers. It
was accepted by the teachers that students would spend more time as
consumers of data and statistical analysis than produces of statistics.
However, teachers’ felt that this view moved the teaching of statistics further
away from mathematics towards more of a social science activity. There was
obvious disquiet amongst the group about teaching around issues. There
was concern that they did not possess the appropriate skills to teach this
way. A definition of statistical literacy was negotiated by teachers. This
definition entailed teachers providing more opportunities for analysing and
evaluating data. There was evidence of teachers providing these
opportunities throughout the unit of work.
Activities that focused solely on statistical literacy, such as the Numeracy in
the News activities were the least enjoyed by teachers of any of the activities.
However, teachers noted that more time was spent on such activities than
had been previously. The research states that using media reports is an
important tool for developing the statistical abilities of students. Siegel and
Borasi (1992) state that teachers introducing statistics through students
reviewing newspapers and magazines for everyday uses of statistics can
then help students form the basis for a discussion on how statistics is
interpreted in everyday usage.

Developing statistical literacy with students and teachers in the secondary mathematics classroom. 145
Students appeared more interested in exploring media reports and the
statistical investigations of others. Some students expressed an
understanding of the subjective nature of statistics. Students enjoyed
opportunities to argue and discuss. This is consistent with Gee (1996) who
states that statistics is not neutral and therefore teachers can not develop
statistical literacy by giving students a set of skills or techniques.
Assessment issues arose during the research. The use of Watson and
Callingham’s (2005) Statistical Literacy Construct was useful for diagnosing
where students were at. However, in future cycles of action research it will
be interesting to see how we can match those levels with the summative
assessment levels assigned students for reporting and tracking. Student
achievement must also be part of assessing the effectiveness of teaching
methods. Different ways of assessing students also need to be explored so
that it can be determined whether or not students’ statistical literacy is
improving. This may entail some other measurement instruments, apart from
assessment-similar tasks being developed.
By the end of the first cycle of this research, statistical literacy was seen as
important by all teachers involved. However, statistical literacy not seen as
important by all the students involved. Only one teacher was able to
complete more than a weeks worth of lessons focussing on statistical literacy
while the other teachers completed only parts. By not valuing it I believe that
the teachers were sending messages to their students about the nature of
statistics. More time was still spent in the scheme with students being
producers of statistics rather than consumers of statistics.
Teachers felt that being statistically literate with students would be easier if
appropriate materials could be found that would engage the students.
Weinberg and Abramowitz (2000, Section 1, ¶ 4) describe the challenge as
the need “to find ways of presenting information to our students so that it is
accessible, relevant, applicable, and even vital to their own areas of interest”.
However, using materials that might challenge students in more social or
political ways was rejected by the teachers. The need for a resource like the
PPDAC ‘data detective’ poster was evident. In the next cycle of research it

Developing statistical literacy with students and teachers in the secondary mathematics classroom. 146
will be interesting to see if the teachers can develop a poster that highlights
the worry questions or dispositions of someone who is statistically literate.
5.4 Adoption of teaching principles
The adoption of the principles outlined in the DVD Making Language and
Learning Work 1: Integrating Language and Learning in Secondary Maths
and Science (Ministry of Education, 2007a) changed the way the statistics
unit was taught. There was much more of what Frankenstein (1998) calls
‘nonlinear teaching’. Teaching was often responding to student need rather
than teacher need to complete the syllabus.
There may be other pedagogical approaches that may be suitable for
teachers to use in teaching statistics and statistical literacy. However, the
language learning principles are particularly good as the focus is on
language. In another setting where the students do not exhibit such a wide
range in language skills or where there are less ESOL students other
approaches may be successful. However, in the particular setting of this
research the adoption of language learning principles into mainstream
lessons was successful.
The sharing of resources between teachers did raise some issues for me as
principal researcher or documenter of the action. Firstly, the power of these
immediate exchanges over transcribed video was obvious. The goal of the
research had been to improve the teaching of statistics and to introduce a
notion of statistical literacy. By sharing strategies and observing other
teachers, the participants were able to quickly modify practice in their own
classrooms in response and so change took place.
All teachers created language resources independently. The resources
created often catered for particular needs of particular students. The
resources also depended on the teacher’s view of language and the view of
positive interactions in the classroom. However, there is a need for
leadership from teachers who have literacy skills to share them with their
colleagues just as it is important for students to share with their peers.
Developing statistical literacy with students and teachers in the secondary mathematics classroom. 147
Teacher A was a good example of this. A critical mass of knowledge is
needed for change.
Those teachers who were able to more fully integrate language and learning
had a greater knowledge of language learning and literacy pedagogical
principles. At times teachers struggled to identify the literacy demands of
lessons. When teachers did identify literacy challenges, some teachers felt ill
prepared and unable to address them. This highlights the importance of
identifying teacher prior knowledge and professional development needs.
A need to find a balance in the approaches was also evident. For example,
the importance of the direct teaching of metalanguage, questioning and
careful text selection for guided reading came into conflict with the principle
of being explicit with language and wanting to use materials that would be of
interest to students.
5.5 Language and literacy in the statistics classroom
What was remarkable to me was that all teachers had collected and
developed their own resources independently because they saw the
importance of language in student learning. There was a lot of discussion
about the materials during the unit of work between teachers in the
department office. It also appeared that by adding language objectives to the
scheme alongside the statistics achievement objectives we had provided a
forum where it was possible to discuss best practice around language. In
previous years, when the scheme was planned without a focus on language,
the conversation between teachers around language and literacy did not
occur despite all the teachers adopting some strategies in their own teaching
practice.
Both Anthony & Walshaw (2007) and Alton-Lee (2003) state that students
need to tackle challenging and demanding tasks. This is seen as just as
important for students who may be perceived as low ability or for students in
multi-lingual classrooms and that all students must be given opportunities to
use language to explain and to justify concepts like expert mathematicians.
Developing statistical literacy with students and teachers in the secondary mathematics classroom. 148
Language is seen as critical to success for students. However, Anthony and
Walshaw (2007) asserts that language in the mathematics classroom is
much more than just vocabulary and technical usage and that a focus on the
syntax and way of communicating in mathematics are just as important.
Alton-Lee (2003) highlights research that describes scaffolding of tasks that
can be used to assist students to achieve. Many of the scaffolding
techniques can be seen in the principles described in the Making Language
and Learning Work 1: Integrating Language and Learning in Secondary
Maths and Science DVD (Ministry of Education, 2007a).
There is a tension between scaffolding and supporting students on the one
hand and the “path smoothing” of Watson (2002, p. 462) where tasks are
over-simplified and students just spend time filling the gaps rather than
thinking or reasoning. This is exacerbated in classrooms with low literacy
levels etc because as Anthony and Walshaw (2007) describe tasks that are
to be used for instruction that put more demands on the teacher in terms of
organisation were less likely to be used.
Meaney and Flett (2006) state reading in the mathematics classroom must
be an active part of the learning process. They maintain teachers must
support students in their reading by the use of reading strategies.
Teacher implementation of new approaches was supported by observations
and feedback from other teachers. In each instance, the teachers involved
spoke about the importance of the opportunity for time to reflect on their own
and on their colleagues’ teaching as an aid to understanding more about
literacy and as a means to think about the implications of their learning to
their own practice.
Once the unit of work was finished it was important that the action research
was geared to making sure that the teaching and learning approaches
adopted were trialled again and that ways to promote them so they could
become part of wider school practice. Teachers wanted to reinforce the
ideas learnt by reviewing the scheme regularly and address professional
development needs from it.

Developing statistical literacy with students and teachers in the secondary mathematics classroom. 149
The need for the use of reading strategies was highlighted. Siegel and
Borasi (1992) state that reading strategies promote social interaction
between students which supports their efforts to work out a meaning for the
text. It also encourages them to take ownership for their reading/learning
experiences and promotes an inquiry orientation to learning. Moreover,
Siegel and Borasi (1992) state that such a format works well for ESOL
students who may have difficulty reading textual materials on their own. By
working with a partner, they are given extra support for developing both
reading skills and their knowledge base on statistics.
It is interesting to question whether teachers in other schools and situations
would take language as a focus. The particular context of the school may
make it easier to adopt language learning principles.
Teachers did not resolve the conflict between providing support for students
and providing too much support for students. They were aware of the
difficulty of producing resources (vocabulary lists of keywords and phrases,
reading guides etc...) that support student learning rather than substituting for
student learning where the teacher does all the work.
5.6 Adopting a critical statistical literacy
A tension existed throughout the research between my goals of critical
literacy compared to the functional literacy of other teachers. I feel some
ambiguity existed because we chose to use language learning principles in
the teaching of statistical literacy. This made it difficult for the teachers to
move from focusing on English literacy skills to focusing on a critical literacy
stance in statistical literacy. Part of the problem was also my lack of ability to
describe a useful definition of critical literacy for the teachers involved or
describe the implications of adopting a critical literacy stance.
However, critical literacy has been described by others. For example,
Sandretto et al.’s (2006) research describes a study undertaken in primary
classrooms where the students often “don’t know what they don’t know”

Developing statistical literacy with students and teachers in the secondary mathematics classroom. 150
(p.26). In the research this did not stop the researchers/teachers from
continuing and they continued to make students aware of possible multiple
readings of the text. Critical literacy is a critical thinking tool that “encourages
readers to question the construction and production of texts” (p.23).
Compare this with mathematics and statistics education researchers like
Schield (2005b) and Watson (2006) who assert that statistical literacy is
critical thinking.
Understandings of critical literacy are emerging in the group of teachers
involved in the research. Brown and England (2004) state that the shifts
depicted in an action research project “are not so much in moving towards
the perceived solution, but rather in successively reframing the parameters in
which the research situation is being understood” (Brown & England, 2004, p.
77). Therefore, it can be accepted that no final solution has been reached
but rather the beginnings of a different and much deeper understanding of
the situation has began.
These small steps of reframing the situation and trialling approaches are a
process that I, the other participants and we as a group of teachers are going
through. The differences in the way that I see the situation and the other
participants see conceptions of statistical literacy or critical literacy help with
both our own understandings and may help us keep the conversation going
beyond the first cycle of action.
The research participants were able to see statistical literacy as more than
just literacy skills. Skovsmose’s (2005, p. 186) call for a “…broadening of the
notion of literacy to include a competence of critical citizenship” that
describes a more radical view of mathematics and mathematics teaching
which should foster critical mathematics literacy and empower students to
become critical citizens in modern society was not adopted by the teachers
involved in the research.
Researchers in both the literacy and statistical arena maintain that texts are
socially constructed and that text is not neutral (Best, 2004; Sandretto et al.,
2006). Sandretto et al. claims that the authors, of say media reports used in
Developing statistical literacy with students and teachers in the secondary mathematics classroom. 151
the classroom, draw on particular ways of viewing and talking about the world
and that these are often the majority discourses. The assumption is made
that the student will be able to draw on them as well. Teachers in the
research believed that students in our context are not necessarily able to do
this for both social and linguistic reasons.
Therefore an important goal was attempting to make these ways of looking at
situations obvious and explicit for students so students could see that ‘texts
have consequences’ (Sandretto et al., 2006, p.24).
How this could be achieved in the classroom is emerging. Teachers saw
their responsibilities in the classroom as creating the environment where they
modelled a questioning stance by giving students multiple understandings of
text or data. This enable teachers to help students “develop a metalanguage
of critical literacy, or a language to talk about critical literacy” (Sandretto et
al., 2006, p.24).
Another consequence of attempting to adopt a critical stance were changes
to the pedagogical practices of teachers.
In lessons where teachers started the short activities before moving to
deeper investigations and analysis the learning was changed. Teachers felt
more able to respond to students’ misunderstandings and questions. Skills
were also addressed as teachers could stop and teach that skill when the
need arose.
As stated previously, these ideas are developing and emerging. As
Skovsmose (2005, p.44) states “critical mathematics education is not to be
understood as a special branch of mathematics education. It cannot be
identified with a certain classroom methodology. It cannot be constituted by
a specific curriculum”. Similarly, Lankshear (1994, p.4) states “ideas of
critical literacy are at best provisional”. The action research that we
undertook may move us to a greater understanding of critical literacy in
statistics. However, we are not there yet.
Developing statistical literacy with students and teachers in the secondary mathematics classroom. 152
5.7 The research process The success of this research can be measured by how the teacher
participants looked at practice and changed. The teachers involved in this
project have a story to share. Action research that allowed for reflection and
opportunities for collaboration was all important for us as teachers. As stated
by Jaworski and Watson (1994), this way of learning but also reflecting on
how we learn was seen as what we as teachers want from our students as
well.
Reflection meant that teachers noticed significant events, shared them with
the other teachers. The critical analysis and subsequent action were all
features of how we acted as a group. I believe that this was a successful first
action research cycle and we are well placed for further improvements in the
future.
Using an action research methodology compared favourably with what we
were asking students to do like becoming critical. The act of attempting
research, especially non-scientific or non-mathematical research, also helped
teachers understand what students might possibly have to go through to
become critically statistically literate.
The participant teachers were able to critically reflect on their teaching with
the researcher. What other processes are needed to allow opportunities for
all teachers to critically reflect?
Some questions arise out of the action research. It is stated that this is a
collaborative curriculum development. However, it is arguable that the
teachers were not involved in the full and final analysis of the data used in
this thesis. How could an even more collaborative partnership be developed
amongst the participants?
The statistical literacy framework and the language learning principles are
referred to as the foundation for the curriculum development. Was this
imposed by me as the principal researcher and how is the framework
amendable to adaptation and change?

Developing statistical literacy with students and teachers in the secondary mathematics classroom. 153
There was a tension throughout the research between my own beliefs and
attitudes and those of us as a group of teachers. I did not see myself as an
expert but I did have a view that I wanted to share. How much of the
research is due to the focus and biases of me as the principal researcher?
As principal researcher I also selected the methods of data collection and
data analysis. Were the methods and analysis tools used the most effective
in generating data? Does the research show the importance of impromptu
meetings and discussions and that much is done on the fly? Does the
research describe the cycles within cycles of action research?
My place as principal researcher or documenter was a challenge to grounded
theory approach adopted in the action research. Participants definitely
noticed things tried actions and then looked at outcomes. Questions and
themes emerged from the data. However, actions were influenced by
theories such as the language learning principles and statistical literacy.
Literature and theory was a feature of research. However, I believe that data
did dictate the selection of an action research methodology.
In this action research I wanted to show what was happening to teachers and
students in the classroom and describe the reflexive action. However, the
research was conducted in actual classrooms there were constraints on its
implementation such as the relatively small of teaching time and availability
of resources. The actions implemented suggested were for actual change in
the classroom. Change was often immediate. However, sometimes I felt
that it in writing for this thesis I was removing the reflection from the
classroom. Was the situation looked at for long enough? Were the right
questions asked and were they asked for the right reasons?
In the end the teacher commitment in terms of time and talking with each
other, the class visits with each other, the discussions in department office
and the sharing of concerns were key to any success in the research.

Developing statistical literacy with students and teachers in the secondary mathematics classroom. 154
As Teacher B’s and Teacher A’s observations from the teacher interview
shows, the strength lay in the teachers themselves.
Teacher B It depends on the mathematics department. There are other departments,
maths departments that don’t work together like ours or share. But, in our
department it is very close and we share, our ideas and resources, and also
if you want to ask something to any teacher here you are free to just to do it
and ask ‘ (Teacher A) can you help me with this?’ or ‘what do you do with
this?’ In that sense whatever comes or happens in the class we can just talk
to each other.
Teacher A Approachable and accessible

Developing statistical literacy with students and teachers in the secondary mathematics classroom. 155
Chapter 6: Implications and recommendations
6.1 Introduction This thesis has attempted to investigate ways to develop statistical literacy in
the secondary mathematics classroom.
In the literature review a brief description was given of the nature and state of
statistics education both internationally and here in New Zealand. An attempt
was made to describe differences between mathematics and statistics. In
doing so a tentative definition of what is meant by statistical literacy was
made. Theoretical frameworks for statistical literacy were then discussed
and links made between the goals of statistical literacy and literacy
education. Particular emphasis was placed on literacy with respect to critical
literacy, including the possibility of a critical statistical literacy. Finally, action
research was suggested as an appropriate method to investigate the
implication of developing statistical literacy in the classroom.
In Chapter 3 the methodology adopted in the research was discussed. An
explanation of the action research process was undertaken. Methodological
issues of trustworthiness, data collection and data analysis were discussed.
My influence and biases in the research were discussed. Finally, a detailed
description of the research setting and participants involved was given.
Analyses of the results of the research were presented in Chapter 4. The
chapter attempts to chronicle the action research process as well as explore
the dominant themes that emerged from the data. Data collected from the
planning phase, classroom observations, student interviews and teachers’
interview undertaken are presented. The themes explored are:
• The concepts of statistics held by students and teachers,
• The concepts of statistical literacy held by students and teachers,
• The adoption of teaching principles,
• The importance of language and literacy in the statistics classroom,
and

Developing statistical literacy with students and teachers in the secondary mathematics classroom. 156
• The challenge of adopting a critical literacy stance in the statistics
classroom.
Chapter 5 was a discussion of the main findings and conclusions taken from
the first cycle of the action research project. The themes were discussed and
links made between the review of the literature in Chapter 2 and the data and
analysis in Chapter 4. Some new ideas emerged and reference was made to
further research.
In this chapter the implications and recommendations of the research are
discussed. In Section 6.2 I hope to give some tentative answers to the
research questions posed by the action research. The large numbers of new
and unanswered questions generated by the research are also discussed. In
Section 6.3 the implications for the participants are discussed, including a
description of possible next steps for the participants. The limitations of the
research are highlighted in Section 6.4. The Chapter finishes with a
discussion of the wider implications of the research and a call for further
research in the area.
6.2 Research questions
The research question posed was;
How can we help students and teachers develop statistical literacy in the
secondary mathematics classroom?
To answer this broader question a number of other questions were posed. In
the following section I will address each of these questions in turn.
What are teachers and students views about the nature of statistics
and statistical literacy in the Mathematics [and Statistics] curriculum?
The research shows that teacher and student views are generally aligned to
the goals and objectives of the 1992 curriculum. The teachers involved in the
research also saw the wider goals of statistical literacy, such as developing
Developing statistical literacy with students and teachers in the secondary mathematics classroom. 157
critical thinking and a critical literacy. The teachers were prepared to make
changes to their practice to achieve these goals.
The inclusion of statistical literacy goals into the Mathematics and Statistics
achievement objectives of the new curriculum (Ministry of Education, 2007c)
may lead to further changes in the views and attitudes of teachers and
students. I believe that this is a real strength of the new Mathematics and
Statistics curriculum (Ministry of Education, 2007b). However, I believe that
there may be issues around the implementation of the new curriculum.
Literacy skills, critical literacy and critical thinking skills need to be taught to
students in mathematics to achieve the goals of a broader definition of
statistical literacy.
Teachers views of statistical literacy match Gal’s (2002) model. Gal focuses
on literacy and critical questions. I feel that the importance of general literacy
skills cannot be underestimated in Gal’s model. This facet is often missing or
avoided by other researchers. It may be because they see it as so obvious
or perhaps because they see it as not as significant as the statistical literacy.
However, teachers in this study felt that students have no chance of
comprehending tasks without literacy skills.
The teachers in this research choose to participate because of their
understanding that some change was needed to the way we taught statistics.
Yet even for our group many of the ideas and concepts were outside our
experience and competence. I would suggest that if the implementation of
the new curriculum is to be successful many mathematics and statistics
teachers will need to go through a similar process of investigation to
understand the demands.
What is needed to facilitate the development of statistical literacy with
students and teachers in secondary mathematics classrooms?
Statistical literacy concentrates on the application of critical thinking skills to
arguments involving statistics. Emphasis is needed on the learner as a
consumer of statistics rather than a producer of statistics. Critical thinking

Developing statistical literacy with students and teachers in the secondary mathematics classroom. 158
and critical literacy are all signalled throughout the new curriculum, in the key
competencies and accompanying achievement objectives. However, being
critical is not an extra that can wait until students have mastered the basics of
statistics. A critical approach should be adopted from the very beginning.
Through statistical literacy, students are presented opportunities to learn to
critically evaluate the statistical information presented to them.
Students need to recognise that statistics and statistical reports either in
teaching materials or in media reports have been written by someone who
made decisions about what meanings are (and are not) represented in the
text. For many of the learners in this research with low literacy levels or who
are perceived as low ability because of literacy issues, this change in
awareness and perspective is one that has rarely appeared in traditional
statistics teaching and learning. However, there is some evidence that being
critical is achievable at all ages and across all literacy levels.
A critical stance ha not often been a feature of teaching in a low decile
secondary school such as the school in this research. Teaching continues to
be dominated by traditional transmission style teaching. While this approach
may be being adopted by teachers trying to be explicit with students about
what is needed for success, teaching of the much more challenging critical
literacy is being avoided.
There is a huge array of suitable resources available for teachers to use in a
statistical literacy classroom. There is easy access to current, topical and
engaging content. However, teachers need to adopt pedagogical
approaches that enable the use of large amounts of data and information in
the classroom
Statistical thinking [literacy] cannot take place in New Zealand classrooms
without access to the appropriate information technology.
How can using language learning principles help students and
teachers to develop statistical literacy in secondary mathematics
classrooms?
Developing statistical literacy with students and teachers in the secondary mathematics classroom. 159
And
How can using the ‘principles of effective teaching for learners from
diverse language and cultural backgrounds’ help students and
teachers to develop statistical literacy in the secondary mathematics
classroom?
I believe that the research shows that language is a key to success for
students in statistics. This appears to be especially the case in such a
school that has a large percentage of Pasifika or ESOL language learners. If
we are going to try to help students become statistically literate we are going
to have to become better at dealing with language in the mathematics
classroom.
The important changes are about classroom methodology rather than content
knowledge. The adoption of language learning principles appears to achieve
this.
I would advocate for teacher professional development that adopts
pedagogical approaches such as Making Language and Learning Work 1:
Integrating Language and Learning in Secondary Maths and Science
(Ministry of Education, 2007a). Approaches that acknowledge the centrality
of language should be part of professional development programmes used
with teachers of mathematics and statistics.
Literacy skills need to be taught to teachers. This can be a challenge for
some teachers of mathematics. However, teachers need time and the
resources to trial, reflect, observe and discuss before they can make
significant differences to their teaching.
What are the appropriate professional development strategies for
teachers to use in this context?
We need to be supported as teachers. However, that support can come from
our peers working in schools. Adopting action research as a process of
changing practice meant that real changes can occur in classrooms.

Developing statistical literacy with students and teachers in the secondary mathematics classroom. 160
Further, observations of others and the sharing of resources allows for
relatively quick changes to practice that have been evaluated and reflected
on by both the teachers and colleagues.
There is also the need for skills and approaches that may not present in the
members of the research. Outside expertise must be sought. We need to
encourage better links between mathematics and statistics teachers. We
need to encourage better links between mathematics and statistics teachers
and teachers working in literacy and language learning. This commitment of
time and energy by teachers needs to be matched with other supports such
as a supportive school climate. Again, this needs to be done within schools
and between schools and outside groups.
6.3 Limitations
The research explored the developing of statistical literacy with students and
teachers. I believe that the data collected in the research is sufficient for the
teachers involved to respond to the research questions posed. However, I
do not believe that I am able to make any statements for others or provide
any well formed or clear guidelines on how to introduce statistical literacy into
Year 9 and 10 mathematics classrooms.
There are limitations in the study that have to be acknowledged. First of all,
the research only involved three classes of students and four participating
teachers. Any findings may not be generalisable to all Year 9 and 10
students and their teachers. Our way of working as a group of teachers and
our perspectives on statistics may be idiosyncratic or peculiar to our setting.
Secondly, it would be unusual for an action research project to only go
through one action research cycle. More cycles will hopefully continue until
the teachers are satisfied with the outcomes. There is also the possibility that
the project does not end. This does not mean the questions and problems
would be the same or that the teachers never reach any conclusions about
the situation (Hughes & Seymour-Rolls, 2000). However, this research is
restrained by my need to provide a written thesis for publication.

Developing statistical literacy with students and teachers in the secondary mathematics classroom. 161
Outcome validity is where there has been a successful resolution of the
research problem. It would be presumptuous to claim any successful
resolution in our case. The process is an on-going one and claims made are
restrained. However, activities and schemes have been altered, adapted and
redesigned as the research has progressed. There was always the
possibility that the research will not offer any solutions or incites.
Finally, there is the limitation of subjectivity versus objectivity. As a participant
in the action research it is difficult to know the extent to which the data has
been selected and, perhaps, other significant data down-played or ignored.
As Bell (1993, p.9) points out; “Inevitably, where a single researcher is
gathering all the information, selection has to be made.....and so there is
always the danger of distortion”. Reliability and validity are, therefore, issues
in the research. It is hoped that I have been able to honestly describe the
research setting and actions.
Research can not be conducted without students and teachers being
affected. It may be impossible to establish the effect of the research itself on
the development of statistical literacy with students and teachers. The
effects of having observers in lessons and being asked to participate in
interviews may have been that participants, both teachers and students, did
and said things that they would not normally do. However, change is one of
the reasons for undertaking action research. Teachers and students
reflecting on their own learning could be considered as good things to occur.
6.4 Wider implications and further research
There needs to be a lot more action research projects undertaken by
teachers. It is in the classroom where any changes to practice as a result of
curriculum change will occur. I would encourage teachers to trial ideas and
importantly work in groups of teachers. It is vital that teachers find time to
reflect and share. I would caution teachers that they will have to make
adjustments to the strategies depending on their own particular contexts.

Developing statistical literacy with students and teachers in the secondary mathematics classroom. 162
In terms of statistics and statistical literacy there are a number of issues and
questions still to be answered. For instance, there are clear descriptions of
what constitutes good statistics and statistical literacy instruction and we are
fortunate that these are communicated in the New Zealand curriculum. It is
exciting to see terms like statistical thinking and statistical literacy described
in the curriculum document as well as notions of critical thinking and critical
literacy in the key competencies and descriptions of effective pedagogy.
However, many of the theories and developments in statistics education are
still relatively new, at least for teachers in schools. I am unsure how many
teachers are aware of the theories and developments in statistics education.
For the a successful implementation of the new curriculum in schools and
classrooms it is necessary that there be an unpacking of what is meant by
statistical literacy for secondary mathematics teachers by the Ministry of
Education, school support services, schools and teachers themselves. While
the production and dissemination of resources will be important it is not
nearly as important as developing the pedagogical practices of teachers. The
new Mathematics and Statistics curriculum must be introduced thoughtfully
and progressively to allow sufficient time for teacher professional
development. Effective professional development that provides ongoing
support is needed for long-term change
There are great models for use in statistics teaching and learning, especially
ones developed by New Zealand researchers. Wild and Pfannkuch’s (1999)
model for statistical thinking is a good start for teachers. The success of their
PPDAC cycle as a description of the investigation cycle is obvious. However,
Wild and Pfannkuch’s model for statistical thinking encompasses four
dimensions that include not only the investigation cycle, but the interrogative
cycle, ways of thinking and dispositions. How the other three dimensions will
be articulated or expressed in the classroom needs to be researched.
A further piece of research could be into the development of a statistical
literacy poster that to help students like the PPDAC cycle Data Detective
poster for statistical investigations or critical literacy poster from (Sandretto et
al., 2006, p.25).

Developing statistical literacy with students and teachers in the secondary mathematics classroom. 163
The linking between different learning areas needs to be explored. There is
a need for learning communities to be established of both mathematics
teachers and teachers of language and language learning. Ways of
developing links with ESOL teachers must be investigated. Alternatively,
links to other teachers who may be comfortable being critical with information
must also be developed. For example the possibility of creating an
interdisciplinary mathematics and social studies curriculum could be
explored.
6.5 Final word This thesis set out to examine ways to develop statistical literacy in the
secondary mathematics classroom. The research shows that teachers see
that a change is needed in the classroom. The evidence showed that it is
possible for groups of teachers to make changes to their teaching
programmes to start to address the teaching of statistical literacy
This research asserts that language and literacy are fundamental to success
in teaching statistical literacy. By starting from a language focus teachers
have a framework that enables them to move from a skills based process
view of statistics to a view of statistics that lends itself to investigation,
analysis and critique. Adopting language focused teaching principles allows
teachers to focus on the skills needed to be statistically literate, with students
able to analyse and interpret the data and information around them
This thesis has also argued that teachers need to move towards a critical
literacy in statistics so as to give students the opportunity to become active
citizens prepared to question the world around them.
Finally, the research hopefully shows that teachers can take action to change
their practice by working together, sharing ideas and reflecting on their
practice
Developing statistical literacy with students and teachers in the secondary mathematics classroom. 164
References
Alton-Lee, A. (2003). Quality Teaching for Diverse Students in Schooling:
Best Evidence Synthesis [BES] Wellington: Ministry of Education
Alton-Lee, A. (2004). A Collaborative Knowledge Building Strategy to
Improve Educational Policy and Practice: Work-in-Progress in the
Ministry of Education’s Iterative Best Evidence Synthesis Programme
Paper prepared for a Symposium at the New Zealand Association for
Research in Education National Conference 2004, Auckland, NZ
Anae M., Coxon, E., Mara, D., Wendt-Samu, T. & Finau, C. (2001). Pasifika
Education Research Guidelines Final Report: Auckland: Uniservices.
Availibility:
http://www.minedu.govt.nz/index.cfm?layout=documentanddocumenti
d=7653anddata=l [cited 22 July 06]
Anderson, G., Herr, K. & Nihlen, A. (1994). Studying your own school: An
educator’s guide to qualitative practitioner research. California, US:
Corwin Press
Anthony, A & Walshaw, M (2007). Effective Pedagogy in
Mathematics/Pangarau Best Evidence Synthesis Iteration [BES]
Wellington: Ministry of Education
Araujo, C. (2006). Statistical Illiteracy In Latin America: A consequence of the
different visions about the meaning of statistics. ICOTS-7 Salvador,
Bahia, Brazil: IASE Availability:
http://www.stat.auckland.ac.nz/~iase/publications.php?show=17 [cited
19 May 07]
Auerbach, E. (1995). The politics of the ESL classroom: Issues of power in
pedagogical choices. In J.W Tollefson (Ed.) Power & inequality in
language education (pp. 9-33) Cambridge: Cambridge University
Press
Australian Education Council. (1991). A national statement on mathematics
for Australian schools. Carlton, Victoria: Australian Education Council
Bakker, A., Chance, B., Li, J. & Watson, J. (2005). Working Group: Report on
Curriculum & Research in Statistics Education. In Burrill, G. &
Camden, M. (Eds.) Curricular Development in Statistics Education:
International Association for Statistical Education 2004 Roundtable.
Developing statistical literacy with students and teachers in the secondary mathematics classroom. 165
(pp 278-283) Voorburg, the Netherlands: International Statistical
Institute
Barbieri, G. A. & Giacché P. (2006). The Worth of Data: The Tale of an
Experience for Promoting & Improving Statistical Literacy. ICOTS-7
Salvador, Bahia, Brazil: IASE Availability:
http://www.stat.auckland.ac.nz/~iase/publications.php?show=17 [cited
19 May 07]
Bauersfeld, H. (1995). “Language Games” in the Mathematics Classroom:
Their Function and Their Effects. In P Cobb & H Bauersfeld (Eds.) The
Emergence of Mathematical Meaning (pp 271-292) Hillsdale, NJ:
Lawrence Erlbaum Associates
Begg, A. (2005). Statistics Curriculum and Development: New Ways of
Working. In Burrill, G. & Camden, M. (Eds.) Curricular Development in
Statistics Education: International Association for Statistical Education
2004 Roundtable. (pp 10-20) Voorburg, the Netherlands: International
Statistical Institute
Begg, A., Pfannkuch, M., Camden, M. Hughes, P., Noble, A. & Wild, C.
(2004). The school statistics curriculum: statistics and probability
education literature review. Auckland: Auckland Uniservices Ltd,
University of Auckland.
Bell, J. (1993). Doing Your Research Project. Buckingham, Philadelphia:
Open
Ben-Zvi, D., & Garfield, J. B. (2004). Statistical literacy, reasoning and
thinking: Goals, definitions, and challenges. In D. Ben-Zvi & J. B.
Garfield (Eds.), The challenge of developing statistical literacy,
reasoning, and thinking (pp. 3-16). Dordrecht, the Netherlands:
Kluwer.
Best, J. (2004). More Damned Lies and Statistics: How Numbers Confuse
Public Issues. California: University of California Press
Beswick, K. (2006). The importance of mathematics teachers’ beliefs. The
Australian Mathematics Teacher, 62(4) 17-22
Biggs, J. & Collis, K. (1982). Evaluating the Quality of Learning: the SOLO
taxonomy. New York: Academic Press
Bloom B. S. (1956). Taxonomy of Educational Objectives, Handbook I: The
Cognitive Domain. New York: David McKay Co Inc.
Developing statistical literacy with students and teachers in the secondary mathematics classroom. 166
Brown, T. & England, J. (2004). Revisiting emancipatory teacher research: A
psychoanalytic perspective. British Journal of Sociology of Education.
25 (1), February 2004; 67-79.
Brunning, D. & Neill, A. (2007). Statistical shifts and the Curriculum.
[Presentation handout] NZAMT Conference: Auckland: September
2007
Bucci, T. (2002). Paradigm parallel pedagogy: The significance of parallel
paradigms. Journal of Educational Thought/Revue de la Pensee
Educative; 36(1), April 2002; 69-85
Burns, R. (1994). Introduction to research methods. Melbourne: Longman
Callingham, R.A., Watson, J.M., Collis, K.F., & Moritz, J.B. (1995).. Teacher
attitudes towards chance and data. In B. Atweh & S. Flavel (Eds.),
Proceedings of the Eighteenth Annual Conference of the Mathematics
Education Research Group of Australasia (pp. 143-150). Darwin, NT:
Mathematics Education Research Group of Australasia.
Carpenter, P., Fennema, E., Franke M.L., Levi, L. & Empson, S. B. (1999).
Children’s mathematics: Cognitively guided instruction. Professional
development materials. Portsmouth, NH: Heinemann.
Chance, B. L. (2002). Components of Statistical Thinking and Implications for
Instruction and Assessment Journal of Statistics Education [Online],
10(3) Availability:
www.amstat.org/publications/jse/v10n3/chance.html [cited 1 July
2007]
Chick, H., Pfannkuch, M., & Watson, J. (2005). Transnumerative thinking:
Finding and telling stories within data. Curriculum matters, 1, 86-107.
Clarke, D.J. & Hollingsworth, H. (2002). Elaborating a model of teacher
professional growth. Teaching and Teacher Education, 18(8), 947-
967.
Cobb, P. (2000). Conducting teaching experiments in collaboration with
teachers. In A. Kelly & R. Lesh (Eds.), Handbook of research design in
mathematics and science (pp. 307-333). Mahwah, NJ: Lawrence
Erlbaum.
Cobb, P., Wood, T., Yackel, E., & McNeal, B. (1992). Characteristics of
classroom mathematics traditions: An interactional analysis. American
Educational Research Journal, 29, 573-604.

Developing statistical literacy with students and teachers in the secondary mathematics classroom. 167
Cobb, P. & Yackel, E. (1995). Constructivist, emergent, and sociocultural
perspectives in the context of developmental research. Educational
Psychologist, 31 (3/4), 175-190.
Cohen, L., Manion, L. & Morrison K. (2000). Research Methods in Education.
(5th Edition) London: Routledge Falmer.
delMas, R. C. (2002). Statistical Literacy, Reasoning, and Learning. Journal
of Statistics Education 10(3), [online]. Availibility:
http://www.amstat.org/publications/jse/v10n3/delmas_discussion.html
[cited 12 June 2007]
Denzin, N.K., & Lincoln, Y.S. (1994). Handbook of qualitative research.
London: Sage.
Doerr, H. M. & Tinto, P. P. (2000). Paradigms for Teacher–Centered,
Classroom-Based Research. In A. E. Kelly & R. A. Lesh (Eds.)
Handbook of Research Design in Mathematics and Science Education
(pp.403-428). Mahwah, NJ: Lawrence Erlbaum Associates Inc.
Falle, J. (2004). Let's talk maths: a model for teaching to reveal student
understandings. [online]. Australian Senior Mathematics Journal; 18(2)
17-27; 2004. Availability:
http://search.informit.com.au/fullText;dn=138393;res=AEIPT [cited 19
Mar 07].
Fillmore, L. W. & Snow, C. E. (2000). What teachers need to know about
language ERIC Clearinghouse on Language and Linguistics [On-line].
Available: http://www.cal.org/ericcll/teachers/teachers.pdf [cited 1 Apr
07]
Franke, M.L., & Kazemi, E. (2001). Teaching as learning within a community
of practice: Characterising generative growth. In T. Wood, B Scott
Nelson & J Warfield. (Eds.), Beyond Classical Pedagogy (pp.47-74).
Mahwah, NJ: Lawrence Erlbaum.
Frankenstein, M. (1998). Reading the World with Math: Goals for a
Criticalmathematical Literacy Curriculum in E. Lee, D. Menkart, M.
Okazawa-Rey (Eds.) Beyond Heroes and Holidays: A Practical Guide
to K-12 Anti-Racist, Multicultural Education and Staff Development,
edited by, Washington, DC: Network of Educators on the Americas
Freebody, P., & Luke, A. (1990). Literacies programs: Debates and demands
in cultural context. Prospect: Australian Journal of TESOL, 5(7), 7-16.
Developing statistical literacy with students and teachers in the secondary mathematics classroom. 168
Freil, S., Curcio, F. & Bright, G. (2001). Making sense of graphs: Critical
factors influencing comprehension and instructional implications.
Journal for Research in Mathematics Education 32(2) 124-158
Gal, I. (2005). Towards probability literacy for all citizens: Building blocks and
instructional dilemmas. In G. Jones (Ed.), Exploring probability in
school: Challenges for teaching and learning. pp. 39-63. Netherlands:
Kluwer Academic Publishing
Gal, I. (2002). Adults’ statistical literacy: Meanings, components,
responsibilities. International Statistical Review, 70(1) 1-51
Gal, I. & Garfield, J.(1997). Curricular Goals and Assessment Challenges in
Statistics Education. In I Gal & J.B. Garfield (Eds.) The Assessment
Challenge in Statistics Education (pp 1 -16) Netherlands: IOS Press
Gal, I. & Murray, S. (2002). Preparing for diversity in statistical literacy:
Institutional and educational implications. The Sixth International
Conference on Teaching Statistics. [online]. Availability:
www.stat.auckland.ac.nz/~iase/serj/SERJ1(2).pdf [cited 10 May 2007]
Garfield, J. (2002). The Challenge of Developing Statistical Reasoning
Journal of Statistics Education [Online], 10(3) Availibility:
www.amstat.org/publications/jse/v10n3/garfield.html [cited 1 July
2007]
Garfield, J. & Gal, I. (1999). Teaching and assessing statistical reasoning. In
I. Stiff & F. Curcio (Eds.), Developing Mathematical Reasoning in
Grades K-12,Chapter 18, Virginia, US: National Council of Teachers of
Mathematics
Gates, P. & Vistro-Yu, C. (2003). 'Is mathematics for all?', in Keitel, C. et al.
(Eds.), Second International Handbook of Mathematics Education,
Dordrecht, Netherlands: Kluwer Academic Publishers
Gee, J. (1996). Social Linguistics and Literacies: Ideology in Discourses.
London: Falmer Press.
Glesne, C., & Peshkin, A. (1992). Becoming qualitative researchers: An
introduction. New York: Longman
Goos, M. (2004). Learning mathematics in a classroom community of inquiry.
Journal for Research in Mathematics Education, 35(4), 258-291.
Gould, R. & Peck, R. (2005). Preparing Secondary Mathematics Educators to
Teach Statistics. In Burrill, G. & Camden, M. (Eds.) Curricular

Developing statistical literacy with students and teachers in the secondary mathematics classroom. 169
Development in Statistics Education: International Association for
Statistical Education 2004 Roundtable. (pp 278-283) Voorburg, the
Netherlands: International Statistical Institute
Graham, A. (2006). Developing thinking in statistics London: Paul Chapman
Publishing
Hatch, G. & Shiu, C. (1998). Practitioner research and the construction of
knowledge in mathematics education. In A. Sierpinska & J. Kilpatrick
(Eds.) Mathematics education as a research domain: A search for
identity – Book 2 Dordrecht, Netherlands: Kluwer Academic Publishers
Hatten, R., Knapp, D. & Salonga, R. (2000). Action Research: Comparison
with the Concepts of ‘The Reflective Practitioner’ and ‘Quality
Assurance’. Action Research E-Reports, 8. Availability:
http://www.fhs.usyd.edu.au/arow/arer/008.htm [cited 28 August 2007]
Hendricks, C. (2006). Improving schools through action research: a
comprehensive guide for educators. United States of America:
Pearson Education
Holmes, P. (1986). A statistics course for all students aged 11-16. In R
Davidson & J. swift (Eds.), Proceedings of the Second International
Conference on Teaching Statistics (pp. 194-196). Victoria, BC:
ICOTS2
Hostetler, K. (2005). What Is "Good" Education Research? Educational
Researcher 34(6), Aug/Sep 2005; 16-21
Huferd-Ackles, K., Fuson, K., & Sherin, M. (2004). Describing levels and
components of a Math-Talk learning community. Journal for Research
in Mathematics Education, 35(2), 81-116.
Hughes, I. & Seymour-Rolls, K. (2000). Participatory Action Research:
Getting the Job Done. Action Research E-Reports, 4. Availability:
http://www.fhs.usyd.edu.au/arow/arer/004.htm [cited 28 August 2007]
Irwin, K. & Woodward, J. (2005). A snapshot in the discourse used in
Mathematics where students are mostly Pasifika (a case study in two
classrooms) In Higgins J. et al (Eds.) foreword Holton D. Findings from
the New Zealand Numeracy Development Project 2004. (pp. 66-73).
Wellington: Ministry of Education.

Developing statistical literacy with students and teachers in the secondary mathematics classroom. 170
Jaworski, B. & Watson, A. (1994). Mentoring, co-mentoring, and the inner
mentor. In Jaworski B. & Watson A. (Eds.) Mentoring in Mathematics
teaching (pp. 124 - 138) London: Falmer Press
Kalantzis, M., Cope, B. (1999). Multicultural Education: Transforming the
Mainstream. In S. May (Ed.) Critical Multiculturalism: Rethinking
Multicultural and Antiracist Education, (pp. 245 - 276), London: Falmer
Press
Kazemi, E., & Franke, M.L. (2004). Teacher learning in mathematics: Using
student work to promote collective inquiry. Journal of Mathematics
Teacher Education, 7. 203-235.
Kemmis, S., & McTaggart, R. (Eds.) (1988). The Action Research Planner.
Melbourne: Deakin University.
Kensington-Miller, B. (2004). Professional development of mathematics
teachers in low socio-economic secondary schools in New Zealand. In
I. Putt, R. Faragher, & M. McLean (Eds.), Mathematics education for
the third millennium: Towards 2010 (Proceedings of the 27th annual
conference of the Mathematics Education Research Group of
Australasia), (pp. 320-327). Sydney: MERGA.
Khisty, L. & Chval K. (2002). Pedagogic discourse and equity in
mathematics: When teachers’ talk matters. Mathematics Education
Research Journal, 14(3). 154-168
Knobel, M. & Healy, A. (1998). Critical Literacies an Introduction. In A. Healy
& M. Knobel (Eds.) Critical Literacies in Primary Classrooms. (pp. 1-
12) Newtown, NSW: Primary English Teaching Association.
Krainer, K. (2005). What is ‘good’ mathematics teaching, and how can
research inform practice and policy? Journal of Mathematics Teacher
Education, 8, 75-81.
Lankshear, C. (1994). Critical literacy. ACT: Australian Curriculum Studies
Association.
Latu, V. (2005). Language factors that affect Mathematics teaching and
learning of Pasifika students In P. Clarkson, A. Downton, D. Gronn, M.
Horne, A. McDonough, R. Pierce, & A.Roche (Eds.), Building
connections: Theory, research and practice. Proceedings of the 28th
annual conference of the Mathematics Education Research Group of
Australasia (pp. 274–281). Sydney: MERGA.

Developing statistical literacy with students and teachers in the secondary mathematics classroom. 171
Li, J. (2005). Statistics Education for Junior High Schools in China. In Burrill,
G., & Camden, M. (Eds.) Curricular Development in Statistics
Education: International Association for Statistical Education 2004
Roundtable. Voorburg, the Netherlands: International Statistical
Institute
Lovitt, C. & Lowe, I. (1993). Chance and Data Investigations; Volume 1
Carlton, Victoria: Curriculum Corporation.
Luke, A. (2000). Critical literacy in Australia: A matter of context and
standpoint. Journal of Adolescent and Adult Literacy, 43(5), 448-461
Marshall, L. & Swan, P. (2006). Using M and Ms to develop statistical
literacy. [online]. Australian Primary Mathematics Classroom; 11(1)
15-21; Availability:
<http://search.informit.com.au/fullText;dn=151736;res=AEIPT> [cited
11 Jul 07].
Mazzillo, T. M. (1994). On becoming a researcher. TESOL Journal, 4(1)
McCormack, B., Illman, A., Culling, J. Ryan, A. &O’Neill. (2002). ‘Removing
the Chaos from the Narrative’: preparing clinical leaders for practice
development. Educational Action Research, 10(3), 335-351
Meaney, T. (2006). Acquiring the mathematics register in classrooms set-
Research Information for Teachers: 3. 39 -43.
Meaney, T. & Flett, K. (2006). Learning to read in mathematics classrooms:
reading and the mathematics classroom. [online]. Australian
Mathematics Teacher; 62(2) 10-16; 2006. Availability:
<http://search.informit.com.au/fullText;dn=153938;res=AEIPT> [cited
21 Mar 07].
Meaney, T. & Irwin, K. (2003). Changing their answers? In 'Educational
research, risks and dilemmas: NZARE/AARE Conference 2003 29
November - 3 December 2003, Auckland New Zealand’. Auckland:
New Zealand Association for Research in Education
Merriman, L. (2006). Using media reports to develop statistical literacy in
Year 10 students. ICOTS-7 Salvador, Bahia, Brazil: IASE Availability:
http://www.stat.auckland.ac.nz/~iase/publications.php?show=17 [cited
1 Nov 07]
MacGregor, M. (2002). Using words to explain mathematical ideas. [online].
Australian Journal of Language and Literacy; 25(1) 78-88; February
Developing statistical literacy with students and teachers in the secondary mathematics classroom. 172
2002. Availability:
<http://search.informit.com.au/fullText;dn=115179;res=AEIPT> [cited
19 Mar 07].
Ministry of Education. (1992). Mathematics in the New Zealand Curriculum.
Wellington: Learning Media
Ministry of Education (2001). Pasifika Education Research Guidelines Final
Report. Anae et al (Eds.): Uniservices; Auckland. Availability:
http://www.minedu.govt.nz/index.cfm?layout=document&documentid=
7653&data=l [cited 22 July 06]
Ministry of Education (2004a). Effective Learning Strategies in Years 9 to 13:
A Guide for Teachers Hay J. & Smith M. (Eds.) Wellington: Learning
Media
Ministry of Education (2004b). Focus on Pasifika Achievement in Reading
Literacy: Results from PISA 2000 Wellington: Ministry of Education
Ministry of Education (2005). Learning for Tomorrow’s World: Programme for
International Student Assessment (PISA) 2003 - New Zealand
Summary Report Wellington: Ministry of Education
Ministry of Education. (2006a). The New Zealand Curriculum: Draft for
consultation 2006. Wellington: Learning Media
Ministry of Education. (2006b). The New Zealand Curriculum: Draft for
consultation 2006 -Mathematics & Statistics Achievement Objectives.
Wellington: Learning Media Availability:
http://www.tki.org.nz/r/nzcurriculum/pdfs/table-mathematics.pdf [cited
12 Apr 07]
Ministry of Education. (2007a). Making Language and Learning Work 1:
Integrating Language and Learning in Secondary Maths and Science
[DVD] Christchurch: Unitech/Visual Learning
Ministry of Education. (2007b). The New Zealand Curriculum. Wellington:
Learning Media
Ministry of Education. (2007c). The New Zealand Curriculum: Mathematics &
Statistics Achievement Objectives. Wellington: Learning Media
Moschkovich, J. (2002). A situated and sociocultural perspective on bilingual
mathematics learners. Mathematical Thinking and Learning. 4(2 & 3),
189-212.
Developing statistical literacy with students and teachers in the secondary mathematics classroom. 173
Murray, L. & Lawrence, B. (2000 0. Practitioner-based enquiry; Principles for
postgraduate research. London, UK: Falmer Press
Mvududu, N (2005). Constructivism in the statistics classroom; from theory to
practice. Teaching Statistics, 27(2), 49-54
Nation, I.S.P. (1989). Group work and language learning. English Teaching
Forum April 1989, 20-24
National Council of Teachers of Mathematics. (2000). Principles and
standards for school mathematics. Reston, VA: NCTM
New Zealand Association for Research in Education (1998). Ethical
Guidelines. Availability: http://www.nzare.org.nz/pdfs/NZARE-Ethical-
Guidelines.pdf [cited 30 Jul. 2006]
New Zealand Teachers Council (2005). Code of Ethics for Registered
Teachers Availability: http://www.teacherscouncil.govt.nz/ [cited 22 Jul
2006]
Ottaviani, M. G. & Luchini, S. R. (2005). Data and Predictions" Emerging as
one of the Basic Themes in the Mathematical Curriculum of the First
Cycle School Level in Italy. In Burrill, G., & Camden, M. (Eds.)
Curricular Development in Statistics Education: International
Association for Statistical Education 2004 Roundtable. Voorburg, the
Netherlands: International Statistical Institute
Parkin, B. & Hayes, J. (2006). Scaffolding the language of maths. [online].
Literacy Learning : the Middle Years; 14(1) 23-35; February 2006.
Availability:
<http://search.informit.com.au/fullText;dn=149379;res=AEIPT> [cited
19 Mar 07].
Pennycook, A. (2001). The politics of pedagogy. In Pennycook, A (Ed.)
Critical Applied Linguistics: A critical introduction. London: Lawrence
Erlbaum Associates.
Pfannkuch, M. (2006). Comparing Box Plot Distributions: A Teacher’s
Reasoning Statistics. Education Research Journal 5 (2) 27- 46
November 2006
Pfannkuch, M. (2001). Assessment of school mathematics: teachers'
perception and practices. [online]. Mathematics Education Research
Journal; 13(3) 185-203; December 2001. Availability:

Developing statistical literacy with students and teachers in the secondary mathematics classroom. 174
<http://search.informit.com.au/fullText;dn=123345;res=AEIPT> [cited
21 Mar 07].
Pfannkuch, M & Horring, J. (2005). Developing Statistical Thinking in a
Secondary School: A Collaborative Curriculum Development. In Burrill,
G. & Camden, M. (Eds.) Curricular Development in Statistics
Education: International Association for Statistical Education 2004
Roundtable. (pp 204-218) Voorburg, the Netherlands: International
Statistical Institute
Pfannkuch, M. & Reading, C. (2006). Reasoning About Distribution: A
Complex Process Statistics Education Research Journal 5 (2) 4 -10
November 2006
Reading, C. (2002). Profile for statistical understanding. Proceedings of the
Sixth International Conference on Teaching Statistics, Cape Town,
South Africa.
Roschelle, J. (2000). Choosing and Using Video Equipment for Data
Collection. In A. E. Kelly & R. A. Lesh (Eds.) Handbook of Research
Design in Mathematics and Science Education (pp.709-731). Mahwah,
NJ: Lawrence Erlbaum Associates Inc.
Rosling, H. (2006). TED: Hans Rosling Video [mpeg] Monterey California:
www.TED.com
Rumsey, D. J. (2002). Statistical Literacy as a Goal for Introductory Statistics
Courses" Journal of Statistics Education [Online], 10(3). Availability:
www.amstat.org/publications/jse/v10n3/rumsey2.html [cited 1 July
2007]
Sandretto, S. and the Critical Literacy Research Team. (2006). Extending
guided reading with critical literacy. set: Research Information for
Teachers. 3 23-28
Secada, W.G. (1992). Race, ethnicity, social class, language, and
achievement in Mathematics. In D. A. Grouws (Ed.) Handbook of
Research on Mathematics Teaching and Learning. (pp 523 – 660)
New York: Macmillan
Schield, M. (2005a). Statistical literacy: Thinking critically about statistics. Of
Significance [Online] 1 (1) Availability: www.apdu.org/publications/
[cited 12 July 2007]
Developing statistical literacy with students and teachers in the secondary mathematics classroom. 175
Schield, M. (2005b). Statistical literacy: A calling IASE/ ISI Satellite, 2005
Availability http:/www.stat.auckland.ac.nz/~iase/publications.php [cited
21 June 2007]
Schield, M. (2004). Statistical Literacy Curriculum Design. 2004 IASE
Roundtable, Lund Sweden. Availability:
http:/www.stat.auckland.ac.nz/~iase/publications.php [cited 21 June
2007]
Simon, M. (2000). Research on the development of mathematics teachers:
The teacher development experiment. In A. E. Kelly & R. A. Lesh
(Eds.), Handbook of research design in mathematics and science
education. (pp. 335-360). Mahwah, NJ: Lawrence Erlbaum
Skovsmose, O. (2005). Travelling through education: Uncertainty,
Mathematics, Responsibility. Rotterdam, the Netherlands: Sense
Publishers
Skovsmose, O. & Borba, M. (2004). Research methodology and critical
mathematics education. In P Valero & R Zevenbergen (Eds.),
Researching the socio-political dimensions of mathematics education:
Issues of power in theory and methodology. (pp. 207-226). Dordrecht,
the Netherlands: Kluwer Academic Publishers.
Stein, M.K. (2001). Teaching and learning mathematics: How instruction can
foster the knowing and understanding of number. In J. Brophy (Ed).
Subject-specific instructional methods and activities. Advances in
Research on Teaching. Vol. 8. New York: Elsevier.
Stoessiger, R. (2002). An introduction to critical numeracy. The Australian
Mathematics Teacher, 58(4), 17-20
Stuart, M. (2005). Mathematical Thinking versus Statistical Thinking;
Redressing the Balance in Statistical Teaching Technical Report
05/07, Department of Statistics, 2005 Dublin: Trinity College
Availability: http://www.tcd.ie/Statistics/staff/michaelstuart.shtml [cited
21 Mar 07]
The University of Waikato (2005). Human Research Ethics Regulations
Availability:
http://calendar.waikato.ac.nz/policies/humanresearchethics.html [cited
20 Jul 06]
Developing statistical literacy with students and teachers in the secondary mathematics classroom. 176
Thornton, S & Hogan, J. (2001). Mathematics for Everybody – implications
for the lower secondary school Availability: http://www.icme-
organisers.dk/dg19/dg19papers/Thornton%20and%20Hogan%20DG
%2019.rtf [cited 1 May 05]
Turner, E., Dominguez, H., Maldonado, L. & Empson, S. (2006). "Facilitating
English language learners' participation in mathematical discussion."
American Educational Research Association (AERA) Annual
Conference, San Francisco, California, April 7-11, 2006
Utts, J. (2003). What educated citizens should know about statistics and
probability. The American Statistician, 57(2) 74-79
Van Zoest, L. (2006). Teachers Engaged in Research: Inquiry into
mathematics classrooms, Grades 9-12. Greenwich, Connecticut:
Information Age Publishing
Wallace, M. & Poulson, L. (2004). Critical reading for self-critical writing. In M.
Wallace & L. Poulson. (Eds.) Learning to read critically in teaching and
learning. (pp.3-36) London: Sage Publications.
Wallman, K. (1993). Enhancing statistical literacy; Enriching our society.
Journal of the American Statistical Association 88(421) 1-8
Watson, A. (2002). Instances of mathematical thinking among low attaining
students in an ordinary secondary classroom. Journal of Mathematical
Behavior. 20(4), 461 – 475.
Watson, J. M. (2006). Statistical literacy at school: Growth and goals
Mahwah, NJ: Lawrence Erlbaum.
Watson, J. M. (2003). Statistical Literacy at the School Level: What Should
Students Know and Do? ISI 54 Berlin 2003 Availability
http:/www.stat.auckland.ac.nz/~iase/publications.php [cited 21 June
2007]
Watson, J. M. (2001). Profiling teachers’ competence and confidence to
teach particular mathematics topics: The case of chance and data.
Journal of Mathematics Teacher Education, 4, 305-337.
Watson, J. M. (1997). Assessing statistical thinking using the media. In I Gal
& J.B. Garfield (Eds.), The Assessment Challenge in Statistics
Education (pp 107 -122) Netherlands: IOS Press
Watson, J. M. & Callingham, R. A. (2005). Statistical Literacy: From
Idiosyncratic to Critical Thinking. In Burrill, G. & Camden, M. (Eds.),

Developing statistical literacy with students and teachers in the secondary mathematics classroom. 177
Curricular Development in Statistics Education: International
Association for Statistical Education 2004 Roundtable, (pp 118-162)
Voorburg, the Netherlands: International Statistical Institute
Watson, J. M. & Callingham, R. A. (2003). Statistical Literacy: A complex
hierarchical construct. Statistics Education Research Journal. 2(2),3-
46
Watson, J. M. & Callingham, R. A. (1997). Data cards: An introduction to
higher order processes in data handling. Teaching Statistics, 19, 12-
16.
Watson, S., Bowen, E., Tao, L. & Earle, K. (2006). The New Zealand
Curriculum Draft for Consultation 2006 Analysis of Long Submissions.
Wellington: Lift Education Availability:
http://www.tki.org.nz/r/nzcurriculum/consultation_feedback_e.php
[cited 12 May 2007]
Weinberg, S., and Abramowitz, S. (2000). Making General Principles Come
Alive in the Classroom. Journal of Statistics Education [Online], 8(2).
Availability:
www.amstat.org/publications/jse/secure/v8n2/weinberg.cfm [cited 3
Nov 2007]
Wild, C.J. & Pfannkuch, M. (1999). Statistical thinking in empirical enquiry
(with discussion). International Statistical Review, 67(3), 223-265.
Wood, T. (1998). Alternative patterns of communication in mathematics
classes: Funnelling or focusing? In H. Steinbring, M. G. Bartolini-
Bussi, A. Sierpinska (Eds.), Language and communication in the
mathematics classroom (pp. 167-178). Reston, VA: National Council
of Teachers of Mathematics
Wright H K. & Lather P. (2006). Editorial: Proliferating perspectives on
paradigm proliferation and educational research. International Journal
of Qualitative Studies in Education.19(1), January-February 2006, 1 –
10
Zevenbergen, R. (2005). The construction of a mathematical habitus:
Implications of ability grouping in the middle years. Journal of
Curriculum Studies, 37(5), 607-619.
Zuber-Skerrit, O. (1992). Action Research in Higher Education: Examples &
Reflections. London: Kogan Page Ltd.
Developing statistical literacy with students and teachers in the secondary mathematics classroom. 178
Zuber-Skerrit, O. (1995). Models for Action Research. In S. Pinchen & R.
Passfield. (Eds.) Moving On: Creative applications of action learning
and action research. (pp. 3 - 29). Queensland, Australia: Action
Research, Action Learning and Process Management.
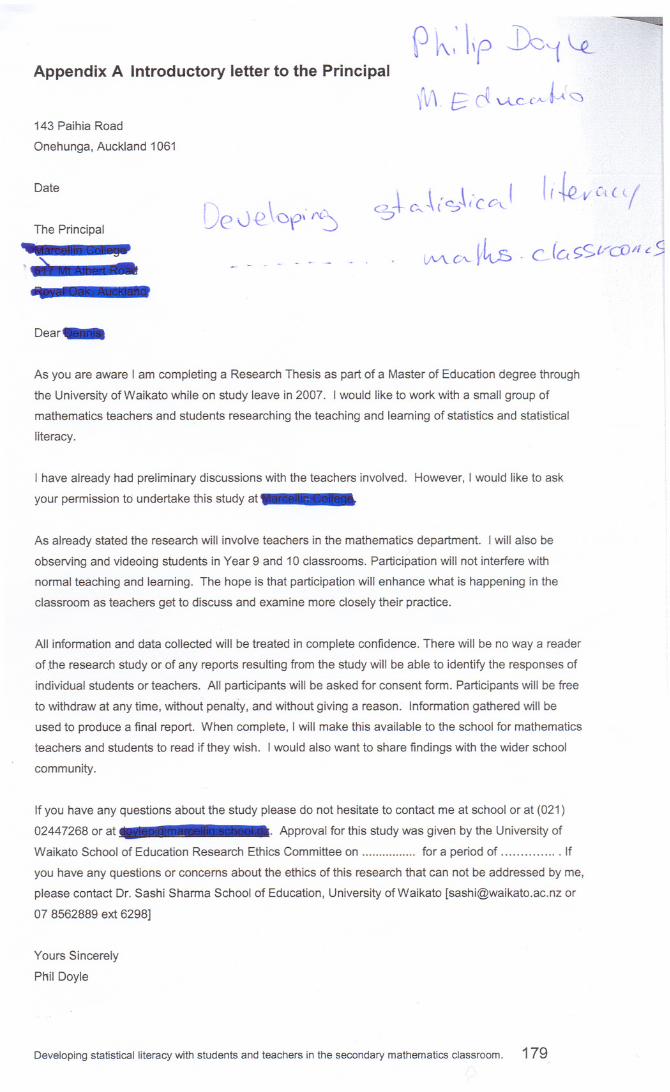
Appendix A Introductory letter to the Principalr ~: IIp J)c'1 ~1\t\.&~ ~c-t'A-~~
143 Paihia Road
Onehunga, Auckland 1061
- - -
~-\- C'"~ {'S~i'C ~ I
~c~ylD
I ( ~v Cl( ((Date
The Principal
- ~,~ -,
De 0Q \Dr" IX~
. cJc( ~S.VcDlf£..9
Dear
As you are aware I am completing a Research Thesis as part of a Master of Education degree through
the University ofWaikato while on study leave in 2007. I would like to work with a small group of
mathematics teachers and students researching the teaching and learning of statistics and statistical
literacy.
I have already had preliminary discussions with the teachers involved. However, I would like to ask
your permission to undertake this study at
As already stated the research will involve teachers in the mathematics department. I will also be
observing and videoing students in Year 9 and 10 classrooms. Participation will not interfere with
normal teaching and learning. The hope is that participation will enhance what is happening in the
classroom as teachers get to discuss and examine more closely their practice.
All information and data collected will be treated in complete confidence. There will be no way a reader
of .the research study or of any reports resulting from the study will be able to identify the responses of
individual students or teachers. All participants will be asked for consent form. Participants will be free
to withdraw at any time, without penalty, and without giving a reason. Information gathered will be
used to produce a final report. When complete, I will make this available to the school for mathematics
teachers and students to read if they wish. I would also want to share findings with the wider school
community.
If you have any questions about the study please do not hesitate to contact me at school or at (021)
02447268 or at . Approval for this study was given by the University of
Waikato School of Education Research Ethics Committee on for a period of . If
you have any questions or concerns about the ethics of this research that can not be addressed by me,
please contact Dr. Sashi Sharma School of Education, University ofWaikato [[email protected] or
078562889 ext 6298]
Yours Sincerely
Phil Doyle
Developing statistical literacy with students and teachers in the secondary mathematics classroom. 179

Appendix B Participant Information Sheet for Teachers/School
Title of research:
Developing statistical literacy with students and teachers in secondary mathematics classrooms.
Explanation of research:
As you are aware, I am interested in language learning and mathematics. I am presently working
towards a further qualification in Education. I am hoping that my study will help me improve the quality
of my teaching and benefit the teaching and learning of mathematics at our school..
As part of my studies I would like to research what we have been doing in our mathematics classes
around'statistics and literacy. Over the next two terms I would like to undertake a small research
project with you and your class that will involve observations of lessons, videoing of lessons &~
interviews. The research will document a unit of work focusing on statistical literacy.
It is up to you to decide whether or not to take part. Refusal to take part will involve no penalty or loss.
Participation will not interfere with your normal teaching. There are no benefits to your participation
other than knowing that you are helping me and hopefully other teachers examine what is effective
practice. I am aware that I am in a privileged position as the HOD of the mathematics department.
Your participation or non-participation will not affect the normal functioning of this relationship.
All information and data collected will be treated in complete confidence. There will be no way a reader
of the research study or of any reports resulting from the study will be able to identify the responses of
individual participants.
If you do decide to take part you will be given this information sheet to keep and be asked to sign a
consent form. If you decide to take part you are still free to withdraw at any time, without penalty, and
without giving a reason.
To indicate your consent to this request for your participation, please complete and sign the attached
consent form and retum it to me. Signed permission is required before any research can take place.
If you have any questions about the study please do not hesitate to contact me at school or at (021)
02447268 or at Approval for this study was given by the University of
Waikato School of Education Research Ethics Committee on for a period of . If
you have any questions or concerns about the ethics of this research that can not be addressed by me,
please contact Dr. Sashi Sharma School of Education, University ofWaikato [[email protected] or
07 8562889 ext 6298].
Many thanks for considering this request.
Mr. Phil Doyle
HOD Mathematics
Developing statistical literacy with students and teachers in the secondary mathematics classroom.180

W"'""'--,~~
Appendix C Participant Information Sheet for Students and their
parents/caregiversTitle of research:
Developing statistical literacy with students and teachers in secondary mathematicsclassrooms.
Explanation of research:
I am studying at the UniversityofWaikato for a Masters in Education. I am interested in language
learning and mathematics. Iwant to look at how we teach statistics. I am hoping that the study canhelp me become a better teacher so Ican help students learn better in mathematics.
As part of my studies Iwould liketo research what we have been doing in our mathematics classes.
Over the next two terms I would like to visit your classroom. The research will show your Mathematics
class at work. The visits will involve observations of lessons, videoing of lessons and interviews. Iwill
observe the whole class. After looking at what is happening I may ask to interview some of you to find
out more or to ask for further explanations I want to look at good statistics teaching that makes iteasier for students to understand statistics.
It is up to you to decide whether or not to take part. You can say no if you do not want to be involved.
Participation will not getin the way of your normal learning and you will not be disadvantaged in any
assessment. There are no benefits to being involved other than having a chance to have your say and
knowing that you are helping your teachers become better teachers.
All information and data collected will be treated in complete confidence. A report will be written at the
end of the research. However, a reader of the research will not be able to identify you in any writing
that comes from the study.
If you do decide to take part you will be given this information sheet to keep and be asked to sign a
consent form. If you decide to take part you are still free to withdraw at any time, without penalty, and
without giving a reason.
If you are happy to be involved, please complete and sign the consent form and return it to your
teacher. Signed permission is required before any research can take place.
If you, or your family, have any questions about the study please do not hesitate to contact me through
school or at (021) 02447268 or at
Many thanks for considering this request.
Mr. Doyle
Developing statistical literacy with students and teachers in the secondary mathematics classroom. 181
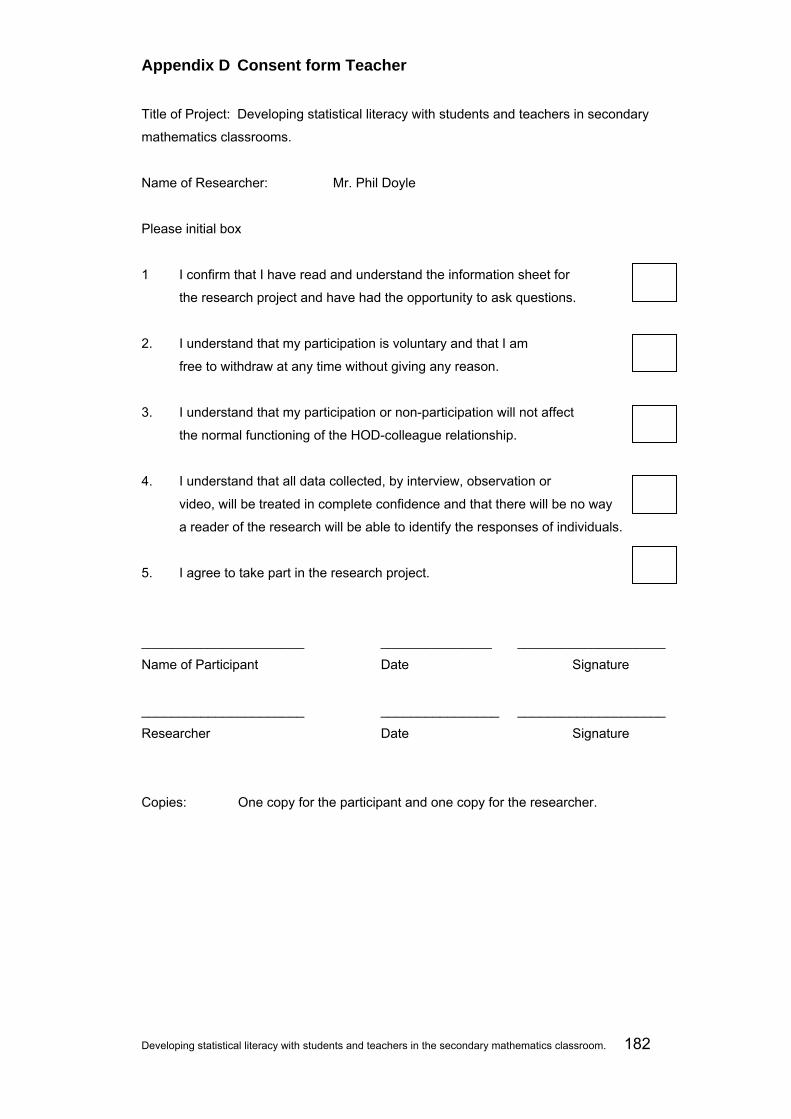
Developing statistical literacy with students and teachers in the secondary mathematics classroom. 182
Appendix D Consent form Teacher
Title of Project: Developing statistical literacy with students and teachers in secondary
mathematics classrooms.
Name of Researcher: Mr. Phil Doyle
Please initial box
1 I confirm that I have read and understand the information sheet for
the research project and have had the opportunity to ask questions.
2. I understand that my participation is voluntary and that I am
free to withdraw at any time without giving any reason.
3. I understand that my participation or non-participation will not affect
the normal functioning of the HOD-colleague relationship.
4. I understand that all data collected, by interview, observation or
video, will be treated in complete confidence and that there will be no way
a reader of the research will be able to identify the responses of individuals.
5. I agree to take part in the research project.
______________________ _______________ ____________________
Name of Participant Date Signature
______________________ ________________ ____________________
Researcher Date Signature
Copies: One copy for the participant and one copy for the researcher.
Developing statistical literacy with students and teachers in the secondary mathematics classroom. 183
Appendix E Consent form Student and Parent/Caregiver
Title of Project: Developing statistical literacy with students and teachers in secondary
mathematics classrooms.
Name of Researcher: Mr. Phil Doyle
Please initial box
1 I have read and understood the information sheet for
the research project and have been able to ask questions.
2. I understand that my participation is voluntary and that I am
free to withdraw at any time without giving any reason.
3. I understand that all information collected by Mr. Doyle will
be confidential and that I will not be identified.
4. I agree to take part in the research project.
________________________ ________________ __________________
Name of Participant Date Signature
________________________ ________________ __________________
Parent / Caregiver Date Signature
[if student is aged under 16]
_________________________ ________________ __________________
Researcher Date Signature
Copies: One copy for the participant and one copy for the researcher.
Developing statistical literacy with students and teachers in the secondary mathematics classroom. 184
Appendix F Focus Interview Questions and Themes
Title: Developing statistical literacy with students and teachers in secondary mathematics
classrooms.
During our initial meeting I would like to explore all or some of the following
• Listing and evaluating our capabilities in statistics and statistical literacy
• Mapping the range of activities to use in the classroom to address the needs of
statistics and statistical literacy
• Analysing gaps between possible practices and current capabilities in order to
identify professional development needs.
• Designing a customised programme to address these gaps.
Because I intend to use an Action Research methodology, responses will somewhat guide
the process.
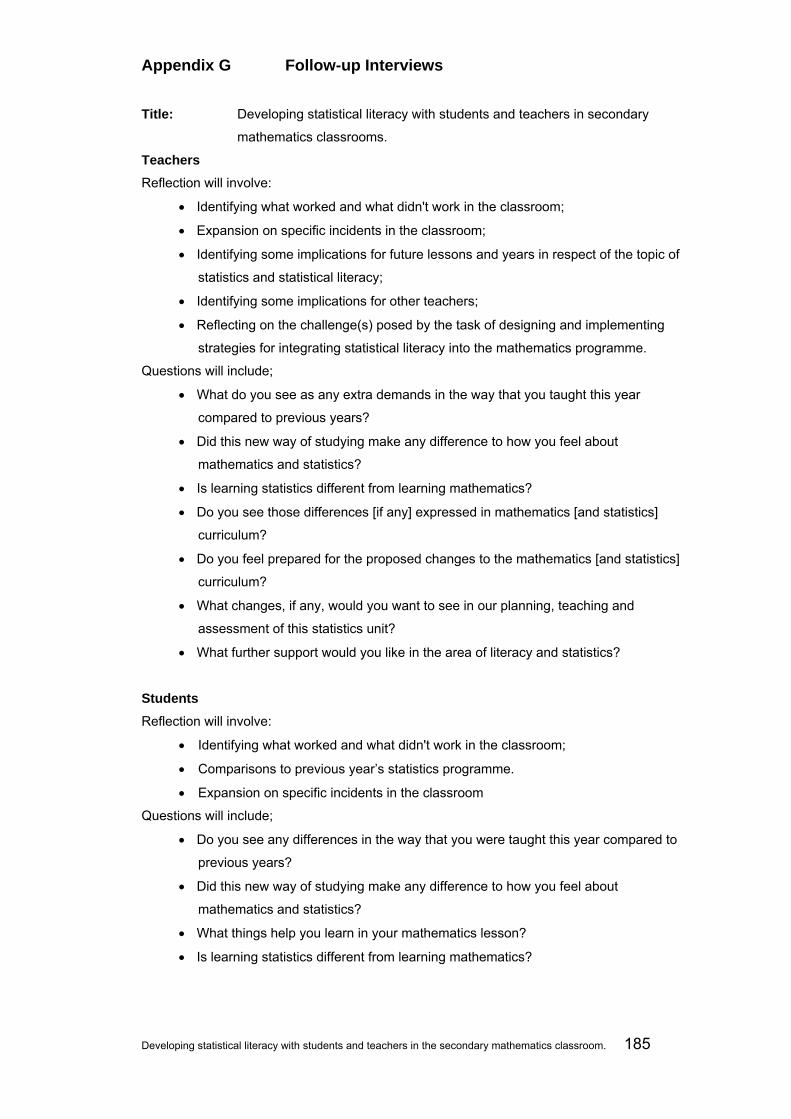
Developing statistical literacy with students and teachers in the secondary mathematics classroom. 185
Appendix G Follow-up Interviews
Title: Developing statistical literacy with students and teachers in secondary
mathematics classrooms.
Teachers Reflection will involve:
• Identifying what worked and what didn't work in the classroom;
• Expansion on specific incidents in the classroom;
• Identifying some implications for future lessons and years in respect of the topic of
statistics and statistical literacy;
• Identifying some implications for other teachers;
• Reflecting on the challenge(s) posed by the task of designing and implementing
strategies for integrating statistical literacy into the mathematics programme.
Questions will include;
• What do you see as any extra demands in the way that you taught this year
compared to previous years?
• Did this new way of studying make any difference to how you feel about
mathematics and statistics?
• Is learning statistics different from learning mathematics?
• Do you see those differences [if any] expressed in mathematics [and statistics]
curriculum?
• Do you feel prepared for the proposed changes to the mathematics [and statistics]
curriculum?
• What changes, if any, would you want to see in our planning, teaching and
assessment of this statistics unit?
• What further support would you like in the area of literacy and statistics?
Students Reflection will involve:
• Identifying what worked and what didn't work in the classroom;
• Comparisons to previous year’s statistics programme.
• Expansion on specific incidents in the classroom
Questions will include;
• Do you see any differences in the way that you were taught this year compared to
previous years?
• Did this new way of studying make any difference to how you feel about
mathematics and statistics?
• What things help you learn in your mathematics lesson?
• Is learning statistics different from learning mathematics?
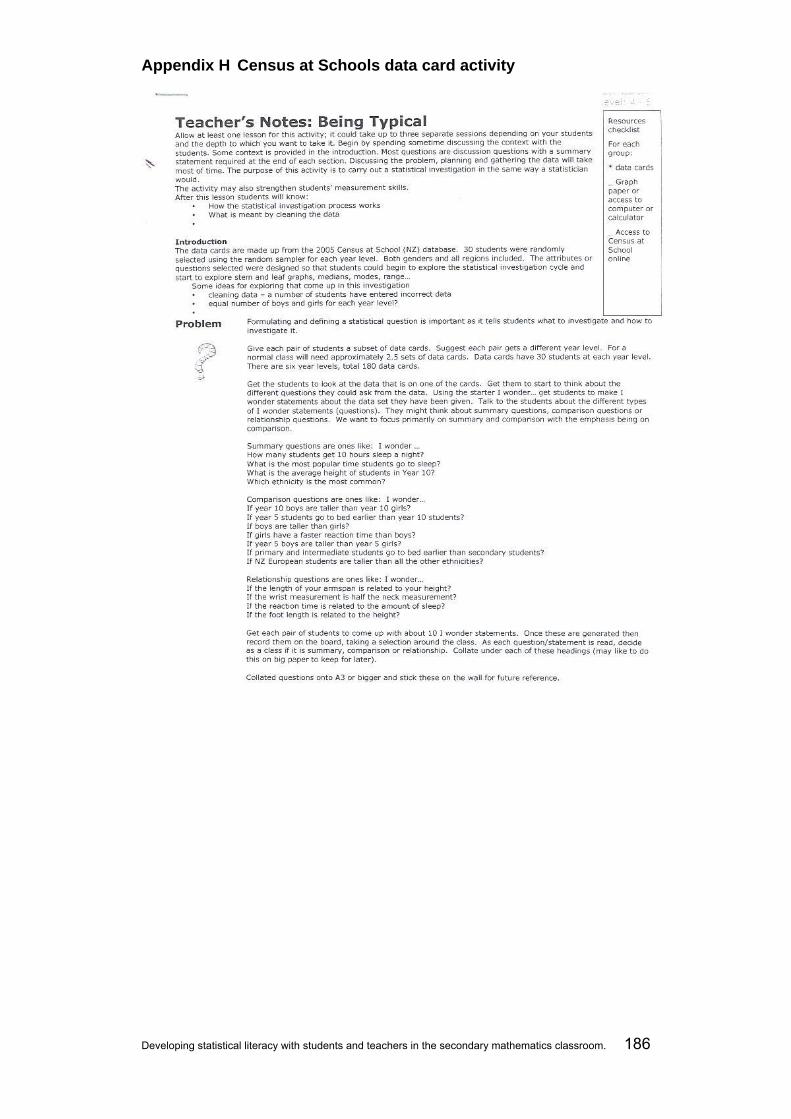
Developing statistical literacy with students and teachers in the secondary mathematics classroom. 186
Appendix H Census at Schools data card activity

Developing statistical literacy with students and teachers in the secondary mathematics classroom. 187
Appendix I Schemes
Old Scheme STATISTICS YEAR 9 TIME ALLOCATION: 7 weeks (25 lessons) ASSESSMENT: Exam asTTle Diagnostic Test ACHIEVEMENT OBJECTIVES:
MiNZC Reference: Level 4 Statistical Investigations: Within a range of meaningful contexts, students should be able to: • plan a statistical investigation arising from the consideration of an issue or an experiment of interest; • collect appropriate data; • choose and construct quality data displays (frequency tables, bar charts and histograms) to communicate
significant features in measurement data; • collect and display time-series data; Interpreting Statistical Reports Within a range of meaningful contexts, students should be able to: • report the distinctive features (outliers, clusters, and shape of data distribution) of data displays; • evaluate others’ interpretations of data displays; • make statements about implications and possible actions consistent with the results of a statistical
investigation. Level 5 Within a range of meaningful contexts, students should be able to: • Plan and conduct statistical investigations of variables associated with different categories within a data set,
or variations of variables over time. • Consider the variables of interest, identify the one(s) to be studied and select and justify samples for
collection. • Find and authenticate by reference to appropriate displays, data measures such as mean, median, mode,
interquartile range and range. • Discuss discrete and continuous numeric data presented in quality displays. • Collect and display comparative samples in appropriate displays such as back-to-back stem and leaf, box and
whisker, and composite bar graphs. Mathematical Processes Level 4/5
Lesson Aim
Textbooks Worksheets /
Equipment Group / Pair
activities Literacy activities
Formulate questions involving social and environmental issues. Discuss how to answer these questions.
Making graphs Activity 1 Activity 2
Activity 3
‘What’s wrong with our world?
Word Find (MM250)
Define discrete and continuous data Math 9: pp.191
Big foot Arm and a leg Nappies
“Information please” Survey classmates Censusatschools
Population, Samples, Census, Questionnaires
Pencil case Pencil case 1 Pencil case 2
Comparing Languages Task; Sampling vs. Census

Developing statistical literacy with students and teachers in the secondary mathematics classroom. 188
Choose and construct quality data displays - Bar (column) Graphs, Dot plots, Picture graphs, Strip (Divided bar) graphs
Alpha pp.392-401 Ex28.1, 28.2, 28.3, 28.4, 28.5
3 level guide Bar graph 1 Bar graph
Pie Graphs Alpha pp. 403 Ex28.6
Frequency tables Alpha pp.425-427 Ex29.5
Computer Graphs - using excel
Stem and Leaf Graphs Alpha Pg407 Ex28.7
Guess how many “macaroni spirals”, and “packaging thingy’s” are in the bags? Weight of school bag OHP
Averages Mean/ Median/ Mode
Alpha Pg417 Ex29.1, 29.2, 29.4
RIME pack – Estimating Averages
3 level guide - Data
Spread Range/ Interquartile Range Beta Pg
Box and whisker graphs Beta Pg Mix and match graphs
Grouping data and Histograms
Alpha Pg 428 Ex29.6 Math 9 Pg212-218
Time-Series Data Alpha Pg410 Ex28.8 or, Maths 9 Pg 231-232
Sum Fun 106, or BL 62
Discuss and recognise misleading graphs
Alpha Pg Beta Pg
Plan a statistical investigation NZMaths –
Censu@schools Figure it out
Carry out a statistical investigation NZMaths – Cars Figure it out
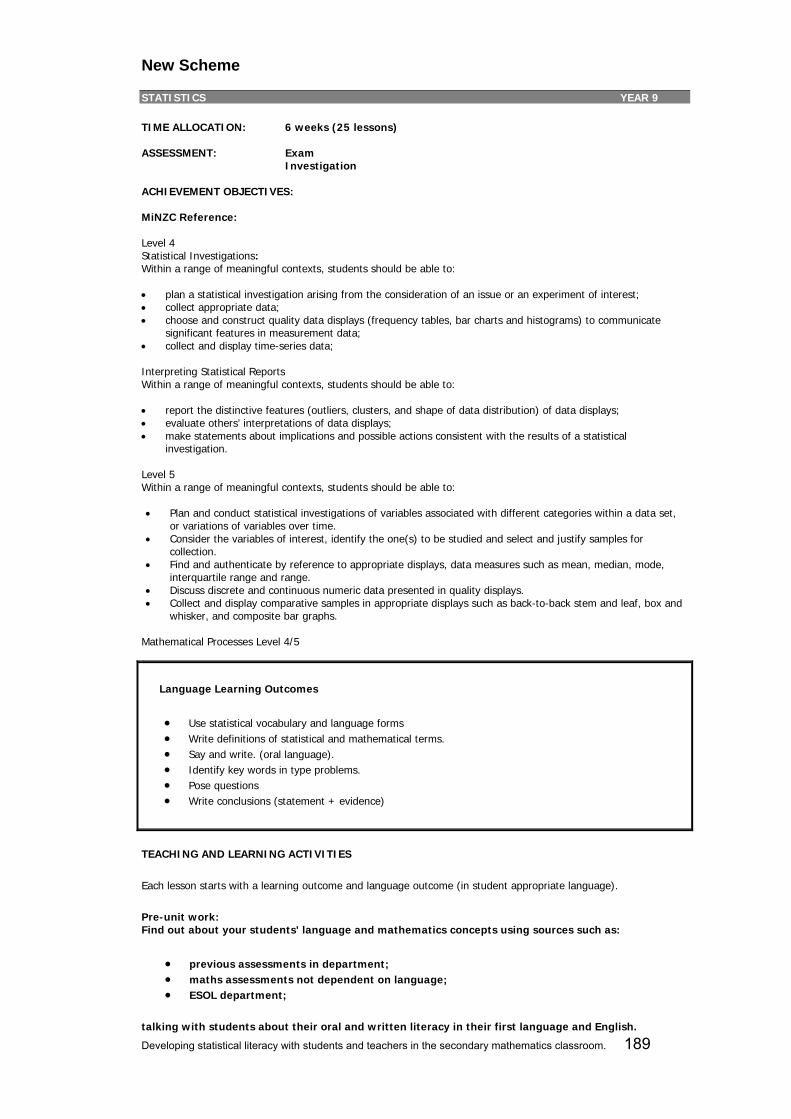
Developing statistical literacy with students and teachers in the secondary mathematics classroom. 189
New Scheme
STATISTICS YEAR 9 TIME ALLOCATION: 6 weeks (25 lessons) ASSESSMENT: Exam Investigation ACHIEVEMENT OBJECTIVES:
MiNZC Reference: Level 4 Statistical Investigations: Within a range of meaningful contexts, students should be able to: • plan a statistical investigation arising from the consideration of an issue or an experiment of interest; • collect appropriate data; • choose and construct quality data displays (frequency tables, bar charts and histograms) to communicate
significant features in measurement data; • collect and display time-series data; Interpreting Statistical Reports Within a range of meaningful contexts, students should be able to: • report the distinctive features (outliers, clusters, and shape of data distribution) of data displays; • evaluate others’ interpretations of data displays; • make statements about implications and possible actions consistent with the results of a statistical
investigation. Level 5 Within a range of meaningful contexts, students should be able to: • Plan and conduct statistical investigations of variables associated with different categories within a data set,
or variations of variables over time. • Consider the variables of interest, identify the one(s) to be studied and select and justify samples for
collection. • Find and authenticate by reference to appropriate displays, data measures such as mean, median, mode,
interquartile range and range. • Discuss discrete and continuous numeric data presented in quality displays. • Collect and display comparative samples in appropriate displays such as back-to-back stem and leaf, box and
whisker, and composite bar graphs. Mathematical Processes Level 4/5
Language Learning Outcomes
• Use statistical vocabulary and language forms • Write definitions of statistical and mathematical terms. • Say and write. (oral language). • Identify key words in type problems. • Pose questions • Write conclusions (statement + evidence)
TEACHING AND LEARNING ACTIVITIES
Each lesson starts with a learning outcome and language outcome (in student appropriate language).
Pre-unit work: Find out about your students' language and mathematics concepts using sources such as:
• previous assessments in department; • maths assessments not dependent on language; • ESOL department;
talking with students about their oral and written literacy in their first language and English.

Developing statistical literacy with students and teachers in the secondary mathematics classroom
Lesson Aim Language Aims Activities
Thin
kin
g
L S
T
Man
agin
g Se
lf
Rel
atin
g to
ot
her
s
P &
C
An overview of current knowledge of statistics. Explore current knowledge
Formulate questions involving social and environmental issues. Discuss how to answer these questions.
Writing questions Question forms I notice … I wonder
Making graphs Activity 1, 2, 3 ‘ What’s wrong with our world? Word Find (MM250) NZmaths Averagelooking Census@School Time Use Survey What is a Typical Year 8? Census at schools Nosey parker
-
Discuss features of small amounts of discrete data
Vocabulary
Population, Sample, Census, Survey discrete and continuous
Language of comparison
Math 9: pp.191 Big foot Arm and a leg Nappies“ Information please” Survey classmates Figure it out Level 4+, Statistics, Book Two, Action and Reaction, page 6 Level 4+, Statistics, Book Two, Testing

Developing statistical literacy with students and teachers in the secondary mathematics classroom 191
Compare features of sets of small amounts of discrete data
Collect and display discrete numeric data;
use their own language to talk about the distinctive features, such as outliers and clusters, in their own and others’ data displays
Language of comparison
Pencil case Pencil case 1 Pencil case 2 Comparing Languages Task; Sampling vs. Census Census at schools Figure it out ARB’s
Choose and construct quality data displays
Bar (column) Graphs, Dot plots, Picture graphs, Strip (Divided bar) graphs
Vocabulary technical vs everyday 3 level guide
Alpha pp.392-401 Ex28.1, 28.2, 28.3, 28.4, 28.5 Bar graph 1 Bar graph 2 Figure it out ARB’s Census at schools Are you a masterpiece?
The case of the missing cake
Constructing Pie Graphs Alpha pp. 403 Ex28.6
Constructing and Using Frequency tables Alpha pp.425-427 Ex29.5

Developing statistical literacy with students and teachers in the secondary mathematics classroom 192
Collect information
Sort information into categories
answer questions by sorting, organizing and arranging information
make sensible statements about the information with supporting evidence
Figure it out ARB’s
Use spreadsheets to display and analyse data (as bar graphs and pie charts) Discuss features of data display
Displaying data using Dot plots and Stem and Leaf Graphs Vocabulary
Alpha Pg407 Ex28.7 Census at schools Big Foot Activity Guess how many “macaroni spirals”, and “packaging thingy’s” are in the bags? Weight of school bag OHP Figure it out ARB’s
Comparing data displays Language of comparison
Census at schools
Bear Hugs
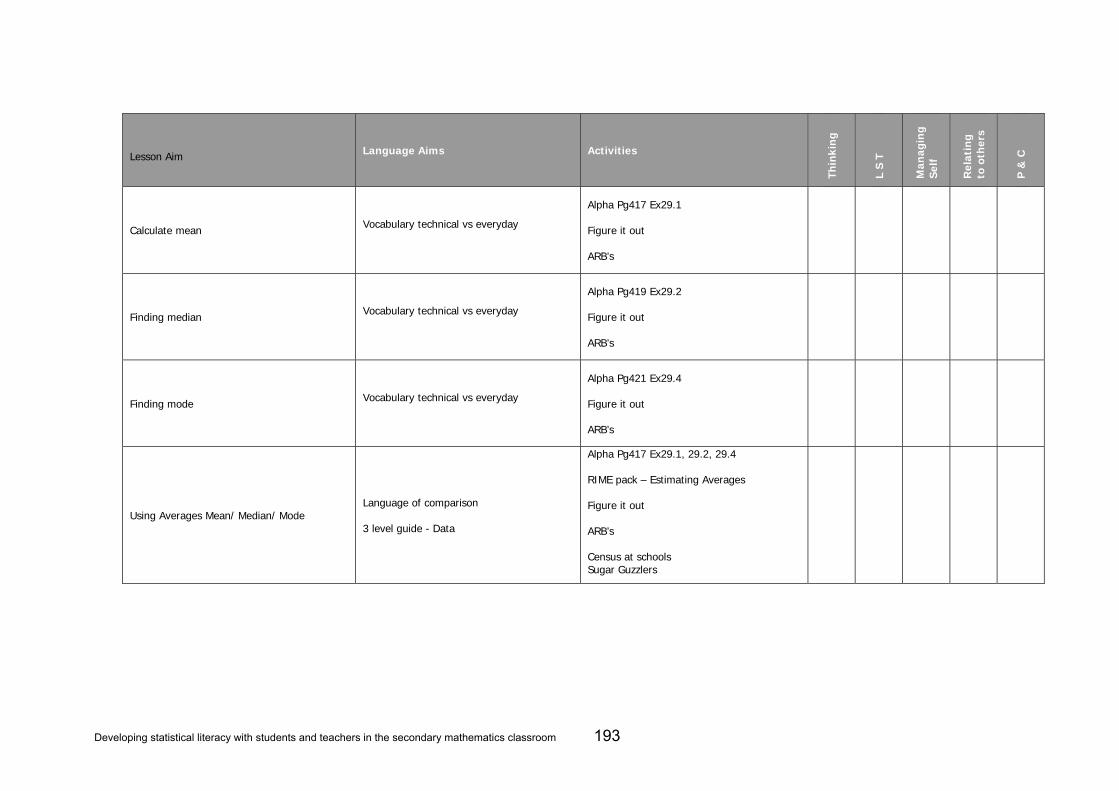
Developing statistical literacy with students and teachers in the secondary mathematics classroom 193
Lesson Aim Language Aims Activities
Thin
kin
g
L S
T
Man
agin
g Se
lf
Rel
atin
g to
oth
ers
P &
C
Calculate mean Vocabulary technical vs everyday
Alpha Pg417 Ex29.1 Figure it out ARB’s
Finding median Vocabulary technical vs everyday
Alpha Pg419 Ex29.2 Figure it out ARB’s
Finding mode Vocabulary technical vs everyday
Alpha Pg421 Ex29.4 Figure it out ARB’s
Using Averages Mean/ Median/ Mode Language of comparison 3 level guide - Data
Alpha Pg417 Ex29.1, 29.2, 29.4 RIME pack – Estimating Averages Figure it out ARB’s Census at schools Sugar Guzzlers
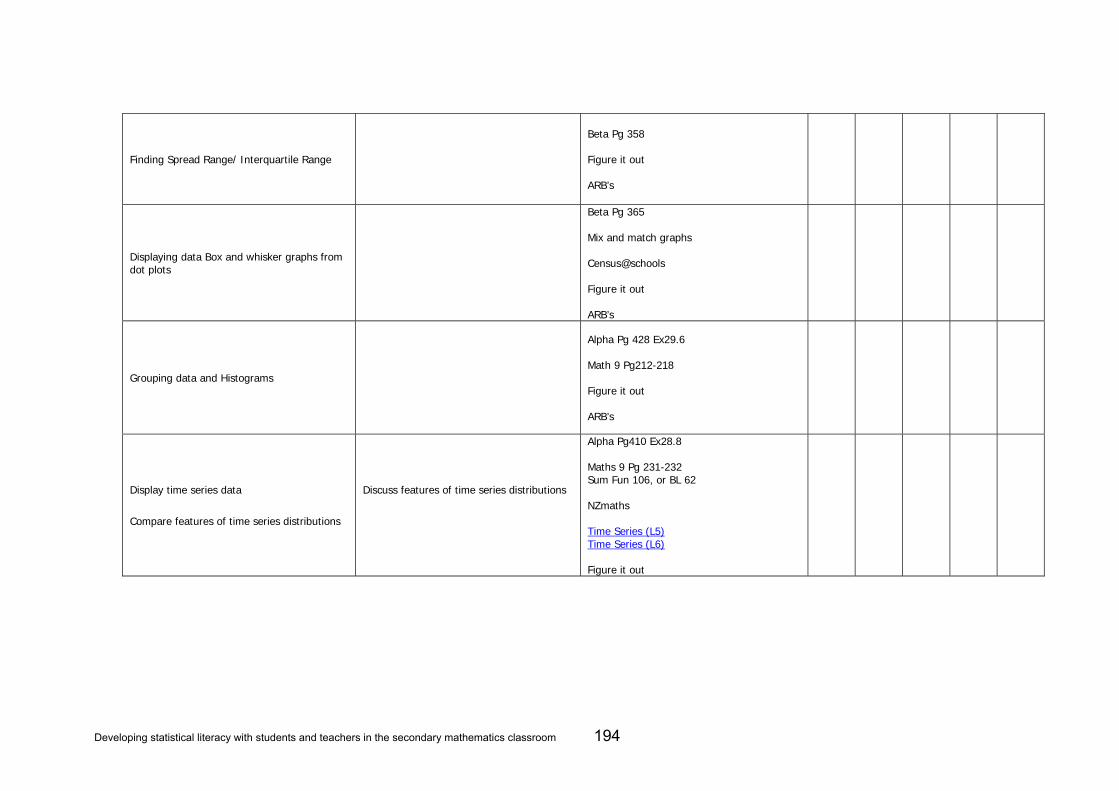
Developing statistical literacy with students and teachers in the secondary mathematics classroom 194
Finding Spread Range/ Interquartile Range
Beta Pg 358 Figure it out ARB’s
Displaying data Box and whisker graphs from dot plots
Beta Pg 365 Mix and match graphs Census@schools Figure it out ARB’s
Grouping data and Histograms
Alpha Pg 428 Ex29.6 Math 9 Pg212-218 Figure it out ARB’s
Display time series data
Compare features of time series distributions
Discuss features of time series distributions
Alpha Pg410 Ex28.8 Maths 9 Pg 231-232 Sum Fun 106, or BL 62 NZmaths Time Series (L5) Time Series (L6) Figure it out

Developing statistical literacy with students and teachers in the secondary mathematics classroom 195
Discuss and recognise misleading graphs
Alpha Pg 321 Beta Pg 378 Numeracy in the News Census at schools Chocolicious
Rumbling Tum
Analyse media reports and statistical reports of others Report on possible sources of error and limitations in displayed data.
Alpha Pg 321 Beta Pg 378 Numeracy in the News
Plan and conduct an investigation to ascertain information from a set of data
NZ Maths Measuring up* Sports statistics * Cars * Travel to school 1 * Travel to school 2 * Marble Roll Census@schools Figure it out
Report the results of the investigation concisely and coherently
make sensible statements about an assertion on the basis of evidence from a statistical investigation;
make statements about implications and possible actions consistent with the results of a statistical investigation
Census at schools
Notes: Please highlight Activities/Resources used for each lesson aim for unit evaluation
Please add new Activities/Resources to grid for unit evaluation. Master copies may be needed for resource room.