Embed Size (px)
Citation preview
DEVELOPMENT OF A FRAMEWORK FOR PRELIMINARY RISK ANALYSIS IN TRANSPORTATION
PROJECTS
by
Wei Guo
A Thesis
Submitted to the Faculty
of the
WORCESTER POLYTECHNIC INSTITUTE
in partial fulfillment of the requirements for the
Degree of Master of Science
in
Civil Engineering
December 2004 APPROVED: Professor Guillermo F. Salazar, Advisor Professor Leonard D. Albano Professor Frederick Hart
ABSTRACT
Over the years, risk analysis methodologies have been developed and
implemented by many industries. NASA has implemented a cost efficient
Continuous Risk Analysis methodology with good results. The U. S. Department
of Transportation also states that a continuous risk analysis is the key in
identifying, addressing, and handling risks before they become threats to success.
However, current practices seldom incorporate this concept into real
transportation projects. In general, risk is simply disregarded in feasibility studies.
One of primary reasons is the lack of a feasible and effective risk analysis
approach to guide efficient implementation in real projects.
This thesis reviews current risk analysis practices used in public transportation
projects. Using a case study, it also explores potential obstacles encountered in the
implementation of systematic risk analysis. Finally, this thesis presents a
preliminary risk analysis framework developed through the case study and
enriched subsequently by incorporating material documented in the literature.
The proposed risk analysis approach is to help achieve continuous risk analysis in
transportation projects by enabling early start, frequent implementation, extensive
application and flexible adoption.
I
ACKNOWLEDGEMENTS
With a deep sense of gratitude, I wish to express my sincere thanks to my advisor,
Professor Guillermo F. Salazar, for his encouragement, stimulating suggestions,
and immense help in planning and executing the works in time. The confidence
and dynamism with which Professor Salazar guided the work requires no
elaboration. On the other hand, profound knowledge and timely wit came as a
boon under the guidance of Professor Salazar. His valuable instructions and
suggestions during the course of work are greatly acknowledged.
My sincere thanks are due to Professor Leonard D. Albano for providing me
constant encouragement and extending timely help. The instructions and kind
considerations I received from other faculty members of my department are
gratefully acknowledged.
I specially thank Mr. Matthew Keamy for offering me the valuable opportunity
for participating in a real transportation project and providing timely help and
important information for my research all the time. I would like to thank Mr.
Saptarshi Bhattacharya and many executives from Pioneer Valley Transit
Administration for sharing their expertise and experience in risk analysis in
transportation with me and proving important data for my research.
I wish I would never forget the company I had from my fellow research friend Ms.
Jeannette Skoropowski. I enjoyed my work with her a lot. She was also of great
help in research development and my thesis writing.
I also want to thank my parents, who taught me the value of hard work by their
own example. I would like to share this moment of happiness with my mother,
II

father and little sister. They rendered me enormous support during the whole
tenure of my study at Worcester Polytechnic Institute and gave me the
encouragement and motivation to carry out my study and teaching work.
Lastly, I am grateful to my husband Kehan Tian for the inspiration and moral
support he provided throughout my study. Without his loving support and
understanding I would never have completed my present work.
Finally, I would like to thank all whose direct and indirect support helped me
completing my thesis in time.
III
TABLE OF CONTENTS
1 INTRODUCTION ················································································· 1
1.1 Research Background ············································································································· 1
1.2 Research Objectives················································································································· 2
1.3 Research Outline······················································································································ 3
2 RISK ANALYSIS IN TRANSPORTATION PROJECTS····················· 4
2.1 Current Status of Risk Analysis Techniques········································································ 4 2.1.1 Dynamic Risks ············································································································4 2.1.2 Static Techniques ········································································································5 2.1.3 Development Lags·······································································································6
2.2 Continuous Risk Analysis ······································································································· 6
2.3 Evolution of Risk Analysis Concept ······················································································ 7 2.3.1 Various Risk Analysis Definitions···············································································7 2.3.2 Definitions of Risk Management ·················································································8 2.3.3 Evolution of Risk Analysis Definition ·········································································9
2.4 Overview of Risk Analysis Implementation in Transportation ········································· 9 2.4.1 Typical Characteristics of Transportation Projects·······················································9 2.4.2 Risk Analysis Implementation in Transportation ·······················································10
3 FEDERAL TRANSIT ADMINISTRATION RISK ANALYSIS ··········· 12
3.1 FTA and Its Role···················································································································· 12
3.2 FTA Risk Analysis Background··························································································· 13
3.3 FTA Risk Analysis Fundamentals and Current Status····················································· 14
3.4 FTA Formal Risk Analysis Implementation Criteria ······················································· 14
3.5 FTA Risk Analysis Methodology ························································································· 16 3.5.1 FTA Documented Risk Analysis Process···································································16 3.5.2 FTA Current Formalized Risk Analysis Methodology···············································17
3.6 FTA Risk Analysis Lessons Learned··················································································· 18
IV
4 CASE STUDY ·················································································· 21
4.1 Case Study Introduction ······································································································· 21 4.1.1 Motivation for the Case Study ···················································································21 4.1.2 General Description···································································································21 4.1.3 Project Organization··································································································23 4.1.4 Project Funding ·········································································································24 4.1.5 Project Timeline ········································································································25
4.2 Proposed Risk Analysis Approach······················································································· 28
4.3 Study Evaluations ·················································································································· 29 4.3.1 Cost Evaluations········································································································29 4.3.2 Schedule Evaluations·································································································32
4.4 Case Study Milestone ············································································································ 35 4.4.1 Study Method ············································································································35 4.4.2 Findings and Challenges····························································································36
4.4.2.1 Challenges········································································································36 4.4.2.2 Monte Carlo Limitations ··················································································36 4.4.2.3 Valuation Problem in Risk Analysis·································································38
5 DEVELOPMENT OF PRELIMINARY RISK ANALYSIS FRAMEWORK ················································································· 39
5.1 New Approach Overview ······································································································ 39
5.2 Generic Risk Analysis methodologies·················································································· 39 5.2.1 Construction Risk Management System – CRMS Model···········································40 5.2.2 Integrated Project Risk Analysis Methodology··························································42
5.3 Literature Review Findings and Conclusions ···································································· 44 5.3.1 Conclusions and Perspectives of Generic Risk Analysis Methodology ······················44
5.3.1.1 CRMS Methodology ························································································44 5.3.1.2 Integrated Project Risk Analysis Methodology·················································45
5.4 General Risk Analysis Techniques ······················································································ 46 5.4.1 Qualitative Risk Analysis Techniques ·······································································46 5.4.2 Quantitative Risk Analysis Techniques ·····································································47 5.4.3 Risk Analysis Techniques Selection Criteria ·····························································48
5.5 Risk Analysis Techniques Selection for Case Study ·························································· 51 5.5.1 Project Classification by Complexity·········································································51
5.5.1.1 Theory: ············································································································51 5.5.1.2 Application to Case Study················································································52
5.5.2 Project Classification by Project Size ········································································53 5.5.2.1 Theory··············································································································53 5.5.2.2 Application to Case Study················································································53
V
5.5.3 Project Classification by Organization Risk Maturity Level ······································54 5.5.3.1 Theory··············································································································54 5.5.3.2 Application to Case Study················································································54
5.5.4 Risk Analysis Techniques Recommendation for Case Study ·····································55
5.6 Preliminary Risk Analysis Process for the Case Study····················································· 56 5.6.1 Pre- workshop ···········································································································56
5.6.1.1 Update Project Information and Pre-identify Risks···········································57 5.6.1.2 Identify Workshop Participants ········································································58 5.6.1.3 Develop Workshop Worksheet·········································································59
5.6.2 Workshop··················································································································60 5.6.2.1 Goals················································································································60 5.6.2.2 Workshop Participants ·····················································································61 5.6.2.3 Methodology····································································································62 5.6.2.4 Project Component Discussions ·······································································63 5.6.2.5 Findings and Results ························································································66 5.6.2.6 Challenges and Difficulties ··············································································67 5.6.2.7 Conclusions······································································································68
5.6.3 Post-workshop···········································································································68 5.6.4 Future Improvement ··································································································70
6 IMPROVED PRELIMINARY RISK ANALYSIS FRAMEWORK FOR TRANSPORTATION PROJECTS···················································· 71
6.1 Overview ································································································································· 71
6.2 Development of Risk Checklist ···························································································· 72 6.2.1 Methodology ·············································································································72 6.2.2 Risk Definitions·········································································································72 6.2.3 Risks in Construction ································································································74 6.2.4 Risks in Transportation Projects ················································································76 6.2.5 Generic Risk Checklist ······························································································79
6.3 Improved Preliminary Risk Analysis Framework····························································· 80 6.3.1 Perform a Pre-Analysis Inquiry ·················································································81 6.3.2 Classify Risks and Develop Workshop Worksheet ····················································81 6.3.3 Workshop: Evaluate Risk ··························································································85 6.3.4 Workshop: Perform a Further Analysis and Analyze Results·····································85 6.3.5 Report Records and Evaluate the Risk Analysis Process············································87
6.4 Conclusions and Future Work ····························································································· 87 6.4.1 Conclusions···············································································································87 6.4.2 Future Work ··············································································································88
6.4.2.1 Tests on Real Projects ······················································································88 6.4.2.2 Delphi Method for Improved Risk Communication··········································89
REFERENCES························································································ 90
VI
APPENDICES ························································································· 93
APPENDIX A - Case Study_Project Cost Summary·································································· 93
APPENDIX B – Case Study_Range Estimating ·········································································· 98
APPENDIX C – Case Study_Schedule Documents Issued by FTA ········································ 105
APPENDIX D – Case Study_Schedule Regenerated for Risk Analysis Study ······················ 108
APPENDIX E - Sample Risk Analysis Workshop Feedback Questionnaire ························· 110
APPENDIX F - Workshop Questionnaire Feedback ································································ 111
APPENDIX G – FTA Risk Analysis Program Question Feedback········································· 113
APPENDIX H - FTA Risk Classification Breakdown ······························································ 115
APPENDIX I – Generic Risk Checklist ······················································································ 118
VII

LIST OF FIGURES
FIGURE 2-1. CONTINUOUS RISK MANAGEMENT DIAGRAM .............................................................. 7
FIGURE 3-1. FTA PROJECT & RISK ANALYSIS CRITERIA SUMMARY.............................................. 15
FIGURE 3-2. FTA RISK ANALYSIS METHODOLOGY........................................................................ 18
FIGURE 3-3. FTA RISK ANALYSIS LESSONS LEARNED SUMMARY ................................................. 19
FIGURE 4-1. CASE STUDY_PROJECT OVERVIEW ............................................................................ 23
FIGURE 4-2. CASE STUDY_PROJECT ORGANIZATION CHART ......................................................... 24
FIGURE 4-3. CASE STUDY_PROJECT FUNDING SUMMARY ............................................................. 25
FIGURE 4-4. CASE STUDY_PROJECT ORIGINAL MAJOR MILESTONES ............................................ 25
FIGURE 4-5. CASE STUDY_UPDATED PROJECT MILESTONES ......................................................... 27
FIGURE 4-7. CAST STUDY_COST PROBABILITY DISTRIBUTION ...................................................... 31
FIGURE 4-8. CASE STUDY_SAMPLE RISK PROFILE_COST .............................................................. 32
FIGURE 4-9. CASE STUDY_RISK PROFILE_SCHEDULE.................................................................... 34
FIGURE 5-1. CRMS_RISK IDENTIFICATION.................................................................................... 41
FIGURE 5-2. RISK CATEGORY SUMMARY SHEET............................................................................ 41
FIGURE 5-3. INTEGRATED PROJECT RISK ANALYSIS PROCESS ....................................................... 43
FIGURE 5-4. PROJECT CLASSIFICATION .......................................................................................... 49
FIGURE 5-5. RECOMMENDATIONS OF RISK ANALYSIS TECHNIQUES .............................................. 49 FIGURE 5-6. CASE STUDY_WORKSHOP WORKSHEET..................................................................... 60
FIGURE 5-7. CASE STUDY_WORKSHOP WORKSHEET WITH RESULTS............................................. 66 FIGURE 6-2. FTA RISK DEFINITION................................................................................................ 77
FIGURE 6-3. FTA RISK CLASSIFICATION TABLE ............................................................................ 78 FIGURE 6-4. GENERIC RISK CHECKLIST SUMMARY........................................................................ 80
FIGURE 6-5. RISK CLASSIFICATION ................................................................................................ 82
VIII
1 INTRODUCTION
1.1 Research Background
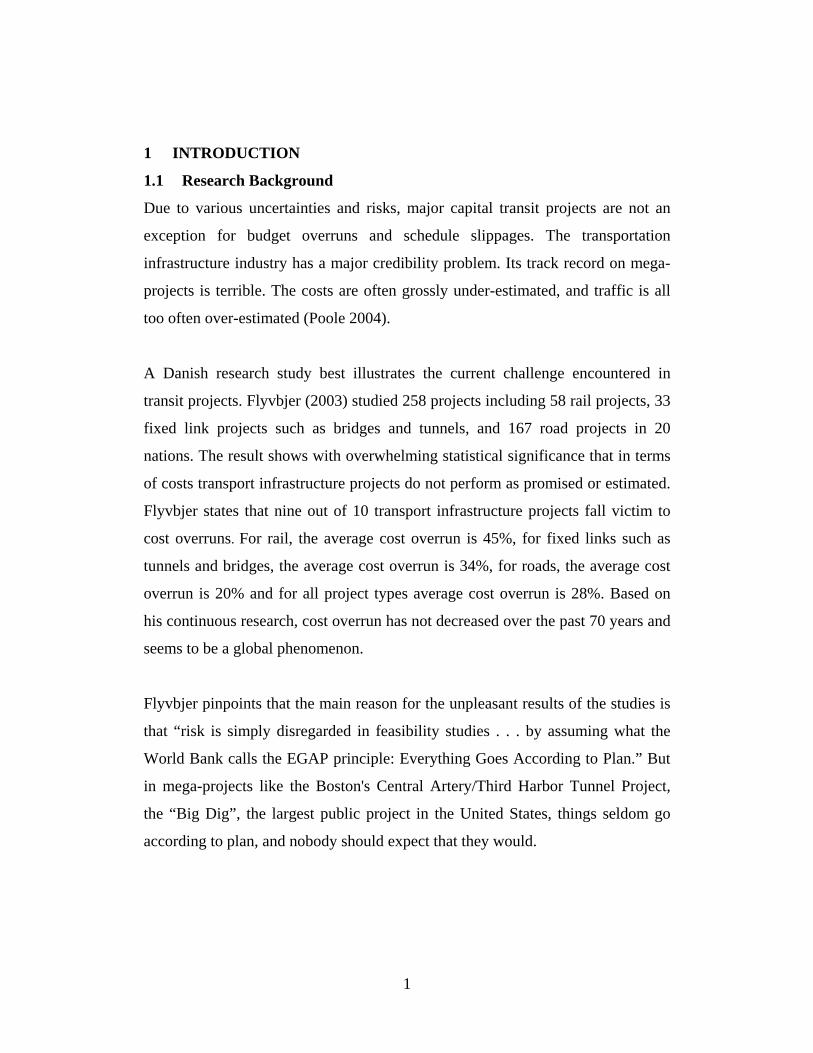
Due to various uncertainties and risks, major capital transit projects are not an
exception for budget overruns and schedule slippages. The transportation
infrastructure industry has a major credibility problem. Its track record on mega-
projects is terrible. The costs are often grossly under-estimated, and traffic is all
too often over-estimated (Poole 2004).
A Danish research study best illustrates the current challenge encountered in
transit projects. Flyvbjer (2003) studied 258 projects including 58 rail projects, 33
fixed link projects such as bridges and tunnels, and 167 road projects in 20
nations. The result shows with overwhelming statistical significance that in terms
of costs transport infrastructure projects do not perform as promised or estimated.
Flyvbjer states that nine out of 10 transport infrastructure projects fall victim to
cost overruns. For rail, the average cost overrun is 45%, for fixed links such as
tunnels and bridges, the average cost overrun is 34%, for roads, the average cost
overrun is 20% and for all project types average cost overrun is 28%. Based on
his continuous research, cost overrun has not decreased over the past 70 years and
seems to be a global phenomenon.
Flyvbjer pinpoints that the main reason for the unpleasant results of the studies is
that “risk is simply disregarded in feasibility studies . . . by assuming what the
World Bank calls the EGAP principle: Everything Goes According to Plan.” But
in mega-projects like the Boston's Central Artery/Third Harbor Tunnel Project,
the “Big Dig”, the largest public project in the United States, things seldom go
according to plan, and nobody should expect that they would.
1
1.2 Research Objectives
Cost overruns in transport infrastructure projects do not isolate from other
uncertainties or risks. Cost overruns combined with other deviations and
uncertainties translate into significant financial risks. Design/construction risks
and financial risks interact and affect the entire project. Scope changes or
optimistic cost estimates, and delay in construction due to external or internal
factors often yield cost overruns. Political atmosphere and financial issues also
contribute to cost overruns. Those risks due to social or political factors are
important. In this research, risks in design, construction and financial affecting
project budget and schedule are the main focus because of the unmanageable
characteristics of political risks.
Risk analysis methodologies have been developed and implemented over the
years in many industries. Transit projects generally have large scales and have
various parties involved including many related communities and numerous
ordinary people who might become the potential clients. The unique
characteristics of transit projects make project management and risk analysis more
important than in other project sectors.
Using less time to meet higher expectations and fewer resources with which to
work is really crucial for business. NASA attempts to achieve the “Faster, Better,
Cheaper” by implementing Continuous Risk Analysis at a cost they can afford
and have received good results (Rosenberg 1999). A continuous risk analysis is not
a totally new concept in transportation infrastructure industry. The Department of
Transportation also states that a continuous risk analysis is the key to identify,
address, and handle risks before they become threats to success (FTA 1994).
2
However, current practices seldom incorporate this concept in real transportation
projects due to various reasons. Moreover, risk is simply disregarded in feasibility
studies. One of primary reasons is the lack of a feasible and effective risk analysis
approach to guide efficient implementation in real transportation projects.
The objective of this research is to develop a preliminary risk analysis framework
to help solve the above application problems of current risk analysis methodology.
Hence, continuous risk analysis could be enabled by implementing the framework,
and then the ultimate target of “Faster, Better, Cheaper” could be achieved by
continuous risk analysis.
1.3 Research Outline
The thesis first explores the potential obstacles in implementing the current
formal structured risk analysis methodologies through a case study.
Terminologies, definitions, techniques, and methodologies are also examined and
clarified in the research.
Then, the thesis presents a preliminary risk analysis framework developed
through a case study and enriched subsequently. The proposed risk analysis
approach is to help achieve continuous risk analysis in transportation projects by
enabling an early start, frequent implementation, extensive application and
flexible adoption.
3
2 RISK ANALYSIS IN TRANSPORTATION PROJECTS
2.1 Current Status of Risk Analysis Techniques
2.1.1 Dynamic Risks
Uncertainties and risks inherently exist in construction projects. Construction
projects are unique comparing to most of other industrial projects. The inherent
uncertainties are generally not only from the unique nature of the project, but also
from the diversity of resources and activities (CII 1989). Moreover, risks are not
always independent and static in construction projects. The effect of two events is
not necessarily the sum of their individual effects. For example, one-day delay
due to snow storm and the same day delay due to a design change are two
independent events, but in combination they have the same consequence – no
work can be done that day. Accordingly, risks are usually dynamic, that is, their
characteristic, probability and impact can change during the project process.
In addition, external factors can have a very significant effect on projects. Project
success is usually measured by its schedule, budget and quality. Broadly, various
risks can affect these three basic factors against the success of a project. In
general, the project scale and complexity have close relation to the schedule of the
project; and at the same time those two aspects have relations with the impact or
severity of risk. That is, in many circumstances, the larger and more complex the
project, the longer the time is required to complete the project, and more severely
will it be affected by project uncertainties and risks.
Thus, for large and complex construction projects, budget overruns and schedule
slippages are not rare and scope changes are inevitable as well. According to the
research report of the FTA, in the United States, cost overruns in large complex
projects such as power plants have been common. Cost estimates for the Boston's
Central Artery/Third Harbor Tunnel Project, the “Big Dig”, which is currently the
4
largest public project in the United States, have been continuously adjusted
upwards in the past years.
2.1.2 Static Techniques
In many industries including construction industry, risk, if left unmanaged, could
have a negative impact on project budget and completion and prevent the project
from meeting its overall objective. If people intend to use appropriate data to
solve problems, make forecasts, develop strategies, and make decisions, then risk
analysis is an essential control tool for project management and an important aid
in decision-making process.
Risk analysis is not far away from our everyday lives. Professional risk analysts
perform risk analysis technologically, while most people rely on intuitive risk
judgments and perceive risks subjectively. The implementation of risk analysis is
increasingly being recognized as a vehicle to help meet project goals as well as
improve project performance at the same time.
Use of formal risk analysis techniques in projects is widespread across many
industries. The value of a proactive formal structured risk analysis approach has
been widely recognized, and many organizations have been or are seeking to
introduce risk processes in order to gain the promised benefits. In many areas its
use is mandatory or required by client organizations, including defense, IT,
offshore, nuclear industries and so on. It appears that risk analysis is a mature
discipline, yet it is still developing and need to be understood better and
implemented by managements.
And risk analysis is a process. There is some way to go before its full potential as
a management tool is realized in construction industry.
5
2.1.3 Development Lags
The construction industry lags much of many other industries in making use of
risk analysis for civil infrastructure projects. And the development and
implementation of risk analysis for transportation infrastructure projects in the
United States also lags those in Europe. Therefore, the importance and urgency of
risk analysis in today's transportation projects in the United States, in face of
financial constraints, has spurred several research efforts in this area. Risk
analysis is full of challenges in transportation infrastructure industry. Yet, it is
imperative that the owners, sponsors and project participants engage in a rigorous,
systematic analysis of major sources of risk.
2.2 Continuous Risk Analysis
Uncertainties are inherent and risks are dynamic. As a project proceeds, a
continuous risk analysis would be more beneficial. Risk analysis should be
applied to all stages of the project lifecycle, from conception, feasibility and
design, through development into implementation, operations and maintenance.
The contribution which risk analysis can make at each stage different, but is
nevertheless of importance.
Risk analysis should start in a very early stage of the project process and need to
be done frequently. Only with the aid of a continuous risk analysis process can
short-term and long-term impact of identified risks are determined and updated,
and hence help decision-making and project management. NASA presents a six-
function of continuous risk management as shown in Figure 2-1.
The six functions of continuous risk management are (1) Identify the risks in a
specific format; (2)Analyze the risk probability, impact/severity, and timeframe;
(3)Plan the approach; (4)Track the risk through data compilation and analysis;
6
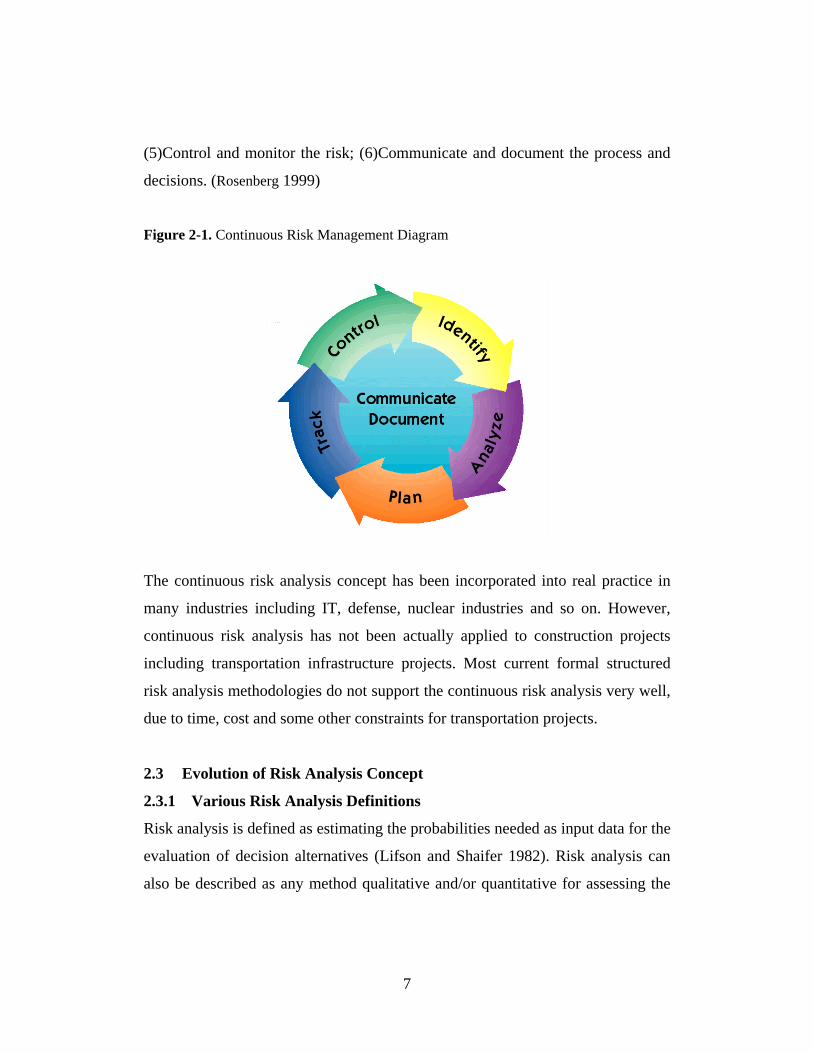
(5)Control and monitor the risk; (6)Communicate and document the process and
decisions. (Rosenberg 1999)
Figure 2-1. Continuous Risk Management Diagram
The continuous risk analysis concept has been incorporated into real practice in
many industries including IT, defense, nuclear industries and so on. However,
continuous risk analysis has not been actually applied to construction projects
including transportation infrastructure projects. Most current formal structured
risk analysis methodologies do not support the continuous risk analysis very well,
due to time, cost and some other constraints for transportation projects.
2.3 Evolution of Risk Analysis Concept
2.3.1 Various Risk Analysis Definitions
Risk analysis is defined as estimating the probabilities needed as input data for the
evaluation of decision alternatives (Lifson and Shaifer 1982). Risk analysis can
also be described as any method qualitative and/or quantitative for assessing the
7
impacts of risk on projects or plans. General Accounting Office defines risk
analysis as a technique to identify and assess factors that may jeopardize the
success of a project or achievement of a goal. This technique also helps define
preventive measures to reduce the probability of these factors from occurring and
identify countermeasures to successfully deal with these constraints when they
develop.
No matter how one defines risk analysis, the objectives of risk analysis in any
field are to determine the probability of failure of a system to meet a
predetermined level of performance during a given period, to improve the
decision-making process within projects, and to help organizations to reduce risk
exposure. However, various definitions always cause confusions and
misunderstanding sometime.
2.3.2 Definitions of Risk Management
There are various definitions for risk management as well. In simple words, they
fall into two statements. One defines risk management as a systematic approach
for identifying, analyzing, communicating, and mitigating risks. This definition
often considers risk analysis as the process of accessing risks, and includes risk
analysis as a part of risk management procedure.
Another defines risk management as the process of evaluating and selecting
action alternatives in response to risk assessment findings. Risk management is
grouped as a follow-up of the previous risk accessing step. This definition is
incorporated in this study. Thus the continuous risk management defined by
NASA above utilizes the first definition of risk management. NASA’s risk
management concept in the continuous risk management is not consistent with the
one is using in this study.
8
2.3.3 Evolution of Risk Analysis Definition
In a broad sense, risk analysis is defined to include risk assessment, risk
characterization, risk communication, risk management, and policy relating to risk,
in the context of risks of concern to individuals, to public and private sector
organizations, and to society at a local, regional, national, or global level by the
Society for Risk Analysis (SRA). Society for Risks Analysis (SRA) is a unique
organization because its membership is drawn from the physical and biological
sciences, engineering and the social sciences.
The scientists and practitioners associated with SRA treat this definition as the
formal risk analysis definition in their researches and actual practices. This
definition of risk analysis is incorporated by an increasing number of
organizations in various industries nowadays. This definition is also implemented
in this study that risk analysis is not only accessing risks, also communicating and
managing risks.
2.4 Overview of Risk Analysis Implementation in Transportation
2.4.1 Typical Characteristics of Transportation Projects
The typical characteristics of transportation projects make project management
and risk analysis more important than others. In general, transportation projects
have a relatively large scale and have various parties involved even including
many related communities and numerous ordinary people who might become the
potential clients. Transportation projects are usually developed in several stages.
It takes longer time to complete a transportation project than others.
Major capital transit projects are not an exception for budget overruns and
schedule slippages due to various uncertainties and risks. The transportation
infrastructure industry has a major credibility problem. Its track record on mega-
9
projects is terrible. The costs are often grossly under-estimated, and traffic is all
too often over-estimated (Poole 2004). Similar to the “Big Dig” project mentioned
above, many recent rail projects have similar, well-documented histories.
Moreover, transportation projects are usually funded by government or public. In
the conventional approach to project development, government is the project
promoter and financier, and private firms who actually conduct the project are
intended to do the best-case feasibility studies, produce the designs, and earn
additional profits by numerous change orders later on. It’s going to be harder and
harder to get public and political support for much-needed mega-projects unless
we can come up with better-performing delivery models. The public-private
partnership for risk allocation and project delivery method are not the focus of
this study. Another critical approach is to incorporate risk analysis into early
project development stage, such as feasibility studies.
2.4.2 Risk Analysis Implementation in Transportation
Risk analysis methodologies have been developed and implemented over years in
transportation infrastructure industry. Headed by an Administrator who is
appointed by the President of the United States within the U.S. Department of
Transportation, Federal Transit Administration (FTA) provides financial
assistance to develop new transit systems and improve, maintain, and operate
existing systems. Federal Transit Administration (FTA) administers a
multibillion-dollar program of financial assistance for grantees 1 that provide
urban and rural public mass transportation. FTA has been aware of the necessity
and urgency of risk analysis and then developed a comprehensive oversight
program including project management oversight.
1 Grantees are the recipients of the allocated funds appropriated by FTA.
10
Risk analysis is becoming more and more critical for the project management
oversight. FTA is improving risk analysis methodologies to enhance the
accountability and management, guidance and training and is attempting to extend
the risk analysis practice to an increased number and type of projects they funded
or monitored.
11
3 FEDERAL TRANSIT ADMINISTRATION RISK ANALYSIS
3.1 FTA and Its Role
The Federal government, through the FTA, provides financial assistance to
develop new transit systems and improve, maintain, and operate existing systems.
FTA administrates this financial assistance according to TEA-21. TEA-21 is the
Transportation Equity Act for the 21st Century, a public law, authorizes the
Federal surface transportation programs for highways, highway safety, and transit.
Each year Congress provides an annual appropriation which funds the programs
specified in TEA-21.
Upon receiving this appropriation, FTA apportions and allocates these funds
according to formulas and earmarks. Generally, FTA funds are available to
designated recipients that must be public bodies, such as states, cities, towns,
regional governments, transit authorities and so on, with legal authority to receive
and dispense Federal funds.
Whereas the grantees of these grants are responsible for the day-to-day
management of their projects in accordance with Federal requirements, FTA is
responsible for ensuring that grantees follow federal mandates along with
statutory and administrative requirements and overseeing the proper use of federal
transit funds. FTA conducts oversight reviews to ensure that these requirements
are met.
FTA evaluates grantee adherence to grant administration requirements through a
comprehensive oversight program which includes Triennial Reviews, Financial
Management Oversight, Procurement Reviews, Drug and Alcohol Reviews,
Security and Assessment Reviews, Civil Rights Reviews, Intelligent
Transportation System Reviews, Planning Oversight, State Management
12
Oversight, and Project Management Oversight. Risk analysis has become an
integrated part of the project management oversight.
3.2 FTA Risk Analysis Background
According to the Mass Transit Report to Congressional Committees, in 1992, the
United States General Accounting Office designated FTA’s management and
oversight of billions of dollars in federal transit grants as a high-risk federal
program that was especially vulnerable to fraud, waste, abuse, and
mismanagement. Since that time, FTA has attempted to address the oversight
weaknesses that were responsible for its high-risk designation and provide a more
comprehensive strategy for staff and contractors to follow in overseeing grants
management.
The development of a risk assessment process has provided a firm foundation for
this improved strategy. Formalized in November 1994, the risk assessment
process was a key element in allowing FTA to target its resources to ensure a
coordinated, cohesive, and uniform level of oversight activity. In February 1995,
as a result of the various initiatives that FTA was undertaking to improve its
oversight, General Accounting Office removed FTA from its high-risk list with
the understanding that General Accounting Office would continue to monitor the
progress and implementation of FTA’s oversight initiatives.
Over years, FTA has developed better guidance for its staff and grantees and has
standardized its oversight procedures to improve the quality and consistency of its
grants management program. In particular, the establishment of a risk assessment
process for targeting limited oversight resources has provided a stronger
foundation for improved oversight.
13
3.3 FTA Risk Analysis Fundamentals and Current Status
Ongoing initiatives and related organizational changes are continuing to
strengthen FTA’s oversight of federal transit grants and decrease the risk
associated with providing billions of dollars each year to grantees. FTA defines
oversight as a continuous review and evaluation of grantee and FTA processes to
ensure compliance with statutory, administrative, and regulatory requirements.
FTA states that as early as the planning phase, alternative project delivery
methods should be considered within the context of project risk analysis and
procurement planning. Given the nature of the project to be implemented and the
experience of the grantee, the project delivery and contracting approach should be
selected that minimizes project risks and provides the greatest likelihood of
implementation success. Success can be measured in terms of minimizing costs
and schedule without sacrificing overall project quality. The general philosophy
is that risks should be assigned to the party which is best able to manage them.
Therefore, an early started risk analysis is the key.
As part of the improvement of its oversight program, FTA sponsors a
Construction Roundtable twice a year to promote knowledge sharing among grant
recipients who are in the process of designing and/or constructing major transit
capital investments. “Risk Analysis is an effective Project Management Oversight
tool for FTA. FTA and project sponsors have already benefited from risk analysis
in less than one and a half years.” (FTA 2004)
3.4 FTA Formal Risk Analysis Implementation Criteria
A risk analysis typically starts in Full Funding Grant Agreement (FFGA) or Final
Design. Full Funding Grant Agreement (FFGA) is a unique contractual obligation
that FTA employs when investing a significant amount of New Starts funding into
14
a locally-developed fixed guideway transit project. New Starts Transit Projects
with greater than $25 million funds require an FFGA.
According to the research of FTA and discussions with the executives from
FTA’s federal office and the local office, on a yearly basis, formalized risk
analyses were conducted for around six to ten projects which are authorized
FFGAs and range from $400 million to $4 billion before Fiscal Year 2003. The
former risk analysis practices were productive and really beneficial to the
decision-making of both FTA and local transit projects developers. Since Fiscal
Year 2003, risk analyses are required for all projects authorized FFGAs; that is,
all locally-developed new transit projects which are invested $25 million or more
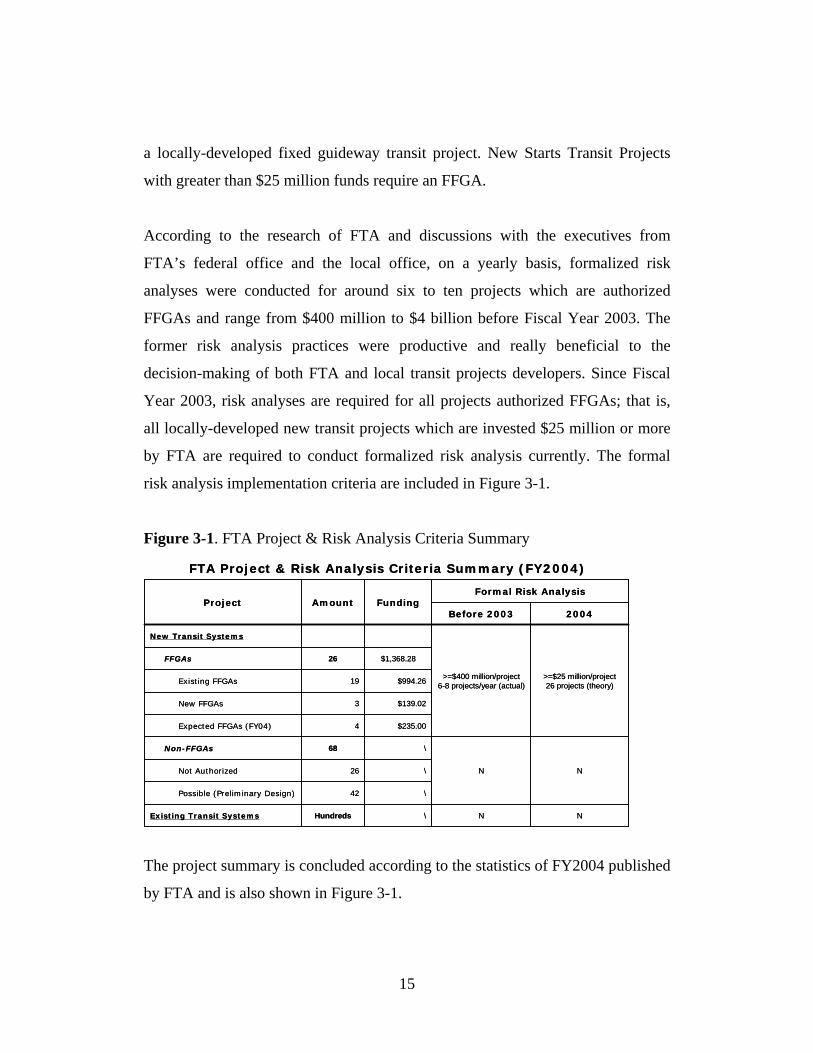
by FTA are required to conduct formalized risk analysis currently. The formal
risk analysis implementation criteria are included in Figure 3-1.
Figure 3-1. FTA Project & Risk Analysis Criteria Summary
NN\HundredsExisting Transit Systems
\42Possible (Preliminary Design)
\26Not Authorized NN
\68Non-FFGAs
$235.004Expected FFGAs (FY04)
$139.023New FFGAs
$994.2619Existing FFGAs
$1,368.2826FFGAs
>=$25 million/project 26 projects (theory)
>=$400 million/project 6-8 projects/year (actual)
New Transit Systems
2004Before 2003
Formal Risk AnalysisFundingAmountProject
FTA Project & Risk Analysis Criteria Summary (FY2004)
The project summary is concluded according to the statistics of FY2004 published
by FTA and is also shown in Figure 3-1.
15
Based on the Administration’s proposed funding levels for FY 2004, the proposed
New Starts funding level is $1,514.92 million. A total of $994.26 million for
nineteen projects with existing FFGAs, a total of $139.02 million for three
projects for which new FFGAs, and a total of $235.00 million for four proposed
projects that are expected to be ready for FFGA commitments before the end of
FY 2004.
Besides these twenty-six projects which were or will be authorized FFGAs, there
are forty-two projects that are in the preliminary design stage and hundreds of
existing projects from the former years which might have scope changes or major
change orders and require risk analyses. For example, the Springfield Union
Station Intermodel Project presented in the case study in Section 4 originally
started in 1999 and conducted a risk analysis in its late preliminary design stage in
2003. As noted by FTA executive, FTA was experimenting with the Risk
Analysis for Springfield Union Station. It was FTA’s first attempt to conduct a
risk analysis for a non-FFGA project.
According to FTA’s annual report for FY2004, they set aside one percent of the
total funds for its oversight activities, which was more than $15 million for
FY2004. The challenge for FTA is to find a feasible and appropriate risk analysis
approach because the current formal structured risk analysis method is difficult to
apply in a context of “Faster, Better, Cheaper” for projects which are currently in
preliminary design stage and might be authorized FFGAs later on or non-FFGA
projects similar to the Springfield Union Station Project.
3.5 FTA Risk Analysis Methodology
3.5.1 FTA Documented Risk Analysis Process
According to FTA, the formalized process of risk analysis can be generalized by
the following steps: Identify Risks, Evaluate and Measure Risks, Analyze Risk
16
Treatment Alternative, i.e., avoidance, prevention, mitigation/cost control, and
insurance (purchased or self-insured), Assign Risk, Select Mix of Control
Instruments, and Monitor and Evaluate Performance of Measures Instituted. This
process is a generic risk analysis methodology documented by FTA previously.
3.5.2 FTA Current Formalized Risk Analysis Methodology
A specific standardized risk analysis methodology has been implemented recently
by FTA. The flowchart in Figure 3-2 shows the process of this methodology.
According to FTA, this methodology has become the main tool for risk analysis
by its grantees.
In the first phase, project is familiarized and risk analysis methodology is studied
and determined. Then a suitable risk analysis team will be formed to further the
study.
In the second phase, the team would review in detail the base cost and schedule,
and the scope of work, and identify risks for each line item or activity of the
project. The next step is the development and implementation of a probabilistic
model for analyzing project risks in terms of cost and schedule. The analysis is
typically done by Monte Carlo simulation.
Based on the risk assessment results, the mitigation strategies are established and
incorporated into the report, which would be used for future updates of the
methodology.
17
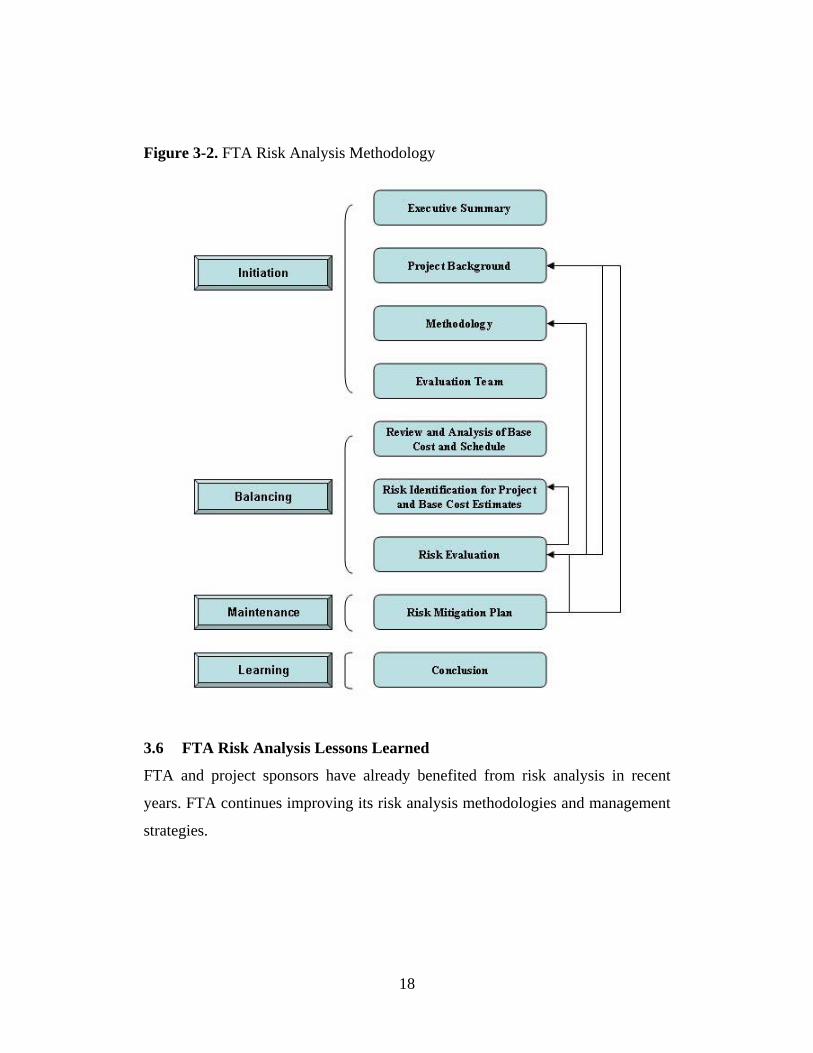
Figure 3-2. FTA Risk Analysis Methodology
3.6 FTA Risk Analysis Lessons Learned
FTA and project sponsors have already benefited from risk analysis in recent
years. FTA continues improving its risk analysis methodologies and management
strategies.
18
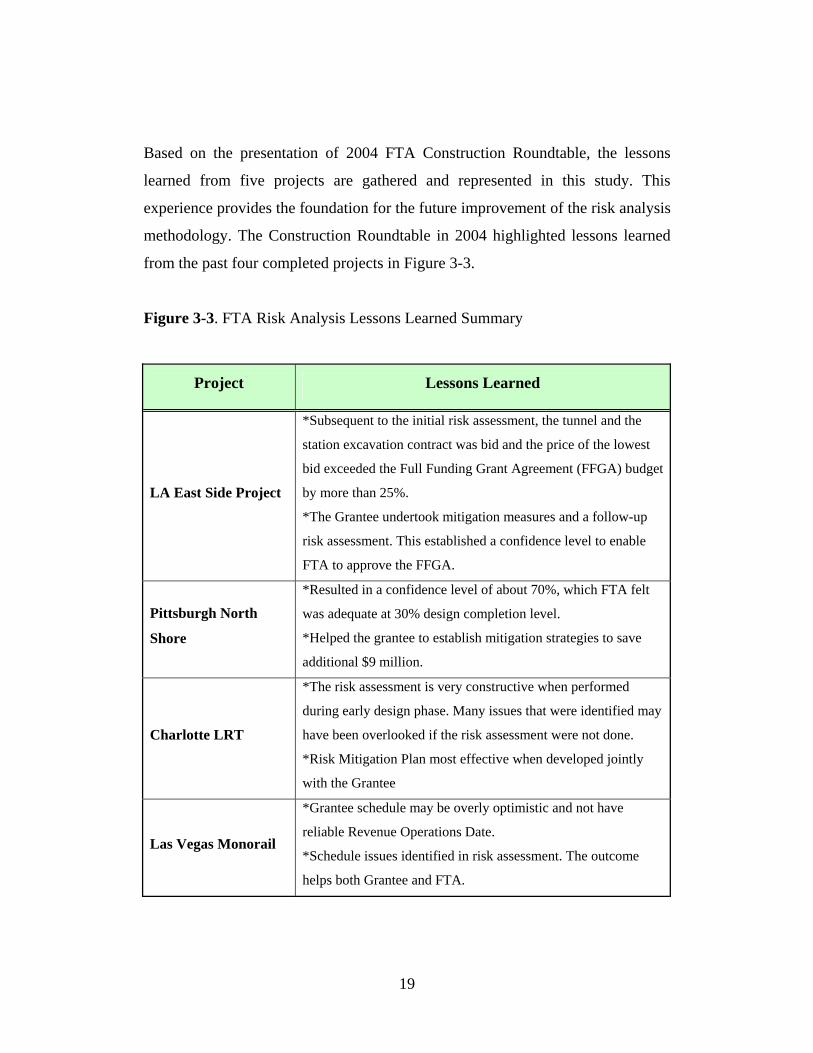
Based on the presentation of 2004 FTA Construction Roundtable, the lessons
learned from five projects are gathered and represented in this study. This
experience provides the foundation for the future improvement of the risk analysis
methodology. The Construction Roundtable in 2004 highlighted lessons learned
from the past four completed projects in Figure 3-3.
Figure 3-3. FTA Risk Analysis Lessons Learned Summary
Project Lessons Learned
LA East Side Project
*Subsequent to the initial risk assessment, the tunnel and the
station excavation contract was bid and the price of the lowest
bid exceeded the Full Funding Grant Agreement (FFGA) budget
by more than 25%.
*The Grantee undertook mitigation measures and a follow-up
risk assessment. This established a confidence level to enable
FTA to approve the FFGA.
Pittsburgh North
Shore
*Resulted in a confidence level of about 70%, which FTA felt
was adequate at 30% design completion level.
*Helped the grantee to establish mitigation strategies to save
additional $9 million.
Charlotte LRT
*The risk assessment is very constructive when performed
during early design phase. Many issues that were identified may
have been overlooked if the risk assessment were not done.
*Risk Mitigation Plan most effective when developed jointly
with the Grantee
Las Vegas Monorail
*Grantee schedule may be overly optimistic and not have
reliable Revenue Operations Date.
*Schedule issues identified in risk assessment. The outcome
helps both Grantee and FTA.
19
In conclusion, risk analysis helped grantees to be approved the FFGA by FTA and
should be performed during early design phase instead of starting at FFGA or
Final Design. On the other hand, risk analysis helped both FTA and Grantees
manage projects better in terms of project cost and schedule and other critical
issues.
20
4 CASE STUDY
4.1 Case Study Introduction
4.1.1 Motivation for the Case Study
The preliminary work for this study started with a literature review in late August,
2004. Having read extensively in the areas of Project Planning, Contracting, Cost
and Schedule, to Information Technologies, Quantitative Methods, and
Construction Materials and Methods, I absorbed insights and essentials in a
relatively short time and found that project risk analysis and management is a
trend and key for construction project management globally.
A risk analysis study was conducted for a real project, the Springfield Union
Station Intermodal Redevelopment Project (SUSIRP). It is a relatively complex,
multi-phased project that includes Federal, State and local transportation agencies
in addition to a private railroad company. Developers, private consultants,
businessmen, and “average citizens” are all players in this highly visible and
visionary project. The unique characteristics of the project provided me a lot of
valuable experience and will be illustrated in details as the case study in my
research.
At the same time, the risk analysis study required me to access extensive
information of the project. This enabled me to utilize my knowledge and
experience in construction, and fostered my interests in construction engineering
and management as well as risk analysis integrated in project management. This
also provided a firm background for my subsequent research.
4.1.2 General Description
Originally built in 1926, Springfield’s Union Station, a historic, landmarked train
station, has been dormant since the 1970’s. Located at 55 Frank B. Murray Street
21

in Springfield, MA, the station is ideally situated directly off of I-91 and I-291,
just minutes south of the Massachusetts Turnpike. According to PVTA, it is
considered the crossroads of New England. The Union Station highlights the
Northern section of the Central Business District (CBD) and is an integral part of
Springfield's entertainment and cultural district which includes Symphony Hall
and the Civic Center.
Pioneer Valley Transit Authority (PVTA) in conjunction with the Springfield
Redevelopment Authority (SRA) and the City of Springfield is coordinating the
efforts to redevelop the original station building into a vibrant, mixed-use
intermodal transportation facility with bus and rail capabilities in addition to retail
and office space, much like what other cities have done, such as the union station
s in Washington DC and St. Louis. An exciting intermodel transportation facility
is planned to be created to compliment Springfield's bustling CBD and
entertainment districts.
In addition to the original building being redeveloped, the project includes two
new parking garages, a new maintenance facility for Peter Pan Bus, and a new
hotel. The new busway will maximize traffic flow through the area and
accommodate both PVTA and Peter Pan buses. Housed within the station will be
Amtrak offices and ticket agents and new facilities Peter Pan ticketing and
waiting area. This is shown in Figure 4-1.
Another integral part of the project is the acquisition of several parcels of land
surrounding the original station. These parcels are necessary to complete the
busway ramps and parking garage facilities. The acquisition process on these
parcels has been delayed pending the resolution of the major issue: negotiations
with CSX.
22
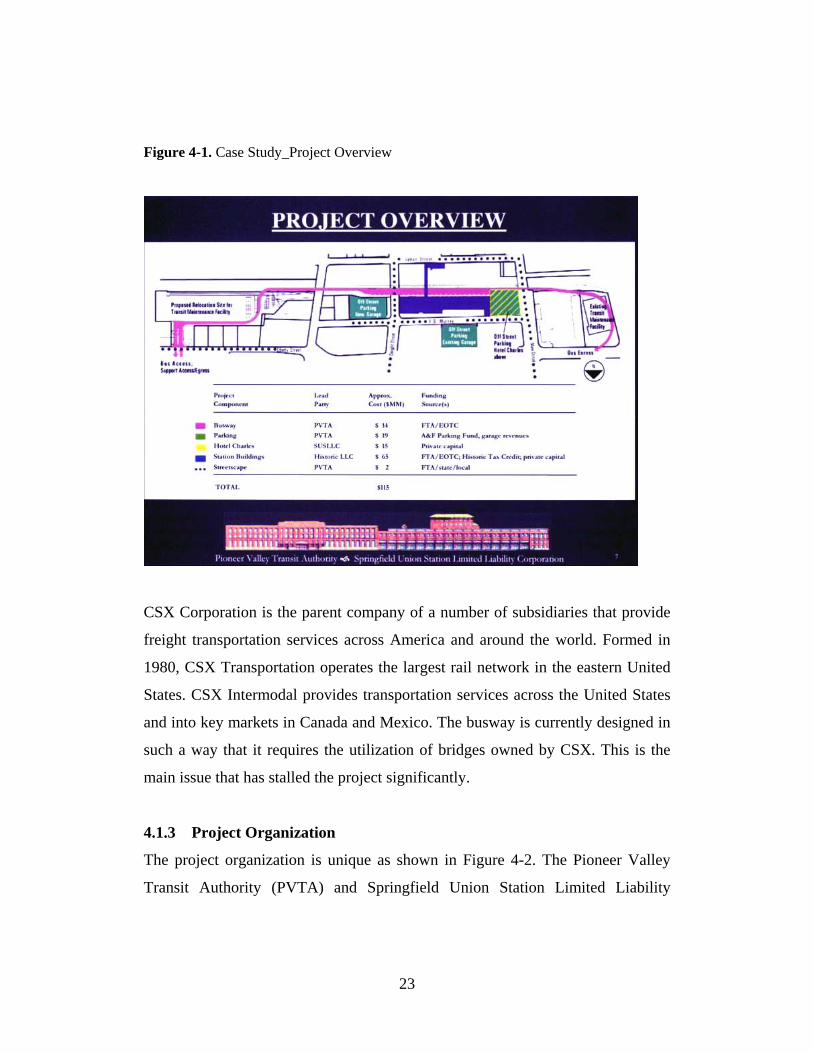
Figure 4-1. Case Study_Project Overview
CSX Corporation is the parent company of a number of subsidiaries that provide
freight transportation services across America and around the world. Formed in
1980, CSX Transportation operates the largest rail network in the eastern United
States. CSX Intermodal provides transportation services across the United States
and into key markets in Canada and Mexico. The busway is currently designed in
such a way that it requires the utilization of bridges owned by CSX. This is the
main issue that has stalled the project significantly.
4.1.3 Project Organization
The project organization is unique as shown in Figure 4-2. The Pioneer Valley
Transit Authority (PVTA) and Springfield Union Station Limited Liability
23
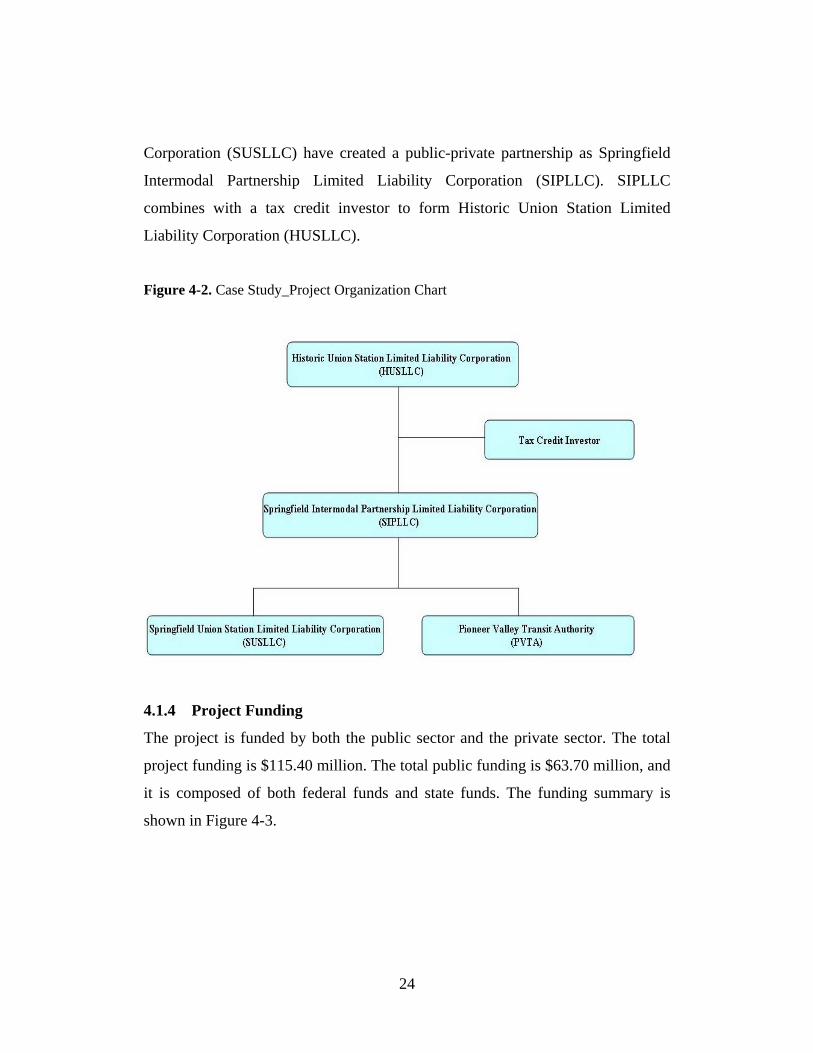
Corporation (SUSLLC) have created a public-private partnership as Springfield
Intermodal Partnership Limited Liability Corporation (SIPLLC). SIPLLC
combines with a tax credit investor to form Historic Union Station Limited
Liability Corporation (HUSLLC).
Figure 4-2. Case Study_Project Organization Chart
4.1.4 Project Funding
The project is funded by both the public sector and the private sector. The total
project funding is $115.40 million. The total public funding is $63.70 million, and
it is composed of both federal funds and state funds. The funding summary is
shown in Figure 4-3.
24
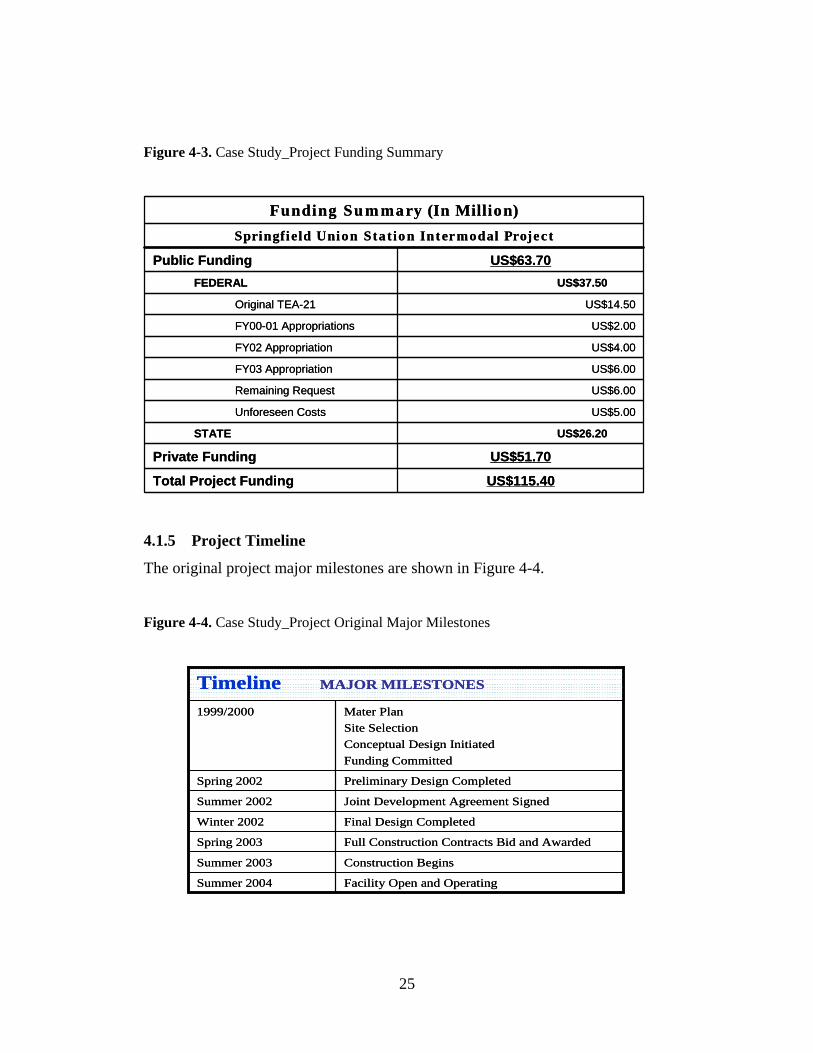
Figure 4-3. Case Study_Project Funding Summary
US$115.40 Total Project Funding
US$51.70 Private Funding
US$26.20 STATE
US$5.00 Unforeseen Costs
US$6.00 Remaining Request
US$6.00 FY03 Appropriation
US$4.00 FY02 Appropriation
US$2.00 FY00-01 Appropriations
US$14.50 Original TEA-21
US$37.50 FEDERAL
US$63.70 Public Funding
Springfield Union Station Inter modal Project
Funding Su m mary (In Million)
4.1.5 Project Timeline
The original project major milestones are shown in Figure 4-4.
Figure 4-4. Case Study_Project Original Major Milestones
Facility Open and OperatingSummer 2004
Construction BeginsSummer 2003
Full Construction Contracts Bid and AwardedSpring 2003
Final Design CompletedWinter 2002
Joint Development Agreement SignedSummer 2002
Preliminary Design CompletedSpring 2002
Mater PlanSite SelectionConceptual Design InitiatedFunding Committed
1999/2000
Timeline MAJOR MILESTONES
25

The project’s master plan, site selection, and conceptual design were initiated in
1999 and 2000. Moving toward Spring 2002, Preliminary design was completed
according to PVTA’s publication Destination. Originally the project was slated to
complete Final Design in the winter of 2002 and to begin Construction in the
summer of 2003, and the Station Opening was slated for the summer of 2004.
The original plan was changed due to various external and internal factors. The
risk analysis study started in September 2003. Based on the Progress Report of
Springfield Union Station Project and project schedule documents provided by the
FTA, preliminary development program has been established and Preliminary
Design was almost completed in March 2002. The Joint Development Agreement
was signed by the spring of 2003. In March 2003, the final design of busway was
nearly completed and final design of station buildings and Full Construction
Contracts bidding were underway.
Correspondingly, the construction did not begin in the summer of 2003 as
originally planned. According to the updated project milestones as shown in
Figure 4-5, the construction should have started in February 2004, and the facility
will be finally completed by February 2006.
As of the risk analysis workshop date (04/27/2004), the construction had not
started. By the date of the workshop on April 2004, the busway concept plan had
not been approved by CSX and further information has confirmed that the
primary busway concept was actually revised. According to PVTA, the
negotiations with CSX have all but stopped at that time and PVTA along with
their consultants and the redevelopment authority were assessing alternatives to
the current busway design to try and get the project back on track. Therefore, the
design of busway and even station buildings had to be revised.
26
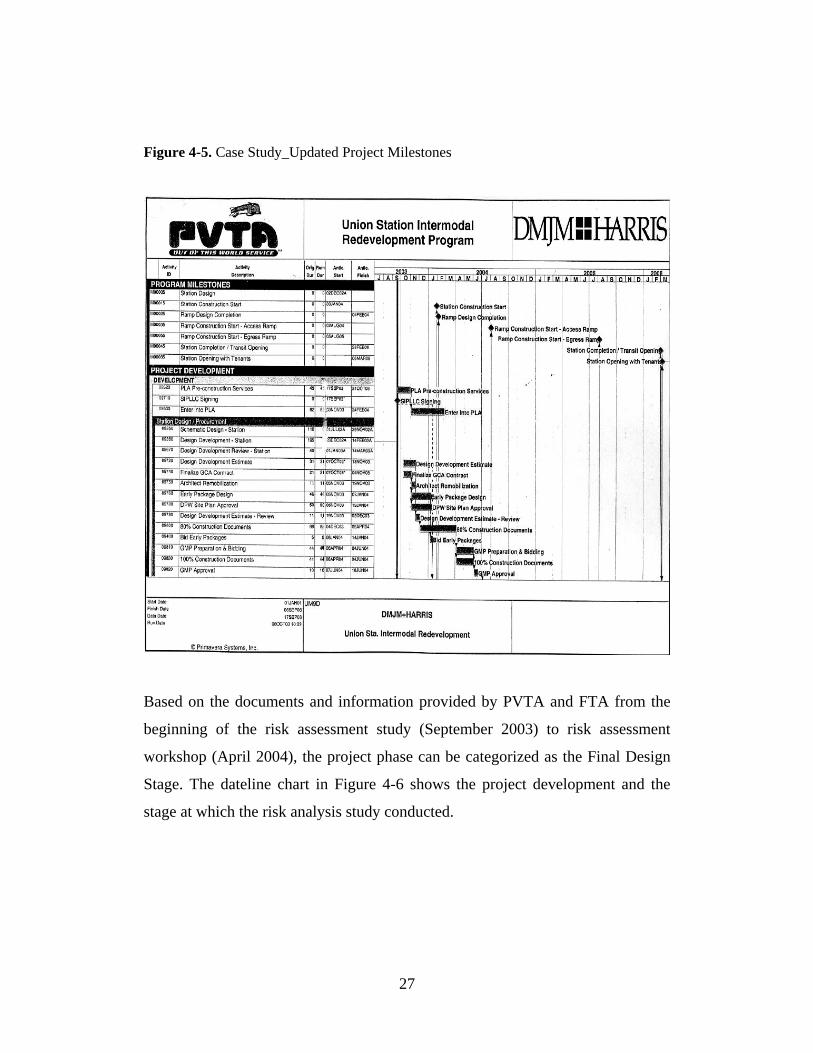
Figure 4-5. Case Study_Updated Project Milestones
Based on the documents and information provided by PVTA and FTA from the
beginning of the risk assessment study (September 2003) to risk assessment
workshop (April 2004), the project phase can be categorized as the Final Design
Stage. The dateline chart in Figure 4-6 shows the project development and the
stage at which the risk analysis study conducted.
27
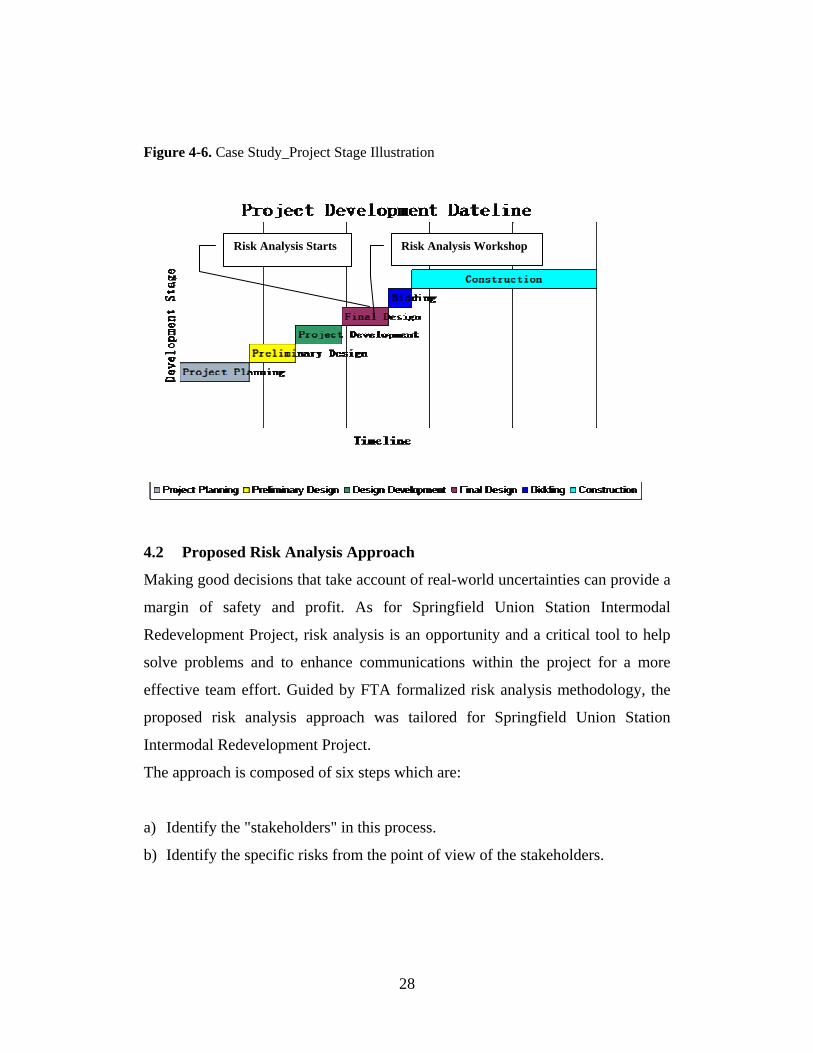
Figure 4-6. Case Study_Project Stage Illustration
Risk Analysis Workshop Risk Analysis Starts
4.2 Proposed Risk Analysis Approach
Making good decisions that take account of real-world uncertainties can provide a
margin of safety and profit. As for Springfield Union Station Intermodal
Redevelopment Project, risk analysis is an opportunity and a critical tool to help
solve problems and to enhance communications within the project for a more
effective team effort. Guided by FTA formalized risk analysis methodology, the
proposed risk analysis approach was tailored for Springfield Union Station
Intermodal Redevelopment Project.
The approach is composed of six steps which are:
a) Identify the "stakeholders" in this process.
b) Identify the specific risks from the point of view of the stakeholders.
28
c) Identify the potential consequences of each of these risks in terms of cost and
schedule, as well as the probabilities of occurrence of each of these events.
d) Conduct quantitative risk analysis to determine the overall risk distribution of
the cost and the schedule. Monte Carlo simulation is suggested by FTA formal
structured risk analysis methodology.
e) Conduct a risk analysis workshop and develop a mitigation plan by identifying
alternative ways that could be used to mitigate or transfer the potential impacts
of risk.
f) Evaluate the consequences of each alternative response and select risk
management strategies.
The process of assessing risks is critical in the whole risk analysis process. The
tools or technologies should be selected very carefully. Two tools that are
typically used to manage the level of risk associated with construction projects are
the project cost estimate and the project schedule. Recent attempts to quantify the
risk inherent in construction projects more reliably have focused on range
estimating and stochastic scheduling (Isidore & Back, 2001). These tools involve
modeling the duration and cost of the activities that make up construction projects
as stochastic quantities.
Range estimating and Monte Carlo simulation have been selected as the tools by
which we, the WPI risk analysis team, performed the probability of risk analysis
on the Springfield Union Station Intermodal Redevelopment Project.
4.3 Study Evaluations
4.3.1 Cost Evaluations
The risk of cost overrun can not be determined if only separate points of cost are
given. In theory, cost estimates should be provided as distributions rather than
29
separate points. Before the construction is completed, the actual cost is always an
unknown. Many possible outcomes are in existence. If there are many possible
outcomes, how to tell which one is most likely is the first problem. The full range
of possible outcomes should be identified rather than selecting one value.
Range Estimating is the key and was implemented for risk analysis regarding cost
for this case study project. Range estimating can be done in a rather simple
fashion by selecting the 20 percent of the line items in the cost estimate that
represent 80 percent of the cost, then developing a range for each of those items
and adding the low and high ranges. A more advanced approach is to take the
same 20-percent items, establish the range, and then use any one of several
available software packages to perform a probabilistic simulation and produce a
risk profile. This approach can give a more accurate projection of the logical
highs and lows involved with the 20-percent drivers.
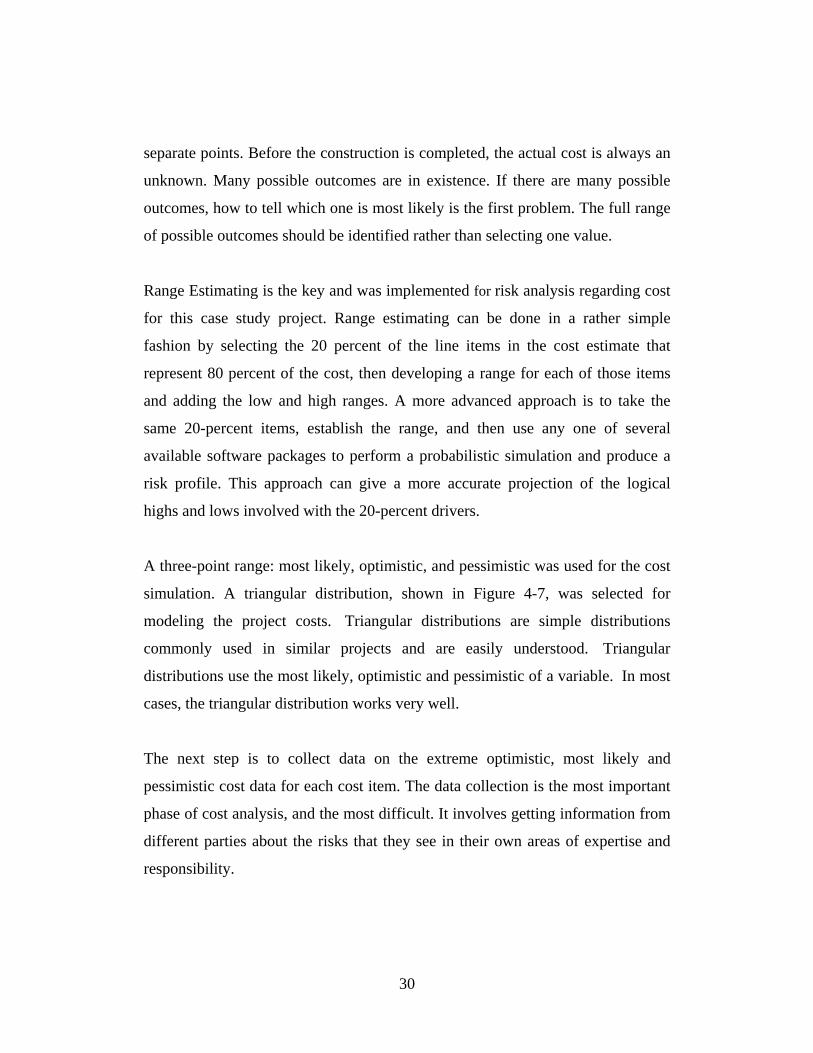
A three-point range: most likely, optimistic, and pessimistic was used for the cost
simulation. A triangular distribution, shown in Figure 4-7, was selected for
modeling the project costs. Triangular distributions are simple distributions
commonly used in similar projects and are easily understood. Triangular
distributions use the most likely, optimistic and pessimistic of a variable. In most
cases, the triangular distribution works very well.
The next step is to collect data on the extreme optimistic, most likely and
pessimistic cost data for each cost item. The data collection is the most important
phase of cost analysis, and the most difficult. It involves getting information from
different parties about the risks that they see in their own areas of expertise and
responsibility.
30
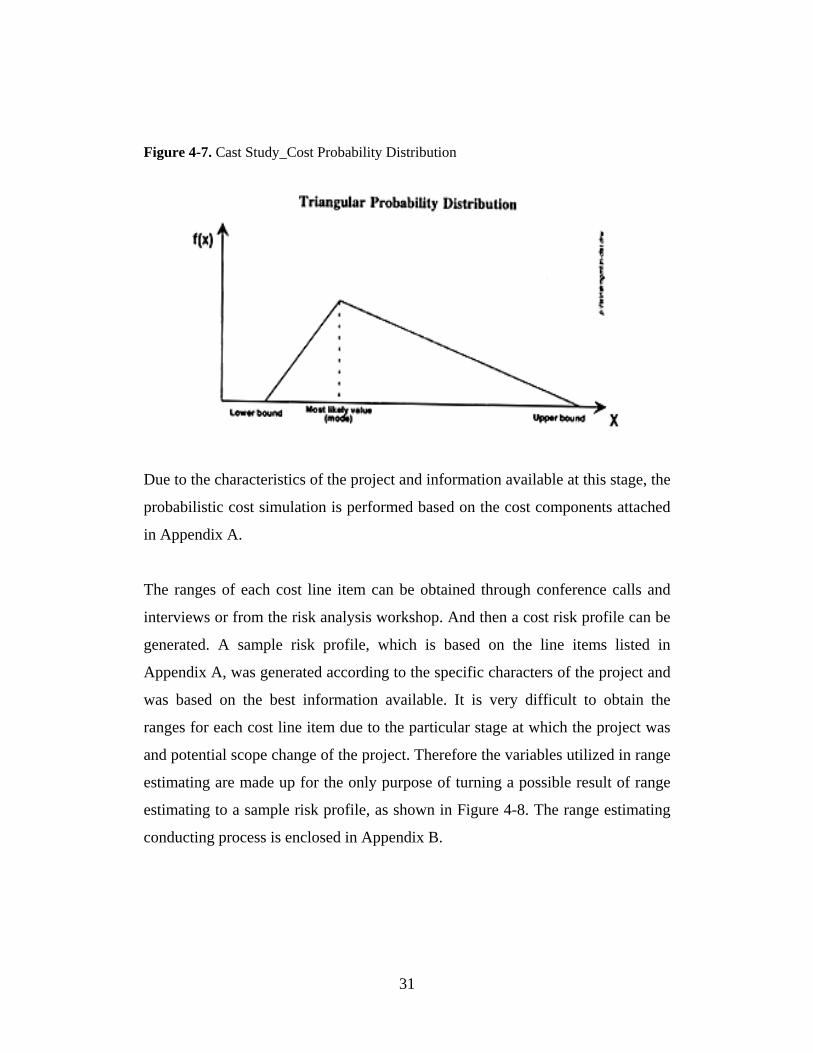
Figure 4-7. Cast Study_Cost Probability Distribution
Due to the characteristics of the project and information available at this stage, the
probabilistic cost simulation is performed based on the cost components attached
in Appendix A.
The ranges of each cost line item can be obtained through conference calls and
interviews or from the risk analysis workshop. And then a cost risk profile can be
generated. A sample risk profile, which is based on the line items listed in
Appendix A, was generated according to the specific characters of the project and
was based on the best information available. It is very difficult to obtain the
ranges for each cost line item due to the particular stage at which the project was
and potential scope change of the project. Therefore the variables utilized in range
estimating are made up for the only purpose of turning a possible result of range
estimating to a sample risk profile, as shown in Figure 4-8. The range estimating
conducting process is enclosed in Appendix B.
31
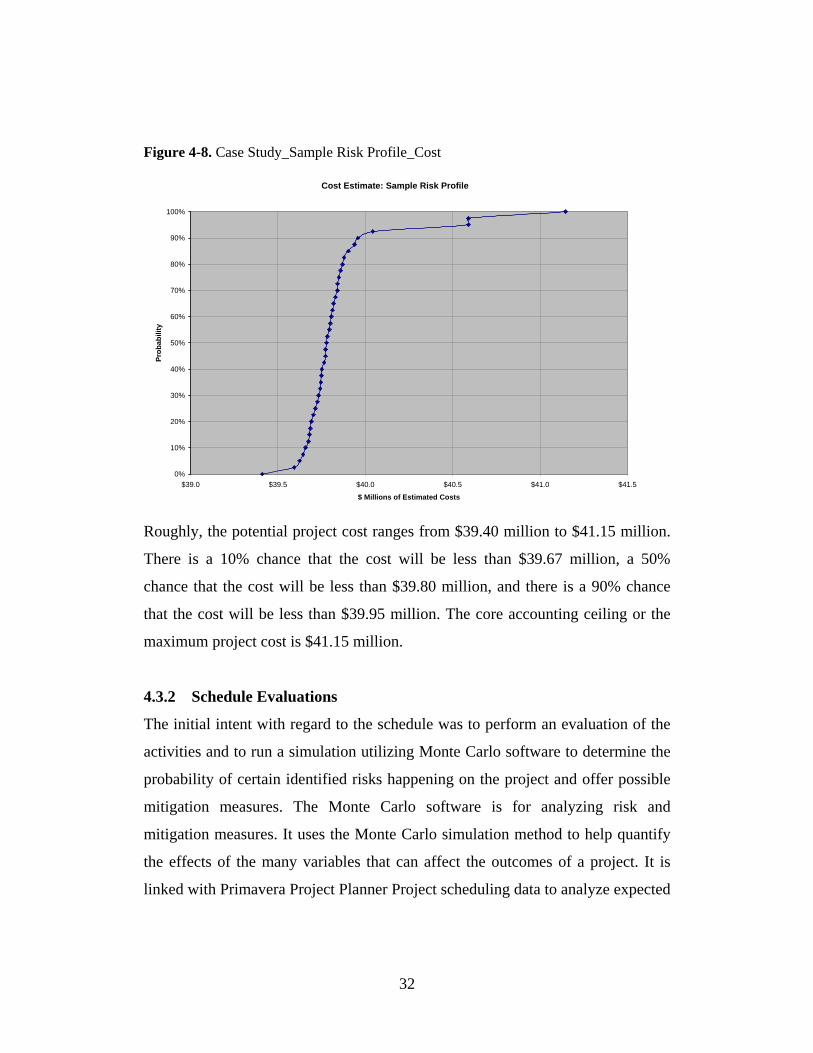
Figure 4-8. Case Study_Sample Risk Profile_Cost
Cost Estimate: Sample Risk Profile
0%
10%
20%
30%
40%
50%
60%
70%
80%
90%
100%
$39.0 $39.5 $40.0 $40.5 $41.0 $41.5
$ Millions of Estimated Costs
Prob
abili
ty
Roughly, the potential project cost ranges from $39.40 million to $41.15 million.
There is a 10% chance that the cost will be less than $39.67 million, a 50%
chance that the cost will be less than $39.80 million, and there is a 90% chance
that the cost will be less than $39.95 million. The core accounting ceiling or the
maximum project cost is $41.15 million.
4.3.2 Schedule Evaluations
The initial intent with regard to the schedule was to perform an evaluation of the
activities and to run a simulation utilizing Monte Carlo software to determine the
probability of certain identified risks happening on the project and offer possible
mitigation measures. The Monte Carlo software is for analyzing risk and
mitigation measures. It uses the Monte Carlo simulation method to help quantify
the effects of the many variables that can affect the outcomes of a project. It is
linked with Primavera Project Planner Project scheduling data to analyze expected
32
dates, and costs, and to critically develop contingency plans, or make go or no-go
decisions. Range estimating provides the solution by synergistically combining
Monte Carlo simulation, Pareto's law and experience of the decision makers to
quantify and rank risks and opportunities for decision making.
The schedule documents obtained from FTA are enclosed in Appendix C. Since
only a hard copy of the schedule was issued by FTA for the risk analysis study, a
new schedule was recreated in Primavera Project Planner, and the best logic ties
were assumed to create the schedule to be utilized for the simulations. It was
apparent from the breakdown of the schedule that input from multiple parties
would be needed to provide schedule updates accurately.
The first schedule run in Primavera Project Planner generated dates inconsistent
with the issued schedule from the FTA. It was apparent that a few possibilities
existed as explanations of the deviations. First, the schedule was not being
updated. A second issue that can be argued is that the milestone dates are forced
within the schedule to make it seem that the project’s end is still within the
original time frame even though the dates are in essence slipping. A third
potential problem could be the logic ties. Whereby certain activities do not have
the correct predecessor / successor relationship will yield inaccurate dates.
However, this is just an assumption without having knowledge of the logic ties.
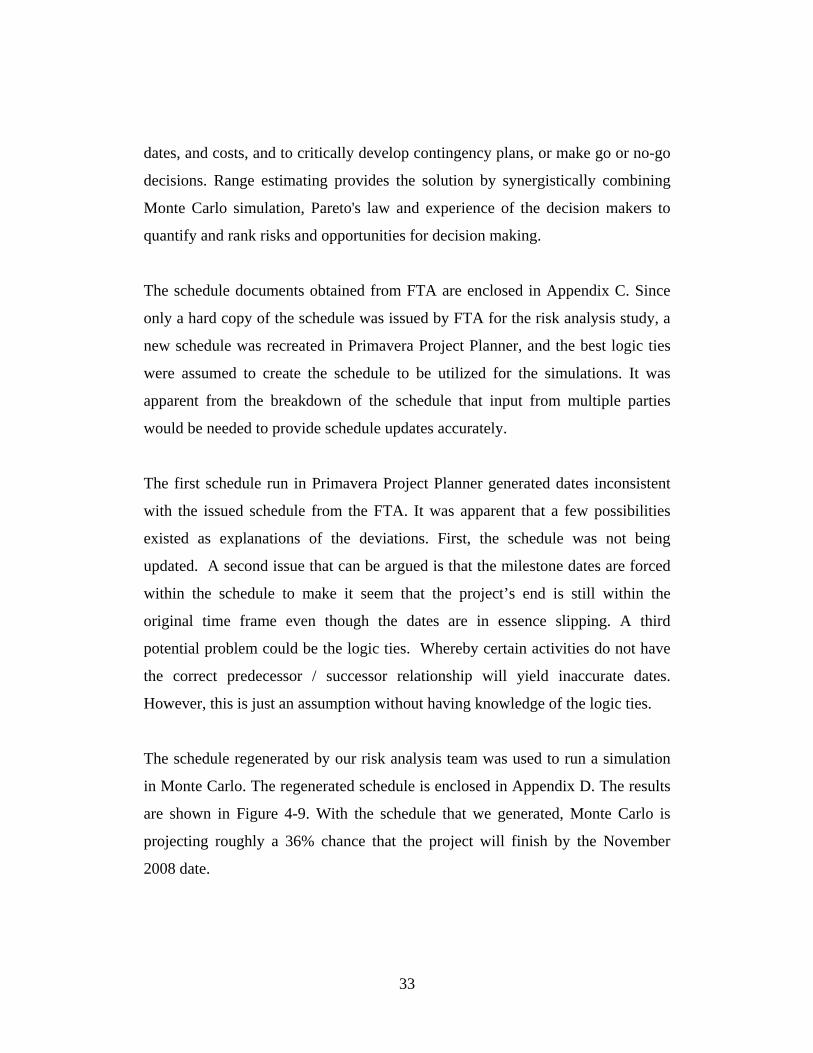
The schedule regenerated by our risk analysis team was used to run a simulation
in Monte Carlo. The regenerated schedule is enclosed in Appendix D. The results
are shown in Figure 4-9. With the schedule that we generated, Monte Carlo is
projecting roughly a 36% chance that the project will finish by the November
2008 date.
33
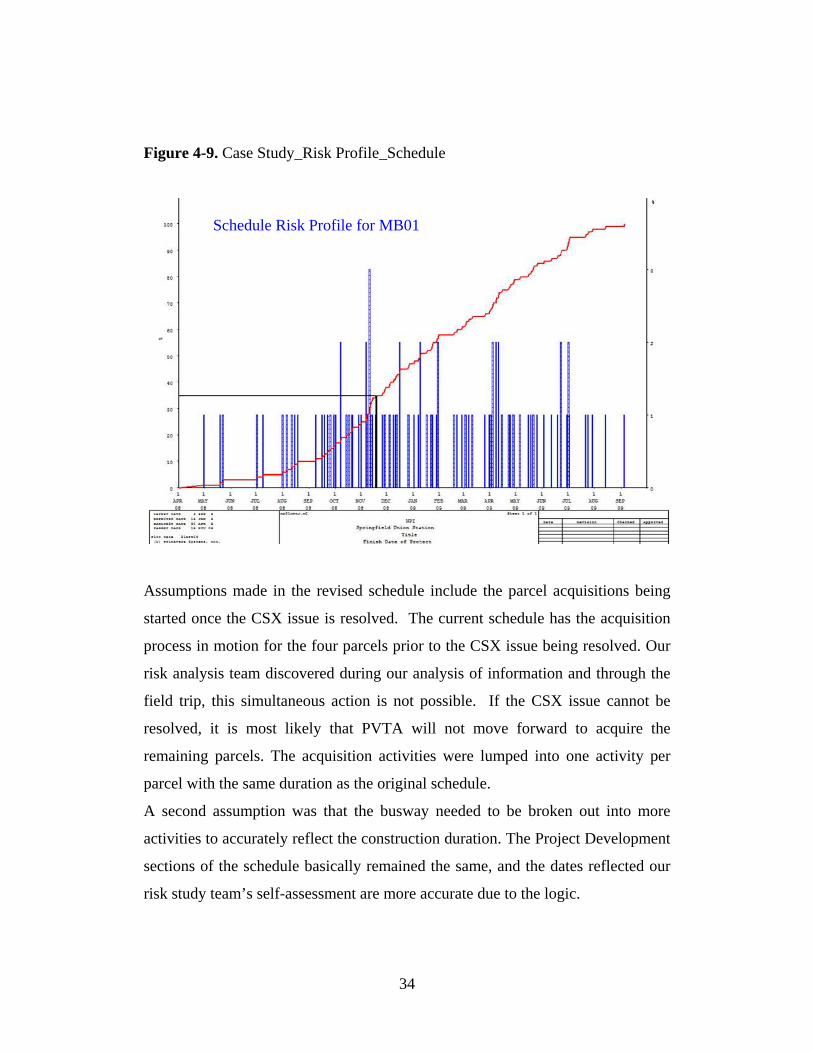
Figure 4-9. Case Study_Risk Profile_Schedule
Schedule Risk Profile for MB01
Assumptions made in the revised schedule include the parcel acquisitions being
started once the CSX issue is resolved. The current schedule has the acquisition
process in motion for the four parcels prior to the CSX issue being resolved. Our
risk analysis team discovered during our analysis of information and through the
field trip, this simultaneous action is not possible. If the CSX issue cannot be
resolved, it is most likely that PVTA will not move forward to acquire the
remaining parcels. The acquisition activities were lumped into one activity per
parcel with the same duration as the original schedule.
A second assumption was that the busway needed to be broken out into more
activities to accurately reflect the construction duration. The Project Development
sections of the schedule basically remained the same, and the dates reflected our
risk study team’s self-assessment are more accurate due to the logic.
34
It would be a recommendation with regard to the schedule that it is critical to have
the schedule updated regularly, with input from the necessary parties responsible
for their activities. A schedule is only as good as the information in it. With
unrealistic dates or dates simply moving along the data line, that management will
never have an idea of the project status or its projected completion. It would be at
that juncture, once a more realistic schedule is in place, to perform another
quantitative risk assessment and to identify the new probabilities for potential
risks and the cost or opportunity associated with them.
4.4 Case Study Milestone
4.4.1 Study Method
From September 2003 to February 2004, we colleted and updated project cost and
schedule data by all means, such as conference calls, interviews, brainstorming
sessions and field trip to perform quantitative risk assessment.
The WPI risk analysis team and Mr. Matthew Keamy (FTA) toured the site in
February 2004. We met initially with Gary Shepard, the administrator of PVTA
and Richard Wilk, the on-site manager at the PVTA offices where they discussed
the project background, history and challenges. Financial information provided to
the WPI team indicated that the project was sectioned into two phases. However
the schedule did not follow a similar breakdown. Once the design consultant
presented their best alternative for the busway design, an issue arose with the
railroad company, CSX. This issue involves the use of bridges by the PVTA and
Peter Pan busses currently owed by CSX. This is the critical issue for the project
because if it is unable to be resolved the project faces an uncertain future, if any.
Extensive time and budget have been expended on this project since its inception
in 2000, not to mention the potential for community growth and revitalization of
the downtown Springfield area.
35
The visit to the site proved quite helpful to the WPI team in understanding the
complex components of this project. It also gave us a better perception of the
elements in the schedule and how they were impacted by the CSX negotiations
and subsequent acquisitions. However, it was also the milestone for our risk
analysis study because we could not follow the proposed risk analysis approach
directed by FTA at that juncture.
4.4.2 Findings and Challenges
4.4.2.1 Challenges
The potential scope change due to CXS acquisition issue and incomplete cost and
schedule data did not enable the risk analysis to be secured further according to
the FTA formalized risk analysis methodology. FTA and PVTA must make a
critical decision at that point to get the project back on track. They wished that the
risk analysis could help their decision–makings and hope that we could continue
conducting risk analysis workshop to guide thinking and stimulate
communications among management. Thus, how to continue the risk analysis and
foster their decision-making effectively became a real challenge.
4.4.2.2 Monte Carlo Limitations
Monte Carlo simulation is suggested by FTA formal risk analysis methodology.
Quantitative risk analysis methods are flourishing these days, especially the
application of Monte Carlo simulation. Executives tend to use Monte Carlo
simulation for risk analysis because they know the importance of analysis and
Monte Carlo has been introduced as a powerful tool for quantitative risk analysis;
however, it has its specific limitations and applications.
Monte Carlo simulation is advantageous because it is a “brute force” approach
that is able to solve problems for which no other solutions exist. Unfortunately,
36
this also means that it is computer intensive and best avoided if simpler solutions
are possible.
Brenda McCabe (2003) brings forward the limitations to Monte Carlo Simulation.
In term of schedule risks, the CPM schedule to be used as basis for analysis must
be complete and correct. Complete refers to having all activities properly tied in
with predecessors and successors, and lags where appreciate. Correct refers to
using durations that do not include float, that reflect the activity scope, and reflect
the construction plan. Negative lags should be avoided as they do not represent
the way activities are undertaken in the field. Moreover, experts are very
comfortable estimating the most likely values of activity duration, but are not as
experienced at estimating the lower and upper limits. The collection of real data to
support these estimates would be very beneficial. Then unfamiliarity with the
technique is another barrier. Last, it is quite difficult to accurately represent
correlation between activities, so approximations have to be developed to simplify
the process. The effects of these approximations are not known with certainty.
The most appropriate situation to use Monte Carlo methods is when other
solutions are too complex or difficult to use. Therefore Monte Carlo simulation is
not a recommended approach without full understanding of the project itself, the
functions of this quantitative risk analysis technique, and meeting the applicable
prerequisites of the technique.
From these points of views and the past experience of our risk analysis team, the
quantitative risk analysis including Monte Carlo simulation and range estimating
used for Springfield Union Station Intermodal Redevelopment project were not
the most effective approach in that particular circumstance. Therefore, another
feasible and effective method must be sought.
37
4.4.2.3 Valuation Problem in Risk Analysis
Large complex capital budgeting projects can be difficult to implement risk
analysis. Decisions and alternatives are often many and complex, as well as
difficult to quantify for valuation purposes. Additionally, there is frequently not
enough quantifiable information available to perform a risk analysis. It is often
also problematic to utilize quantitative risk analysis models based on questionable
or incomplete data inputs. Such practical implementation issues cause the current
quantitative risk analysis methodology utilized by Federal Transit Administration
to be ineffective in some circumstances.
This is not only the current problem for large complex projects, but also a
problem for smaller less complex projects. Project risk analysis process must be
tailored to particular circumstances of the project. For example, in some
circumstances, a current formalized risk analysis methodology might not be of
great importance or too time consuming in practice for transit projects monitored
by FTA.
Difficulties, such as those noted above, in applying quantitative risk analysis in
practice suggest that the application of more qualitative processes can improve
managerial decision-making. For example, a scenario analysis can help managers
better identify the long-term risks and uncertainties that impact the project and
assist them in defining possible alternatives and contingencies; and qualitative
risk analysis is helpful in guiding management to consider the non-quantifiable
value embedded in a project by then adding detailed structuring and, thus,
allowing for a richer understanding of the scenarios identified.
38
5 DEVELOPMENT OF PRELIMINARY RISK ANALYSIS
FRAMEWORK
5.1 New Approach Overview
To continue the risk analysis and help decision-making, a new, effective and
feasible approach had to be determined in a timely manner. The new approach
was developed based on lessons learned from the application of the FTA
formalized risk analysis methodology on Springfield Union Station Intermodal
Redevelopment project and academic surveys on generic risk analysis
methodologies. Moreover, the newly-developed preliminary risk analysis
framework was also tested on the Union Station project.
5.2 Generic Risk Analysis methodologies
The basic project risk analysis steps are well known in many fields, ranging from
aerospace projects, health and environmental management to IT, which are:
1) Identify the sources of risk
2) Identify the range of possible risk events
3) Assess the potential impacts of risk events on the project
4) Identify alternative responses to mitigate the hypothetical impacts of risk
events
5) Identify the consequences of the alternative responses
6) Select risk management strategies including the allocation of risk
In this study, two generic risk analysis methodologies for construction projects are
studied and have provided insights for the development of the new risk analysis
approach.
39
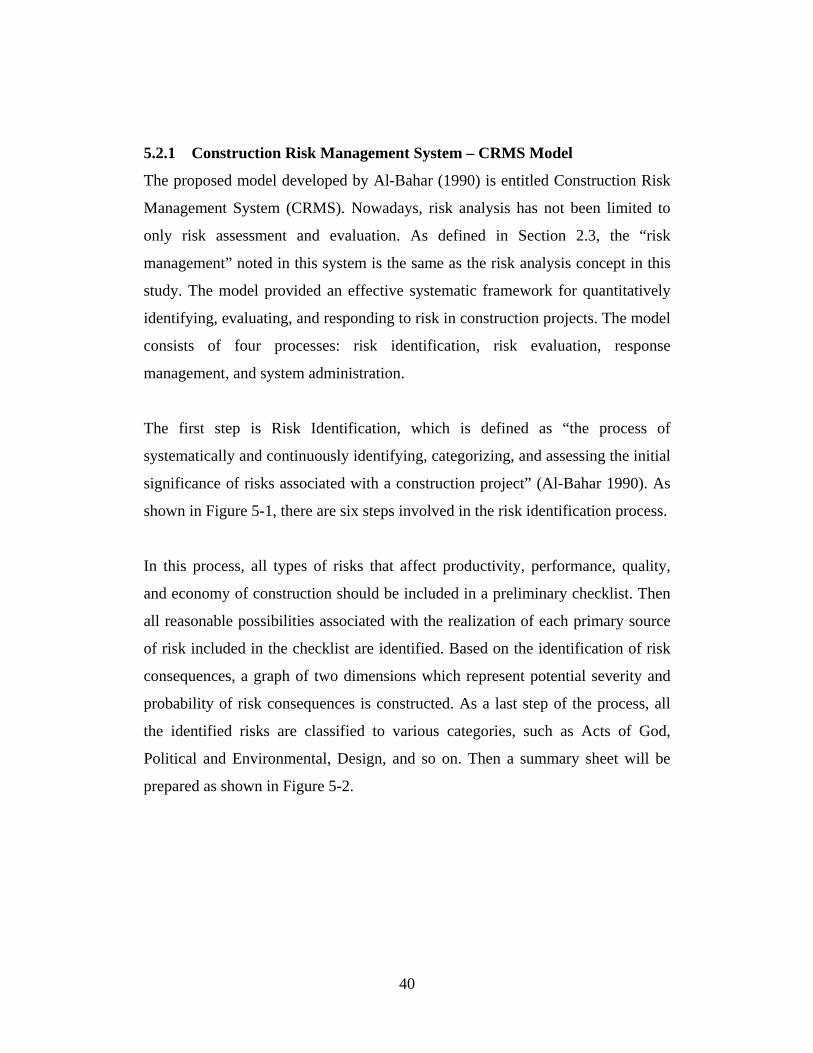
5.2.1 Construction Risk Management System – CRMS Model
The proposed model developed by Al-Bahar (1990) is entitled Construction Risk
Management System (CRMS). Nowadays, risk analysis has not been limited to
only risk assessment and evaluation. As defined in Section 2.3, the “risk
management” noted in this system is the same as the risk analysis concept in this
study. The model provided an effective systematic framework for quantitatively
identifying, evaluating, and responding to risk in construction projects. The model
consists of four processes: risk identification, risk evaluation, response
management, and system administration.
The first step is Risk Identification, which is defined as “the process of
systematically and continuously identifying, categorizing, and assessing the initial
significance of risks associated with a construction project” (Al-Bahar 1990). As
shown in Figure 5-1, there are six steps involved in the risk identification process.
In this process, all types of risks that affect productivity, performance, quality,
and economy of construction should be included in a preliminary checklist. Then
all reasonable possibilities associated with the realization of each primary source
of risk included in the checklist are identified. Based on the identification of risk
consequences, a graph of two dimensions which represent potential severity and
probability of risk consequences is constructed. As a last step of the process, all
the identified risks are classified to various categories, such as Acts of God,
Political and Environmental, Design, and so on. Then a summary sheet will be
prepared as shown in Figure 5-2.
40
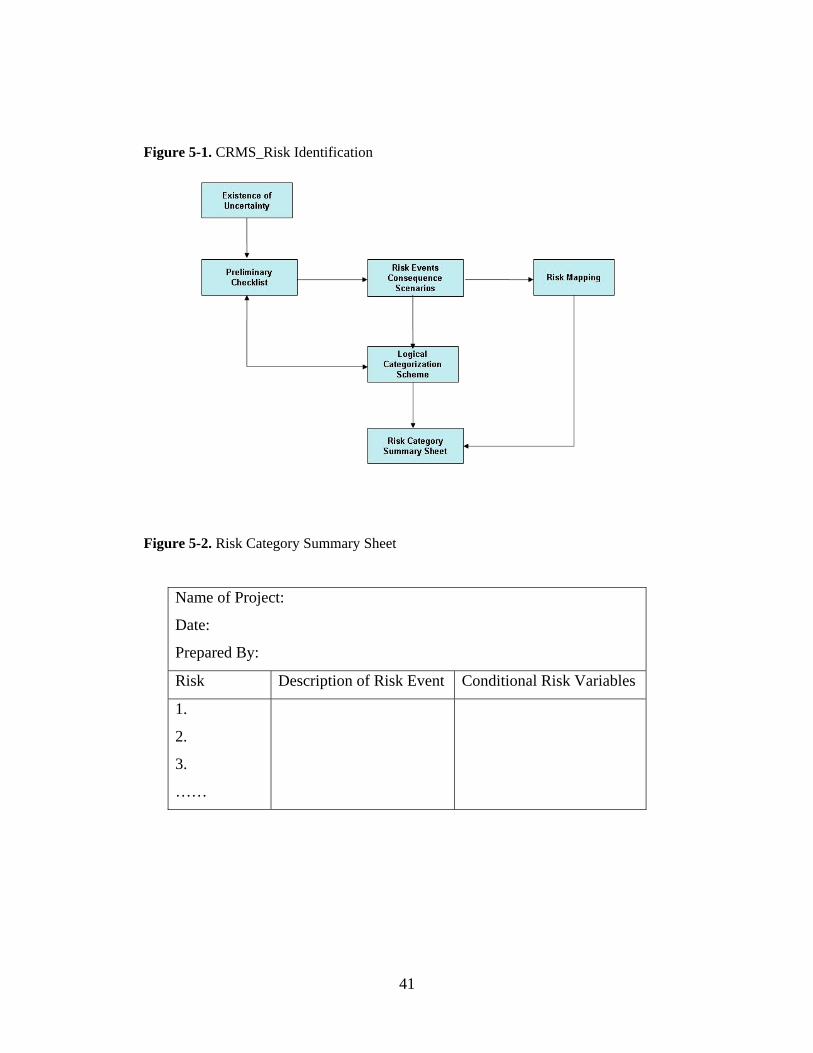
Figure 5-1. CRMS_Risk Identification
Figure 5-2. Risk Category Summary Sheet
Name of Project:
Date:
Prepared By:
Risk Description of Risk Event Conditional Risk Variables
1.
2.
3.
……
41
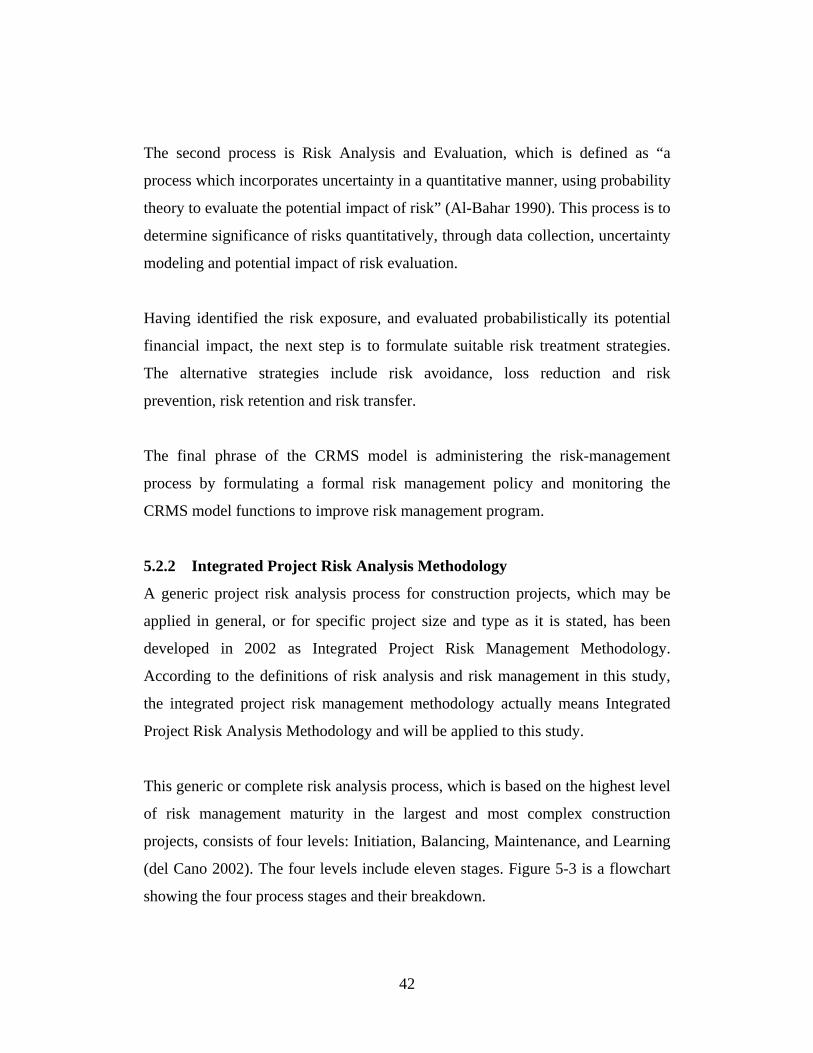
The second process is Risk Analysis and Evaluation, which is defined as “a
process which incorporates uncertainty in a quantitative manner, using probability
theory to evaluate the potential impact of risk” (Al-Bahar 1990). This process is to
determine significance of risks quantitatively, through data collection, uncertainty
modeling and potential impact of risk evaluation.
Having identified the risk exposure, and evaluated probabilistically its potential
financial impact, the next step is to formulate suitable risk treatment strategies.
The alternative strategies include risk avoidance, loss reduction and risk
prevention, risk retention and risk transfer.
The final phrase of the CRMS model is administering the risk-management
process by formulating a formal risk management policy and monitoring the
CRMS model functions to improve risk management program.
5.2.2 Integrated Project Risk Analysis Methodology
A generic project risk analysis process for construction projects, which may be
applied in general, or for specific project size and type as it is stated, has been
developed in 2002 as Integrated Project Risk Management Methodology.
According to the definitions of risk analysis and risk management in this study,
the integrated project risk management methodology actually means Integrated
Project Risk Analysis Methodology and will be applied to this study.
This generic or complete risk analysis process, which is based on the highest level
of risk management maturity in the largest and most complex construction
projects, consists of four levels: Initiation, Balancing, Maintenance, and Learning
(del Cano 2002). The four levels include eleven stages. Figure 5-3 is a flowchart
showing the four process stages and their breakdown.
42
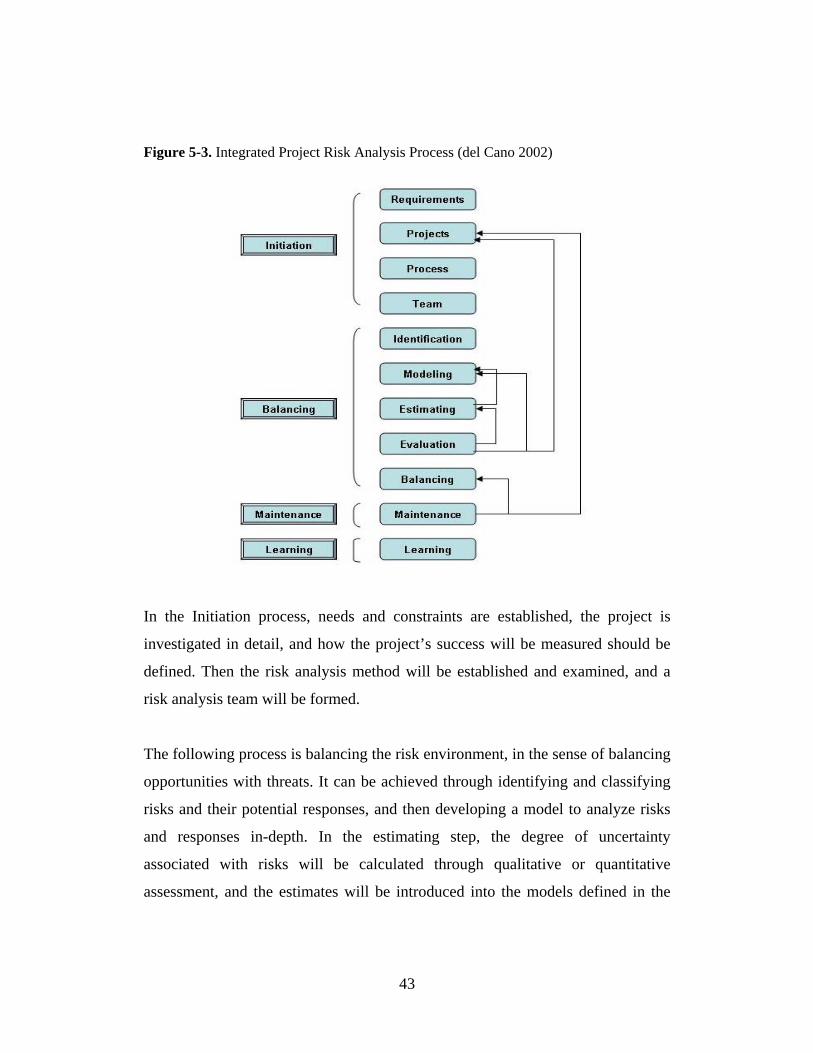
Figure 5-3. Integrated Project Risk Analysis Process (del Cano 2002)
In the Initiation process, needs and constraints are established, the project is
investigated in detail, and how the project’s success will be measured should be
defined. Then the risk analysis method will be established and examined, and a
risk analysis team will be formed.
The following process is balancing the risk environment, in the sense of balancing
opportunities with threats. It can be achieved through identifying and classifying
risks and their potential responses, and then developing a model to analyze risks
and responses in-depth. In the estimating step, the degree of uncertainty
associated with risks will be calculated through qualitative or quantitative
assessment, and the estimates will be introduced into the models defined in the
43
modeling stages to evaluate project’s risk and finally summarize the project’s
global plan by balancing between opportunities and threats.
The Maintenance phase refers to maintaining the equilibrium of the project’s risk
environment through monitoring risks, responses, risk models, and risk
evaluations. Last, the Learning phase is about learning from this experience to
improve on future activity and increase the body of corporate knowledge.
5.3 Literature Review Findings and Conclusions
5.3.1 Conclusions and Perspectives of Generic Risk Analysis Methodology
5.3.1.1 CRMS Methodology
The CRMS Model is a systematic analytical approach developed in 1990 starting
with risk identification, probabilistic risk evaluation of significant risks, and
development of alternative risk management strategies. It provides a closed-loop
feedback to update the information in risk analysis. This methodology provides
neither detailed descriptions of risk evaluation method and details of feasible risk
analysis techniques, nor any information on application of the methodology to a
real risk analysis practice.
The risk identification process is generic and should be tailored to shorten the
process time frame. In this process, the development of preliminary checklist can
be combined with the risk classification step.
In the risk evaluation process, data collection is critical and may come from
historical records. However, in many cases, directly applicable historical data
concerning the risk is not available in adequate amount. Hence, available data is
mainly subjective in nature and must be obtained through careful questioning of
44
experts or persons with the relevant knowledge. This questions the result of
probability analysis, and in many cases, even the need of uncertainty modeling.
Probability is an explicit way of dealing with uncertainty. It is a device that
permits management to incorporate all the available information concerning the
likelihood of risk consequence into a single or combined number. However,
without adequate data, the number is of no use and value. Probabilistic risk
analysis is one of the steps of CRMS methodology. However, risk analysis
techniques should be selected according to many factors regarding the project, the
people conducting risk analysis, the available risk analysis techniques, and so on.
5.3.1.2 Integrated Project Risk Analysis Methodology
The integrated generic project risk analysis methodology is tailored for
construction projects. Different from the CMRS model, the stages of this process
can overlap and interact with the project management activities. Moreover,
analysis techniques can be chosen according to the project, its determining factors,
and the type of analysis to be executed. The main qualitative risk analysis
techniques are listed and some recommendations are also provided.
A specific risk analysis process must be developed according to the particular
circumstances of the project and the organization undertaking it. In this integrated
risk management methodology, the generic process can be simplified according to
various factors associated with the maturity of the organization, the relative size
of the project, and its complexity. This is one of the advantages of this
methodology. However, this generic methodology does not provide details of risk
identification, classification and evaluation methods. It provides details in risk
analysis techniques, but similar to the CMRS model, it only focuses on the
general descriptions of the risk analysis process.
45
5.4 General Risk Analysis Techniques
Monte Carlo simulation is specified in the FTA formal risk analysis methodology.
It is also suggested according to our risk analysis study for Springfield Union
Station Intermodal Redevelopment project. In fact, tools and techniques for
analyzing risk and making decisions under risk are many and must be chosen
according to project, its determining factors, and the type of analysis to carry out.
Any rigid recommendation in this field would be absurd (del Cano 2002).
In the context of management science, there are two broad categories of
management techniques, which are deterministic and probabilistic or stochastic.
Deterministic techniques assess risks qualitatively while probabilistic techniques
make quantitative evaluation of risks. Deterministic techniques are also called
qualitative techniques, and probabilistic techniques are called quantitative
techniques. When one makes decision he or she needs to have clear objectives,
goals, plans, and strategies. The tools and techniques help people to determine a
decision, but can not make the decision, only humans can initiate the course of
action (Flanagan & Norman 1993).
5.4.1 Qualitative Risk Analysis Techniques
The main currently used qualitative risk analysis techniques are (del Cano 2002):
• Checklists;
• Assumptions analysis;
• Data precision ranking, to examine the extent to which a risk is understood,
the data available about it, and the reliability of the data in order to evaluate
the degree to which the data about risks is useful;
• Probability and impact description, to describe those parameters in qualitative
terms (very high, high, moderate, and so on);
46
• Probability-impact risk rating tables, which assign risk ratings (very low, low,
moderate, and so on) to risks based on combining probability and impact
qualitative scales;
• Cause-and-effect diagrams, also called Ishikawa or fishbone diagrams, to
illustrate the interrelations between risks and their causes;
• Flowcharts and influence diagrams, as pure graphs reflecting the interrelations
between activities, risks, and responses; and
• Event and fault trees, which are typically used in risk analysis of engineering
systems and which can also be used in project management.
5.4.2 Quantitative Risk Analysis Techniques
The main currently used quantitative techniques are (del Cano 2002):
• Sensitivity analysis, to discover the criticality of various project parameters;
• Expected value tables, to compare expected values for different risk responses;
• Triple estimates and probabilistic sums applied to cost estimating;
• Monte Carlo simulation, to obtain the cumulative likelihood distributions of
the project’s objectives using probabilistic estimation of the input parameters;
• Decision trees to aid decision making when there are choices with uncertain
outcomes;
• Probabilistic influence diagrams combining influence diagrams with
probability and Monte Carlo theory to simulate aspects of project risk;
• Multi-criteria decision-making support methods (MDMSMs) for making
choices among alternatives with conflicting demands. Analytic hierarchy
process (AHP), for example, is a type of MDMSM that can be used for multi-
criteria selection among different risk responses, mixing qualitative and
quantitative criteria;
47
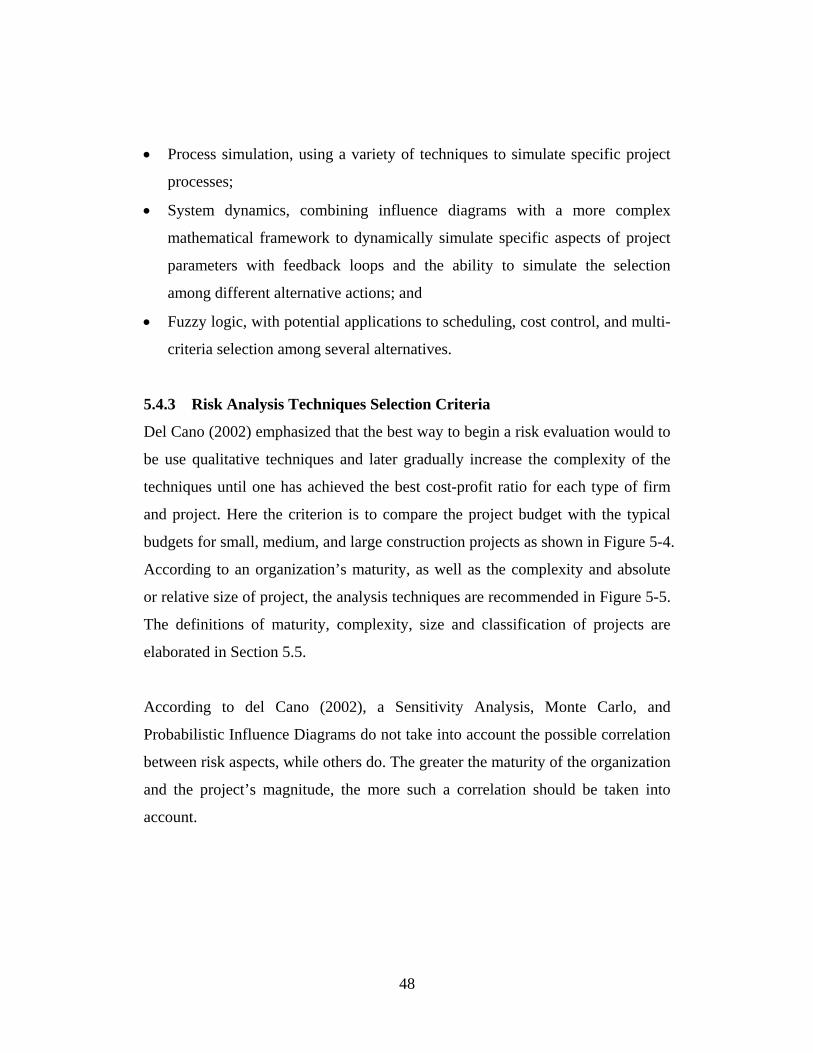
• Process simulation, using a variety of techniques to simulate specific project
processes;
• System dynamics, combining influence diagrams with a more complex
mathematical framework to dynamically simulate specific aspects of project
parameters with feedback loops and the ability to simulate the selection
among different alternative actions; and
• Fuzzy logic, with potential applications to scheduling, cost control, and multi-
criteria selection among several alternatives.
5.4.3 Risk Analysis Techniques Selection Criteria
Del Cano (2002) emphasized that the best way to begin a risk evaluation would to
be use qualitative techniques and later gradually increase the complexity of the
techniques until one has achieved the best cost-profit ratio for each type of firm
and project. Here the criterion is to compare the project budget with the typical
budgets for small, medium, and large construction projects as shown in Figure 5-4.
According to an organization’s maturity, as well as the complexity and absolute
or relative size of project, the analysis techniques are recommended in Figure 5-5.
The definitions of maturity, complexity, size and classification of projects are
elaborated in Section 5.5.
According to del Cano (2002), a Sensitivity Analysis, Monte Carlo, and
Probabilistic Influence Diagrams do not take into account the possible correlation
between risk aspects, while others do. The greater the maturity of the organization
and the project’s magnitude, the more such a correlation should be taken into
account.
48
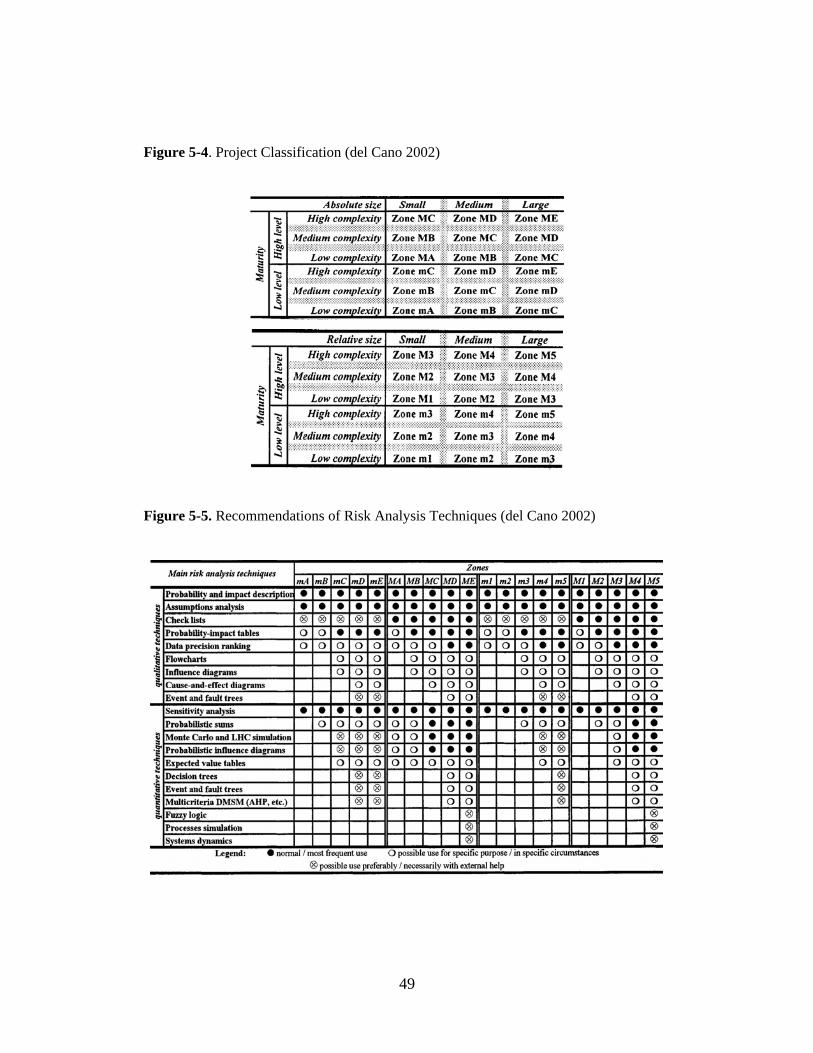
Figure 5-4. Project Classification (del Cano 2002)
Figure 5-5. Recommendations of Risk Analysis Techniques (del Cano 2002)
49
Finally, sophisticated quantitative techniques (process simulation, system
dynamics, fuzzy logic) will only be used in a small number of cases of high-level
risk maturity organizations undertaking ‘‘megaprojects,’’ particularly when the
organization wants to add a component of research and development. In general,
more complex risk models and, consequently, more knowledge and experience
are needed for that purpose.
In addition to the techniques noted above, other techniques such as brainstorming,
interviewing and modifying one or more the above techniques can also be used in
evaluating risks. del Cano (2002) stated that the selection of risk analysis
techniques would also be affected by the following factors:
• In cases where a certain degree of maturity is involved, whether or not the
organization is, for the first time, in the transition from applying the process in
small and well-managed projects to its application in more problematic and
larger ones;
• The motivation and attitudes of personnel involved in the implementation of
the risk management process;
• Whether or not the risk management process is applied from the project’s
inception;
• The way in which risk management is carried out in the program that includes
the present project;
• The available resources (internal and external) and time;
• The type of contracting system; and
• The prioritization of objectives.
50
5.5 Risk Analysis Techniques Selection for Case Study
5.5.1 Project Classification by Complexity
5.5.1.1 Theory:
As del Cano (2002) states, a questionnaire with 69 short questions has been
elaborated to estimate a project’s complexity, in qualitative terms, in the
following seven project areas:
• Project environment
• Facility to build
• Technology
• Project organization
• Project objectives
• Information
• Cultural aspects
In each project area there are two types of complexity, direct and indirect
complexity. Direct complexity includes differentiation and interdependence
among a system’s elements. Indirect complexity relates to factors that tend to lead
eventually to higher levels of interdependence among the elements of a system.
Answers are placed on a scale to show how much importance each factor in the
above seven areas has for a particular project. At the same time, each question has
a weighting or level of importance. The index of complexity refers to the quotient
between the weighted average of the answers and the maximum value of
complexity that can be obtained answering the questionnaire.
Thus, as real-life examples:
51
• Low complexity: Complexity Index measured up to 15%,
For example, an apartment building complexity Index is
about 7%
• Medium complexity: Complexity Index is 15% to 30%
• High complexity: Complexity Index is higher than 30%,
For example, for the channel tunnel, is about 50%.
In this case, project complexity is classified subjectively because the goal of this
classification is only to establish recommendations within a flexible
methodological framework. The above examples can serve as the reference for
classification in terms of project complexity.
5.5.1.2 Application to Case Study
A point that needs to be emphasized is that the goal of the classification is only to
establish recommendations with a flexible methodological framework. The
developed questionnaire to estimate complexity of construction projects is not
available, and it may also waste time and effort to go through the questionnaire
even when it is accessible. Therefore, instead of using a questionnaire, the project
can be classified by considering direct and indirect complexity of the factors
including project environment, facility to build, technology, project organization,
project objectives, information, and cultural aspects.
The project for case study can be classified as a high level complexity. Although
the facility to build and technology applied to the case study project may not be in
a high complexity level, the other project characteristics make the project a high
lever complexity. It is a multi-phased project that includes Federal, State and local
transportation agencies in addition to a private railroad company. The project
organization is unique as stated hereinbefore. The project objectives and
52
information required and cultural consideration involve a lot of people or parties.
Therefore, the Springfield Union Station Intermodal Redevelopment project can
be classified as a high level complexity.
5.5.2 Project Classification by Project Size
5.5.2.1 Theory
Project can be classified by either relative size or absolute size. According to del
Cano (2002), the criterion to classify project by project relative size is to compare
project budget and company’s capitalization. For example, the project can be
classified as small, medium or large when the project budget is on the order of
1/100, 1/10, or 1/1 of the company’s capitalization, respectively.
To classify a project by project absolute size, the criterion is to compare the
project budget with the typical budgets for small, medium, and large projects in a
particular field. For example, a project can be classified as small, medium or large
when the project budget is less than US$25 million, between US$25 million and
US$100 million or greater than US$100 million for construction projects
generally.
5.5.2.2 Application to Case Study
As of June 2003, the Funding Allocation Plan indicated that the Union Station
project has received FTA and EOTC funding commitments in the amounts of
$44.125 million. With the corresponding increment in state matching funds, this
requested earmark would bring the combined FTA / EOTC commitment to $56
million. Therefore, the proposed total funding is $100.125 million. And according
to Use of FTA / EOTC Funds, the total estimated project cost is $115.416 million.
Because the case study project is a joint-developed project by both public sector
and private sector, the project relative size is difficult to determine by comparing
53
project budget and company capitalization. Therefore, the project is classified by
its absolute size as Large.
5.5.3 Project Classification by Organization Risk Maturity Level
5.5.3.1 Theory
Hillson (1997) establishes possible organization risk management maturity levels
as followed:
1) “naïve”: the organization is unaware of the need for risk management
2) “novice”: the organization is beginning to experiment with risk management
through a small number of individuals, but there is no generic, structured
approach to manage risk
3) “normalized”: risk management is included in normal business processes
and consistently implemented on all or most projects
4) “natural”: the organization has a risk-aware culture with a proactive
approach to risk management in all aspects of the business and with an
emphasis on opportunity management.
The low maturity level includes levels 1 and 2 from Hillion’s model. The high
maturity level includes level 3 and 4. Few organizations are currently at level 4;
many organizations are either at level 2 or 3, and a significant number remain at
level 1. Normally, non-project-driven organizations are at level 1 (Hillson 1997).
5.5.3.2 Application to Case Study
Federal Transit Administration (FTA) is the main organization conducting risk
assessment for the project, and FTA does have a generic, structured approach to
manage risk, and risk management has been included in their normal project
process.
54
The earliest risk assessment was done in 1995 on the Baltimore Light Rail
Transportation project. After that, they have continued making efforts in risk
assessment to help decision making. There are four risk assessment model
projects, Lower Manhattan Recovery Office project, Seattle Sound Transit
Central Link project, Pittsburgh North Shore Connector project recently.
Therefore the organization risk maturity level can be considered level 3, which is
a high maturity level.
5.5.4 Risk Analysis Techniques Recommendation for Case Study
Risk analysis techniques can be chosen according to the project, its determining
factors, and the type of analysis to carry out (profitability, time, cost, and so on).
The main qualitative risk analysis techniques are listed and recommendations are
provided.
A summary of the classification of Springfield Union Station Intermodal
Redevelopment project by complexity, relative size, and organization risk
maturity level is: high-level organization risk maturity, high complexity, and large
absolute size. Based on the classification matrix provided by del Cano (2002)
shown in Figure 5-4, the project is located in Zone ME. Then based on the
recommendation matrix in Figure 5-5, risk analysis techniques regarding Zone
ME are recommended.
Normal or most frequently used risk analysis qualitative techniques include:
• Probability and impact description
• Assumptions analysis
• Probability-impact risk rating tables
• Data precision ranking
55
Normal or most frequently used quantitative techniques include:
• Sensitivity analysis
• Probabilistic sums
• Monte Carlo and Latin Hypercube simulation
• Probabilistic influence diagrams
Therefore, both qualitative risk analysis techniques and quantitative analysis
techniques can be selected and applied to the case study project.
Monte Carlo simulation has been recommended by FTA. Unfortunately, after
five-month’s data collection and updating, the resources were still incomplete for
conducting Monte Carlo simulation at that particular phase of the project. Because
the main objectives of quantitative analysis are to provide participants with an
opportunity for reflection and to make any uncertainty in the project as clear as
possible to those participants, a quantitative analysis should never be idolized. It
should be done seriously and rigorously; otherwise, it is preferable to avoid it
altogether. It should also be used with prudence, mainly as a communication tool.
Therefore, a qualitative risk analysis technique or modified analysis method
should be applied to the case study project in this particular circumstance.
5.6 Preliminary Risk Analysis Process for the Case Study
5.6.1 Pre- workshop
Our risk analysis team has been familiar with the project and analyzed base cost
and schedule independently. By all means we tried to update the project
information and to identify independent project events and the associated risks.
The next step was to conduct a workshop in which the current critical issues could
be addressed and hence stimulate the management’s decision-making. Several
actions were taken for preparation of the further effective risk analysis process.
56
5.6.1.1 Update Project Information and Pre-identify Risks
We concluded that it is critical to get a progress schedule and other available
updated information from FTA as to the project status. We can not obtain any
progress schedule form FTA because there were actually no updates on the
project schedule and no cost information. FTA has had several meetings with
PVTA and their design consultant right following our field trip to the site. We
received the updates of the project from FTA as follows:
1) “CSX does not want the PVTA's busway to utilize their RR bridges without
significant cost sharing in the rehabilitation. This will have to be negotiated
in the near future. The design consultant is looking to see if it is possible to
build adjacent structures and not utilize the RR bridges.”
2) “Property acquisition is delayed on one parcel.”
3) “Water infiltration from the busway slab is causing damage to the east wall of
Union Station.” FTA may be authorizing the grantee to go ahead and replace
this slab now. The cost could be significant because this slab runs the entire
length of the building.
Based on our field trip to the site and meeting with Gary Shepard and his staff,
and the updates provided by FTA, we identified the following risks:
1) Timing and availability of the car lot to be used as the new maintenance
facility for Peter Pan.
2) Participation and cooperation by CSX in issues related to the use of the
corridor that runs parallel to the building and the ownership and subsequent
maintenance of the bridges.
3) Amtrak's lack of economic contribution to the operation and maintenance of
the building as well as the moving of the $1 M control panel.
57
4) Busway slab leaking problem may incur significant replacement cost.
5) Impact of the delays in starting construction on the overall present condition
and security of the building.
We concluded that the two most critical items at this time are (1) and (2). Without
acquiring the required parcels, the project scope would have to be changed and
the project would not be able to be furthered.
5.6.1.2 Identify Workshop Participants
Another critical issue is identifying the participants in the workshop. The
identification is becoming more critical due in large part to the logistics of getting
the multiple parties to arrange their schedules to attend the workshop.
Our risk analysis team developed a list of whom we think should be invited but
we needed FTA to confirm and/or edit these participants, as follows:
Designer Representative
PVTA Representative
FTA
Peter Pan Representative
CSX Representative
AMTRAK Representative
Springfield Union Station Redevelopment Authority Representative
The schedule also indicates that there are both public and private funds which will
affect the project. The team deferred to the FTA as to whom the representatives
are and whether they should be invited to participate.
58
We also discussed the private citizen who owns the property that is being tapped
to house the Peter Pan maintenance facility. Again we deferred to FTA on the
decision of his involvement.
5.6.1.3 Develop Workshop Worksheet
As the basis of information to begin and guide discussions at the workshop, our
risk analysis team developed two spreadsheets, one for cost and one for schedule.
The schedule spreadsheet contained the program milestones and major activities
in each of the components of the project. Relevant to each activity, time schedule,
potential risks, party involved, and risk correlations could be evaluated by
participants, if applicable.
Participants would be directed to assign values of probability to the risks they
identified, if applicable. Participants were also encouraged to discuss the impacts
due to the potential risks. We utilized the anticipated start and completion dates
from the schedule in the hope that more realistic dates could be determined by the
participants while assigning the potential risks to the activities.
It was determined that the cost estimate worksheet could not correlate back to the
schedule items due to the incomplete cost breakdown information. Hence, the
schedule spreadsheet became the main worksheet in the workshop and is included
in Figure 5-6.
59
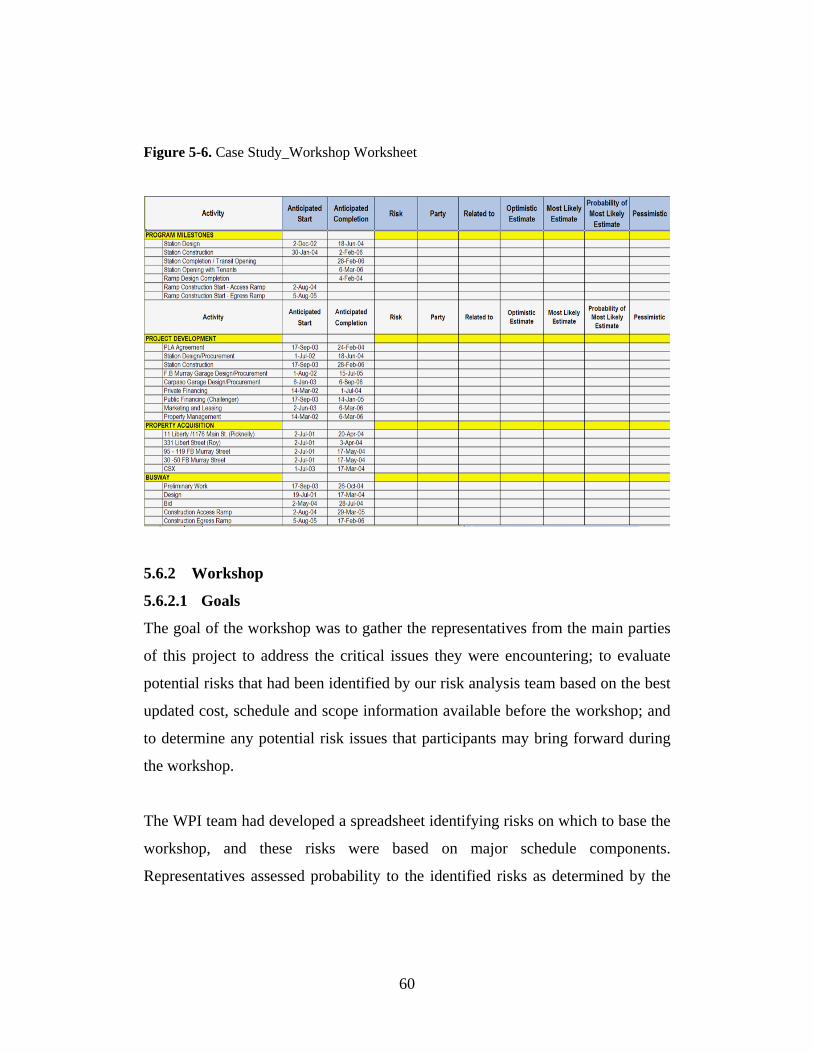
Figure 5-6. Case Study_Workshop Worksheet
5.6.2 Workshop
5.6.2.1 Goals
The goal of the workshop was to gather the representatives from the main parties
of this project to address the critical issues they were encountering; to evaluate
potential risks that had been identified by our risk analysis team based on the best
updated cost, schedule and scope information available before the workshop; and
to determine any potential risk issues that participants may bring forward during
the workshop.
The WPI team had developed a spreadsheet identifying risks on which to base the
workshop, and these risks were based on major schedule components.
Representatives assessed probability to the identified risks as determined by the
60
schedule milestones and major schedule components and at the same time other
potential risks which are not determined by the available cost and schedule
information obtained by our risk analysis team was further identified from the
point of views of the representatives.
There was also the intent to determine a responsible party for said risks. The
major components identified for discussion were: (1) Project Building
Components including the Station, the Busway, and Garages (FB Murray &
Caparso), (2) Parcel Acquisition including CSX negotiations for the bridges and
(3) Developmental Components of the projects including financial, marketing and
property development.
5.6.2.2 Workshop Participants
The workshop was conducted on April 27, 2004 at the PVTA offices in
Springfield. The participants included:
• PVTA: Gary Shepard (Administrator), Sandra Sheehan, Kevin Walkowski
(Legal Council)
• City of Springfield: Robert Warren
• Hayes Development: Maureen C. Hayes
• DMJM+HARRIS: Michael Hunter (Design Consultant to PVTA)
• CMG/PVTA: Richard Wilk (On-site manager)
• FTA: Matthew Keamy and Saptarshi Bhattachria
• WPI Team: Guillermo Salazar, Ph.D., Wei Guo and Jeannette Skoropowski
61
5.6.2.3 Methodology
Our intention was to have a main session involving all participants and then two
smaller sessions in which the group would be split, one to discuss cost issues and
one to discuss schedule issues identified in the large session and then a recap of
the small group discussion in the large forum. Due to the size of the group in
general, the smaller breakouts were forgone and all participants discussed each
item based on cost and schedule implications. This method proved to be quite
beneficial in facilitating much discussion and identification of other potential risk
issues not readily determined by the cost and schedule information.
As the basis of information to begin discussions at the workshop, the worksheet
that contained the program milestones and major activities in each of the
components of the project had been developed. During the workshop discussions,
the worksheet turned out to be useful and helped to guide the discussions. When
evaluating each schedule item, a column was added during the course of the
workshop and to record any cost risks associated with the activity. However, the
participants felt that it would be nearly impossible to determine more realistic
dates at this juncture while the CSX issue was still unresolved.
We moved forward identifying potential risks associated with each milestone
activity. Several secondary but pertinent discussions and some potential
mitigation measures ensued along the way as each item was discussed. In terms
of potential risks, including optimistic, most likely and pessimistic time frames
and then a probability (percentage) of the most likely and most pessimistic
options was determined among the participants.
As discussions progressed, unsolicited mitigation ideas began to emerge into the
discussions. This was an unexpected additional benefit to the workshop results.
62
Generally mitigation measures in keeping with current FTA methodology are
presented and discussed at a later phase in the process. The ideas presented and
discussed as the workshop progressed are valuable avenues to pursue as the
project moves forward. In some instances, if the mitigation measures ultimately
become a reality, they will allow the project to move forward. The participants
were raising ideas and issues previously not explored on the project. Potential
mitigation measures have been captured within the appropriate project component
narrative below.
5.6.2.4 Project Component Discussions
Station Design: Scope change was determined to be a potential risk. If the issue
with CSX is unable to be resolved and subsequently the busway unable to be built
as currently designed, the station could encounter changes due to the relocation of
the busway. There was some discussion as to the amount of rework needed via
scope change as some participants felt it would be minimal, mainly traffic flow
within the station would need to be reevaluated. It was discussed in regard to the
CSX issue and its impact that the possible effects could become potential
solutions and therefore mitigation measures in the future.
Station Construction: Currently the construction of the station is phased and the
drawings are at the 60% due diligence stage. Should there be a scope change that
would allow construction to be completed in 1 stage, there is the possibility for
cost savings overall. The busway design does not impact the construction of the
station. Potential risks discussed included material costs (steel in particular) and
labor prices. It was determined that these would cancel each other out. A risk
identified here was the tunnels within the station in regard to liability. A
secondary issue raised was the ADA regulations and compliance. Gary Shepard
mentioned that the tunnels are a key to the traffic flow of the station to the tracks
63
and also a marketing tool that would be negated should the tunnels be eliminated
form the project.
Busway Design and CSX Negotiation: The current design of the busway will not
be feasible if the CSX issue is not resolved and PVTA can acquire an easement to
allow use of the 3 bridges owned by CSX. PVTA has directed their designer
DMJM+HARRIS to investigate alternatives to the current design to make the
busway work without utilizing the bridges. It was mentioned that CSX also has to
approve the design of the busway.
PVTA (Walkowski) stated that CSX would sell/grant permanent easement for no
cost and would “do it tomorrow”; however, PVTA must assume all maintenance
and operational costs associated with the bridges. He further stated that CSX is
not willing to enter into any deal that would increase their liability one percent or
their costs one dollar when it comes to negotiation on this issue. Several
discussions ensued concerning the condition of the bridges, life cycle analysis of
the bridges, PVTA owing the bridges and responsibilities for maintaining them
(how to price contingency liability), historical issues in regard to the Main Street
Bridge, and the possibility of HAZMATS in relation to the bridges. Also
discussed was the lack of maintenance records that CSX has in regard to the
bridges, so there is no way to evaluate what has been done in terms of upkeep.
Discussions progressed to alternative ways to deal with the CSX issue,
suggestions included: rebuilding half the bridges, build independent new bridges,
and the possible role that the historical commission will play. Possible funding
opportunities were discussed where a “fund” would be set up and maintained to
cover the maintenance and operation of the bridges. This money could come
from Federal agencies, or a new transportation funding bill. This avenue needed
64
to be investigated further to determine exactly what stipulations were set forth in
the funding bill in order to see if the project would qualify.
Final issues discussed with regard to the busway were flagged availability and
restrictive access to site. These items were applicable to the construction of the
busway ramps in general and both were assigned a one month negative impact on
the schedule.
Acquisition Issues: The City consultant felt that the acquisitions were, in essence,
not very complicated, and therefore it was easy to determine the range and
probability of the potential risks. However, the acquisitions of the parcels were
again contingent upon the resolution of the CSX issue. A secondary issue brought
up at this juncture was the “deep pockets” of Peter Picknelli who they felt could
take legal action to block the acquisition of his parcels if PVTA attempted to take
the properties without his buy in. There was a discussion surrounding the
appraisal values of the said properties being “not in the same vicinity” of one
another. There is such a difference in the appraised values the PVTA (Walkowski)
felt that it would be difficult to come to an amicable settlement for the sale and
acquisition of his properties.
In relation to cost risks where the acquisitions are concerned, a 15% plus 4%
escalation was put to these parcels to cover any delays while acquiring the parcels.
The 19% does not include any outside of the normal legal fees that may ensue as a
result of the acquisition process.
Project Development: In large part the participants felt at this juncture that he
activities under this heading couldn’t be assessed in terms of risk potential. This
is due primarily to the flux of the project at this time. A discussion was held in
65
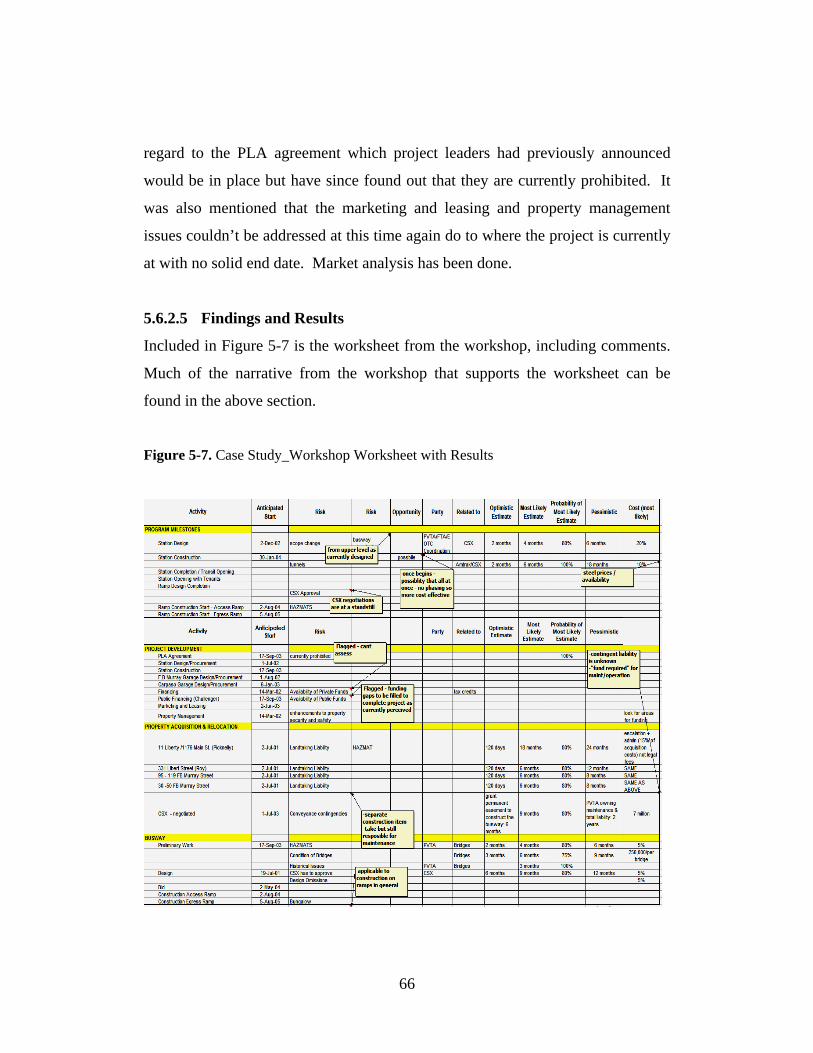
regard to the PLA agreement which project leaders had previously announced
would be in place but have since found out that they are currently prohibited. It
was also mentioned that the marketing and leasing and property management
issues couldn’t be addressed at this time again do to where the project is currently
at with no solid end date. Market analysis has been done.
5.6.2.5 Findings and Results
Included in Figure 5-7 is the worksheet from the workshop, including comments.
Much of the narrative from the workshop that supports the worksheet can be
found in the above section.
Figure 5-7. Case Study_Workshop Worksheet with Results
66
The results of the workshop proved quite worthwhile to the project. While the
CSX issue was quite apparent to be the dominating one, in terms of risk to the
project moving forward, several other “secondary” risks were identified and
discussed among the participants. At this juncture of the project, the risk analysis
study did not follow the FTA formal risk analysis methodology to conduct Monte
Carlo simulation; however, the forum produced much thought-provoking
discussion that could lead to diminished potential risks in the future, once the
CSX issue is resolved.
5.6.2.6 Challenges and Difficulties
Three main challenges we encountered were:
First, data or resources available for evaluating or analyzing the risks through
qualitative risk analysis techniques, such as Monte Carlo simulation
recommended by FTA, were incomplete.
Second, the workshop is an important way for representatives from the major
project parties to share thoughts and make decisions. However, attendance of all
the critical representatives from the main project parties was difficult to achieve.
Last, the time to start the risk analysis study for Springfield Union Station
Intermodal Redevelopment project was late. Some risky issues such as the
acquisition of CSX parcel did not be mitigated or even not be noticed by the
management before it became an critical risk which caused the project scope
change.
It is true that there is a trade off between an early start and sufficient and precise
data. However, an early commitment through qualitative risk analysis techniques
67
in many circumstances is certainly more important than waiting for the complete
data for risk evaluation. The most important point is to find a right way or method
to conduct a risk analysis at an early stage of the project before any risky issue
becomes a critical risk and has a significant unpleasant impact on the project.
5.6.2.7 Conclusions
The information we have provided and the discussions that were the result of the
workshop exercise provide a strong fundamental basis for the project participants
to think over as they move forward with the Springfield Union Station Intermodal
Redevelopment Project. A better understanding of the project’s realm and how the
multitude of activities affect and effect one another will ultimately offer various
alternatives to the many challenges of the project. New ideas and possible
solutions were presented through the workshop and gave the participants avenues
to pursue to possibly mitigate many potential risks. In some cases their discovery
of mitigation possibilities will allow the project to move forward where currently
it has been otherwise stalled as a result of the CSX issue. On the other hand, the
case study examined the generic integrated project risk analysis methodology and
was of great value in the future improvement of risk analysis methodology.
5.6.3 Post-workshop
After the workshop, the discussions and results were collected and reported. And
feedback was collected from the participants through questionnaire. We received
feedbacks from the main participants which are PVTA, FTA and busway design
consultant. A sample questionnaire is included in Appendix E, and the feedback
obtained from the workshop participants is enclosed in Appendix F.
As discussed hereinbefore, an early risk analysis commitment is certainly critical
before any risky issue becomes a critical risk and has a significant unpleasant
68
impact on the project. To start a risk analysis at an early stage of the project,
identifying risks would be more difficult than the risk identification performed in
this case study because potential risks are still not clear. And it would be also
difficult to collect or update data used for risk analysis at an early stage of the
project. Hence, an improvement of the risk analysis approach implemented in the
case study would be helpful for an early risk analysis commitment.
According to the feedback, the workshop was successful in terms of addressing
critical issues and fostering decision-making. The CSX issue was highlighted
during the workshop. This was a very good opportunity for participants to realize
the importance of CSX acquisition issue. During the discussion, the main topic
was focused on this issue since many other issues or activities are related to CSX
issue. The risk related to the CSX issue is very obvious. On the other hand, too
much focus on one issue may neglect some other critical issues and may make the
workshop not as effective as it should be. Therefore, an improvement to address
this problem would be of benefit.
Moreover, risk management and mitigation step was not formally included in the
risk analysis workshop for the case study. The mitigation plan should be
discussed at a later phase according to FTA formal risk analysis methodology. In
the new approach developed to continue the risk analysis for Springfield Union
Station Intermodal Redevelopment project, risk management and mitigation was
not expected to be addressed in the workshop. However, during the workshop as
discussions progressed, unsolicited mitigation ideas were emerging into the
discussions which provided a better understanding for decision-makers. To foster
decision-making and improve the effectiveness of the workshop, formally
addressing risk management and mitigation in the workshop would be one of the
important contributors.
69
5.6.4 Future Improvement
The new risk analysis approach implemented in the case study can be enriched
and improved in the following facets:
• Risk Checklist could be beneficial for risk analysis team to identify risks at an
early stage of the project.
• Risk Classification could be incorporated in the process to improve the
effectiveness of the workshop discussions and to stimulate the decision-
makers’ better understanding of potential risks.
• Risk Management and Mitigation could be addressed formally in the
workshop.
• Other improvements, such as Web-Biuld to enhance risk communications
among project participants would be of great value.
70
6 IMPROVED PRELIMINARY RISK ANALYSIS FRAMEWORK FOR
TRANSPORTATION PROJECTS
6.1 Overview
Considering potential future outcomes when an organization pursues a project
helps to earn additional value in the project. It helps to identify what management
knows, but may not be able to quantify. Whereas the current use of risk analysis
focuses very heavily on how to quantify the uncertainties, the real discussion is
how to think about all of the potential losses and opportunities. It requires an
effective risk analysis methodology to be able to apply to projects at a very early
stage without sacrificing the quality of risk analysis results, and can be easily
implemented at a lower cost and shorter time frame, as well as serving as a quick
follow-up risk analysis, if applicable, to enhance risk communication.
The preliminary risk analysis framework has been developed and tested on the
Springfield Union Station Intermodal Redevelopment project. This newly-
developed approach was of great value in the circumstances that the formal
structured FTA risk analysis methodology was not feasible and applicable. The
results of applying this preliminary risk analysis framework to the real project
were very good. Hence, being improved based on the lessons learned and
conclusions from the case study, this proposed framework would be able to
achieve an effective early risk analysis commitment at a relatively low cost while
providing the much-needed flexibility to improve project decision-making and
reduce risk exposure for transportation projects.
Finally, this risk analysis approach increases the chance of a project’s success and
the opportunity for a better return on investment. Furthermore, this approach can
be integrated with the current formalized risk analysis approach into a continuous
71
risk analysis methodology that can assist executives in managing uncertainties,
mitigating risks, and exploiting opportunities effectively.
6.2 Development of Risk Checklist
6.2.1 Methodology
To enrich the proposed preliminary risk analysis framework, a generic risk
checklist was developed through literature review, brainstorming sessions and
discussions with experts and experience of risk analysis practice in Springfield
Union Station Intermodal Redevelopment project.
6.2.2 Risk Definitions
Risk is a major concern in many fields from the study of lotteries to economics
and banking to engineering (Kottegoda and Rosso 1997). Any commercial
venture is affected by risk. Risk is defined in many different ways in different
disciplines. Risk is usually defined as the chance or probability of loss, harm,
failure, or danger in Webster’s Dictionary. In a broad definition, in terms of a
hazard, bad consequences, loss, or exposure to mischance, risk is defined as the
potential for realization of unwanted, adverse consequences to human life, health,
property, or the environment (Society for Risk Analysis 2003). In a more
technical sense, risk is the combination of the probability of a possible unwanted
event and the associated quantity of possible damage.
Lawrence Livermore National Laboratory of the United States Department of
Energy defines risk as the quantitative or qualitative expression of possible loss
that considers both the probability that a hazard will cause harm and the
consequences of that event (Environment, Safety and Health Manual 2001).
72
Hertz and Thomas (1983) provide an alternative definition of risk in the context
of uncertainty. They describe risk as uncertainty and the result of uncertainty. And
they also stated that risk would have to involve some kind of damage or loss. For
a construction project, it refers to a lack of predictability about structure,
outcomes, or consequences in a planning or decision situation. Symbolically, Risk
= Uncertainty + Damage.
Risk in this study is defined as “the exposure to the chance of occurrences of
events adversely or favorably affecting project objectives as a consequence of
uncertainty” (Al-Bahar and Crandall 1990). From this definition, a risk equation
can be written as: Risk = ƒ (Uncertainty, Consequence).
“Uncertainty” represents the probability that an event occurs. A consequence of
uncertainty can be positive (“gain/opportunity”) or negative (“loss/hazard/threat”).
Here, “gain” is referred to profit and benefit, and “loss” is economic loss and
physical damage. The risk definition here is no longer limited to the probability of
loss and damage. This description has been brought forward by Al-Bahar and
Crandall. They explained that even in situations of potential gains, uncertainty is
unattractive since the knowledge of the exact gains is unknown, and people
seldom give credit to an unknown gain.
Risks are not restricted to hazards, liabilities, threats and difficulties but also
opportunities. The opportunity for advancement cannot be achieved without
taking risk. "Risk in itself is not bad; risk is essential to progress, and failure is
often a key part of learning. But we must learn to balance the possible negative
consequences of risk against the potential benefits of its associated opportunity"
(Scoy 1992). This concept of risk does not conflict with the former definitions.
Furthermore, it describes risk in a more objective sense and provides a foundation
73

for the complete understanding of risk and its relative consequence, especially
when potential gains would be significant and neglecting account for these factors
may lead to misestimate total potential consequence of risks.
For the purpose of the subsequent research of a risk analysis methodology,
another important definition is introduced here. In a decision-making context, risk
can be written as: Risk = Sum {Probability * Severity}. (Wilson and Crouch 2001)
“Our perception of the magnitude of risk from some event depends on some form
of product of how often we think the event will occur and how serious we
consider each occurrence to be in its effects.” To associate risks with more
complex events or actions, it is necessary to break down the actions into
individual smaller actions. Then “Sum” stands for the summation of those risks of
the smaller actions. The equation can be also written as: Risk = Sum {Probability
* Severity * Weight}. The weight factor is included separately here – it could also
be included in the “severity” term if the equation relates perceptions.
6.2.3 Risks in Construction
Construction projects are complex in nature. Uncertainties inherently exist in all
construction projects, from the political factors to the price of various materials,
weather and site conditions, and so on. Uncertainties are not only from the unique
characteristic of the construction projects, also from the diversity of resources and
activities (CII 1989). There are very few industries that have the risks of the
construction industry, especially with the increasing growth of fast-track delivery
methods, such as design-build. There are various ways to categorize construction
risks. Risk can be classified as external risk and internal risk according to its
nature and primary source as illustrated in Figure 6-1.
74
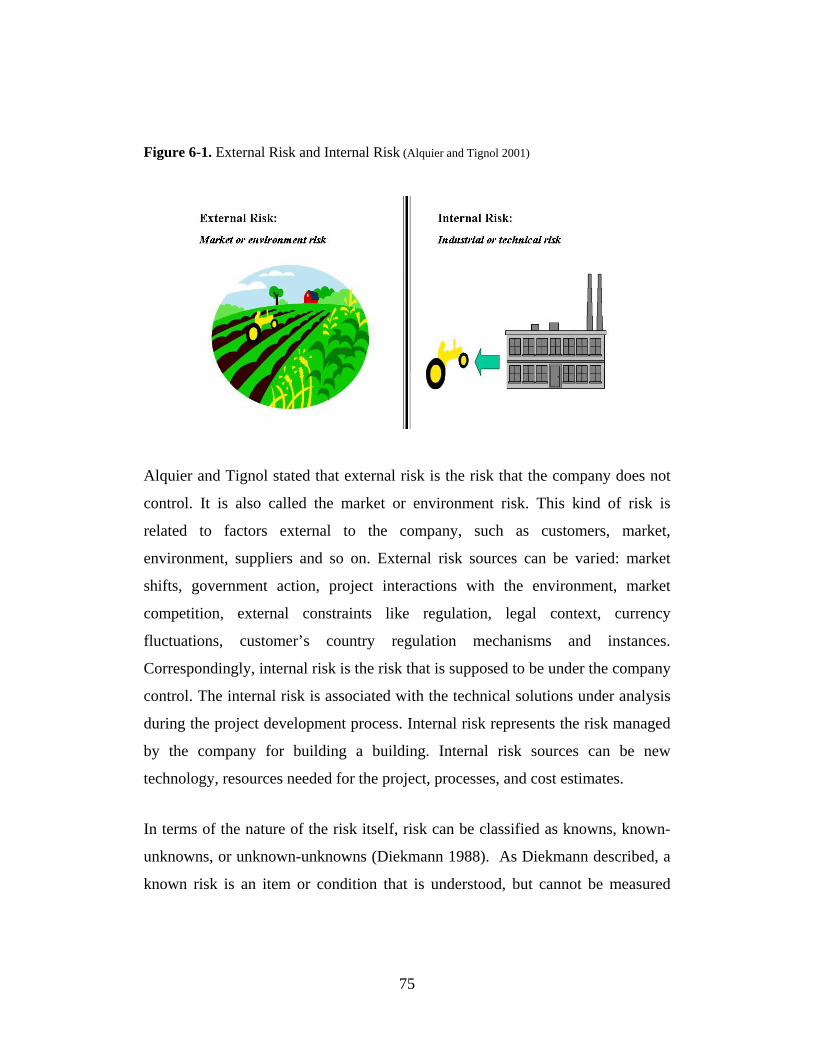
Figure 6-1. External Risk and Internal Risk (Alquier and Tignol 2001)
Alquier and Tignol stated that external risk is the risk that the company does not
control. It is also called the market or environment risk. This kind of risk is
related to factors external to the company, such as customers, market,
environment, suppliers and so on. External risk sources can be varied: market
shifts, government action, project interactions with the environment, market
competition, external constraints like regulation, legal context, currency
fluctuations, customer’s country regulation mechanisms and instances.
Correspondingly, internal risk is the risk that is supposed to be under the company
control. The internal risk is associated with the technical solutions under analysis
during the project development process. Internal risk represents the risk managed
by the company for building a building. Internal risk sources can be new
technology, resources needed for the project, processes, and cost estimates.
In terms of the nature of the risk itself, risk can be classified as knowns, known-
unknowns, or unknown-unknowns (Diekmann 1988). As Diekmann described, a
known risk is an item or condition that is understood, but cannot be measured
75
with complete accuracy. Generally, such risks occur at a relatively high rate and
contain a range of possible outcomes. Labor productivity is a good example of a
known risk. Known-unknowns conditions are events that are foreseeable, but not
normally expected. Normally, such events have a relatively low frequency and
result in severe consequences. Earthquakes, hurricanes, strikes and unusual
difficulty with a contractor are examples of this type of risk. Unknown-unknowns
are conditions or events that cannot be predicted. These items are generally
catastrophic in nature and have a low probability of occurring. Examples of
unknown-unknown include asbestos-related hazards or AIDS before they were
recognized. Once an unknown-unknown is identified, it becomes a known-
unknown.
Another approach is more direct for many construction companies to categorize
risks. Based on their effects on the project, risks are classified as cost risks,
schedule risks and quality risks for a construction project. The weak point to
classify risks using this method is that risks are easy to be counted to more than
one category. This may lead to subsequent confusion or misestimating the
consequences of risks
.
6.2.4 Risks in Transportation Projects
Project risk is defined by Federal Transit Administration (FTA) as an unexpected
event or circumstance that has a chance of occurring and that may prevent a
project from meeting its schedule and cost estimate (FTA 2004).
“Risks” are defined as cost overruns and schedule slippages in transit projects by
FTA. In the project process of complex capital projects such as fixed guideway
transit systems, cost overruns and schedule slippages are relatively common and
inevitable due to the uncertainties inherent in transit projects. Considering the
76
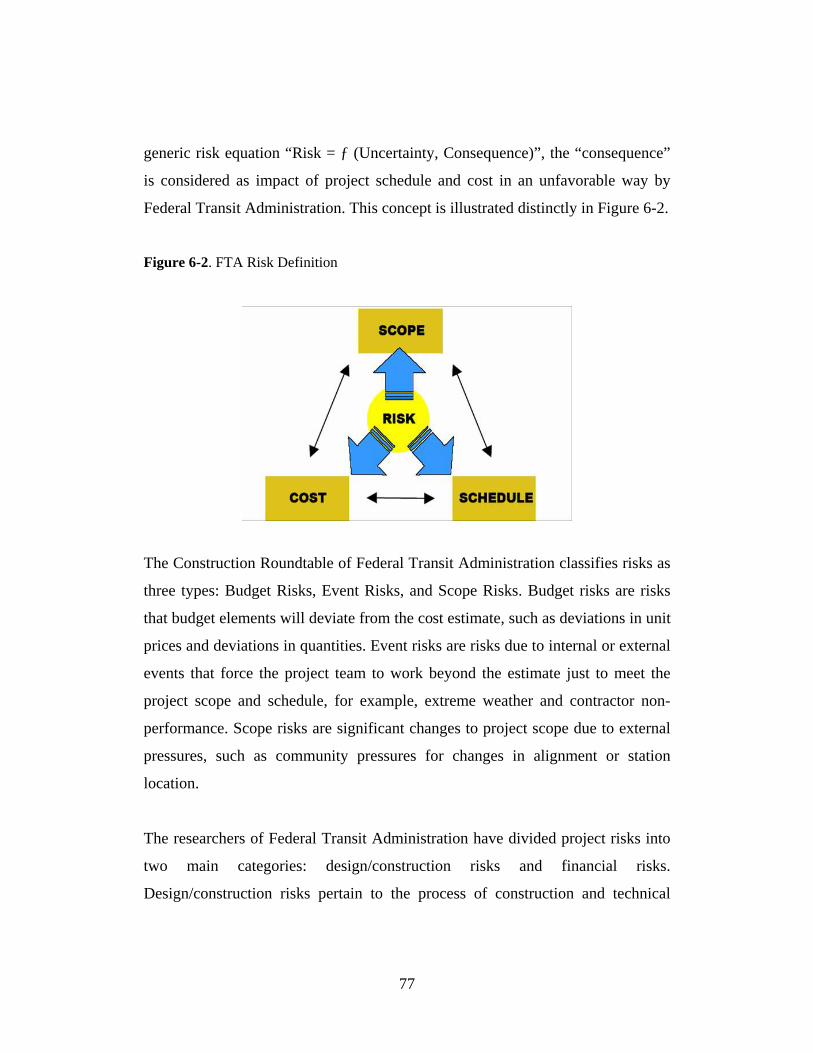
generic risk equation “Risk = ƒ (Uncertainty, Consequence)”, the “consequence”
is considered as impact of project schedule and cost in an unfavorable way by
Federal Transit Administration. This concept is illustrated distinctly in Figure 6-2.
Figure 6-2. FTA Risk Definition
The Construction Roundtable of Federal Transit Administration classifies risks as
three types: Budget Risks, Event Risks, and Scope Risks. Budget risks are risks
that budget elements will deviate from the cost estimate, such as deviations in unit
prices and deviations in quantities. Event risks are risks due to internal or external
events that force the project team to work beyond the estimate just to meet the
project scope and schedule, for example, extreme weather and contractor non-
performance. Scope risks are significant changes to project scope due to external
pressures, such as community pressures for changes in alignment or station
location.
The researchers of Federal Transit Administration have divided project risks into
two main categories: design/construction risks and financial risks.
Design/construction risks pertain to the process of construction and technical
77
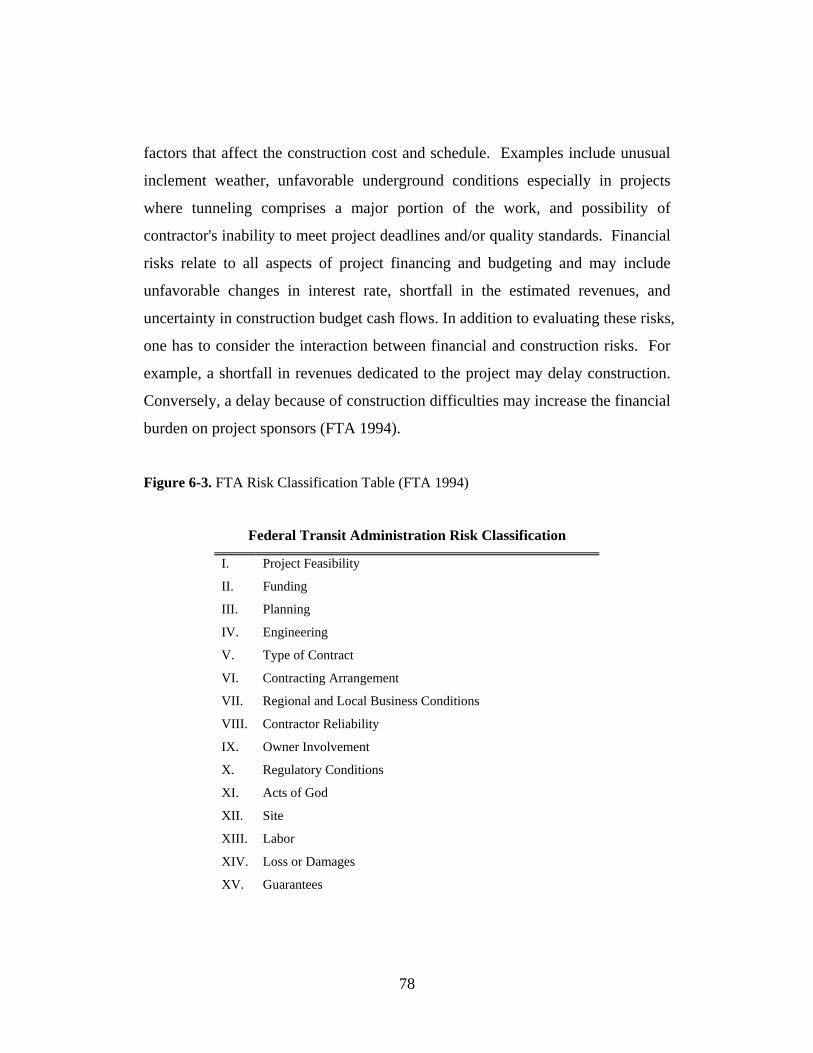
factors that affect the construction cost and schedule. Examples include unusual
inclement weather, unfavorable underground conditions especially in projects
where tunneling comprises a major portion of the work, and possibility of
contractor's inability to meet project deadlines and/or quality standards. Financial
risks relate to all aspects of project financing and budgeting and may include
unfavorable changes in interest rate, shortfall in the estimated revenues, and
uncertainty in construction budget cash flows. In addition to evaluating these risks,
one has to consider the interaction between financial and construction risks. For
example, a shortfall in revenues dedicated to the project may delay construction.
Conversely, a delay because of construction difficulties may increase the financial
burden on project sponsors (FTA 1994).
Figure 6-3. FTA Risk Classification Table (FTA 1994)
Federal Transit Administration Risk Classification
I. Project Feasibility
II. Funding
III. Planning
IV. Engineering
V. Type of Contract
VI. Contracting Arrangement
VII. Regional and Local Business Conditions
VIII. Contractor Reliability
IX. Owner Involvement
X. Regulatory Conditions
XI. Acts of God
XII. Site
XIII. Labor
XIV. Loss or Damages
XV. Guarantees
78
Based upon this classification, a further breakdown has been developed to provide
a systematic checklist of risks by FTA in 1994. From the owner’s point of view,
risks are divided into fifteen major categories as showed in Figure 6-3. The
complete risk classification table including subcategories is included in Appendix
H.
6.2.5 Generic Risk Checklist
Based on the literature review, brainstorming sessions and discussions with
experts and the above FTA risk classification developed in 1994, risks are
classified as eighteen major categories for transportation projects as showed in
Figure 6-4. A detailed breakdown list of potential risks is included in Appendix I.
The risk listing would be beneficial for preliminary risk analysis or management
planning. It serves as a generic guideline of potential risks for transportation
projects. The list would be helpful for breaking down all risks into manageable
components as well.
The subcategories of risks reflect all areas of risk for transportation projects. It
would provide a systematic and objective approach to the risk identification
process and ensure that no major risk element is overlooked. With various project
delivery methods, the provisions addressed in the terms and conditions of
construction contracts, and various project resources and characteristics, risks
should be identified specifically upon needs for a specified project.
79
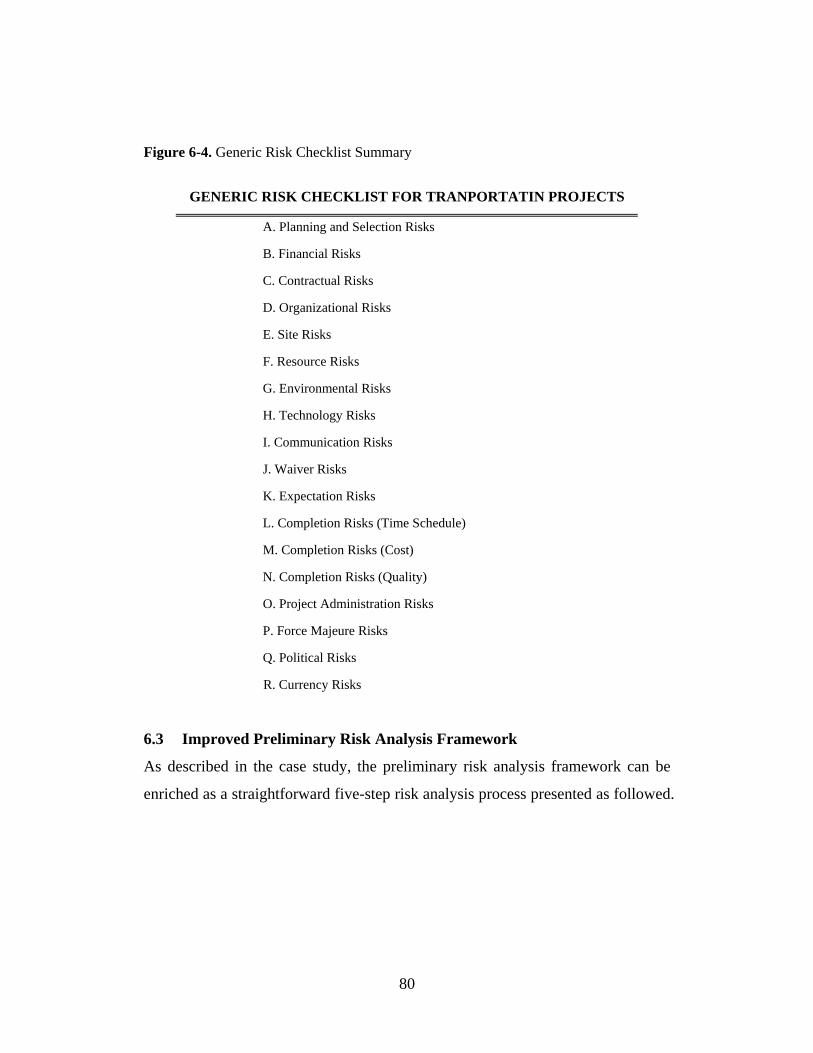
Figure 6-4. Generic Risk Checklist Summary
GENERIC RISK CHECKLIST FOR TRANPORTATIN PROJECTS
A. Planning and Selection Risks
B. Financial Risks
C. Contractual Risks
D. Organizational Risks
E. Site Risks
F. Resource Risks
G. Environmental Risks
H. Technology Risks
I. Communication Risks
J. Waiver Risks
K. Expectation Risks
L. Completion Risks (Time Schedule)
M. Completion Risks (Cost)
N. Completion Risks (Quality)
O. Project Administration Risks
P. Force Majeure Risks
Q. Political Risks
R. Currency Risks
6.3 Improved Preliminary Risk Analysis Framework
As described in the case study, the preliminary risk analysis framework can be
enriched as a straightforward five-step risk analysis process presented as followed.
80
6.3.1 Perform a Pre-Analysis Inquiry
For most transportation projects, this pre-analysis inquiry can be combined with
the process of risk identification. The goal of pre-analysis inquiry is to familiarize
with the project including the available cost data, schedule information, project
scope, parties involved and so on. The duration of this step depends on
characteristics of the specific project.
This is mainly the same as the first step that was followed in the case study. The
only difference is a generic risk checklist has been developed for transportation
projects as presented in the previous section. This generic risk checklist can be
used to help in identifying risks. The traditional risk identification process often
lasts for a relatively long period of time. It is of considerable importance since the
subsequent risk analysis steps may only be focused on identified potential risks.
Therefore, the risk identification process must involve an investigation into all
possible potential risks. This process can be very difficult, particularly if the risk
analysis starts at an early stage of a project, such as preliminary design stage. The
generic and complete risk checklist enclosed in Appendix I would be very useful
to identify all potential risks in a relatively short time and low cost associated with
the identification process. This preliminary risk analysis framework is
advantageous since it is feasible for starting a risk analysis at the early stage of a
project. In an early stage of the project, the risk analyst or risk analysis team can
develop a specific risk checklist for the project based on the generic risk checklist
through pre-analysis inquiries by any means which can best fit, such as
conference calls, emails, interviews and so on.
6.3.2 Classify Risks and Develop Workshop Worksheet
Unlike the process in the case study, after the risk analysis team identified risks,
risks should be classified based on two main factors which are the potential
81
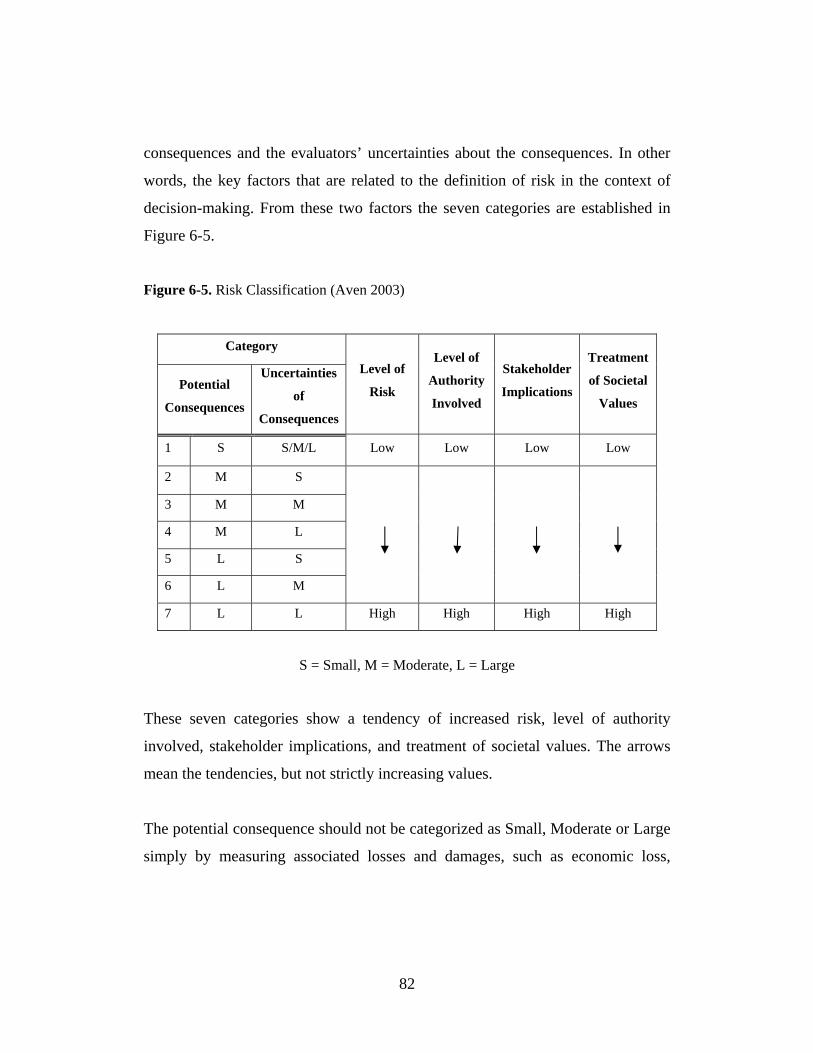
consequences and the evaluators’ uncertainties about the consequences. In other
words, the key factors that are related to the definition of risk in the context of
decision-making. From these two factors the seven categories are established in
Figure 6-5.
Figure 6-5. Risk Classification (Aven 2003)
Category
Potential
Consequences
Uncertainties
of
Consequences
Level of
Risk
Level of
Authority
Involved
Stakeholder
Implications
Treatment
of Societal
Values
1 S S/M/L Low Low Low Low
2 M S
3 M M
4 M L
5 L S
6 L M
7 L L High High High High
S = Small, M = Moderate, L = Large
These seven categories show a tendency of increased risk, level of authority
involved, stakeholder implications, and treatment of societal values. The arrows
mean the tendencies, but not strictly increasing values.
The potential consequence should not be categorized as Small, Moderate or Large
simply by measuring associated losses and damages, such as economic loss,
82
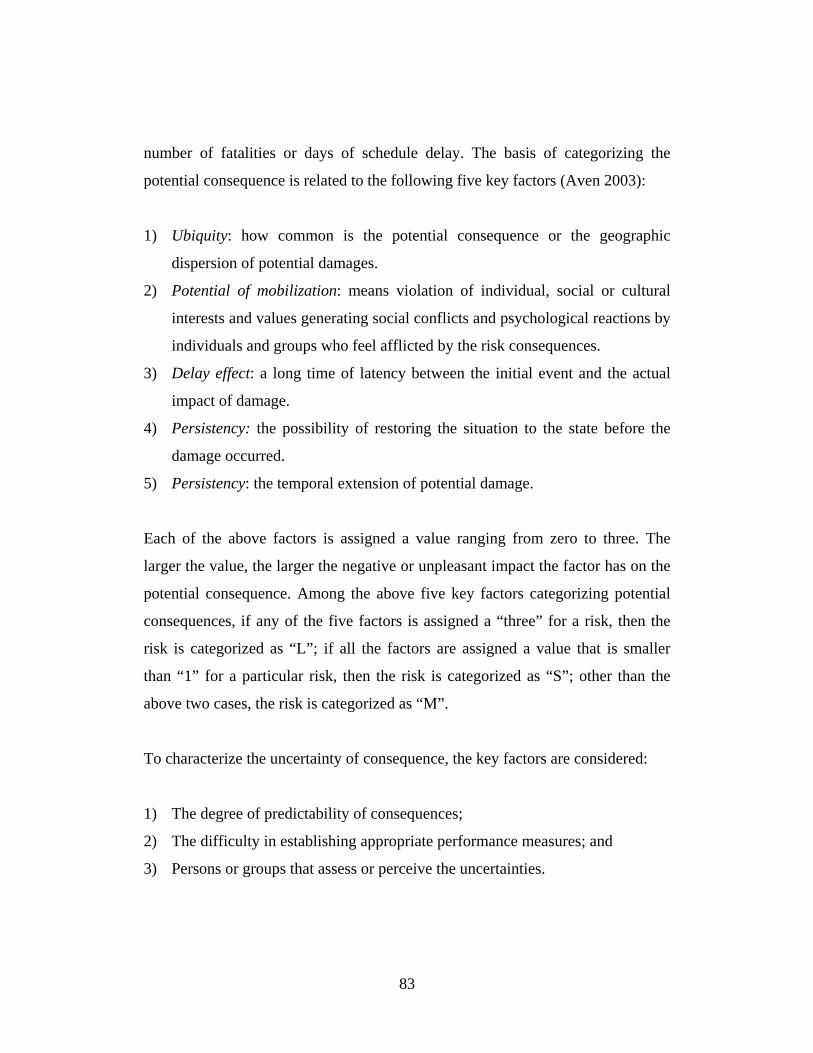
number of fatalities or days of schedule delay. The basis of categorizing the
potential consequence is related to the following five key factors (Aven 2003):
1) Ubiquity: how common is the potential consequence or the geographic
dispersion of potential damages.
2) Potential of mobilization: means violation of individual, social or cultural
interests and values generating social conflicts and psychological reactions by
individuals and groups who feel afflicted by the risk consequences.
3) Delay effect: a long time of latency between the initial event and the actual
impact of damage.
4) Persistency: the possibility of restoring the situation to the state before the
damage occurred.
5) Persistency: the temporal extension of potential damage.
Each of the above factors is assigned a value ranging from zero to three. The
larger the value, the larger the negative or unpleasant impact the factor has on the
potential consequence. Among the above five key factors categorizing potential
consequences, if any of the five factors is assigned a “three” for a risk, then the
risk is categorized as “L”; if all the factors are assigned a value that is smaller
than “1” for a particular risk, then the risk is categorized as “S”; other than the
above two cases, the risk is categorized as “M”.
To characterize the uncertainty of consequence, the key factors are considered:
1) The degree of predictability of consequences;
2) The difficulty in establishing appropriate performance measures; and
3) Persons or groups that assess or perceive the uncertainties.
83
Based on the above three factors, a percentage is assigned (0-100%). The larger
the percentage, the more uncertain the consequence of a risk is. If the percentage
is lower than 15%, the related uncertainty of consequence will be “S”;
Uncertainty of consequence is characterized as “L” when the percentage is larger
than 55%. The percentage between 15% and 55% will be related to “M”
uncertainty of consequence.
Risks are classified by their potential consequences and uncertainties of
consequences and listed in a table that will be developed for the use of workshop
discussions. Instead of listing critical project activities or project major milestones
in the first column of the workshop worksheet as what has been done in the case
study, the classified risk activities can be listed in the first column of the
worksheet. The other columns of the workshop can be kept unchanged from the
one developed for the case study as shown in Figure 5-7
It is possible that some risks are “obviously” too large to be acceptable, and others
are too small to be worth discussing. When a risk is so large that the action or
substance must obviously be banned or so small as obviously to be ignored, then a
detailed analysis is unnecessary. Therefore, risks that are classified as “S”
potential consequence, no matter the characterization of the related uncertainties,
the risks can be ignored for the workshop discussions if this category of risks is of
only a small amount within the total amount of risks. At the same time, the risk
category “7” which have “L” potential consequence and “L” uncertainties of
consequences may not be of importance for workshop discussion since risk
management strategy can be easily selected without too much in-depth evaluation
and further discussions.
84
Thus, depending on the categories of risks, the corresponding risk management
and mitigation strategy can be clearly addressed during the course of workshop as
discussions of risks process. At the same time, according to the time duration of
the workshop, the discussions can be actually focused on the critical risks and
associated methods by selecting risk items from the worksheet based on their
classification. This would make the workshop more effective and flexible while
improving the understanding of workshop participants.
6.3.3 Workshop: Evaluate Risk
Instead of implementation of probabilistic model, such as Monte Carlo simulation
techniques, the analysis is typically done subjectively by using an appropriate
qualitative method, similar to the method conducted in the case study.
Risk analysis should be tied closely to the project model, usually in the form of a
project schedule. This ensures that high-risk and opportunistic areas of a project
can be easily identified and monitored. In the previous step, risk activities have
been classified by their potential consequences and uncertainties of the
consequences and worksheet are prepared as presented above. People who have
valuable perspectives on the risks, and representatives from various parties
involved in the project will be able to bring an independent view on important
areas of project uncertainty.
6.3.4 Workshop: Perform a Further Analysis and Analyze Results
This should be led by an experienced risk analyst who is familiar with project
development issues and risks, and this step is usually conducted simultaneously
with the previous risk evaluating step. The insights and feelings of participants
regarding to the project are guided by an experienced risk analyst in interpreting
and finalizing the discussion and findings.
85
Similar what was done during the workshop in the case study, risk management
and mitigation strategies should be addressed in the workshop. The worksheet
developed according to the classified risk activities would ease the discussions.
One of the many reasons for identifying, classifying and assessing risks is to find
ways of reducing them, and to provide an input into decision processes about
taking various actions. The primary risk responses include controlling risk,
transferring risk, removing risk and retaining risk. These risk responses can be
discussed and selected for the risk activities by the participants simultaneously
with the risk evaluating process.
Risk control involves avoiding particularly hazardous conditions or situations, or
taking special measures such as training, preventive maintenance, and safety
programs to reduce the frequency and severity of potential losses. Risk transfer
means shifting the burden of financial responsibility for potential losses to a third
party, such as an insurer. Contractual phrases such as “hold-harmless” clauses,
which specify responsibility for liability, are another form of risk transfer. Risk
removal or avoidance involves eliminating those situations that involve a higher
than acceptable level of potential risk. Risk retention refers to a management’s
decision to take financial responsibility for all or some portion of a potential loss.
A combination of all four techniques is usually implemented in the risk
management programs.
It is important to use the preliminary risk analysis method as intended, which is an
engineering and communication tool. While it may be tempting, it may be
dangerous, to follow the methodology stiffly because it is more important to focus
on what key messages the result express, and to use those messages as
information to help make good project management decisions. That being said, it
is also critical that the project team understands the results, thus ensuring that the
86
intended risk or opportunity impacts and consequences were determined
reasonably and will be managed effectively.
6.3.5 Report Records and Evaluate the Risk Analysis Process
After the workshop, keeping appropriate records is essential because these records
form the basis for reports emanating from the risk management function in regard
to any further modification of risk mitigation strategies. Evaluation of the risk
analysis process is an effort to improve the procedures of risk identification,
evaluation, and response management.
6.4 Conclusions and Future Work
6.4.1 Conclusions
The preliminary risk analysis framework has been developed as an alternative of
risk analysis methodology when risk data is not sufficient to implement
quantitative techniques. The results of risk analysis by using this approach are
generated by guiding participants’ real perspectives on the project. Wilson (2001)
mentioned that a real beneficial risk analysis is focused on a very strong emphasis
on the word thorough. Many attempts to perform risk-benefit analysis have been
inadequate. If time, knowledge and resources do not admit of a thorough analysis,
the preliminary risk analysis framework might be justifiable.
This methodology facilitates improved communications among parties involved
in the project at an early stage of a project. The success of many formal risk
analysis methodologies relies on relatively complete and precise project
information in cost and schedule to generate relatively precise and useful risk
profiles. This often prevents an early effort of risk analysis and management.
Otherwise, implementing risk analysis using Monte Carlo simulation or other
quantitative techniques when required data are not sufficient for evaluation will
87
mislead the decision-making process and lose its functions to benefit management.
Under this situation, this preliminary risk analysis framework could be
implemented at an early stage of project. This framework would be more helpful
for managing expectations for budget and schedule in this environment.
It is important to realize that most decisions about risks are made every day by
millions of ordinary individuals. We are the decision makers. Life is a risky
business. Wilson (2001) pinpoints that the method of analysis and managing risks
by professional risk managers should not differ too much from the methods used
by ordinary people in their decisions, lest the decision becomes much too hard to
explain and will be less acceptable. Therefore it is important to have a procedure,
and a terminology, that are consistent with these “ordinary” methods. The
proposed preliminary risk analysis method satisfies the above criterion.
A continuous risk analysis is the key to identify, address, and handle risks before
they become threats to success, and, this preliminary risk analysis framework
could enable the realization of a continuous risk analysis for transportation
projects. It facilitates the validation of continuous risk analysis in transportation
infrastructure projects by enabling early commitment, extensive application,
flexible adoption and frequent implementation, hence it is beneficial for
communications among project participants and decision-making of management.
6.4.2 Future Work
6.4.2.1 Tests on Real Projects
The preliminary risk analysis framework was developed through the case study
and improved based on the lessons learned from the real risk analysis practice in
Springfield Union Station Intermodal Redevelopment project and the literature
review. This improved preliminary risk analysis approach should be examined
88
6.4.2.2 Delphi Method for Improved Risk Communication
Besides the future testing of the improved preliminary risk analysis framework on
real projects, Delphi Method would be of value for future improvement of this
process because it was originally developed for market research and sales
forecasting purposes. It is a proven and effective methodology for allowing a
group of people to deal with complex problems. It has even been used for
evaluating contract administration procedures. This method could be integrated
into the preliminary risk analysis framework.
It is found that sometimes bringing experts together in a conference room
introduces factors that may have little to do with the issue at hand. Therefore, the
Delphi method can be developed and designed to remove conference room
impediments to a true expert consensus. A possible means is introducing Web-
Build to risk analysis procedures. Anonymity may be applied to encourage a true
opinion and independent of personalities. The flexibility of web discussion due to
its asynchronism is another advantage. However, to get right people together to a
workshop is still a good way to gain objectives. If the workshop can be conducted
without many difficulties, Web-Build may provide some assistance.
89
REFERENCES Al-Bahar, Jamal F. and Crandall, Keith C. (1990). “Systematic Risk Management
Approach for Construction Project.” J. Constr. Eng. Manage., 116(3), 533-546.
Alquier, A. M. and Tignal, M. H. (2001). “Project Management Technique to
Estimate and Manage Risk of Innovative Projects.” IPMA International
Symposium and NORDNET.
Aven, T.,(2003). “Foundations of Risk Analysis: A knowledge and Decision-
Oriented Perspective.” John Wiley & Sons Ltd
Construction Roundtable (2004). “FTA Risk Assessment.” Federal Transit
Administration Workshop Presentation, Newark, NJ, May 4, 2004.
Construction Industry Institute (CII). (1989). “Management of Project Risks and
Uncertainties.” Publication 6-8, Cost/Schedule Control Task Force. University of
Texas, Austin, Tex., 2-23.
del Cano, Alfredo and de la Cruz, M. Pilar. (2002). “Integrated Methodology for
Project Risk Management.” J. Constr. Eng. Manage.,128(6), 473-485.
Flanagan, R. and Norman, G. (1993). “Risk Management and Construction.”
Blackwell Scientific Publications.
Flyzbjerg, B., Bruzelius, N., Rothengather W. (2003). “Megaprojects and Risk:
An Anatomy of Ambition.” Cambridge University Press.
90
Flyvbjerg B., Skwmeris, M. K. and Buhl, S. L. (2003). “How common and how
large are cost overruns in transport infrastructure projects?” Tyler & Francis
Group, Transport Reviews, 2003, VOL. 23, NO. 1, 71-88
Hertz, D.B., and Thomas, H. (1983). “Risk Analysis and its Applications.” Wiley,
New York, 1-5.
Hillson, D. A. (1997). ‘‘Towards a Maturity Model.’’ Int. J. Project and Business
Risk Management, 35–46.
Isidore, L., Back, E. (2001). “Integrated Range Estimating and Stochastic
Scheduling.” Cost Engineering, Vol. 43, No. 02.
Kottegoda, N.T., and Rosso, R. (1997). “Probability, statistics and reliability for
civil and environmental engineers.” McGraw-Hill, New York.
Lifson, M.W., and Shaifer, E.F. (1982). “Decision and Risk Anlaysis for
Construction Management.” Wiley, New York, 133-134.
McCabe, B. (2003). “Monte Carlo Simulation for Schedule Risks”. Proceedings
of the 2003 Winter Simulation Conference.
Poole, R. W. Jr. (2004) “Addressing the ‘Big Dig Syndrome’”. Public Works
Financing. May 14, 2004.
Risk Assessment in Fixed Guideway Construction, FTA, Report # FTA-MA-26-
0022, Northeastern University, January 1994
91
Rosenberg, L., Gallo, A., and Parolek, F. (1999). “Continuous Risk Management
Structure of Functions at NASA.” AIAA 99-4455, American Institute of
Aeronautics and Astronautics.
Scoy, Van and L., Roger (1992). “Software Development Risk: Opportunity, Not
Problem.” Software Engineering Institute, CMU/SEI-92-TR-30, ADA 258743.
Skoropowski, J., Guo, W., Guillermo, F. S. (2004). “Springfield Union Station
Intermodal Redevelopment Project – Risk Analysis Study”. Independent Study
Report. Worcester Polytechnic Institute.
Slovic, P., Finucane, M. L., Peters, E. and MacGregor, D. G. (2004). “Risk as
Analysis and Risk as Feelings: Some Thoughts about Affect, Reason, Risk, and
Rationality.” Risk Analysis, Vol.24, No.2, 2004.
Thomas Cool, (1999). “Proper Definitions for Risk and Uncertainty.” Econ-WPA,
ewp-get/9902002.
Wilson, R. and Crouch E. A.C. (2001). “Risk-Benefit Analysis.” The Center for
Risk Analysis, Harvard University Press, Second Edition, P8-10.
http://www.llnl.gov/
http://www.projectrisk.com
http://www.pvta.com
http://www.sra.org/
92
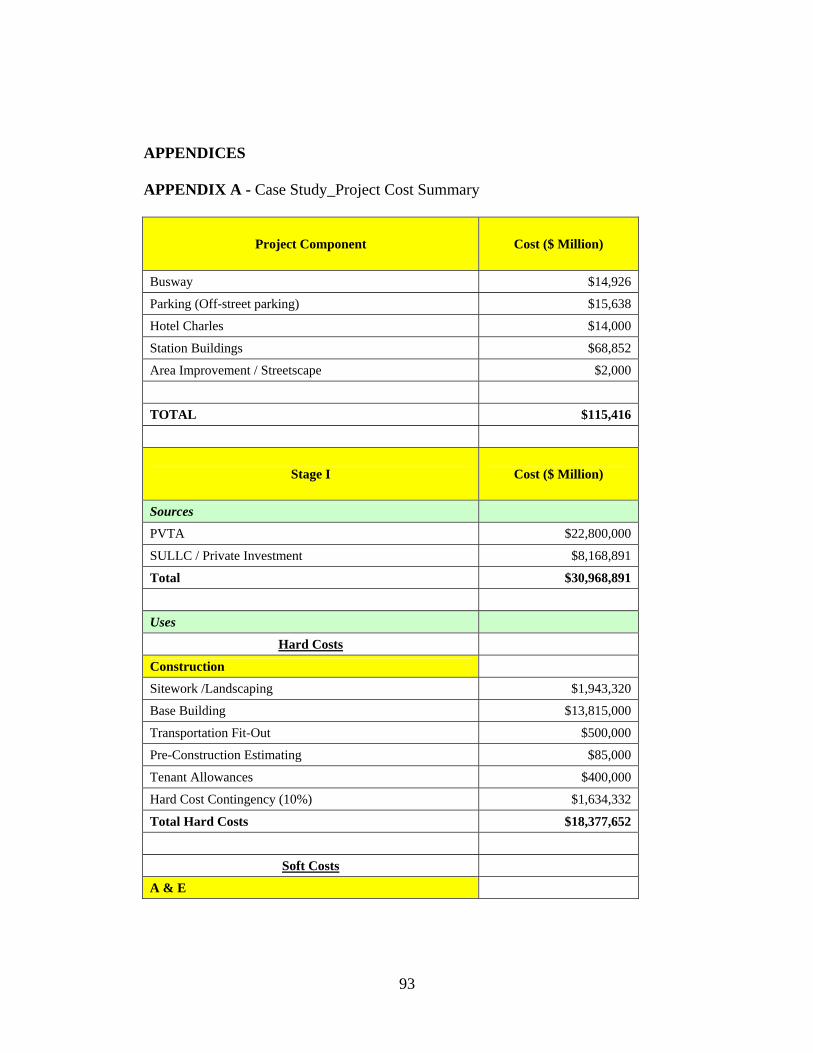
APPENDICES APPENDIX A - Case Study_Project Cost Summary
Project Component Cost ($ Million)
Busway $14,926
Parking (Off-street parking) $15,638
Hotel Charles $14,000
Station Buildings $68,852
Area Improvement / Streetscape $2,000
TOTAL $115,416
Stage I Cost ($ Million)
Sources
PVTA $22,800,000
SULLC / Private Investment $8,168,891
Total $30,968,891
Uses
Hard Costs
Construction
Sitework /Landscaping $1,943,320
Base Building $13,815,000
Transportation Fit-Out $500,000
Pre-Construction Estimating $85,000
Tenant Allowances $400,000
Hard Cost Contingency (10%) $1,634,332
Total Hard Costs $18,377,652
Soft Costs
A & E
93
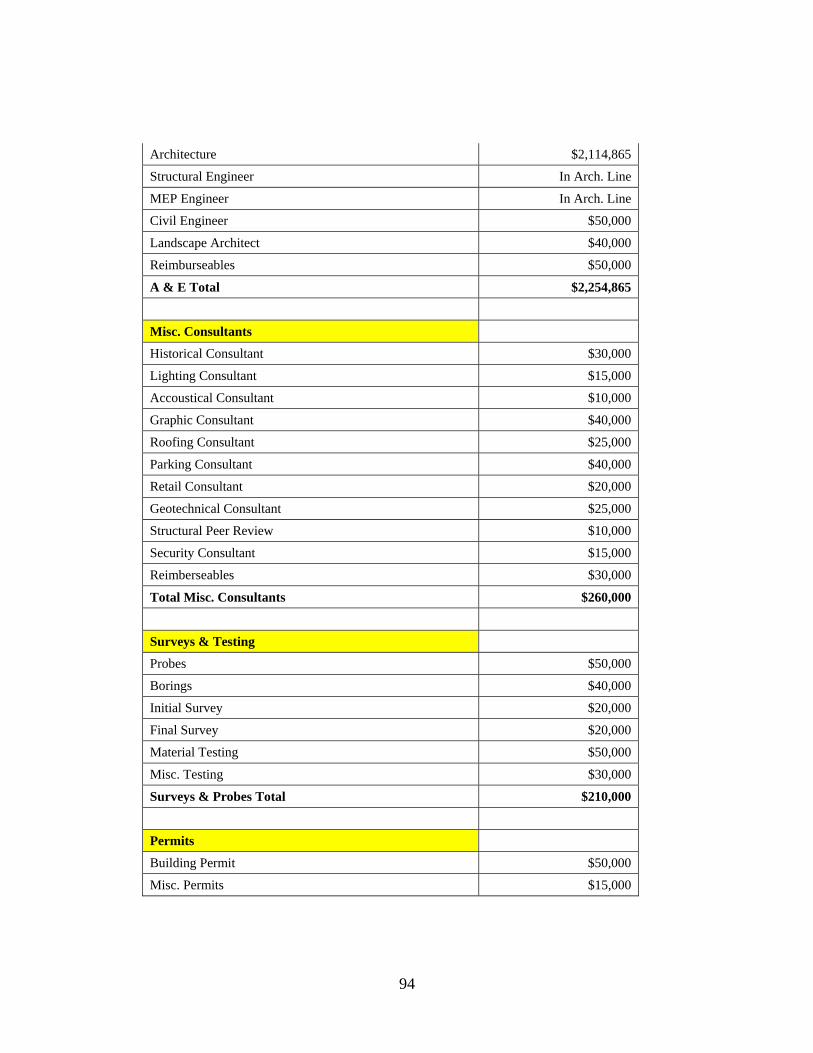
Architecture $2,114,865
Structural Engineer In Arch. Line
MEP Engineer In Arch. Line
Civil Engineer $50,000
Landscape Architect $40,000
Reimburseables $50,000
A & E Total $2,254,865
Misc. Consultants
Historical Consultant $30,000
Lighting Consultant $15,000
Accoustical Consultant $10,000
Graphic Consultant $40,000
Roofing Consultant $25,000
Parking Consultant $40,000
Retail Consultant $20,000
Geotechnical Consultant $25,000
Structural Peer Review $10,000
Security Consultant $15,000
Reimberseables $30,000
Total Misc. Consultants $260,000
Surveys & Testing
Probes $50,000
Borings $40,000
Initial Survey $20,000
Final Survey $20,000
Material Testing $50,000
Misc. Testing $30,000
Surveys & Probes Total $210,000
Permits
Building Permit $50,000
Misc. Permits $15,000
94

Permits Total $65,000
Development OH & Fee
Financial Services $300,000
Project Coordination $400,000
Design & Construction $1,100,000
Marketing, Leasing & Property Management $200,000
Incentive Fee $700,000
Reimberseables $75,000
Additional Paid Fee based on Expanding $778,000
Developer Fee Loan $1,411,923
Development Fee and Overhead Total $4,964,923
Legal
Tax Credit Attorney $300,000
Agreements $200,000
Legal Total $500,000
Leasing & Merchandising
Leasing Commission & Fees $32,074
Legal $50,000
Tenant Criteria $40,000
Renderings / Project Sign $80,000
Brochures and Website $40,000
ICSC Convention $35,000
Events $100,000
Misc. $20,000
Leasing & Merchandising Total $397,074
FF&E
Food Court Amenities $50,000
Retail Signage /Directories $255,000
Waiting Room Amenities $20,000
Common Area Amenities $125,000
95
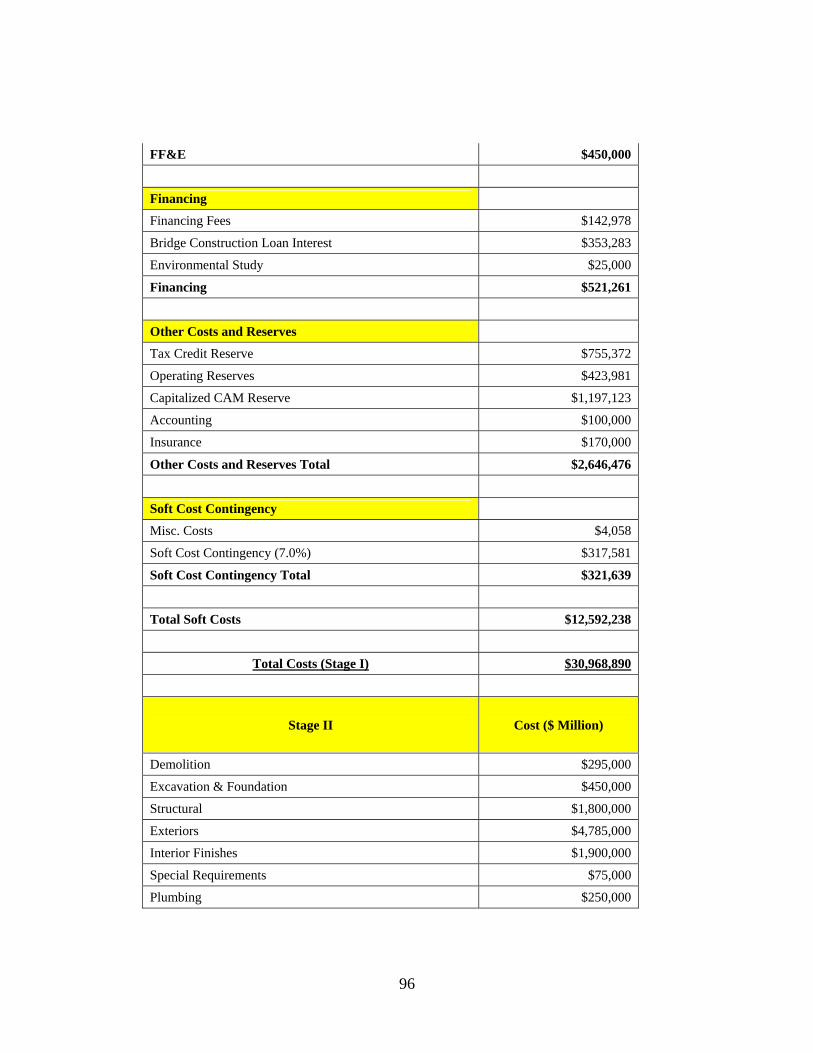
FF&E $450,000
Financing
Financing Fees $142,978
Bridge Construction Loan Interest $353,283
Environmental Study $25,000
Financing $521,261
Other Costs and Reserves
Tax Credit Reserve $755,372
Operating Reserves $423,981
Capitalized CAM Reserve $1,197,123
Accounting $100,000
Insurance $170,000
Other Costs and Reserves Total $2,646,476
Soft Cost Contingency
Misc. Costs $4,058
Soft Cost Contingency (7.0%) $317,581
Soft Cost Contingency Total $321,639
Total Soft Costs $12,592,238
Total Costs (Stage I) $30,968,890
Stage II Cost ($ Million)
Demolition $295,000
Excavation & Foundation $450,000
Structural $1,800,000
Exteriors $4,785,000
Interior Finishes $1,900,000
Special Requirements $75,000
Plumbing $250,000
96
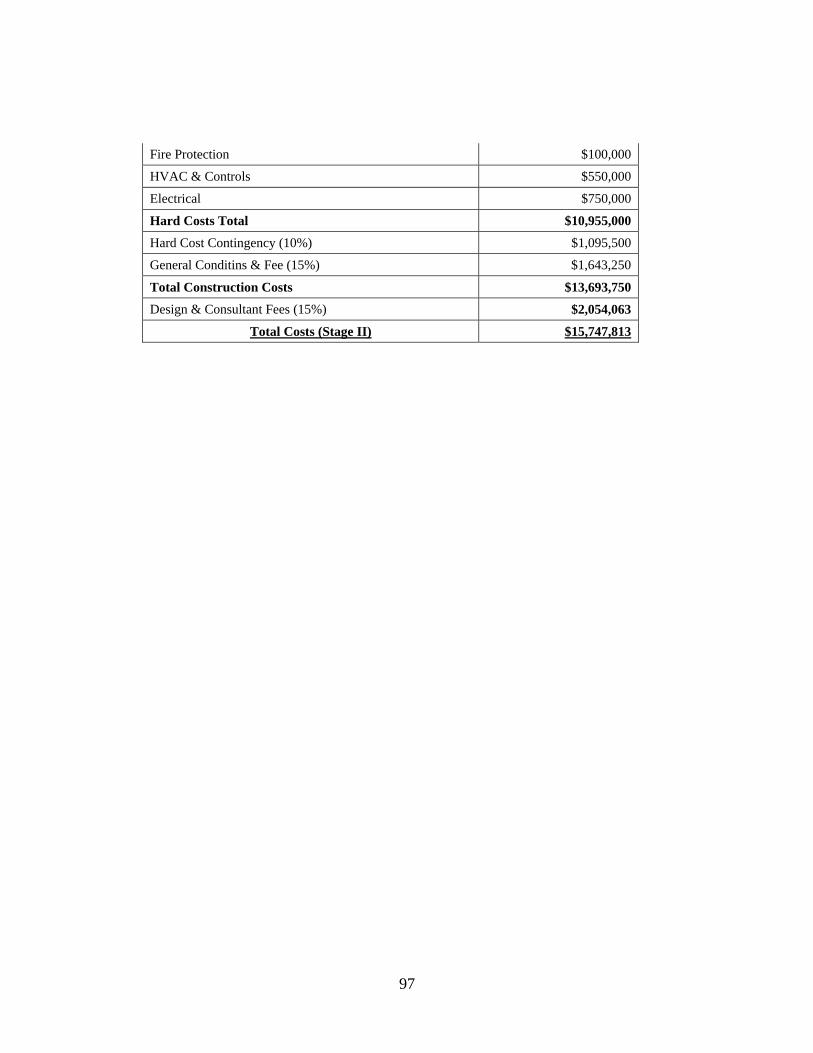
Fire Protection $100,000
HVAC & Controls $550,000
Electrical $750,000
Hard Costs Total $10,955,000
Hard Cost Contingency (10%) $1,095,500
General Conditins & Fee (15%) $1,643,250
Total Construction Costs $13,693,750
Design & Consultant Fees (15%) $2,054,063
Total Costs (Stage II) $15,747,813
97
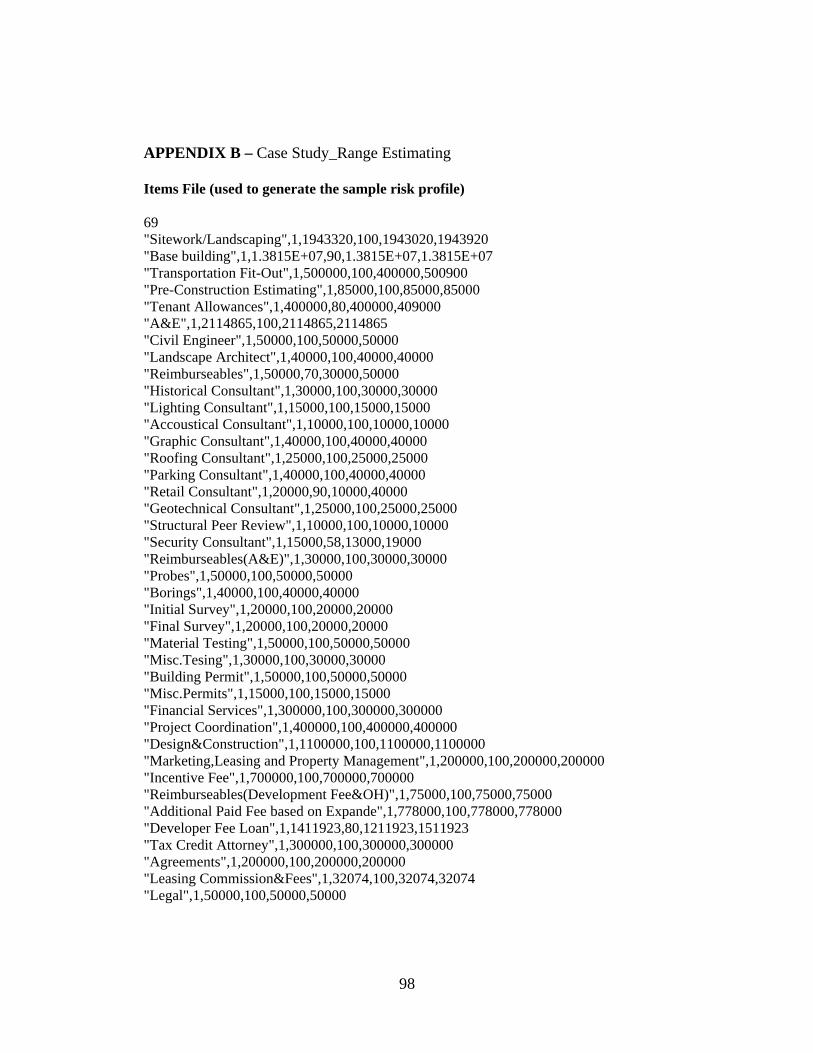
APPENDIX B – Case Study_Range Estimating Items File (used to generate the sample risk profile) 69 "Sitework/Landscaping",1,1943320,100,1943020,1943920 "Base building",1,1.3815E+07,90,1.3815E+07,1.3815E+07 "Transportation Fit-Out",1,500000,100,400000,500900 "Pre-Construction Estimating",1,85000,100,85000,85000 "Tenant Allowances",1,400000,80,400000,409000 "A&E",1,2114865,100,2114865,2114865 "Civil Engineer",1,50000,100,50000,50000 "Landscape Architect",1,40000,100,40000,40000 "Reimburseables",1,50000,70,30000,50000 "Historical Consultant",1,30000,100,30000,30000 "Lighting Consultant",1,15000,100,15000,15000 "Accoustical Consultant",1,10000,100,10000,10000 "Graphic Consultant",1,40000,100,40000,40000 "Roofing Consultant",1,25000,100,25000,25000 "Parking Consultant",1,40000,100,40000,40000 "Retail Consultant",1,20000,90,10000,40000 "Geotechnical Consultant",1,25000,100,25000,25000 "Structural Peer Review",1,10000,100,10000,10000 "Security Consultant",1,15000,58,13000,19000 "Reimburseables(A&E)",1,30000,100,30000,30000 "Probes",1,50000,100,50000,50000 "Borings",1,40000,100,40000,40000 "Initial Survey",1,20000,100,20000,20000 "Final Survey",1,20000,100,20000,20000 "Material Testing",1,50000,100,50000,50000 "Misc.Tesing",1,30000,100,30000,30000 "Building Permit",1,50000,100,50000,50000 "Misc.Permits",1,15000,100,15000,15000 "Financial Services",1,300000,100,300000,300000 "Project Coordination",1,400000,100,400000,400000 "Design&Construction",1,1100000,100,1100000,1100000 "Marketing,Leasing and Property Management",1,200000,100,200000,200000 "Incentive Fee",1,700000,100,700000,700000 "Reimburseables(Development Fee&OH)",1,75000,100,75000,75000 "Additional Paid Fee based on Expande",1,778000,100,778000,778000 "Developer Fee Loan",1,1411923,80,1211923,1511923 "Tax Credit Attorney",1,300000,100,300000,300000 "Agreements",1,200000,100,200000,200000 "Leasing Commission&Fees",1,32074,100,32074,32074 "Legal",1,50000,100,50000,50000
98
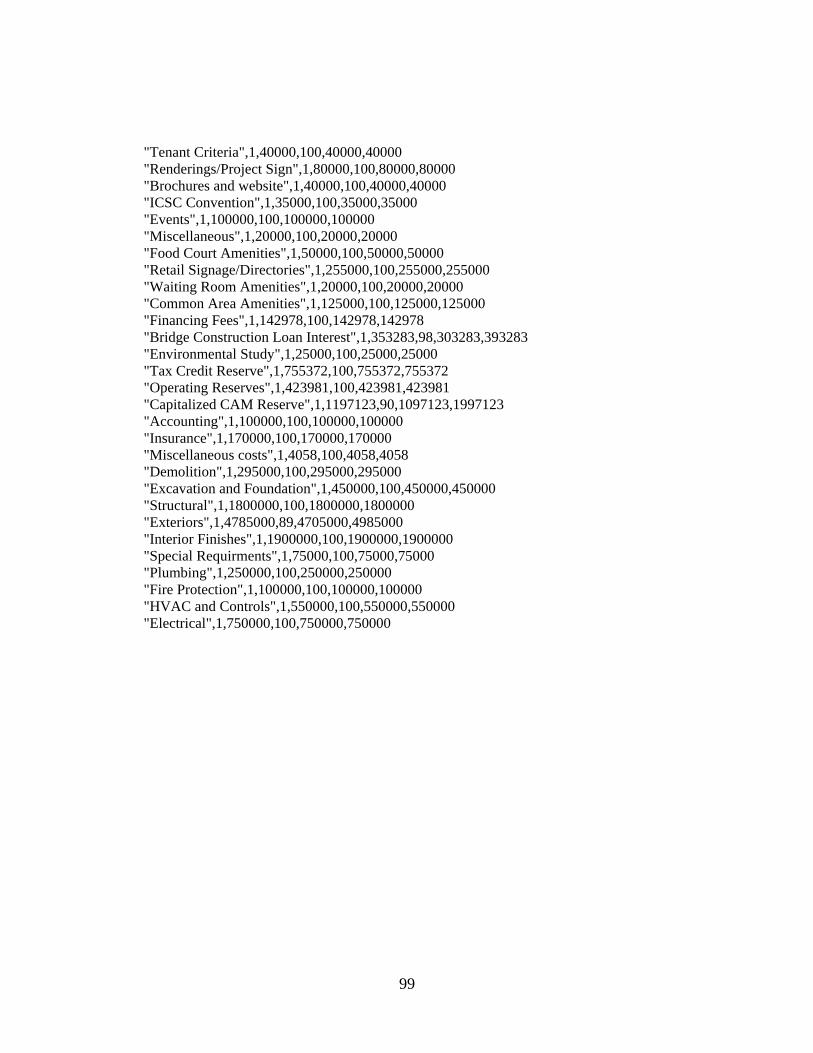
"Tenant Criteria",1,40000,100,40000,40000 "Renderings/Project Sign",1,80000,100,80000,80000 "Brochures and website",1,40000,100,40000,40000 "ICSC Convention",1,35000,100,35000,35000 "Events",1,100000,100,100000,100000 "Miscellaneous",1,20000,100,20000,20000 "Food Court Amenities",1,50000,100,50000,50000 "Retail Signage/Directories",1,255000,100,255000,255000 "Waiting Room Amenities",1,20000,100,20000,20000 "Common Area Amenities",1,125000,100,125000,125000 "Financing Fees",1,142978,100,142978,142978 "Bridge Construction Loan Interest",1,353283,98,303283,393283 "Environmental Study",1,25000,100,25000,25000 "Tax Credit Reserve",1,755372,100,755372,755372 "Operating Reserves",1,423981,100,423981,423981 "Capitalized CAM Reserve",1,1197123,90,1097123,1997123 "Accounting",1,100000,100,100000,100000 "Insurance",1,170000,100,170000,170000 "Miscellaneous costs",1,4058,100,4058,4058 "Demolition",1,295000,100,295000,295000 "Excavation and Foundation",1,450000,100,450000,450000 "Structural",1,1800000,100,1800000,1800000 "Exteriors",1,4785000,89,4705000,4985000 "Interior Finishes",1,1900000,100,1900000,1900000 "Special Requirments",1,75000,100,75000,75000 "Plumbing",1,250000,100,250000,250000 "Fire Protection",1,100000,100,100000,100000 "HVAC and Controls",1,550000,100,550000,550000 "Electrical",1,750000,100,750000,750000
99
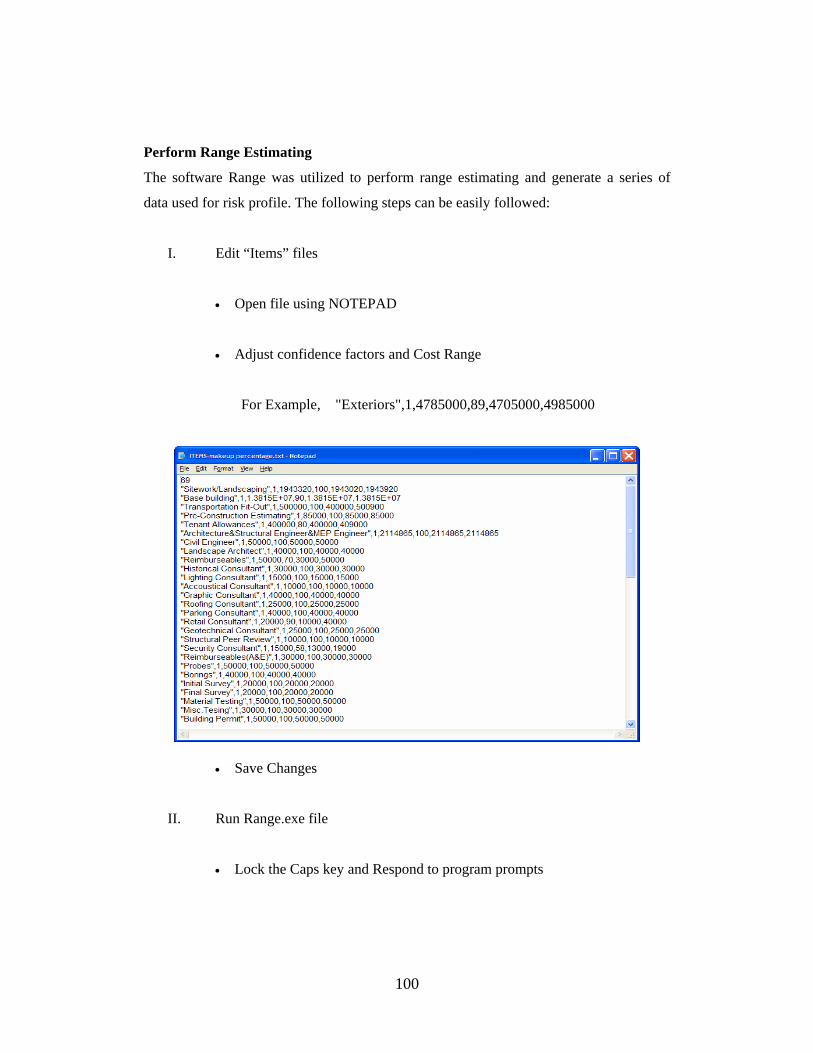
Perform Range Estimating
The software Range was utilized to perform range estimating and generate a series of
data used for risk profile. The following steps can be easily followed:
I. Edit “Items” files
• Open file using NOTEPAD
• Adjust confidence factors and Cost Range
For Example, "Exteriors",1,4785000,89,4705000,4985000
• Save Changes
II. Run Range.exe file
• Lock the Caps key and Respond to program prompts
100
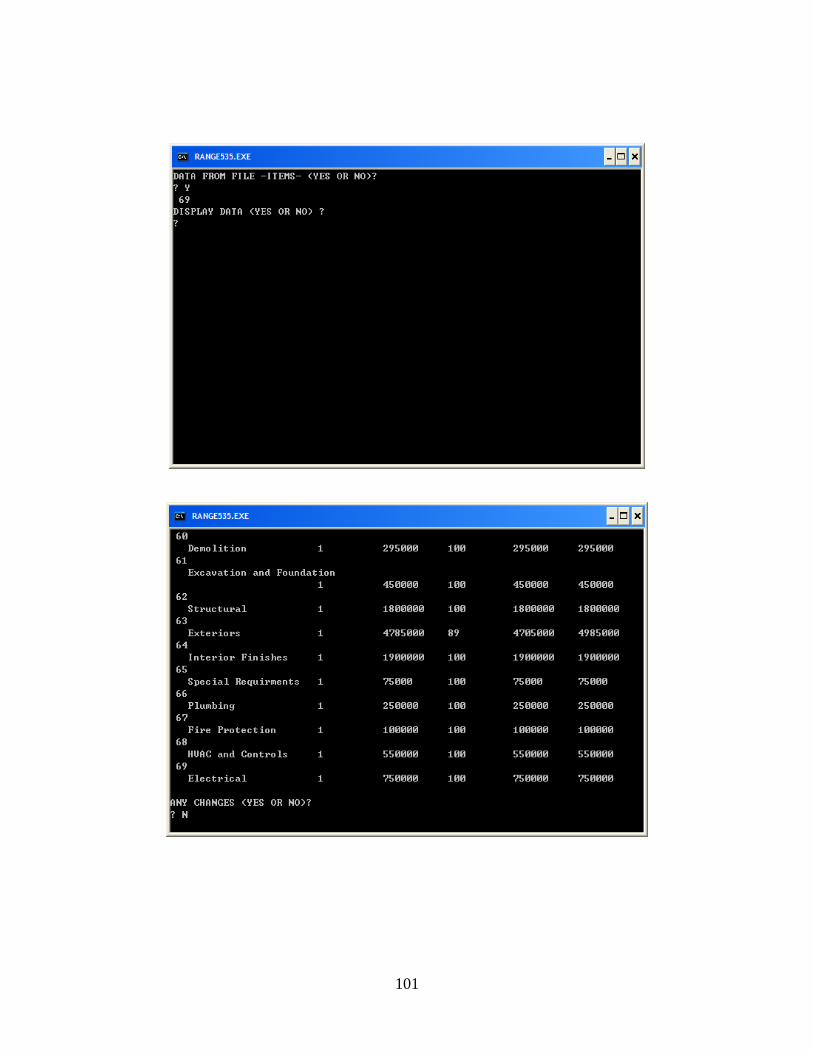
101
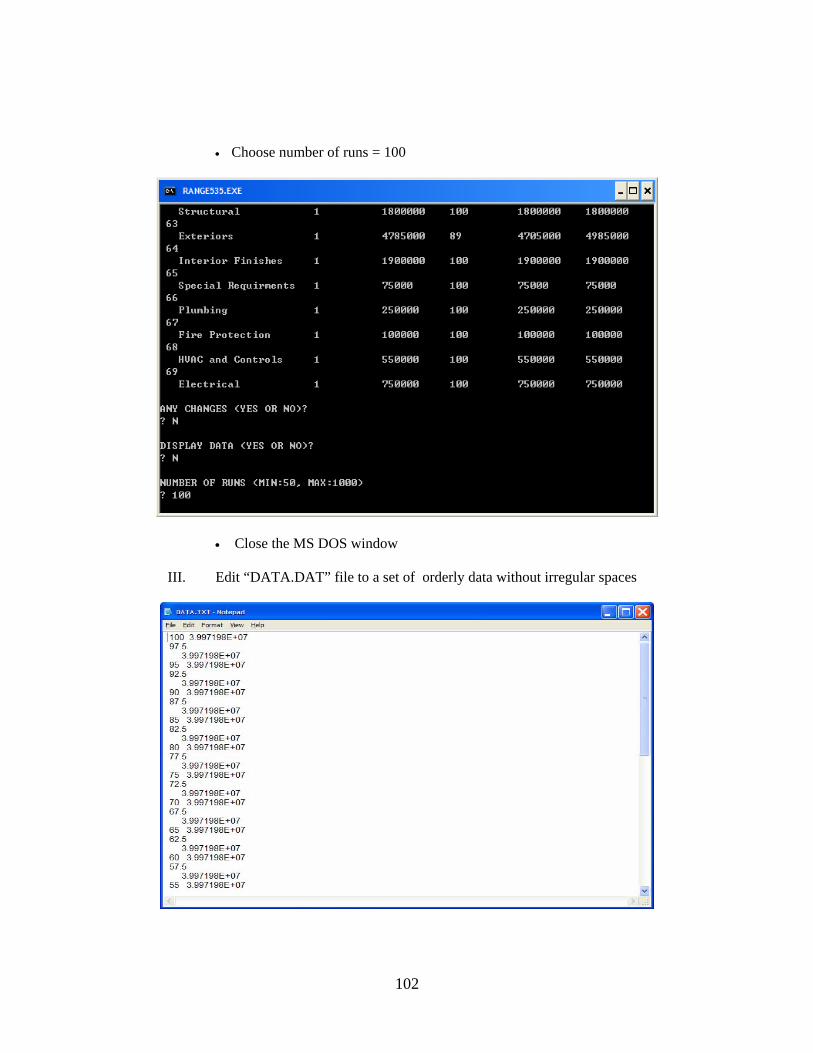
• Choose number of runs = 100
• Close the MS DOS window
III. Edit “DATA.DAT” file to a set of orderly data without irregular spaces
102

IV. Import “DATA.DAT” file into “DATA.XLS” file and Move Column, Sort,
Format to a desirable format
103
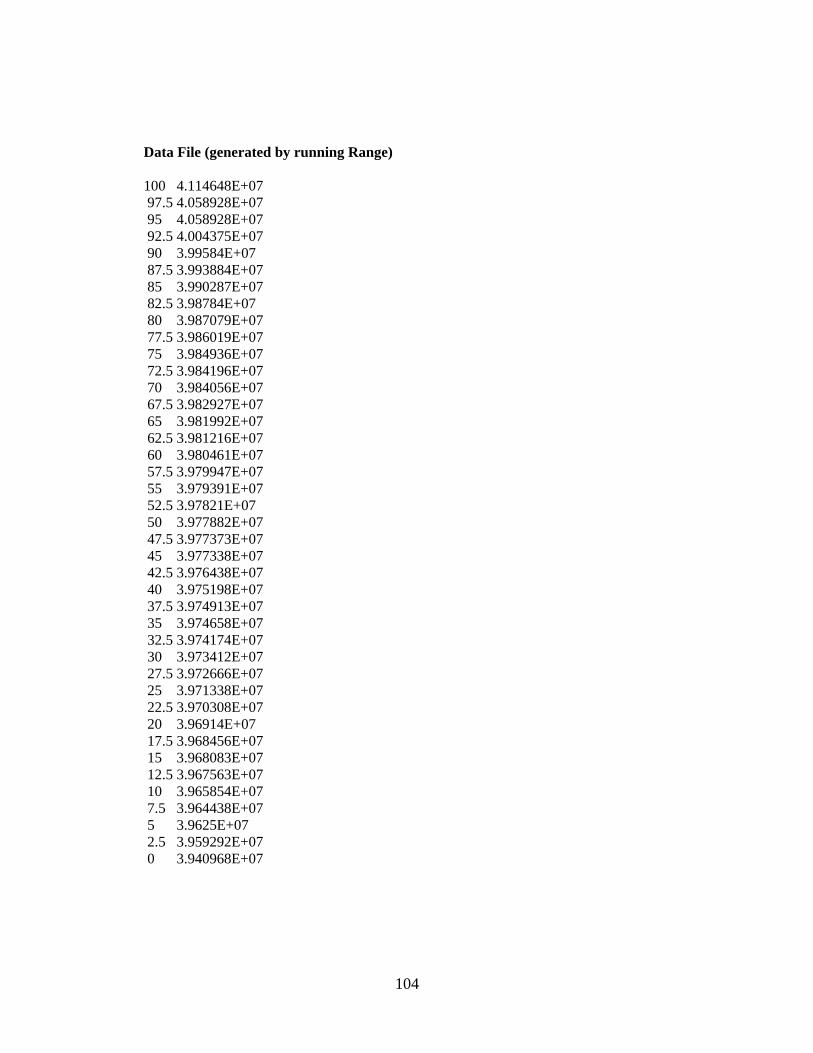
Data File (generated by running Range)
100 4.114648E+07 97.5 4.058928E+07 95 4.058928E+07 92.5 4.004375E+07 90 3.99584E+07 87.5 3.993884E+07 85 3.990287E+07 82.5 3.98784E+07 80 3.987079E+07 77.5 3.986019E+07 75 3.984936E+07 72.5 3.984196E+07 70 3.984056E+07 67.5 3.982927E+07 65 3.981992E+07 62.5 3.981216E+07 60 3.980461E+07 57.5 3.979947E+07
55 3.979391E+07 52.5 3.97821E+07
50 3.977882E+07 47.5 3.977373E+07 45 3.977338E+07 42.5 3.976438E+07
40 3.975198E+07 37.5 3.974913E+07 35 3.974658E+07
32.5 3.974174E+07 30 3.973412E+07 27.5 3.972666E+07 25 3.971338E+07 22.5 3.970308E+07 20 3.96914E+07 17.5 3.968456E+07 15 3.968083E+07 12.5 3.967563E+07 10 3.965854E+07 7.5 3.964438E+07 5 3.9625E+07
2.5 3.959292E+07 0 3.940968E+07
104
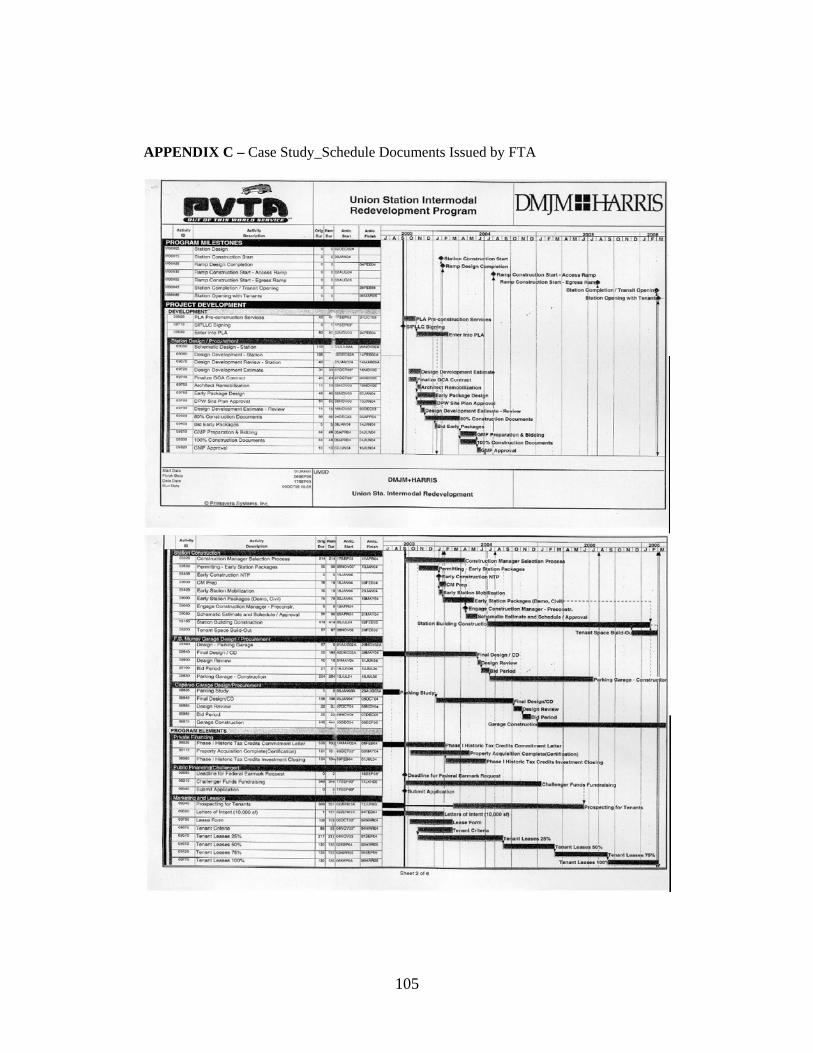
APPENDIX C – Case Study_Schedule Documents Issued by FTA
105
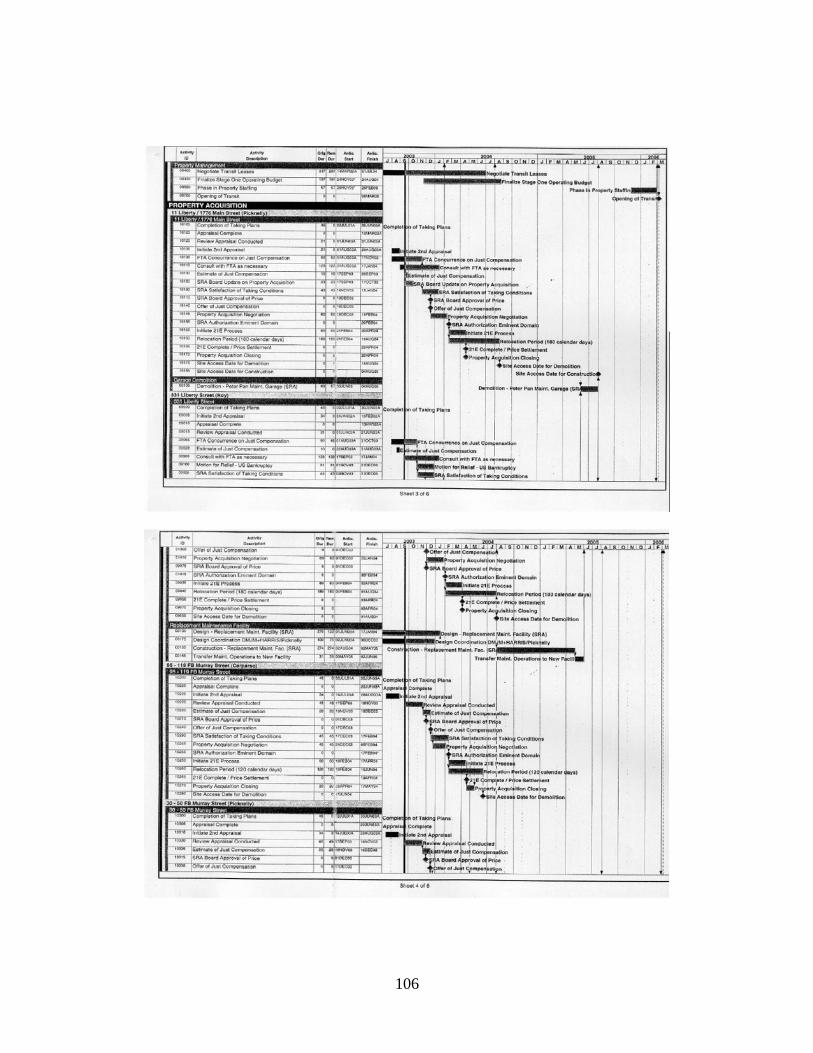
106
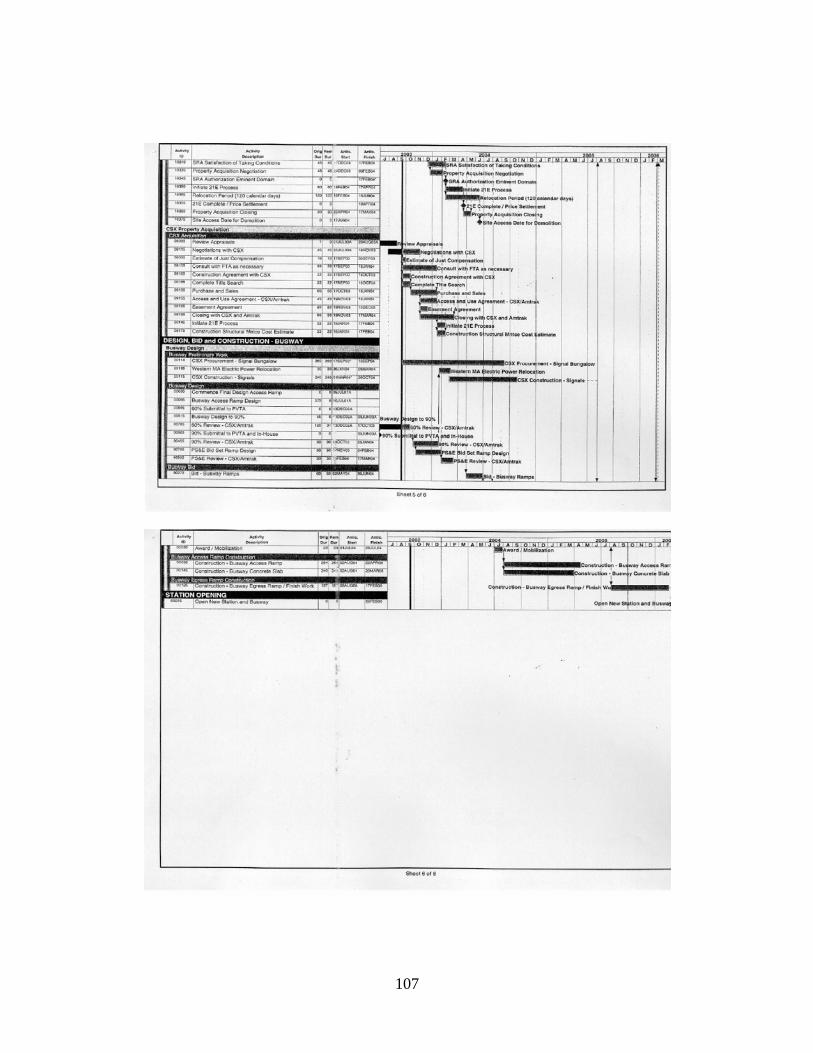
107
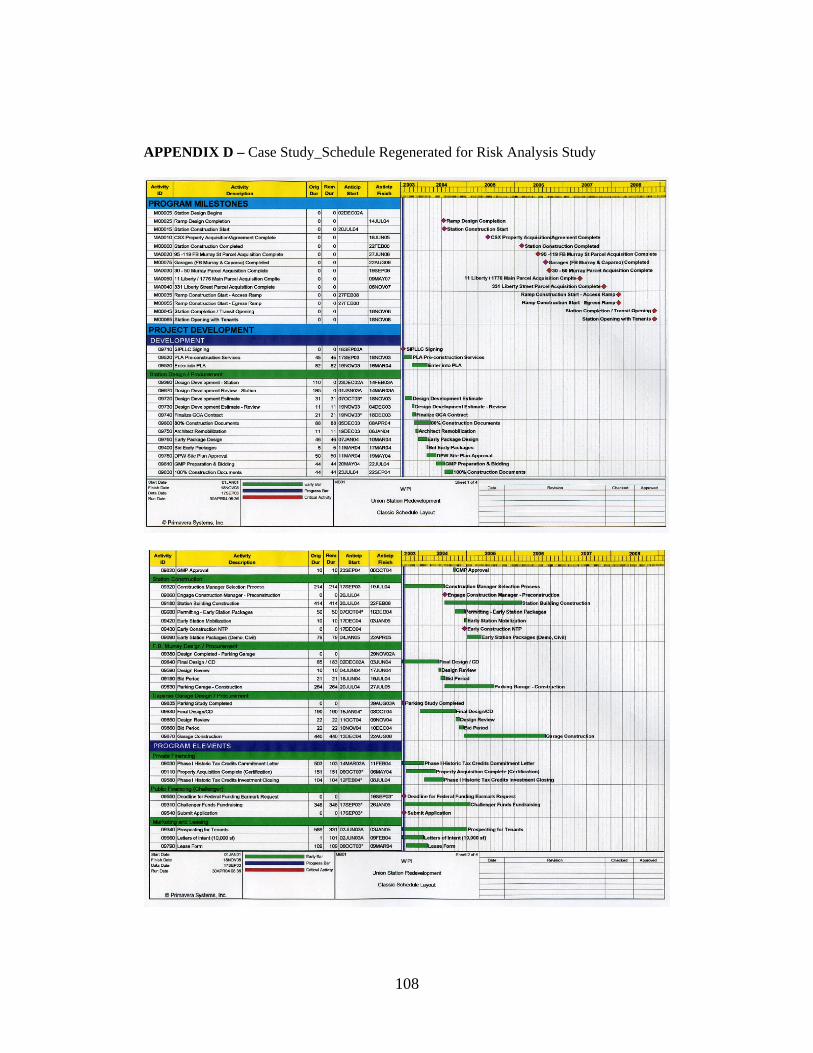
APPENDIX D – Case Study_Schedule Regenerated for Risk Analysis Study
108
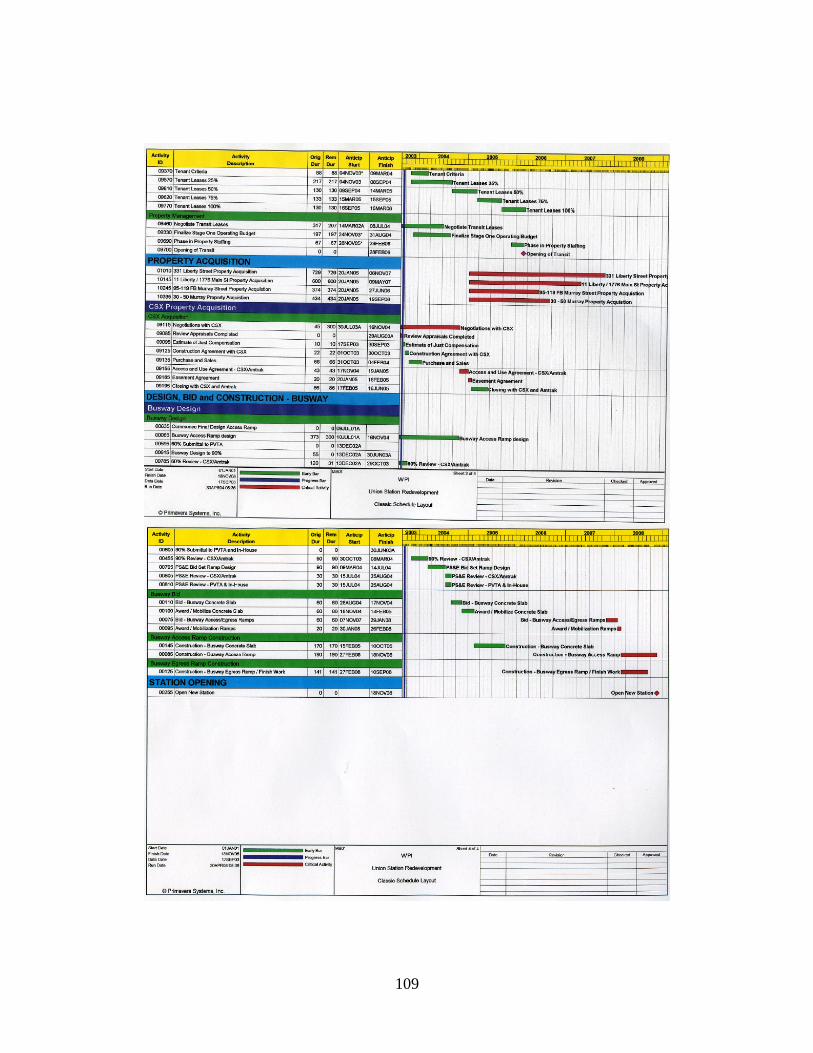
109
APPENDIX E - Sample Risk Analysis Workshop Feedback Questionnaire
Springfield Union Station Intermodal Redevelopment Project
Risk Assessment Workshop Feedback Questionnaire
WPI Risk Analysis Study Group, 2004
The risk assessment workshop was conducted on April 27, 2004 at the PVTA
offices in Springfield. On behalf of WPI we would like to thank you for the
opportunity to be involved in this challenging project. Utilizing a “real” project
provided us an invaluable opportunity and learning experience.
To further our study for academic purposes, your comments and advice would be
crucial. You may have a look at a couple of questions below or send us any
comment or advice you would like to offer.
1. Do you think the format we utilized in the workshop was helpful to making
r how did it assist bringing to light project
issues?
critical project decisions? Why?
2. What did you find is most helpful o
We do really appreciate any advice and suggestion from you. And thank you very
much for the time and consideration!
110
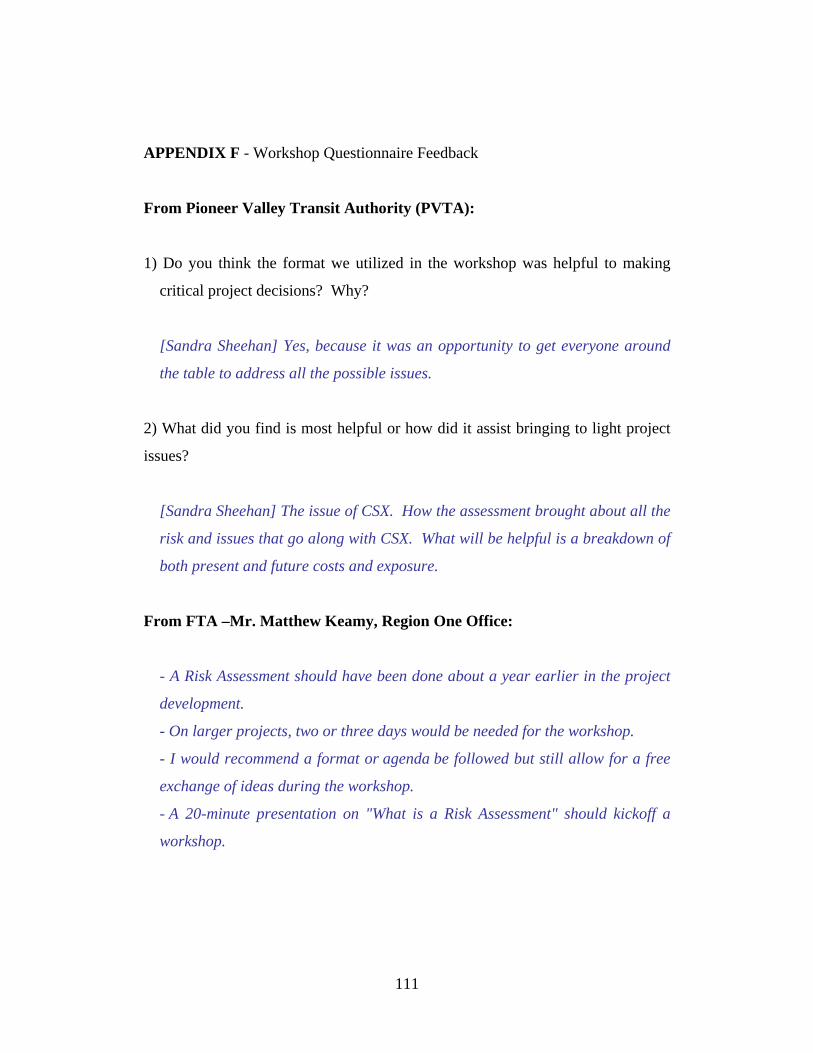
APPENDIX F - Workshop Questionnaire Feedback
Fro rity (PVTA):
critical project decisions? Why?
issues.
) What did you find is most helpful or how did it assist bringing to light project
sues?
[Sandra Sheehan] The issue of CSX. How the assessment brought about all the
be helpful is a breakdown of
both present and future costs and exposure.
rom FTA –Mr. Matthew Keamy, Region One Office:
been done about a year earlier in the project
development.
a free
exchange of ideas during the workshop.
hop.
m Pioneer Valley Transit Autho
1) Do you think the format we utilized in the workshop was helpful to making
[Sandra Sheehan] Yes, because it was an opportunity to get everyone around
the table to address all the possible
2
is
risk and issues that go along with CSX. What will
F
- A Risk Assessment should have
- On larger projects, two or three days would be needed for the workshop.
- I would recommend a format or agenda be followed but still allow for
- A 20-minute presentation on "What is a Risk Assessment" should kickoff a
works
111
Fr
H
alize what they were up
against and the minimal chance they had of advancing the project the way it
om DMJM+HARRIS, Inc. – Ms. Jeannette Skoropowski and Mr. Michael
unter:
The workshop was extremely helpful in making PVTA re
currently developed because of CSX.
112
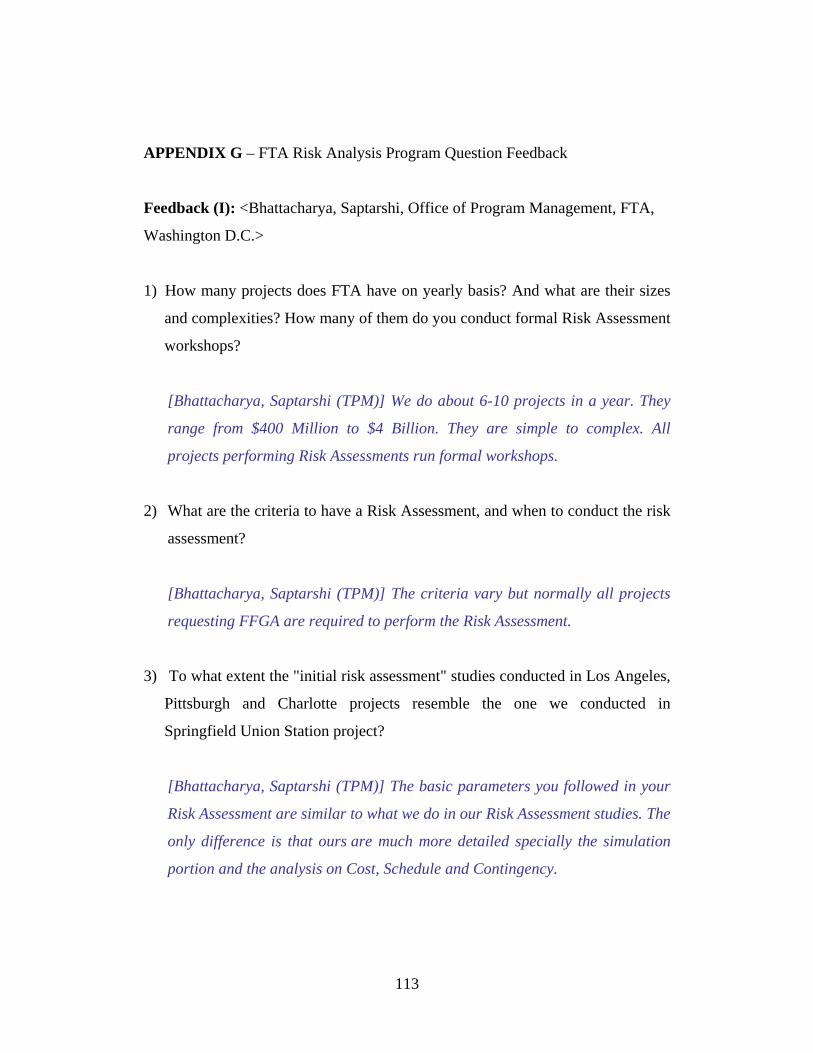
APPENDIX G – FTA Risk Analysis Program Question Feedback
eedback (I): <Bhattacharya, Saptarshi, Office of Program Management, FTA,
ashington D.C.>
) How many projects does FTA have on yearly basis? And what are their sizes
and complexities? How many of them do you conduct formal Risk Assessment
workshops?
[Bhattacharya, Saptarshi (TPM)] We do about 6-10 projects in a year. They
range from $400 Million to $4 Billion. They are simple to complex. All
projects performing Risk Assessments run formal workshops.
nduct the risk
assessment?
Saptarshi (TPM)] The criteria vary but normally all projects
requesting FFGA are required to perform the Risk Assessment.
3)
nd Charlotte projects resemble the one we conducted in
Springfield Union Station project?
ent studies. The
only difference is that ours are much more detailed specially the simulation
F
W
1
2) What are the criteria to have a Risk Assessment, and when to co
[Bhattacharya,
To what extent the "initial risk assessment" studies conducted in Los Angeles,
Pittsburgh a
[Bhattacharya, Saptarshi (TPM)] The basic parameters you followed in your
Risk Assessment are similar to what we do in our Risk Assessm
portion and the analysis on Cost, Schedule and Contingency.
113
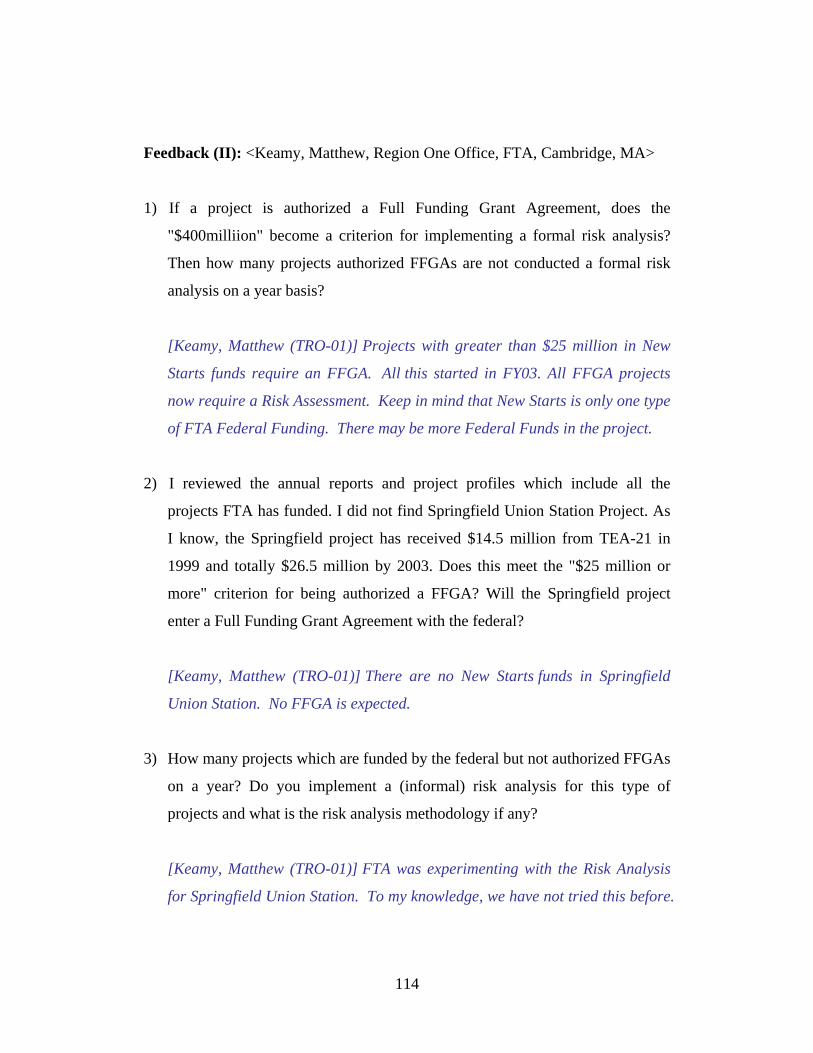
Feedback (II): <Keamy, Matthew, Region One Office, FTA, Cambridge, MA>
1)
"$400milliion" become a criterion for implementing a formal risk analysis?
[Keamy, Matthew (TRO-01)] Projects with greater than $25 million in New
) I reviewed the annual reports and project profiles which include all the
s
I know, the Springfield project has received $14.5 million from TEA-21 in
[Keamy, Matthew (TRO-01)] There are no New Starts funds in Springfield
3)
f
rojects and what is the risk analysis methodology if any?
If a project is authorized a Full Funding Grant Agreement, does the
Then how many projects authorized FFGAs are not conducted a formal risk
analysis on a year basis?
Starts funds require an FFGA. All this started in FY03. All FFGA projects
now require a Risk Assessment. Keep in mind that New Starts is only one type
of FTA Federal Funding. There may be more Federal Funds in the project.
2
projects FTA has funded. I did not find Springfield Union Station Project. A
1999 and totally $26.5 million by 2003. Does this meet the "$25 million or
more" criterion for being authorized a FFGA? Will the Springfield project
enter a Full Funding Grant Agreement with the federal?
Union Station. No FFGA is expected.
How many projects which are funded by the federal but not authorized FFGAs
on a year? Do you implement a (informal) risk analysis for this type o
p
[Keamy, Matthew (TRO-01)] FTA was experimenting with the Risk Analysis
for Springfield Union Station. To my knowledge, we have not tried this before.
114
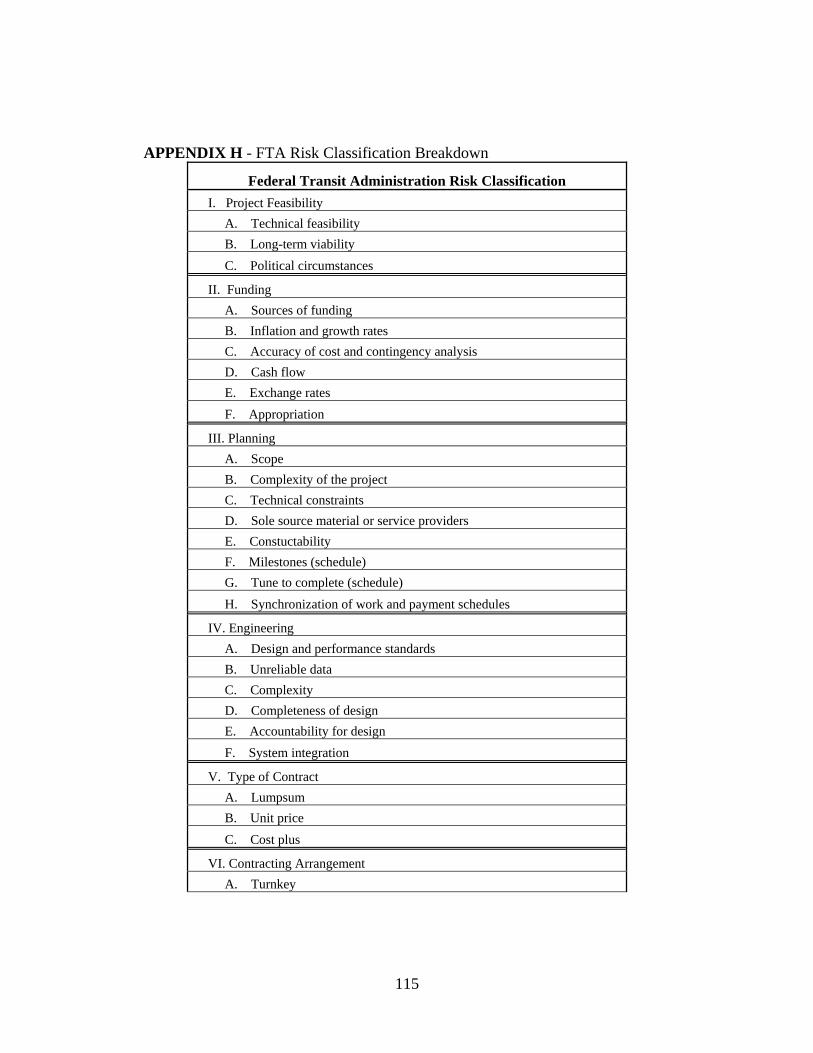
APPENDIX H - FTA Risk Classification Breakdown
Federal Transit Administration Risk Classification I. Project Feasibility A. Technical feasibility B. Long-term viability C. Political circumstances
II. Funding A. Sources of funding B. Inflation and growth rates C. Accuracy of cost and contingency analysis D. Cash flow E. Exchange rates F. Appropriation
III. Planning A. Scope B. Complexity of the project C. Technical constraints D. Sole source material or service providers E. Constuctability F. Milestones (schedule) G. Tune to complete (schedule) H. Synchronization of work and payment schedules
IV. Engineering A. Design and performance standards B. Unreliable data C. Complexity D. Completeness of design E. Accountability for design F. System integration
V. Type of Contract A. Lumpsum B. Unit price C. Cost plus
VI. Contracting Arrangement A. Turnkey
115
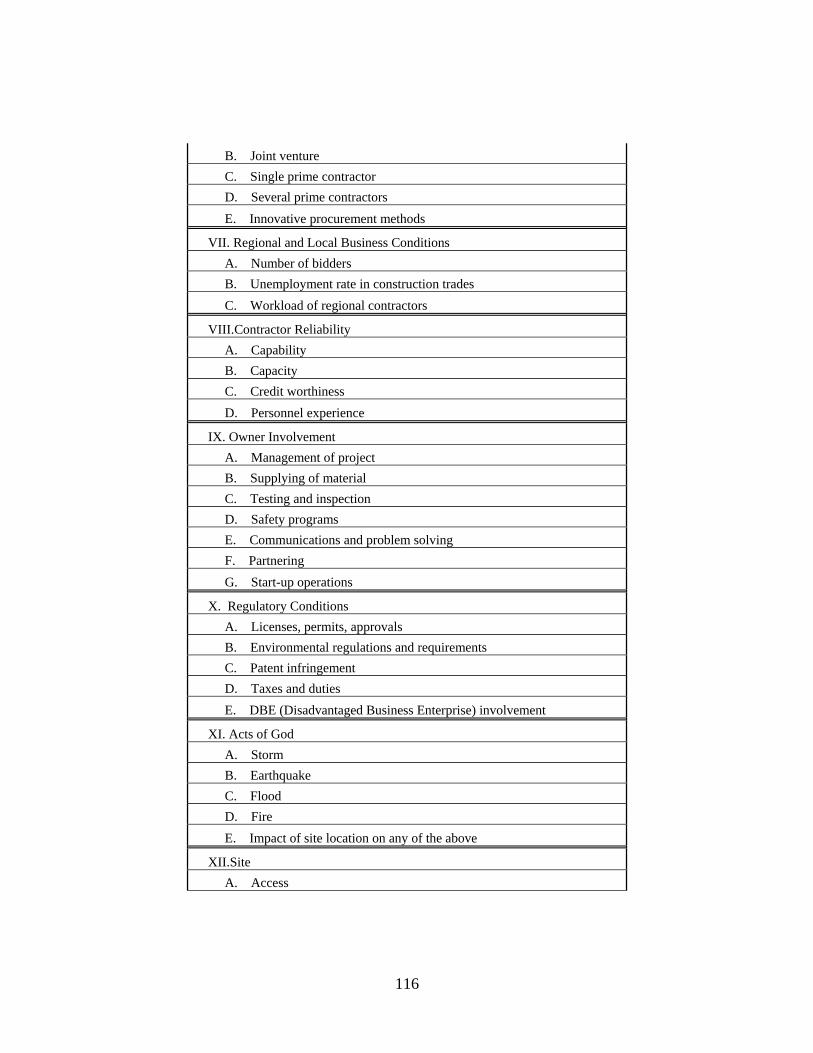
B. Joint venture C. Single prime contractor D. Several prime contractors E. Innovative procurement methods
VII. Regional and Local Business Conditions A. Number of bidders B. Unemployment rate in construction trades C. Workload of regional contractors
VIII.Contractor Reliability A. Capability B. Capacity C. Credit worthiness D. Personnel experience
IX. Owner Involvement A. Management of project B. Supplying of material C. Testing and inspection D. Safety programs E. Communications and problem solving F. Partnering G. Start-up operations
X. Regulatory Conditions A. Licenses, permits, approvals B. Environmental regulations and requirements C. Patent infringement D. Taxes and duties E. DBE (Disadvantaged Business Enterprise) involvement
XI. Acts of God A. Storm B. Earthquake C. Flood D. Fire E. Impact of site location on any of the above
XII.Site A. Access
116
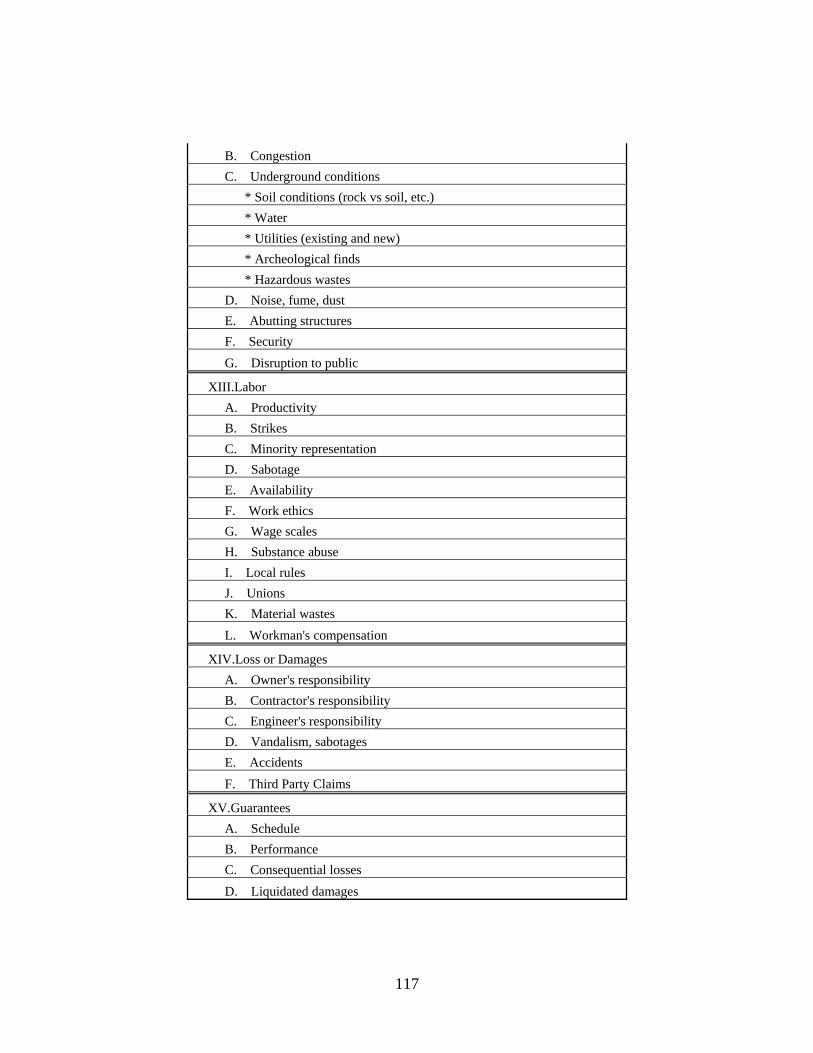
B. Congestion C. Underground conditions * Soil conditions (rock vs soil, etc.) * Water * Utilities (existing and new) * Archeological finds * Hazardous wastes D. Noise, fume, dust E. Abutting structures F. Security G. Disruption to public
XIII.Labor A. Productivity B. Strikes C. Minority representation D. Sabotage E. Availability F. Work ethics G. Wage scales H. Substance abuse I. Local rules J. Unions K. Material wastes L. Workman's compensation
XIV.Loss or Damages A. Owner's responsibility B. Contractor's responsibility C. Engineer's responsibility D. Vandalism, sabotages E. Accidents F. Third Party Claims
XV.Guarantees A. Schedule B. Performance C. Consequential losses D. Liquidated damages
117
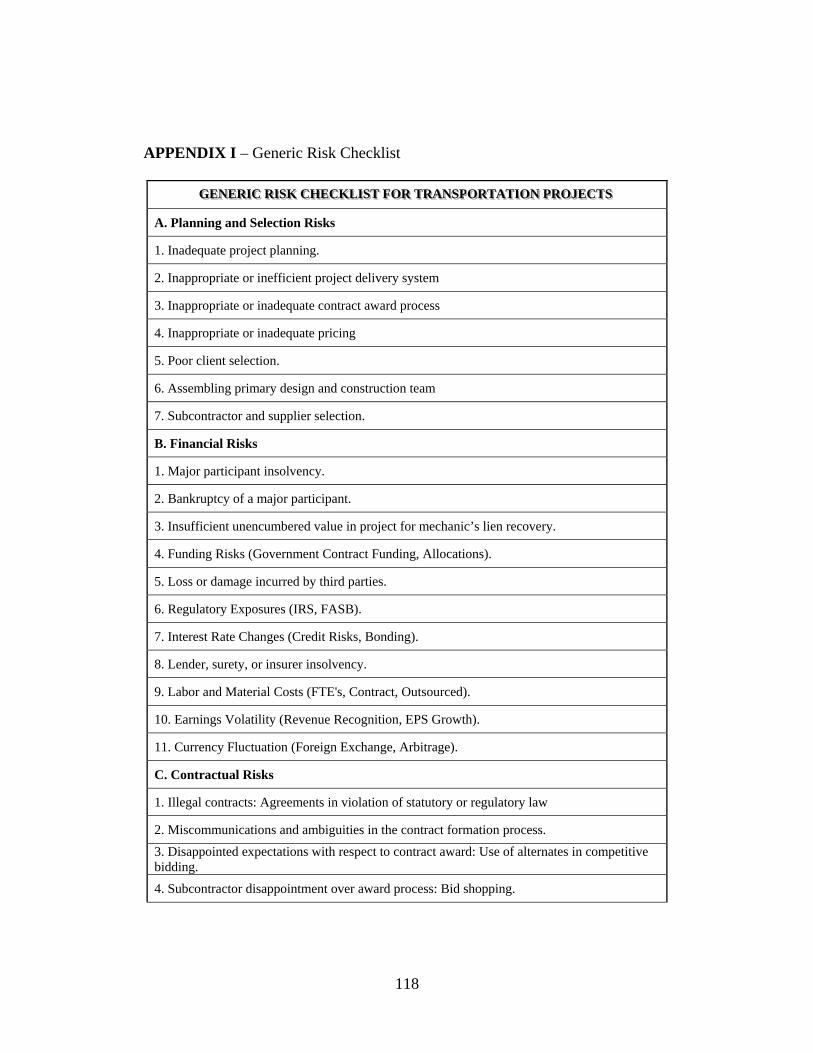
APPEND isk Checklist
IX I – Generic R
GGG LLLIIISSSTTT FFFOOORRR TTTRRRAAANNNSSSPPPOOORRRTTTAAATTTIIIOOONNN PPPRRROOOJJJEEECCCTTTSSS EEENNNEEERRRIIICCC RRRIIISSSKKK CCCHHHEEECCCKKK
A. Planning and Selection Risks
1. Inadequate project planning.
2. Inappro system priate or inefficient project delivery
3. Inappro d process priate or inadequate contract awar
4. Inappropriate or inadequate pricing
5. Poor client selection.
6. Assem ign and construction team bling primary des
7. Subcon r selection. tractor and supplie
B. Financial Risks
1. Major participant insolvency.
2. Bankruptcy of a major participant.
3. Insufficient unencumbered value in project for mechanic’s lien recovery.
4. Funding Risks (Government Contract Funding, Allocations).
5. Loss or damage incurred by third parties.
6. Regulatory Exposures (IRS, FASB).
7. Interest Rate Changes (Credit Risks, Bonding).
8. Lender, surety, or insurer insolvency.
9. Labor and Material Costs (FTE's, Contract, Outsourced).
10. Earnings Volatility (Revenue Recognition, EPS Growth).
11. Currency Fluctuation (Foreign Exchange, Arbitrage).
C. Contractual Risks
1. Illegal contracts: Agreements in violation of statutory or regulatory law
2. Miscommunications and ambiguities in the contract formation process. 3. Disappointed expectations with respect to contract award: Use of alternates in competitive bidding. 4. Subcontractor disappointment over award process: Bid shopping.
118
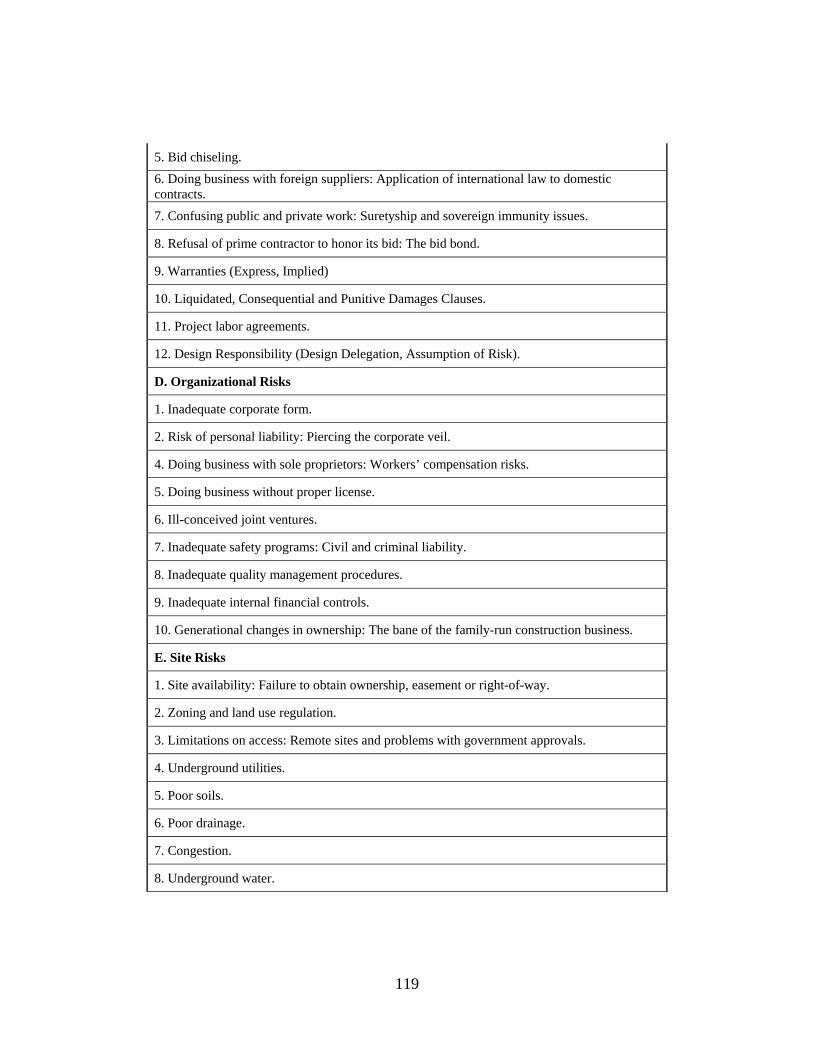
5. Bid chiseling. 6. Doing business with foreign suppliers:contracts.
Application of international law to domestic
7. Confusing public and private work: Suretyship and sovereign immunity issues.
8. Refusal of prime contractor to honor its bid: The bid bond.
9. Warranties (Express, Implied)
10. Liquidated, Consequential and Punitive Damages Clauses.
11. Project labor agreements.
12. Design Responsibility (Design Delegation, Assumption of Risk).
D. Organizational Risks
1. Inadequate corporate form.
2. Risk of personal liability: Piercing the corporate veil.
4. Doing business with sole proprietors: Workers’ compensation risks.
5. Doing business without proper license.
6. Ill-conceived joint ventures.
7. Inadequate safety programs: Civil and criminal liability.
8. Inadequate quality management procedures.
9. Inadequate internal financial controls.
10. Generational changes in ownership: The bane of the family-run construction business.
E. Site Risks
1. Site availability: Failure to obtain ownership, easement or right-of-way.
2. Zoning and land use regulation.
3. Limitations on access: Remote sites and problems with government approvals.
4. Underground utilities.
5. Poor soils.
6. Poor drainage.
7. Congestion.
8. Underground water.
119
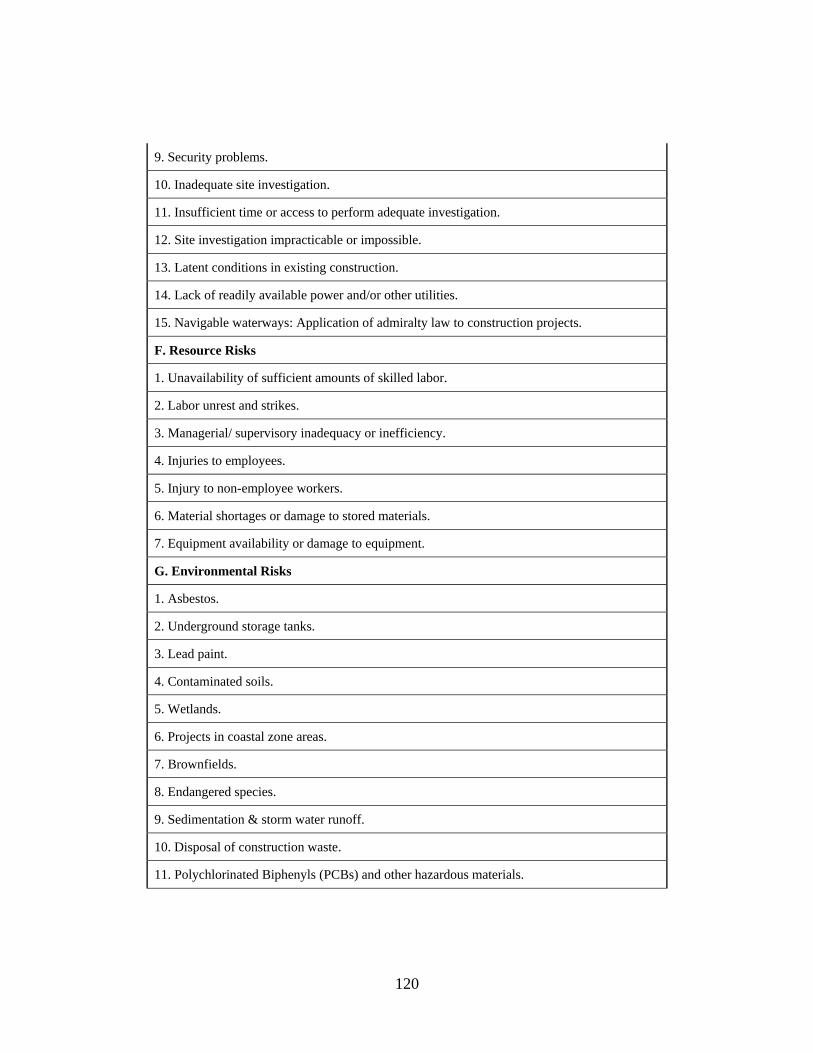
9. Security problems.
10. Inadequate site investigation.
11. Insufficient time or access to perform adequate investigation.
12. Site investigation impracticable or impossible.
13. Latent conditions in existing construction.
14. Lack of readily available power and/or other utilities.
15. Navigable waterways: Application of admiralty law to construction projects.
F. Resource Risks
1. Unavailability of sufficient amounts of skilled labor.
2. Labor unrest and strikes.
3. Managerial/ supervisory inadequacy or inefficiency.
4. Injuries to employees.
5. Injury to non-employee workers.
6. Material shortages or damage to stored materials.
7. Equipment availability or damage to equipment.
G. Environmental Risks
1. Asbestos.
2. Underground storage tanks.
3. Lead paint.
4. Contaminated soils.
5. Wetlands.
6. Projects in coastal zone areas.
7. Brownfields.
8. Endangered species.
9. Sedimentation & storm water runoff.
10. Disposal of construction waste.
11. Polychlorinated Biphenyls (PCBs) and other hazardous materials.
120
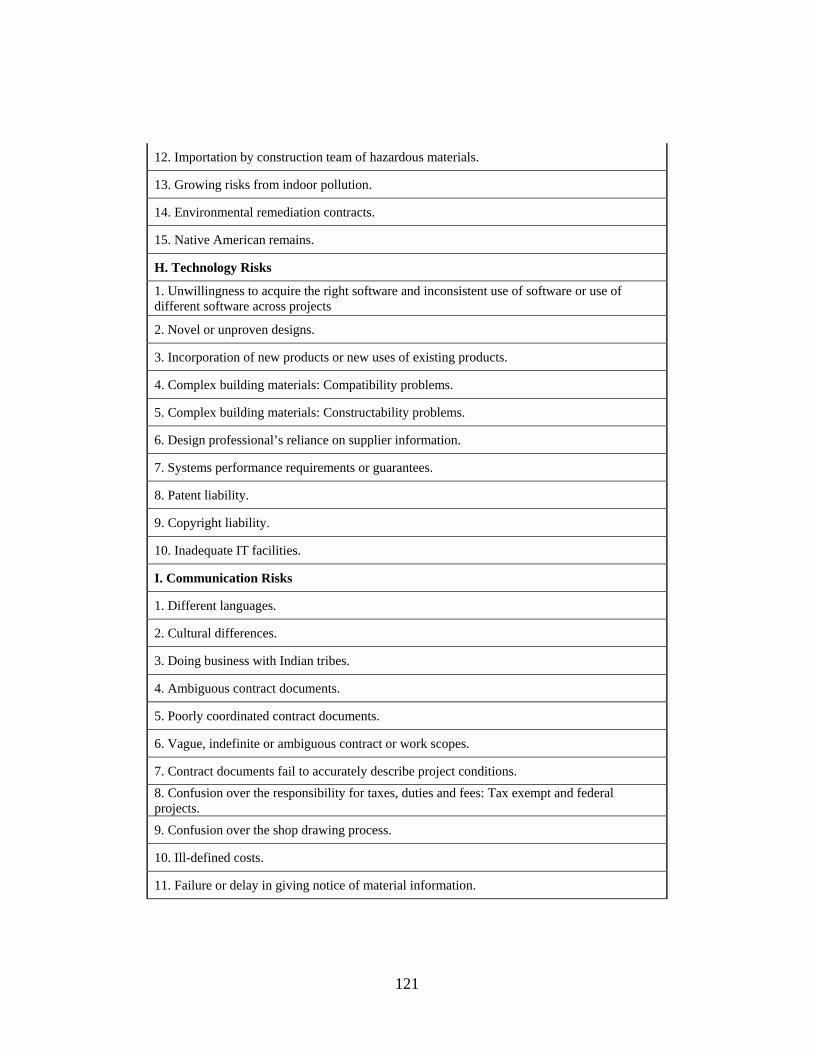
12. Importation by construction team of hazardous materials.
13. Growing risks from indoor pollution.
14. Environmental remediation contracts.
15. Native American remains.
H. Technology Risks
1. Unwillingness todifferent softw
acquire the right software and inconsistent use of software or use of are across projects
2. Novel or unproven designs.
3. Incorporation of new products or new uses of existing products.
4. Complex building materials: Compatibility problems.
5. Complex building materials: Constructability problems.
6. Design professional’s reliance on supplier information.
7. Systems performance requirements or guarantees.
8. Patent liability.
9. Copyright liability.
10. Inadequate IT facilities.
I. Communication Risks
1. Different languages.
2. Cultural differences.
3. Doing business with Indian tribes.
4. Ambiguous contract documents.
5. Poorly coordinated contract documents.
6. Vague, indefinite or ambiguous contract or work scopes.
7. Contract documents fail to accurately describe project conditions. 8. Confusion over the responsibility for taxes, duties aprojects.
nd fees: Tax exempt and federal
9. Confusion over the shop drawing process.
10. Ill-defined costs.
11. Failure or delay in giving notice of material information.
121
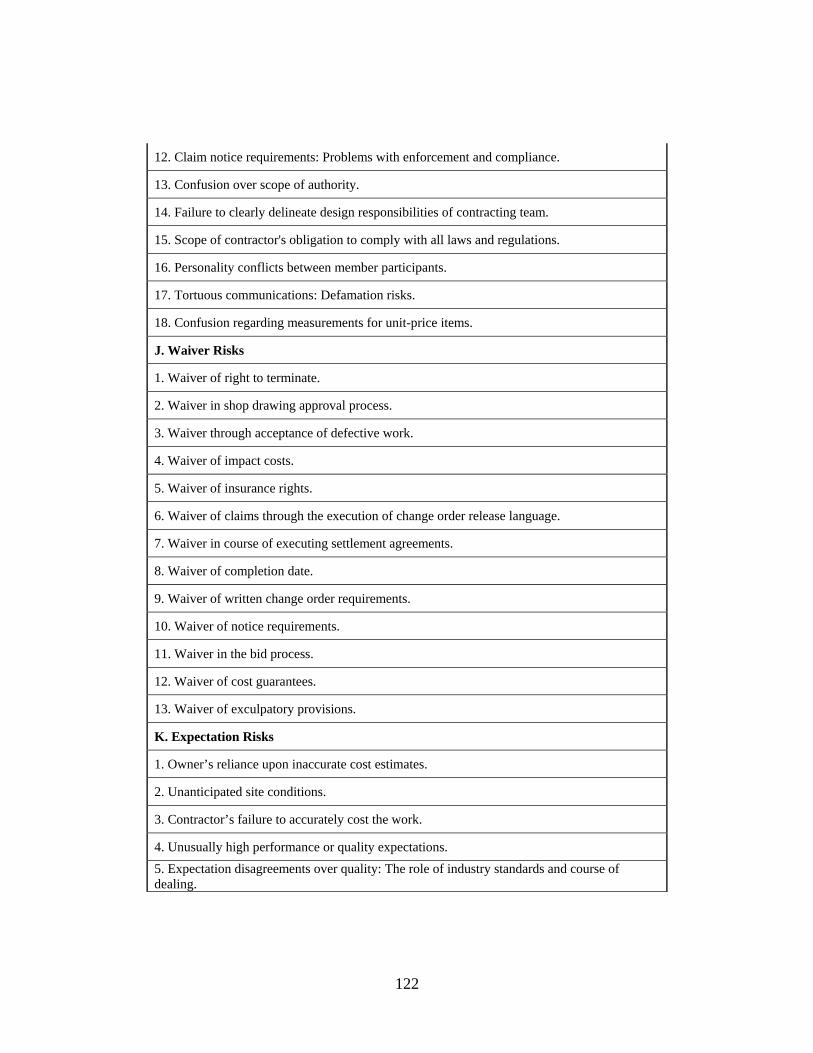
12. Claim notice requirements: Problems with enforcement and compliance.
13. Confusion over scope of authority.
14. Failure to clearly delineate design responsibilities of contracting team.
15. Scope of contractor's obligation to comply with all laws and regulations.
16. Personality conflicts between member participants.
17. Tortuous communications: Defamation risks.
18. Confusion regarding measurements for unit-price items.
J. Waiver Risks
1. Waiver of right to terminate.
2. Waiver in shop drawing approval process.
3. Waiver through acceptance of defective work.
4. Waiver of impact costs.
5. Waiver of insurance rights.
6. Waiver of claims through the execution of change order release language.
7. Waiver in course of executing settlement agreements.
8. Waiver of completion date.
9. Waiver of written change order requirements.
10. Waiver of notice requirements.
11. Waiver in the bid process.
12. Waiver of cost guarantees.
13. Waiver of exculpatory provisions.
K. Expectation Risks
1. Owner’s reliance upon inaccurate cost estimates.
2. Unanticipated site conditions.
3. Contractor’s failure to accurately cost the work.
4. Unusually high performance or quality expectations. 5. Expectation disagreements over quality: The role of inddealing.
ustry standards and course of
122
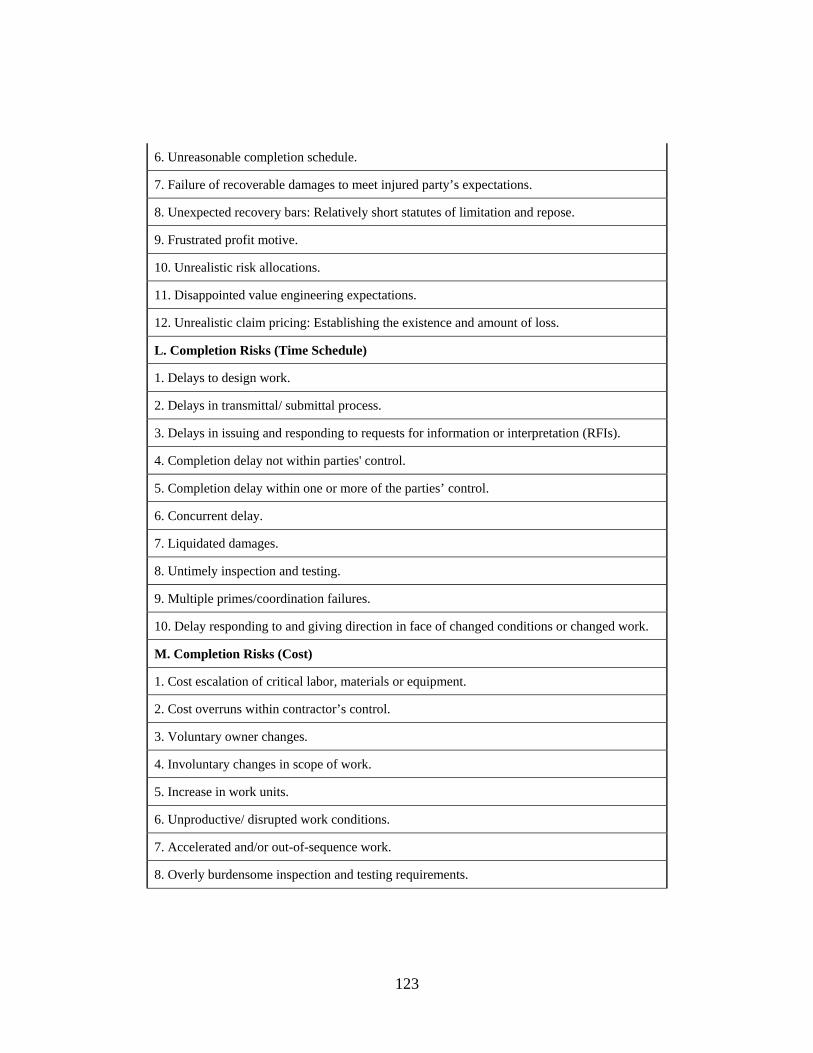
6. Unreasonable completion schedule.
7. Failure of recoverable damages to meet injured party’s expectations.
8. Unexpected recovery bars: Relatively short statutes of limitation and repose.
9. Frustrated profit motive.
10. Unrealistic risk allocations.
11. Disappointed value engineering expectations.
12. Unrealistic claim pricing: Establishing the existence and amount of loss.
L. Completion Risks (Time Schedule)
1. Delays to design work.
2. Delays in transmittal/ submittal process.
3. Delays in issuing and responding to requests for information or interpretation (RFIs).
4. Completion delay not within parties' control.
5. Completion delay within one or more of the parties’ control.
6. Concurrent delay.
7. Liquidated damages.
8. Untimely inspection and testing.
9. Multiple primes/coordination failures.
10. Delay responding to and giving direction in face of changed conditions or changed work.
M. Completion Risks (Cost)
1. Cost escalation of critical labor, materials or equipment.
2. Cost overruns within contractor’s control.
3. Voluntary owner changes.
4. Involuntary changes in scope of work.
5. Increase in work units.
6. Unproductive/ disrupted work conditions.
7. Accelerated and/or out-of-sequence work.
8. Overly burdensome inspection and testing requirements.
123
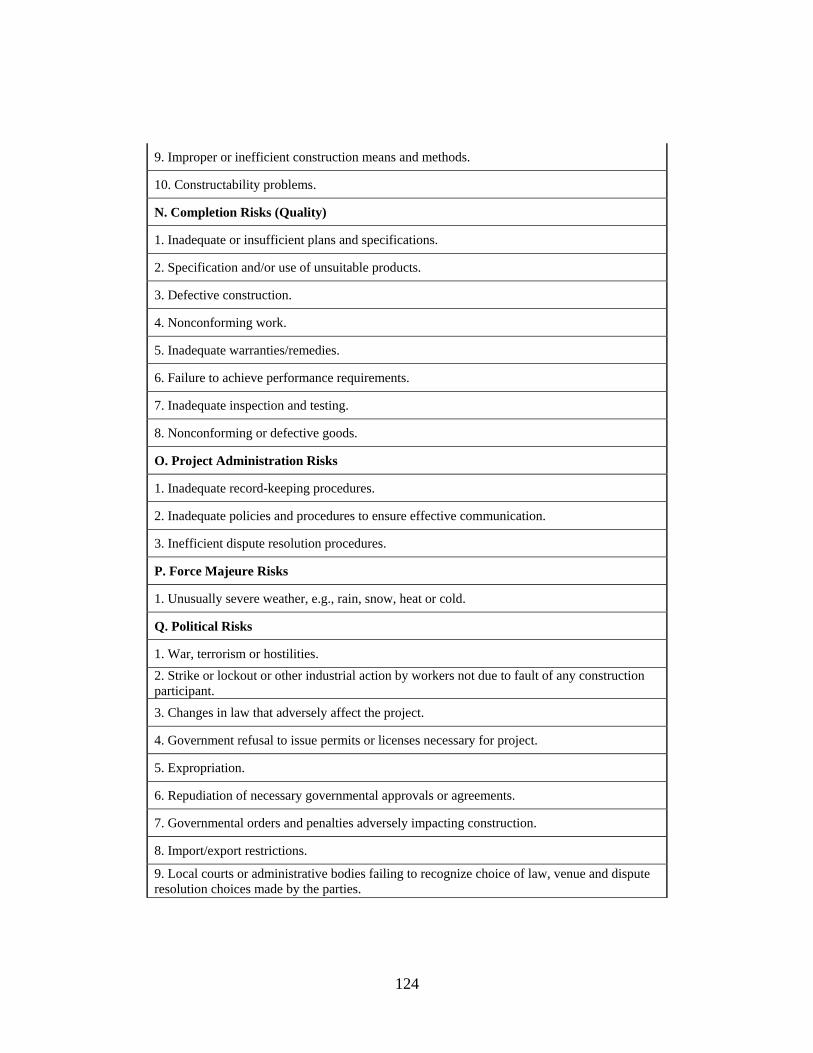
9. Improper or inefficient construction means and methods.
10. Constructability problems.
N. Completion Risks (Quality)
1. Inadequate or insufficient plans and specifications.
2. Specification and/or use of unsuitable products.
3. Defective construction.
4. Nonconforming work.
5. Inadequate warranties/remedies.
6. Failure to achieve performance requirements.
7. Inadequate inspection and testing.
8. Nonconforming or defective goods.
O. Project Administration Risks
1. Inadequate record-keeping procedures.
2. Inadequate policies and procedures to ensure effective communication.
3. Inefficient dispute resolution procedures.
P. Force Majeure Risks
1. Unusually severe weather, e.g., rain, snow, heat or cold.
Q. Political Risks
1. War, terrorism or hostilities. 2. Strike or lockout or other industriparticipant.
al action by workers not due to fault of any construction
3. Changes in law that adversely affect the project.
4. Government refusal to issue permits or licenses necessary for project.
5. Expropriation.
6. Repudiation of necessary governmental approvals or agreements.
7. Governmental orders and penalties adversely impacting construction.
8. Import/export restrictions.
9. Local courts or administrative bodies failing to recognize choice of law, venue and dispute resolution choices made by the parties.
124
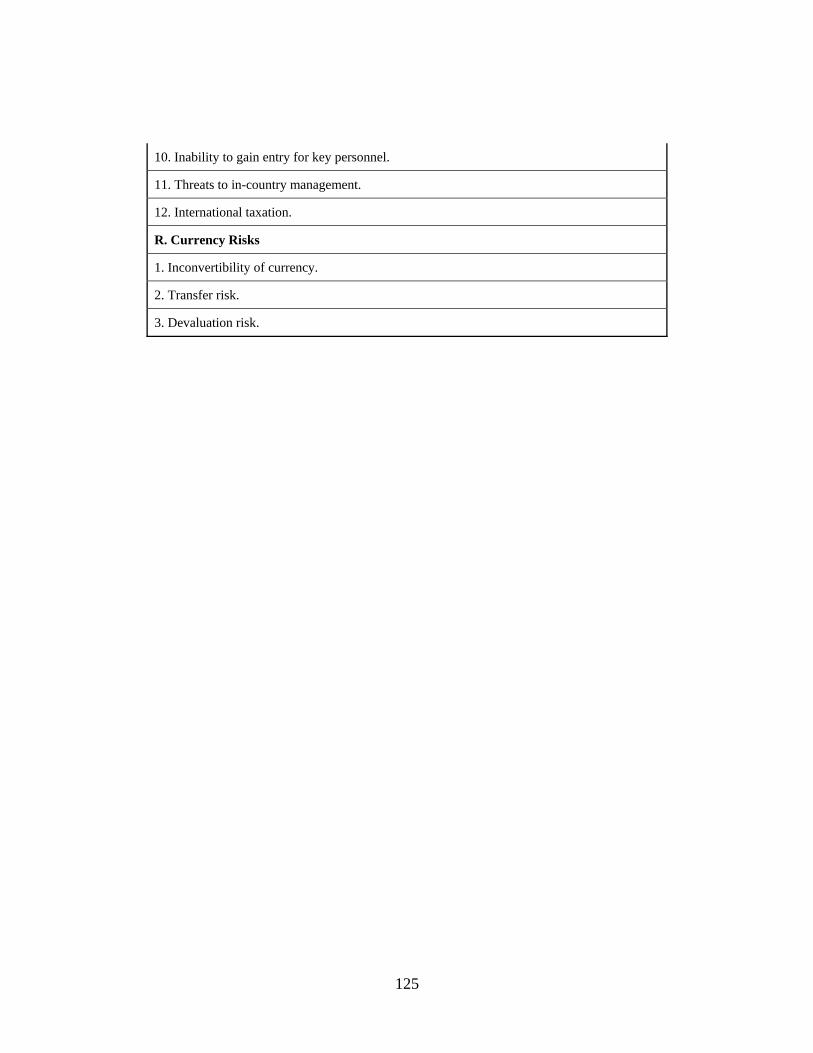
10. Inability to gain entry for key personnel.
11. Threats to in-country management.
12. International taxation.
R. Currency Risks
1. Inconvertibility of currency.
2. Transfer risk.
3. Devaluation risk.
125