Embed Size (px)
Citation preview
DO
NO
T COPY
Harvard Business School 9-799-158June 6, 1999
Professors Jan W. Rivkin and Michael E. Porter prepared this case from public sources with the assistance of ResearchAssociate Faramarz Nabavi as the basis for class discussion rather than to illustrate either effective or ineffective handling ofan administrative situation. The case draws on a report prepared by Charlie Bruin, Markus Cappel, Tom Galizia, and LailaWorrell, all MBA 1998.
Copyright © 1999 by the President and Fellows of Harvard College. To order copies or request permission toreproduce materials, call 1-800-545-7685 or write Harvard Business School Publishing, Boston, MA 02163. Nopart of this publication may be reproduced, stored in a retrieval system, used in a spreadsheet, or transmitted inany form or by any means—electronic, mechanical, photocopying, recording, or otherwise—without thepermission of Harvard Business School.
1
Matching Dell
Between 1994 and 1998, the revenue of Dell Computer Corporation rose from $3.5 billion to$18.2 billion, and profits increased from $149 million to $1.5 billion. The company’s stock price roseby 5,600%. During the same period, Dell grew twice as fast as its major rivals in the personalcomputer market and tripled its market share. In the first half of 1998, Dell reported operatingearnings that were greater than the personal computer earnings of Compaq, Gateway, Hewlett-Packard, and IBM combined.1 On Forbes magazine’s list of the richest Americans, Michael Dell, the33-year-old founder of Dell Computer, ranked fourth with an estimated worth of $13 billion. Hetrailed only Bill Gates, Warren Buffett, and Paul Allen on the list and was worth more than Gates hadbeen at the same age.2
Dell Computer had pioneered the widely publicized “Direct Model” in the personalcomputer (PC) industry. While competitors sold primarily through distributors, resellers, and retailsites, Dell took orders directly from customers, especially corporate customers. Once it received anorder, Dell rapidly built computers to customer specifications and shipped machines directly to thecustomer.
The success of the Direct Model attracted the intense scrutiny of Dell’s competitors. By 1997,headlines such as “Now Everyone in PCs Wants to Be Like Mike,” “Compaq Reengineers theChannel: Will It Be Enough to Slow Dell’s Momentum?” and “In Search of Greener Pastures, GatewayMoves on Dell’s Turf” peppered the PC trade press.3 By late 1998, virtually every major PCmanufacturer had taken some step to match Dell’s approach.
The Personal Computer Industry
History. Electronic computers emerged from military research undertaken during WorldWar II. In 1949, the magazine Popular Mechanics predicted that “Computers in the futuremay…perhaps only weigh 1.5 tons.” For the following three decades, large mainframe andminicomputers, produced by vertically integrated firms such as IBM and Digital EquipmentCorporations (DEC), dominated the market. As late as 1977, Kenneth Olsen, founder ofminicomputer maker DEC, opined, “There is no reason for any individual to have a computer in theirhome.”4
DO
NO
T COPY
799-158 Matching Dell
2
However, electronic hobbyists were already purchasing mail-order and retail kits whichallowed them to assemble primitive computers at home. These kits pieced together components thatwere either altogether new or newly affordable: microprocessors made by start-ups such as Intel,random-access and read-only memories, power supplies, and so forth. (A Glossary at the end of thecase defines technical terms.)
Between 1975 and 1981, a series of firms began to offer increasingly integrated, pre-assembled personal computers.5 Start-ups such as Apple Computer and MITS, and midsize firmssuch as Tandy / Radio Shack and Commodore, led the early market, gaining popularity amonghobbyists and educational institutions with easy-to-use machines for ordinary people. Establishedfirms including Texas Instruments, Hewlett-Packard, Zenith, NEC, Xerox, IBM, Toshiba, Sanyo, Sony,Olivetti, Wang, and DEC soon joined the entrepreneurs and began to produce PCs.
IBM launched its first PC in 1981 and, two years later, held 42% of the market. With a world-renowned corporate sales force and service organization, IBM commanded 61% of the market formainframe computers and produced many of the components for its mainframes.6 In launching itsPC, however, IBM purchased many components. It commissioned a start-up software firm,Microsoft, to write the operating system for its PC and adopted a microprocessor architecturedesigned by Intel. Publishing most of the specifications for its PC system, IBM established an “openarchitecture” to encourage software developers to write programs for the IBM PC and to spur otherfirms to make compatible peripherals such as printers. Most of the industry rapidly rallied aroundthe IBM standards. By 1983, the major alternative standard, a proprietary system championed byApple, held only 20% of the market.7
IBM used its huge sales force to sell personal computers to large corporate accounts. Volumediscounts encouraged large firms to centralize PC purchases through corporate MIS departments,with whom IBM sales people had strong relationships. To serve small businesses and individuals,IBM turned to retail stores such as Sears and Computerland.8 It also encouraged the development ofa network of distributors and dealers known as value-added resellers. These resellers not only sold PCsto customers, but also guided them through the purchase of what was still an unfamiliar product.Resellers commonly handled installation, configured software, pieced together customer networks,and serviced machines on an on-going basis. In small and midsize businesses, employees rarely hadthe skills to do what resellers did, and few companies had enough PCs to justify hiring trainedpersonnel.
As demand for IBM’s PCs exploded, other firms began to offer “IBM clones.” Compaqentered the market with a low-priced portable clone in 1982 and booked $100 million of revenueduring its first year, making it the fastest growing firm in American history. A host of other start-upsfollowed Compaq’s lead and entered the market with IBM clones. Among these entrants was DellComputer Corporation, incorporated in 1984. During the same period, most established competitorssuch as Hewlett-Packard shifted from proprietary architectures to the IBM standard.
Like IBM, makers of IBM clones relied on resellers and retail stores to reach customers. WhileIBM initially steered resellers away from the largest corporate accounts, start-ups such as Compaqwithout internal sales forces encouraged resellers to cater to large customers. In time, even IBMrelied heavily on resellers to service large accounts.
By 1986, IBM realized that it had set a standard, but in doing so, had spawned a set ofimitators while ceding the rights to the most valuable components of the PC—the microprocessor andthe operating system—to Intel and Microsoft. In 1986, IBM declined to adopt Intel’s third-generationmicroprocessor, the 386 chip. In introducing its PS/2 line of computers in 1987, IBM tried to make thePC more proprietary. Compaq both adopted the 386 chip and led a group of nine clone makers inaffirming the existing industry standards. Though IBM subsequently accepted the 386, its marketshare fell from 37.0% in 1985 to 16.9% in 1989.9
DO
NO
T COPY
Matching Dell 799-158
3
Throughout the 1980s and 1990s, PC performance improved and prices fell at a rapid clip.Intel’s 386DX microprocessor, introduced in 1985, was priced at $299 and could perform 2.5 millioninstructions per second (MIPS)—a price of $120 per MIPS. Intel’s Pentium II microprocessor,launched in 1998, was priced at $699 and could carry out 675 MIPS—$1 per MIPS.10 In addition, therange of software available for the personal computer expanded dramatically.
Microsoft released its new operating system Windows 3.0 in 1990, and over the next fouryears, the user-friendly Windows became ubiquitous on PCs configured to the IBM standard. Indeed,the standard soon became known as “Wintel,” reflecting the combination of the Windows operatingsystem and Intel’s x86 microprocessor architecture. By 1991, between 85% and 90% of computerssold conformed to Microsoft / Intel standards, with the remainder using the proprietary Appleoperating system and a Motorola microprocessor.
The initial surge in sales of personal computers crested in 1990, just as a recession gripped theUnited States. In newspapers around the world, Dell Computer ran advertisements showing that itsprices were much, much lower than Compaq’s list prices. Compaq usually discounted its PCs wellbelow the list price, but the advertising campaign was highly effective. In response, Compaq slashedits prices by as much as 32%, introduced 41 new products in 1992, and added new distributionchannels.11 A vigorous price war followed.
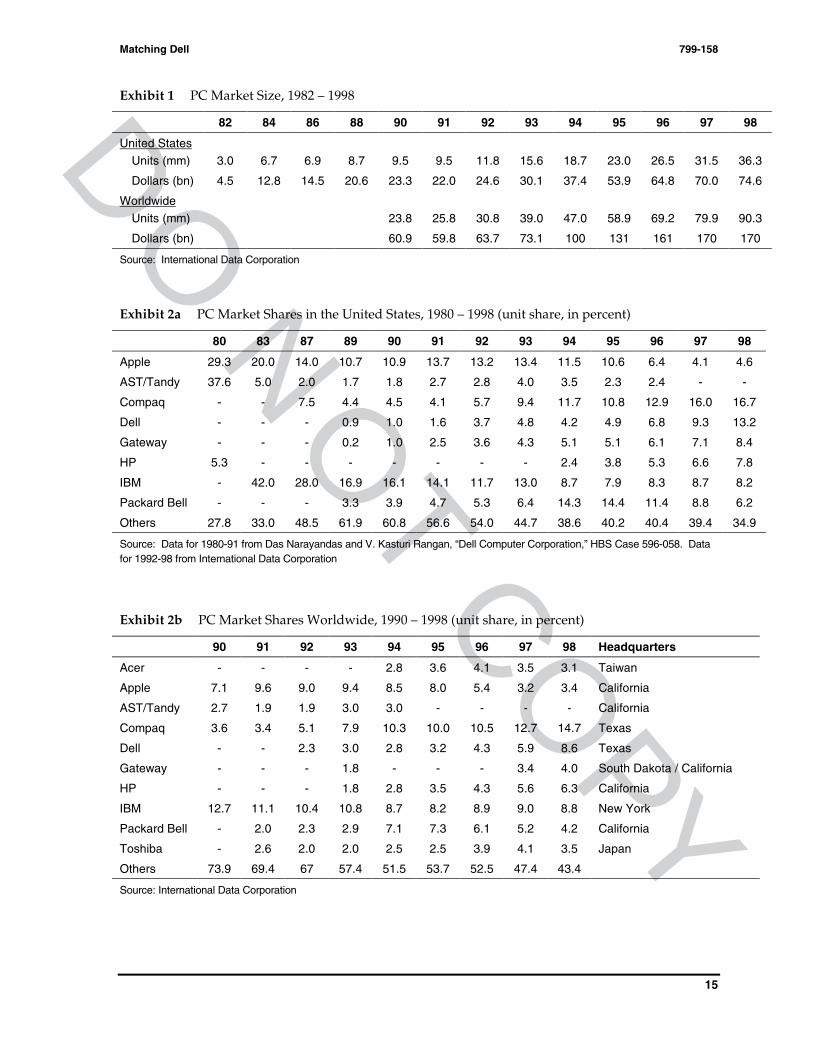
Demand growth recovered in the mid-1990s, buoyed by strong economic growth and theemergence of new, popular services involving computer networks. Proliferation of electronic mailand growth of the World Wide Web gave customers, especially individual consumers, new reasons topurchase a personal computer. PC prices continued to decline. Compaq offered a powerful personalcomputer for less than $1,000 in 1997, and other companies rushed to offer similarly inexpensive PCs.By December 1998, the prices of the least expensive PCs had plunged to $499. In the United States,45.5% of households owned a computer in 1998, and the figure was expected to rise to 49.5% by2000.12 Household ownership levels were lower but also growing in Europe and Asia. See Exhibits 1and 2 for market size and share data over time.
Products in 1998. PC makers followed well-established standards to piece together modularcomponents of hardware and software. The resulting machines differed widely in their processingspeeds, memory capacities, portability, software configurations, modem speeds, and screen sizes, forinstance.
Hardware components such as housings, keyboards, memory chips, motherboards, diskdrives, monitors, modems, and connectors could be purchased in highly competitive global marketsserved by numerous companies. In contrast, microprocessors were supplied by only a handful ofcompanies. Intel dominated this market, providing 80-90% of the microprocessors for Wintel PCs.13
By 1998, roughly 96% of new PCs followed the Wintel standard.14 Virtually all of the rest employedthe Apple standard with PowerPC microprocessors. Other semiconductor makers such as AMD andCyrix offered low-priced microprocessors which competed with Intel’s and used a similararchitecture, but historically, these companies had made few inroads into Intel’s near-monopoly. Inthe sub-$1,000 market, AMD and Cyrix appeared finally to have made some headway in unseatingIntel. Roughly half of the sub-$1,000 PCs sold during 1998 were equipped with an AMD processor.15
Intel ordinarily made its microprocessors available to all major purchasers at a standardprice, thereby maintaining a level playing field among the leading PC makers. When Intel released anew generation of microprocessors, demand typically exceeded supply. Intel then rationed its newproduct, allotting microprocessors to PC makers in proportions that were based roughly on pastpurchases. The price of a microprocessor of a given generation declined rapidly as a generation aged,as did the price of PCs made with them. PC margins were typically highest during the early days of amicroprocessor generation.
DO
NO
T COPY
799-158 Matching Dell
4
The core piece of software on a PC was the operating system. Virtually all PCs with x86microprocessors employed an operating system made by Microsoft, usually some version ofWindows. A number of vendors offered “application software” such as word processors,spreadsheets, database management systems, financial organizers, Web browsers, and electronicmessaging software. In this market, also, Microsoft held a preeminent position, accounting for nearly80% of the market for so-called “office productivity applications” (e.g., word processors,spreadsheets) and 10% of the overall $56 billion market for application software.16
The hardware and software that comprised a PC were often sold as an integrated bundle. PCmakers such as IBM, Compaq, and Dell would deliver computers with a Microsoft operating systemalready installed and, in turn, would pay a fee to Microsoft. Increasingly, PCs were delivered withpieces of application software also already installed.
As processing costs declined, the lines between PCs and other devices blurred. At the lowerend of the processing and memory spectrum, handheld electronic organizers had begun to competewith the personal computer for applications such as electronic mail and portable computing. At thehigher end, PCs had become increasing hard to distinguish from workstations. Historically,workstations had been several times faster and more expensive than PCs and had employed speciallydesigned microprocessors and distinct operating systems. In recent years, however, PCs based on thefastest x86 microprocessors and Windows NT had begun to compete with the low end of theworkstation market. PC makers had also extended their product lines to include servers, powerfulcomputers that sat at the hubs of computer networks.
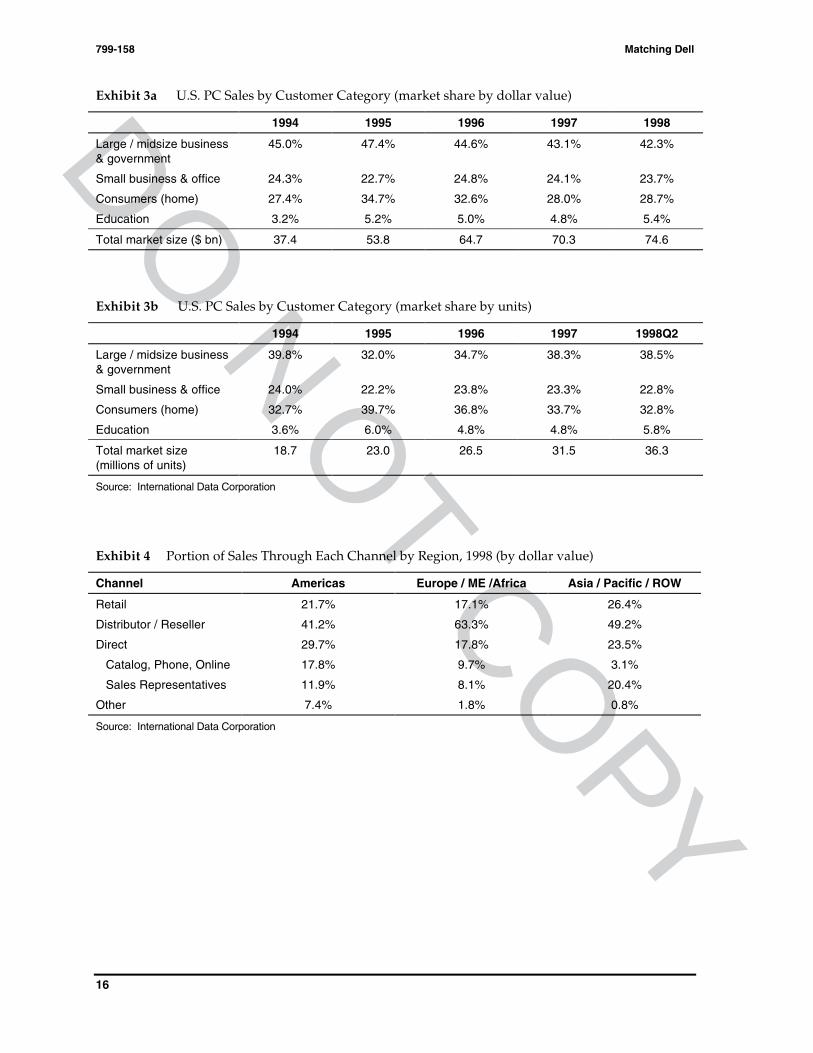
Customers. PC buyers were usually divided into four categories: large and midsizebusinesses / government; small businesses and offices; individual consumers; and educationalinstitutions. Exhibit 3 shows the portion of PC units and sales revenue accounted for by each set ofcustomers.
Large and midsize businesses and government institutions usually had significant MISdepartments that purchased, maintained, and supported PCs in a centralized fashion. Staff memberswere highly knowledgeable about PCs. They were charged with providing a reliable network ofhigh-performance computers while also controlling information system costs. The capital cost of a PCwas only a portion of the total cost associated with the machine. Once a PC was purchased, MIS staffhad to tag it for identification purposes, configure software, install the machine at the user location,train the users, and help users when they encountered problems. By one estimate, corporations spentbetween $8,000 and $12,000 annually to support each desktop PC.17 Most large organizations had amotley collection of PCs of various brands and vintages, making maintenance, support, and reliabilityof machines problematic.
Small businesses and offices typically lacked MIS staffs. Reliability, performance, support,service, price, brand, and channel recommendations (see below) all played roles in the choice of a PCby such organizations. By 1998, virtually all businesses had extensive experience with personalcomputers.
Individual consumers purchased PCs for home or home-office use. In choosing amongbrands, individuals relied heavily on the evaluations of independent organizations such as ConsumerReports. Individual buyers were a diverse lot, but tended to be more sensitive to price and moreinterested in a computer’s brand name than were business buyers.18 Some consumers also paidattention to the brand of the microprocessor. Since 1990, Intel had spent an estimated $3 billion onbrand advertising for its microprocessors. Among individual consumers in the U.S., 30% ofpurchasers were first-time buyers in 1998. This figure was expected to decline to 16% by 2000.19
In the eyes of some industry observers, buyers were divided into two true camps: Apple andWintel. Many long-time owners of Apple computers were highly, almost emotionally, attached to theApple standard, and they cursed the ascendancy of Wintel. Wintel customers, in contrast, tended to
DO
NO
T COPY
Matching Dell 799-158
5
be less attached to a particular brand of computer. Apple was more successful in selling its PCs toindividuals and educational institutions than to businesses, though it thrived among desktoppublishers.
Channels. Personal computers flowed from manufacturers to customers via four channels:retail stores, distributors (working with small resellers), integrated resellers, and direct distribution.20
Exhibit 4 shows the portion of PCs passing through each channel in various regions of the world.
Retailers such as Circuit City and CompUSA in the United States and Time Computers inEurope took delivery of PCs directly from manufacturers. Machines then passed through distributioncenters owned by the retailers on their way to stores. In stores, retail displays and sales peopleplayed a significant role in helping customers select among models and manufacturers. Retail shelfspace was limited, and even large superstores typically carried only 3-5 brands of PCs. Computerretailers operated on very thin margins. CompUSA, for example, earned overall gross margins of14.1% and gross margins of roughly 7-9% on computers. It registered a net margin of 0.6% in 1998.
A handful of large distributors such as Ingram Micro (with 1998 sales of $22.0 billion) andTech Data ($7.1 billion) supplied a full range of computer hardware and software to nearly 100,000resellers.21 These resellers, typically small owner-managed firms, worked with business customers todesign, buy, configure, install, and support computer networks. According to one survey, 93% of endusers accepted reseller recommendations for computer purchases.22 Beyond charging for their value-added services, distributors and resellers typically marked up hardware by a total of 5-7%, thoughthis mark-up had fallen in recent years.23
A few resellers were large enough to deal directly with manufacturers rather than buythrough distributors. Integrated resellers such as MicroAge and Vanstar operated distributioncenters, fielded extensive sales and service organizations, and in some cases, managed the PCnetworks of clients on an on-going basis. Vanstar, for instance, split its operations into three distinctsegments. The largest, involved in the procurement and installation of corporate PC networks,earned a gross margin of 9.7% in 1998. A second segment devoted to network design and consultingreported a gross margin of 44.4%, while a third involved in on-going network support andmaintenance earned a gross margin of 53.1%. Overall, Vanstar’s net margin in 1998 was a thin 1.3%.
A fourth and final channel led directly from the manufacturer to the customer. A handful ofPC manufacturers took orders directly from customers, either over the telephone and Internet or bymeans of internal sales forces. They then delivered PCs via third-party shippers such as UPS.
Manufacturers usually agreed to buy back channel inventory that did not sell. In addition,they provided price protection to resellers and distributors: if the price of a computer fell while it wasin the distribution channel, the manufacturer would reimburse the reseller or distributor accordingly.By one estimate, inventory buy-backs and price protection cost PC manufacturers 2.5 cents on everydollar of revenue. Manufacturers spent another 2.5 cents advertising to resellers and distributors,funding the market development activities of channel players, and managing product returns. PCstypically took four to five weeks to pass from the PC maker through distributors and resellers tocustomers.24
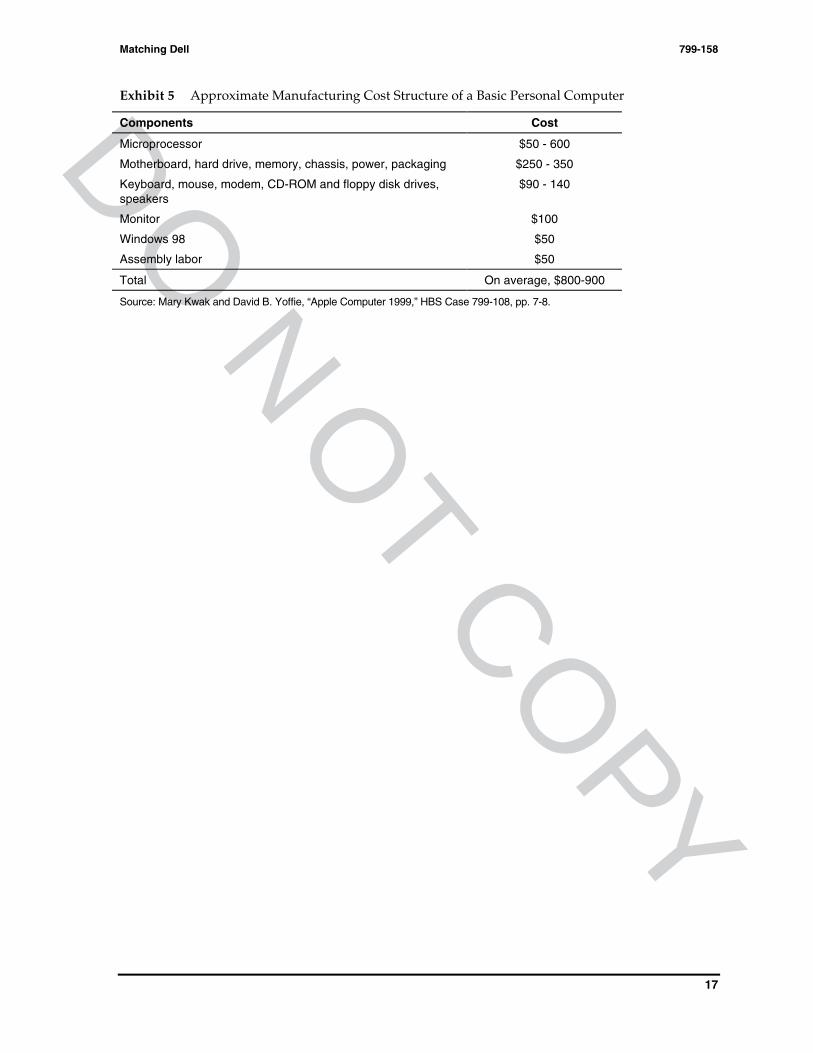
Manufacturing. Computer makers used basic assembly-line techniques to assemble PCsfrom standard parts. By the early 1990s, a manufacturer could buy and install the capital equipmentrequired for an efficient PC assembly line, capable of assembling 250,000 PCs per year, with aninvestment of roughly a million dollars.25 Contract manufacturers, many in Asia, also stood ready tomake PCs on behalf of other firms. Exhibit 5 shows the structure of the costs typically incurred toassemble a PC that would retail for roughly $1,000.
The prices of components used to make PCs had typically declined 25-30% per year. In 1998,prices declined even faster, at a rate of roughly 1% per week. The financial crisis in Asia (where
DO
NO
T COPY
799-158 Matching Dell
6
many component makers were located), increased competition faced by Intel, and gluts in themarkets for several components all contributed to the faster decline in prices.26
Marketing and sales. PC manufacturers took a variety of approaches to marketing and sales.Companies such as Apple, Hewlett-Packard, and IBM spent as much as 2-3% of sales on advertisingin order to develop recognizable brands. Others produced unbranded “white box” PCs and did notadvertise to end users at all. Sales forces varied from the 25,000-strong sales organization of IBM tothe virtually nonexistent sales forces of white-box PC makers. White-box manufacturers served 23%of the market in North America, 50% in Europe and Asia, and as much as 90% in China.27
Dell Computer Corporation
“It was too late to challenge the technical standard and the dealer network had been donealready. Compaq was already very strong in retail. A new marketing and distributionstrategy was something new, however.”28
While a freshman at the University of Texas at Austin, 18-year-old Michael Dell started apart-time business in his dorm room: he formatted hard disks for personal computers and addedextra memory, disk drives, and modems to IBM clones, selling them for as much as 40% less thancomparable IBM machines. Reluctant to reveal this distraction from his studies, Dell hid PCs in hisroommate’s bathtub when his parents came to visit.29
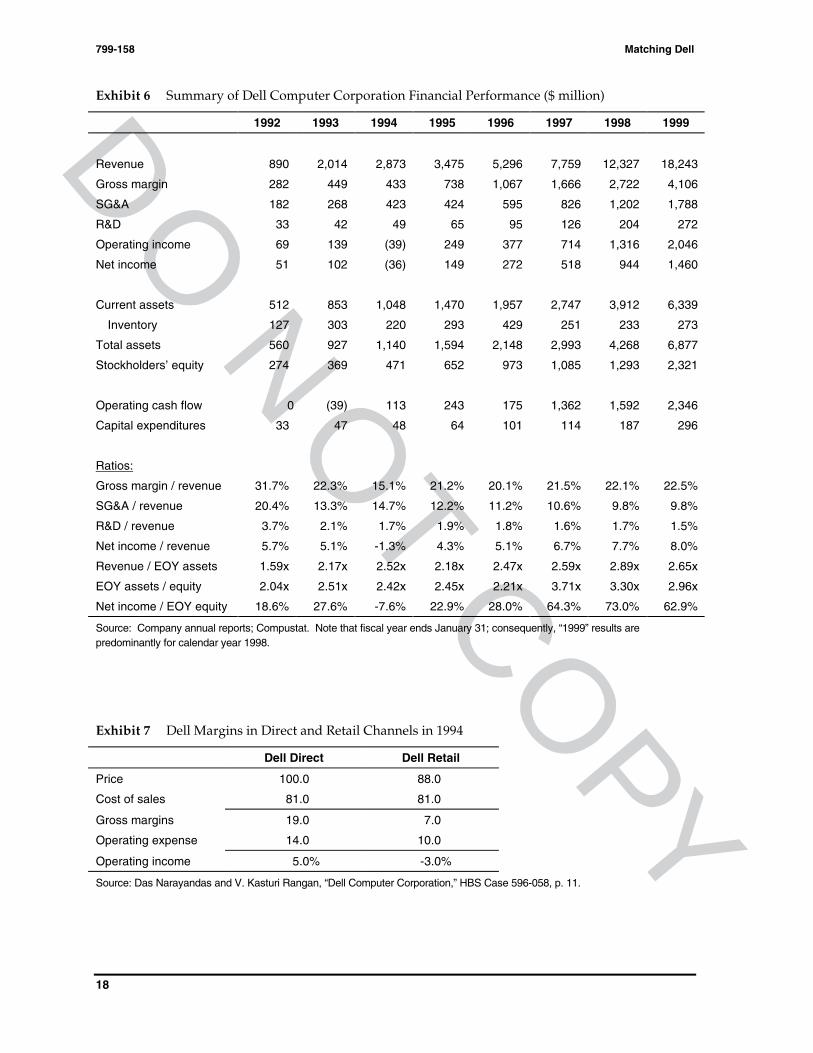
When revenue reached $80,000 per month in 1984, Dell dropped out of college and foundedDell Computer Corporation. Already, companies such as Exxon and Mobil were clamoring for 50 to100 of Dell’s machines at a time.30 In 1985, Dell shifted from upgrading the machines of othermanufacturers to assembling Dell-branded PCs. Revenue rose each subsequent year. (See Exhibit 6for financial results.)
The basic elements of Dell’s Direct Model came together early in the company’s history andremained in place in 1998. The company dealt directly with end customers. It served primarilycorporate customers and offered them high-performance PCs at relatively low prices. PCs werecustomized to buyer specifications, and assembly commenced only after Dell received an order.
Sales and marketing. While most competitors supplied machines based on orders fromdistributors, resellers, and retailers, Dell took orders directly from customers. Businesses andgovernment institutions accounted for 77% of Dell’s sales, home and small office users 18%, andeducational institutions 5%. Very large customers, who purchased more than $1 million in PCs eachyear, provided 70% of the firm’s revenue.31 No single customer represented more than 2% of Dell’ssales.32
Dell used indicators of a company’s potential PC purchases, such as the number of employeesand the number of PCs per employee, to divide customers into two groups: Relationship buyers andTransaction buyers.33 Relationship buyers were large companies and institutions that could becounted on to place repeated orders for multiple PCs. Dell assigned a team of outside sales reps andinside sales reps to each Relationship account. Over a thousand outside sales reps spent their time inthe field, understanding customer needs, courting customer personnel, helping customers configuretheir information systems, and promoting Dell’s products and services. Inside sales reps, located incall centers, received telephone calls from assigned customers. Because Relationship customerstypically specified particular PC configurations that their employees were allowed to order, the insidereps serving such customers simply took orders and provided product and delivery information.Both inside and outside sales reps had access to on-line information about a customer’s entire
DO
NO
T COPY
Matching Dell 799-158
7
purchase history and worked closely with Dell personnel responsible for after-sale service andtechnical support. Dell tended to realize its highest gross margins among Relationship buyers.34
Transaction buyers included small-to-medium businesses and home computer users. Thecompany reached these customers via advertisements in trade journals and business publications,catalogs, and direct marketing. Customers who wanted to buy a PC or obtain information couldreach an inside sales rep by calling 1-800-BUY-DELL (a different number than that used byRelationship buyers). Inside sales reps for Transaction buyers provided product information andactively encouraged customers to purchase more advanced PCs. Traditionally, Dell avoided theinexperienced Transaction buyer. Morton Topfer, Vice Chairman of Dell, explained: “Consumers atretail don’t know what they are looking for, other than price. We, on the other hand, like to sell to theeducated consumer.”35
In late 1990, Dell departed from its Direct Model and entered the retail channel. The move,Michael Dell said, would “[provide] us with the opportunity to generate significant new business andincrease Dell’s market penetration,” especially among “PC customers—particularly at the entrylevel—who want to physically ‘touch and feel’ a unit before they buy.”36 Accordingly, Dell producedtwo lines of standard PCs and reached distribution agreements with computer superstores such asCompUSA and warehouse clubs such as Sam’s Club. Sales through the retail channel were brisk, butDell soon found that it was losing money on retail sales. Exhibit 7 compares the margins which Dellearned in the direct and retail channels. Retail losses contributed to Dell’s poor financial results in1993, as did a major recall of notebook computers. In 1994, Dell withdrew from retail stores.
As Dell had grown, it had subdivided its customer base into finer and finer categories. In1994, buyers were classified as large customers or small customers. By 1996, the large customerclassification had been split into large companies, midsize companies, and government andeducational institutions. By 1998, large companies had been split into global enterprise accounts andother large companies; government and educational accounts into federal, state and local, andeducational; and small customers into small companies and consumers.37 In addition, sales effortswere divided by region and, within region, by country. Michael Dell explained that such divisionswere accomplished “for a lot of reasons. One is to identify unique opportunities and economics. Theother is purely a managerial issue: you can’t possibly manage something well if it’s too big.”38
Dell launched its Web site www.dell.com in July of 1996, and increasingly, customers wereusing the site to contact Dell. Transaction buyers could obtain product information, configure acomputer system, check pricing, place an order, and track an order’s progress. They could also gainaccess to the complete catalog of service and support information used by Dell’s servicerepresentatives.
For thousands of Relationship customers, Dell had designed custom Premier PagesSM. Onthese secure Web pages, an employee of a customer might find pager numbers for their Dell accountteam or a list of computer configurations that had been approved by the customer’s purchasingmanager, for instance. By December of 1998, transactions totaling $10 million per day involvedwww.dell.com.39
Occasionally, Dell sold to resellers. In December 1997, for instance, it sent a flyer to a limitednumber of resellers offering older systems to resellers at prices 15-20% below the prices quoted atwww.dell.com. However, Dell did not allow returns or provide price protection.40 Roughly 5% ofDell’s systems were purchased by resellers.41
Production, logistics, and procurement. Dell manufactured machines that were—within theguidelines of a broad menu—tailored to customer needs. The company made customized PCs basedon actual orders and held no finished goods inventory of standardized machines. Dell operatedmanufacturing facilities in Austin, Texas; Limerick, Ireland; Penang, Malaysia; and Xiamen, China. A
DO
NO
T COPY
799-158 Matching Dell
8
fifth site was slated for Alvorada, Brazil. Daily meetings matched production schedules with salesflows. Keith Maxwell, Dell’s vice president for worldwide operations, commented:42
[The current production system] requires that the whole organization beintegrated. You’ve eliminated buffers. When you have no buffers and you have noinventory, the whole organization has to work together. There is no way to let thingspile up, because you have no piles.
Once received, an order was sent electronically to the appropriate manufacturing facility.There, a computer generated a parts list for the order and assigned the order a bar code for trackingpurposes. Dell’s older facilities were organized in assembly-line fashion: as the chassis of themachine traveled down the line, the hardware specified by the parts list was added. Its newestfacility in Austin employed five-person manufacturing cells: parts for a PC were compiled in a bin,the bin sent to a cell, and the computer assembled there. The company found that the cells deliveredmachines with fewer defects more efficiently.43
After assembly, the machine moved to a software loading zone. There, special machines anda very-high-speed computer network installed software specified by the customer: an operatingsystem, commercial application software, and diagnostic software. For some corporate customers,Dell also loaded proprietary software. The fully equipped machine proceeded to a “burn-in” area,where it was tested for several hours. Finally, it was boxed along with accessories and shipped to thecustomer. Dell maintained shipping contracts with a number of third-party shippers such as UPS andAirborne Express.
The production process, from order entry to shipping, took about a day and a half.44 In themidst of the Asian economic crisis in October of 1997, for instance, Dell received an emergency orderfrom the Nasdaq stock exchange for eight servers. The exchange’s existing servers were beingstrained by unprecedented trading volumes. Dell shipped the customized, tested servers within 36hours.45 At the same time, the production process could handle large orders. Also in late 1997, forexample, Dell built 2,000 desktop computers and 4,000 servers for Wal-Mart, loaded the machineswith proprietary software, and shipped them to 2,000 Wal-Mart stores.46
Dell worked closely with suppliers to arrange just-in-time delivery of parts. Dell hadwhittled its days of inventory down from 32 in 1995 to 7 in 1998.47 Since 1992, it had reduced thenumber of suppliers for its Austin facility from 204 to 47.48 With remaining suppliers, Dell maintainedclose electronic links, communicating replenishment needs to some vendors on an hourly basis. Theelectronic links allowed Dell to direct some suppliers’ shipments straight to its customers. Computermonitors supplied by Sony, for instance, never passed through Dell’s facilities. Rather, Dellcommunicated the order for a monitor to Sony and to its shipper. The shipper picked up thecomputer at Dell’s site, picked up the monitor at Sony’s, brought the boxes together, and deliveredthem simultaneously to the customer. A web site customized to Sony gave both Sony and Dellcontinuous access to ordering and manufacturing information.49 Michael Dell explained:50
…what’s the point in having a monitor put on a truck to Austin, Texas, andthen taken off the truck and sent on a little tour around the warehouse, only to be putback on another truck? That’s just a big waste of time and money, unless we get ourjollies from touching monitors, which we don’t.
Dell encouraged suppliers to locate warehouses and production facilities close to its assemblyoperations. Co-location was particularly easy to arrange near Dell’s major facilities in Austin, wherelocal and state government officials had worked since the 1950s and 1960s to attract high-technologycompanies. Now known as “Silicon Hills,” the Austin region included 72 semiconductormanufacturers and related suppliers, 160 computer and electronics manufacturing firms, more than600 small and midsized software companies, and 825 technology consulting and services firms.51
DO
NO
T COPY
Matching Dell 799-158
9
Products and services. Dell provided two lines of desktop computers, one designed to bereliable, stable, and highly compatible with corporate networks, the other intended to incorporate thelatest technology. Desktop computers ranged from $1,250 machines for individual consumers to$4,000 PC for corporate networks. The company also offered two lines of notebook computers, with asimilar distinction between the lines. A line of network servers and, since 1998, a line of workstationsfilled out the company’s product range.52 Dell’s workstations and servers used Windows NT and x86microprocessors.
In addition to selling hardware, Dell offered to install off-the-shelf software and a customer’sproprietary software. On a custom basis, it installed and tested computers and networks at customersites. A new venture, Dell Financial Services, offered leasing, technology planning, and assetmanagement services.
After a sale, Dell supported its products in several ways. Online, Dell offered 50,000 pages ofcustomer support information. A customer with a problem could also reach a technical support staffof 1,300 representatives via a hotline that was manned 24 hours a day. Upon receiving a call, supportpersonnel would retrieve a file containing details of the customer’s computer, starting with theoriginal order and recording all subsequent service calls. Using the diagnostic software installed inthe factory, the customer and the support specialist could resolve the problem over the telephone inapproximately 90% of cases. For problems requiring an on-site visit, Dell contracted out service tocompanies such as Xerox, Wang Global, and Unisys rather than employ service personnel itself. Mostproblems requiring an on-site visit were resolved with 24 to 48 hours.53 Dell was working withservice providers to create measures of service quality and to improve the flow of data between themand Dell.54 Dell also conveyed information concerning defective parts from the service providers backto its suppliers.55
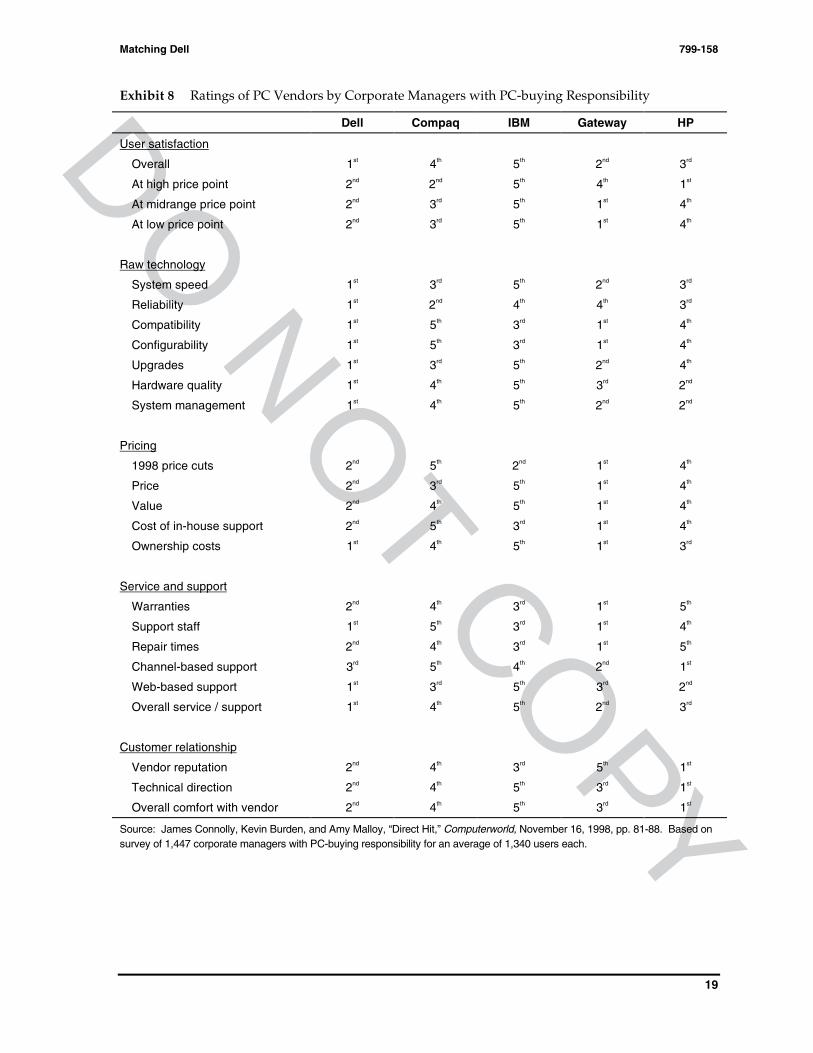
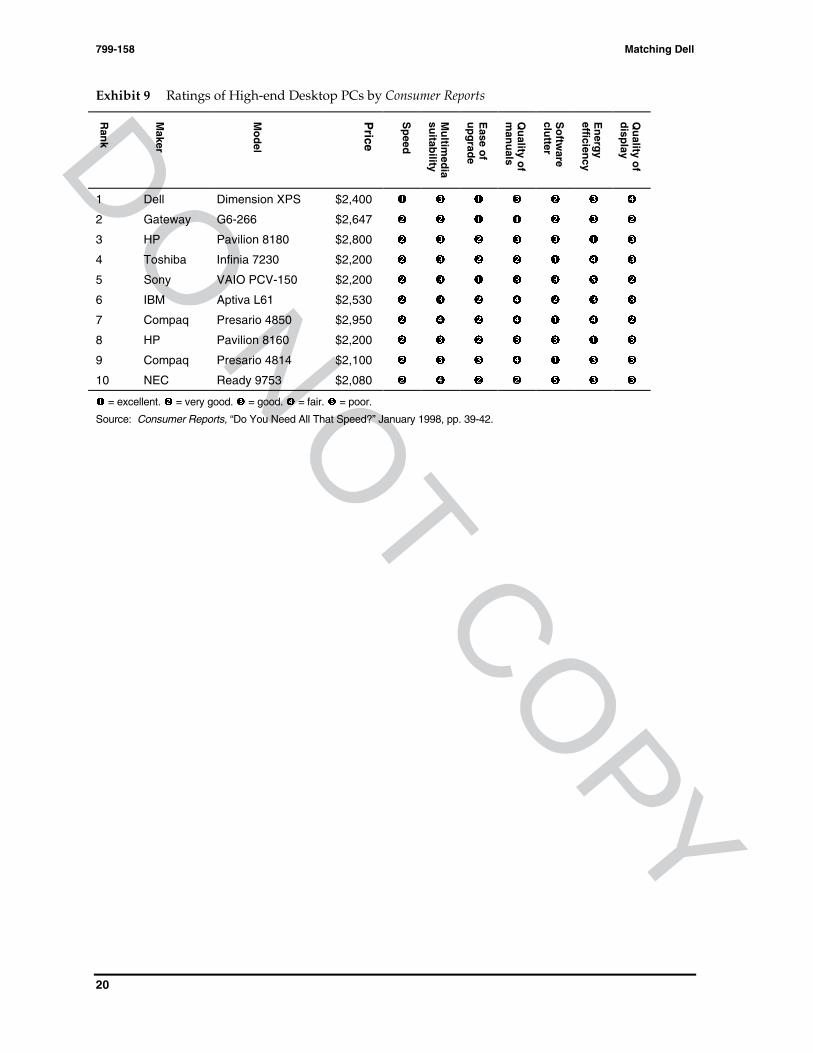
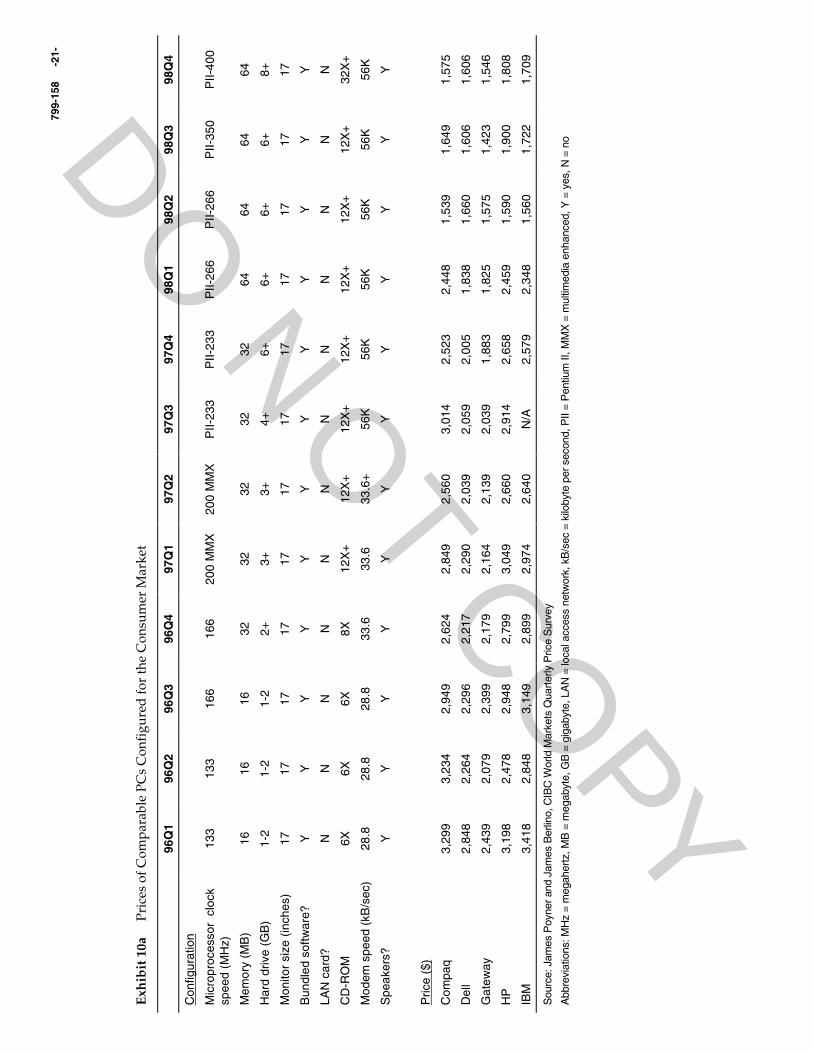
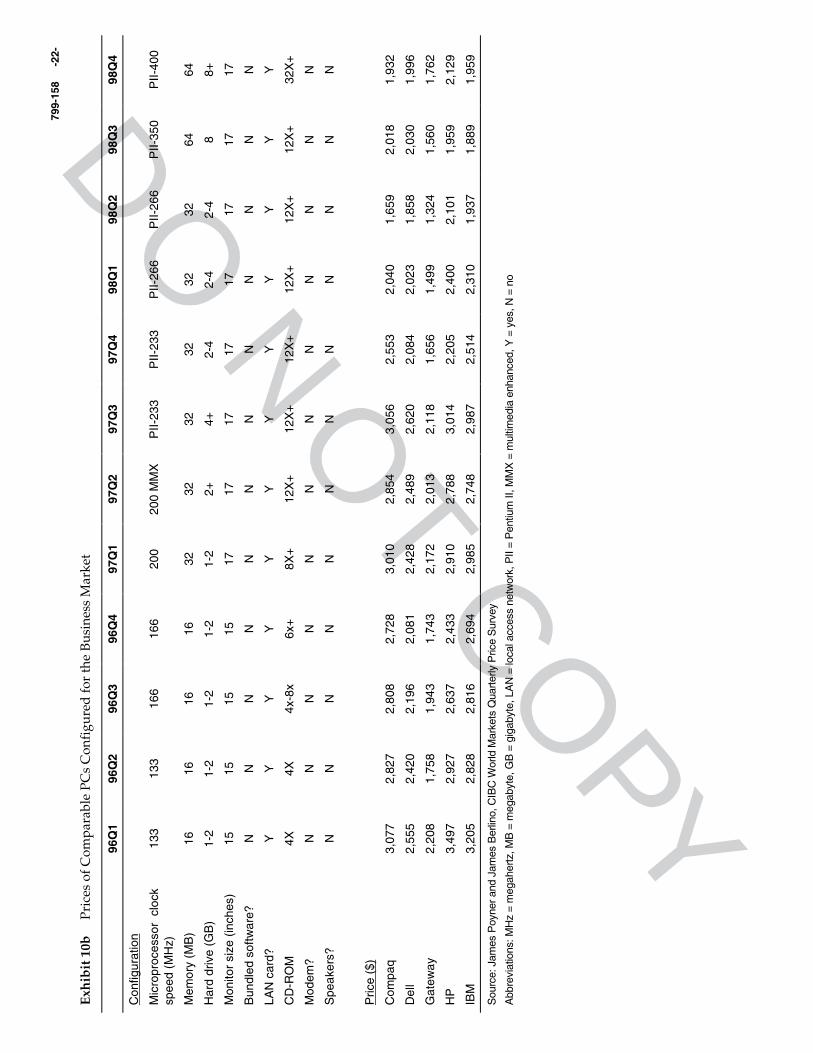
In most industry surveys, customers rated Dell’s sales, products, and services highly relativeto the competition. Exhibits 8 and 9 report the results from a survey of corporate PC buyers andfrom Consumer Reports, respectively. Exhibits 10a and 10b show, for the consumer and businessportions of the market, the prices of Dell PCs relative to comparably configured machines offered byrivals.
Firm infrastructure. For much of its history, Dell was managed as an entrepreneurial start-up with few formal control systems. Growth pains culminated in a net loss in 1993. Dell’s supply ofcash fell as low as $20 million in 1993, a thin cushion for a company with annual sales of nearly $3billion.
Subsequently, Michael Dell hired a number of seasoned managers, including veterans fromMotorola, Apple Computer, Sun Microsystems, Intel, and Electronic Data Systems. Morton Topfer,formerly at Motorola, took the position of Vice Chairman and focused especially on operations andmanufacturing. Dell himself, at 33 the longest tenured chief executive in the PC industry,concentrated on products and market trends.56
In 1998, senior management paid special attention to several performance metrics. Thecompany monitored days of inventory by product component. It managed receivables and payablessuch that, on average, it received payment for its products five days before it had to pay suppliers.Managers examined margins, selling price, and overhead by customer segment, product, andcountry.57 As an overall indicator of company performance, the senior management team focused onreturn on invested capital.58 Dell’s FY 1998 return on invested capital was 186%.
DO
NO
T COPY
799-158 Matching Dell
10
Competition
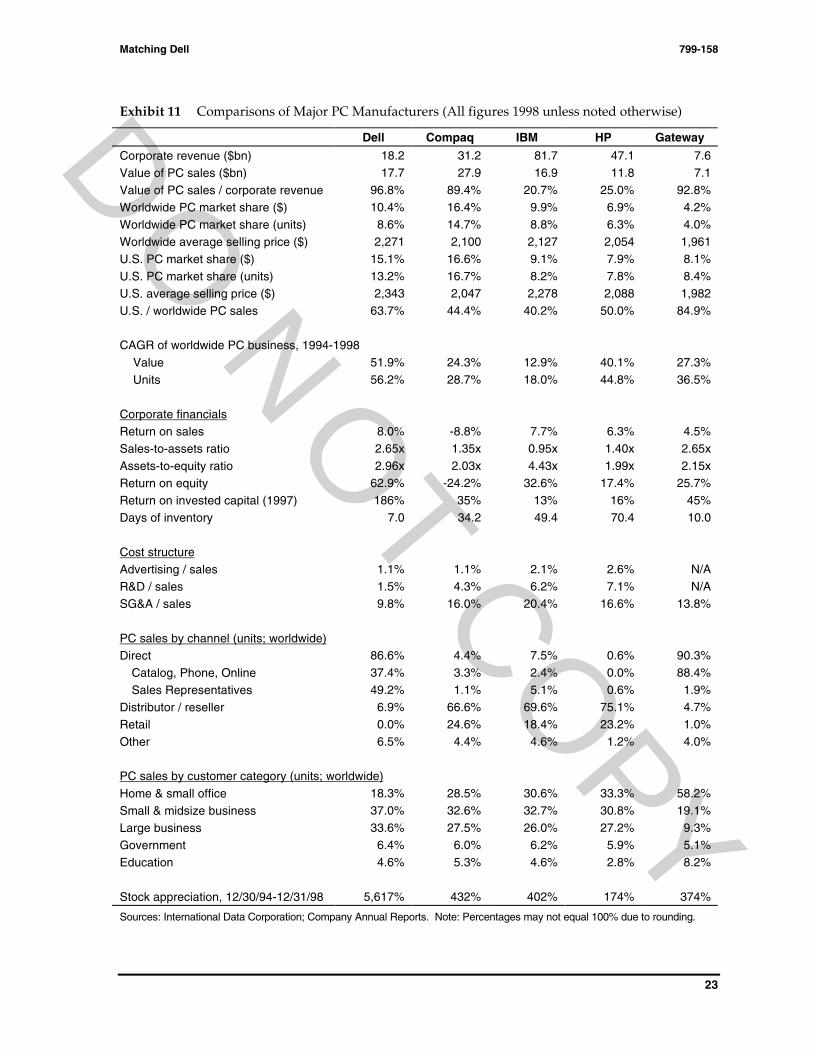
Dell’s financial returns and rapid growth caused its rivals to take both notice and action.(Exhibit 11 compares Dell’s growth rate, profitability, and other characteristics to competitors’.) Dellfaced a diverse set of competitors, typified by IBM, Compaq, Hewlett-Packard, and Gateway.
IBM. Since sparking the growth of the PC market in the early 1980s, IBM had fallen to thirdplace among PC makers in terms of dollar market share worldwide. IBM remained the largestinformation technology corporation in the world, offering an extremely broad range of IT hardware,software, and services. Its personal computing products covered the spectrum from sub-$1,000 PCsto high-end servers and workstations. IBM’s vaunted sales and service organization gave it fullaccess to corporate MIS managers. The sales force accounted for 5% of its PC sales, distributors andresellers for 70%, and retailers for 18%.
IBM was among the first PC makers to recognize the challenge posed by direct distribution.59
Starting in the early 1990s, it launched a series of initiatives to improve coordination with distributorsand resellers: a Joint Manufacturing Authorization Program was followed by an Integration andAssembly Program and an Enhanced Integration and Assembly Program. In these programs, IBMshipped “heavily configured” PCs to authorized distributors and resellers, who then completed theconfiguration of the machine to customer specifications and forwarded it on to the customer.
In 1995, IBM moved to an Authorized Assembly Program (AAP). Here, IBM shipped “lightlyconfigured” PCs, known as Model 0s, to downstream partners. Model 0s were barely functionalcomputers, containing only a motherboard, a floppy drive, and a video card. Partners in the channelcompleted the assembly to customer specifications, using components purchased from IBM. UntilSeptember 1998, components were always shipped from IBM facilities. Hence a microprocessormight travel from Intel’s warehouse in Arizona to IBM’s facility in North Carolina and back to apartner’s assembly plant in Arizona.60 IBM set component prices such that total costs, includingassembly costs, were the same for a channel-assembled and IBM-assembled PC.61 Under AAP, IBMcontinued to build Model 0 PCs based on forecasts, not on actual customer orders.
A number of major distributors and resellers, including MicroAge, Ingram Micro, and TechData, had invested tens of millions of dollars to build plants that assembled IBM PCs (and by 1998,PCs with other brand names).62 By 1998, roughly half of IBM’s shipments of desktop PCs toMicroAge, for instance, were thought to be Model 0s.63 Overall, between one-quarter and one-third ofIBM’s PCs were finished by one of 14 channel partners.64
AAP enabled IBM and its partners to deliver customized PCs rapidly without holding largeamounts of inventory. One partner reported that the program improved the inventory turnover rateof its IBM stock from 10-12x to 20x. At the same time, the partner’s fill rate—the portion of time thatit had a desired product in stock—rose from 80% to 95%. The program also reduced the need forresellers to “tear down” new PCs, that is, take them apart and reconfigure them to meet customerneeds. Tear downs were costly and appeared to cause quality problems. MicroAge reported that2.0% to 2.25% of IBM-built machines had defects after a tear-down while only 0.5% of its AAP-assembled machines had problems.65
Even as it increased coordination with channel partners, IBM explored ways to expand itsown direct sales. To combat IBM clones, IBM had launched an autonomous division named “Ambra”in 1992. The division produced low-end PCs at low cost by contracting out most operations, and itsold Ambra PCs by mail-order and telephone. The Ambra division was shut down in 1994.66 In April1998, IBM opened a web site that allowed customers to buy PCs.67 The site referred businesscustomers to resellers, who then set prices and fulfilled orders. Individual consumers could use theweb site to purchase standardized PCs directly from IBM, without going through a retail outlet. Forconsumers, the site offered the Aptiva line of PCs, which Taiwan-based Acer built on behalf of IBM.
DO
NO
T COPY
Matching Dell 799-158
11
Later in 1998, IBM introduced its first program to enable businesses to buy a small set of productsdirectly: the Netfinity Direct program allowed large enterprises to purchase a particular line of IBMservers without going through resellers.
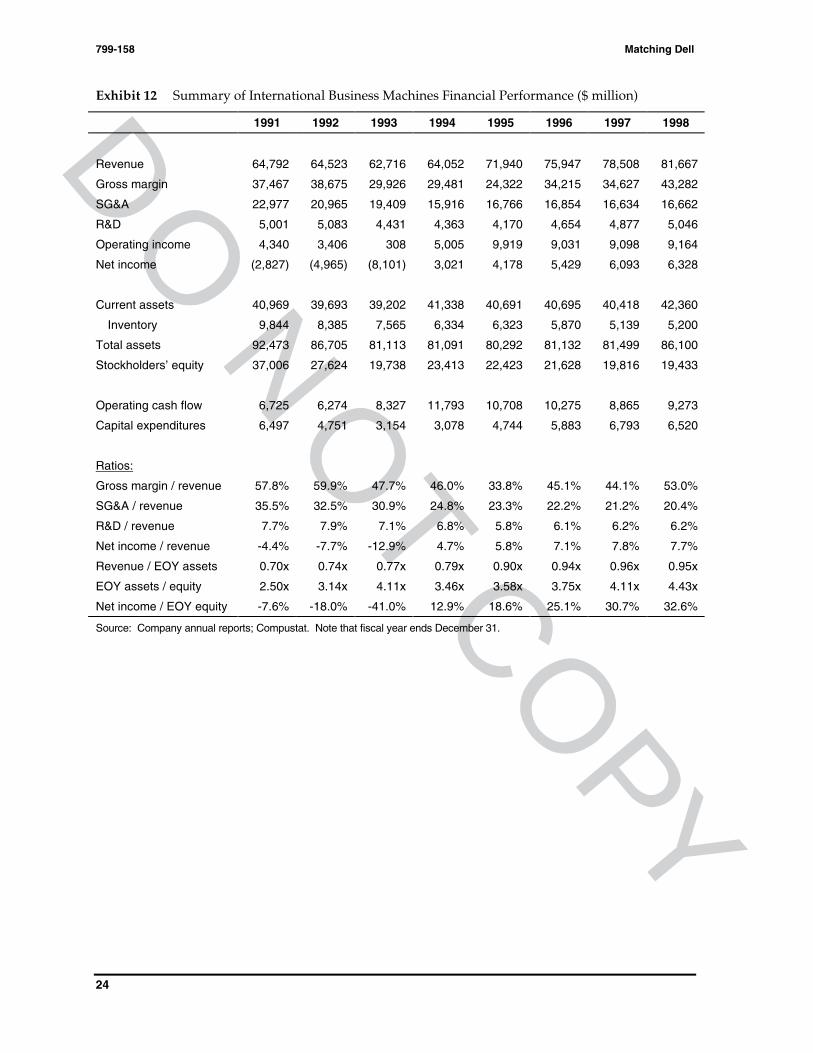
Exhibit 12 shows financial results for IBM as a whole. Personal computers represented 23%of IBM’s corporate revenue. Its PC division lost $39 million before taxes in 1996, $161 million in 1997,and $992 million in 1998. The company reported, however, that PC operations returned toprofitability in the fourth quarter of 1998.68
Compaq. Founded in 1982, Compaq surpassed IBM in 1994 to become the world’s largestmanufacturer of personal computers. By 1998, Compaq offered a broad range of computers, fromsub-$1,000 PCs to $2 million fail-safe servers.69 With its $3 billion acquisition of Tandem Computersin 1997, Compaq doubled its sales and support staff to 8,000 people and gained access to thecorporate data centers which Tandem’s fail-safe computers had served.70 Its $9 billion acquisition ofDEC in 1998 gave Compaq, among other assets, DEC’s highly regarded service and consulting staff of22,000 people. In the words of Eckhard Pfeiffer, Compaq’s CEO, “We want to do it all, and we wantto do it now.”71
The company employed the full range of PC channels, selling 67% of its PCs through 44,000distributors and resellers, 25% at retail, and 4% direct.72 Compaq served individual consumers andbusiness customers in quite different ways. For consumers, Compaq built standard PCs to stock,either in its own factories or the factories of Asian contractors. It distributed to consumers primarilythrough retail stores. Compaq launched an online catalog in 1993, but abandoned the initiative in theface of channel resistance.73 In 1996, Compaq introduced a toll-free telephone number that allowedconsumers to order PCs directly from the company. According to one analyst, “the results have beentepid, mainly because Compaq kept its prices high to avoid angering dealers.”74
Compaq’s production and distribution system for business customers had evolved over time.In late 1995, Compaq moved from a production system in which it built business PCs according to itsown forecast to one in which it built according to forecasts made by channel members. Thispermitted Compaq to reduce the inventory it held for PCs from 60 days to 30 days. Because resellersand distributors held 35 more days of inventory, a Compaq computer delivered in mid-1997 wastypically 65 days old before it reached a customer through the reseller channel.
In July of 1997, Compaq announced a new effort to coordinate efforts with distributors andresellers, an Optimized Distribution Model (ODM). Under ODM, PCs would be built only after anorder was received, and orders and delivery would continue to go through distributors and resellers.Relatively standard machines would be built to order in Compaq’s plants and delivered rapidly,ready for installation, to resellers. More complicated, customized machines would be assembled in atwo-step process: Compaq would ship stripped-down PCs, similar to IBM’s Model 0s, to channelpartners. Members of the channel would handle the final assembly and configuration. Compaqexpected to finish 80% of its corporate PCs in its own factory, with channel partners completing theother 20%.75
Under ODM, Compaq would offer only two weeks of price protection, down from as muchas seven weeks. In late 1998, the total inventory in the Compaq / distributor / reseller channel wasestimated to have declined to 45-50 days.76 Analysts thought that ODM might eventually reduce totalinventory to 25 days.77
Following the DEC acquisition, announced in January of 1998, distributors and resellers wereconcerned that Compaq would use DEC customer relationships to sell directly to corporate accounts,especially to large corporations. In June, Compaq confirmed that it would do so. Compaq’s vicepresident of marketing and communications assured that “the price of systems bought through thechannel will be the same as systems purchased directly from Compaq, and resellers will still make aprofit.”78
DO
NO
T COPY
799-158 Matching Dell
12
In November of 1998, Compaq unveiled its DirectPlus Program, intended to sell customizedPCs directly to small and midsize companies. Under the program, Compaq would offer a new line ofcomputers via the telephone and Internet. The line would be available only through DirectPlus, andprices would be lower than those charged by resellers for comparable Compaq machines. Compaqoffered to pay resellers a referral fee of 6-7% on orders that they passed along to DirectPlus. Toaccompany the new computer line, Compaq introduced support services, software modules, andleasing programs that might attract small and midsize business customers. Compaq intended to shipDirectPlus orders as early as the next business day and, on average, within five days.79 Observersexpected Compaq to turn over some manufacturing of the new line to resellers who had invested inassembly operations.80
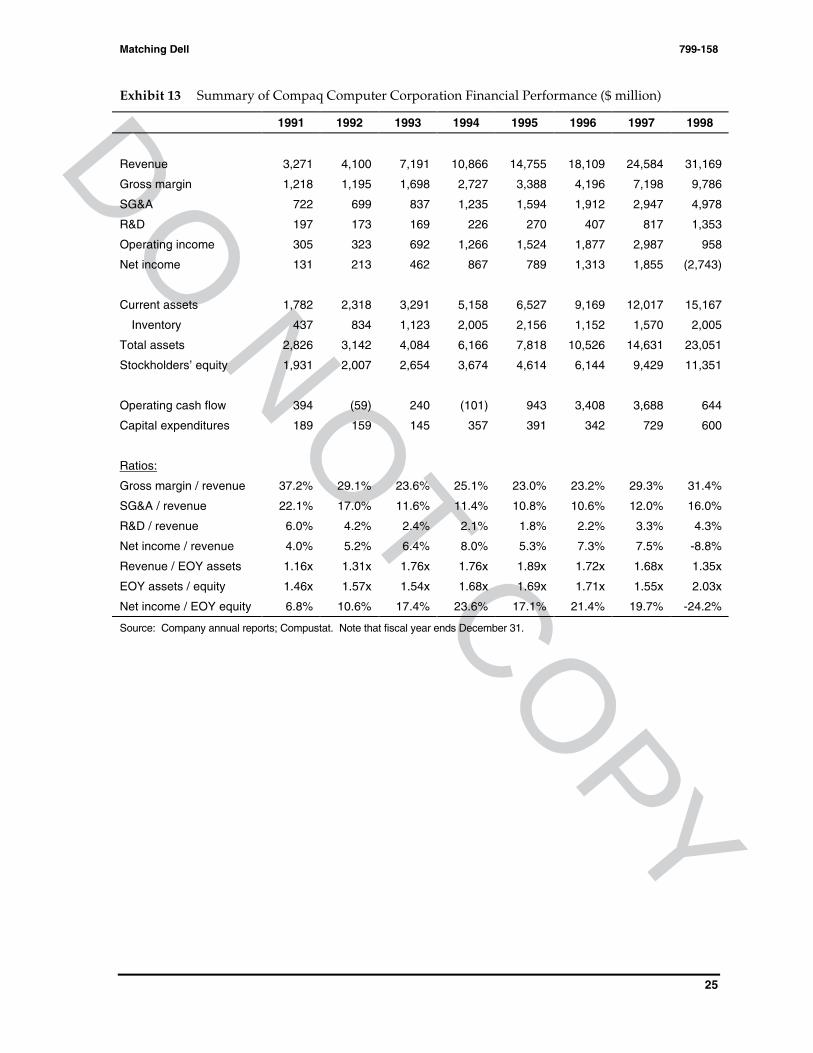
Exhibit 13 provides financial information for Compaq. Prior to recent acquisitions, PCsconstituted virtually all of Compaq’s revenue. According to analysts, Compaq relied heavily onprofits from its PC server business. In February of 1998, IBM cut its server prices sharply, passingalong cost savings made possible by its efforts to streamline production and distribution. In March,Compaq announced that it would break even in the first quarter of 1998 rather than post a profitexpected to exceed $500 million.81
Hewlett-Packard. Hewlett-Packard (HP) was founded in 1939 as a maker of scientificinstruments but, by 1998, offered a broad range of scientific equipment, computers, printers, andother computer peripherals. In the PC business, HP maintained a reputation for high quality andperformance and sold to more demanding customers. Its product range was comparable toCompaq’s, but it earned a smaller portion of its revenue from the low end of the consumer andbusiness markets. The company sold 75% of its PCs through distributors and resellers, 23% throughretail channels, and less than 1% directly to customers via its sales force.
In September of 1997, shortly after Compaq announced its ODM program, HP unveiled asimilar Extended Solutions Partnership Program (ESPP). Under ESPP, HP would build largecorporate orders to customer specifications in its factories. Orders would be delivered to resellers or,at the reseller’s request, shipped directly to the customer. Ten channel partners would completeassembly of some HP machines. A Web site would allow customers to order products over theInternet for delivery through resellers. HP hoped that the program would allow it to reduce priceprotection to two weeks, cut down defects, and shave 5% - 15% off of its prices.82
HP courted distributors and resellers and steadfastly refused to attach the word “direct” toany of its efforts related to business customers. Even before Compaq announced its DirectPlusprogram, 59% of resellers reported that they were more willing to promote HP products as a result ofIBM’s and Compaq’s movement toward direct sales.83 Following the DirectPlus announcement, HPinitiated an advertising campaign aimed at resellers to small and midsize businesses and announcedincentives for resellers to switch from Compaq to HP products. Duncan Campbell, HP’s worldwidegroup marketing manager for personal systems, explained, “We are pleased that Compaq is goingdirect. They have made a bad call, and the channel should make them pay.”84
Nonetheless, in October 1998, HP launched a modest effort to set up direct sales on the WorldWide Web.85 HP Shopping Village, a web service previously providing refurbished HP computers toindividuals, was expanded to allow consumers to buy new PCs directly from HP. Business customerscould use a similar web site to purchase HP PCs, but like IBM’s web site, HP’s required businesscustomers to complete purchases through resellers. Lew Platt, CEO of HP, hinted that businesscustomers might not have to go through resellers in the future: “You can’t ignore what Dell hasdone…. I could give you a list of names of really large customers who have said to HP, ‘Either dobusiness with us directly or you are not going to do business with us.’”86
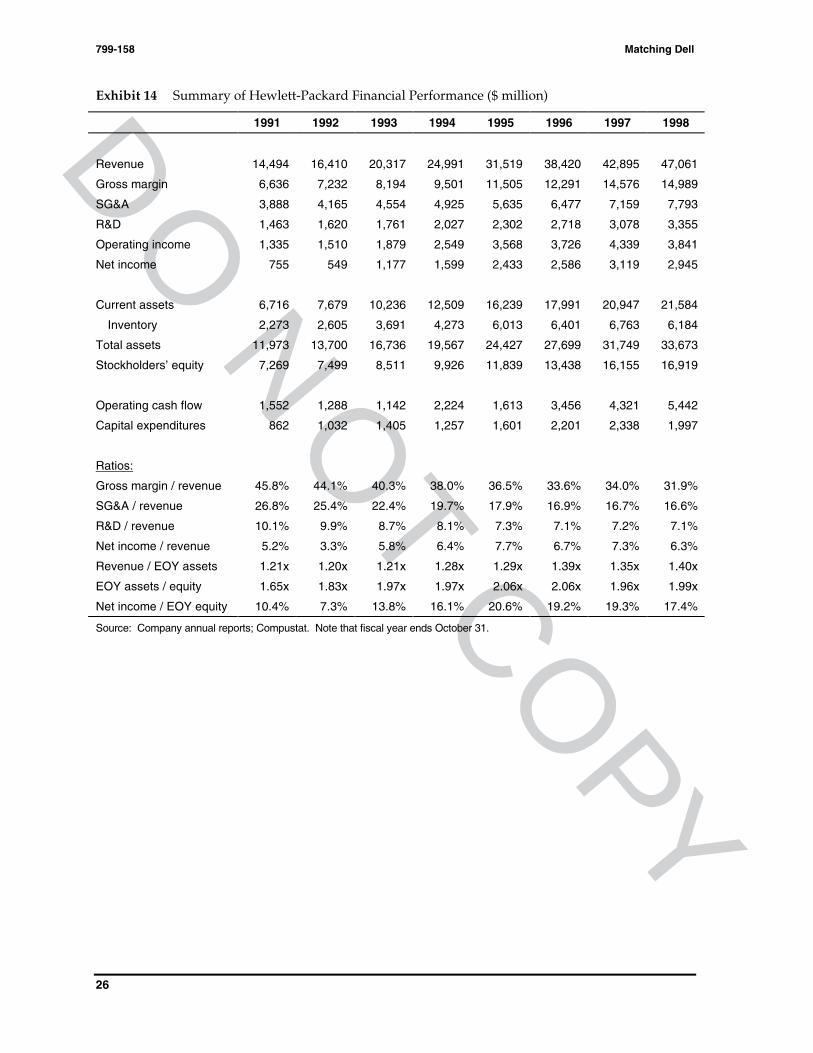
Exhibit 14 provides financial information for Hewlett-Packard. Personal computersconstituted 20-25% of corporate revenue in 1998 and earned an operating margin estimated at 3%.87
DO
NO
T COPY
Matching Dell 799-158
13
Gateway 2000. Founded in an Iowa farmhouse in 1985, Gateway 2000 was the world’ssecond largest direct marketer of PCs, trailing only Dell. Like Dell, Gateway took orders fromcustomers, produced PCs to their specifications, loaded software on the PCs, and shipped machinesdirectly to customers. The company maintained a force of inside and some outside sales reps,provided extensive telephone- and Web-based technical support, and contracted with third-partiesfor on-site technical service. The company prided itself on efficient, high-quality manufacturingfacilities in South Dakota, Virginia, Utah, and Malaysia and reported that it was usually among thefirst PC makers to introduce the latest Intel microprocessors.
Gateway’s product line ranged from sub-$1,000 PCs to servers and workstations. Its corecustomers were sophisticated home and small office users, and accordingly, its sales of bothinexpensive and high-end PCs were relatively modest. In 1998, 58% of Gateway’s sales were to homeand small office computer users, 28% to businesses, and 13% to educational and governmentinstitutions.88 Roughly a third of Gateway’s revenue from business customers came from smallbusinesses. The company’s advertisements—in newspapers, family-oriented magazines, andcomputer trade publications as well as on television—featured its mascots, a set of Holstein cows.Black and white Holstein spots were featured on Gateway’s distinctive packaging.
Gateway grew at annual clip of 39% from 1991 to 1996 and surpassed Dell’s U.S. sales brieflyin 1994. In 1997, however, sales growth slowed to 25%, and net income fell by half. Attempts to clearexcess inventory, charges related to an acquisition, and an aborted effort to develop a new customerinformation system were said to have contributed to the decline in profits.
Slowing growth prompted a number of initiatives. The 1997 acquisition of Advanced LogicResearch eased Gateway’s entry into the PC server business. At the same time, the firm set upGateway Major Accounts, Inc., a company within the company, to service large corporate,government, and educational accounts. The company also opened 144 Gateway Country Stores,retail showrooms, in the United States in 1997 and 1998. In the stores, customers could view Gatewayproducts and place orders. The stores did not stock products.
In 1998, Gateway scaled back its brief efforts to lure major accounts and refocused its energyon small businesses. Observers reported that “Gateway couldn’t afford to pay for the expanded salesteam it needed to knock on the doors of big corporate clients.”89 A new division, Gateway Partners,was slated to work with resellers.90 The firm also removed the Holstein cows from its ads and movedits administrative headquarters—including its IT services, marketing, and finance divisions—fromNorth Sioux City, South Dakota, to San Diego, California. The company had tried but failed to fillroughly 250 job openings in South Dakota.
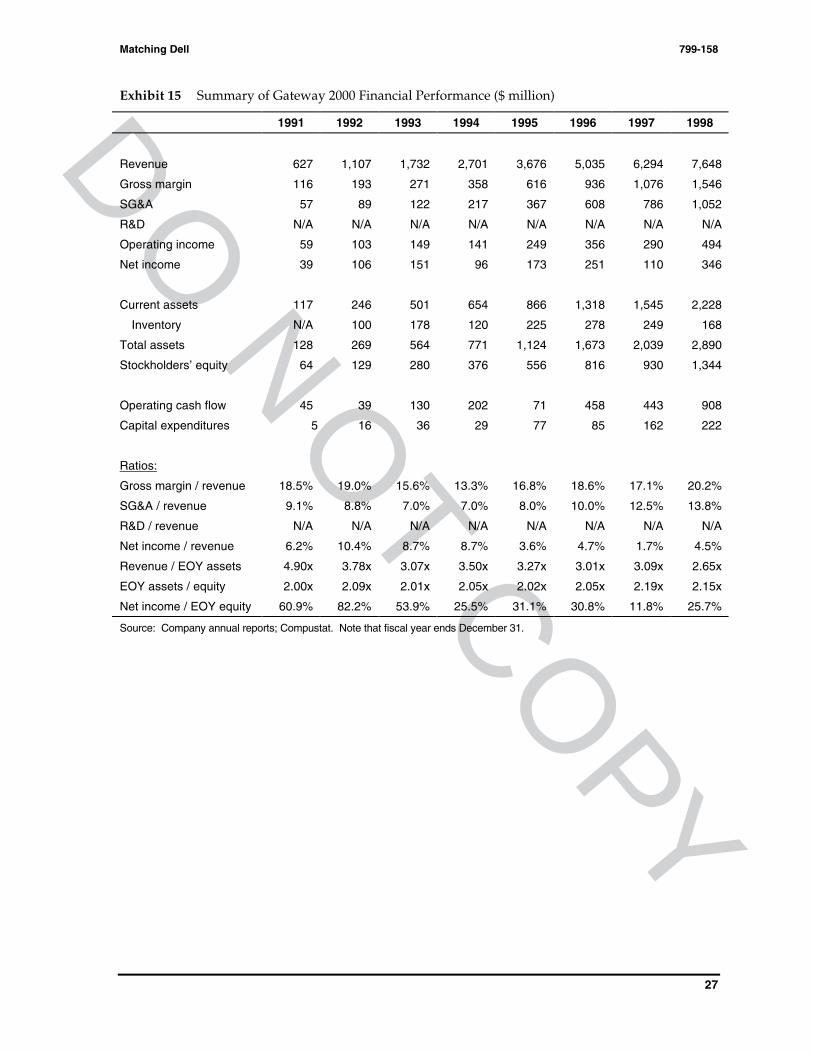
Exhibit 15 provides financial information for Gateway.
Recent Developments
In late 1998, Dell claimed that its advantage in inventory turnover remained very large,91 butthe price differential between Dell’s products and its competitors’ had all but vanished.92
Manufacturer and channel inventories for PCs from Dell’s rivals were declining as planned, butavailability was now a problem. Customers reported that they could not obtain certain models ofIBM PCs and, to a lesser extent, Compaq PCs.93 A skeptic of channel assembly argued, “There are somany mechanics involved in this and so many egos to go with it. You have to change cultures beforethis will work.”94
An observer of the channel reported that “a number of [distributors, resellers, and retailersare] exploring ‘strategic alternatives’ as a direct result of moves by these manufacturers.”95 MicroAge,

DO
NO
T COPY
799-158 Matching Dell
14
one of the resellers that had set up assembly operations, had established the brand name “Pinacor”for its distribution operation. Its assembly facility was allegedly running at 25% capacity in late1998.96 The retailer CompUSA had started to sell inexpensive computers under its own brand name.97
In public statements, Dell’s senior management appeared unconcerned about the efforts of itsrivals. “The things HP, IBM, and company have done have added more credibility to us thananything we could have done,” said Vice Chairman Morton Topfer.98 Concerning Compaq’s plan tosell direct, Michael Dell joked, “It’s like we’re the best baseball player and Compaq is the bestbasketball player. Now they want to play baseball.”99
DO
NO
T COPY
Matching Dell 799-158
15
Exhibit 1 PC Market Size, 1982 – 1998
82 84 86 88 90 91 92 93 94 95 96 97 98
United States
Units (mm) 3.0 6.7 6.9 8.7 9.5 9.5 11.8 15.6 18.7 23.0 26.5 31.5 36.3
Dollars (bn) 4.5 12.8 14.5 20.6 23.3 22.0 24.6 30.1 37.4 53.9 64.8 70.0 74.6
Worldwide
Units (mm) 23.8 25.8 30.8 39.0 47.0 58.9 69.2 79.9 90.3
Dollars (bn) 60.9 59.8 63.7 73.1 100 131 161 170 170
Source: International Data Corporation
Exhibit 2a PC Market Shares in the United States, 1980 – 1998 (unit share, in percent)
80 83 87 89 90 91 92 93 94 95 96 97 98
Apple 29.3 20.0 14.0 10.7 10.9 13.7 13.2 13.4 11.5 10.6 6.4 4.1 4.6
AST/Tandy 37.6 5.0 2.0 1.7 1.8 2.7 2.8 4.0 3.5 2.3 2.4 - -
Compaq - - 7.5 4.4 4.5 4.1 5.7 9.4 11.7 10.8 12.9 16.0 16.7
Dell - - - 0.9 1.0 1.6 3.7 4.8 4.2 4.9 6.8 9.3 13.2
Gateway - - - 0.2 1.0 2.5 3.6 4.3 5.1 5.1 6.1 7.1 8.4
HP 5.3 - - - - - - - 2.4 3.8 5.3 6.6 7.8
IBM - 42.0 28.0 16.9 16.1 14.1 11.7 13.0 8.7 7.9 8.3 8.7 8.2
Packard Bell - - - 3.3 3.9 4.7 5.3 6.4 14.3 14.4 11.4 8.8 6.2
Others 27.8 33.0 48.5 61.9 60.8 56.6 54.0 44.7 38.6 40.2 40.4 39.4 34.9
Source: Data for 1980-91 from Das Narayandas and V. Kasturi Rangan, “Dell Computer Corporation,” HBS Case 596-058. Datafor 1992-98 from International Data Corporation
Exhibit 2b PC Market Shares Worldwide, 1990 – 1998 (unit share, in percent)
90 91 92 93 94 95 96 97 98 Headquarters
Acer - - - - 2.8 3.6 4.1 3.5 3.1 Taiwan
Apple 7.1 9.6 9.0 9.4 8.5 8.0 5.4 3.2 3.4 California
AST/Tandy 2.7 1.9 1.9 3.0 3.0 - - - - California
Compaq 3.6 3.4 5.1 7.9 10.3 10.0 10.5 12.7 14.7 Texas
Dell - - 2.3 3.0 2.8 3.2 4.3 5.9 8.6 Texas
Gateway - - - 1.8 - - - 3.4 4.0 South Dakota / California
HP - - - 1.8 2.8 3.5 4.3 5.6 6.3 California
IBM 12.7 11.1 10.4 10.8 8.7 8.2 8.9 9.0 8.8 New York
Packard Bell - 2.0 2.3 2.9 7.1 7.3 6.1 5.2 4.2 California
Toshiba - 2.6 2.0 2.0 2.5 2.5 3.9 4.1 3.5 Japan
Others 73.9 69.4 67 57.4 51.5 53.7 52.5 47.4 43.4
Source: International Data Corporation
DO
NO
T COPY
799-158 Matching Dell
16
Exhibit 3a U.S. PC Sales by Customer Category (market share by dollar value)
1994 1995 1996 1997 1998
Large / midsize business& government
45.0% 47.4% 44.6% 43.1% 42.3%
Small business & office 24.3% 22.7% 24.8% 24.1% 23.7%
Consumers (home) 27.4% 34.7% 32.6% 28.0% 28.7%
Education 3.2% 5.2% 5.0% 4.8% 5.4%
Total market size ($ bn) 37.4 53.8 64.7 70.3 74.6
Exhibit 3b U.S. PC Sales by Customer Category (market share by units)
1994 1995 1996 1997 1998Q2
Large / midsize business& government
39.8% 32.0% 34.7% 38.3% 38.5%
Small business & office 24.0% 22.2% 23.8% 23.3% 22.8%
Consumers (home) 32.7% 39.7% 36.8% 33.7% 32.8%
Education 3.6% 6.0% 4.8% 4.8% 5.8%
Total market size(millions of units)
18.7 23.0 26.5 31.5 36.3
Source: International Data Corporation
Exhibit 4 Portion of Sales Through Each Channel by Region, 1998 (by dollar value)
Channel Americas Europe / ME /Africa Asia / Pacific / ROW
Retail 21.7% 17.1% 26.4%
Distributor / Reseller 41.2% 63.3% 49.2%
Direct 29.7% 17.8% 23.5%
Catalog, Phone, Online 17.8% 9.7% 3.1%
Sales Representatives 11.9% 8.1% 20.4%
Other 7.4% 1.8% 0.8%
Source: International Data Corporation
DO
NO
T COPY
Matching Dell 799-158
17
Exhibit 5 Approximate Manufacturing Cost Structure of a Basic Personal Computer
Components Cost
Microprocessor $50 - 600
Motherboard, hard drive, memory, chassis, power, packaging $250 - 350
Keyboard, mouse, modem, CD-ROM and floppy disk drives,speakers
$90 - 140
Monitor $100
Windows 98 $50
Assembly labor $50
Total On average, $800-900
Source: Mary Kwak and David B. Yoffie, “Apple Computer 1999,” HBS Case 799-108, pp. 7-8.
DO
NO
T COPY
799-158 Matching Dell
18
Exhibit 6 Summary of Dell Computer Corporation Financial Performance ($ million)
1992 1993 1994 1995 1996 1997 1998 1999
Revenue 890 2,014 2,873 3,475 5,296 7,759 12,327 18,243
Gross margin 282 449 433 738 1,067 1,666 2,722 4,106
SG&A 182 268 423 424 595 826 1,202 1,788
R&D 33 42 49 65 95 126 204 272
Operating income 69 139 (39) 249 377 714 1,316 2,046
Net income 51 102 (36) 149 272 518 944 1,460
Current assets 512 853 1,048 1,470 1,957 2,747 3,912 6,339
Inventory 127 303 220 293 429 251 233 273
Total assets 560 927 1,140 1,594 2,148 2,993 4,268 6,877
Stockholders’ equity 274 369 471 652 973 1,085 1,293 2,321
Operating cash flow 0 (39) 113 243 175 1,362 1,592 2,346
Capital expenditures 33 47 48 64 101 114 187 296
Ratios:
Gross margin / revenue 31.7% 22.3% 15.1% 21.2% 20.1% 21.5% 22.1% 22.5%
SG&A / revenue 20.4% 13.3% 14.7% 12.2% 11.2% 10.6% 9.8% 9.8%
R&D / revenue 3.7% 2.1% 1.7% 1.9% 1.8% 1.6% 1.7% 1.5%
Net income / revenue 5.7% 5.1% -1.3% 4.3% 5.1% 6.7% 7.7% 8.0%
Revenue / EOY assets 1.59x 2.17x 2.52x 2.18x 2.47x 2.59x 2.89x 2.65x
EOY assets / equity 2.04x 2.51x 2.42x 2.45x 2.21x 3.71x 3.30x 2.96x
Net income / EOY equity 18.6% 27.6% -7.6% 22.9% 28.0% 64.3% 73.0% 62.9%
Source: Company annual reports; Compustat. Note that fiscal year ends January 31; consequently, “1999” results arepredominantly for calendar year 1998.
Exhibit 7 Dell Margins in Direct and Retail Channels in 1994
Dell Direct Dell Retail
Price 100.0 88.0
Cost of sales 81.0 81.0
Gross margins 19.0 7.0
Operating expense 14.0 10.0
Operating income 5.0% -3.0%
Source: Das Narayandas and V. Kasturi Rangan, “Dell Computer Corporation,” HBS Case 596-058, p. 11.
DO
NO
T COPY
Matching Dell 799-158
19
Exhibit 8 Ratings of PC Vendors by Corporate Managers with PC-buying Responsibility
Dell Compaq IBM Gateway HP
User satisfaction
Overall 1st 4th 5th 2nd 3rd
At high price point 2nd 2nd 5th 4th 1st
At midrange price point 2nd 3rd 5th 1st 4th
At low price point 2nd 3rd 5th 1st 4th
Raw technology
System speed 1st 3rd 5th 2nd 3rd
Reliability 1st 2nd 4th 4th 3rd
Compatibility 1st 5th 3rd 1st 4th
Configurability 1st 5th 3rd 1st 4th
Upgrades 1st 3rd 5th 2nd 4th
Hardware quality 1st 4th 5th 3rd 2nd
System management 1st 4th 5th 2nd 2nd
Pricing
1998 price cuts 2nd 5th 2nd 1st 4th
Price 2nd 3rd 5th 1st 4th
Value 2nd 4th 5th 1st 4th
Cost of in-house support 2nd 5th 3rd 1st 4th
Ownership costs 1st 4th 5th 1st 3rd
Service and support
Warranties 2nd 4th 3rd 1st 5th
Support staff 1st 5th 3rd 1st 4th
Repair times 2nd 4th 3rd 1st 5th
Channel-based support 3rd 5th 4th 2nd 1st
Web-based support 1st 3rd 5th 3rd 2nd
Overall service / support 1st 4th 5th 2nd 3rd
Customer relationship
Vendor reputation 2nd 4th 3rd 5th 1st
Technical direction 2nd 4th 5th 3rd 1st
Overall comfort with vendor 2nd 4th 5th 3rd 1st
Source: James Connolly, Kevin Burden, and Amy Malloy, “Direct Hit,” Computerworld, November 16, 1998, pp. 81-88. Based onsurvey of 1,447 corporate managers with PC-buying responsibility for an average of 1,340 users each.
DO
NO
T COPY
799-158 Matching Dell
20
Exhibit 9 Ratings of High-end Desktop PCs by Consumer Reports
Ran
k
Maker
Mo
del
Price
Sp
eed
Mu
ltimed
iasu
itability
Ease o
fu
pg
rade
Qu
ality of
man
uals
So
ftware
clutter
En
ergy
efficiency
Qu
ality of
disp
lay1 Dell Dimension XPS $2,400 � � � � � � �
2 Gateway G6-266 $2,647 � � � � � � �
3 HP Pavilion 8180 $2,800 � � � � � � �
4 Toshiba Infinia 7230 $2,200 � � � � � � �
5 Sony VAIO PCV-150 $2,200 � � � � � � �
6 IBM Aptiva L61 $2,530 � � � � � � �
7 Compaq Presario 4850 $2,950 � � � � � � �
8 HP Pavilion 8160 $2,200 � � � � � � �
9 Compaq Presario 4814 $2,100 � � � � � � �
10 NEC Ready 9753 $2,080 � � � � � � �
� = excellent. � = very good. � = good. � = fair. � = poor.
Source: Consumer Reports, “Do You Need All That Speed?” January 1998, pp. 39-42.
DO
NO
T COPY
799-
158
-
21-
Exh
ibit
10a
Pri
ces
of C
ompa
rabl
e P
Cs
Con
figu
red
for
the
Con
sum
er M
arke
t
96Q
196
Q2
96Q
396
Q4
97Q
197
Q2
97Q
397
Q4
98Q
198
Q2
98Q
398
Q4
Con
figur
atio
n
Mic
ropr
oces
sor
clo
cksp
eed
(MH
z)13
313
316
616
620
0 M
MX
200
MM
XP
II-23
3P
II-23
3P
II-26
6P
II-26
6P
II-35
0P
II-40
0
Mem
ory
(MB
)16
1616
3232
3232
3264
6464
64
Har
d dr
ive
(GB
)1-
21-
21-
22+
3+3+
4+6+
6+6+
6+8+
Mon
itor
size
(in
ches
)17
1717
1717
1717
1717
1717
17
Bun
dled
sof
twar
e?Y
YY
YY
YY
YY
YY
Y
LAN
car
d?N
NN
NN
NN
NN
NN
N
CD
-RO
M6X
6X6X
8X12
X+
12X
+12
X+
12X
+12
X+
12X
+12
X+
32X
+
Mod
em s
peed
(kB
/sec
)28
.828
.828
.833
.633
.633
.6+
56K
56K
56K
56K
56K
56K
Spe
aker
s?Y
YY
YY
YY
YY
YY
Y
Pric
e ($
)
Com
paq
3,29
93,
234
2,94
92,
624
2,84
92,
560
3,01
42,
523
2,44
81,
539
1,64
91,
575
Del
l2,
848
2,26
42,
296
2,21
72,
290
2,03
92,
059
2,00
51,
838
1,66
01,
606
1,60
6
Gat
eway
2,43
92,
079
2,39
92,
179
2,16
42,
139
2,03
91,
883
1,82
51,
575
1,42
31,
546
HP
3,19
82,
478
2,94
82,
799
3,04
92,
660
2,91
42,
658
2,45
91,
590
1,90
01,
808
IBM
3,41
82,
848
3,14
92,
899
2,97
42,
640
N/A
2,57
92,
348
1,56
01,
722
1,70
9
Sou
rce:
Jam
es P
oyne
r an
d Ja
mes
Ber
lino,
CIB
C W
orld
Mar
kets
Qua
rter
ly P
rice
Sur
vey
Abb
revi
atio
ns: M
Hz
= m
egah
ertz
, MB
= m
egab
yte,
GB
= g
igab
yte,
LA
N =
loca
l acc
ess
netw
ork,
kB
/sec
= k
iloby
te p
er s
econ
d, P
II =
Pen
tium
II, M
MX
= m
ultim
edia
enh
ance
d, Y
= y
es, N
= n
o
DO
NO
T COPY
799-
158
-
22-
Exh
ibit
10b
Pric
es o
f Com
para
ble
PCs
Con
figu
red
for
the
Bus
ines
s M
arke
t
96Q
196
Q2
96Q
396
Q4
97Q
197
Q2
97Q
397
Q4
98Q
198
Q2
98Q
398
Q4
Con
figur
atio
n
Mic
ropr
oces
sor
clo
cksp
eed
(MH
z)13
313
316
616
620
020
0 M
MX
PII-
233
PII-
233
PII-
266
PII-
266
PII-
350
PII-
400
Mem
ory
(MB
)16
1616
1632
3232
3232
3264
64
Har
d dr
ive
(GB
)1-
21-
21-
21-
21-
22+
4+2-
42-
42-
48
8+
Mon
itor
size
(in
ches
)15
1515
1517
1717
1717
1717
17
Bun
dled
sof
twar
e?N
NN
NN
NN
NN
NN
N
LAN
car
d?Y
YY
YY
YY
YY
YY
Y
CD
-RO
M4X
4X4x
-8x
6x+
8X+
12X
+12
X+
12X
+12
X+
12X
+12
X+
32X
+
Mod
em?
NN
NN
NN
NN
NN
NN
Spe
aker
s?N
NN
NN
NN
NN
NN
N
Pric
e ($
)
Com
paq
3,07
72,
827
2,80
82,
728
3,01
02,
854
3,05
62,
553
2,04
01,
659
2,01
81,
932
Del
l2,
555
2,42
02,
196
2,08
12,
428
2,48
92,
620
2,08
42,
023
1,85
82,
030
1,99
6
Gat
eway
2,20
81,
758
1,94
31,
743
2,17
22,
013
2,11
81,
656
1,49
91,
324
1,56
01,
762
HP
3,49
72,
927
2,63
72,
433
2,91
02,
788
3,01
42,
205
2,40
02,
101
1,95
92,
129
IBM
3,20
52,
828
2,81
62,
694
2,98
52,
748
2,98
72,
514
2,31
01,
937
1,88
91,
959
Sou
rce:
Jam
es P
oyne
r an
d Ja
mes
Ber
lino,
CIB
C W
orld
Mar
kets
Qua
rter
ly P
rice
Sur
vey
Abb
revi
atio
ns: M
Hz
= m
egah
ertz
, MB
= m
egab
yte,
GB
= g
igab
yte,
LA
N =
loca
l acc
ess
netw
ork,
PII
= P
entiu
m II
, MM
X =
mul
timed
ia e
nhan
ced,
Y =
yes
, N =
no
DO
NO
T COPY
Matching Dell 799-158
23
Exhibit 11 Comparisons of Major PC Manufacturers (All figures 1998 unless noted otherwise)
Dell Compaq IBM HP Gateway
Corporate revenue ($bn) 18.2 31.2 81.7 47.1 7.6
Value of PC sales ($bn) 17.7 27.9 16.9 11.8 7.1
Value of PC sales / corporate revenue 96.8% 89.4% 20.7% 25.0% 92.8%
Worldwide PC market share ($) 10.4% 16.4% 9.9% 6.9% 4.2%
Worldwide PC market share (units) 8.6% 14.7% 8.8% 6.3% 4.0%
Worldwide average selling price ($) 2,271 2,100 2,127 2,054 1,961
U.S. PC market share ($) 15.1% 16.6% 9.1% 7.9% 8.1%
U.S. PC market share (units) 13.2% 16.7% 8.2% 7.8% 8.4%
U.S. average selling price ($) 2,343 2,047 2,278 2,088 1,982
U.S. / worldwide PC sales 63.7% 44.4% 40.2% 50.0% 84.9%
CAGR of worldwide PC business, 1994-1998
Value 51.9% 24.3% 12.9% 40.1% 27.3%
Units 56.2% 28.7% 18.0% 44.8% 36.5%
Corporate financialsReturn on sales 8.0% -8.8% 7.7% 6.3% 4.5%
Sales-to-assets ratio 2.65x 1.35x 0.95x 1.40x 2.65x
Assets-to-equity ratio 2.96x 2.03x 4.43x 1.99x 2.15x
Return on equity 62.9% -24.2% 32.6% 17.4% 25.7%
Return on invested capital (1997) 186% 35% 13% 16% 45%
Days of inventory 7.0 34.2 49.4 70.4 10.0
Cost structureAdvertising / sales 1.1% 1.1% 2.1% 2.6% N/A
R&D / sales 1.5% 4.3% 6.2% 7.1% N/A
SG&A / sales 9.8% 16.0% 20.4% 16.6% 13.8%
PC sales by channel (units; worldwide)Direct 86.6% 4.4% 7.5% 0.6% 90.3%
Catalog, Phone, Online 37.4% 3.3% 2.4% 0.0% 88.4%
Sales Representatives 49.2% 1.1% 5.1% 0.6% 1.9%
Distributor / reseller 6.9% 66.6% 69.6% 75.1% 4.7%
Retail 0.0% 24.6% 18.4% 23.2% 1.0%
Other 6.5% 4.4% 4.6% 1.2% 4.0%
PC sales by customer category (units; worldwide)
Home & small office 18.3% 28.5% 30.6% 33.3% 58.2%
Small & midsize business 37.0% 32.6% 32.7% 30.8% 19.1%
Large business 33.6% 27.5% 26.0% 27.2% 9.3%
Government 6.4% 6.0% 6.2% 5.9% 5.1%
Education 4.6% 5.3% 4.6% 2.8% 8.2%
Stock appreciation, 12/30/94-12/31/98 5,617% 432% 402% 174% 374%
Sources: International Data Corporation; Company Annual Reports. Note: Percentages may not equal 100% due to rounding.
DO
NO
T COPY
799-158 Matching Dell
24
Exhibit 12 Summary of International Business Machines Financial Performance ($ million)
1991 1992 1993 1994 1995 1996 1997 1998
Revenue 64,792 64,523 62,716 64,052 71,940 75,947 78,508 81,667
Gross margin 37,467 38,675 29,926 29,481 24,322 34,215 34,627 43,282
SG&A 22,977 20,965 19,409 15,916 16,766 16,854 16,634 16,662
R&D 5,001 5,083 4,431 4,363 4,170 4,654 4,877 5,046
Operating income 4,340 3,406 308 5,005 9,919 9,031 9,098 9,164
Net income (2,827) (4,965) (8,101) 3,021 4,178 5,429 6,093 6,328
Current assets 40,969 39,693 39,202 41,338 40,691 40,695 40,418 42,360
Inventory 9,844 8,385 7,565 6,334 6,323 5,870 5,139 5,200
Total assets 92,473 86,705 81,113 81,091 80,292 81,132 81,499 86,100
Stockholders’ equity 37,006 27,624 19,738 23,413 22,423 21,628 19,816 19,433
Operating cash flow 6,725 6,274 8,327 11,793 10,708 10,275 8,865 9,273
Capital expenditures 6,497 4,751 3,154 3,078 4,744 5,883 6,793 6,520
Ratios:
Gross margin / revenue 57.8% 59.9% 47.7% 46.0% 33.8% 45.1% 44.1% 53.0%
SG&A / revenue 35.5% 32.5% 30.9% 24.8% 23.3% 22.2% 21.2% 20.4%
R&D / revenue 7.7% 7.9% 7.1% 6.8% 5.8% 6.1% 6.2% 6.2%
Net income / revenue -4.4% -7.7% -12.9% 4.7% 5.8% 7.1% 7.8% 7.7%
Revenue / EOY assets 0.70x 0.74x 0.77x 0.79x 0.90x 0.94x 0.96x 0.95x
EOY assets / equity 2.50x 3.14x 4.11x 3.46x 3.58x 3.75x 4.11x 4.43x
Net income / EOY equity -7.6% -18.0% -41.0% 12.9% 18.6% 25.1% 30.7% 32.6%
Source: Company annual reports; Compustat. Note that fiscal year ends December 31.
DO
NO
T COPY
Matching Dell 799-158
25
Exhibit 13 Summary of Compaq Computer Corporation Financial Performance ($ million)
1991 1992 1993 1994 1995 1996 1997 1998
Revenue 3,271 4,100 7,191 10,866 14,755 18,109 24,584 31,169
Gross margin 1,218 1,195 1,698 2,727 3,388 4,196 7,198 9,786
SG&A 722 699 837 1,235 1,594 1,912 2,947 4,978
R&D 197 173 169 226 270 407 817 1,353
Operating income 305 323 692 1,266 1,524 1,877 2,987 958
Net income 131 213 462 867 789 1,313 1,855 (2,743)
Current assets 1,782 2,318 3,291 5,158 6,527 9,169 12,017 15,167
Inventory 437 834 1,123 2,005 2,156 1,152 1,570 2,005
Total assets 2,826 3,142 4,084 6,166 7,818 10,526 14,631 23,051
Stockholders’ equity 1,931 2,007 2,654 3,674 4,614 6,144 9,429 11,351
Operating cash flow 394 (59) 240 (101) 943 3,408 3,688 644
Capital expenditures 189 159 145 357 391 342 729 600
Ratios:
Gross margin / revenue 37.2% 29.1% 23.6% 25.1% 23.0% 23.2% 29.3% 31.4%
SG&A / revenue 22.1% 17.0% 11.6% 11.4% 10.8% 10.6% 12.0% 16.0%
R&D / revenue 6.0% 4.2% 2.4% 2.1% 1.8% 2.2% 3.3% 4.3%
Net income / revenue 4.0% 5.2% 6.4% 8.0% 5.3% 7.3% 7.5% -8.8%
Revenue / EOY assets 1.16x 1.31x 1.76x 1.76x 1.89x 1.72x 1.68x 1.35x
EOY assets / equity 1.46x 1.57x 1.54x 1.68x 1.69x 1.71x 1.55x 2.03x
Net income / EOY equity 6.8% 10.6% 17.4% 23.6% 17.1% 21.4% 19.7% -24.2%
Source: Company annual reports; Compustat. Note that fiscal year ends December 31.
DO
NO
T COPY
799-158 Matching Dell
26
Exhibit 14 Summary of Hewlett-Packard Financial Performance ($ million)
1991 1992 1993 1994 1995 1996 1997 1998
Revenue 14,494 16,410 20,317 24,991 31,519 38,420 42,895 47,061
Gross margin 6,636 7,232 8,194 9,501 11,505 12,291 14,576 14,989
SG&A 3,888 4,165 4,554 4,925 5,635 6,477 7,159 7,793
R&D 1,463 1,620 1,761 2,027 2,302 2,718 3,078 3,355
Operating income 1,335 1,510 1,879 2,549 3,568 3,726 4,339 3,841
Net income 755 549 1,177 1,599 2,433 2,586 3,119 2,945
Current assets 6,716 7,679 10,236 12,509 16,239 17,991 20,947 21,584
Inventory 2,273 2,605 3,691 4,273 6,013 6,401 6,763 6,184
Total assets 11,973 13,700 16,736 19,567 24,427 27,699 31,749 33,673
Stockholders’ equity 7,269 7,499 8,511 9,926 11,839 13,438 16,155 16,919
Operating cash flow 1,552 1,288 1,142 2,224 1,613 3,456 4,321 5,442
Capital expenditures 862 1,032 1,405 1,257 1,601 2,201 2,338 1,997
Ratios:
Gross margin / revenue 45.8% 44.1% 40.3% 38.0% 36.5% 33.6% 34.0% 31.9%
SG&A / revenue 26.8% 25.4% 22.4% 19.7% 17.9% 16.9% 16.7% 16.6%
R&D / revenue 10.1% 9.9% 8.7% 8.1% 7.3% 7.1% 7.2% 7.1%
Net income / revenue 5.2% 3.3% 5.8% 6.4% 7.7% 6.7% 7.3% 6.3%
Revenue / EOY assets 1.21x 1.20x 1.21x 1.28x 1.29x 1.39x 1.35x 1.40x
EOY assets / equity 1.65x 1.83x 1.97x 1.97x 2.06x 2.06x 1.96x 1.99x
Net income / EOY equity 10.4% 7.3% 13.8% 16.1% 20.6% 19.2% 19.3% 17.4%
Source: Company annual reports; Compustat. Note that fiscal year ends October 31.
DO
NO
T COPY
Matching Dell 799-158
27
Exhibit 15 Summary of Gateway 2000 Financial Performance ($ million)
1991 1992 1993 1994 1995 1996 1997 1998
Revenue 627 1,107 1,732 2,701 3,676 5,035 6,294 7,648
Gross margin 116 193 271 358 616 936 1,076 1,546
SG&A 57 89 122 217 367 608 786 1,052
R&D N/A N/A N/A N/A N/A N/A N/A N/A
Operating income 59 103 149 141 249 356 290 494
Net income 39 106 151 96 173 251 110 346
Current assets 117 246 501 654 866 1,318 1,545 2,228
Inventory N/A 100 178 120 225 278 249 168
Total assets 128 269 564 771 1,124 1,673 2,039 2,890
Stockholders’ equity 64 129 280 376 556 816 930 1,344
Operating cash flow 45 39 130 202 71 458 443 908
Capital expenditures 5 16 36 29 77 85 162 222
Ratios:
Gross margin / revenue 18.5% 19.0% 15.6% 13.3% 16.8% 18.6% 17.1% 20.2%
SG&A / revenue 9.1% 8.8% 7.0% 7.0% 8.0% 10.0% 12.5% 13.8%
R&D / revenue N/A N/A N/A N/A N/A N/A N/A N/A
Net income / revenue 6.2% 10.4% 8.7% 8.7% 3.6% 4.7% 1.7% 4.5%
Revenue / EOY assets 4.90x 3.78x 3.07x 3.50x 3.27x 3.01x 3.09x 2.65x
EOY assets / equity 2.00x 2.09x 2.01x 2.05x 2.02x 2.05x 2.19x 2.15x
Net income / EOY equity 60.9% 82.2% 53.9% 25.5% 31.1% 30.8% 11.8% 25.7%
Source: Company annual reports; Compustat. Note that fiscal year ends December 31.
DO
NO
T COPY
799-158 Matching Dell
28
Glossary100
Application: a program that helps a user accomplish a specific task, for example, a word processingprogram or a spreadsheet program. Application programs are distinguished from system programs,which control the computer and run the application programs, and utilities, which are small helperprograms.
Microprocessor: the semiconductor in a personal computer that performs mathematical and logicaloperations based on programmed instructions; the central processing unit in a PC.
Motherboard: the main circuit board inside a computer, which contains the microprocessor, memory,and other basic components. Additional boards, called daughter boards, can be plugged into themotherboard.
Operating system: the main control program of a computer that schedules tasks, manages storage,and handles communication with peripherals. The operating system presents a basic user interfacewhen no applications are open, and all applications must communicate with the operating system.
Random-access memory: the working memory of a computer. RAM is the memory used for storingdata temporarily while working on it, running application programs, and so forth. “Random access”refers to the fact that any area of RAM can be accessed directly and immediately, in contrast to othermedia such as a magnetic tape where the tape must be wound to the point where the data is.
Read-only memory: memory that can be read but not changed. Read-only memory holds its contentseven when a PC is turned off. Data is placed in ROM only once and stays there permanently.
Video card: a circuit board that enables a computer to display information on its screen. Theresolution, number of colors, and refresh rate of a monitor is determined by the kind of video cardused, plus the limitations of the monitor itself.
DO
NO
T COPY
Matching Dell 799-158
29
Notes
1 Evan Ramstad, “Dell Profit Jumps 62%, Beating Expectations,” Wall Street Journal, August 19, 1998, p. A3.2 “The Forbes 400: The Richest People in America,” Forbes, October 12, 1998, pp. 165-361.3 David Kirkpatrick, “Now Everyone in PCs Wants to Be Like Mike,” Fortune, September 8, 1997, pp. 91-92.
Steven Fortuna and Pamela Pappachan, “Compaq Reengineers the Channel: Will It Be Enough to Slow Dell’sMomentum?”, Deutsche Morgan Grenfell Technology Group, June 11, 1997. Andy Zisper, “In Search ofGreener Pastures, Gateway Moves on Dell’s Turf,” Barron’s, September 15, 1997, p. 10.
4 John MacIntyre, “Fact of Life: Computers,” Spirit, p. 170.5 Das Narayandas and V. Kasturi Rangan, “Dell Computer Corporation,” HBS Case 596-058.6 John Steffens, Newgames: Strategic Competition in the PC Revolution (Oxford: Pergamon Press, 1994), p. 181.7 Source either old case, Steffans, or other.8 James Chposky and Ted Leonsis, Blue Magic, New York: Facts on File Books, 1988, pp. 65-66.9 Das Narayandas and V. Kasturi Rangan, “Dell Computer Corporation,” HBS Case 596-058, p. 16.10 Lee Gomes, “Bigger and Smaller: Personal Computers Will Be a Lot More Powerful; But They May Not Be
Where the Action Is,” Wall Street Journal, November 16, 1998, p. R6.11 John Steffens, Newgames: Strategic Competition in the PC Revolution (Oxford: Pergamon Press, 1994), p. 253.12 Data from International Data Corporation.13 Andy Reinhardt, “Computers and Chips: Prognosis 1999,” Business Week, January 11, 1999, pp. 94-95.14 Mary Kwak and David B. Yoffie, “Apple Computer 1999,” Harvard Business School Case 799-108, p. 16.15 “Semiconductors: The Money and the Gorilla,” The Economist, December 5, 1998, p. 71.16 Microsoft Corporation, 1998 Annual Report and Brian Goodstadt, “Standard & Poor’s Industry Surveys,
Computers: Software,” March 12, 1999, pp. 9-10.17 Jeff Bliss, “Can NCs Live Up to Promise of Lower Cost?” Computer Reseller News, April 14, 1997.18 Roger Kay, analyst at International Data Corporation, April 22, 1999.19 Data from International Data Corporation.20 Kasturi Rangan and Marie Bell, “Dell Online,” HBS Case 598-116, pp. 7-8.21 Hassan Fattah, “1998 Forecast: The Channel Fights Back,” MC Technology Marketing Intelligence, January 1998.22 Hassan Fattah, “1998 Forecast: The Channel Fights Back,” MC Technology Marketing Intelligence, January 1998.23 Steven Fortuna and Pamela Pappachan, “Compaq Reengineers the Channel: Will It Be Enough to Slow Dell’s
Momentum?”, Deutsche Morgan Grenfell Technology Group, June 11, 1997. David Kirkpatrick, “NowEveryone in PCs Wants to Be Like Mike,” Fortune, September 8, 1997, pp. 91-92. Saul Hansell, “Is This theFactory of the Future?” New York Times, July 26, 1998.
24 Steven Fortuna and Pamela Pappachan, “Compaq Reengineers the Channel: Will It Be Enough to Slow Dell’sMomentum?”, Deutsche Morgan Grenfell Technology Group, June 11, 1997.
25 David B. Yoffie, “Apple Computer 1992,” Harvard Business School Case 792-081, p. 4.26 Walter J. Winnitzki, “PC Hardware Outlook,” Hambrecht and Quist, February 17, 1999.27 Mary Kwak and David B. Yoffie, “Apple Computer 1999,” Harvard Business School Case 799-108, p. 9.28 Michael Dell quoted in John R. Halbrooks, How to Really Deliver Superior Customer Service.29 http://www.dell.com/30 Das Narayandas and V. Kasturi Rangan, “Dell Computer Corporation,” HBS Case 596-058, p. 5.31 Joan Magretta, “The Power of Virtual Integration: An Interview With Dell Computer’s Michael Dell,” Harvard
Business Review, March-April 1998, p. 77.32 Joan Magretta, “The Power of Virtual Integration: An Interview With Dell Computer’s Michael Dell,” Harvard
Business Review, March-April 1998, p. 77.33 Dell Computer Corporation, Form 10-K, February 1, 1998, pp. 6-7.34 Das Narayandas and V. Kasturi Rangan, “Dell Computer Corporation,” HBS Case 596-058, p. 6. Dell
Computer Corporation Form 10-K, February 1, 1998, p. 6.35 Das Narayandas and V. Kasturi Rangan, “Dell Computer Corporation,” HBS Case 596-058, p. 5.36 Dell press release, “Dell PCs to be Offered Through Soft Warehouse Superstores—Expands Reach to
Individuals and Small Businesses,” September 10, 1990.37 Joan Magretta, “The Power of Virtual Integration: An Interview With Dell Computer’s Michael Dell,” Harvard
Business Review, March-April 1998, p. 78.38 Joan Magretta, “The Power of Virtual Integration: An Interview With Dell Computer’s Michael Dell,” Harvard
Business Review, March-April 1998, p. 78.
DO
NO
T COPY
799-158 Matching Dell
30
39 Scott Thurm, “Leading the PC Pack: Lots of Computer Companies Offer Services on the Web. Why Does Dell
Stand Out?” Wall Street Journal, December 7, 1998, p. R27. Dell takes orders totaling $3 million of sales per dayvia its Web site. Another $7 million per day involve customers who browse online, but order in other ways.
40 Kimberly Caisse, “Dell Uses Channel to Move System Inventory,” Computer Reseller News, January 12, 1998.41 Data from International Data Corporation.42 Kirk Ladendorf, “Dell Computer Works to Improve Custom Assembly Process,” Austin American-Statesman,
September 29, 1998.43 Kasturi Rangan and Marie Bell, “Dell Online,” HBS Case 598-116, p. 3.44 Kasturi Rangan and Marie Bell, “Dell Online,” HBS Case 598-116, p. 4.45 Dell Computer Corporation, Annual Report, 1998, p. 15.46 Dell Computer Corporation, Annual Report, 1998, p. 23.47 Dell Computer Corporation, Annual Report, 1998, p. 6.48 Kasturi Rangan and Marie Bell, “Dell Online,” HBS Case 598-116, p. 4.49 David Joachim, “Dell Links Virtual Supply Chain,” InternetWeek, November 2, 1998.50 Joan Magretta, “The Power of Virtual Integration: An Interview With Dell Computer’s Michael Dell,” Harvard
Business Review, March-April 1998, p. 76.51 Julie Borenstein, Stephan Feldgoise, Mike Harmon, Eric Jeck, and Steve Latham, “Austin, Texas—Silicon
Hills,” in Michael E. Porter, ed., Case Studies in Competition and Competitiveness, Harvard Business School, May1997.
52 Dell Computer Corporation, Form 10-K, February 1, 1998, pp. 7-8.53 Kasturi Rangan and Marie Bell, “Dell Online,” HBS Case 598-116, p. 4.54 Joan Magretta, “The Power of Virtual Integration: An Interview With Dell Computer’s Michael Dell,” Harvard
Business Review, March-April 1998, p. 75.55 Kevin Rollins, “Using Information to Speed Execution,” Harvard Business Review, March-April 1998, p. 81.56 Scott McCartney, “Michael Dell Shifts From Whiz to Wisdom,” Houston Chronicle, February 1, 1995.57 Kevin Rollins, “Using Information to Speed Execution,” Harvard Business Review, March-April 1998, p. 81.58 Dell Computer Corporation, Annual Report, 1997, p. 3.59 Steven Fortuna and Pamela Pappachan, “Compaq Reengineers the Channel: Will It Be Enough to Slow Dell’s
Momentum?”, Deutsche Morgan Grenfell Technology Group, June 11, 1997.60 Daniel Lyons, “Games Dealers Play,” Forbes, October 19, 1998, pp. 132-134.61 Steven Fortuna and Pamela Pappachan, “Compaq Reengineers the Channel: Will It Be Enough to Slow Dell’s
Momentum?”, Deutsche Morgan Grenfell Technology Group, June 11, 1997.62 Daniel Lyons, “Games Dealers Play,” Forbes, October 19, 1998, pp. 132-134.63 Steven Fortuna and Pamela Pappachan, “Compaq Reengineers the Channel: Will It Be Enough to Slow Dell’s
Momentum?”, Deutsche Morgan Grenfell Technology Group, June 11, 1997.64 Hassan Fattah, “1998 Forecast: The Channel Fights Back,” MC Technology Marketing Intelligence, January 1998.65 Steven Fortuna and Pamela Pappachan, “Compaq Reengineers the Channel: Will It Be Enough to Slow Dell’s
Momentum?”, Deutsche Morgan Grenfell Technology Group, June 11, 1997, p. 3.66 “IBM’s Ambra PC: A Lesson Learned,” Marketing, February 24, 1994. Jaikumar Vijayan, “IBM Cuts PC Force,
Kills Ambra Corp.,” Computerworld, August 1, 1994.67 “IBM Announces New Web Site, Enabling Customers to Purchase IBM PC Products Via the Internet,” IBM
press release, April 17, 1998.68 William M. Buckeley, “IBM Had ’98 PC Pretax Loss of Nearly $1 Billion,” Wall Street Journal, March 25, 1999.69 Gary McWilliams, Ira Sager, Paul G. Judge, and Peter Burrows, “Power Play,” Business Week, February 9, 1998,
pp. 90-97.70 Eric Nee, “Compaq Computer Corp.,” Forbes, January 12, 1998, pp. 90-94.71 Gary McWilliams, Ira Sager, Paul G. Judge, and Peter Burrows, “Power Play,” Business Week, February 9, 1998,
pp. 92.72 Gary McWilliams, “Computers: Mimicking Dell, Compaq to Sell its PCs Directly,” Wall Street Journal,
November 11, 1998, p. B1.73 Gary McWilliams, “Computers: Mimicking Dell, Compaq to Sell its PCs Directly,” Wall Street Journal,
November 11, 1998, p. B1.74 Saul Hansell, “Compaq Plans to Sell Directly to Consumers,” New York Times, November 11, 1998.75 David Kirkpatrick, “Now Everyone in PCs Wants to Be Like Mike,” Fortune, September 8, 1997, pp. 91-92.76 Robert P. Anastasi, Neal F. Johnson, J. Drennan Lane, and Stephanie L. Spinner, “The Computer Sales
Channel: Third Quarter Demand Survey,” Robinson-Humphrey, September 23, 1998.
DO
NO
T COPY
Matching Dell 799-158
31
77 Steven Fortuna and Pamela Pappachan, “Compaq Reengineers the Channel: Will It Be Enough to Slow Dell’s
Momentum?”, Deutsche Morgan Grenfell Technology Group, June 11, 1997.78 Dan Briody and Ed Scannell, “Direct Approach,” InfoWorld, June 15, 1998.79 Saul Hansell, “Compaq Plans to Sell Directly to Consumers,” New York Times, November 11, 1998. Rob Guth,
“Compaq Goes After Direct-sales Model,” InfoWorld, November 16, 1998, p. 10.80 “Mimicking Dell, Compaq to Sell Its PCs Directly to Customers,” Dow Jones Online News, November 11, 1998.81 Evan Ramsted, “Compaq Stumbles as PCs Weather New Blow,” Wall Street Journal, March 9, 1998, p. B1.82 Jeff Bliss, “HP Unveils Assembly Plan,” Computer Reseller News, September 15, 1997.83 John Roberts, “Could Direct Moves Backfire?” Computer Reseller News, July 20, 1998.84 Kelley Damore and Steven Burke, “HP Responds to Compaq Direct Plan,” Computer Reseller News, November
23, 1998.85 Eric Nee, “Defending the Desktop,” Forbes, December 28, 1998, pp. 53-54.86 Ephraim Schwartz and David Pendery, “HP Expands Direct Sales Offerings,” InfoWorld Daily News, October 1,
1998.87 Eric Nee, “Defending the Desktop,” Forbes, December 28, 1998, pp. 53-54.88 Data from International Data Corporation.89 Roger O. Crockett, “Gateway Loses the Folksy Shtick,” Business Week, July 6, 1998, pp. 80-84.90 Evan Ramstad, “Gateway Unit to Bolster Ties to PC Dealers,” Wall Street Journal, April 20, 1998, p. B2.91 Craig Zarley, “Resellers Fight Dell,” Informationweek, April 20, 1998.92 Hassan Fattah, “1998 Forecast: The Channel Fights Back,” MC Technology Marketing Intelligence, January 1998.
Craig Zarley and Christina Torode, “The Party’s Over: Dell Loses Pricing Advantage,” Computer Reseller News,December 15, 1997.
93 Robert P. Anastasi, Neal F. Johnson, J. Drennan Lane, and Stephanie L. Spinner, “The Computer SalesChannel: Third Quarter Demand Survey,” Robinson-Humphrey, September 23, 1998.
94 Tony Amico, director of PC Channels at International Data Corporation, quoted in Hassan Fattah, “1998Forecast: The Channel Fights Back,” MC Technology Marketing Intelligence, January 1998.
95 Marty Wolf, “IBM, Compaq Strategies ‘Unsettling’,” Computer Reseller News, July 6, 1998.96 Daniel Lyons, “Games Dealers Play,” Forbes, October 19, 1998, pp. 132-134.97 Daniel Lyons, “Games Dealers Play,” Forbes, October 19, 1998, pp. 132-134.98 Christopher Palmeri, “The Perils of Being Number One,” Forbes, December 1, 1997, p. 44.99 Andrew Serwer, “Michael Dell Turns the PC World Inside Out,” Fortune, September 8, 1997, pp. 76-86.100 Based on Computer Currents High-Tech Dictionary, http://www.currents.net/resources/dictionary/dictionary.phtml.