Embed Size (px)
Citation preview

Material contained in this publication is inthe public domain and may be reproduced,fully or partially, without permission of theFederal Government. Source credit is requestedbut not required. Permission is requiredonly to reproduce any copyrighted materialcontained herein.
This material will be made available tosensory impaired individuals upon request.TDD* phone: 1-800-326-2577
*Telecommunications Device for the Deaf.
Training and Employment Report of the Secretary of Labor
Covering the Period July 1995 - September 1996
U.S. Department of LaborAlexis M. Herman, Secretary
Employment and Training AdministrationRaymond J. Uhalde, Acting Assistant Secretary of Labor
Office of Policy and ResearchGerard F. Fiala, Administrator

ContentsPage
Transmittal Letter of the Secretary of Labor . . . . . . . . . . . . . . . . . . . . . . . . . .
Abbreviation and Acronym List . . . . . . . . . . . . . . . . . . . . . . . . . . . . . . . . . . . . . .
Chapter 1–Program Activities
Introduction . . . . . . . . . . . . . . . . . . . . . . . . . . . . . . . . . . . . . . . . . . . . . . . . . . . . . . . .One-Stop Career Center Systems and Labor Market Information Initiatives . . . . .
One-Stop Career Center Systems . . . . . . . . . . . . . . . . . . . . . . . . . . . . . . . . . .America’s Labor Market Information System . . . . . . . . . . . . . . . . . . . . . . . . . .
Improving the Nation’s Employment and Training System . . . . . . . . . . . . . . . . . .Skill Standards and Certification . . . . . . . . . . . . . . . . . . . . . . . . . . . . . . . . . . . . . .
National Skill Standards Board . . . . . . . . . . . . . . . . . . . . . . . . . . . . . . . . . . . . .Demonstration Programs . . . . . . . . . . . . . . . . . . . . . . . . . . . . . . . . . . . . . . . . .Business/Trade Association Initiative . . . . . . . . . . . . . . . . . . . . . . . . . . . . . . . .National Youth Apprenticeship Program . . . . . . . . . . . . . . . . . . . . . . . . . . . . .WorkPlus . . . . . . . . . . . . . . . . . . . . . . . . . . . . . . . . . . . . . . . . . . . . . . . . . . . . .Information Dissemination . . . . . . . . . . . . . . . . . . . . . . . . . . . . . . . . . . . . . . . .
School-To-Work Opportunities . . . . . . . . . . . . . . . . . . . . . . . . . . . . . . . . . . . . . . .Other Project Highlights . . . . . . . . . . . . . . . . . . . . . . . . . . . . . . . . . . . . . . . . . . . . .
What is Working in Employment and Training . . . . . . . . . . . . . . . . . . . . . . . . .Conference on Building a Reemployment System . . . . . . . . . . . . . . . . . . .Publication on “What is Working” . . . . . . . . . . . . . . . . . . . . . . . . . . . . . . . .
Serving Dislocated Workers: The Enterprise Project . . . . . . . . . . . . . . . . . . . .Promoting Customer Choice for Dislocated Workers . . . . . . . . . . . . . . . . . . . .Training Survey . . . . . . . . . . . . . . . . . . . . . . . . . . . . . . . . . . . . . . . . . . . . . . . .Study of Job Skills and High Performance . . . . . . . . . . . . . . . . . . . . . . . . . . . .
Special JTPA Initiatives . . . . . . . . . . . . . . . . . . . . . . . . . . . . . . . . . . . . . . . . . . . . .National Dialogue on Improving Job Training Services . . . . . . . . . . . . . . . . . .Emergency Grants . . . . . . . . . . . . . . . . . . . . . . . . . . . . . . . . . . . . . . . . . . . . . .
Flood Relief . . . . . . . . . . . . . . . . . . . . . . . . . . . . . . . . . . . . . . . . . . . . . . . . .Earthquake Aid . . . . . . . . . . . . . . . . . . . . . . . . . . . . . . . . . . . . . . . . . . . . . .Oklahoma City Bombing . . . . . . . . . . . . . . . . . . . . . . . . . . . . . . . . . . . . . . .
Job Training Partnership Act Programs . . . . . . . . . . . . . . . . . . . . . . . . . . . . . . . . .JTPA Overview . . . . . . . . . . . . . . . . . . . . . . . . . . . . . . . . . . . . . . . . . . . . . . . . . . .
Technical Assistance and Training . . . . . . . . . . . . . . . . . . . . . . . . . . . . . . . . . .Dialogue on the Disadvantaged . . . . . . . . . . . . . . . . . . . . . . . . . . . . . . . . . . . .
Adult Programs, Title II-A . . . . . . . . . . . . . . . . . . . . . . . . . . . . . . . . . . . . . . . . . . . .Background . . . . . . . . . . . . . . . . . . . . . . . . . . . . . . . . . . . . . . . . . . . . . . . . . . .Highlights of PY 1993 and 1994 Activities . . . . . . . . . . . . . . . . . . . . . . . . . . . .
Year-Round Services for Youth, Title II-C . . . . . . . . . . . . . . . . . . . . . . . . . . . . . . .Background . . . . . . . . . . . . . . . . . . . . . . . . . . . . . . . . . . . . . . . . . . . . . . . . . . .Highlights of PY 1993 and 1994 Activities . . . . . . . . . . . . . . . . . . . . . . . . . . . .
Summer Youth Programs, Title II-B . . . . . . . . . . . . . . . . . . . . . . . . . . . . . . . . . . . .Background . . . . . . . . . . . . . . . . . . . . . . . . . . . . . . . . . . . . . . . . . . . . . . . . . . .
Highlights of Calendar Year 1994 and 1995 Activities . . . . . . . . . . . . . . . . . . .Dislocated Worker Programs, Title III . . . . . . . . . . . . . . . . . . . . . . . . . . . . . . . . . .
Background . . . . . . . . . . . . . . . . . . . . . . . . . . . . . . . . . . . . . . . . . . . . . . . . . . .PY 1993 National Reserve Projects and Special Initiatives . . . . . . . . . . . . . . .
National Reserve Projects . . . . . . . . . . . . . . . . . . . . . . . . . . . . . . . . . . . . . .Special Initiatives . . . . . . . . . . . . . . . . . . . . . . . . . . . . . . . . . . . . . . . . . . . .
PY 1994 National Reserve Projects and Special Initiatives . . . . . . . . . . . . . . .National Reserve Projects . . . . . . . . . . . . . . . . . . . . . . . . . . . . . . . . . . . . . .Special Initiatives . . . . . . . . . . . . . . . . . . . . . . . . . . . . . . . . . . . . . . . . . . . .
PY 1993 and 1994 Program Results and Participant Characteristics . . . . . . .Performance Standards . . . . . . . . . . . . . . . . . . . . . . . . . . . . . . . . . . . . . . . . . .Response to Special Dislocations in PY 1993 and 1994 . . . . . . . . . . . . . . . . .
Defense-Related Dislocations . . . . . . . . . . . . . . . . . . . . . . . . . . . . . . . . . . .Clean Air Employment Transition Assistance . . . . . . . . . . . . . . . . . . . . . . .
National Programs, Title IV . . . . . . . . . . . . . . . . . . . . . . . . . . . . . . . . . . . . . . . . . .Overview . . . . . . . . . . . . . . . . . . . . . . . . . . . . . . . . . . . . . . . . . . . . . . . . . . . . .
Indian and Native American Programs . . . . . . . . . . . . . . . . . . . . . . . . . . . .Background . . . . . . . . . . . . . . . . . . . . . . . . . . . . . . . . . . . . . . . . . . . . . .Highlights of PY 1993 and 1994 Activities . . . . . . . . . . . . . . . . . . . . . . .
Migrant and Seasonal Farmworker Program . . . . . . . . . . . . . . . . . . . . . . .Background . . . . . . . . . . . . . . . . . . . . . . . . . . . . . . . . . . . . . . . . . . . . . .Highlights of PY 1993 and 1994 Activities . . . . . . . . . . . . . . . . . . . . . . .
Job Corps . . . . . . . . . . . . . . . . . . . . . . . . . . . . . . . . . . . . . . . . . . . . . . . . . .Background . . . . . . . . . . . . . . . . . . . . . . . . . . . . . . . . . . . . . . . . . . . . . .Highlights of PY 1993 and 1994 Activities . . . . . . . . . . . . . . . . . . . . . . .
Pilot and Demonstration Programs . . . . . . . . . . . . . . . . . . . . . . . . . . . . . . .School-To-Work Transition and Youth-Related Projects . . . . . . . . . . . .
National Youth Apprenticeship in the Customer Service Industry . . . . . . . . . . . . . . . . . . . . . . . . . . . . . . . . . . . . . . . .Union-Based School-To-Work Mentoring Project . . . . . . . . . . . . . . .High School Career Academies Demonstration . . . . . . . . . . . . . . . .Transition to Work Demonstrations for Disabled
Youth Using a Natural Supports Model . . . . . . . . . . . . . . . . . . . . . .Project FocusHOPE . . . . . . . . . . . . . . . . . . . . . . . . . . . . . . . . . . . . .At-Risk Youth School-To-Work Pilot Project . . . . . . . . . . . . . . . . . .Preparing Out-of-School Youth for a Career Path Project . . . . . . . .Quantum Opportunities Project . . . . . . . . . . . . . . . . . . . . . . . . . . . .

Youth Year-Round Training Demonstrations . . . . . . . . . . . . . . . . . .Out-of-School Pilot Projects . . . . . . . . . . . . . . . . . . . . . . . . . . . . . . .Youth Fair Chance Program . . . . . . . . . . . . . . . . . . . . . . . . . . . . . . .
Addressing the Labor Market Needs of Women . . . . . . . . . . . . . . . . . .Glass Ceiling Demonstration . . . . . . . . . . . . . . . . . . . . . . . . . . . . . .Nontraditional Employment for Women . . . . . . . . . . . . . . . . . . . . . .
Improving Programs and Coordination . . . . . . . . . . . . . . . . . . . . . . . . .Job Training 2000 Projects . . . . . . . . . . . . . . . . . . . . . . . . . . . . . . . .Evaluation of the Job Training 2000 One-Stop Career Centers Demonstration . . . . . . . . . . . . . . . . . . . . . . . . . . . . . . . . . .Partnership Programs . . . . . . . . . . . . . . . . . . . . . . . . . . . . . . . . . . . .
Improving Worker Skills . . . . . . . . . . . . . . . . . . . . . . . . . . . . . . . . . . . . .The National Job Analysis Study . . . . . . . . . . . . . . . . . . . . . . . . . . .Increasing Organizational Capacity to Provide Workplace Literacy Services . . . . . . . . . . . . . . . . . . . . . . . . . . . . .Workplace Literacy Test Implementation Pilot Project . . . . . . . . . . . . . . . . . . . . . . . . . . . . . . . . . . . . . . . . . .New Directions: African Americans in a Diversifying Nation Project. . . . . . . . . . . . . . . . . . . . . . . . . . . . . . . . . . . . . . . . .
Helping Immigrants Succeed in the Labor Market . . . . . . . . . . . . . . . . .Immigration Demonstration Projects . . . . . . . . . . . . . . . . . . . . . . . .
Helping People With Disabilities to Succeed in the Labor Market . . . . .Programs for People With Disabilities . . . . . . . . . . . . . . . . . . . . . . .
Job Training for the Homeless Demonstration Program . . . . . . . . . . . . . . . . . . . .
Apprenticeship . . . . . . . . . . . . . . . . . . . . . . . . . . . . . . . . . . . . . . . . . . . . . . . . . . . . .Background . . . . . . . . . . . . . . . . . . . . . . . . . . . . . . . . . . . . . . . . . . . . . . . . . . . . .Highlights of FY 1994 and 1995 Activities . . . . . . . . . . . . . . . . . . . . . . . . . . . . . . .Special FY 1994 and 1995 Initiatives . . . . . . . . . . . . . . . . . . . . . . . . . . . . . . . . . . .
STEP-UP Program . . . . . . . . . . . . . . . . . . . . . . . . . . . . . . . . . . . . . . . . . . . . . .Center for Advanced Journeymen Education . . . . . . . . . . . . . . . . . . . . . . . . . .International Union of Operating Engineers . . . . . . . . . . . . . . . . . . . . . . . . . . .United Automobile Workers of America Skilled Trades Apprenticeship Preparation Program . . . . . . . . . . . . . . . . . . . . . . . . . . . . . . .Women in Apprenticeship and Nontraditional Occupations and the Diversity in Apprenticeship Grants . . . . . . . . . . . . . . . . . . . . . . . . . . . . . . . . .Federal-State Registered Apprenticeship Liaison Committee . . . . . . . . . . . . .School-To-Work . . . . . . . . . . . . . . . . . . . . . . . . . . . . . . . . . . . . . . . . . . . . . . . .Education and Performance Apprenticeship Standards . . . . . . . . . . . . . . . . . .Construction Craft Skills Training Program . . . . . . . . . . . . . . . . . . . . . . . . . . .Federal Committee on Apprenticeship . . . . . . . . . . . . . . . . . . . . . . . . . . . . . . .
Senior Community Service Employment Program . . . . . . . . . . . . . . . . . . . . . . . . .Background . . . . . . . . . . . . . . . . . . . . . . . . . . . . . . . . . . . . . . . . . . . . . . . . . . . . .Highlights of PY 1993 and 1994 Activities . . . . . . . . . . . . . . . . . . . . . . . . . . . . . . .
Employment Service . . . . . . . . . . . . . . . . . . . . . . . . . . . . . . . . . . . . . . . . . . . . . . . . .Labor Exchange and Other Activities . . . . . . . . . . . . . . . . . . . . . . . . . . . . . . . . . . .
Labor Exchange . . . . . . . . . . . . . . . . . . . . . . . . . . . . . . . . . . . . . . . . . . . . . . . .Employment Service Revitalization Initiative . . . . . . . . . . . . . . . . . . . . . . . . . .America’s Job Bank . . . . . . . . . . . . . . . . . . . . . . . . . . . . . . . . . . . . . . . . . . . . .Reemployment Services . . . . . . . . . . . . . . . . . . . . . . . . . . . . . . . . . . . . . . . . .Employers’ National Job Service Council . . . . . . . . . . . . . . . . . . . . . . . . . . . . .Targeted Jobs Tax Credit . . . . . . . . . . . . . . . . . . . . . . . . . . . . . . . . . . . . . . . . .Occupational Information Network . . . . . . . . . . . . . . . . . . . . . . . . . . . . . . . . . .Help for Migrant and Seasonal Farmworkers . . . . . . . . . . . . . . . . . . . . . . . . . .Foreign Labor Certification . . . . . . . . . . . . . . . . . . . . . . . . . . . . . . . . . . . . . . . .
Permanent Labor Certification . . . . . . . . . . . . . . . . . . . . . . . . . . . . . . . . . .H-2B Labor Certification . . . . . . . . . . . . . . . . . . . . . . . . . . . . . . . . . . . . . . .H-2A Temporary Labor Certification . . . . . . . . . . . . . . . . . . . . . . . . . . . . . .H-1A Nurses . . . . . . . . . . . . . . . . . . . . . . . . . . . . . . . . . . . . . . . . . . . . . . . .H-1B Specialty (Professional) Workers . . . . . . . . . . . . . . . . . . . . . . . . . . . .F-1 Students . . . . . . . . . . . . . . . . . . . . . . . . . . . . . . . . . . . . . . . . . . . . . . . .D-1 Crewmembers . . . . . . . . . . . . . . . . . . . . . . . . . . . . . . . . . . . . . . . . . . .
Unemployment Insurance Program . . . . . . . . . . . . . . . . . . . . . . . . . . . . . . . . . . . . .Background . . . . . . . . . . . . . . . . . . . . . . . . . . . . . . . . . . . . . . . . . . . . . . . . . . . . .Highlights of FY 1994 and 1995 Activities . . . . . . . . . . . . . . . . . . . . . . . . . . . . . . .
Reemployment Demonstration Projects . . . . . . . . . . . . . . . . . . . . . . . . . . . . . .Self-Employment Demonstration Projects . . . . . . . . . . . . . . . . . . . . . . . . . . . .Work Search Demonstration Project . . . . . . . . . . . . . . . . . . . . . . . . . . . . . . . .Job Search Assistance Demonstration Projects . . . . . . . . . . . . . . . . . . . . . . .
The Unemployment Insurance Performance System . . . . . . . . . . . . . . . . . . . . . .The Performance Measurement Review (PMR) . . . . . . . . . . . . . . . . . . . . . . . .The Revenue Quality Control (RQC) Initiative . . . . . . . . . . . . . . . . . . . . . . . . .Benefits Quality Control . . . . . . . . . . . . . . . . . . . . . . . . . . . . . . . . . . . . . . . . . .
Trade Adjustment Assistance for Workers . . . . . . . . . . . . . . . . . . . . . . . . . . . . . . .Background . . . . . . . . . . . . . . . . . . . . . . . . . . . . . . . . . . . . . . . . . . . . . . . . . . . . .Highlights of FY 1994 and 1995 Activities . . . . . . . . . . . . . . . . . . . . . . . . . . . . . . .
NAFTA-Transitional Adjustment Assistance . . . . . . . . . . . . . . . . . . . . . . . . . . . . . .Background . . . . . . . . . . . . . . . . . . . . . . . . . . . . . . . . . . . . . . . . . . . . . . . . . . . . .Highlights of FY 1994 and 1995 Activities . . . . . . . . . . . . . . . . . . . . . . . . . . . . . . .
Incumbent Worker Training . . . . . . . . . . . . . . . . . . . . . . . . . . . . . . . . . . . . . . . . . . .Highlights of PY 1993 and 1994 Activities . . . . . . . . . . . . . . . . . . . . . . . . . . . . . . .
Labor Surplus Areas Program . . . . . . . . . . . . . . . . . . . . . . . . . . . . . . . . . . . . . . . . .Background . . . . . . . . . . . . . . . . . . . . . . . . . . . . . . . . . . . . . . . . . . . . . . . . . . . . .
Highlights of FY 1994 and 1995 Activities . . . . . . . . . . . . . . . . . . . . . . . . . . . . . . .
National Commission for Employment Policy . . . . . . . . . . . . . . . . . . . . . . . . . . . .Background . . . . . . . . . . . . . . . . . . . . . . . . . . . . . . . . . . . . . . . . . . . . . . . . . . . . .Highlights of PY 1993 and 1994 Activities . . . . . . . . . . . . . . . . . . . . . . . . . . . . . . .
National Occupational Information Coordinating Committee . . . . . . . . . . . . . . . .Background . . . . . . . . . . . . . . . . . . . . . . . . . . . . . . . . . . . . . . . . . . . . . . . . . . . . .Highlights of PY 1993 and 1994 Activities . . . . . . . . . . . . . . . . . . . . . . . . . . . . . . .
Support for State Occupational Information Coordinating Committees . . . . . .Occupational Information Support System . . . . . . . . . . . . . . . . . . . . . . . . . . . .Career Information Delivery . . . . . . . . . . . . . . . . . . . . . . . . . . . . . . . . . . . . . . .Career Development Activities . . . . . . . . . . . . . . . . . . . . . . . . . . . . . . . . . . . . .
Chapter 2–Research and Evaluation Findings
Introduction . . . . . . . . . . . . . . . . . . . . . . . . . . . . . . . . . . . . . . . . . . . . . . . . . . . . .
I. Labor Market Studies of Specific Groups . . . . . . . . . . . . . . . . . . . . . . . . . . . . . . . . .
Help for Farmers and Ranchers . . . . . . . . . . . . . . . . . . . . . . . . . . . . . . . . . . . . . . . . . . . .Overview . . . . . . . . . . . . . . . . . . . . . . . . . . . . . . . . . . . . . . . . . . . . . . . . . . . . . . . .Background: The Farm Crisis . . . . . . . . . . . . . . . . . . . . . . . . . . . . . . . . . . . . . . . .Past Efforts to Help Farmers and Ranchers . . . . . . . . . . . . . . . . . . . . . . . . . . . . .Farmers and Ranchers Demonstration Projects . . . . . . . . . . . . . . . . . . . . . . . . . .
Iowa . . . . . . . . . . . . . . . . . . . . . . . . . . . . . . . . . . . . . . . . . . . . . . . . . . . . . . .Minnesota . . . . . . . . . . . . . . . . . . . . . . . . . . . . . . . . . . . . . . . . . . . . . . . . . .North Dakota . . . . . . . . . . . . . . . . . . . . . . . . . . . . . . . . . . . . . . . . . . . . . . . .South Dakota . . . . . . . . . . . . . . . . . . . . . . . . . . . . . . . . . . . . . . . . . . . . . . .
Enrollment Patterns and Participant Characteristics . . . . . . . . . . . . . . . . . . . . . . .Services and Outcomes . . . . . . . . . . . . . . . . . . . . . . . . . . . . . . . . . . . . . . . . . . . . .Study Conclusions and Recommendations . . . . . . . . . . . . . . . . . . . . . . . . . . . . . .
Providing Training and Employment Services for Farmers and Ranchers . . . . . . . . . . . .Overview . . . . . . . . . . . . . . . . . . . . . . . . . . . . . . . . . . . . . . . . . . . . . . . . . . . . . . . .How Farmers Differ From Other Clients . . . . . . . . . . . . . . . . . . . . . . . . . . . . . . . . .The Increase in Farmer Dislocation . . . . . . . . . . . . . . . . . . . . . . . . . . . . . . . . . . . .Start-Up Activities . . . . . . . . . . . . . . . . . . . . . . . . . . . . . . . . . . . . . . . . . . . . . . . . .
Assessing the Need for Services . . . . . . . . . . . . . . . . . . . . . . . . . . . . . . . .Determining the Characteristics and Needs of Potential Clients . . . . . . . . .Identifying Funding Sources . . . . . . . . . . . . . . . . . . . . . . . . . . . . . . . . . . . .Developing Networks . . . . . . . . . . . . . . . . . . . . . . . . . . . . . . . . . . . . . . . . .Recruiting, Training, and Supervising Staff . . . . . . . . . . . . . . . . . . . . . . . . .
Addressing the Special Needs of Farmers and Ranchers . . . . . . . . . . . . . . . . . . .Outreach Efforts . . . . . . . . . . . . . . . . . . . . . . . . . . . . . . . . . . . . . . . . . . . . .Tailoring Services to Farmers and Intake/Enrollment Efforts . . . . . . . . . . .

Case Management . . . . . . . . . . . . . . . . . . . . . . . . . . . . . . . . . . . . . . . . . . .Assessment and Service Planning . . . . . . . . . . . . . . . . . . . . . . . . . . . . . . .Job Search and Placement Assistance . . . . . . . . . . . . . . . . . . . . . . . . . . . .Retraining and Supportive Services . . . . . . . . . . . . . . . . . . . . . . . . . . . . . .
Suggestions for State JTPA Officials . . . . . . . . . . . . . . . . . . . . . . . . . . . . . . . . . . .
Evaluating Programs for Migrant and Seasonal Farmworkers . . . . . . . . . . . . . . . . . . . . .Overview . . . . . . . . . . . . . . . . . . . . . . . . . . . . . . . . . . . . . . . . . . . . . . . . . . . . . . . .Conceptual Framework and Quality of Training Model . . . . . . . . . . . . . . . . . . . . .Characteristics of the Eligible Population and Program Participants . . . . . . . . . . .Grantee Service Strategies and Operations . . . . . . . . . . . . . . . . . . . . . . . . . . . . .
Training Services . . . . . . . . . . . . . . . . . . . . . . . . . . . . . . . . . . . . . . . . . . . .Pre-Training Services . . . . . . . . . . . . . . . . . . . . . . . . . . . . . . . . . . . . . . . . .
Classroom Training . . . . . . . . . . . . . . . . . . . . . . . . . . . . . . . . . . . . . . . . . . . . . . . .Basic Skills Classroom Training . . . . . . . . . . . . . . . . . . . . . . . . . . . . . . . . .Vocational Classroom Training . . . . . . . . . . . . . . . . . . . . . . . . . . . . . . . . . .Relationships Between Vocational and Basic Skills Classroom Training . . . . . . . . . . . . . . . . . . . . . . . . . . . . . . . .
On-the-Job Training . . . . . . . . . . . . . . . . . . . . . . . . . . . . . . . . . . . . . . . . . . . . . . . .Supportive Services . . . . . . . . . . . . . . . . . . . . . . . . . . . . . . . . . . . . . . . . . . . . . . . .Placement Services and Outcomes . . . . . . . . . . . . . . . . . . . . . . . . . . . . . . . . . . . .
Placement Services . . . . . . . . . . . . . . . . . . . . . . . . . . . . . . . . . . . . . . . . . .Indirect Placements . . . . . . . . . . . . . . . . . . . . . . . . . . . . . . . . . . . . .Direct Placements . . . . . . . . . . . . . . . . . . . . . . . . . . . . . . . . . . . . . .
Services Received and Outcomes . . . . . . . . . . . . . . . . . . . . . . . . . . . . . . .Factors Influencing Program Design and Outcomes . . . . . . . . . . . . . . . . . . . . . . .Recommendations . . . . . . . . . . . . . . . . . . . . . . . . . . . . . . . . . . . . . . . . . . . . . . . . .
Job Training for the Homeless . . . . . . . . . . . . . . . . . . . . . . . . . . . . . . . . . . . . . . . . . . . . .Overview . . . . . . . . . . . . . . . . . . . . . . . . . . . . . . . . . . . . . . . . . . . . . . . . . . . . .Program Background . . . . . . . . . . . . . . . . . . . . . . . . . . . . . . . . . . . . . . . . . . . . . . .Participant Characteristics . . . . . . . . . . . . . . . . . . . . . . . . . . . . . . . . . . . . . . . . . . .Program Design, Implementation, Services, and Coordination . . . . . . . . . . . . . . .
Initial Services . . . . . . . . . . . . . . . . . . . . . . . . . . . . . . . . . . . . . . . . . . . . . . .Case Management . . . . . . . . . . . . . . . . . . . . . . . . . . . . . . . . . . . . . . . . . . .Education and Training Services . . . . . . . . . . . . . . . . . . . . . . . . . . . . . . . . .Job Development, Placement, and Postplacement . . . . . . . . . . . . . . . . . .Housing Services . . . . . . . . . . . . . . . . . . . . . . . . . . . . . . . . . . . . . . . . . . . .Supportive Services . . . . . . . . . . . . . . . . . . . . . . . . . . . . . . . . . . . . . . . . . .Coordination and Linkages . . . . . . . . . . . . . . . . . . . . . . . . . . . . . . . . . . . . .
Program and Participant Outcomes . . . . . . . . . . . . . . . . . . . . . . . . . . . . . . . . . . . .Site-Level Analysis . . . . . . . . . . . . . . . . . . . . . . . . . . . . . . . . . . . . . . . . . . .Participant-Level Analysis . . . . . . . . . . . . . . . . . . . . . . . . . . . . . . . . . . . . . .
Findings, Implications, and Recommendations . . . . . . . . . . . . . . . . . . . . . . . . . . .
Helping Youth With Disabilities Move From School To Work . . . . . . . . . . . . . . . . . . . . . .

Overview . . . . . . . . . . . . . . . . . . . . . . . . . . . . . . . . . . . . . . . . . . . . . . . . . . . . .The Demonstration Projects . . . . . . . . . . . . . . . . . . . . . . . . . . . . . . . . . . . . . . . . .
California . . . . . . . . . . . . . . . . . . . . . . . . . . . . . . . . . . . . . . . . . . . . . . . . . . .Maryland . . . . . . . . . . . . . . . . . . . . . . . . . . . . . . . . . . . . . . . . . . . . . . . . . . .Massachusetts . . . . . . . . . . . . . . . . . . . . . . . . . . . . . . . . . . . . . . . . . . . . . .Minnesota . . . . . . . . . . . . . . . . . . . . . . . . . . . . . . . . . . . . . . . . . . . . . . . . . .New Hampshire . . . . . . . . . . . . . . . . . . . . . . . . . . . . . . . . . . . . . . . . . . . . . .Oregon . . . . . . . . . . . . . . . . . . . . . . . . . . . . . . . . . . . . . . . . . . . . . . . . . . . .
Support Services and Coordination . . . . . . . . . . . . . . . . . . . . . . . . . . . . . . . . . . . .Accomplishments . . . . . . . . . . . . . . . . . . . . . . . . . . . . . . . . . . . . . . . . . . . . . . . . . .Project Costs . . . . . . . . . . . . . . . . . . . . . . . . . . . . . . . . . . . . . . . . . . . . . . . . . . . . .Barriers and Challenges . . . . . . . . . . . . . . . . . . . . . . . . . . . . . . . . . . . . . . . . . . . .Capacity-Building, Continuity of Services, and Systems Change . . . . . . . . . . . . .Future Directions . . . . . . . . . . . . . . . . . . . . . . . . . . . . . . . . . . . . . . . . . . . . . . . . . .
Integrating Training and Employment Services for Immigrants . . . . . . . . . . . . . . . . . . . .Overview . . . . . . . . . . . . . . . . . . . . . . . . . . . . . . . . . . . . . . . . . . . . . . . . . . . . .Service Strategy, Goals, and Objectives . . . . . . . . . . . . . . . . . . . . . . . . . . . . . . . .Evaluation Methodology . . . . . . . . . . . . . . . . . . . . . . . . . . . . . . . . . . . . . . . . . . . . .Project Services . . . . . . . . . . . . . . . . . . . . . . . . . . . . . . . . . . . . . . . . . . . . . . . . . . .Project Implementation . . . . . . . . . . . . . . . . . . . . . . . . . . . . . . . . . . . . . . . . . . . . .Linkages and Coordination . . . . . . . . . . . . . . . . . . . . . . . . . . . . . . . . . . . . . . . . . .Outcomes . . . . . . . . . . . . . . . . . . . . . . . . . . . . . . . . . . . . . . . . . . . . . . . . . . . . .Client Characteristics . . . . . . . . . . . . . . . . . . . . . . . . . . . . . . . . . . . . . . . . . . . . . . .Project Effectiveness . . . . . . . . . . . . . . . . . . . . . . . . . . . . . . . . . . . . . . . . . . . . . . .Conclusions and Recommendations . . . . . . . . . . . . . . . . . . . . . . . . . . . . . . . . . . .
Helping Immigrants Succeed in the Labor Market . . . . . . . . . . . . . . . . . . . . . . . . . . . . . .Overview . . . . . . . . . . . . . . . . . . . . . . . . . . . . . . . . . . . . . . . . . . . . . . . . . . . . .Client Demographics . . . . . . . . . . . . . . . . . . . . . . . . . . . . . . . . . . . . . . . . . . . . . . .Recruitment, Targeting, and Eligibility . . . . . . . . . . . . . . . . . . . . . . . . . . . . . . . . . .Assessment . . . . . . . . . . . . . . . . . . . . . . . . . . . . . . . . . . . . . . . . . . . . . . . . . . . . .Curriculum Development . . . . . . . . . . . . . . . . . . . . . . . . . . . . . . . . . . . . . . . . . . . .Instruction and Other Services . . . . . . . . . . . . . . . . . . . . . . . . . . . . . . . . . . . . . . . .Project Summary . . . . . . . . . . . . . . . . . . . . . . . . . . . . . . . . . . . . . . . . . . . . . . . . . .
Overcoming Poverty in the United States . . . . . . . . . . . . . . . . . . . . . . . . . . . . . . . . . . . . .Overview . . . . . . . . . . . . . . . . . . . . . . . . . . . . . . . . . . . . . . . . . . . . . . . . . . . . .Major Articles . . . . . . . . . . . . . . . . . . . . . . . . . . . . . . . . . . . . . . . . . . . . . . . . . . . . .
II. Meeting the Needs of Dislocated Workers . . . . . . . . . . . . . . . . . . . . . . . . . . . . . . .
Services for Dislocated Workers . . . . . . . . . . . . . . . . . . . . . . . . . . . . . . . . . . . . . . . . . . .Overview . . . . . . . . . . . . . . . . . . . . . . . . . . . . . . . . . . . . . . . . . . . . . . . . . . . . .Early Intervention Services . . . . . . . . . . . . . . . . . . . . . . . . . . . . . . . . . . . . . . . . . .Services to Develop Reemployment Plans: Assessment,
Career Exploration, and Service Planning . . . . . . . . . . . . . . . . . . . . . . . . . . . . . .Services to Develop Reemployment Plans: Supportive Services and Case Management . . . . . . . . . . . . . . . . . . . . . . . . . . . . . . . . . . . . .Basic Readjustment Services: Job Search Training and Assistance . . . . . . . . . . .Basic Readjustment Services: Crisis Adjustment, Job Readiness, and Relocation Services . . . . . . . . . . . . . . . . . . . . . . . . . . . . . .Retraining Services: Classroom Training in Basic Skills . . . . . . . . . . . . . . . . . . . .Retraining Services: Classroom Training in Occupational Skills . . . . . . . . . . . . . .Retraining Services: On-the-Job Training . . . . . . . . . . . . . . . . . . . . . . . . . . . . . . .Organizational Issues . . . . . . . . . . . . . . . . . . . . . . . . . . . . . . . . . . . . . . . . . . . . . .
Easing Job Loss in the Defense Industry . . . . . . . . . . . . . . . . . . . . . . . . . . . . . . . . . . . . .Overview . . . . . . . . . . . . . . . . . . . . . . . . . . . . . . . . . . . . . . . . . . . . . . . . . . . . .Study Methodology . . . . . . . . . . . . . . . . . . . . . . . . . . . . . . . . . . . . . . . . . . . . . . . .
The Dislocation Aversion Approach . . . . . . . . . . . . . . . . . . . . . . . . . . . . . .The Worker Mobility Approach . . . . . . . . . . . . . . . . . . . . . . . . . . . . . . . . . .The Community Planning Approach . . . . . . . . . . . . . . . . . . . . . . . . . . . . . .
Preventing Layoffs from Defense Firms . . . . . . . . . . . . . . . . . . . . . . . . . . . . . . . . .Assisting Dislocated Defense Workers . . . . . . . . . . . . . . . . . . . . . . . . . . . . . . . . .Community Planning Projects . . . . . . . . . . . . . . . . . . . . . . . . . . . . . . . . . . . . . . . .Conclusions . . . . . . . . . . . . . . . . . . . . . . . . . . . . . . . . . . . . . . . . . . . . . . . . . . . . .
Helping Dislocated Workers to Become Entrepreneurs . . . . . . . . . . . . . . . . . . . . . . . . . .Overview . . . . . . . . . . . . . . . . . . . . . . . . . . . . . . . . . . . . . . . . . . . . . . . . . . . . .The Job Creation Demonstration . . . . . . . . . . . . . . . . . . . . . . . . . . . . . . . . . . . . . .A Review of Job Creation Efforts . . . . . . . . . . . . . . . . . . . . . . . . . . . . . . . . . . . . . .The EDWAA Job Creation Demonstration Projects . . . . . . . . . . . . . . . . . . . . . . . .
BEST Program . . . . . . . . . . . . . . . . . . . . . . . . . . . . . . . . . . . . . . . . . . . . . .Muskegon Economic Growth Alliance (MEGA) Job Creation Demonstration Program . . . . . . . . . . . . . . . . . . . . . . . . . . . .Friends of the Children of Mississippi Project . . . . . . . . . . . . . . . . . . . . . . .Project Excel . . . . . . . . . . . . . . . . . . . . . . . . . . . . . . . . . . . . . . . . . . . . . . . .Project New Ventures . . . . . . . . . . . . . . . . . . . . . . . . . . . . . . . . . . . . . . . . .The Center for Practical Solutions . . . . . . . . . . . . . . . . . . . . . . . . . . . . . . .
Service Models and Implementation Issues . . . . . . . . . . . . . . . . . . . . . . . . . . . . .Analysis of Participant-Level Data . . . . . . . . . . . . . . . . . . . . . . . . . . . . . . . . . . . . .Job Creation in Ongoing EDWAA Programs . . . . . . . . . . . . . . . . . . . . . . . . . . . . .Conclusions and Policy Recommendations . . . . . . . . . . . . . . . . . . . . . . . . . . . . . .
Helping Dislocated Workers Through Early Intervention . . . . . . . . . . . . . . . . . . . . . . . . .Overview . . . . . . . . . . . . . . . . . . . . . . . . . . . . . . . . . . . . . . . . . . . . . . . . . . . . .The Worker-Profiling and Reemployment Services System . . . . . . . . . . . . . . . . .How the Worker-Profiling and Reemployment Services System Works . . . . . . . .Research Results . . . . . . . . . . . . . . . . . . . . . . . . . . . . . . . . . . . . . . . . . . . . . . . . . .Legislation . . . . . . . . . . . . . . . . . . . . . . . . . . . . . . . . . . . . . . . . . . . . . . . . . . . . .Worker Profiling and Reemployment Services System . . . . . . . . . . . . . . . . . . . . .

Technical Assistance . . . . . . . . . . . . . . . . . . . . . . . . . . . . . . . . . . . . . . . . . . . . . . .
Accelerating Dislocated Workers’ Return to Employment . . . . . . . . . . . . . . . . . . . . . . . .Overview . . . . . . . . . . . . . . . . . . . . . . . . . . . . . . . . . . . . . . . . . . . . . . . . . . . . .The New Jersey UI Reemployment Demonstration Project . . . . . . . . . . . . . . . . . .
The “Job Search Assistance Only” Group . . . . . . . . . . . . . . . . . . . . . . . . . .The “Job Search Assistance Plus Training or Relocation” Group . . . . . . . .The “Job Search Assistance Plus Reemployment Bonus” Group . . . . . . . .
Summary of the Initial and First Followup Evaluation Findings . . . . . . . . . . . . . . .Findings from the Second Followup Study . . . . . . . . . . . . . . . . . . . . . . . . . . . . . .
Impact on UI Receipt and Employment and Earnings . . . . . . . . . . . . . . . . .Impacts of Training . . . . . . . . . . . . . . . . . . . . . . . . . . . . . . . . . . . . . . . . . . .Targeting of Services . . . . . . . . . . . . . . . . . . . . . . . . . . . . . . . . . . . . . . . . .Benefit-Cost Analysis . . . . . . . . . . . . . . . . . . . . . . . . . . . . . . . . . . . . . . . . .
Policy Analysis and Considerations . . . . . . . . . . . . . . . . . . . . . . . . . . . . . . . . . . . .
III. Building Tomorrow’s Workforce . . . . . . . . . . . . . . . . . . . . . . . . . . . . . . . . . . . . . . .
Skill Standards in the Secondary Labor Market . . . . . . . . . . . . . . . . . . . . . . . . . . . . . . . .Overview . . . . . . . . . . . . . . . . . . . . . . . . . . . . . . . . . . . . . . . . . . . . . . . . . . . . .School-To-Work Policy an Current Initiatives . . . . . . . . . . . . . . . . . . . . . . . . . . . .Youth in the Secondary Labor Market . . . . . . . . . . . . . . . . . . . . . . . . . . . . . . . . . .Work Experience and Skill Development . . . . . . . . . . . . . . . . . . . . . . . . . . . . . . . .Recommendations and Suggested Initiatives . . . . . . . . . . . . . . . . . . . . . . . . . . . .
Policy Recommendations . . . . . . . . . . . . . . . . . . . . . . . . . . . . . . . . . . . . . .Suggested Initiatives . . . . . . . . . . . . . . . . . . . . . . . . . . . . . . . . . . . . . . . . . .
Community-Centered Strategies . . . . . . . . . . . . . . . . . . . . . . . . . . .National Initiatives . . . . . . . . . . . . . . . . . . . . . . . . . . . . . . . . . . . . . .Research Initiatives . . . . . . . . . . . . . . . . . . . . . . . . . . . . . . . . . . . . .
Using Skill Standards to Improve the Nation’s Workforce . . . . . . . . . . . . . . . . . . . . . . . .Overview . . . . . . . . . . . . . . . . . . . . . . . . . . . . . . . . . . . . . . . . . . . . . . . . . . . . .The Emergence of Skill Standards . . . . . . . . . . . . . . . . . . . . . . . . . . . . . . . . . . . .Building a Skill Standards System . . . . . . . . . . . . . . . . . . . . . . . . . . . . . . . . . . . . .
Historical Foundation . . . . . . . . . . . . . . . . . . . . . . . . . . . . . . . . . . . . . . . . .Education- and Industry-Driven Skill Standards . . . . . . . . . . . . . . . . . . . . .Lessons from Other Countries . . . . . . . . . . . . . . . . . . . . . . . . . . . . . . . . . .Related Activities . . . . . . . . . . . . . . . . . . . . . . . . . . . . . . . . . . . . . . . . . . . . .
The Ideal Skill Standards System . . . . . . . . . . . . . . . . . . . . . . . . . . . . . . . . . . . . .Key Tasks of the National Skill Standards Board . . . . . . . . . . . . . . . . . . . . . . . . .
Helping Students Move From School To Work . . . . . . . . . . . . . . . . . . . . . . . . . . . . . . . .Overview . . . . . . . . . . . . . . . . . . . . . . . . . . . . . . . . . . . . . . . . . . . . . . . . . . . . .The Demonstration Projects . . . . . . . . . . . . . . . . . . . . . . . . . . . . . . . . . . . . . . . . .
Boston Private Industry Council . . . . . . . . . . . . . . . . . . . . . . . . . . . . . . . . .Craftsmanship 2000 . . . . . . . . . . . . . . . . . . . . . . . . . . . . . . . . . . . . . . . . . .

Gwinnett Youth Apprenticeship . . . . . . . . . . . . . . . . . . . . . . . . . . . . . . . . . .Illinois State Board of Education . . . . . . . . . . . . . . . . . . . . . . . . . . . . . . . . .Manufacturing Technology Partnership . . . . . . . . . . . . . . . . . . . . . . . . . . . .MechTech, Inc. . . . . . . . . . . . . . . . . . . . . . . . . . . . . . . . . . . . . . . . . . . . . . .Middle Georgia Aerospace . . . . . . . . . . . . . . . . . . . . . . . . . . . . . . . . . . . . .OaklandWorks . . . . . . . . . . . . . . . . . . . . . . . . . . . . . . . . . . . . . . . . . . . . . .Pennsylvania Youth Apprenticeship Program . . . . . . . . . . . . . . . . . . . . . . .Scripps Ranch High School . . . . . . . . . . . . . . . . . . . . . . . . . . . . . . . . . . . . .Sears/Davea . . . . . . . . . . . . . . . . . . . . . . . . . . . . . . . . . . . . . . . . . . . . . . . .Seminole County/Siemens . . . . . . . . . . . . . . . . . . . . . . . . . . . . . . . . . . . . .Toledo Private Industry Council . . . . . . . . . . . . . . . . . . . . . . . . . . . . . . . . .Workforce LA Youth Academies . . . . . . . . . . . . . . . . . . . . . . . . . . . . . . . . .
Program Participation . . . . . . . . . . . . . . . . . . . . . . . . . . . . . . . . . . . . . . . . . . . . . .Meeting Student Expectations . . . . . . . . . . . . . . . . . . . . . . . . . . . . . . . . . . . . . . . .School-Based Learning . . . . . . . . . . . . . . . . . . . . . . . . . . . . . . . . . . . . . . . . . . . . .Work-Based Learning . . . . . . . . . . . . . . . . . . . . . . . . . . . . . . . . . . . . . . . . . . . . . .Integrating School and Work . . . . . . . . . . . . . . . . . . . . . . . . . . . . . . . . . . . . . . . . .Program Partnerships . . . . . . . . . . . . . . . . . . . . . . . . . . . . . . . . . . . . . . . . . . . . . .Resources Used in Program Planning and Implementation . . . . . . . . . . . . . . . . .Study Conclusions . . . . . . . . . . . . . . . . . . . . . . . . . . . . . . . . . . . . . . . . . . . . . . . . .
IV. Helping the Nation’s Unemployed . . . . . . . . . . . . . . . . . . . . . . . . . . . . . . . . . . . . . .
The Washington State Self-Employment Demonstration . . . . . . . . . . . . . . . . . . . . . . . . .Overview . . . . . . . . . . . . . . . . . . . . . . . . . . . . . . . . . . . . . . . . . . . . . . . . . . . . .The SEED Demonstration . . . . . . . . . . . . . . . . . . . . . . . . . . . . . . . . . . . . . . . . . . .Implementation Results . . . . . . . . . . . . . . . . . . . . . . . . . . . . . . . . . . . . . . . . . . . . .Self-Employment Impacts . . . . . . . . . . . . . . . . . . . . . . . . . . . . . . . . . . . . . . . . . . .Wage and Salary Employment Impacts . . . . . . . . . . . . . . . . . . . . . . . . . . . . . . . . .Impacts on Total Employment and Earnings . . . . . . . . . . . . . . . . . . . . . . . . . . . . .Impacts Using Administrative Data . . . . . . . . . . . . . . . . . . . . . . . . . . . . . . . . . . . .Indirect Impacts on Job Creation and Job Satisfaction . . . . . . . . . . . . . . . . . . . . .Conclusions . . . . . . . . . . . . . . . . . . . . . . . . . . . . . . . . . . . . . . . . . . . . . . . . . . . . .
From Unemployment To Self-Employment: Interim Report on the UI Self-Employment Demonstration . . . . . . . . . . . . . . . . . . . . . . . . . . . . . . . . . .
Overview . . . . . . . . . . . . . . . . . . . . . . . . . . . . . . . . . . . . . . . . . . . . . . . . . . . . .The Demonstration Projects . . . . . . . . . . . . . . . . . . . . . . . . . . . . . . . . . . . . . . . . .Experimental and Operational Designs . . . . . . . . . . . . . . . . . . . . . . . . . . . . . . . . .
Massachusetts . . . . . . . . . . . . . . . . . . . . . . . . . . . . . . . . . . . . . . . . . . . . . .Washington . . . . . . . . . . . . . . . . . . . . . . . . . . . . . . . . . . . . . . . . . . . . . . . . .
Data Sources . . . . . . . . . . . . . . . . . . . . . . . . . . . . . . . . . . . . . . . . . . . . . . . . . . . . .Demonstration Implementation . . . . . . . . . . . . . . . . . . . . . . . . . . . . . . . . . . . . . . .Employment and Earnings . . . . . . . . . . . . . . . . . . . . . . . . . . . . . . . . . . . . . . . . . . .Impacts on Job Creation and UI Outcomes . . . . . . . . . . . . . . . . . . . . . . . . . . . . . .Implementation Summary . . . . . . . . . . . . . . . . . . . . . . . . . . . . . . . . . . . . . . . . . . .
Conclusions . . . . . . . . . . . . . . . . . . . . . . . . . . . . . . . . . . . . . . . . . . . . . . . . . . . . .
From Unemployment to Self-Employment: Final Report on the UI Self-Employment Demonstration . . . . . . . . . . . . . . . . . . . . . . . . . . . . . . . . .
Overview . . . . . . . . . . . . . . . . . . . . . . . . . . . . . . . . . . . . . . . . . . . . . . . . . . . . .Findings . . . . . . . . . . . . . . . . . . . . . . . . . . . . . . . . . . . . . . . . . . . . . . . . . . . . .
V. Program Development and Improvement . . . . . . . . . . . . . . . . . . . . . . . . . . . . . . . .
Alternative Unemployment Insurance Base Periods . . . . . . . . . . . . . . . . . . . . . . . . . . . .Overview . . . . . . . . . . . . . . . . . . . . . . . . . . . . . . . . . . . . . . . . . . . . . . . . . . . . .The Alternative Base Period . . . . . . . . . . . . . . . . . . . . . . . . . . . . . . . . . . . . . . . . .Conclusions . . . . . . . . . . . . . . . . . . . . . . . . . . . . . . . . . . . . . . . . . . . . . . . . . . . . .
Increasing the Federal Taxable Wage Base for Unemployment Insurance . . . . . . . . . . .Overview . . . . . . . . . . . . . . . . . . . . . . . . . . . . . . . . . . . . . . . . . . . . . . . . . . . . .Federal and State Taxable Wage Bases . . . . . . . . . . . . . . . . . . . . . . . . . . . . . . . .Rationale for Raising the Federal Taxable Wage Base . . . . . . . . . . . . . . . . . . . . .Study Methodology . . . . . . . . . . . . . . . . . . . . . . . . . . . . . . . . . . . . . . . . . . . . . . . .Study Findings . . . . . . . . . . . . . . . . . . . . . . . . . . . . . . . . . . . . . . . . . . . . . . . . . . . .
Macroeconomic Estimates . . . . . . . . . . . . . . . . . . . . . . . . . . . . . . . . . . . . .Universe Data . . . . . . . . . . . . . . . . . . . . . . . . . . . . . . . . . . . . . . . . . . . . . . .Sample Data . . . . . . . . . . . . . . . . . . . . . . . . . . . . . . . . . . . . . . . . . . . . . . . .
Extended Unemployment Insurance Benefit Triggers . . . . . . . . . . . . . . . . . . . . . . . . . . .Overview . . . . . . . . . . . . . . . . . . . . . . . . . . . . . . . . . . . . . . . . . . . . . . . . . . . . .Historical Use of Triggers . . . . . . . . . . . . . . . . . . . . . . . . . . . . . . . . . . . . . . . . . . . .Study Methodology . . . . . . . . . . . . . . . . . . . . . . . . . . . . . . . . . . . . . . . . . . . . . . . .Study Findings . . . . . . . . . . . . . . . . . . . . . . . . . . . . . . . . . . . . . . . . . . . . . . . . . . . .
Annotated Bibliography of Research and Evaluation ReportsCompleted During Program Years 1985-94 . . . . . . . . . . . . . . . . . . . . . . . . . . .
Statistical Appendix . . . . . . . . . . . . . . . . . . . . . . . . . . . . . . . . . . . . . . . . . . . . . . . . .

Transmittal Letter of the Secretary of Labor ETA To Produce Camera-Ready Copy and Insert Here

Acknowledgements
This edition of the Training and Employment Report of the Secretary of Laborwas written under the direction of the Department of Labor’s Employment and TrainingAdministration (ETA), Office of Policy Research. It was prepared under contract No. K-5548-5-00-80-30 by the Landini Group: Michael Landini and Frances Oliver. Theproject manager for the contract was Mary Vines.
The major components of ETA contributed material and valuable assistance. The text was reviewed by appropriate agencies within the Department and by the Officeof Management and Budget.
Abbreviation and Acronym List
The following are abbreviations and acronyms used throughout this edition andrecent editions of the Training and Employment Report of the Secretary of Labor. (c =acronym used in this (current) edition; r = used in recent edition(s); b = used in bothcurrent and recent editions.)
ACRS . . . . . . . . . . . . Asian Counseling and Referral Service (c)
AES . . . . . . . . . . . . . American Enterprise Systems (c)
AFDC . . . . . . . . . . . . Aid to Families with Dependent Children (b)
ALMIS . . . . . . . . . . . . America’s Labor Market Information System (c)
AMS . . . . . . . . . . . . . Agricultural Mediation Service (c)
AODA . . . . . . . . . . . . Alcohol and Other Drugs of Addiction (r)
AWW . . . . . . . . . . . . Average Weekly Wage (c)
BAG . . . . . . . . . . . . . Basic Assistance Grant (r)
BAT . . . . . . . . . . . . . . Bureau of Apprenticeship and Training (b)
BLS . . . . . . . . . . . . . . Bureau of Labor Statistics (b)
BQC . . . . . . . . . . . . . Benefits Quality Control (b)
CAETA . . . . . . . . . . . Clean Air Employment Transition Assistance (r)
CASAS . . . . . . . . . . . Comprehensive Adult Student Assessment System (c)
CBO . . . . . . . . . . . . . Community-Based Organization (c)
CDC . . . . . . . . . . . . . Community Development Corporation (c)
CDTI . . . . . . . . . . . . . Career Development Training Institute (c)
CETA . . . . . . . . . . . . Comprehensive Employment and Training Act (b)
CIDS . . . . . . . . . . . . . Career Information Delivery System (b)
CMI . . . . . . . . . . . . . . Computer-Managed Instruction (r)
CPS . . . . . . . . . . . . . Center for Practical Solutions (c)
CY . . . . . . . . . . . . . . . Calendar Year (b)
DCA . . . . . . . . . . . . . Defense Conversion Adjustment (c)
DCAP . . . . . . . . . . . . Defense Conversion Adjustment Program (b)
DDP . . . . . . . . . . . . . Defense Diversification Program (b)
DOD . . . . . . . . . . . . . U.S. Department of Defense (c)
DOT . . . . . . . . . . . . . Dictionary of Occupational Titles (b)
DUA . . . . . . . . . . . . . Disaster Unemployment Assistance (b)
EB . . . . . . . . . . . . . . . Extended Benefits (b)
Ecr . . . . . . . . . . . . . . European Community (r) EDWAA . . . . . . . . . . Economic Dislocation and Worker Adjustment Assistance (b)
EEO . . . . . . . . . . . . . Equal Employment Opportunity (b)
EER . . . . . . . . . . . . . Entered Employment Rate (c)
ENJSC . . . . . . . . . . . Employers' National Job Service Council (b)
ES . . . . . . . . . . . . . . . Employment Service (b)
ESA . . . . . . . . . . . . . Employment Standards Administration (r) ESOP . . . . . . . . . . . . Employee Stock Ownership Plan (c)
ETA . . . . . . . . . . . . . . Employment and Training Administration (b)
EUC . . . . . . . . . . . . . Emergency Unemployment Compensation (b)
FCA . . . . . . . . . . . . . Federal Committee on Apprenticeship (b)

FCM . . . . . . . . . . . . . Friends of Children of Mississippi (c)
FUTA . . . . . . . . . . . . Federal Unemployment Tax Act (c)
FY . . . . . . . . . . . . . . . Fiscal Year (b)
GATB . . . . . . . . . . . . General Aptitude Test Battery (c)
GED . . . . . . . . . . . . . General Educational Development (also General Equivalency Degree) (b)
GM . . . . . . . . . . . . . . General Motors (c)
GRASP . . . . . . . . . . . Greater Atlanta Small Business Project (c)
GSA . . . . . . . . . . . . . General Services Administration (r)
HHS . . . . . . . . . . . . . U.S. Department of Health and Human Services (r)
HUD . . . . . . . . . . . . . U.S. Department of Housing and Urban Development (b)
IAM . . . . . . . . . . . . . . International Association of Machinists (c)
ICESA . . . . . . . . . . . . Interstate Conference of Employment Security Agencies (c)
IDP . . . . . . . . . . . . . . Immigrant Training Demonstration Project (c)
IEP . . . . . . . . . . . . . . Individualized Education Plan (c)
IG . . . . . . . . . . . . . . . Inspector General (r)
IJB . . . . . . . . . . . . . . Interstate Job Bank (r)
INA . . . . . . . . . . . . . . Indian and Native American (b)
INRA . . . . . . . . . . . . . Immigration Nursing Relief Act (b)
INS . . . . . . . . . . . . . . Immigration and Naturalization Service (r)
IRI . . . . . . . . . . . . . . . Integrated Resources Institute (c)
ITP . . . . . . . . . . . . . . Individual Transition Plan (c)
IUR . . . . . . . . . . . . . . Insured Unemployment Rate (c)
JOBS . . . . . . . . . . . . Job Opportunities and Basic Skills Training Program (b)
JSA . . . . . . . . . . . . . . Job Search Assistance (c)
JSEC . . . . . . . . . . . . Job Service Employer Committee (c)
JTHDP . . . . . . . . . . . Job Training for the Homeless Demonstration Program (b)
JTLS . . . . . . . . . . . . . Job Training Longitudinal Survey (r)
JTPA . . . . . . . . . . . . . Job Training Partnership Act (b)
JTQS . . . . . . . . . . . . Job Training Quarterly Survey (r)
LEDC . . . . . . . . . . . . Local Economic Development Corporation (c)
LMI . . . . . . . . . . . . . . Labor Market Information (c)
MEGA . . . . . . . . . . . . Muskegon Economic Growth Alliance (c)
MIS . . . . . . . . . . . . . . Management Information System (c)
MSFW . . . . . . . . . . . Migrant and Seasonal Farmworker (c)
MTP . . . . . . . . . . . . . Manufacturing Technology Partnership (c)
NAFTA . . . . . . . . . . . North American Free Trade Agreement (b)
NASTAD . . . . . . . . . . National Association of State and TerritorialApprenticeship Directors (r)
NAWS . . . . . . . . . . . . National Agricultural Workers Survey (c)
NCEP . . . . . . . . . . . . National Commission for Employment Policy (b)
NIST . . . . . . . . . . . . . National Institute of Standards and Technology (b)
NJAS . . . . . . . . . . . . National Job Analysis Study (c)
NJTC . . . . . . . . . . . . New Jobs Tax Credit (c)
NOICC . . . . . . . . . . . National Occupational Information Coordinating Committee (b)
NSSB . . . . . . . . . . . . National Skill Standards Board (c)

NSW . . . . . . . . . . . . . National Supported Work (r)
NTIS . . . . . . . . . . . . . National Technical Information Service (b)
NWAC . . . . . . . . . . . National Workforce Assistance Collaborative (c)
OIG . . . . . . . . . . . . . . Office of the Inspector General (c)
OIS . . . . . . . . . . . . . . Occupational Information System (r)
OJT . . . . . . . . . . . . . . On–the–job training (b)
OLMID . . . . . . . . . . . Occupational Labor Market Information Database (c)
OMB . . . . . . . . . . . . . Office of Management and Budget (c)
OTIr . . . . . . . . . . . . . . Office of Treatment Improvement (HHS) (r)
P&D . . . . . . . . . . . . . Pilot and Demonstration (r)
Pir . . . . . . . . . . . . . . . Program Improvement (r)
PIC . . . . . . . . . . . . . . Private Industry Council (b)
P.L. . . . . . . . . . . . . . . Public Law (b)
PMR . . . . . . . . . . . . . Performance Measurement Review (b)
PSID . . . . . . . . . . . . . Panel Survey of Income Dynamics (b)
PTS . . . . . . . . . . . . . . Participant Tracking System (c)
PY . . . . . . . . . . . . . . . Program Year (b)
PYAP . . . . . . . . . . . . Pennsylvania Youth Apprenticeship Program (c)
QA . . . . . . . . . . . . . . Quality Appraisal (c)
QC . . . . . . . . . . . . . . Quality Control (b)
RQC . . . . . . . . . . . . . Revenue Quality Control (b)
SCANS . . . . . . . . . . . Secretary's Commission on Achieving Necessary Skills (b)
SCDB . . . . . . . . . . . . Single Client Data Base (r)
SCSEP . . . . . . . . . . . Senior Community Service Employment Program (b)
SDA . . . . . . . . . . . . . Service Delivery Area (b)
SDSUF . . . . . . . . . . . San Diego State University Foundation (c)
SEID . . . . . . . . . . . . . Self-Employment Initiative Demonstration (c)
SESA . . . . . . . . . . . . State Employment Security Agency (b)
SFSUF . . . . . . . . . . . San Francisco State University Foundation (c)
SJTCC . . . . . . . . . . . State Job Training Coordinating Council (b)
SOICC . . . . . . . . . . . State Occupational Information Coordinating Committee (b)
SSA . . . . . . . . . . . . . Substate Area (c)
SSO . . . . . . . . . . . . . Supportive Services Only (c)
SST . . . . . . . . . . . . . . Social Skills Training (r)
STEP . . . . . . . . . . . . Summer Training and Education Program (r) STI . . . . . . . . . . . . . . State Training Inventory (b)
SYETP . . . . . . . . . . . Summer Youth Employment and Training Program (b)
TAA . . . . . . . . . . . . . . Trade Adjustment Assistance (b)
TAR . . . . . . . . . . . . . Training Achievement Record (r)
TJTC . . . . . . . . . . . . . Targeted Jobs Tax Credit (b)
TRA . . . . . . . . . . . . . Trade Readjustment Allowance (b)
TRSS . . . . . . . . . . . . Training-Related Supportive Services (c)
TTRC . . . . . . . . . . . . Training Technology Resource Center (c)
TUR . . . . . . . . . . . . . Total Unemployment Rate (c)
UAW . . . . . . . . . . . . . United Automobile Workers (c)
UCFE . . . . . . . . . . . . Unemployment Compensation for Federal Civilian

Employees (b)
UCX . . . . . . . . . . . . . Unemployment Compensation for Ex–servicemembers (b)
UI . . . . . . . . . . . . . . . Unemployment Insurance (b)
UIASA . . . . . . . . . . . . Unemployment Insurance Automation Support Account (b)
UIS . . . . . . . . . . . . . . Unemployment Insurance Service (c)
VJSST . . . . . . . . . . . Volunteer Job Specific Skills Training (c)
WARN . . . . . . . . . . . Worker Adjustment and Retraining Notification Act (r)
WP/RS . . . . . . . . . . . Worker Profiling and Reemployment Services (c)
YFC . . . . . . . . . . . . . Youth Fair Chance (b)
YOU . . . . . . . . . . . . . Youth Opportunities Unlimited (r)
YRTAP . . . . . . . . . . . Youth Research and Technical Assistance Project (c)

1
CHAPTER 1
PROGRAMACTIVITIES

1The activities covered in Chapter 1 that operate on a program year (PY) basisare Job Training Partnership Act programs, the Senior Community Service EmploymentProgram, some aspects of the Employment Service, the National Commission forEmployment Policy, and the National Occupational Information CoordinatingCommittee. All others operate on a fiscal year (FY) basis.
2
PROGRAMACTIVITIES
INTRODUCTION
This chapter describes the programs operated by the Department of Labor’s
Employment and Training Administration (ETA) during Program Years 1993 and 1994
(July 1993 through June 1995) and Fiscal Years 1994 and 1995 (October 1993 through
September 1995).1 ETA oversees the Nation’s major job training, employment, and
unemployment compensation programs.
In addition to its ongoing programs, during the Report period, the Department
also created One-Stop Career Center systems, undertook efforts to improve labor
market information systems, started technical assistance and training initiatives to
enhance the skills of its own workforce, and worked toward passage of legislation on
and implementation of skill standards and school-to-work programs.
This introductory section reviews these projects, highlights other initiatives of the
Report period, and reports on special Job Training Partnership Act (JTPA) activities.
The remainder of the chapter provides information about specific programs for
which ETA is responsible: JTPA programs, Apprenticeship, the Senior Community
3
Service Employment Program, the Employment Service, Unemployment Insurance,
Trade Adjustment Assistance, NAFTA-Transitional Adjustment Assistance, Incumbent
Worker Training, and the Labor Surplus Areas Program. It also summarizes the
activities of two independent Federal organizations responsible for employment-related
activities–the National Commission for Employment Policy and the National
Occupational Information Coordinating Committee.
One-Stop Career Center Systems andLabor-Market Information Initiatives
During the Report period, the Department further developed One-Stop Career
Center Systems. In supporting the “one-stop” concept, the Department established a
One-Stop/Labor Market Information team to help improve employment and training
opportunities for the American public.
One-Stop Career Center Systems
A common frustration among jobseekers and employers has been the difficulty
of finding adequate information about available training and employment programs.
Often, jobseekers must go from one place to another to receive needed information and
services.
The Department took steps during the Report period to address this problem. It
established One-Stop Career Centers–helping to ensure that U.S. workers have access
to the education, training, and information they need to succeed in today’s demanding
labor market. The Centers bring together an array of employment and training
programs, turning them into an integrated service delivery system for jobseekers and
employers alike.
Although One-Stop Centers may take many forms, they all offer the following
services:
4 Information on a full array of employment-related services, including

2 For additional information, see “Job Training 2000 Projects” and “Evaluation ofthe Job Training 2000 One-Stop Career Centers Demonstration” under Pilot andDemonstration Programs in the JTPA section of this chapter.
4
information about local education and training service providers.
4 Assistance in filing initial claims for unemployment insurance and in evaluating
eligibility for any job training and education programs, including availability of
student financial aid.
4 Preliminary assessment of skill levels, aptitudes, abilities, and support service
needs (which may include individual and/or group counseling).
4 Self-help information relating to career exploration and the skill requirements of
various occupations; career planning information; job vacancy announcements
and listings; job search (including resume writing) assistance; job recruitment,
referral, and job placement services.
The One-Stop Career Center System is built on the following principles: (1)
universality–accessibility to all job-seekers of a wide array of jobseeking and
employment services; (2) customer choice–employers and jobseekers have choices in
where and how they get information and services; (3) integration–a seamless approach
which requires integration of programs and services at the State and local levels; and
(4) performance driven, outcome-based measures–Career Centers must have clear
expectations, such as job placements, and consequences for failing to meet them.
PY 1993 activities were devoted to research and development efforts in this
area. A case study analysis was conducted of 10 Private Industry Council-sponsored
Centers operating from June 1993 to December 1994.2
Several One-Stop Career Center Systems began operating in October 1994, as
six States–Connecticut, Iowa, Maryland, Massachusetts, Texas, and Wisconsin–
received grants totaling $21.5 million for the One-Stop system and $7 million for labor
market information systems. In January 1995, the Department announced that three
more States–Indiana, Minnesota, and Ohio–would receive over $15 million for
implementation activities. In addition, 19 States received $4.9 million on October 1994

3The National Occupational Information Coordinating Committee (NOICC) is anindependent Federal interagency committee authorized by JTPA and the PerkinsVocational and Applied Technology Education Act. More information about NOICCmay be found in the last section of this chapter.
5
for One-Stop Career Center planning and development, and 10 grants totaling $3.7
million were awarded to local communities in recognition and support of their innovative
work in making the One-Stop system a reality.
The Department expects to offer One-Stop system planning and development
grants to all of the remaining States and territories.
America’s Labor Market Information System (ALMIS)
In order to ensure that current and future workers know about different labor
markets and available job openings throughout the Nation, ETA and the Department’s
Bureau of Labor Statistics (BLS) reviewed the available labor market information and
systems in the United States. Begun in late PY 1993, the review was done in
cooperation with the Interstate Conference of Employment Security Agencies (ICESA),
the National Occupational Information Coordinating Committee (NOICC)3, and others.
It found significant gaps in the information available that would allow jobseekers,
workers, employers, and others to fully understand local labor markets and make
informed career decisions.
The LMI team then developed a series of recommendations to fill those gaps
and to create a comprehensive system of State and local labor market
information–known as America's Labor Market Information System.
In PY 1994, to further the team’s recommendations, the Department:
4 Provided grants to all States to build their LMI capacity and to create a set of
core products and services.
4 Supported the creation of research and development consortia to provide the
intellectual and research base for core products and services in the future and to

4The JTPA Amendments of 1992, which went into effect at the beginning of PY1993, created a national training and technical assistance initiative. Intended to focus
6
transfer best practices from State to State. The research topics and lead States
are: (1) Wage Records as an LMI Tool (Maryland); (2) Short-term Forecasts
(Illinois); (3) Long-term Projections (Nevada); (4) Standard Wage Information
(Rhode Island and Alaska); (5) LMI Institute (South Carolina); (6) Employer
Database (Maine); and (7) Consumer Reports (Texas).
4 Supported the creation/expansion of a job/talent bank network. Investments
are being made in three types of improvements for the current labor exchange
operated by the Employment Service around the country: (1) making America’s
Job Bank and various State job banks accessible via the Internet and improving
access and ease of search for these job banks; (2) creating, probably in
partnership with the newspapers, electronically searchable want ads; and (3)
creating a nationwide network of “talent banks.”
4 Provided support for the LMI infrastructure within the “One-Stop”
implementation States, primarily to build the delivery technology to make
information available to the One-Stop customers (both those in the Centers and
those in remote locations).
The One-Stop/LMI team is building a framework within which States and local
entities have the flexibility to design One-Stop Centers that are customized to their
particular needs, while incorporating four broad principles that characterize the National
system: universal access, customer choice, integration of services, and outcome-based
standards of performance.
Improving the Nation’s Employment and Training System
During the Report period, the Department emphasized staff training within the
employment and training system, recognizing the importance of building its own high-
skilled workforce to deliver services for the Nation’s jobseekers.4

primarily on Title II-A activities, the initiative has since expanded to become anintegrated, coordinated, systemwide effort. (See the JTPA section of this Chapter formore information about the amendments.)
7
The emergence of the One-Stop Career Center systems, restructuring of
services to dislocated workers, welfare reform, and the new strategies for helping youth
make the transition from school to work placed new demands on agencies, managers,
and professionals who administer and provide employment and training services.
Further demands on staff are expected as Congress revisits the roles and
responsibilities of the national workforce development system.
The Department is working with its National, State, and local partners to build a
learning network to help them effectively respond to the changing requirements of the
workforce development system and its customers.
Among the activities initiated as part of the training and technical assistance
effort during the Report period were the following.
4 A Panel of Experts, including 34 National, State, and local partners from all
major sectors of the employment and training system, was convened to guide
and oversee training and technical assistance efforts. Among the programs and
initiatives represented are JTPA Titles II and III, the Enterprise Council, the
Employment Service, One-Stop Centers, and Job Opportunities and Basic Skills
(JOBS) initiatives.
4 A survey of staff was conducted to identify training, technical assistance, and
other needs of frontline staff.
4 Partners are working together to define the core skills, knowledge, and abilities
needed by training and employment staff in order to identify common functions
and to develop training curricula in related subject areas. Partners are also
working together to identify and validate program models, training, and other
resources.
4 Two of the Department’s regional offices are piloting peer-to-peer projects that
will help build a framework and design tools that professionals in the system can

8
use to help each other.
4 Two other regional offices have joined together to develop quality improvement
tools and techniques to help local and State agencies implement systems that
enhance customer satisfaction and continuously improve service quality.
4 Ten States are developing or improving cross-agency training delivery
systems, innovative and replicable program models, and broadly applicable
training products.
4 State Training Institutes are working with the Department to enhance State
and local staff development training design and delivery and to bring their
knowledge and expertise into developing a National training and technical
assistance strategy.
4 Training sessions, materials, and tools are being delivered to address
technical assistance needs in various program areas.
4 New technology is being used to electronically share information and transfer
learning, including the use of an Electronic Service Center and World-Wide Web.
(See the JTPA section of this Chapter for additional information on technical
assistance and training efforts and “challenge grants” awarded by the Department.)
Skill Standards and Certification
Since the early 1990s, the Department has worked to develop a national system
of voluntary skill standards and certification. This voluntary system was designed to
increase the return on public and private investments in education and training by: (1)
improving the match between skills needed in the workplace and the skills imparted
through education and training; (2) enhancing economic competitiveness; (3) increasing
productivity; and (4) facilitating the transition of American business to high performance
work organizations.
During the Report period, the Department continued its efforts in this area by
overseeing the operation of the National Skill Standards Board, funding and providing
technical assistance to several new demonstration projects, and by supporting a

9
number of related activities which are described below.
National Skill Standards Board
In March 1994, Congress passed the Goals 2000: Educate America Act which
established a national framework of voluntary skill standards to be administered by a
National Skill Standards Board. The Board identifies broad clusters of major
occupations that involve one or more industries, and endorses standards, assessment,
maintenance, and certification systems. The legislation also requires the Board to work
closely with the National Education Standards and Improvement Council to coordinate
the development of skill standards with the development of voluntary national content
standards.
The Board is composed of 28 members. Twelve are selected by the President,
six are selected by the Speaker of the House (based on recommendations by both
Majority and Minority Leaders), and six are selected by the President pro tempore of the
Senate (also based on recommendations by the Majority and Minority Leaders). Four
ex-officio, nonvoting members (the Secretaries of Labor, Education, and Commerce
and the Chair of the National Education Standards and Improvement Council) are also
represented. Voting members include:
4 Eight business persons nominated by business and trade associations;
4 Eight organized labor persons nominated by recognized national labor
federations;
4 Two human resource professionals to be “neutral agents;” and
4 Six persons, with at least one from each of the following groups: educational
institutions (including vocational education); community-based organizations;
State and local governments; and nongovernmental civil rights organizations.
In PY 1994, 27 of the 28 Board members and the executive director were
appointed. The Board met in April and June of 1995. Topics discussed ranged from

10
Wisconsin’s youth apprenticeship activities to foreign experience with skill standards
systems.
Demonstration Programs
In an effort to build on its previous workforce development efforts, the
Department funded six demonstration projects in late PY 1992 and developed a team of
individuals from different sections of ETA to work with the projects and advance the
idea of voluntary national skill standards. An additional 16 projects were funded by the
U.S. Department of Education.
The grants were issued to six trade associations or combined industry
association foundations to: (1) convene a coalition of industry partners; (2) select
occupational areas for standards development; and (3) to develop and implement
voluntary industry skill standards and certification systems. These projects were
operated by the American Electronics Association; the Council on Hotel, Restaurant
and Institutional Education; the National Electrical Contractors Association; the National
Tooling and Machining Association; the National Retail Federation; and the Uniform
and Textile Service Association.
Each project demonstrated an approach for developing, implementing, and
gaining industry acceptance for skill standards and certification in the United States.
Seven phases were suggested for each project:
4 Establish a coalition of industry partners;
4 Identify occupations that are appropriate for skill standards development;
4 Develop and validate skills standards within industries for these occupations;
4 Identify appropriate training delivery mechanisms and processes;
4 Develop and validate assessments to demonstrate mastery of skill standards;
4 Establish certification to recognize the achievement of skill standards; and
4 Establish implementation and marketing strategies for the adoption of skill
standards.

5That definition is: “A competency unit which includes a description of work forwhich the standard applies; a listing of the essential knowledge and skills that arecritical to the work segment; a listing of the essential tools and equipment that arecritical to the work segment, if applicable; and the criteria used to measure competencyin performing the work segment.”
11
The Department's skill standards team worked with several contractors who
provided technical assistance to the projects and to the Department through written
material and two meetings for the project directors.
To provide technical assistance to the projects, the Institute for Educational
Leadership organized a roundtable discussion on assessment and credentialing at the
Department in March 1994. Several guiding principles for an ideal assessment system
were identified. These include:
4 The system should be standards-based;
4 It should be jointly developed by industry representatives and educators;
4 It should include a variety of assessment tasks;
4 The system should have performance-based assessments;
4 It should include technical quality as a primary consideration; and
4 The system should include equity and legal defensibility.
Participants developed a preferred definition of skill standards.5 The roundtable
also addressed ways to categorize the different areas of skills and knowledge to be
assessed–including the preferred model of knowledge, occupational skills, basic skills,
and cross-functional skills; the importance of conducting a needs analysis among the
stakeholder groups to determine how to encourage their participation in the programs;
and the development of plans to establish viability and financing requirements.
In PY 1993, the projects focused on the first four phases listed above. In PY
1994, five of the projects released their standards.
Business/Trade Association Initiative
In promoting the adoption of high-performance workplaces, the Department's

12
Office of the American Workplace’s Business/Trade Association Initiative formed
partnership agreements with three Skill Standards Pilot Projects–the American
Electronics Association; the Council of Hotel, Restaurant and Institutional Education;
and the National Retail Federation. The agreements outline a number of initiatives that
will further the understanding and dissemination of high-performance concepts to
diverse industry audiences.
National Youth Apprenticeship Program
The National Retail Federation and the Council on Hotel, Restaurant and
Institutional Education are sharing their skill standards experience with McDonald's
Corporation for a program designed to help shape the skills and competencies of young
people entering the consumer service industry.
The program, known as the National Youth Apprenticeship Program, will
implement a comprehensive career development training system in business
management at participating schools and the McDonald's Corporation. The
Department’s Employment and Training Administration is providing $300,000 for the
effort, which will feature comprehensive preemployment training, ongoing employee
training, and a performance/skill standards and certification system that establishes
career paths within McDonald's and other participating retail corporations.
The funding is being used for a national advisory group, refinement of youth
apprenticeship and student mentoring efforts, development of a workplace skills
certificate, program development for at-risk youth, project evaluation, and information
dissemination.
WorkPlus
During the Report period, the Council on Hotel, Restaurant and Institutional
Education, the National Retail Federation, and the National Grocers Association agreed
to work with a new program known as “WorkPlus” in an effort to pilot test the application

6For additional information, call (800) 488-0901.
13
of their standards through a portable “Preliminary National Service Credential.”
Public/Private Ventures, a Philadelphia-based organization, is pilot testing the new
education and training program designed to better meet the needs of both employers
and young workers.
WorkPlus is intended to increase the productivity of entry-level hospitality, food
service, and retail workers by taking into consideration the natural tendency of young
workers to explore occupations by changing jobs frequently. It rotates participants after
several months to another job, sometimes with different employers, thus offering young
workers a variety of experiences, while allowing them to build credentials for additional
skills.
Information Dissemination
The Department's Training Technology Resource Center (TTRC) worked on
ways to allow businesses and educators to have electronic access to information about
skill standards. TTRC manages databases on such workforce development issues as
workplace reorganization, exemplary training programs, emerging training technologies,
and related policy issues. Housed in ETA, TTRC manages an on-line information
system that serves as a central repository on workforce development issues.6
School-To-Work Opportunities
The School-to-Work Opportunities Act of 1994 (P.L. 103-239), enacted in May
1994 and jointly administered by the Departments of Education and Labor, paves the
way for a new approach to learning in America. Through this Act, States and localities
are building school-to-work systems that prepare young people for further education
and careers in high-skill, high-wage jobs.

14
The School-to-Work initiative is based on the concept that education for all
students can be made more relevant and useful to future careers and lifelong learning.
Students apply what they learn to real life, real work situations.
Developed with the input of business, education, labor, and community-based
organizations that have a strong interest in how students prepare for the workplace of
the next century, the effort to create a national school-to-work system contains three
fundamental elements:
4 Work-based learning. Employers provide structured learning experiences for
students that develop broad, transferable skills. Work-based learning provides
students with opportunities to study complex subject matter and obtain
workplace skills in a hands-on “real life” environment.
4 School-based learning. School-to-Work programs restructure the educational
experience so that students learn rigorous academics through career
applications. Teachers work closely with employers to develop broad-based
curricula that help students understand and expand on the lessons of their work
experience. Students develop projects and work in teams, much like the modern
workplace.
4 Connecting activities. Connecting activities ensure the coordination of the
work-and school-based learning components of a School-to-Work system.
Activities may include matching students with the work-based learning
opportunities of employers, linking participants with other community services
necessary to assure a successful transition from school to work, and increasing
opportunities for minorities, women, and people with disabilities.
While the School-to-Work Opportunities Act was being considered in Congress,
the Administration used existing Federal authority and funds to begin the initiative and
further State and local school-to-work partnerships nationwide. In early 1994, all 50
States, Puerto Rico, and the District of Columbia received State Development Grants to
design plans for implementing comprehensive statewide School-to-Work Opportunities
systems.
In July 1994, eight States received Implementation Grants totaling $43 million to

15
put in place or expand their school-to-work opportunities systems. Subject to
appropriations, the grants are renewable for five years. In addition, 15 local school-to-
work partnerships were funded competitively for approximately $10 million in August
1994. In November 1994, 21 partnerships in urban and rural, high-poverty areas
received competitive grants for local school-to-work opportunities initiatives totaling $10
million. In June 1995, nine School-to-Work Opportunities Grants for Indian Youth were
awarded to partnerships including schools funded by the Bureau of Indian Affairs. Also,
development grants were awarded to the seven insular territories with PY 95 funds.
In December 1994, the President and 18 chief executive officers of major
corporations announced the creation of the National Employer Leadership Council.
Members of the Council help implement school-to-work programs throughout their
companies and encourage suppliers and other companies to create their own school-
to-work programs. Members of large and small businesses are represented on the
Council.
In January 1995, the Departments of Labor and Education jointly opened the
National School-to-Work Opportunities Office. The Office worked with the States to
develop a Glossary of Terms to ensure that data used for evaluating programs funded
by the Departments are comparable. The Office also worked with States to develop
and refine an initial set of performance measures to determine States’ progress in
establishing high-quality school-to-work opportunity systems.
In June of 1995, the National School-to-Work Learning and Information Center
was established. The Center is housed in, and managed by, the National School-to-
Work Office. The main tasks of the Learning Center are to provide technical assistance
and to disseminate information to School-to-Work grantees as well as the general
public. One of the unique features of the Center is the establishment of technical
assistance “lines of credit” for State Implementation Grantees. This mechanism allows
States to select from a bank of certified technical assistance providers and use their line
of credit to finance the services. These experts are assisting States to refine key
aspects of system-building, such as curriculum development and creating career
majors.

16
A National School-to-Work Advisory Board was established in 1995 to examine
what is working and what is not working in school-to-work. It also provides advice on
national policy directions in the school-to-work area. The Board, appointed early in PY
1995, is also evaluating the effectiveness of the Federal Government’s investments in
furthering the School-To-Work Opportunity System. The 40-member board had its first
meeting in March 1996.
The Department also developed a marketing plan for School-to-Work late in PY
1994. The plan included a series of print and electronic advertisements. A television
special, entitled “JOBS: The Class of 2000” was developed through a grant with a
Pittsburgh-based PBS station. The show is scheduled to air in September 1996. A
Speaker's Kit, which includes speaking tips, model speeches on school-to-work, and
appropriate overheads, was produced and made available to selected employer, labor,
and education representatives. These “School-to-Work Ambassadors” raise public
awareness about the benefits of school-to-work systems. A media guide, completed in
the fall of 1995, helps local organizations get their school-to-work initiatives featured in
the news.
A range of technical assistance conferences, involving all grantees at the State
and local levels, were held in the Report period. The conferences allowed participants
to share promising practices and to discuss the effectiveness of various policies.
Meetings were also held with employer, labor, and community organization
stakeholders to solicit their views and to share information. “Bidders conferences” for
partnerships interested in applying for upcoming 1995 School-to-Work Opportunities
Grants were planned for the fall of 1995.
In PY 1995, 19 additional State Implementation grants in the amount of $74
million were awarded. During the same period, 37 Local Partnership Grants in the
amount of $20 million were awarded. Up to 35 Urban/Rural Opportunities Grants in the
amount of $17 million will also be awarded in PY 1995.
Other Project Highlights

7The cities were: Detroit, Michigan.; Sunnyvale and San Jose, California;Louisville, Kentucky; Bangor, Maine; Seattle, Washington; San Antonio, Texas;Minneapolis, Minnesota; Englewood, Colorado; New York, New York; Boston,Massachusetts; Philadelphia, Pennsylvania; and Davenport, Iowa.
17
During the Report period, the Department undertook a number of initiatives to
improve the employment and training system. It held a conference and published a
study on what works best in job training. The Department also initiated the Enterprise
Project to promote quality management of dislocated worker programs, awarded a
grant to promote customer choice for dislocated workers, conducted a survey on
employer-provided training, and undertook a nationwide assessment of skills required
for the high-performance workplace.
What is Working in Employment and Training
The Department engaged in a number of activities to determine the most
effective ways of serving the Nation’s jobseekers. Focusing on what works best in
employment and training programs, the Department held a national workforce
conference in 1994 and issued a comprehensive review of literature on the topic in
1995.
Conference on Building a Reemployment System. The Secretary of Labor
served as panel moderator at a day-long conference on “Building the Reemployment
System: What's Working,” held in the District of Columbia in February 1994. Over 300
business, community, and labor leaders, together with elected officials, consumers, and
employment and training experts, gathered to learn what works best in helping
unemployed and dislocated workers move back into the workforce. The President
served as a panelist in one session, along with program operators and participants.
Representatives from successful training programs in 13 cities presented their
experiences to attendees.7 Each of the programs encompassed at least one of several
features, such as customer focus, universal access, one-stop delivery, comprehensive

8These elements were the key features of the Administration’s workforce securityinitiative, the Reemployment Act of 1994. Designed to make the national employmentsystem more accessible and responsive to all Americans seeking new or better jobs,the legislation was presented to Congress in March 1994. The Department providedstaff work on the legislation, which focused on increased choice, training andemployment system integration, providing market-driven training programs, andaccountability.
18
services, innovative use of technology, and training linked to jobs.8
Publication on “What is Working.” In January 1995, the Department released
a report entitled: What’s Working (and What’s Not): A Review of Evidence of the
Economic Impacts of Employment and Training Programs . A comprehensive review of
the literature on the results of education and training efforts, the report includes the
following:
4 There is now overwhelming evidence that long-term postsecondary training
produces positive impacts for those who need new skills.
4 Short-term training, especially for disadvantaged youth, has a mixed record of
success.
4 Government training for disadvantaged adults produces positive impacts and
is often a cost-effective investment for society. However, training alone is often
not sufficient to lift disadvantaged adults out of poverty.
4 The government’s major long-term training program for disadvantaged
youth–the Job Corps–appears to produce benefits for participants and society.
4 Job search assistance has produced positive impacts for most of the
populations for whom it has been tried, and is a highly cost-effective investment
for government.
Serving Dislocated Workers: The Enterprise Project
In PY 1993, the Department initiated a major effort to improve customer service
and satisfaction in dislocated worker programs. A “national customer satisfaction

19
survey,” completed in December 1993, revealed that 57 percent of the dislocated
workers who received services under JTPA's Title III rated the program as “extremely”
or “quite helpful.”
As part of this effort, the Department began the “Enterprise Project” to promote
and enhance the quality of all dislocated worker programs. The “Enterprise” is a
network of organizations that emphasize high-quality, customer-focused services, using
successful process management techniques from the private sector.
During the Report period, the Enterprise Council was appointed to serve as the
focal point for system-wide improvements. The Council–a group of local, State and
Federal officials broadly representative of the job training system–determined that if a
job training organization is to be accepted as an Enterprise member, it must meet the
following standards:
4 Achieve a rating of 75 percent on a standard customer satisfaction survey
administered by an independent research firm;
4 Achieve superior performance as measured by an 80 percent entered
employment rate in substate formula programs, and meet or exceed the
employment standard for Governor's reserve and national discretionary projects;
and
4 Demonstrate a commitment to continuous improvement through responses to
questions in ten critical quality management dimensions.
Over 200 dislocated worker organizations indicated their commitment to learning
more about customer satisfaction and quality systems. The Department provided
training to these organizations to help them qualify for Enterprise Membership.
In PY 1994, dislocated worker organizations from around the country took part in
a three-step application process to become Enterprise Members. Organizations
selected for membership attended "The Enterprise Launch" conference, held in
Washington, D.C. in July 1995, where they received training from nationally recognized
experts on quality management in both the public and private sectors.
20
Promoting Customer Choice for Dislocated Workers
In March 1995, the Department awarded California $18 million–the largest single
dislocated worker grant ever–to help nearly 5,000 southern California aerospace
workers who lost their jobs. The grant marked the first time dislocated workers
anywhere in the United States could have access to training and reemployment
services through a voucher system. Instead of being eligible for service in only one
location, workers used the vouchers as training tickets at any of the 14 Service Delivery
Areas in and around Los Angeles. Introducing the element of customer choice, the
grant ensured that workers had easy access to job placement services, career
counseling, and if necessary, skills training needed to find another job.
Training Survey
The “1993 Survey of Employer-Provided Training” was conducted by the Bureau
of Labor Statistics for ETA. Results showed that most employers make some type of
formal training available to their employees, but many offer training that is unrelated to
specific job skills, such as general orientation or safety training. Less than half of all
U.S. employers offer their workers formal job skills training to improve productivity and
increase wages.
As defined by BLS, formal training has a structured format and a defined
curriculum, and may be conducted by supervisors, company training centers,
businesses, schools, associations, or others. It may include classroom work, seminars,
lectures, workshops and audio-visual presentations. The survey measured six types of
formal training–orientation sessions, safety and health instruction, apprenticeship
training, basic skills training (reading and math), job skills training, and workplace-
related training.
Study of Job Skills and High Performance

9High performance workplaces invest heavily in training and continuous learning,equip workers with the education and skills they need to affect products and services,and encourage workers to become problem solvers, self-managers, and entrepreneurs.
21
In December 1994, the Department began the first nationwide assessment of
skills required for the “high-performance workplace”9 by surveying approximately 18,000
employees in the country's largest and fastest growing occupations.
The National Job Analysis Study assessed both generic skills (which cut across
occupational and industry lines) and those which directly relate to high-performance
workplaces. The 164 occupations reviewed employ approximately 92 million workers
across the country. The study is intended to help educators and trainers as they
redefine skill requirements for occupations, set skill standards, develop training
programs, and design school curricula linking education to the world of work. The study
is designed to help employers and employees make the transition to high-performance
workplaces and enable industries to set world-class skill standards.
Special JTPA Initiatives
Along with implementing changes called for by the JTPA Reform Amendments
that went into effect at the beginning of this Report period, the Department engaged in
a number of special JTPA initiatives to improve programs and to respond to a series of
national emergencies.
National Dialogue on Improving Job Training Services
The Department sponsored a nationwide series of meetings to explore ways to
improve and strengthen job training programs for economically disadvantaged citizens.
Fifteen small group discussions and five “town hall” meetings were held in June and

22
July 1994. The events gave Department officials and others an opportunity to learn
from program participants, program graduates, employers, program operators,
policymakers, labor representatives, and community leaders involved in JTPA and other
human service programs.
Emergency Grants
JTPA funds were used by the Federal Government to respond to a number of
emergencies during the Report period.
Flood Relief. In PY 1993, eight Midwest States–Iowa, Missouri, Illinois, South
Dakota, Minnesota, Wisconsin, Kansas, and Nebraska–received funding to create jobs
for workers displaced by massive flooding and to help with flood recovery in the
summer of 1993. Similar funding was awarded to the States of Georgia (in 1994) and
California (in 1995) for their flood recovery efforts.
Earthquake Aid. California received funding in January 1994 to help its
residents recover from the devastation suffered by the earthquake that struck the Los
Angeles area. The funding provided temporary jobs to dislocated workers and helped
support clean-up and recovery efforts.
Oklahoma City Bombing. In May 1995, the Department provided an
emergency grant to create temporary jobs to help clean up and restore public facilities
and lands damaged in the bombing of the Oklahoma City Federal Building. Workers
hired under the grant participated in recovery efforts provided by organizations such as
the Oklahoma County Office of Emergency Management, American Red Cross, and the
Salvation Army.
JOB TRAINING PARTNERSHIP ACT PROGRAMS
JTPA Overview

10Job training services under Titles II-A, II-B, and II-C are delivered through thefollowing administrative structures: (1) State Job Training Coordinating Councils(SJTCCs) which provide advice to Governors on training activities and recommend thedesignation of Service Delivery Areas (the geographical boundaries for administeringJTPA services). Governors appoint members to the Councils who represent business,State legislatures, State agencies, local government, educational agencies, labor,community-based organizations, and the general public; (2) Private Industry Councils(PICs), which are established by local elected officials in each Service Delivery Area toguide and oversee the development and operation of job training programs. PICmembership generally includes representatives from business, educational agencies,organized labor, rehabilitation agencies, welfare agencies, community-basedorganizations, economic development agencies, and the Employment Service. In orderto ensure that JTPA clients are trained for jobs that currently exist and that will continueto exist in the years ahead, most PIC members represent business and industry withina particular Service Delivery Area. The PIC chairperson is also a local businessrepresentative.
23
Since the Job Training Partnership Act’s implementation in 1983, its programs
have prepared millions of economically disadvantaged adults and youth, workers who
have lost their jobs because of plant closings or mass layoffs, and special populations,
such as Native Americans and migrant workers, to obtain the training and other help
needed to succeed in the labor market.
Under JTPA, businesses, educators, organized labor, rehabilitation agencies,
welfare agencies, community-based organizations, economic development agencies,
and local Employment Service offices work together to identify current and future
workforce needs, ensure that quality training is provided for eligible clients, and help
place clients in private sector jobs.10 For the most part, JTPA programs are managed
by State and local governments, although some programs authorized under Title IV are
funded directly by the Department of Labor and administered by local organizations.
The Department’s role in the JTPA system includes setting broad program
policy, allocating funds to the States, prescribing standards for the program’s overall
performance, monitoring and auditing State and local activities to ensure program and
fiscal integrity, providing technical assistance to policymakers and program operators,
evaluating the effectiveness of JTPA programs, supporting training and employment-

11The Amendments were signed on September 7, 1992 and took effect July 1,1993. They target JTPA programs to those seriously in need or at risk of failure in thelabor market; improve the quality of JTPA services through participant assessment andthe development of individual service strategies; institute new, rigorous fiscal andprocurement controls in order to strengthen program accountability; establish aseparate year-round youth program (Title II-C); create a new national capacity-buildingand replication program to improve program quality and the skills of staff whoadminister and deliver JTPA services; and authorize the creation of State HumanResource Investment Councils to help Governors plan and oversee coherent statewidesystems of vocational education and training.
12For more information about One-Stop Career Center Systems, see Dale W.Berry and Mona A. Feldman, Evaluation of One-Stop Career Center DemonstrationProjects (Arlington, Va.: TvT Associates, 1995) and Mona A. Feldman and Dale W.Berry, A Guide for Planning and Operating One-Stop Career Centers (Arlington, Va.:TvT Associates, 1995). These two publications are summarized in Chapter 2 of thisReport.
13For information about initiatives that serve dislocated workers, see David Drury,Stephen Walsh, and Marlene Strong, Evaluation of the EDWAA Job Creation
24
related research and demonstration projects, and directly administering some programs
that serve special population groups.
A number of important changes took place in the training and employment field
during Program Years 1993 and 1994.
First, in response to the JTPA Amendments of 1992 (P.L. 102-367), program
managers and operators further concentrated their efforts on serving “hard-to-serve”
clients–individuals who face serious and multiple barriers to employment.11
Second, the “one-stop” career center concept was developed, refined,
implemented, and studied12 in an effort to better meet the needs of a diverse set of
clients–from individuals looking for new jobs and workers seeking to enter or reenter the
labor market to clients seeking to upgrade their existing skills.
Third, the Department continued its efforts to restructure services to “dislocated”
workers (individuals who have lost their jobs because of plant closures or major layoffs)
because their skills may be not be adequate for today’s jobs.13 Also during the period,

Demonstration (Oakland, Calif.: Berkeley Planning Associates, 1994) and KatherineDickinson, et al., A Guide to Well-Developed Services For Dislocated Workers (MenloPark, Calif.: Social Policy Research Associates; Oakland, Calif.: Berkeley PlanningAssociates; and Menlo Park, Calif.: SRI International, 1994). These two publicationsare summarized in Chapter 2 of this Report. In addition to the EDWAA job creationdemonstration, the Department of Labor designed and implemented a new initiativeaimed at easing the transition to new employment of individuals who have beenadversely affected by cutbacks in defense spending. The National DefenseAuthorization Act of 1991 allocated $150 million to the Department of Labor to operatethe Defense Conversion Adjustment (DCA) Program, which is administered underSection 325 of Title III of JTPA. Twelve DCA demonstration grants were awarded inNovember 1992 (with a total of about $5 million in funding) and seven additional grants(with a total of about $3.4 million in funding) were awarded in November 1993. Theseprojects were funded to design and implement innovative approaches that were nototherwise found in standard JTPA Title III or defense conversion activities supported byother funding sources. For more information about the DCA demonstration effort, seeMary G. Visher and Deborah Kogan, Evaluation of the Defense Conversion AdjustmentDemonstration: Interim Report on Implementation (Oakland, Calif.: Berkeley PlanningAssociates and Menlo Park, Calif.: Social Policy Research Associates, 1994) which issummarized in Chapter 2 of this Report.
25
the Department developed new strategies to help young people and worked to build the
capacity of the Nation’s training and employment system to deliver quality JTPA
services.
The Department’s efforts to better meet the training and employment needs of
economically disadvantaged individuals are briefly highlighted below.
Technical Assistance and Training
One of the many changes brought about by the JTPA Amendments was the
creation of a national initiative to improve the quality of JTPA programs by upgrading
the skills of staff who design, manage, and deliver JTPA services.
Throughout Program Years 1993 and 1994, the Department was engaged in a
multi-tiered, highly collaborative technical assistance and training effort which
emphasized new training curricula, and encouraged the sharing of best practices

14The grant recipients were as follows: (1) Indiana received $125,000 to assessexisting staff competencies, develop a database of staff competencies, establishlearning objectives to improve staff competencies, and to train “peer” trainers to helplocal agencies meet their training needs; (2) Maryland received $125,000 to support aneffort of the Maryland Institute for Employment and Training Professionals to developcurricula for 13 separate courses and seminars for frontline training and employmentstaff in the field of program planning and design; (3) Massachusetts received $125,000to conduct a statewide needs assessment for frontline staff and to manage a strategythat includes interagency mentoring and training. Regional resource libraries will alsobe established for use by training and employment agency staff; (4) Michigan received$125,000 to create an interagency capacity-building team to oversee the developmentof new staff training curricula based on customer feedback from employers and jobseekers; (5) Missouri received $125,000 for the Missouri Training Institute to develop aprofessional certificate program as part of a five-year staff training and technicalassistance program. The Missouri grant also supports the development of new trainingdelivery techniques, new training curricula based on generic task analysis, and thedevelopment of techniques for measuring the effectiveness of staff training; (6)Montana received $115,000 to develop a State Interagency Capacity Building System;(7) New York received $73,680 to provide team-building training to the interagency staffat two One-Stop Service Centers; (8) Oregon received $125,000 to develop materialsand deliver training on the role of labor market information in career decision-making;(9) South Carolina received $106,920 to produce CD-ROM-based training modules onimproved career decision making skills, to purchase equipment needed to establishinteractive teleconferencing capabilities in eight local Job Service offices, and todevelop customer feedback techniques; and (10) Vermont received $95,622 to hire atraining coordinator and to develop a computer-based training system.
26
throughout the JTPA system. In support of these efforts, the Department awarded ten
“challenge grants” to further support projects that featured innovative training
techniques and effective program models.14
The technical assistance and training effort also encouraged the development of
quality systems, tools, and techniques to measure program improvement. The
Department provided numerous learning opportunities during the Report period
(conferences, training seminars, and technical assistance guides), and introduced and
promoted new technologies (e.g., computer-based learning and communication
resources) to better share program information.

27
Dialogue on the Disadvantaged
During PY 1994, the Department carried out a system-wide dialogue to examine
new directions that would lead to improved job training and employment preparation for
economically disadvantaged individuals–the majority of JTPA clients. Discussions were
held with JTPA partners at 15 locations across the country. These partners included
program administrators, operators and staff, JTPA clients and prospective clients,
employers, local elected officials, community leaders, and citizens with an interest in
training and employment services and workforce preparation.
The dialogue was designed to help achieve a broad consensus among JTPA
system partners on goals, overall strategy, and next steps for improving programs and
services for economically disadvantaged individuals.
Through the numerous discussions, the Department learned that participants
considered programs serving the economically disadvantaged to be essential, that the
JTPA system could be improved, and that there were effective models around the
country that met the needs of JTPA participants and local businesses.
Based on these discussions, the Department created an action agenda which
was integrated with its existing goals and work plans. The Department’s major
objectives were to:
4 Improve the connection between training and work;
4 Better meet the needs of JTPA clients–both employers and participants;
4 Streamline program administration;
4 Improve the quality of client information and client access to such information;
4 Strengthen linkages among the various programs and services;
4 Build system and staff capacity; and
4 Provide early and comprehensive training, education, employment, and other
interventions that meet the needs of disadvantaged youth.
28
Adult Programs, Title II-A
As a result of the JTPA Amendments of 1992, services for out-of-school youth, which were formerly provided under Title II-A,were offered under a new Title II-C beginning in PY 1993. Because the data on the number and characteristics of Title II-Aparticipants in this section of the Report refer to adults only (22years old and older), they are not necessarily comparable to prioryear data (which included youth now served under the new Title II-C).
Likewise, Title II-A expenditures for PY 1993 and PY 1994appear considerably less than previous years. Because the JTPAamendments authorized a new Title II-C for year-round services foryouth (who were formerly served under Title II-A), a significantamount of funds that had been used in Title II-A to serve youthbefore 1993 was shifted in PY 1993 and subsequent years to thenew Title II-C. Title II-C expenditures for PY 1993 were slightlyless than $554,000,000.
Background
Title II-A is JTPA’s basic program for economically disadvantaged adults, and
other adults who face significant employment barriers.
Eligibility is limited to individuals ages 22 and older who have, or are a member
of a family that has, a total family income that, in relation to family size, was less than
the higher of either: (1) the official poverty line as defined by the Office of Management
and Budget; or (2) 70 percent of the lower living standard income level.
At least 65 percent of Title II-A participants must fall into one or more of the

15Up to 10 percent of Title II-A participants do not have to be economicallydisadvantaged if they fall into one or more of the six categories.
16Including participants in the Job Opportunities and Basic Skills program.
29
following “hard-to-serve” categories 15: (1) people who are deficient in basic skills; (2)
school dropouts; (3) people who receive cash welfare payments16; (4) offenders; (5)
people with disabilities; or (6) homeless individuals.
Title II-A participants may receive direct training and training-related and
supportive services. Direct services may include basic skills training (including remedial
education, literacy training, and English-as-a-second language instruction); institutional
skill training; on-the-job training; skill level and service needs assessment; job and
career counseling; case management services; education-to-work transition services;
programs that combine workplace training and related instruction; work experience;
advanced career training combining on-the-job training and institutional training; training
programs operated by labor organizations or private sector employers; skill upgrading
and retraining; bilingual training; entrepreneurial training; vocational exploration; work
habit development programs that help people obtain and retain jobs; instruction or
services to obtain a certificate of high school equivalency; preapprenticeship programs;
on-site, industry-specific training; customized training in cases where an employer will
give jobs to those who successfully complete training; and advanced learning
technology for education, job preparation, and skills training.
Training-related and supportive services authorized under Title II-A include:
4 Help in finding a job;
4 Outreach activities that help people find out about education and training
services and work experience programs that help women obtain nontraditional
jobs;
4 Dissemination of information about training programs to employers;
4 Development of job openings for training program participants and activities
to obtain job placements for program participants;

17For both years, excludes II-A participants enrolled under special State set-asides. These set-asides represent 22 percent of total funding and are used for: (1)coordination with State education programs (eight percent of total funds); (2) incentivegrants for programs exceeding performance standards or technical assistance forprograms that fail to meet standards (six percent); (3) training programs for olderworkers (three percent); (4) State administrative responsibilities, including support forthe State Job Training Coordinating Council (five percent).
18Data on Title II-A funding and the number of participants served by State areincluded in the “E Table” series in Statistical Appendix of this Report.
30
4 Programs coordinated with other Federal employment-related activities;
4 Other services (e.g., transportation, health care, financial assistance, drug
and alcohol abuse counseling, special services and materials for people with
disabilities, child care, meals, temporary shelter, job coaches, and financial
counseling);
4 Limited needs-based payments; and
4 Certain followup services for people placed in unsubsidized jobs.
Using a formula stipulated in the JTPA legislation, the Department allocates
funds to States (Governors), which, in turn, allocate funds to Service Delivery Areas.
Private Industry Councils (PICs)–one in each SDA–oversee local programs and
determine which local organizations will receive funds to operate Title II-A programs.
Highlights of PY 1993 and 1994 Activities
In PY 1993, expenditures for Title II-A totaled $809,931,638 which provided
services to 355,656 adult Title II-A participants.17 PY 1994 expenditures totaled
$787,444,137, which provided services to 370,130 participants.18
The “cost per entered employment” declined slightly during the report period. In
PY 1994, the “cost per entered employment” for II-A participants was $7,282; in PY
1993, it was $7,303.
The average wage for clients when they were placed in jobs (known as the

31
“average wage at placement”) rose from $6.86 in PY 1993 to $7.09 in PY 1994.
Changes in participant characteristics were noted in both PY 1993 and 1994.
For example, the percentage of females in the program continued to rise. In PY 1993,
64 percent of Title II-A participants were female. In PY 1994, women made up 67
percent of II-A participants.
The percentage of adult participants receiving welfare was 37 percent in PY
1993. This figure included participants receiving food stamps and general assistance,
as well as those receiving Aid to Families with Dependent Children. For PY 1994, the
percentage of welfare recipients was 39 percent.
The percent share of participants with disabilities was 14 percent in PY 1993 and
eight percent in PY 1994.
An important feature of JTPA programs continues to be the development and
subsequent use of national standards for measuring program performance. These
standards, determined by the Secretary of Labor, and adjusted by the States, require
that a certain percentage of participants obtain employment after training, receive a
certain level of earnings, and work a certain number of weeks after they are placed in
jobs.
Chart 1 shows the PY 1993 and 1994 performance standards and program
performance for followup employment rates for Title II-A participants and participants
who were welfare recipients at the time of program enrollment. As the chart indicates,
the PY 1993 and PY 1994 followup employment rate performance standard was 59
percent. Actual performance, at 62 percent in PY 1993 and 63 percent in PY 1994,
exceeded the standard.
The PY 1993 and PY 1994 followup employment rate standard for adult
participants who were welfare recipients at the time of enrollment was 47 percent. The
standard was exceeded by almost seven percentage points in PY 1993 and by almost
eight percentage points in PY 1994.
The PY 1993 and PY 1994 weekly earnings at followup standard was $245.
Actual performance, at $246 in PY 1993 and $284 in PY 1994, exceeded the standard.
The PY 1993 and PY 1994 followup adult welfare weekly earnings standard for

32
participants who were welfare recipients at the time of enrollment was $223. The
standard was exceeded by $34 in PY 1993 and by $44 in PY 1994.
Selected participant outcomes for Title II-A for program years 1993 and 1994 are
shown in Table 1. (Numbers differ significantly from prior year totals because PY 1993
was the first year in which youth–who were formerly served under Title II-A–were
served under the new Title II-C.)
Table 2 shows selected characteristics for Title II-A adult terminees for PY 1991
through 1994.
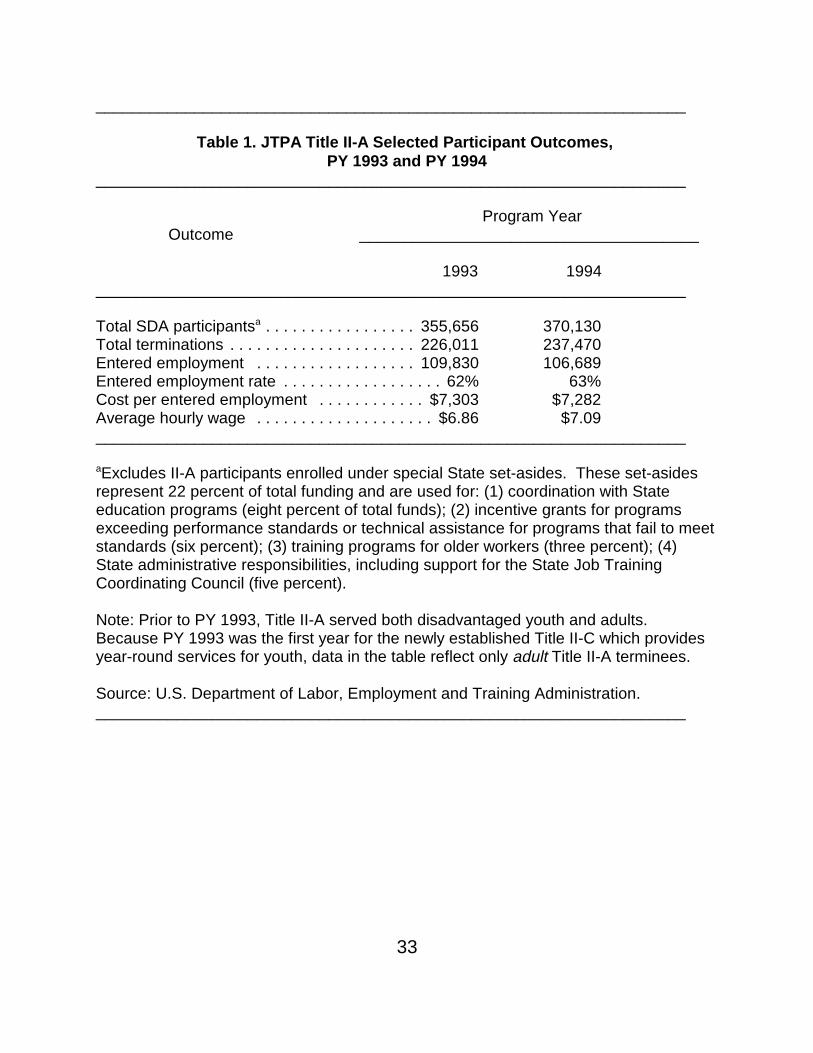
33
__________________________________________________________________
Table 1. JTPA Title II-A Selected Participant Outcomes, PY 1993 and PY 1994
__________________________________________________________________
Program YearOutcome ______________________________________
1993 1994__________________________________________________________________
Total SDA participantsa . . . . . . . . . . . . . . . . . 355,656 370,130Total terminations . . . . . . . . . . . . . . . . . . . . . 226,011 237,470Entered employment . . . . . . . . . . . . . . . . . . 109,830 106,689Entered employment rate . . . . . . . . . . . . . . . . . . 62% 63%Cost per entered employment . . . . . . . . . . . . $7,303 $7,282Average hourly wage . . . . . . . . . . . . . . . . . . . . $6.86 $7.09__________________________________________________________________
aExcludes II-A participants enrolled under special State set-asides. These set-asidesrepresent 22 percent of total funding and are used for: (1) coordination with Stateeducation programs (eight percent of total funds); (2) incentive grants for programsexceeding performance standards or technical assistance for programs that fail to meetstandards (six percent); (3) training programs for older workers (three percent); (4)State administrative responsibilities, including support for the State Job TrainingCoordinating Council (five percent).
Note: Prior to PY 1993, Title II-A served both disadvantaged youth and adults. Because PY 1993 was the first year for the newly established Title II-C which providesyear-round services for youth, data in the table reflect only adult Title II-A terminees.
Source: U.S. Department of Labor, Employment and Training Administration.__________________________________________________________________

34
__________________________________________________________________
Table 2. JTPA Title II-A Selected Terminee Characteristics (Percent Distribution), PY 1991 - PY 1994
__________________________________________________________________
Program YearCharacteristic ______________________________________
1991 1992 1993 1994__________________________________________________________________
Female . . . . . . . . . . . . . . . . . . . . . . . . . . 58 59 64 67Male . . . . . . . . . . . . . . . . . . . . . . . . . . . . 42 41 36 33
Age 55 and over . . . . . . . . . . . . . . . . . . . . 3 3 2 2
Black . . . . . . . . . . . . . . . . . . . . . . . . . . . . 29 30 31 31Hispanic origin . . . . . . . . . . . . . . . . . . . . 13 15 13 14White . . . . . . . . . . . . . . . . . . . . . . . . . . . 54 52 53 52
Welfare recipient . . . . . . . . . . . . . . . . . . 33 33 37 39Disabled individual . . . . . . . . . . . . . . . . . 10 10 14 8. . . . . . . . . . . . . . . . . . . . . . . . . . . . . . . . . . .Homeless . . . . . . . . . . . . . . . . . . . . . . . . . 2 2 4 2__________________________________________________________________
Note: Prior to PY 1993, Title II-A served both disadvantaged youth and adults. Because PY 1993 was the first year for the newly established Title II-C which providesyear-round services for youth, data in the table for PY 1991 and PY 1992 reflect onlyadult Title II-A terminees during those two years.
Source: U.S. Department of Labor, Employment and Training Administration.__________________________________________________________________

19Most Title II-C programs provide services to youth ages 16 through 21,although 14- and 15-year-old in-school youth may participate if local plans allow fortheir inclusion in the program.
35
Year-Round Services for Youth, Title II-C
Background
As a result of the JTPA Amendments of 1992, services provided for out-of-
school youth were made into a separate program under Title II-C of the Act. PY 1993
was the first year that the Title II-C program operated under separate authority.
The purpose of Title II-C is to improve the long-term employability of youth by:
(1) enhancing their basic educational, occupational, and citizenship skills; (2) increasing
their employment and earnings; (3) encouraging school completion or enrollment in
supplementary or alternative school programs; (4) reducing their dependency on
welfare; and (5) addressing problems that impair their ability to make a successful
transition from school to work, apprenticeship, the military, or postsecondary education
and training.
The JTPA legislation provides for services to economically disadvantaged young
people 16 through 21 years of age19 who are in school; hard-to-serve youth who are in

20Within this category, at least 65 percent of participants must be youth who aredeficient in basic skills, have educational attainment that is one or more grade levelsbelow the grade level appropriate for their age, are pregnant or parenting, have adisability (which may include a learning disability), are homeless or who have run awayfrom home, or are offenders.
21At least half of Title II-C program participants must be out of school.
22Within this category, at least 65 percent of participants must be youth who lackbasic skills, are school dropouts, are pregnant or parenting, have a disability (whichmay include a learning disability), are homeless or who have run away from home, orare offenders.
23Up to 10 percent of the participants in Title II-C programs in each ServiceDelivery Area do not have to meet these criteria if they face certain barriers toemployment or have limited English language proficiency, are alcoholics, or are drugaddicts.
36
school;20 out-of-school youth;21 hard-to-serve out-of-school youth;22 and young people
who do not meet the above requirements but who face other barriers to employment.23
Services under Title II-C are provided year-round and, as appropriate, services
are made available to participants on a multiyear basis. Upon entry into Title II-C
programs, participants’ basic skills, occupational skills, prior work experience,
employability, interests, aptitudes, and supportive service needs are assessed and a
service strategy is developed which identifies employment goals, objectives, and
appropriate services.
Job training and employment services provided under Title II-C may include:
basic skills training with a workplace context and integrated with occupational skills
testing; tutoring and study skills training; alternative high school services; instruction
leading to high school completion or the equivalent; mentoring; limited internships in the
private sector; training and education combined with community and youth service

24Title II-C expenditures are from the JTPA Semiannual Status Report. Title II-Cparticipant data are from the JTPA Annual Status Report. Data on Title II-C fundingand the number of participants served by State are included in the “E Table” series inthe Statistical Appendix of this Report.
37
opportunities in public agencies, nonprofit agencies, and other appropriate agencies,
institutions, and organizations, including Youth Corps programs; entry-level employment
experience; school-to-work transition services; school-to-postsecondary education
transition services; school-to-apprenticeship transition services; preemployment and
work maturity skills training; and support services (e.g., drug and alcohol abuse
counseling and referral, and limited needs-based payments).
Highlights of PY 1993 and 1994 Activities
During PY 1993, the Title II-C program enrolled 280,275 individuals.24 A total of
264,968 participants were enrolled in PY 1994.
PY 1993 expenditures for Title II-C totaled $540.9 million, while PY 1994
expenditures were $547.9 million.
As was the case for adult participants under Title II-A, the youth enrolled in the
Title II-C program exhibited greater needs, and therefore required higher levels of
supportive services and more intensive training strategies. As a result, the cost per
positive termination, which was $4,445 in PY 1993, increased to $4,723 in PY 1994.
In PY 1993, school dropouts comprised 39 percent of all Title II-C participants.
For PY 1994, the percentage of participants who were school dropouts was 33. In PY
1993, 35 percent of Title II-C participants were welfare recipients, while in PY 1994, 31
percent received welfare benefits.

38
In PY 1993, 10 percent of the program’s participants were offenders, while 11
percent were offenders in PY 1994. In PY 1993, 55 percent of participants were
female, while 56 percent were female in PY 1994.
For PY 1993, the Title II-C performance standard for “youth employability
enhancement rate” was 40 percent. It was greatly exceeded, with actual performance
of 53 percent. For PY 1994, this standard remained at 40 percent and actual
performance was 54 percent.
The other standard for Title II-C, the “youth entered employment rate” was met in
PY 1993. For 1993, the standard was 41 percent, while actual performance was 44
percent. For PY 1994, this standard remained at 41 percent and actual performance
was 44 percent.
Title II-C participant outcomes for PY 1991 through 1994 are shown in Table 3,
and Table 4 shows selected characteristics of year-round youth program terminees.
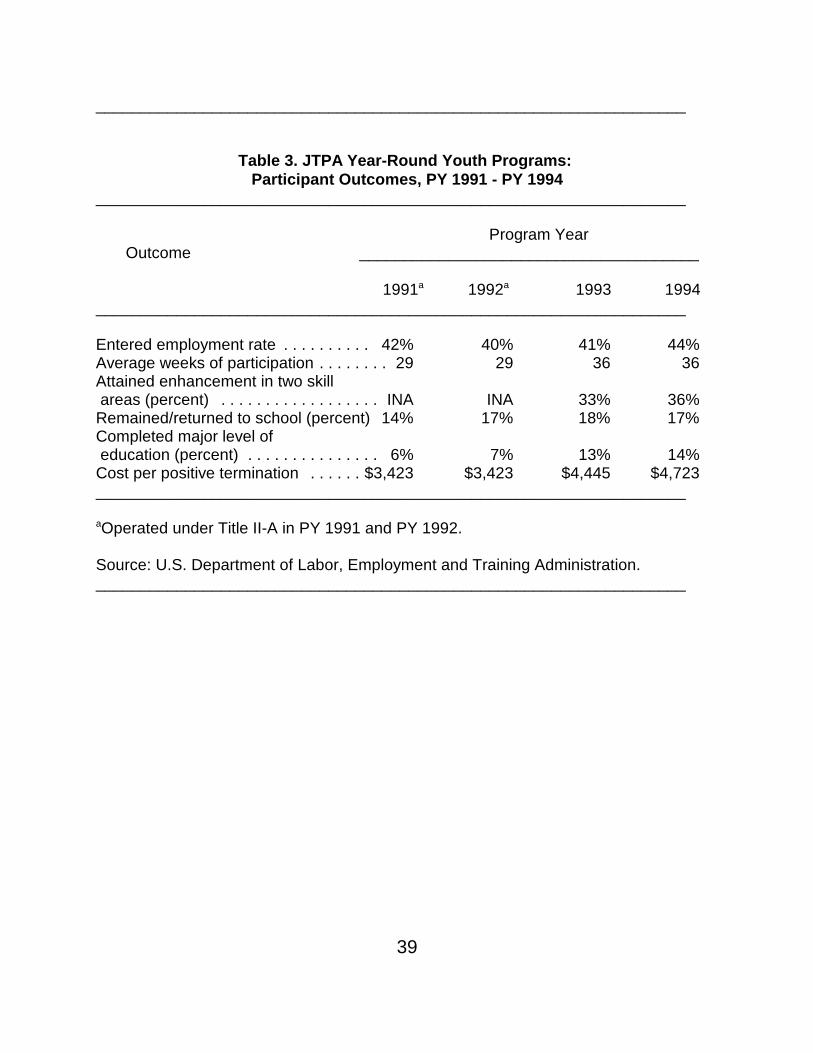
39
__________________________________________________________________
Table 3. JTPA Year-Round Youth Programs: Participant Outcomes, PY 1991 - PY 1994
__________________________________________________________________
Program YearOutcome ______________________________________
1991a 1992a 1993 1994__________________________________________________________________
Entered employment rate . . . . . . . . . . 42% 40% 41% 44%Average weeks of participation . . . . . . . . 29 29 36 36Attained enhancement in two skill areas (percent) . . . . . . . . . . . . . . . . . . INA INA 33% 36%Remained/returned to school (percent) 14% 17% 18% 17%Completed major level of education (percent) . . . . . . . . . . . . . . . 6% 7% 13% 14%Cost per positive termination . . . . . . $3,423 $3,423 $4,445 $4,723__________________________________________________________________
aOperated under Title II-A in PY 1991 and PY 1992.
Source: U.S. Department of Labor, Employment and Training Administration.__________________________________________________________________
40
__________________________________________________________________
Table 4. JTPA Year-Round Youth Programs: Selected Terminee Characteristics(Percent Distribution), PY 1991 - PY 1994
__________________________________________________________________
Program YearOutcome ______________________________________
1991a 1992a 1993 1994__________________________________________________________________
Female . . . . . . . . . . . . . . . . . . . . . . . . . . 53 53 55 56Male . . . . . . . . . . . . . . . . . . . . . . . . . . . . 47 47 45 44
Age 14-15 . . . . . . . . . . . . . . . . . . . . . . . . 16 18 16 14
Black . . . . . . . . . . . . . . . . . . . . . . . . . . . . 35 36 35 35Hispanic origin . . . . . . . . . . . . . . . . . . . . 19 21 20 20White . . . . . . . . . . . . . . . . . . . . . . . . . . . 43 40 41 41
Welfare recipient . . . . . . . . . . . . . . . . . . 26 27 35 31Disabled individual . . . . . . . . . . . . . . . . . 15 15 17 14. . . . . . . . . . . . . . . . . . . . . . . . . . . . . . . . . . .__________________________________________________________________
aOperated under Title II-A in PY 1991 and PY 1992.Source: U.S. Department of Labor, Employment and Training Administration.__________________________________________________________________

25Academic enrichment activities are designed to enhance the reading and mathskills of the participants during the summer months.
26This Report discusses Title II-B program activities for Calendar Years 1994 and1995 because funds for it were included in JTPA appropriations for Program Years1993 and 1994. The source of statistics on these programs is the JTPA Summer YouthPerformance Report. Detailed statistical information for Title II-B programs is shown inthe “E Table” series in the Statistical Appendix of this Report.
41
Summer Youth Programs,Title II-B
Background
The summer jobs program targets economically disadvantaged young people
ages 14-21. Major activities under the program include work experience, academic
enrichment,25 and work-based learning. Personal and employment counseling may
also be provided. Participants work in a wide variety of public sector jobs, including
city/county government offices, libraries, hospitals, laboratories, parks, day care, and
elder care operations.
Highlights of Calendar Year1994 and 1995 Activities
The Summer Youth Employment and Training Program (SYETP) provided jobs,
education, and training for 568,326 participants26 in the summer of 1994 and for
495,288 participants in the summer of 1995.
In the summer of 1994, 235,017 Title II-B participants were involved in
educational activities, while 249,115 were involved in these activities in the summer of

27Title III programs are sometimes called EDWAA programs, referring to theEconomic Dislocation and Worker Adjustment Assistance (EDWAA) Act whichamended JTPA Title III in 1988 and became effective July 1989.
28Specific State funds and numbers of participants for Title III programs areshown in the “E Table” series in the Statistical Appendix of this Report.
29During the Report period, the findings of a study of a special EDWAA jobcreation demonstration were released by the Department. Initiated in June 1991, thedemonstration was designed to explore the effectiveness of Community Development
42
1995. Also in the summer of 1994, 28,523 youth were enrolled in private sector
employment experience activities; in the summer of 1995, 28,875 young people were
enrolled in these activities.
Dislocated Worker Programs, Title III
Background
During PY 1993, Title III programs27 provided services to 306,000 individuals
who lost their jobs for such reasons as mass layoffs or plant closures and were unlikely
to return to their previous industries or occupations. About 410,000 individuals received
Title III services during the following program year.28
Title III funds are used by State and local program operators as well as other
eligible grantees to provide retraining, basic readjustment, and supportive services for
dislocated workers. Services include assessment, job search assistance, job
development, and needs-related payments.29

Corporations (CDCs) and similar organizations in expanding opportunities for dislocatedworkers through entrepreneurial training and by establishing linkages with localeconomic development activities. For details about the job-creation demonstration, seeDavid Drury, Stephen Walsh, and Marlene Strong, Evaluation of the EDWAA JobCreation Demonstration (Oakland, Calif.: Berkeley Planning Associates, 1994) which issummarized in Chapter 2 of this Report. As a followup to the study, a guidebook forEDWAA practitioners was also produced. See Katherine Dickinson, et al., A Guide toWell-Developed Services For Dislocated Workers (Menlo Park, Calif.: Social PolicyResearch Associates; Oakland, Calif.: Berkeley Planning Associates; and Menlo Park,Calif.: SRI International, 1994) which is also summarized in Chapter 2 of this Report.
43
Eighty percent of the Title III annual appropriation is allotted to States. Up to 40
percent of each State’s allotment must be used by the Governor for overall
administration of the JTPA dislocated worker system, for providing rapid response
services to workers dislocated by plant closures and substantial layoffs, and, where
funds are still available, for regular dislocated worker activities. Upon the Governor’s
approval of the substate areas plans, the remainder (not less than 60 percent) of a
State’s allotment must be distributed to substate areas to provide retraining and other
services at the local level.
The other 20 percent of the Title III appropriation is retained in the Secretary’s
National Reserve Account for discretionary projects serving workers affected by plant
closings and mass layoffs, projects in areas of special need (including emergency
response to natural disasters), technical assistance and training, and exemplary and
demonstration programs. Discretionary funds are awarded in response to applications
that Governors and other eligible applicants may submit at any time throughout a
program year and may be spent during the two following program years.
In PY 1993, approximately $414 million was allotted by formula to the 50 States,
the District of Columbia, and Puerto Rico. About $894 million was allotted the following
program year.

44
PY 1993 National Reserve Projectsand Special Initiatives
National Reserve Projects. In PY 1993, $178 million was awarded for national
reserve projects in 27 States and Guam. Many of these projects focused on the needs
of communities and workers affected by natural disasters. In response to floods in the
Nation’s midwest, $10 million was awarded to nine States, followed by an additional
$54 million from a Special Disaster Supplemental Appropriation. An Emergency
Supplemental Appropriation of $28 million was also awarded in response to needs
brought about by an earthquake in Southern California.
Also in PY 1993, discretionary funds were targeted to help timber workers in
Oregon, Washington, and Northern California. Over $9 million was awarded to these
three States for timber-related dislocated worker projects during the year.
Special Initiatives. During the same year, the Department initiated a major
effort to improve customer service and customer satisfaction in dislocated worker
programs. As part of this effort, the first “national customer satisfaction survey” was
completed in December 1993. The survey revealed that 57 percent of the dislocated
workers who received services under Title III rated the program as “extremely” or “quite
helpful.” The survey results were shared with program designers and operators
throughout the JTPA system.
During the same program year, in a series of seven Regional Partnership
meetings, over 1,200 representatives of Federal, State, and local Title III programs met
to discuss ways to improve services to dislocated workers. Over 200 State and local
program operators volunteered to participate in locally designed innovative projects to
measure and improve customer satisfaction. Program operators also volunteered to

45
share their project experience with individuals and organizations throughout the JTPA
Title III system.
PY 1994 National Reserve Projectsand Special Initiatives
National Reserve Projects. In PY 1994, $167 million was awarded for national
reserve projects in 29 States. In response to floods in the Nation’s southeast and west,
over $20 million was awarded to four States. Two States with substantial layoffs in the
aerospace industry received $22 million to provide readjustment and retraining services
to dislocated workers.
Also in PY 1994, discretionary funds were targeted to assist timber workers in
Washington, Oregon, Montana, and California. Over $19 million was awarded to these
four States for timber-related dislocated worker projects during the year.
Special Initiatives. During the same year, the Department awarded over $21
million for 37 demonstration grants nationwide. Eleven projects are developing better
ways help laid-off workers find jobs; 13 are providing retraining opportunities to health
workers who may lose their jobs; and 13 others are testing the feasibility of providing
funds or “career management accounts” to dislocated workers for self selection and
payment of training courses and other services.
Also in PY 1994, in continuance of the Department’s commitment to improve
customer service and increase customer satisfaction, the Enterprise Council was
formed. This partnership of local, State, and Federal representatives promotes
customer-focused quality improvements in the employment and training system. To
begin this effort, the Council established standards to gauge the quality of dislocated
worker programs. Members selected for the Enterprise Council must meet three
standards: customer satisfaction, superior performance, and continuous improvement.

46
By the end of PY 1994, 103 charter members were prepared for induction into the
Enterprise Council.
PY 1993 and 1994 Program Resultsand Participant Characteristics
Of the 165,000 dislocated workers who received services and left the program
during PY 1993, 68 percent obtained a job at an average hourly wage of $9.40. This
compares to 193,000 individuals who left the program in PY 1994, 71 percent of whom
obtained jobs at an average hourly wage of $10.00.
In PY 1993, 69 percent of the dislocated workers who left the program were
employed 13 weeks later, while 71 percent of program terminees in PY 1994 were
employed 13 weeks later. On average, participants stayed in the program for 39 weeks
in PY 1993, and for 34 weeks in PY 1994.
Table 5 shows PY 1993 and 1994 data for selected Title III participant
characteristics.
47
__________________________________________________________________
Table 5. JTPA Title III Selected Terminee Characteristics (Percent Distribution), PY 1993 and PY 1994
__________________________________________________________________
Program YearCharacteristic ______________________________________
1993 1994__________________________________________________________________
Sex:Male . . . . . . . . . . . . . . . . . . . . . . . . . . . . . . . . . . . . . . . . 55 54Female . . . . . . . . . . . . . . . . . . . . . . . . . . . . . . . . . . . . . . 45 46
Age:29 years and under . . . . . . . . . . . . . . . . . . . . . . . . . . . . . 19 1830-54 years . . . . . . . . . . . . . . . . . . . . . . . . . . . . . . . . . . . 73 7355 years and over . . . . . . . . . . . . . . . . . . . . . . . . . . . . . . . 8 9
Education:Less than high school . . . . . . . . . . . . . . . . . . . . . . . . . . . 11 10High school graduate . . . . . . . . . . . . . . . . . . . . . . . . . . . 50 49Post high school attendee . . . . . . . . . . . . . . . . . . . . . . . . 40 41
College graduate and above . . . . . . . . . . . . . . . . . . 13 15Race:
White (not Hispanic) . . . . . . . . . . . . . . . . . . . . . . . . . . . . 73 72Black (not Hispanic) . . . . . . . . . . . . . . . . . . . . . . . . . . . . 15 16Hispanic . . . . . . . . . . . . . . . . . . . . . . . . . . . . . . . . . . . . . . 8 8Alaskan/American Indian . . . . . . . . . . . . . . . . . . . . . . . . . 1 1Asian/Pacific Islander . . . . . . . . . . . . . . . . . . . . . . . . . . . . 3 3
Unemployment Insurance claimant . . . . . . . . . . . . . . . . . . . 62 59Individual with a disability . . . . . . . . . . . . . . . . . . . . . . . . . . . . 8 3Veteran . . . . . . . . . . . . . . . . . . . . . . . . . . . . . . . . . . . . . . . . . 17 17__________________________________________________________________
Note: All data reflect characteristics/activities of terminees. Some data do notadd to 100 percent because of rounding.
Source: Worker Adjustment Annual Program Report, U.S. Department of Labor,Employment and Training Administration.__________________________________________________________________

48
Performance Standards
The national standard for the entered employment rate for Title III was 64
percent for PY 1993. The standard for PY 1994 and PY 1995 was 67 percent.
Governors were encouraged to set an average wage at placement standard for
dislocated worker programs.
Response to Special Dislocations in PY 1993 and 1994
The Title III program also includes authorization for services targeted to defense
workers and workers who are adversely affected by the Clean Air Act.
Defense-Related Dislocations. Under a memorandum of agreement, funds
were transferred from the Department of Defense to the Department of Labor to
operate the Defense Conversion Adjustment Program (DCAP) and the Defense
Diversification Program (DDP). Both of these initiatives are Title III discretionary grant
programs specifically targeted to defense-related layoffs.
During PY 1993, the Department awarded $100 million for 43 defense-related
training and assistance projects.
A total of $205 million in defense funds was fully obligated for projects by the
end of the first quarter of PY 1994 and a total of 35,305 dislocated workers were served
in both programs by the end of PY 1994.
In PY 1993, as part of the DCAP effort, the Department also awarded $3.4
million for seven demonstration projects to test innovative ways of helping workers
dislocated due to reductions in military spending and base closures. The projects
focused on four areas: 1) averting layoffs; (2) increasing worker mobility; (3) community

30For more information about the DCAP, see Mary G. Visher and DeborahKogan, Evaluation of the Defense Conversion Adjustment Demonstration: InterimReport on Implementation (Oakland, Calif.: Berkeley Planning Associates and MenloPark, Calif.: Social Policy Research Associates, 1994) which is summarized in Chapter2 of this Report.
49
planning; and (4) locally initiated projects.30
The 1993 Base Closure and Realignment Commission report identified dozens
of military installations that would be closed or realigned during the next five years. In
response to the report, the Departments of Defense and Labor cooperated to create
special teams that visited military sites listed in the report where major dislocations were
expected to take place. The teams provided information on programs available to help
employees, including information about the availability of DCAP and DDP funds.
Clean Air Employment Transition Assistance. The Clean Air Employment
Transition Assistance program is designed to target funds to areas experiencing major
dislocations caused by compliance with the Clean Air Act of 1990 (P.L. 101-549). A
total of $26 million was appropriated and obligated by the end of PY 1993, and 1,741
participants were served by the end of PY 1994.
National Programs, Title IV
Overview
Title IV authorizes the Job Corps and other Department-administered programs
that serve Indians and Native Americans, migrant and seasonal farmworkers, and
veterans. Title IV also authorizes the National Commission for Employment Policy
(NCEP), the National Occupational Information Coordinating Committee (NOICC),
federally administered technical assistance efforts, labor market information activities,
research and evaluation, and pilot and demonstration programs.

31The activities of NCEP and NOICC are described at the end of this chapter. Veterans’ services, administered by the Department of Labor’s Office of the AssistantSecretary for Veterans’ Employment and Training, are reviewed in the Secretary’sannual report on veterans’ activities. These programs are targeted to veterans withservice-connected disabilities, veterans of the Vietnam era, and veterans recentlyseparated from military service.
50
Four categories of Title IV activities are described in this section of the Report.
These are programs for Indians and Native Americans, programs for migrant and
seasonal farmworkers, the Job Corps, and pilot and demonstration programs.31
Indian and Native American Programs
Background. To train and secure employment for eligible individuals in
productive jobs, Indian and Native American (INA) programs offer job training, job
referrals, counseling, and other employment-related services, such as child care,
transportation, and training allowances. Those eligible for the program include Indians,
Eskimos, Aleuts, Hawaiians, and other persons of Native American descent who are
economically disadvantaged, unemployed, or underemployed.
INA programs differ somewhat from Title II and III programs in that they are
administered at the national level by the Department, rather than by Service Delivery
Areas.
Highlights of PY 1993 and 1994 Activities. In PY 1994, total expenditures of
$60.1 million provided support to 182 program grantees which served a total of 24,425
Native American participants in all 50 States and the District of Columbia. The grantees
included Indian tribes, other Native American communities, and various related
organizations.

51
Approximately 50.2 percent of the 19,383 participants who left the program in PY
1994 were placed in jobs and another 32 percent attained an “employability
enhancement,” indicating that they returned to school, entered another training
program, completed a major level of education, completed a worksite training objective,
or attained basic or occupational skills proficiency. Of those who completed the
program in PY 1994, 46.4 percent were male, 30.1 percent were 21 years of age or
younger, and 20.5 percent were high school dropouts.
In PY 1993, total expenditures of $59.1 million provided support to 183 program
grantees which served a total of 24,924 Native American participants in all 50 States
and the District of Columbia. Approximately 52 percent of the PY 1993 participants
who left the program were placed in jobs and another 32 percent obtained an
“employability enhancement.” Of those who completed the program in PY 1993, 47
percent were male, 29 percent were 21 years of age or younger, and 21 percent were
high school dropouts.
As in previous years, the Department continued to encourage grantees to
coordinate their activities with those of other human resource programs.
In addition to programs authorized under JTPA Title IV-A, INA grantees also
received JTPA Title II-B funds to operate summer programs for Native American Youth.
Approximately 9,900 Native American youth participated in such programs in the
summer of 1995, at a cost of $13.5 million.
In the summer of 1994, about 10,500 Native American youth participated in
summer programs at a cost of $11.7 million. (This compares with 11,191 Native
American youth who participated in the summer of 1993 at a cost of $16 million.)
Performance measures for INA programs are designed to encourage the

32Alaska and Rhode Island, as well as the District of Columbia are not includedbecause of their small farmworker populations.
52
development of particular skills as well as employment goals. The three measures for
INA programs are entered employment rate, positive termination rate, and employability
enhancement rate. During the Report period, grantees were required to meet two of
the three standards. The specific performance standards levels are individually
determined for each grantee using a statistical model and are objective and equitable.
Adjustments are made to each grantee’s standards to reflect comparative differences in
the participants served and in local labor market conditions, such as the unemployment
rate, percent of the workforce in manufacturing, and whether the population is urban or
rural.
Migrant and Seasonal Farmworker Programs
Background. Title IV
of JTPA also authorizes training and employment programs for migrant and
seasonal farmworkers to help address chronic unemployment, underemployment, and
substandard living conditions among members of this group.
For the most part, services are designed to help migrant and seasonal
farmworkers who seek alternative job opportunities to secure stable employment at an
income above the poverty level and to improve the living standard of those who remain
in the agricultural labor market. Participants must be economically disadvantaged. Like
Indian and Native American programs, the migrant and seasonal farmworker program is
administered at the national level by the Department.
The Department allocates funds to organizations in almost all States32 based on

33Most of the grants are awarded to private nonprofit organizations.
53
the number of farmworkers in each State using census data and more current
Immigration and Naturalization Service data. Grants are awarded to public or private
nonprofit organizations33 that understand the problems of migrant and seasonal
farmworkers, are familiar with the area to be served, and have previously demonstrated
the capability to effectively administer a diversified employability development program
for this population. These organizations must compete for refunding.
Highlights of PY 1993 and 1994 Activities. In PY 1994, regular farmworker
employment and training activities served 46,310 persons with expenditures of $77
million. This is a decrease in the number of participants from the 47,547 individuals
who received services the previous program year, and expenditures of $73.9 million.
During PY 1994, there were 52 migrant and seasonal farmworker projects in 48
States and Puerto Rico. A total of 46,310 participants received some type of service
and left the program during the year. In PY 1993, there were 53 projects in 48 States
and Puerto Rico. Over 37,275 participants received services and left the program
during the year.
A total of 20,938 of the individuals who completed the program in PY 1994
received some type of supportive services assistance (including child care, medical
services, or emergency housing) and another 8,615 received job skills training which
led to successful unsubsidized employment. The remaining individuals either left the
program before significant intervention by the grantees or they received some job
search assistance. In PY 1993, 21,812 of the program’s terminees received some type
of supportive service and another 9,191 received job skills training which led to
unsubsidized employment.

54
In PY 1994, of those placed in jobs, 37 percent were women and 76 percent
were school dropouts. The average annual income of participants before entering the
program in PY 1994 was $3,720.
In PY 1993, 36 percent of those placed in jobs were women and 72 percent
were school dropouts. Also in PY 1993, the average annual income of participants prior
to entering the program was $4,140.
For both years, classroom and on-the-job training continued to be the main
employment strategies used by farmworker program grantees.
The Migrant and Seasonal Farmworker program, like the Indian and Native
American Program, serves a “harder-to-serve” population. The performance measures
developed for this program are intended to reflect basic educational and occupational
skills development and to enhance the employability of migrants and seasonal
farmworkers. The two performance measures for the program are “entered
employment rate” and “average wage at placement.” They are set for each grantee
based on local conditions (e.g., unemployment, transportation, number of barriers to
employment, etc.). All grantees met their performance standards during PY 1994.
Job Corps
Background. Job Corps is a major national training and employment program
administered by the Department to address the multiple barriers to employment faced
by severely disadvantaged youth between the ages of 16 and 24. Its residential aspect
distinguishes it from other training and employment programs and enables it to provide
a comprehensive array of services in one setting 24 hours a day, seven days a week.
Established in 1964 under the Economic Opportunity Act, the program provides

55
eligible youth with a comprehensive mix of services including:
4 Entry diagnostic testing and regular progress reviews;
4 Occupational exploration and “world of work” training;
4 A comprehensive basic academic education program which includes reading,
math, General Equivalency Degree (GED), health education, parenting,
introduction to computers, and driver’s education;
4 Competency-based vocational education;
4 Social skills training;
4 Counseling, health care, and related support services;
4 Work experience;
4 Meals, lodging, and clothing; and
4 Postprogram placement and support.
Highlights of PY 1993 and 1994 Activities. One hundred and ten Job
Corps centers in 46 States, the District of Columbia, and Puerto Rico served
approximately 200,000 students, including 125,000 new trainees, during Program Years
1993 and 1994. Job Corps expenditures totaled $991 million in PY 1994 and $932
million in PY 1993.
4 Enrollee Characteristics and Outcomes. Approximately 80 percent
of students enrolled in Program Years 1993 and 1994 were high school
dropouts. The average reading level at the time of enrollment was eighth
grade. Over 70 percent of the students had never held a full-time job.
Approximately 70 percent were minority youth, and 60 percent were male.
The average length of enrollment was 7.5 months. Outcomes for all Job
Corps terminees for PY 1993 and 1994 are shown in Table 6.
56
__________________________________________________________________
Table 6. Outcomes for Job Corps Terminees, PY 1993 and 1994__________________________________________________________________
Program YearOutcome ______________________________________
1993 1994__________________________________________________________________
Education and Training:Reading gains by grade levels . . . . . . . . . . . . . . . . . . . . 1.2 1.8Math gains by grade levels . . . . . . . . . . . . . . . . . . . . . . . 1.8 2.1Vocational completion . . . . . . . . . . . . . . . . . . . . . . . . . . 36% 43%
Placement:Entered employment . . . . . . . . . . . . . . . . . . . . . . . . . . . 54% 63%Enrolled in education . . . . . . . . . . . . . . . . . . . . . . . . . . 10% 10%Total terminees placed . . . . . . . . . . . . . . . . . . . . . . . . . 64% 73%Average job placement wage . . . . . . . . . . . . . . . . . . . $5.40 $5.64
__________________________________________________________________
Source: U.S. Department of Labor, Employment and Training Administration.__________________________________________________________________
4 Special Job Corps Initiatives. During PY 1993 and 1994, Job Corps
implemented a number of management initiatives in response to issues raised
by the Office of the Inspector General and the Congress. A new code of
conduct with zero tolerance for drugs and violence was implemented at all Job
Corps centers on May 1, 1995. This policy includes a provision which results in
immediate expulsion of any Job Corps student committing a serious offense
such as possession of a gun or weapon, sexual assault, any arrest for a felony
on or off center grounds, as well as possession or sale of any illegal drug.
The new code of conduct also requires that students have a drug test
when they first arrive at the Job Corps center. Students who test positive
are retested prior to the end of a 30-day probationary enrollment period;
those who still test positive are terminated from the program. After the
57
probationary period, students are retested if they are suspected of illegal
drug use; those who test positive are terminated immediately.
Other management initiatives taken during the Report period focused on
the development of procedures for strengthening the applicant selection
process. Revised policies call for closer scrutiny of an applicant’s
background in determining eligibility and a stronger focus on selecting
applicants with the commitment and motivation to benefit from enrollment.
Also during the period, the Department addressed problems relating to
poor performing centers. Enrollment of new students was stopped at
three centers where it was determined that center management was not
providing a safe and secure environment. Thirteen center contracts were
terminated and operators changed. One center was closed. In addition,
the procurement process for selecting center operators was revised to
provide increased weight for past performance. Training was conducted
for management staff at 11 poor performing centers, and intensive on-site
technical assistance by teams of experts was initiated at two centers.
4 Longitudinal Study. A new longitudinal study was implemented in PY
1993. The study is comparing the experiences of Job Corps students
with a control group to provide information on the difference Job Corps
makes in the lives of students. It is also comparing the benefits of
program participation to program costs. Followup interviews will be
conducted with both the student and control groups over a period of
several years. Initial study results will be available in 1997.
4 Performance Standards. Job Corps has established performance
standards for center operators, placement contractors, and
outreach/admissions contractors. Center standards include student math
and reading gains, GED attainment rates, vocational completion rates,
and placement rates.
Placement contractor standards include overall placement rates, job
training match placement rates, and starting wages.

58
Outreach/admissions contractor standards include arrival, retention, and
placement rates.
Pilot and Demonstration Programs
Pilot and Demonstration (P&D) programs, authorized under Part D of Title
IV, are designed to test innovative approaches and strategies for enhancing the
employability skills of people who face particular labor force barriers. They are
administered at the national level by the Department. A major goal of the P&D
programs is State and local level adoption or replication of the successful approaches
and models that result from P&D initiatives.
Funded at approximately $34.9 million in PY 1993 and $35.8 million in PY
1994, the projects reflected the goals, interests, and concerns of the Department of
Labor in a number of key areas.
Many of the projects addressed the needs of the Nation’s at-risk youth.
Many of the youth-related projects, such as the National Youth Apprenticeship in the
Customer Service Industry project, the Union-Based School-to-Work Mentoring project,
the High School Career Academies Demonstration, the Transition to Work
Demonstrations for Disabled Youth, and Project FocusHOPE, were designed to help
students make a successful transition from the classroom to the labor market.
Several other youth initiatives were supported by the Department to
ensure that young people–who might otherwise lack the skills and abilities to succeed in
today’s competitive labor market–have access to the quality training and education
necessary to ensure their future success as wage earners.
Two P&D efforts conducted during the Report period, the Glass Ceiling
Demonstration, and the Non-Traditional Employment for Women Initiative, which were
funded through mid-1996, were designed to help women overcome barriers that may
prevent them from achieving their full potential in the workplace.
Several efforts were also supported during the period to improve both the
services provided by and the coordination of existing programs. These include the Job

59
Training 2000 projects/One-Stop Career Centers initiative, which coordinates the
delivery of needed services, often locating them in a single facility; the Job Training for
the Homeless Demonstration Project, which coordinates efforts of JTPA and numerous
other service providers; and the Partnership Programs initiative, which increases the
involvement in JTPA of several national organizations, such as the National Urban
League, Opportunities Industrialization Centers of America, Inc., the National Alliance
of Business, and others.
Four P&D efforts responded to the need to improve the skills of American
workers. These included the National Job Analysis Study, the Initiative to Increase
Capacity to Provide Workplace Literacy Services, the Workplace Literacy Test effort,
and the initiative to develop basic financial training for employee stock ownership.
Because immigrants continue to make up an increasing percentage of the
Nation’s labor force, four separate immigration demonstration projects were conducted
during the period. These projects focused on innovative ways to provide quality training
and employment services, targeted to various immigrant population groups, to ensure
that they quickly become productive members of the work force.
Finally, the Department continued its efforts to help individuals with
disabilities receive the services necessary to enable them to compete equitably in both
the private and public sectors.
P&D projects which operated during Program Years 1993 and 1994 are
summarized below. They are also listed, along with their periods of performance and
funding levels, in Table 7.

60
__________________________________________________________________
Table 7. Pilot and Demonstration Projects Conducted During PY 1993-1994
__________________________________________________________________
Pilot and Demon- Period of Fundingstration Project Performance
__________________________________________________________________
National Youth Apprentice-ship in the Customer Service Industry. . . . . . . . . . . . . . . . Dec. 1, 1994 - March 1, 1998 $294,000
Union-Based School-To-Work Mentoring Project . . . . . . . . . March 17, 1995 - March 16, 1996 $150,000
High School Career Academies Demonstration . . . . . . . June 29, 1993 - June 30, 1996 $600,000
Transition to Work Demon-strations for Disabled Youth . . . . . . Oct. 1, 1993 - Oct. 1, 1994 $750,000
Project FocusHOPE . . . . . . . . . . . . June 28, 1994 - June 30, 1996 $1.2 million
At-Risk Youth Pilot Project . . . . . . . . . . . . . . . . . . . . . . June 30, 1994 - June 30, 1995 $208,400
Preparing Out-of-SchoolYouth for a Career Path . . . . . . . . . Jan. 31, 1994 - July 31, 1995 $25,000
Quantum Opportunities Project . . . . . . . . . . . . . . . . . . . . . . June 28, 1995 - June 27, 1996 $200,000
Year-Round YouthTraining Demonstrations. . . . . . . . . Sept. 30, 1993 - Sept. 30, 1995 $2.6 million
Out of School Youth Pilot Projects (four projects). . . . . . . . . . June 30, 1994 - June 30, 1995 $832,000__________________________________________________________________
61
__________________________________________________________________
Table 7. Pilot and Demonstration Projects Conducted During PY 1993-1994 (continued)
__________________________________________________________________
Pilot and Demon- Period of Fundingstration Project Performance
__________________________________________________________________
Glass Ceiling Demonstration . . . . . . . . . . . . . . . . June 16, 1994 - June 16, 1996 $200,000
Non-Traditional Employmentfor Women . . . . . . . . . . . . . . . . . . . July 23, 1992 - July 22, 1996 $6 million
Job Training 2000 Projects . . . . . . . . . . . . . . . . . Oct. 1992 - Dec. 1994 $1.7 million
Evaluation of the Job Training 2000 One-Stop Career Centers Demonstration . . . . . . . . . . . . . . . . June 28, 1993 - Dec. 27, 1994 $200,000
Partnership Programs . . . . . . . . . . . July 1993 - June 1995 $18.9 million
National Job Analysis Study . . . . . . June 1992 - June 1997 $1.4 million
Increasing Capacity to Provide WorkplaceLiteracy Services . . . . . . . . . . . . . . July 1994 - June 1995 $25,000
Workplace Literacy Test . . . . . . . . July 1, 1993 - June 30, 1996 $1.6 million__________________________________________________________________

62
__________________________________________________________________
Table 7. Pilot and Demonstration Projects Conducted During PY 1993-1994 (continued)
__________________________________________________________________
Pilot and Demon- Period of Fundingstration Project Performance
__________________________________________________________________
New Directions: African Americans in a Diversifying Nation . . . . . . . . . . April 18, 1995 - Oct. 18, 1996 $50,000
Immigration Demonstration Projects (four projects) . . . . . . . . . . . . . . . . . June 30, 1992 - Oct. 31, 1994 $1.1 million
Programs for People With Disabilities . . . . . . . . . . . . . . . July 1993 - June 1995 $8,345,600__________________________________________________________________
Source: U.S. Department of Labor, Employment and Training Administration.__________________________________________________________________

63
School-To-Work Transition and Youth-Related Projects
National Youth Apprenticeship in the Customer Service Industry. Funded at
$294,085 and operating from December 1994 to March 1998, this project, conducted by
Northern Illinois University, implements youth apprenticeship and related training
programs for a comprehensive career development training system in business
management at schools and the McDonald Corporation. The project is a joint venture
between the University and the McDonald Corporation in cooperation with States,
foundations, and schools in four demonstration sites. It provides up to four years of
business management training, beginning with the junior year in high school and ending
after two years of postsecondary education. The program model features
performance/skill standards and a certification system that establishes career paths
within McDonald’s.
Union-Based School-to-Work Mentoring Project. Operating from March 17,
1995 through March 16, 1996, this project linked secondary school students and
workers with a wide range of occupations. It also identified specific skills and behaviors
that constitute an organized set of workplace competencies. It was funded at
$150,000.
High School Career Academies Demonstration. Funded at $600,000 for the
period June 29, 1993 through June 30, 1996, the High School Career Academies
demonstration is testing a school restructuring and school-to-work transition model that
provides an intensive three- to four-year education experience for 2,500 to 3,000 at-risk
youth in 14 locations. The model integrates academic and occupational instruction. It
features intensive involvement by employers in a school-within-a-school setting. A
small cluster of students within a school take most of their classes together and are
taught by a team of teachers who remain with them throughout their four years.

34Supported employment is premised on the belief that many persons who areplaced in sheltered workshops or who are considered unable to benefit fromrehabilitation services can perform substantial work in regular work sites if given thenecessary long-term support. Three basic models of supported employment have beendeveloped. In the “individual placement” model, individuals with severe disabilities areplaced in a job in which their immediate coworkers are generally persons withoutdisabilities. In this model, a job coach helps the individual learn the job. In the“enclave” model, two or more persons with severe disabilities are placed in closeproximity in a specified part of the work environment. Supervision is often provided bya job coach not directly hired by the business. In the “work crew” model, two or moreindividuals with disabilities are transported to an employment site for special tasks. After completing their work, they are transported to another site. A job coach oftenaccompanies each crew.
35An evaluation of this demonstration effort was completed during the Reportperiod. See Rima Azzam, Ronald Conley, and Arthur Mitchell, Evaluation of Transitionto Work Demonstration Projects Using a Natural Supports Model (Washington, D.C.:Pelavin Research Institute, 1995) which is summarized in Chapter 2 of this publication.
64
Transition to Work Demonstrations for Disabled Youth Using a Natural
Supports Model. Funded at $750,000 for the period October 1, 1993 through October
1, 1994, the Department sponsored a joint effort with the Department of Health and
Human Services to develop innovative school-to-work transition programs for youth with
moderate to severe disabilities. The programs emphasized “natural” support systems in
which on-the-job assistance was provided through co-workers rather than through
external “job coaches.” This differed from traditional supported employment activities
which had generally been available to individuals with moderate to severe disabilities.34
The initiative also attempted to expand opportunities for competitive, compensated
employment for program participants.35
Project FocusHOPE. FocusHOPE is a multi-year demonstration conducted by
the Center for Advanced Technologies (CAT) in Detroit. The CAT is a national project
with participation from different Federal agencies, including the Departments of Labor,
Defense, Commerce, and Education. The Center provides world-class training in

36Participants were paid a small salary (either by the employer or by the pilotproject) for the work-based learning portion of their program experience.
65
advanced manufacturing engineer technologies. Total private and public sector funding
for the Center has exceeded $90 million since its inception. The CAT student
population served by the Department of Labor grant is composed largely of minority and
disadvantaged individuals who have completed a seven-week school-to-work transition
program. They move into a one-year precision manufacturing program and into training
for higher-demand occupations in flexible manufacturing at the CAT.
The DOL-sponsored demonstration, covering the period June 28, 1994 through
June 30, 1996, was funded at $1.2 million ($600,000 each year), and focused on the
first two years of participation in the CAT six-year program. Grant funds were used
primarily for instruction, candidate training stipends, and administration. At the
conclusion of the demonstration, trainees have acquired certifiable manufacturing skills
and academic credits.
At-Risk Youth School-to-Work Pilot Project. Funded at $208,434 for the
period, June 30, 1994 through June 30, 1995, the project combined classroom and
work-based learning for approximately 35 youth in Boston. Job opportunities for the
participants were assessed through the Boston PIC’s school-to-work program.
Participants spent 10-15 hours per week on the job and 20 hours in related classroom
instruction. They were placed in entry-level, career oriented, paid work experiences36 in
the areas of health and hospitals, financial services, utilities, communication, and
environmental services.
Preparing Out-of-School Youth for a Career Path Project. Funded at
$25,000 and operating from January 31, 1994 through July 31, 1995, the project drew
on the expertise of the research, business, and education communities to create

66
comprehensive strategies for a career path model to be used by organizations
operating programs for out-of-school and other at-risk youth.
Quantum Opportunities Project. During the period June 28, 1995 through
June 27, 1996, funding of $200,000 was allocated to replicate and evaluate a
successful model program directed specifically toward at-risk youth entering the ninth
grade. The objectives of the project were to enable participants to complete high
school and to improve their rate of entering and succeeding in postsecondary
education. Five sites were funded.
Youth Year-Round Training Demonstrations. These demonstration efforts,
conducted in several States, linked summer and regular school academic and work
experience programs to ensure that the learning acquired by students was reinforced
throughout the year. They operated from September 30, 1993 through September 30,
1995, and were funded as follows: $532,686 for several counties in Kentucky; $550,000
for Dade County, Florida; $550,000 for the City and County of Santa Fe (New Mexico);
$416,415 for portions of two counties in Texas; and $550,000 for the City of Los
Angeles.
Out-of-School Pilot Projects. Four out-of-school pilot projects were conducted
from June 30, 1994 through June 30, 1995. One of the projects, “SUCCESS,” operated
in Sacramento and was funded at $300,000. It was designed to help determine better
ways of providing effective employment and training services to economically
disadvantaged, 16-21 year-old, out-of-school youth. The county office of education, the
Urban League, the local PIC, and the Sacramento County Assessment Network formed
a partnership to provide education, employment, and incentives to help the project’s
participants. In addition to school-based and work-based learning directed at career
and life skills development, the project provided mentors and support services which
included child care and family counseling.

67
The second project, funded at $299,986, was in Monroe, Va. It developed,
demonstrated, and disseminated the findings from an innovative job training and
placement program for disadvantaged out-of-school youth with disabilities. In
partnership with a JTPA local SDA, a Job Corps Center, and local rehabilitation and
special education professionals, a model was tested that enabled disadvantaged youth
with disabilities between the ages of 18 and 21 to obtain employment in the
occupations of their choice.
A third project, still ongoing in Boston, was funded at $104,217. Building on an
alternative high school diploma/GED program for at-risk and out-of-school students, it
has developed a basic school-to-work program. Students have been trained in life skills
such as budgeting money, preparing income tax forms, resolving conflicts at work, etc.
Additionally, students were engaged in rigorous work-based curriculum projects which
combined classroom academics with work site activities. These activities were made
possible by the Boston Private Industry Council and the Boston School System.
The fourth project, funded at $127,414, was located in Jensen Beach, Florida. It
provided employment and training services to out-of-school youth who lacked the basic
skills needed to function in today’s job market. Services were provided by the Treasure
Coast Private Industry Council, which operated the FUTURE LINK job club to prepare
economically disadvantaged youth who dropped out of school or who graduated with
insufficient basic skills to succeed in even moderately demanding employment
situations.
Youth Fair Chance Program. The JTPA amendments of 1992 authorized the
Secretary of Labor to award up to 25 Youth Fair Chance (YFC) projects, conduct an
evaluation of the program, and to provide technical assistance at a total of $50 million.
The YFC concept is a community-based initiative that targets money directly into
areas where youth problems are greatest–areas of high poverty. The initiative provides

68
a variety of services and harnesses the cooperation and involvement of other service
providers to focus on such youth problems as dropping out of school, teen pregnancy,
drug and gang involvement, employment and training, lack of sports and recreation,
family support, child development, and health. The initiative is developing a “new”
comprehensive system that addresses the needs of all youth in the community. It is
hoped that by creating systemic change, changes will be made in the way services are
provided to all youth beyond the availability of Federal funds for this effort.
This initiative addresses the needs of youth and young adults between 14-30
years of age who reside in rural and urban communities. It saturates small
neighborhoods or communities with populations of not more than 25,000, having the
highest concentration of poverty based on the latest Bureau of the Census estimates;
migrant or seasonal farmworker communities; native Alaskan villages; or Indian
reservations.
The YFC design includes two components–one to serve in-school youth and
another to serve out-of-school youth and young adults. The in-school component is a
school-to-work program to transform high schools and improve the education, training,
and employment opportunities of youth. The school-to-work program is consistent with
the School-to-Work Opportunities legislation and the Goals 2000 Act. It contains three
main components: (1) work-based learning; (2) school-based learning; and (3)
connecting activities such as student-employer matching, providing technical assistance
and services to employers and others in designing work-based learning components
and counseling and case management services, providing a broad range of assistance
to students, and collecting and analyzing information about post-program outcomes.
The out-of-school programs are comprised of community centers for continuing
education and training. Centers provide remedial education, GED preparation,
occupational training, English-as-a-second-language classes, job search assistance,
support services, and recreation and sports programs.

69
A number of the grantees provide job guarantees for youth meeting prior school
attendance and performance standards. To be eligible for a guaranteed job, youth
must be between 16-19 years of age and must make a commitment to continue and
complete high school. Wage subsidies of up to 50 percent are provided by some of the
grantees. The duration of such employment is limited to one year and youth are not to
exceed 15 hours of work per week during the school year.
Community residents, businesses, schools, etc. are directly involved in the
program through the Community Advisory Board and the school-to-work partnership
which directs the activities of all program components.
Seventeen grants, totaling $66 million, were awarded in July 1994, providing
funds for 18 months. Additional resources totaling $25 million were added to the grants
in July 1995 and grants were extended through December 1997.
The target communities are located in neighborhoods in: Seattle, Washington;
Indianapolis, Indiana; Tehlequah, Oklahoma; Douglas, Arizona; Baltimore, Maryland;
Denver, Colorado; Los Angeles (two sites), California; Fresno, California; Memphis,
Tennessee; Cleveland, Texas; Fort Worth, Texas; Racine, Wisconsin; New Haven,
Connecticut; New York, New York; Cleveland, Ohio; and Hazard, Kentucky.
The Tehlequah grant is operated by the Cherokee Nation. The Cleveland,
Texas grant focuses on migrant and seasonal farmworkers who reside in Edingburg,
Texas. One of the Los Angeles grants focuses on former gang members. Grant
awards to rural areas are Douglas and Hazard.
The program has been operating since July 1, 1994. During the initial 18
months of operation, over 22,000 youth and young adults received services.

70
Addressing the LaborMarket Needs of Women
Glass Ceiling Demonstration. Funded at $200,000 for the period June 16,
1994 through June 16, 1996, the demonstration is developing a model of instruction
and mentoring that will help women overcome the gender barrier (known as the “glass
ceiling”) which inhibits their climb to the highest levels of industry and government.
Program components include a two-day orientation for participating fellows, a series of
meetings and conferences, at least 14 days spent by each fellow under the instruction
of a successful female mentor at the mentor’s workplace, a week of study at Harvard
University, speaking and written presentations by fellows, and a mandatory
postprogram element.
Non-Traditional Employment for Women. The Nontraditional Employment for
Women (NEW) Act amended JTPA to encourage a broader range of training and job
placement activities for women. In supporting the Act, the Department’s Employment
and Training Administration and its Women’s Bureau work together to help bring about
nontraditional training and employment opportunities for women through the JTPA
system. They also help guide the institutionalization of nontraditional training through
grants made to States to further efforts that support the NEW Act. Funding for this
effort is $6 million ($1.5 million for each of four years from July 23, 1992 through July
22, 1996).
Improving Programsand Coordination
Job Training 2000 Projects. From October 1992 to December 1994, $1.7
million was awarded to 10 PICs in nine States to conduct a demonstration that tested

37See Dale W. Berry and Mona A. Feldman, Evaluation of One-Stop CareerCenter Demonstration Projects (Arlington, Va.: TvT Associates, 1995) and Dale W.Berry and Mona A. Feldman, A Guide for Planning and Operating One-Stop CareerCenters (Arlington, Va.: TvT Associates, 1995) which are summarized in Chapter 2 ofthis publication.
71
models for local skill centers that integrated the delivery of employment and training
services. The purpose of the projects was to assure the quality of job skill training
programs, to explore the efficacy of using vouchers to facilitate increased choice in the
selection of vocational training, and to expand the authority of PICs in providing
program oversight. (See the following for a discussion of the evaluation effort for the
demonstrations.)
Evaluation of the Job Training 2000 One-Stop Career Centers
Demonstration. A case study analysis of 10 PIC-sponsored One-Stop Career Center
sites in nine States was conducted from June 1993 through December 1994. The sites
demonstrated PIC leadership in integrating the services of the Employment Service,
JTPA, and Job Opportunities and Basic Skills/welfare programs to increase accessibility
of services to individuals seeking new jobs, labor market information, or to upgrade their
work skills. Other objectives that were evaluated included the demonstration of quality
assurance of training programs and the exploration of the use of training vouchers.
Funded at $200,000, the evaluation effort yielded a final report and “how to” guide for
planning and implementing One-Stop Career Centers.37
Partnership Programs. As in previous years, pilot and demonstration efforts
included “partnership programs” designed to increase the involvement in JTPA of
several national business, labor, and community-based organizations that represent
broad constituencies. These organizations can promote JTPA training and cooperation
within their own organizations and with the private sector and local government. Six

72
organizations in this category were funded during Program Years 1993 and 1994.
These were the National Urban League, Inc.; SER-Jobs for Progress, Inc.;
Opportunities Industrialization Centers of America, Inc.; the National Alliance of
Business; the Human Resources Development Institute of the AFL-CIO; and the
National Council of La Raza.
Improving Worker Skills
The National Job Analysis Study. Part of a major research effort to assess the
skill levels of the American workforce, the National Job Analysis Study (NJAS) focuses
on the development of assessment measures of the workforce competencies and skills
needed for job success in high-performance work settings. The study is jointly
administered by the Department of Labor in cooperation with the Department of
Education, and the Office of Personnel Management. Through a $1.4 million contract
with American College Testing, the NJAS will explore the appropriate competencies
and skills, and provide information to businesses and workers undergoing the
transformation to high-performance workplaces and to industries that are setting world-
class standards.
Increasing Organizational Capacity to Provide Workplace Literacy
Services. A total of $25,000 was provided to Literacy Volunteers of America (LVA) to
increase the organizational capacity of its affiliate organizations throughout the country
to provide workplace literacy services to individuals with low reading levels. Funded
from July 1994 through June 1995, LVA convened focus groups, produced and
disseminated a Resource Guide, provided technical assistance to affiliates, and
produced a three-year action plan to expand services.
Workplace Literacy Test Implementation Pilot Project. Funded at $1.6
million for the period July 1, 1993 through June 30,1996, the Workplace Literacy Test

73
Pilot Project is designed to administer a newly created instrument for assessing
workplace literacy skills. About 130 sites are participating in the project. Included are
job training sites, adult education programs, vocational education programs, community
colleges, correctional institutions, summer youth programs, and job assistance
programs. The test is being used to: (1) determine individuals’ needs for participation in
job and literacy training programs; (2) meet the Federal reporting requirement for
“reading skills grade level” as required under certain programs; (3) enhance job training
counseling and employment guidance; and (4) evaluate training programs by assessing
the learning gains of individual trainees while they are in job training and literacy
programs.
New Directions: African Americans in a Diversifying Nation Project. During
the Report period, the Department contributed $50,000 out of a total budget of
$764,000 for this project. It was funded in cooperation with the National Policy
Association (formerly known as the National Planning Association) and the Joint Center
for Political and Economic Studies. The Department’s portion of funds covers staff time
devoted to employment and training issues, consultant/writers, advisory committee
meetings, and appropriate proportionate shares of public forums, publications, office,
and other expenses. The Department’s support covers the period April 18, 1995
through October 18, 1996.
Helping Immigrants Succeed in the Labor Market
Immigration Demonstration Projects. Four immigration demonstration
projects were conducted during the Report period. The first project, funded at $301,190
for the period June 30, 1992 through October 31, 1994, supported efforts of the Jewish
Vocational Service, a major provider of training and employment services to refugees in
the Greater Boston area. It offered two skill training programs to address the special

38An evaluation of this demonstration was conducted during the Report period. See Vicki Asakura and David Snedeker, Immigration Demonstration Grant FinalEvaluation Report (Seattle, Wash.: Seattle-King County Private Industry Council, 1995)which is summarized in Chapter 2 of this publication.
74
employability needs of immigrants residing in the 43 cities and towns comprising the
Boston-area SDA. The contractor provided data entry and computer-aided drafting
training and featured bilingual/bicultural employment counseling, vocationally specific
English-as-a-second language instruction, regular counseling and support services, job
development and placement, and postplacement followup services.
The second project, conducted during the same time frame and funded at
$315,000, was jointly operated by the Wayne County PIC, the Arab Community Center
for Economic and Social Services, and the Arab-American and Chaldean Council. It
provided a comprehensive program of training and employment services to Arab-
American immigrants in the Balance of Wayne County, Michigan. Key features of the
program were English-as-a-second language training, mentoring, and case
management.
The third project, also conducted during the same time frame, and funded at
$315,000, was operated by the San Diego Consortium and PIC and its partner,
SER/Jobs for Progress, Inc. It provided a program of integrated services to 140
immigrants, primarily Latinos in the San Diego area. Services included case
management, English-as-a-second language training, and basic education using a
computer assisted program covering 23 basic subjects.
The fourth project, funded at $315,000 and operating from September 1, 1992
through November 30, 1994, was managed by the Seattle-King County (Washington
State) PIC in collaboration with two community-based organizations. It served both
Asian and Hispanic immigrants and offered an array of services and instruction.38

39For additional information based on JTHDP evaluations, see Lawrence N.Bailis, Margaret Blasinsky, Stephanie Chestnutt, and Mark Tecco, Job Training for theHomeless: Report on Demonstration’s First Year (Rockville, Md.: R.O.W. Sciences,
75
Helping People With DisabilitiesSucceed in the Labor Market
Programs for People With Disabilities. Pilot and demonstration programs
served approximately 6,800 people with disabilities in PY 1994 and about 6,900
received services in PY 1993. The general purpose of these projects is to increase the
number and quality of job opportunities for individuals with disabilities and to empower
them to integrate more fully into society.
The projects offer special outreach services, tailored training, job development,
and job placement assistance. Grantees operate national programs which, in many
instances, are linked to local rehabilitation agencies and programs. In both PY 1993
and 1994, programs were operated by nine national organizations with expertise in
working with people with disabilities, with total funding each year of $4,172,815. These
organizations were Goodwill Industries of America, Inc., Association for Retarded
Citizens, Electronic Industries Foundation, Epilepsy Foundation of America,
Mainstream, Inc., Marriott Foundation for People With Disabilities, American
Rehabilitation Association, National Federation of the Blind, and International
Association of Machinists (IAM Cares).
JOB TRAINING FOR THE HOMELESS DEMONSTRATION PROGRAM
The Job Training for the Homeless Demonstration Program (JTHDP) is the first
comprehensive nationwide Federal effort specifically designed to train homeless people
and to place them in jobs.39 The Department is authorized to plan, implement, and

Inc., 1991) and John W. Trutko, et al., Employment and Training for America’sHomeless: Report on the Job Training for the Homeless Demonstration Program(Arlington, Va.: James Bell Associates, Inc., 1993).
76
evaluate JTHDP under Section 731 of the Stewart B. McKinney Homeless Assistance
Act of 1987 (P.L. 100-77).
Since beginning operations in October 1988, organizations receiving
demonstration grants designed and implemented innovative and replicable approaches
for serving this population group. During the Report period, the emphasis was shifted
from developing knowledge about how best to help homeless clients obtain jobs to
building the capacity of mainstream JTPA programs (through partnerships formed with
existing grantees) to promote enhanced capability for serving homeless individuals.
During the period September 1994 through November 1995, funding of $7.3 million
enabled the project to focus on this new effort. (Grantees continued to provide case
management, housing, supportive services, job training, and placement services for
homeless clients.)
APPRENTICESHIP
Background
In FY 1995, registered apprenticeship programs employed and trained over
354,800 U.S. workers in the skilled trades. This was an increase from just over
325,700 workers in FY 1994. The apprenticeship system, which combines structured
on-the-job training with related theoretical instruction (usually in a classroom
environment) has long been recognized as an effective method for preparing people to
enter and succeed in a variety of skilled and higher-paid occupations.

77
The Federal role in apprenticeship is defined by the National Apprenticeship Act
of 1937 (Public Law 75-308), which is known as the Fitzgerald Act. Through the
Department’s Bureau of Apprenticeship and Training (BAT), the Federal Government
establishes and promotes the adoption of labor standards necessary to safeguard the
welfare of apprentices. BAT does not directly operate apprenticeship programs.
Rather, it registers apprenticeship programs and apprentices and provides assistance
to employers, organized labor, and open shops to help plan and promote quality
apprenticeship programs.
Employers or groups of employers and unions design, organize, manage, and
finance apprenticeship training under the standards developed and registered with BAT
or BAT-recognized State Apprenticeship Agencies. They also select apprentices who
are trained to meet certain predetermined occupational standards.
In 27 States, the District of Columbia, the Virgin Islands, and Puerto Rico,
programs are registered by State Apprenticeship Agencies or Councils which are
recognized by the Secretary of Labor. Most State agencies receive policy guidance
from apprenticeship councils composed of employers, labor groups, and public
representatives.
BAT provides apprenticeship services in all States, and registers programs and
apprentices in 23 States where there is no State Apprenticeship Agency or Council.
Highlights of FY 1994and 1995 Activities
Table 8 shows selected apprenticeship program data for Fiscal Years 1991
through 1995.

78
In FY 1995, 273,160 civilian apprentices received training in 33,916 civilian
apprenticeship programs registered with BAT or State Apprenticeship Agencies. About
24.5 percent of these apprentices were minorities and 8.5 percent were women. In FY
1994, 247,958 civilian apprentices received training in over 34,000 civilian
apprenticeship programs. About 24 percent were minorities and eight percent were
women.
An additional 81,684 uniformed military apprentices in FY 1995 and 77,754 in FY
1994 were registered in 17 programs. About 33 percent of these military apprentices
were minorities in both years; 7.5 percent were women in FY 1995, and seven percent
were women in FY 1994.
At the end of FY 1995, the Department recognized 835 apprenticeable
occupations, including eight new ones, which were Inspector Metal Fabricating;
Computer Operator; Dispatcher, Service; Multi-Story Window/Building Exterior Cleaner;
Tool Programmer, Numerical Control; Control Equipment Electrician-Technician; Guard,
Security; and Tuckpointer, Cleaner, and Caulker.
This compares with 828 apprenticeable occupations recognized at the end of FY
1994. Apprenticeable occupations recognized during FY 1994 were: Teacher Aide 1;
Plastic Process Technician; Construction Craft Laborer; and Facilities Locator.
Promoting equal opportunity in apprenticeship has been an important function of
the Department. Equal Employment Opportunity (EEO) in apprenticeship is pursued
through promotion and technical assistance efforts and compliance reviews.
79
__________________________________________________________________
Table 8. Selected Apprenticeship Program Data forFiscal Years 1991 - 1995
__________________________________________________________________
Fiscal Yearsa
Item ______________________________________
1991 1992 1993 1994 1995__________________________________________________________________
Total number of civilian apprentices receiving trainingb . . 291,035 265,156 220,159 247,958 273,160
Percent minority . . . . . . . . . . . . . . 22.5 22.2 22.7 24.0 24.5Percent women . . . . . . . . . . . . . . . . 7.1 7.6 7.6 8.0 8.5
Number of civilian apprenticeship programs . . . . . . . . 42,000 41,000 36,000 34,035 33,916
Number of military apprentices . . . . 45,000 64,000 69,952 77,754 81,684Percent minority . . . . . . . . . . . . . . 35.6 34.0 34.0 33.0 33.3Percent women . . . . . . . . . . . . . . . . 6.7 7.0 7.0 7.0 7.5
Number of reviews conducted:EEO compliance reviews . . . . . . 1,700 1,200 1,800 1,290 NAOn-site quality reviews . . . . . . . . 2,000 1,200 1,500 1,025 NA
Number of apprenticeship actions:New registrations . . . . . . . . . . . 99,500 63,000 79,000 110,785 94,112Completions . . . . . . . . . . . . . . . 40,000 41,000 44,000 44,322 NA
__________________________________________________________________
aEnd of fiscal year data.
bData for Fiscal Years 1991-1993 have been adjusted from previous editions of theTraining and Employment Report of the Secretary of Labor to reflect end of fiscal yearenrollment.
Note: NA = Not available.
Source: U.S. Department of Labor, Employment and Training Administration.__________________________________________________________________

40The standards developed by NAHRO were approved and registered by theBAT. They are used as guidelines for housing authorities and other organizations thatwish to include the STEP-UP component in their registered apprenticeship programs.
41These STEP-UP public housing authorities are in: Huntsville, Alabama;Chandler, Nogales, and Phoenix, Arizona; Ft. Lauderdale, Florida; Chicago and Joliet,
80
Special FY 1994 and 1995 Initiatives
Major apprenticeship activities conducted or supported during the Report period
include the STEP-UP program, the Center for Advanced Journeymen Education, the
International Union of Operating Engineers, the United Automobile Workers (UAW) of
America Skilled Trades Apprenticeship Preparation Program, the Women in
Apprenticeship and Nontraditional Occupations Act, Diversity in Apprenticeship grants,
the Federal-State Registered Apprenticeship Liaison Committee, School-to-Work
initiatives, the development of Education and Performance Apprenticeship Standards,
the Construction Craft Skills Training program, and the Federal Committee on
Apprenticeship.
STEP-UP Program. With technical assistance from BAT and the U.S.
Department of Justice, the U.S. Department of Housing and Urban Development
created the STEP-UP program in FY 1994 to provide employment, job training, and
career opportunities to public and Indian housing residents and other low-income
persons. STEP-UP operates as a first step (one-year maximum) in a longer
employment and training curriculum. It was developed as a component of the National
Apprenticeship and Training Standards which is sponsored by the National Association
of Housing and Redevelopment Officials (NAHRO).40 There are 17 occupations in the
NAHRO apprenticeship standards. Since the program’s inception, the STEP-UP
component has been incorporated in the apprenticeship standards of 19 public housing
authorities.41

Illinois; Baltimore, Maryland; Detroit, Michigan; St. Paul and Minneapolis, Minnesota;Albany, Cohoes, Schenectady, Troy, and Watervliet, New York; Dallas, Texas;Milwaukee, Wisconsin; and Huntington, West Virginia.
42IUOE owns 62 training sites located in the following States: Alabama, Alaska,Arizona, California, Colorado, Connecticut, Florida, Georgia, Hawaii, Illinois, Indiana,Iowa, Kentucky, Louisiana, Maryland, Massachusetts, Michigan, Mississippi, Missouri,Montana, Nebraska, Nevada, New Jersey, New Mexico, New York, Oklahoma, Oregon,Pennsylvania, Rhode Island, Tennessee, Virginia, Washington, and Wisconsin. Atraining site is also located in the District of Columbia.
43The grantee partners include the Center for Occupational Research (CORD) ofWaco, Texas; the Labor Employment and Training Corporation of Bell, California; andthe UAW Skilled Trades Department of Detroit, Michigan.
81
Center for Advanced Journeymen Education (Iowa Journeyworker
Demonstration). The purpose of this demonstration is to identify contemporary skill
standards for mature journeyworkers in the construction industry served by the Central
Iowa Labor Council. The demonstration is also developing and testing a curriculum
geared to improving their skills.
International Union of Operating Engineers. Throughout FY 1994 and 1995,
this BAT-supported effort–administered by the International Union of Operating
Engineers (IUOE)–trained participants in heavy equipment operation, maintenance, and
repair. The project emphasized recruiting and training women for employment in
nontraditional (heavy equipment) occupations. Apprenticeship participation is
approximately 33 percent minorities and 18 percent female.42
United Automobile Workers (UAW) of America Skilled Trades
Apprenticeship Preparation Program. In PY 1994, BAT and the Office of Policy and
Research entered into an agreement with the UAW to develop and implement, on a
pilot basis, an Apprenticeship Preparation Project43 for recruiting, orienting, and training

44The organizations that received grants under WANTO during FY 1995 were:The Home Builders Institute, Washington, D.C. for a nationwide program; theInternational Masonry Institute, Washington, D.C. for programs in Atlantic City, Chicago,Seattle, and the New England Region; and La Raza, Washington, D.C. for programs inTucson, Arizona and Albuquerque, New Mexico.
45In FY 1994, WANTO grants were awarded to the Chicago Women in Trades,Chicago; Tradeswomen of Purpose/Women in Nontraditional Work, Inc., Philadelphia;Women’s Resource Center, Grand Rapids, Michigan; Women Unlimited, Augusta,Maine; Wider Opportunities for Women, Washington, D.C.; and the Young Women’sChristian (YWCA) Association of Greater Memphis/Women in Trades, Memphis,Tennessee.
82
apprentices. The project provides services to minority and female workers. It will help
UAW production workers make the transition into skilled trades and support Federal
and State initiatives aimed at improving School-to-Work Opportunities for youth and
young adults.
Women in Apprenticeship and Nontraditional Occupations (WANTO) Act
and the Diversity in Apprenticeship (DIA) Grants. In FY 1995, women and minorities
seeking to enter and move up in apprenticeship and nontraditional occupations
benefitted from $1.5 million awarded in technical assistance grants to community-based
organizations. In this effort, the Department’s two-fold objectives were to expand skilled
employment and to create greater economic parity for working women and minorities.
Under WANTO, in FY 1995, three organizations received grants to provide
technical assistance to employers and labor unions to expand the employment of
women in apprenticeable and other nontraditional occupations in the private sector.44
During FY 1994, the Department awarded six technical assistance grants totaling
$750,000 to community-based organizations45 to help employers and labor unions
expand skilled employment opportunities for working women. BAT and the

46In FY 1995, the DIA grants were awarded to the following community-basedorganizations: the Minneapolis Urban League; the Long Island Women’s EqualOpportunity Council, New York; and the Preparation Recruitment Employment Program(PREP), Inc., Ohio.
83
Department’s Women’s Bureau jointly administer the WANTO grants.
Through the DIA grants for FY 1995, three community-based organizations
provided technical assistance to employers and labor unions to encourage recruitment,
selection, training, and retention of minorities in higher-skilled apprenticeable
occupations.46
Federal-State Registered Apprenticeship Liaison Committee. One of the
primary objectives of this committee is to build a strong Federal-State partnership for
registered apprenticeship. Throughout the Report period, the Federal-State Registered
Apprenticeship Liaison Committee continued to help improve communications and
facilitate information sharing by conducting meetings and conferences, organizing
regional and State planning and strategy sessions, and by establishing subcommittees
to undertake a cost/benefit study of apprenticeship. In FY 1995, bi-regional sessions
were held for BAT and State Apprenticeship Council (SAC) staff in various SAC States
to develop and implement BAT/State annual plans.
School-To-Work. During FY 1995, staff members from local, State, and
regional offices and the national office participated in implementing the School-To-Work
Opportunities Act of 1994 by providing technical expertise, grant development
assistance, statewide system development guidance, regional/tri-regional assistance,
and regional and national office review teams.
Education and Performance Apprenticeship Standards. During FY 1995,
BAT States and State Apprenticeship Councils continued to expand apprenticeship

47State Committees exist in construction, manufacturing, and service industries.
48The Home Builders Institute is the training component of the NationalAssociation of Home Builders, which has a membership of 120,000 homebuilders. Theassociation is involved with more than 800 affiliated State and local associations and
84
training and improve both the on-the-job training and related instruction components.
One initiative undertaken during the year was the establishment of an 80 percent
core of competencies in the curriculum and work process schedules. Under the
guidance of the Wisconsin State Apprenticeship Council, several of the newly
established 14 State trade committees47 are now using the “Developing a Curriculum”
(DACUM) process in reviewing the related instruction for their trades. Other
committees are also using the Wisconsin Apprenticeship model for expansion into new
trade areas such as professional truck drivers and construction craft laborers. These
committees have developed State standards for the trades through a partnership of
industry, organized labor, the vocational education system, and State and Federal
Government apprenticeship agencies.
In South Carolina, the BAT State office developed and registered apprenticeship
training standards which several associations plan to use as a model for the uniform
implementation of School-to-Work initiatives in the State. The standards can also be
used to develop curriculum in grades K-14. One of South Carolina’s largest employers
in the construction industry is a partner in this initiative and will use the standards as a
tool to require apprenticeship training of all its employees, including related
subcontractors, suppliers, and draftsmen who design the projects.
Construction Craft Skills Training Program. In PY 1993, the Department
awarded $360,330 to the Home Builders Institute to support the Construction Craft
Skills Training Program. Operated by affiliated State and local associations of the
National Association of Home Builders,48 the program provided preapprenticeship

chapters.
49Data for the Construction Craft Skills Training Program are calculated on aprogram year basis.
50Section 2 of the National Apprenticeship Act of 1937 authorizes theappointment of national advisory committees.
51The four ex-officio members of the FCA are the president of the NationalAssociation of State and Territorial Apprenticeship Directors, the president of theNational Association of Governmental Labor Officials (both of the members have votingrights), a representative of the U.S. Department of Education, and the AssistantSecretary of Labor for Employment and Training.
85
classroom and on-the-job training for economically disadvantaged individuals and
displaced workers, with trainees entering registered apprenticeship programs. During
PY 199349, 253 individuals were trained, and 190 were placed in craft-related jobs.
Eleven percent of the trainees were women. The grant expired in September 1994.
Federal Committee on Apprenticeship50 (FCA). Reestablished in December
1993, the FCA advises the Secretary of Labor and the Assistant Secretary for
Employment and Training on ways to improve and expand the registered
apprenticeship system. The Committee makes recommendations regarding: (1)
policies on legislation and regulations affecting apprenticeship; (2) program
responsibilities in the apprenticeship and journeyworker training areas; and (3) the most
effective role of the apprenticeship training system in meeting future skilled worker
training needs. The Committee’s 21 members represent employers, organized labor,
educators, the public, and four ex-officio members.51
SENIOR COMMUNITY SERVICE EMPLOYMENT PROGRAM

86
Background
Program Year 1994 marked the 29th year of the Senior Community Service
Employment Program (SCSEP) which is authorized in Title V of the Older Americans
Act of 1965, as amended (P.L. 102-375). SCSEP finances the creation of part-time
community service jobs for low-income individuals who are at least 55 years old, have
poor employment prospects, and are unemployed.
Participants work at government agencies, nonprofit organizations, schools, and
hospitals. SCSEP also provides nutrition programs, recreation, health and home care,
and transportation services.
Highlights of PY 1993 and 1994 Activities
PY 1994 SCSEP allocations totaled $410.5 million, an increase of $14.4 million
over the PY 1993 allocation of $396.1 million. Of this amount, $320.2 million was
provided to national sponsors and $90.3 million was made available to State agencies
in PY 1994. In PY 1993, approximately $308 million was provided to national sponsors
and approximately $87 million to the State agencies.
SCSEP served 102,000 participants in part-time subsidized jobs in PY 1994 and
over 100,000 participants in PY 1993.
In both years, consistent with policy direction provided by the Department to help
older workers find unsubsidized employment, almost 30 percent of the individuals who
were authorized to enroll were placed in unsubsidized jobs. Also for both years, the
percentage of funds used for program administration continued to be below the

52The legislative limit for program administration is 15 percent of Federal funds. In PY 1993, approximately 12.5 percent of all Federal costs for the program wereadministrative costs, while in PY 1994, the figure was 12.1 percent.
87
legislative limits.52
During the Report period, SCSEP sponsors continued to improve the
geographical distribution of program resources in an effort to ensure that all eligible
individuals have the same opportunity to participate in the program.
Characteristics of SCSEP participants for PY 1988 through 1994 are shown in
Table 9.
As Chart 2 indicates, the percentage of participants who are 70 years old or
older has been growing steadily over the past several years.
88
__________________________________________________________________
Table 9. Selected Characteristics of Senior Community Service EmploymentProgram Participants, PY 1988 through PY 1994
__________________________________________________________________
Program YearCharacteristic
________________________________________
1988 1989 1990 1991 1992 1993 1994__________________________________________________________________
Sex:. . . . . . . . . . . . . . . . . . . . . . . . . . Male 29.7 29.2 28.7 28.9 28.9 28.2
27.9. . . . . . . . . . . . . . . . . . . . . . . . Female 70.3 70.8 71.3 71.1 71.1 71.8
72.1Age:
. . . . . . . . . . . . . . . . . . . . . 50-69 years 18.5 17.4 17.4 17.1 18.5 18.818.9
. . . . . . . . . . . . . . . . . . . . . 60-64 years 27.3 26.1 25.4 25.0 24.8 24.524.5
. . . . . . . . . . . . . . . . . . . . . 65-69 years 26.4 26.7 26.3 26.2 25.6 24.824.5
. . . . . . . . . . . . . . . . . . . . . 70-74 years 16.3 17.3 18.1 18.7 18.6 19.019.2
. . . . . . . . . . . . . . . . 75 years and over 11.5 12.5 12.7 12.9 12.5 12.913.0
Ethnic group:. . . . . . . . . . . . . . . . . . . . . . . . . Whitea 63.3 62.3 62.2 61.3 61.4 60.9
59.4. . . . . . . . . . . . . . . . . . . . . . . . . Blacka 23.3 23.9 23.8 23.9 23.8 23.6
24.3. . . . . . . . . . . . . . . . . . . . . . . Hispanic 8.8 9.0 9.1 9.4 9.5 9.9
10.0. . . . . . . . . . . . . . . . . . Indian/Alaskan 1.6 1.7 1.6 1.6 1.6 1.7
1.7. . . . . . . . . . . . . Asian/Pacific Islander 3.1 3.1 3.3 3.7 3.6 3.8
4.3Veteran . . . . . . . . . . . . . . . . . . . . . . . . . 13.1 13.4 13.3 13.2 13.5 13.5 13.0Education:
. . . . . . . . . . . . . . 8th grade and under 27.4 26.4 25.1 24.3 22.5 21.320.4
. . . . . . . . . . . . . . . . . . 9th-11th grade 21.4 21.6 21.3 20.6 20.3 19.719.4
. . . . . . . . . . . . . . . . . . . . . High school 34.2 34.8 35.4 36.1 37.3 37.838.1
. . . . . . . . . . . . . . 1-3 years of college 12.3 12.4 13.0 13.5 14.0 14.815.2
89
. . . . . . . . . . . . . . . . 4 years of college 4.7 4.8 5.1 5.6 5.9 6.36.9
Family income below the poverty level . . . . . . . . . . . . . . . . . 79.9 80.9 80.2 78.7 79.0 79.9 79.5__________________________________________________________________
aNot Hispanic.
Note: Numbers may not add to 100 percent due to rounding.
Source: U.S. Department of Labor, Employment and Training Administration.__________________________________________________________________

90
History of SCSEP
The SCSEP evolved from a pilot program which was established in the mid-1960s under TitleIII of the Economic Opportunity Act. The original program was known as Operation Mainstream.Administrative responsibility for Operation Mainstream was transferred from the Office of EconomicOpportunity to the Department of Labor in 1967.
“Green Thumb” was the first Operation Mainstream project. Initiated in 1965, it wasadministered by a nonprofit organization for rural workers and affiliated with the National Farmers’Union. In its early years, most of Mainstream’s participants were 55 years old or older.
Mainstream services have remained essentially the same since the program’s inception. It wasoriginally designed as a work experience program, with skill training, basic education, counselingand other supportive services available to supplement work experience. Participants often workedin community beautification and improvement projects which were operated by public and privatenonprofit agencies. For the most part, these projects were concentrated in small communities andrural areas where there were few resources available for such activities and where job opportunitiesof any kind were often scarce. Because of the nature of the work, projects were generally seasonaland were curtailed during the winter months.
By the late 1960s (Fiscal Years 1967 and 1968), there were about 200 different Mainstreamprojects operating throughout the country, serving approximately 24,000 participants each year.
During the project’s early years, the median educational level of the participants was less thaneighth grade. Thirty percent of the project’s enrollees were welfare recipients, and about one fifthh a d b e e n u n e m p l o y e d f o r o v e r a y e a r .
In 1968, contracts of about $1 million each were awarded to the National Council on Aging andthe National Council of Senior Citizens to establish new demonstrations which were known as OlderAmerican Community Service Programs. In 1969, the American Association of Retired Persons wasadded to the list of national organizations that received Federal funds to provide various servicesto older individuals.
In the early 1970s, the U.S. Forest Service was authorized to initiate Operation Mainstreamprojects. The program was given a legislative basis under the Older Americans Act. In addition, afew States and territories received funds in 1976 to operate Mainstream projects.
Three national organizations representing various minority groups received funding in the late1970s. These were the National Caucus and Center on Black Aged, the Asociacion Nacional ProPersonas Mayores, and the National Urban League.
Funding for the initiative increased to $367 million by the end of the 1980s. The fundingincrease enabled the inclusion of two additional national minority sponsors–the NationalPacific/Asian Resource Center on Aging, and the National Indian Council on Aging.
Today, the program is operated in 50 States and territories and by 10 national sponsororganizations. Most States operate the program through their own agencies, although Alabama,Arizona, Florida, Montana, and South Dakota have assigned administrative responsibility foroperating their programs to one or more of the national sponsor organizations.

91
92
EMPLOYMENT SERVICE
During the Report period, the Employment Service (ES) conducted a variety of
labor exchange activities; developed a comprehensive workforce investment strategy
that included labor exchange revitalization, reemployment services, and technology
initiatives; administered the Foreign Labor Certification program; and conducted a
number of related activities. These efforts are described below.
Labor Exchange and Other Activities
Labor Exchange
In PY 1994, 18,809,900 people registered with local ES offices and received a
wide variety of employment-related services. In PY 1993, over 20 million individuals
registered with ES offices. As in previous years, jobseekers were interviewed and,
based on their experience, education, training, and aptitudes, they were assigned one
or more occupational codes to help match their job skills with reemployment services
and employers’ job orders.
In PY 1994, 40.7 percent of these jobseekers were eligible unemployment
compensation claimants, 43.8 percent were women, and 15.6 percent were
economically disadvantaged. In PY 1993, these figures were 47 percent, 43 percent,
and 17 percent, respectively.
In PY 1994, local ES offices referred over 8.2 million jobseekers to interviews
with employers, who listed over 6.6 million job openings with the ES. This compares to
over eight million jobseekers and some 6.4 million job openings in PY 1993. In both

93
years, 2.7 million persons were placed in jobs (representing 32.6 percent of those
referred to employers in PY 1994 and 34 percent in PY 1993).
ES offices referred about 405,200 individuals to training and provided about
676,300 with employment-related counseling during PY 1994. This compares with
about 363,000 individuals who were referred to training and over 629,000 who received
employment-related counseling during the previous program year.
Table 10 shows selected characteristics of ES clients and the services they
received during Program Years 1993 and 1994.
__________________________________________________________________
Table 10. Selected Characteristics of Employment Service Clients and Services Received, Program Years 1993 and 1994
__________________________________________________________________
Program YearProgram Year
19931994
_____________________________________________Item
Number Percent NumberPercent
of totalof total
__________________________________________________________________
Total Applicants . . . . . . . . . . . . . . . 20,195,000 100.0 18,809,900 100.0
Customers served:. . . . . . . . . . . Economically disadvantaged 3,425,600 17.0 2,943,700
15.6. . . . . . . . . . . . . . . . . . . . . . . . . . . Veterans 2,572,100 12.7 2,299,200
12.2. . . . . . . . . . . . . . . . . . Eligible UI claimants 9,236,000 45.7 7,662,100
40.7. . . . . . . . . . . . . . . . . Migrant and seasonal
. . . . . . . . . . . . . . . . . . . . . . . farmworkers 215,800 1.1 191,4001.0
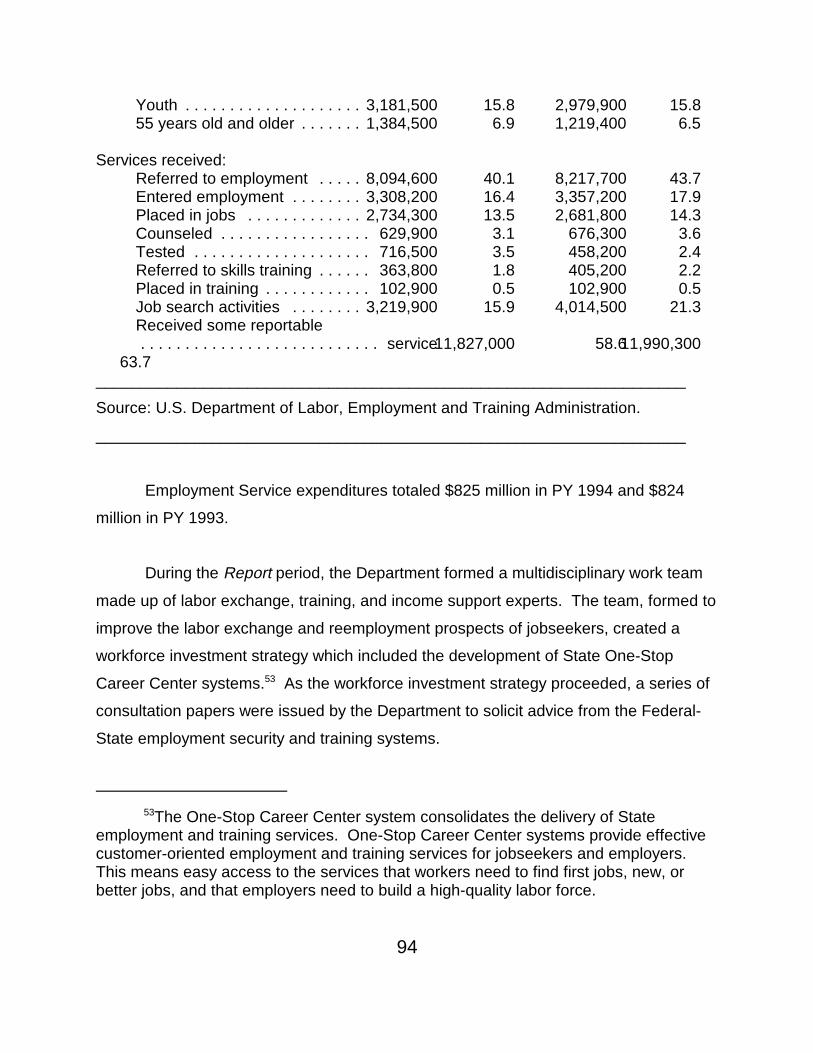
53The One-Stop Career Center system consolidates the delivery of Stateemployment and training services. One-Stop Career Center systems provide effectivecustomer-oriented employment and training services for jobseekers and employers. This means easy access to the services that workers need to find first jobs, new, orbetter jobs, and that employers need to build a high-quality labor force.
94
Youth . . . . . . . . . . . . . . . . . . . . 3,181,500 15.8 2,979,900 15.855 years old and older . . . . . . . 1,384,500 6.9 1,219,400 6.5
Services received:Referred to employment . . . . . 8,094,600 40.1 8,217,700 43.7Entered employment . . . . . . . . 3,308,200 16.4 3,357,200 17.9Placed in jobs . . . . . . . . . . . . . 2,734,300 13.5 2,681,800 14.3Counseled . . . . . . . . . . . . . . . . . 629,900 3.1 676,300 3.6Tested . . . . . . . . . . . . . . . . . . . . 716,500 3.5 458,200 2.4Referred to skills training . . . . . . 363,800 1.8 405,200 2.2Placed in training . . . . . . . . . . . . 102,900 0.5 102,900 0.5Job search activities . . . . . . . . 3,219,900 15.9 4,014,500 21.3Received some reportable. . . . . . . . . . . . . . . . . . . . . . . . . . . service11,827,000 58.611,990,300
63.7__________________________________________________________________
Source: U.S. Department of Labor, Employment and Training Administration.
__________________________________________________________________
Employment Service expenditures totaled $825 million in PY 1994 and $824
million in PY 1993.
During the Report period, the Department formed a multidisciplinary work team
made up of labor exchange, training, and income support experts. The team, formed to
improve the labor exchange and reemployment prospects of jobseekers, created a
workforce investment strategy which included the development of State One-Stop
Career Center systems.53 As the workforce investment strategy proceeded, a series of
consultation papers were issued by the Department to solicit advice from the Federal-
State employment security and training systems.

95
As a result of this effort, the Administration introduced the Reemployment Act in
Congress in March 1994 to provide for a comprehensive workforce strategy. While the
103rd Congress adjourned without taking action on the Act, the Department began to
invest in One-Stop system-building efforts across the country.
Employment Service Revitalization Initiative
In February 1994, at the request of the Assistant Secretary for Employment and
Training, the ES “Revitalization” initiative began with the formation of a special work
group. The work group consisted of representatives from the Department of Labor, the
Interstate Conference for Employment Security Agencies (ICESA), State Employment
Security Agencies (SESAs), and public unions (i.e., the Service Employees
International Union, the American Federation of Labor-Congress of Industrial
Organizations, the American Federation of State, County, and Municipal Employees,
and the International Association of Personnel in Employment Security). Under the
leadership of the Department’s United States Employment Service (USES), the group
was responsible for devising and implementing both a short- and long-term strategy for
increasing the value of the ES to workers, job seekers, and employers. The strategies
were also designed to promote an increased sense of job fulfillment among ES
employees.
Throughout the Report period, the work group met monthly and held bimonthly
teleconferences which resulted in the preparation of the following long-term vision
statement: “The ES is the Nation’s recognized leader in providing efficient labor
exchange services and a universal gateway to workforce development resources by
professional, empowered employees.”
The work group also developed a short-term “ES Revitalization Work Plan”
which focused on continuous quality improvements in services to ES customers. The

54The annual customer service recognition program was a recommendationmade by the ES Revitalization work group.
55These were: “State Employment Service Revitalization Plan Summaries” and“Highlights: State Employment Service Revitalization Plans” (Washington, D.C.: UnitedStates Employment Service, U.S. Department of Labor, Employment and Training
96
plan serves as a guide for each SESA which can tailor ES revitalization efforts to fit its
own needs.
The ES Revitalization Work Plan was presented at the ICESA annual
conference in September 1994. At the conference, the national customer service
annual awards program was initiated. The program recognizes SESA programs and
ES workers for outstanding performance.54 SESAs in nine States received national
customer service awards for innovation in customer service, collaboration for improved
service, leading tools and technology, and professional development/capacity building.
In late 1994, the work group was expanded to include a representative from the
Employers’ National Job Service Council.
In October 1994,
in an effort to obtain technical support for the revitalization initiative, the USES,
in consultation with ICESA, entered into “Cooperative Agreements” with Iowa, Texas,
West Virginia, Maryland, Rhode Island, and Ohio to provide technical support in the
following areas: (1) staff training and capacity building; (2) leadership activities; (3) best
practices, model clearinghouses; (4) local office as a resource center; (5) customer
satisfaction and input; and (6) best practices in job matching. These agreements
produced specific information that was used in the revitalization effort.
The ES Revitalization Work Plan was transmitted to the SESAs in October 1994.
SESAs were requested to submit copies of their individual revitalization work plans
which were subsequently summarized in two publications prepared by USES.55
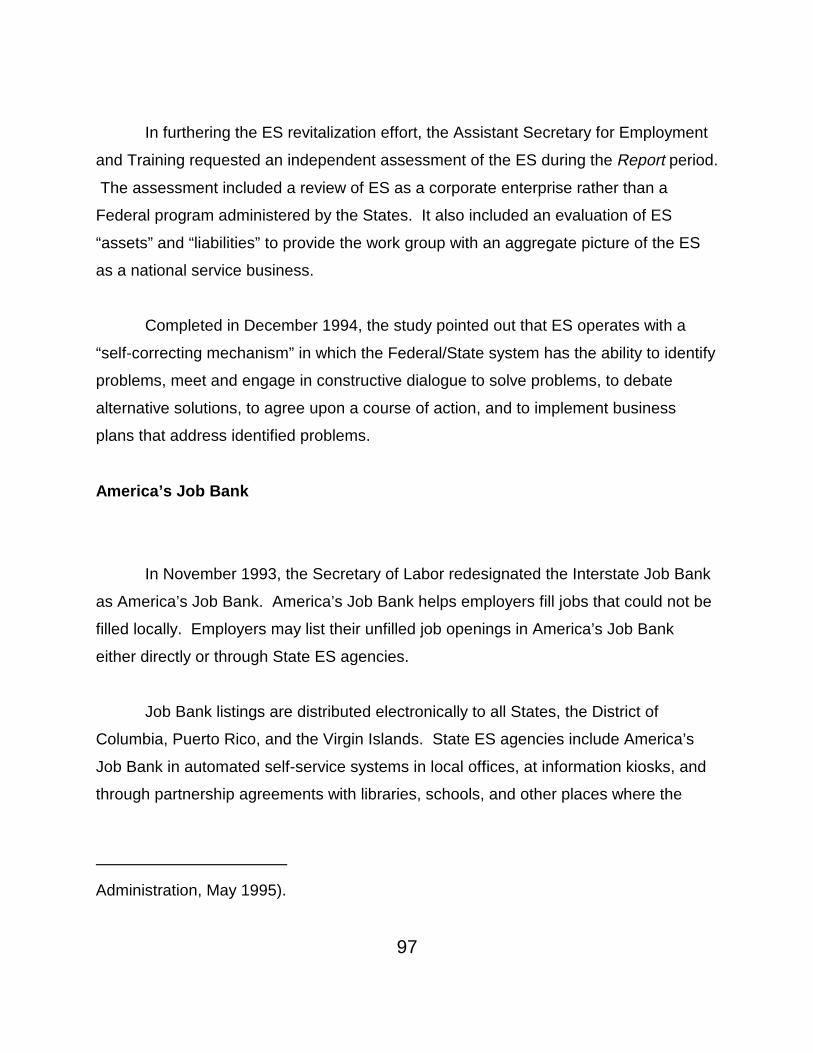
Administration, May 1995).
97
In furthering the ES revitalization effort, the Assistant Secretary for Employment
and Training requested an independent assessment of the ES during the Report period.
The assessment included a review of ES as a corporate enterprise rather than a
Federal program administered by the States. It also included an evaluation of ES
“assets” and “liabilities” to provide the work group with an aggregate picture of the ES
as a national service business.
Completed in December 1994, the study pointed out that ES operates with a
“self-correcting mechanism” in which the Federal/State system has the ability to identify
problems, meet and engage in constructive dialogue to solve problems, to debate
alternative solutions, to agree upon a course of action, and to implement business
plans that address identified problems.
America’s Job Bank
In November 1993, the Secretary of Labor redesignated the Interstate Job Bank
as America’s Job Bank. America’s Job Bank helps employers fill jobs that could not be
filled locally. Employers may list their unfilled job openings in America’s Job Bank
either directly or through State ES agencies.
Job Bank listings are distributed electronically to all States, the District of
Columbia, Puerto Rico, and the Virgin Islands. State ES agencies include America’s
Job Bank in automated self-service systems in local offices, at information kiosks, and
through partnership agreements with libraries, schools, and other places where the

56The Job Bank listings are also provided to military transition offices at morethan 300 U.S. military bases around the world.
57The first legislation that called for profiling was Section 4 of Public Law 103-6. It called for the Secretary of Labor to establish a worker profiling program. Stateparticipation was voluntary. The FY 1994 Federal budget included $9 million toestablish such a program and another $9 million was requested for FY 1995. PublicLaw 103-6 was later superseded by Section 4 of Public Law 103-152 which amendedthe Social Security Act. It added a new subsection requiring State agencies that
98
public can access Job Bank listings.56
In PY 1994, SESAs listed about 710,000 job openings in the Job Bank. In PY
1993, SESAs listed about 455,000 job openings in America’s Job Bank to extend the
advertisement of job openings on behalf of employers and to help people find jobs in
other states. More than one-quarter of the job vacancies were in professional and
managerial occupations and another quarter were in clerical, sales, and service
occupations. Chart 3 shows the number of job listings with America’s Job Bank (and
formerly, the Interstate Job Bank) since 1991.
Reemployment Services
The Worker Profiling and Reemployment Services System is an early
intervention approach that helps individuals who seek unemployment insurance (UI) to
speed their return to productive employment. It consists of two components: (1) a set
of criteria–a “profile”–that can be used to identify UI claimants who are likely to exhaust
their benefits before they find a new job; and (2) various reemployment services for
these individuals. States and employment security agencies are required to “profile” all
unemployment compensation claimants to determine their likelihood of exhausting
benefits. These individuals, as a condition of continued receipt of benefits, are referred
to reemployment services such as job search assistance training.57

administer UI laws to establish and use a system of profiling all new claimants forregular compensation.
58See The Worker Profiling and Reemployment Services System: Legislation,Implementation Process and Research Findings (Washington, D.C.: U.S. Departmentof Labor, Employment and Training Administration, Unemployment Insurance Service,1994), which is summarized in Chapter 2 of this publication.
59The States selected were Delaware, Florida, Kentucky, New Jersey, andOregon.
99
A recent Department-sponsored study revealed that the early referral of long-
term UI claimants to reemployment services speeds up their return to new jobs.58
During the Report period, ES, in conjunction with the UI Service (UIS) and the
Department’s office responsible for administering Economic Dislocation and Worker
Adjustment Assistance Act (EDWAA) programs, issued policy and operating
instructions to States to implement the Worker Profiling and Reemployment Services
initiative.
In PY 1994, ES, UIS and EDWAA selected five prototype States59 to pioneer
worker profiling techniques and reemployment services to speed the return of long-term
unemployed UI claimants to new jobs. Funds were awarded to the prototype States
and 20 “first wave” States to develop profiling models and to strengthen the provision of
reemployment services by both ES and training service providers.
Employers’ National Job Service Council
Throughout PY 1993 and 1994, the Department continued to fund the
Employers’ National Job Service Council (ENJSC), a volunteer organization of

60Its final reauthorization came under the Omnibus Budget Reconciliation Act of1993.
61These groups were people with disabilities who were referred to employersfrom the vocational rehabilitation programs of either a State or the U.S. Department ofVeterans Affairs; youth ages 18-22 from economically disadvantaged families; youthages 16-19 from economically disadvantaged families who participated in qualifiedcooperative education programs; economically disadvantaged youth 16 to 17 years oldon the hiring date, who had not previously worked for the employer, and were hired fora summer job; economically disadvantaged Vietnam-era veterans; recipients of FederalSupplemental Security Income (SSI); recipients of State and local general assistancepayments for at least 30 days; economically disadvantaged ex-convicts who were hiredno later than five years after their date of release from prison or the date of conviction(whichever was more recent); and recipients of Aid to Families with Dependent Children(AFDC) who were eligible for AFDC benefits on the hiring date and had received it for90 days immediately before being hired.
100
approximately 100,000 employers who work with ES through 1,100 local Job Service
Employer Committees (JSECs). ENJSC helps ES improve its labor exchange system
and inform employers of America’s Job Bank and other related programs. It also helps
employers understand the processes for hiring and training special groups of workers,
including individuals who are economically disadvantaged, youth who are at-risk of
dropping out of school or not succeeding in the labor market, veterans, and disabled
persons.
Targeted Jobs Tax Credit
Authorization for the Targeted Jobs Tax Credit (TJTC), which was first
authorized by the Revenue Act of 1978 (P.L. 95-600), and subsequently reauthorized
several times,60 expired December 31, 1994.
TJTC provided tax credits to employers who hired individuals with significant
barriers to employment from nine specific target groups.61 In most cases, employers

62Because TJTC was a tax-related program, data were provided on a calendaryear basis.
101
who hired qualified individuals could claim a tax credit of 40 percent of the first $6,000
of the employee’s first-year wages, for a maximum credit of $2,400. In cases where
employers hired economically disadvantaged youth, they could claim a credit of 40
percent of the youth’s wages up to $3,000, for a maximum credit of $1,200.
Individuals from the designated target groups received vouchers which indicated
to prospective employers that, if hired, the employer would be eligible for the tax credit.
Employers who hired individuals who had the vouchers could then obtain certifications
from State Employment Security Agencies (SESAs). The certifications would later be
used by the employers to document their eligibility to receive the tax credit. While most
of the vouchers were issued by the SESAs, qualified cooperative education programs,
local welfare offices, and local offices of the Department of Veterans’ Affairs were also
authorized to issue vouchers. (Certifications, however, were issued only by the
SESAs.)
In August 1994, the Office of the Inspector General (OIG) issued a report of an
audit of the TJTC program in selected States. The OIG concluded that TJTC was not
an effective and economical means of helping target group members obtain jobs;
mostly because employers would have hired these individuals anyway. The
Administration did not request an extension of the program.
During Calendar Year 1994, 591,632 TJTC vouchers and 391,896 certifications
were issued. During Calendar Year 1993, 379,427 vouchers and 272,763 certifications
were issued.62
Occupational Information Network

102
Throughout the Report period, the Department continued to replace the 60-year-
old publication, the Dictionary of Occupational Titles (DOT) and the system that
produces it with a new, computerized database known as the Occupational Information
Network (O*NET). The O*NET collects, analyzes, organizes, publishes, and
disseminates scientifically verified worker skills and job requirement information.
The O*NET will be as a major component of a new national labor market
information system. In support of the O*NET’s database, the Department plans to
combine the Occupational Analysis Field Centers with the Assessment Research and
Development Centers.
The Assessment Research and Development Centers are located in
Sacramento, California; Salt Lake City, Utah; Detroit, Michigan; Raleigh, North Carolina;
and Brooklyn, New York. Staff are employed by their respective State employment
security offices except for the Sacramento office, which is staffed by a private sector
company. Under cooperative agreements with Department, the Centers worked in PY
1994 on the General Aptitude Test Battery (GATB) improvement final report, the
abilities profiler, and the revision of the occupational interest inventory.
During the same period, the Occupational Analysis Field Centers, under grants
from the Department, worked with the O*NET prototype developer to convert existing
DOT data to the new O*NET content model and assisted with data collection. These
field centers are located in Boston, Massachusetts; Salt Lake City, Utah; Detroit,
Michigan; Raleigh, North Carolina; and St. Louis, Missouri. Staff are employed by their
respective State employment security offices.
In addition to serving as an occupational information database, the O*NET
system will serve as a framework for the Department’s assessment research and
development activities.

63The National Monitor Advocate, along with regional and State MonitorAdvocates, oversees and promotes employment services for farmworkers.
103
During the Report period, the O*NET system undertook a series of initiatives to
improve the technical validity and reliability of existing assessment tools (such as the
GATB and the “occupational interest inventory”).
The O*NET database and assessment tools will serve ES offices, one-stop
career centers, and other workforce development initiatives such as school-to-work
transition programs, activities centered around developing skill standards for various
occupations, America’s Labor Market Information System, the Job Corps, and EDWAA
programs.
Help for Migrant and Seasonal Farmworkers
The H-2A Temporary Labor Certification program (which is described in more
detail later in this section) enables agricultural employers who anticipate a shortage of
domestic workers to bring nonimmigrant aliens into the country to perform agricultural
labor (or services of a temporary or seasonal nature) only if U.S. workers are not
available. In this regard, during the Report period, the National Monitor Advocate63
worked closely with the Department’s Division of Foreign Labor Certifications to
enhance the recruitment of U.S. farmworkers as required by the H-2A program. This
was accomplished by publicizing jobs with farmworker organizations and the media.
In addition, the migrant rest center in Ohio received $36,000 in additional funds
during the period to develop automated job information to be made available to migrant
workers on their way to employment in the midwest.

104
Also during the period, several States tested innovative programs to help migrant
and seasonal farmworkers. One such program in New York State established Job
Service Employer Committees to address the unique situation, problems, and
information needs of agricultural workers. Regional office staff helped the committees
obtain current information on Federal regulatory requirements.
Foreign Labor Certification
Alien labor certification programs ensure that the admission of aliens to work in
this country on a permanent or temporary basis does not adversely affect the job
opportunities, wages, and working conditions of U.S. workers. With few exceptions,
foreign labor programs are jointly administered by the Department of Labor and the
State Employment Security Agencies. These programs are summarized below.
Permanent Labor Certification. Aliens seeking to immigrate to the United
States to work must obtain an offer of permanent, full-time employment from an
employer in the United States. The alien cannot be admitted as a permanent resident
unless, among other things, the employer obtains a labor certification from the
Department acknowledging that qualified U.S. workers are not able, willing, or available
for the employment offered to the alien and that the wages and working conditions
offered to the alien will not adversely affect those of similarly employed U.S. workers.
The labor certification process requires the employer to recruit U.S. workers at
prevailing wages and working conditions through the State Employment Service, by
advertising, posting notice of the job opportunity, and by other appropriate means. A
regional Labor Department certifying officer makes a decision to grant or deny the labor
certification based on the results of the employer’s recruitment efforts and compliance
with the Department’s regulations.

105
In an effort to further ensure that the entry of foreign workers does not depress
the wages of U.S. workers, in FY 1995 the Department provided special funding for all
States to hire a prevailing wage specialist. In addition, during FY 1995 a prevailing
wage task force, made up of national, regional, and State wage rate experts was
formed. The team will support the prevailing wage responsibilities of the States,
including: (1) providing technical assistance and training to State staff; (2) examining
current prevailing wage practices; and (3) identifying current wage surveys which meet
certain standards.
Also in FY 1995 Federal and State ES staff continued to improve the alien labor
certification process. The goal of the initiative was to reduce the resources needed for
alien labor certification, to simplify the process, improve customer service, and increase
the use of technology in this effort.
The Department also held two national conferences in FY 1995 which were
attended by national, State, and regional ES staff and experts in the immigration field.
Attendees discussed prevailing wages, advertising, and other recruitment methods
used to attract U.S. workers, State and Federal roles in alien labor certification, litigation
and legal issues, and consistency in interpreting policies.
In FY 1995, the Department received 35,509 applications from employers to
allow foreign workers to fill permanent jobs; 26,044 of these applications were
approved. In FY 1994, the Department received 27,287 employer applications and
24,721 were approved.
H-2B Labor Certification. Under the H-2B nonimmigrant visa classification,
aliens may come temporarily to the United States to perform nonagricultural work. The
process for obtaining an H-2B labor certification is very similar to that required for
permanent labor certification, although it is not as extensive or time consuming. The

64See the description of the Migrant and Seasonal Farmworkers program in thisChapter. Also see Marlene Strong and Ron D’Amico, Evaluation of the JTPA Title IV
106
labor certification may be issued for a period of up to one year; renewable for a
maximum of three years, and the job must be temporary (i.e., a one-time occurrence, a
seasonal need, a peak workload need, or an intermittent need).
In FY 1995 the Department received 2,153 applications from employers
requesting certification for temporary nonagricultural job opportunities. In FY 1994,
2,234 applications were received.
H-2A Temporary Labor Certification. The H-2A temporary agricultural
program provides a way for agricultural employers who anticipate a shortage of
domestic workers to bring nonimmigrant aliens to the U.S to perform temporary or
seasonal agricultural labor or services. Before the Immigration and Naturalization
Service can consider an employer’s petition for such workers, the employer must file an
application with the Department stating that there are not sufficient workers who are
able, willing, qualified, and available, and that the employment of aliens will not
adversely affect the wages and working conditions of similarly employed U.S. workers.
The statute and Department regulations provide for numerous worker
protections and employer requirements with respect to wages and working conditions of
workers in this program that do not apply to nonagricultural programs. The
Department’s Employment Standards Administration enforces the provisions of H-2A
worker contracts. In both Calendar Years 1994 and 1993, the Department received
approximately 3,000 applications requesting certification to fill approximately 18,000 job
openings with temporary agricultural foreign workers.
In both FY 1994 and FY 1995, funds from JTPA’s Migrant and Seasonal
Farmworker (Section 402) program64 were made available through State and

Migrant and Seasonal Farmworker Program (Oakland and Menlo Park, Calif.: BerkeleyPlanning Associates and Social Policy Research Associates, 1994) which issummarized in Chapter 2 of this publication.
65Attestations are statements by health care facilities that timely and significantsteps have been taken to develop, recruit, and retain U.S. registered nurses and thatthere are no strike or lock-out activities.
107
community agencies in Florida to help workers travel to agricultural jobs in other States.
H-1A Nurses. The Immigration Nursing Relief Act (INRA) of 1989 established a
new H-1A nonimmigrant classification for registered nurses for a five-year period. In
order for a health care facility to access and employ foreign nurses under INRA, the
facility must take “timely and significant” steps to develop, recruit, and retain U.S.
registered nurses in order to reduce dependence on nonimmigrant alien nurses, while
simultaneously ensuring the protection of their wages and working conditions. There
must be no strike or lockout at the place of employment. H-1A “attestations”65 are filed
with and processed by regional offices in Boston, Chicago, Dallas, and Seattle. As
required by law, records are maintained for public disclosure in the Department’s
national office.
In FY 1994, 1,709 H-1A attestations were received, of which, the Department
approved 1,424. The program expired September 1, 1995.
H-1B Specialty (Professional) Workers. Employers who intend to temporarily
employ alien workers in professional occupations or as fashion models must file labor
condition applications with the Department stating that they will pay the appropriate
wage rate to the alien, that they have notified the bargaining representative or otherwise
posted notice of their intent to employ alien workers, and that there is no strike or
lockout at the place of employment. Aggrieved parties may file complaints with the
Department regarding misrepresentation or failure to comply with the statements

66Since the statutory Immigration and Naturalization Service (INS) limit is 65,000per year admitted to the United States, employers are requesting that the Departmentapprove more attestations than the number for which will eventually be issued visas.
108
attested to in the application.
Where the complaint is successful, the Employment Standards Administration
may assess penalties (usually a fine called a civil monetary penalty) and the employer
may be barred from filing petitions for permanent and temporary workers for at least
one year. H-1B applications may be approved for periods of up to three years, and can
be extended for three more–the maximum allowable period of stay in the United States
under H-1B status.
The statute limits the number of aliens that may be admitted to the United States
on H-1B visas to 65,000 per year. The Department amended its regulations on
December 20, 1994, by publishing a final rule to increase protections for U.S. workers
and codify policy positions developed through the operation of the program. However,
there has been much criticism that employers still do not need to test the labor market
for available and qualified U.S. workers, nor is there a prohibition on hiring foreign
workers when U.S. workers are laid off from the same firm.
The Department received 117,345 H-1B labor condition applications66 in FY
1995 and 97,166 applications in FY 1994.
In FY 1994, the top five occupations requested were physical and occupational
therapists, computer occupations, college/university faculty, physicians/surgeons, and
accountants/auditors. (The physical and occupational therapists category and the
computer occupations category accounted for 74 percent of all requests in FY 1994.)
F-1 Students. Under the F-1 program, foreign students may work for employers

109
who have filed attestations with the Department. Students may work off-campus after
the first year of study for no more than 20 hours per week, and full-time during vacation
periods and between school terms. Attestations filed by the employer must state that
they have recruited unsuccessfully for 60 days and that they will pay the appropriate
wage rate to F-1 students and similarly employed workers. Employers may be
disqualified from hiring foreign students if the Department finds misrepresentation or
noncompliance with the attestation. This pilot program for off-campus employment of
foreign students is scheduled to expire on September 30, 1996.
In FY 1995, the Department received 976 F-1 student attestations and approved
559. In FY 1994, 1,735 student attestations were received and 905 were approved.
D-1 Crewmembers. Performance of longshore work at U.S. ports by D-1
crewmembers on foreign vessels is prohibited, with few exceptions.
One such exception requires an employer to file an attestation with the
Department stating that it is the prevailing practice for the activity at that port, that there
is no strike or lockout at the place of employment, and that notice has been given to
U.S. workers or their representatives. Violations may produce penalties of up to $5,000
for each alien crewmember wrongfully performing longshore work, and would bar
vessels owned or chartered by the employer from entering all U.S. ports for up to one
year.
Another exception applies to longshore work to be performed in Alaska. The
regulations governing the Alaska exception were published in the Federal Register on
January 19, 1995.
In FY 1995, the Department received 34 such attestations for the performance of
longshore work at U.S ports in the State of Alaska, and approved 33. In FY 1994, nine
attestations were received and nine were approved.

110
UNEMPLOYMENT INSURANCE PROGRAM
Background
The Federal-State unemployment insurance (UI) system provides cash
payments directly to unemployed persons who were engaged in work covered by State
UI laws, lost their jobs through no fault of their own, and are looking for new
employment. It covers about 110 million workers–virtually all persons working for
salaries and wages in the Nation.
The UI program was established under the tax credit and grant incentives
enacted in the original Social Security Act of 1935. The system is financed primarily
through State taxes paid by employers on the wages of their covered workers, although
three States also collect small taxes from employees. Funds collected are held for the
States in the Unemployment Trust Fund in the U.S. Treasury.
State agencies take applications for and administer the UI program. Regular
benefits (cash payments to laid-off workers) are payable for up to 26 weeks in most
States, and extended benefits (EB) are payable in individual States when “triggered on”
by periods of high unemployment in a State. EB payments increase a claimant’s
benefit entitlement by half of their entitlement to regular benefits, for a combined total of
up to 39 weeks. The EB program is funded on a shared basis–half from State funds
and half from Federal funds.
From time to time, in periods of national economic recession, when all States are
affected by high and sustained unemployment, federally funded programs of

111
supplemental benefits have been adopted. There were two such programs during the
1970s, one during the early 1980s, and the Emergency Unemployment Compensation
(EUC) program which was effective from November 1991 through April 1994.
As agents of the Federal Government, States also pay benefits to ex-service
members with recent service in the Armed Forces, former civilian Federal employees,
workers who lose their jobs as a result of the Nation’s trade policies, and workers who
lose their jobs as a result of a natural disaster and are otherwise ineligible for UI.
Highlights of FY 1994 and 1995 Activities
Initial claims for regular UI benefits averaged 1.5 million per month in FY
1995–the same monthly average for FY 1994.
In FY 1995, approximately 7.9 million workers received benefits totaling $21.0
billion under regular State UI programs. In FY 1994, about 8.2 million workers received
benefits totaling $21.7 billion under these State programs. Table 11 shows the number
of beneficiaries and amount of benefits paid under all unemployment compensation
programs in FY 1994 and FY 1995.

112
__________________________________________________________________
Table 11. Unemployment Compensation Benefits Paid and Beneficiaries by Program, FY 1994 and 1995
__________________________________________________________________
Amount Beneficiaries(In Millions) (In Thousands)
Program ________________________________________
FY 1994 FY 1995 FY 1994 FY 1995__________________________________________________________________
Regular State Unemployment Benefits . . . . . . . . . . . . . . . . . . . . . $21,667 $20,994 8,162 7,893Federal-State Extended Benefits . . . . . . 292 77 217 69Emergency Unemployment Com- pensation (EUC) Benefits . . . . . . . . . 4,224 0 1,017 0Unemployment Compensation for for Federal Employees (UCFE)a . . . . . . 333 344 84 82Unemployment Compensation for Ex-servicemembers (UCX)a . . . . . . . . . 398 319 103 84Trade Readjustment Allowancesb . . . . 120.2 143.2 30,845 27,900Disaster Unemployment Assistance (DUA)c . . . . . . . . . . . . . . . 76.3 15.2 31,942 13,246Total . . . . . . . . . . . . . . . . . . . . . . . . 27,224.5 21,892.4 41,308d 21,305d
__________________________________________________________________
aThe UCFE program provides benefits to jobless former Federal employees, and the UCX programprovides benefits to unemployed ex-servicemembers. Both programs are financed with Federal funds,with States–through agreements with the Secretary of Labor–determining benefit amounts, terms, andconditions of receipt.bTrade readjustment allowances are provided to workers laid off by firms adversely affected by importcompetition. Claimants must exhaust eligibility for regular unemployment insurance and extendedbenefits before collecting trade readjustment allowances. (See the section on trade adjustmentassistance in this chapter.)cDisaster unemployment assistance aids workers made jobless by a major disaster as declared by thePresident. Benefit payments are funded out of the Federal Emergency Management Agency’sappropriation. Individuals eligible for regular unemployment insurance benefits are not eligible fordisaster unemployment assistance.dTo avoid duplication, extended benefit and trade readjustment allowance recipients are not included inthe total.Source: U.S. Department of Labor, Employment and Training Administration.__________________________________________________________________

113
Reemployment Demonstration Projects
During the Report period, the Department continued to conduct a series of
demonstration projects that test innovative ways of using the UI system to help
claimants who lose their jobs through major layoffs or plant closings. These “dislocated
worker” initiatives are designed to:
4 Identify UI recipients who meet the “profile” of a dislocated worker and refer
these individuals to reemployment services early in their spell of unemployment;
4 Test different reemployment service options that help targeted UI recipients
become reemployed (either in a wage and salary job or through self-
employment); and
4 Create effective service delivery networks for dislocated UI recipients through
improved program linkages among UI and other service providers, including the
Employment Service, the EDWAA program, and economic development
agencies.
Five States (Florida, Maryland, Massachusetts, Washington, and Wisconsin)
and the District of Columbia participated in such demonstration projects during the
Report period. The various projects are briefly described below.
Self-Employment Demonstration Projects
During the Report period, the Department continued to study the viability of self-
employment as a reemployment option for a portion of the population of unemployed
workers. The first impact evaluation of two UI self-employment demonstration projects
in Washington State and Massachusetts was completed during the period. These
projects had provided UI beneficiaries who were permanently laid off and were
interested in self-employment with an array of services designed to help them start their

67They were typically sole proprietorships with one or a few employees.
114
own microenterprises.67
The Washington demonstration, called the SEED Project, provided selected UI
claimants with self-employment allowances in the form of lump-sum payments which
could be used as business startup capital. These payments were equal to the
remainder of the claimants’ entitlement for UI benefits. The project also provided
participants with a series of business training seminars, one-on-one business
counseling and technical assistance, and regular meetings of a peer support group.
A total of 755 eligible UI recipients were randomly selected to receive these
services while another 752 were assigned to a control group (which did not receive self-
employment services but did receive other UI services). Of those individuals who
received services, 450 received lump-sum payments averaging $4,225 each to start
microenterprises. Business starts were primarily in the areas of services and retail
trade, with some small-scale manufacturing and construction businesses also started.
The Massachusetts demonstration, called the Enterprise Project, provided
eligible UI recipients with biweekly self-employment allowance payments equal to their
regular UI benefits to supplement their earnings while they were starting their new
businesses. (Lump-sum payments were not offered in the Massachusetts project.)
Like the Washington State project, Massachusetts participants received a series of
business training workshops, one-on-one business counseling and technical
assistance, and peer support.
Enrollments for the Enterprise Project ended in May 1993. Over the three years
of project operations, 614 UI claimants were selected for the demonstration and
another 608 were selected for a control group. Project participants received biweekly

68See Jacob M. Benus, et al., Self-Employment Programs: A New ReemploymentStrategy, Final Report on the UI Self-Employment Demonstration (Bethesda, Md.: AbtAssociates, Inc., 1994) which is summarized in Chapter 2 of this publication. See alsoJacob M. Benus, Michelle L. Wood, and Neelima Grover, Self-Employment as aReemployment Option: Demonstration Results and National Legislation, UnemploymentInsurance Occasional Paper 94-3 (Bethesda, Md.: Abt Associates, Inc., 1994) which isalso summarized in Chapter 2.
115
self-employment allowances of approximately $530 to $540 per person while working
full-time on planning and operating their businesses. Nearly half of the Massachusetts
participants started their own microenterprises, mostly in the services industry.
An evaluation report on the net impacts of the self-employment demonstration
projects, based on followup data one and one-half years after enrollment in each
project, was published during FY 1994.68 The results from this report showed that self-
employment assistance promoted rapid reemployment of participants who pursued this
option (between two and four percent of the population of UI beneficiaries). Self-
employment assistance significantly reduced project participants’ initial duration of
unemployment and increased their total employment (i.e., the combination of self-
employment plus wage and salary employment) over the followup period.
Self-employment assistance also had an impact on job creation for participants,
nearly doubling the number of business starts by participants (as compared to a
randomly selected control group) in both Washington State and Massachusetts. Sixty-
three percent of those businesses started by project participants in Washington State
were still operating at the time of the followup survey; in Massachusetts, 77 percent of
the participants who started a business through the project were still in business at the
time of the survey. The authors of the study report concluded, “Given these results, we
believe that self-employment programs like Washington State’s SEED Demonstration
and the Massachusetts Enterprise Project represent viable policy tools for promoting

69Since contractors conducting research and evaluation projects undergovernment sponsorship are encouraged to express their own judgment freely, theirfindings do not necessarily represent the official opinion or policy of the Department.
116
the rapid reemployment of UI claimants.”69
Based in part on the findings of this evaluation report, a provision allowing States
to establish self-employment assistance programs as part of their UI programs was
signed into law as part of Title V of the North American Free Trade Agreement (NAFTA)
Implementation Act (P.L. 103-182).
Work Search Demonstration Project
The area of work search represents a complex issue within the UI system.
While one purpose of UI is to provide financial support to unemployed workers
separated from jobs through no fault of their own, another important purpose is to
promote the reemployment of UI recipients. In this regard, the UI system offers
reemployment services and most States require that claimants make an active search
for suitable work.
During the Report period, the Department conducted a demonstration project in
Maryland to test the effects of alternative work search requirements on UI recipients’
return to work. The demonstration drew on the findings of several previous studies,
including the Washington Alternative Work Search Experiment. The project tested four
variations on work search requirements for UI recipients: (1) no required work search
contacts; (2) required work search requirements (two work search contacts) plus
increased verification of those contacts; (3) regular work search requirements plus a job
search workshop; and (4) an increased number of required work search contacts (four)
with potential employers.
70See Walter Corson and Joshua Haimson, The New Jersey UnemploymentInsurance Reemployment Demonstration Project: Six-Year Followup and SummaryReport (Princeton, N.J.: Mathematica Policy Research, Inc., 1994) which is summarizedin Chapter 2 of this publication.
117
The Maryland Work Search Demonstration began operations on a pilot test
basis in one UI local office from March-June 1993. Full implementation of the
demonstration project began in June 1993 in five sites covering seven local offices in
Maryland. The demonstration completed enrolling participants in December 1994.
Using UI data files, participants are being tracked for 12 months after enrollment.
Job Search Assistance Demonstration Projects
Title II of the Emergency Unemployment Compensation Act of 1991 required the
Department to enter into agreements with three States to test the feasibility of providing
intensive job search assistance programs for dislocated workers. These Job Search
Assistance Demonstrations will use the UI program to rapidly identify UI recipients likely
to exhaust their benefits before they find new jobs and to refer these individuals to job
search assistance services early in their unemployment spell.
The project is designed to determine the feasibility of implementing different
types of job search assistance programs. The Job Search Assistance (JSA)
Demonstration is an experimental research effort which builds on the results of the New
Jersey UI Demonstration Project.70 The New Jersey demonstration showed that
intensive job search assistance services can speed dislocated UI claimants’ return to
productive employment. The JSA demonstration expands on this knowledge by testing
alternative service approaches to see which ones have the greatest impacts and are
the most cost-effective.
71See the discussion of the EDWAA program under the JTPA section of thisChapter. For additional information about EDWAA activities, see Katherine P.Dickinson, Deborah J. Kogan, Kevin J. Rogers, and David Drury, Study of theImplementation of the Economic Dislocation and Worker Adjustment AssistanceAct–Phase II: Responsiveness of Services (Menlo Park, Calif.: Social Policy ResearchAssociates; Oakland, Calif.: Berkeley Planning Associates; and Menlo Park, Calif.: SRIInternational, 1993) which was summarized in the edition of the Training andEmployment Report of the Secretary of Labor which covered the period July 1992through September 1993.
118
A comprehensive range of job search assistance services will be provided to
targeted workers enrolled in the demonstration. These services include orientation,
vocational testing, a workshop on job search skills, individual assessment and
counseling, and followup assistance. Additional services may include intensive
placement assistance, job clubs, and classroom or on-the-job training programs
provided through the EDWAA program.71
Florida, Wisconsin, and the District of Columbia were competitively selected to
operate the Job Search Assistance Demonstration Projects. (Wisconsin later withdrew
from the project.) The Florida demonstration, which began in November 1994, is
operating in ten local sites. Enrollment of project participants in the District of Columbia
began in February 1995 in one site.
The Unemployment Insurance Performance System
In Fall 1993, the Unemployment Insurance Service began addressing the issue
of improved UI operational performance. Although this issue had been under
consideration for some time, two events prompted its immediate attention. These were
the Administration’s emphasis on improving the efficiency and customer-orientation of

72See the discussion of the Benefits Quality Control program at the end of the UIsection of the Report.
119
all governmental activities, and the Vice President’s National Performance Review,
which recommended that UI review its oversight system (looking especially at how it
could refocus the UI Benefits Quality Control (BQC) program to make it improve UI
benefit payment operations).72
The UIS’ partner in this task has been a committee of senior SESA managers
appointed by the Interstate Conference of Employment Security Agencies (ICESA).
This joint workgroup comprising the State representatives and Federal national and
regional office staff met nearly once a month throughout much of the Report period.
The workgroup set three goals related to providing better services to UI
claimants and employers. These were to: (1) develop the broad framework for State
Employment Security Agency-Department of Labor working relationships and the roles
for the partners; (2) develop a system through which the UI system can more readily
enhance performance; and (3) apply the framework and performance enhancement
principles in reconsidering the nature and focus of the BQC program.
By the end of FY 1994, the committee had developed and circulated for
comment “Partnership Principles,” which outlined how Federal and State officials and
staff should work together to serve UI system customers. Five papers illustrating how
these principles translate into complementary Federal and State roles in different areas
were developed and an outline of a closed-loop management system for continuously
enhancing operational performance was produced.
The committee completed the conceptual design of a “continuous improvement
system” early in Calendar Year 1995. It envisions that States, in cooperation with the
Department, will continuously track performance for a small set (approximately 10) of

73The committee identified the following key performance objectives: timely firstpayments; timely nonmonetary adjudications; prompt appeals (lower authority); promptappeals (higher authority); timely deposit to clearing account; timely transfer to trustfund; timely status determinations; quality adjudications; quality lower authority appeals;and quality status determinations.
120
key performance objectives.73 Standard measures will be defined for these objectives
and national standards and criteria will be set.
The committee identified another 35 to 40 other activities of central importance
to the UI system. Although federally specified performance measures have been or will
be developed for these activities, it is envisioned that States will set individualized
planning targets for them. A complete description of the conceptual design was
circulated to SESAs and various UI stakeholders at the end of FY 1995.
Having completed the conceptual design of the continuous improvement system,
the committee addressed the BQC program. It completed work on a proposed redesign
of the program at the end of FY 1995.
A single system for using UI performance measures to improve performance will
affect all existing UI measurement systems and measurement initiatives. Three of the
most important UI measurement systems are discussed below.
The Performance Measurement Review (PMR)
Since 1988, UIS has been working on the PMR project to examine, evaluate,
and improve the measures used to assess the timeliness and quality of State
Employment Security Agencies’ (SESAs) benefit payment performance activities. For
the past 20 years, aspects of benefit payment performance have been measured by the

121
Quality Appraisal (QA) system. For many QA measures, State performance is
benchmarked against “Secretary’s Standards and Desired Levels of Achievement.”
When a SESA fails to meet benchmarked performance levels, the SESA must submit a
formal corrective action plan in order to receive its annual administrative grant.
QA, which was designed before automation and advanced electronic data
handling made substantial changes in SESA operations, has not been responsive to
the technological changes which have affected performance in various ways.
Three phases of activity have comprised PMR. In Phase I, UI program
specialists and an expert panel evaluated the existing QA benefits measures. The
evaluators suggested technical improvements to many of the measures, and developed
alternatives for others, taking into account the role of automated processes in SESA
performance.
In Phase II, UIS monitored a six-State, 15-month field test of the new
performance measures to determine their operational feasibility. During the test, a
contractor developed a system for validating the data underlying the new measures. All
field test data were complete and available for analysis by the end of FY 1994.
As a result of the interpretation of field test data, participants’ responses to the
new reports, and their reports of costs for implementation, UIS made some changes in
measures.
Now in Phase III, UIS is implementing the new measures, which have been
cleared by the Office of Management and Budget. To facilitate electronic reporting of
data for the new and revised measures, UIS is creating new and revising previous data
entry screens. It is also revising the UI reporting handbook, ETA 401.
Also, UIS is writing new handbooks for evaluating the quality of nonmonetary
122
determinations and lower authority appeals, and is planning training for both SESA staff
and regional office staff of the Department.
The Revenue Quality Control (RQC) Initiative
In 1989, the UIS initiated the RQC initiative to examine, evaluate, and improve
measures of tax processing performance. In FY 1993, States began implementing the
new RQC-developed measures of timeliness, accuracy, and completeness. Their
implementation activities continued throughout 1994 and 1995, with technical
assistance from UIS staff. “Computed measures”–performance indicators of timeliness
and completeness–were emphasized throughout 1994. The “ETA 581 Report,” which
is the primary tax activity reporting instrument used by the Department, was extensively
revised during the period to conform to the new indicators developed by RQC.
Two other related activities occurred during the period. First, the UIS conducted
a three-State pilot test to develop an approach to validating the tax data on the “ETA
581 Report.” Secondly, a workgroup began revising how the timeliness of depositing
funds to the clearing account is measured. This measure was pilot tested in FY 1995.
Benefits Quality Control
Since 1987, the accuracy of benefit payments for the largest permanently
authorized UI programs has been measured through the BQC program. It provides
statistically sound estimates through carefully controlled verification of small samples of
payments (about 800 per State on average). Special State staff operate the program;
Federal regional and national office staff provide quality assurance. BQC estimates
that the national weighted average overpayment rate during CY 1994 was 8.6 percent.

123
It was estimated to be 8.8 percent during CY 1993. The rate of measured
underpayments (which includes only payments that were too small, not erroneously
denied claims) has remained steady at about 0.9 percent of benefits paid.
The Performance Enhancement Committee proposed several changes to the
BQC program. The major ones are: substantially reduced sample sizes; greater
flexibility in how States may verify data on sampled cases; elimination of the
requirement that States publicly release findings each year; and (after pilot testing)
adding the measurement of the accuracy of decisions to deny claims.
TRADE ADJUSTMENT ASSISTANCE FOR WORKERS
Background
The Trade Adjustment Assistance Program, Chapter 2 of Title II of the Trade Act
of 1974 (P.L. 93-618) as amended, authorizes an array of reemployment services for
workers who lose their jobs, experience a reduction in the number of hours of work, or
receive reduced wages because of increased imports of articles which are like or
directly competitive with those produced by the workers’ firm.
Under the Act, workers whose job loss, or the threat of job loss, is the result of
import competition, may file a petition for Trade Adjustment Assistance (TAA) with the
Department of Labor. The Department then conducts an investigation to determine if
the worker separations from their firms are linked to import competition.
The requirements for certification of eligibility to apply for TAA are:
4 A significant number or proportion of workers of the firm were totally or partially

124
separated from their jobs, or threatened with job loss;
4 Sales or production (or both) at the workers’ firm decreased absolutely; and
4 Increases of imports of articles like or directly competitive with articles
produced by the workers’ firm have contributed importantly to worker separations
and to decreased company sales or production.
Workers certified by the Secretary of Labor as eligible to apply for TAA may
receive training in new occupational skills, a job search allowance when suitable
employment is not available in their normal commuting area, a relocation allowance if
they obtain permanent employment outside their commuting area, and weekly income
support, known as a trade readjustment allowance (TRA).
Workers from a wide variety of industries have been certified under the TAA
program. Since its inception in 1975, the seven industries with the largest
concentration of certified workers have been automotive equipment, apparel and other
finished products made from fabrics and similar materials, primary metal industries,
leather and leather products, electrical and electronic machinery equipment and
supplies, oil and gas production and services, and fabricated metal products.
Highlights of FY 1994 and 1995 Activities
In FY 1995, 1,499 worker petitions were filed with Department’s Office of Trade
Adjustment Assistance, and the Department certified 1,195 positions, covering
approximately 86,753 workers. During the year, 388 petitions were denied and 63
petitions were terminated. At the end of FY 1995, 148 petitions were being processed
by the Department.
125
In FY 1994, 1,629 petitions were filed, and the Department certified 925
petitions, covering about 72,530 workers. During the same year, 582 petitions were
denied and 28 were terminated. At the end of the year, 356 petitions were being
processed by the Department.
In each year (FY 1995 and 1994), $98.9 million in TAA funds were allocated to
States for training, job search, and relocation allowances, and for administering TAA
program services to certified workers. Table 12 shows TAA activity and services for
Fiscal Years 1990-1995.
In FY 1995, State agencies paid $142.9 million in TRA benefits to 24,058
certified workers, while in FY 1994, $120.1 million was paid to 30,846 certified workers.
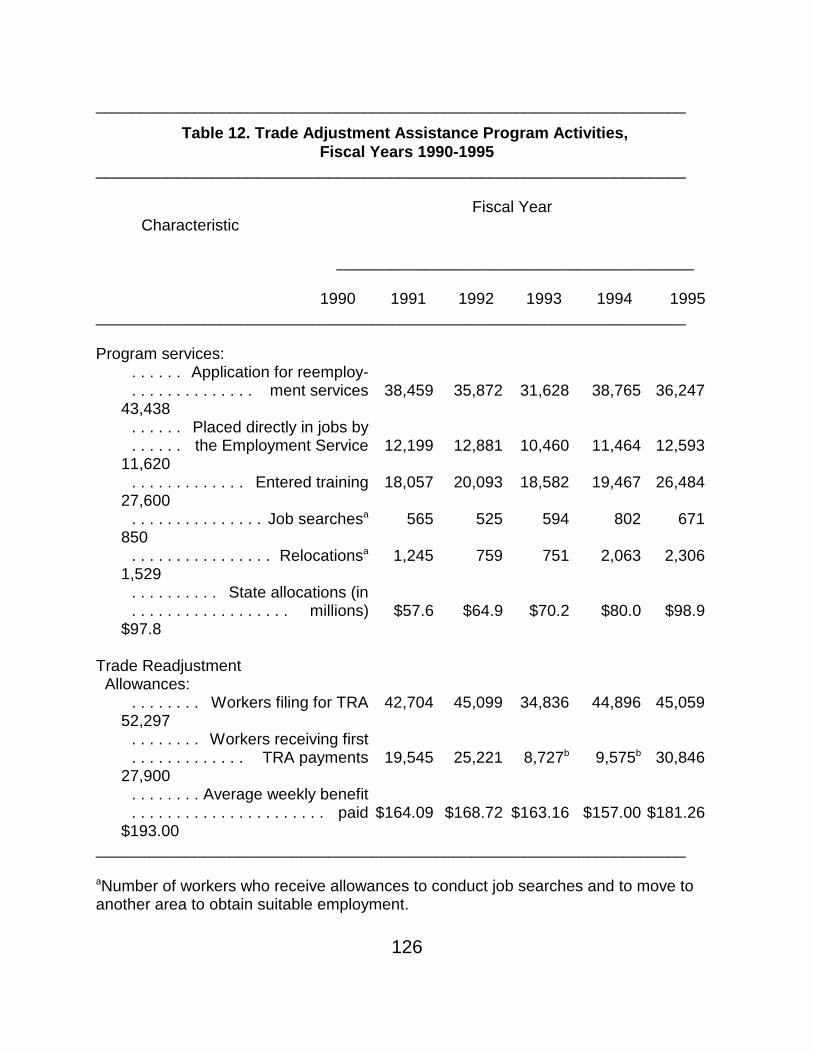
126
__________________________________________________________________
Table 12. Trade Adjustment Assistance Program Activities, Fiscal Years 1990-1995
__________________________________________________________________
Fiscal YearCharacteristic
________________________________________
1990 1991 1992 1993 1994 1995__________________________________________________________________
Program services:. . . . . . Application for reemploy-. . . . . . . . . . . . . . ment services 38,459 35,872 31,628 38,765 36,247
43,438. . . . . . Placed directly in jobs by. . . . . . the Employment Service 12,199 12,881 10,460 11,464 12,593
11,620. . . . . . . . . . . . . Entered training 18,057 20,093 18,582 19,467 26,484
27,600. . . . . . . . . . . . . . . Job searchesa 565 525 594 802 671
850. . . . . . . . . . . . . . . . Relocationsa 1,245 759 751 2,063 2,306
1,529. . . . . . . . . . State allocations (in. . . . . . . . . . . . . . . . . . millions) $57.6 $64.9 $70.2 $80.0 $98.9
$97.8
Trade Readjustment Allowances:
. . . . . . . . Workers filing for TRA 42,704 45,099 34,836 44,896 45,05952,297
. . . . . . . . Workers receiving first
. . . . . . . . . . . . . TRA payments 19,545 25,221 8,727b 9,575b 30,84627,900
. . . . . . . . Average weekly benefit
. . . . . . . . . . . . . . . . . . . . . . paid $164.09 $168.72 $163.16 $157.00 $181.26$193.00
__________________________________________________________________
aNumber of workers who receive allowances to conduct job searches and to move toanother area to obtain suitable employment.

127
bThis number is significantly lower than previous and subsequent years because inorder to be eligible for TRA, individuals must exhaust all other compensation. In FY1992-1993, a large number of individuals were eligible for Emergency UnemploymentCompensation which was available for 26 weeks.
Source: U.S. Department of Labor, Employment and Training Administration.__________________________________________________________________

74The Trade Act of 1974 was amended to incorporate the NAFTA-TAA programas Subchapter D of Chapter 2, Title II of the Trade Act.
128
NAFTA-TRANSITIONAL ADJUSTMENT ASSISTANCE
Background
In December 1993, Title V, Section 250 of the North American Free Trade
Agreement (NAFTA) Implementation Act, P.L. 103-182, created the NAFTA-
Transitional Adjustment Assistance program. The program became effective on
January 1, 1994.74
The NAFTA program provides reemployment services and assistance to workers
in companies affected by imports from Canada or Mexico, or by shifts in U.S.
production to those countries. It covers workers in firms directly affected by trade with
Canada and/or Mexico.
NAFTA-TAA combines the basic components of the EDWAA and the TAA
programs by providing affected workers with both rapid and early response to the threat
of unemployment and the opportunity to engage in long-term training while receiving
income support.
In order to be certified as eligible to apply for NAFTA-TAA services and benefits,
a significant number or proportion of workers of the affected firm must be totally or
partially separated from their jobs or threatened with job loss and either: (1) sales or
production (or both) at the workers’ firm decreased absolutely and (2) increases of
imports from Canada or Mexico of articles that are like or directly competitive with
articles produced by the workers’ firm have contributed importantly to worker

129
separations and to decreased company sales or production, or there has been a shift in
production by the workers’ firm or subdivision to Canada or Mexico of articles that are
like or directly competitive with articles produced by the firm.
Chart 4 shows the steps involved in the NAFTA-TAA certification process. The
certification process involves a partnership between the Department and the Governors
of the States where the workers’ firms are located. Petitions for NAFTA assistance are
filed with the State agency designated by the Governor to investigate NAFTA cases.
The State agency collects data and issues preliminary findings regarding the meeting of
eligibility criteria within 10 days of the receipt of the petition. Once the State agency
makes an affirmative preliminary finding, the Governor ensures that EDWAA rapid
response services are provided to the eligible workers. Services provided include skills
assessment as well as financial and personal counseling to help with job transition.
Within 30 days of receiving the State’s preliminary finding, the Secretary of
Labor issues a final determination of workers’ eligibility to apply for NAFTA-TAA.
Workers who are certified by the Secretary as eligible to apply for the NAFTA program
are entitled to employment services such as:
4 Career counseling;
4 Job placement and support services;
4 Training for employment in another job or career;
4 Income support for up to 52 weeks after exhausting unemployment
compensation when the worker is enrolled in training;
4 A job search allowance; and
4 A relocation allowance if the worker obtains permanent employment outside
his/her commuting area.
While benefits under the NAFTA program closely parallel those provided under
the TAA program, NAFTA requires that claimants must be enrolled in training to qualify
for income support; waivers of the training requirement are not allowed for NAFTA

130
participants.
Highlights of FY 1994 and 1995 Activities
From January 1, 1994 (the program’s implementation date) through December
31, 1994 (CY 1994), NAFTA petitions were received for workers in 321 firms located in
41 States. During this time, final determinations were issued on 297 petitions, of which,
153 were certified. About 21,139 workers were eligible to apply for NAFTA-TAA
program benefits as a result of the certifications.
From January 1 through December 31, 1995 (CY 1995), 425 NAFTA petitions
were received for workers located in 43 States. During the year, final determinations
were issued on 386 petitions, of which, 220 were certified. Approximately 31,993
workers were certified eligible to apply for NAFTA-TAA program benefits.
The largest concentration of NAFTA-TAA certified workers was engaged in
employment related to the production of goods in the following industries: apparel;
electronics (except computer); industrial machinery and computer equipment;
agricultural production; medical and optical goods; lumber and wood products; paper
and allied products; chemicals and allied products; and rubber and plastic products.
NAFTA-TAA program funds totaling $8.5 million in FY 1994 and $21.4 million in
FY 1995 were allocated to States for training, job search, and relocation allowances,
and for administering the NAFTA-TAA program services to certified workers. Table 13
provides data on NAFTA-TAA program activities and services for CY 1994 and 1995.
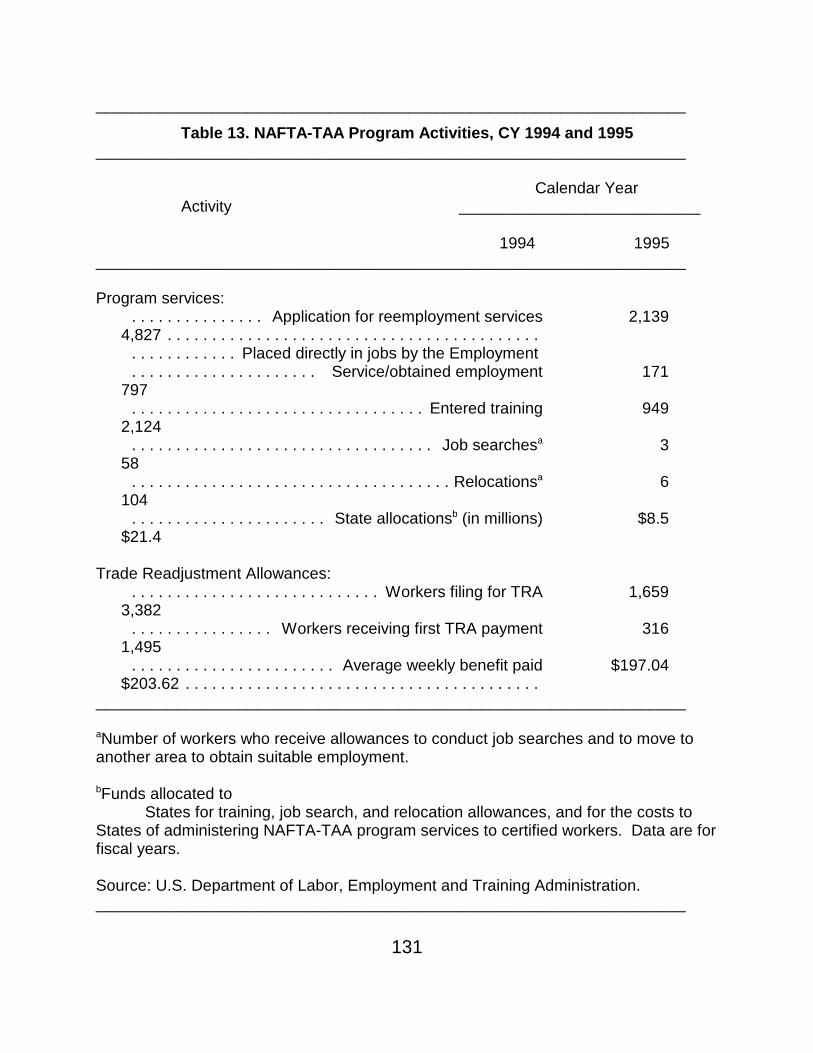
131
__________________________________________________________________
Table 13. NAFTA-TAA Program Activities, CY 1994 and 1995__________________________________________________________________
Calendar YearActivity ___________________________
1994 1995__________________________________________________________________
Program services:. . . . . . . . . . . . . . . Application for reemployment services 2,139
4,827 . . . . . . . . . . . . . . . . . . . . . . . . . . . . . . . . . . . . . . . . . .. . . . . . . . . . . . Placed directly in jobs by the Employment . . . . . . . . . . . . . . . . . . . . . Service/obtained employment 171
797. . . . . . . . . . . . . . . . . . . . . . . . . . . . . . . . . Entered training 949
2,124. . . . . . . . . . . . . . . . . . . . . . . . . . . . . . . . . . Job searchesa 3
58. . . . . . . . . . . . . . . . . . . . . . . . . . . . . . . . . . . . Relocationsa 6
104. . . . . . . . . . . . . . . . . . . . . . State allocationsb (in millions) $8.5
$21.4
Trade Readjustment Allowances:. . . . . . . . . . . . . . . . . . . . . . . . . . . . Workers filing for TRA 1,659
3,382. . . . . . . . . . . . . . . . Workers receiving first TRA payment 316
1,495. . . . . . . . . . . . . . . . . . . . . . . Average weekly benefit paid $197.04
$203.62 . . . . . . . . . . . . . . . . . . . . . . . . . . . . . . . . . . . . . . . .__________________________________________________________________
aNumber of workers who receive allowances to conduct job searches and to move toanother area to obtain suitable employment.
bFunds allocated to States for training, job search, and relocation allowances, and for the costs to
States of administering NAFTA-TAA program services to certified workers. Data are forfiscal years.
Source: U.S. Department of Labor, Employment and Training Administration.__________________________________________________________________

132

75The human resources assessment tool uses a combination of employee andmanager interviews and written surveys to investigate a firm’s human resourcespractices and determine opportunities for improvement. The assessment instrument isgenerally administered to companies by field agents of regional manufacturingextension centers. This nationwide network of Centers is funded through theDepartment of Commerce’s National Institute of Standards and Technology. TheCenters improve the competitiveness of small and mid-sized companies by providingtechnology deployment assistance.
133
INCUMBENT WORKER TRAINING
Highlights of PY 1993 and 1994 Activities
Throughout the Report period, the Department supported a number of activities
that provided training and skills upgrading for currently employed workers.
In PY 1993 and 1994, the Departments of Labor and Commerce entered into
interagency agreements to fund a number of special incumbent worker initiatives. One
such initiative involved supporting the development of a human resources assessment
tool.75
The assessment tool will enhance the capability of the Department of
Commerce’s National Institute of Standards and Technology’s (NIST) Manufacturing
Extension Centers to assess the workforce skills development needs of small and mid-
sized companies and their technology development needs.
Also, during the Report period, five supplier-manufacturer networks which link
large manufacturing companies with their mutual suppliers received funding to identify
common requirements for supplier firms’ modernization and workforce development.
The large firms help the small and mid-sized supplier companies obtain technologies

76The Department’s Employment and Training Administration created theTraining Technology Resource Center (TTRC) to function as an electronic informationsystem to collect and disseminate information relating to workforce development. TheTTRC offers information about America’s labor market information system, emergingtraining and learning technologies, innovative workplace practices, JTPA, occupationalskill standards, One-Stop Career Center Systems, and school-to-work transitioninitiatives. The system is accessible through modem and the Internet.
134
and employee training resources to modernize and improve workers’ skills.
The Department also supported efforts of the NIST Manufacturing Extension
Centers to build their capacity to provide workforce development services to companies
through partnership arrangements with educational and community-based
organizations. The workforce development services include training for employees in
small companies in such areas as team-building, quality improvement techniques,
leadership, and basic skills training.
In addition to these initiatives, the Department established new partnerships and
conducted several pilot and demonstration projects throughout PY 1993 and 1994. It
continued to fund the American Association of Community Colleges to conduct a small
business assistance training institute to share information on exemplary training
programs for incumbent workers. The project was expanded to include a network of
community college liaisons to help identify training needs of incumbent, dislocated, and
entry-level workers in each State and to share resources among community colleges.
In addition, a workforce development database was established that includes
information on the reemployment and training program capacities of community
colleges throughout the country. The database will focus on customized courses
developed for workers in small and mid-sized firms and courses and services for
special client populations, such as participants in JTPA or Job Opportunities and Basic
Skills (JOBS) programs. The database is housed in the Department’s Training
Technology Resource Center.76

135
The Department also established the National Workforce Assistance
Collaborative (NWAC) which is a partnership of the National Alliance of Business, the
Council of Adult and Experiential Learning, the Institute for the Study of Adult Literacy
at Pennsylvania State University, the Maryland Center for Quality and Productivity, and
the National Labor-Management Association. It is designed to improve worker skills
and the performance of companies by working with networks of business service
providers (e.g., community colleges, literacy assistance providers, and technology
assistance providers) to create and disseminate workforce development tools and
information.
The NWAC provides resources in the areas of employee training, workplace
literacy, work restructuring, and labor-management relations. These resources are
available from the National Alliance of Business, or through two electronic networks.
The NWAC also sponsors an electronic forum for discussing workforce development
issues and information (such as instructional materials, research and applications, and
evaluation methods).
During the Report period, the Department funded two pilot workforce
development projects with groups of small and mid-sized companies. One project was
conducted in partnership with the Massachusetts Bay State Skills Corporation. It was
designed to develop advanced skills training for workers in small machine shops in the
Western Massachusetts Chapter of the National Tooling and Machining Association.
Another project provided funding to five networks of small and mid-sized
companies, or “learning consortia.” These consortia identified training needs that
company members had in common and enabled the companies to cost-effectively
access training resources or share company-developed resources.

77The labor surplus areas program is authorized by P.L. 99-272, P.L. 96-302, andP.L. 95-89.
136
LABOR SURPLUS AREAS PROGRAM
Background
Since the early 1950s, the Department has supported efforts to direct
Government procurement funds into areas with the greatest economic need by
designating jurisdictions that experience an unemployment rate 20 percent or more
above the national average as “labor surplus areas.”77 Employers located in these
areas receive preference when they bid on Federal procurement contracts.
The Department issues a list of labor surplus areas annually and adds
jurisdictions to the list throughout the year under an “exceptional circumstances”
provision. This permits the addition of areas which did not meet the high
unemployment criterion for the initial list, but subsequently experienced major
disruptions in their local economies due to natural disasters, plant closings, major
layoffs, or contract cancellations.
Highlights of FY 1994 and 1995 Activities
The labor surplus areas in FY 1995 included jurisdictions that had a qualifying
unemployment rate of 8.6 percent or higher during the period January 1992 through
December 1993, while those in FY 1994 had a qualifying unemployment rate of 8.5

78The 10 areas added during the year were: Poughkeepsie City, Balance ofDutchess County, Ulster County, Wappinger Town, New York; Berkeley Township,Irvington Town, Orange City, Pemberton Township, New Jersey; Philadelphia,Pennsylvania; and Hardeman, Tennessee.
137
percent or higher during the period January 1991 through December 1992.
In FY 1995, 1,342 areas were initially designated and no areas were later added
under the exceptional circumstances provision during the year.
In FY 1994, 1,521 areas were initially designated and 10 more were added
during the year.78
The labor surplus areas and a complete description of their classification criteria,
as well as updates, are published in Area Trends in Employment and Unemployment, a
monthly publication prepared by the Department.

138
NATIONAL COMMISSION FOR EMPLOYMENT POLICY
The National Commission for Employment Policy (NCEP) was first authorized bythe Comprehensive Employment and Training Act of 1973 and reauthorized in 1982under JTPA. The Commission sponsored research on economic, workforce, training,and employment issues; responded to Congressional requests for information; heldhearings and symposiums; developed policy recommendations, and advised thePresident and the Congress on a wide variety of training and employment concerns.NCEP funding for Program Year 1995 (July 1, 1995 - June 30, 1996) was withdrawnas part of the 1995 Rescissions Bill signed by the President on July 27, 1995.Commission activities ceased on September 30, 1995.
Background
The National Commission for Employment policy examined broad questions of
development, coordination, and administration of training and employment programs,
and advised the President and the Congress on a variety of national training and
employment issues.
The Commission’s members were appointed by the President and were broadly
representative of agriculture, business, labor, commerce, education, veterans’ groups,
State and local elected officials, community-based organizations, public assistance
programs, and the public at large. Commissioners were uncompensated and served
three-year, staggered terms. The President appointed one of the members as Chair.
To assist the Commissioners in their work, the Commission had a permanent
staff of economists, program experts, and support personnel, whose expertise was
supplemented as needed through personnel loan arrangements with universities, and
Federal, State, and local government agencies.
Highlights of PY 1993

79Michael J. Landini, Understanding Federal Training and Employment Programs(Washington, D.C., National Commission for Employment Policy, 1995).
139
and 1994 Activities
During the Report period, the Commission responded to concerns in the
Congress about the duplication of services and varied administrative structures of many
of the Nation’s federally funded training and employment programs. In response to this
concern, the Commission published Understanding Federal Training and Employment
Programs to enlighten the debate79. The publication contains descriptions of 55
federally funded programs administered by seven Federal agencies (the Departments
of Labor, Education, Veterans Affairs, Housing and Urban Development, Health and
Human Services, Agriculture, and Commerce) as well as information about their funding
levels, participation rates, and administrative structures. It was widely distributed in
early 1995 to legislators, policymakers, and program administrators at the Federal,
State, and local levels.
The Commission also focused on broad economic concerns during Program
Years 1993 and 1994 by publishing several studies comparing income changes over
time. Two studies by the Commission’s chief economist looked at income changes
over two decades–the 1970s and 1980s–in order to help explain some of the “anger”
emanating from workers who see their standards of living declining, while in many
cases, working longer hours and being more productive. Using longitudinal data from
the Michigan Panel Survey of Income Dynamics (PSID), NCEP found that–contrary to
the views of many economists who use “snapshot” data from the Current Population
Survey–job tenure is, in fact, declining. Moreover, changing employers, occupations,
and/or industry, all have the effect of reducing earnings over time. Not surprisingly,
those who have fared best and will continue to do well are managers or professionals
with college degrees who have remained in a single occupation. Those who are falling
behind in terms of earnings are individuals without college training and with few
technical skills, who frequently change employers, occupations, and even industries

140
during the course of their working lives. (See On Shaky Ground: Rising Fears About
Incomes and Earnings and Declining Job Security and the Professionalization of
Opportunity.)
Looking beyond these broad findings, the Commission sponsored a number of
other studies that looked more closely at wage inequality for African-Americans and
other minorities; discussed how office automation and technology in general are
affecting the number and kinds of jobs; reviewed Bureau of Labor Statistics data to
determine where new jobs are emerging; reviewed local job creation strategies and
Federal extension efforts to promote regional development; investigated how the
unemployment insurance system serves part-time workers, especially women; looked
into the relationship between employment and wages and macroeconomic policy tools;
and evaluated the EDWAA-JTPA Title III dislocated workers’ training program using the
Commission’s UI wage database.
The UI wage database, housed at Northern Illinois University, continued to be
supported by the Commission during the Report period. Linking UI wage records and
JTPA program files in a number of participating States, the database enabled the
Commission and university scholars to examine how JTPA participants (especially
young men and women, ex-offenders, AFDC recipients, Hispanics, and other specific
groups) fared in terms of employment and earnings following training. Several studies
using these data, including one on ex-offenders and another on young, female AFDC
recipients who participated in JTPA programs, were completed during PY 1994.
Several education-related issues were explored through Commission-sponsored
research. These included creative strategies for preventing school dropouts, the status
of tutoring programs for at-risk students, and effective school-to-work transition
activities.
Finally, in addition to research sponsored by NCEP alone, two other studies were
published with the Department of Energy that focused on jobs created through
environmental policies (Environment and Jobs: The Employment Impact of Federal
Environmental Investments and Promoting Growth and Job Creation Through Emerging
Environmental Technologies).

141
NATIONAL OCCUPATIONAL INFORMATION COORDINATING COMMITTEE
Background
The National Occupational Information Coordinating Committee (NOICC) is an
independent Federal interagency committee authorized by JTPA and the Perkins
Vocational and Applied Technology Education Act. For 19 years, NOICC and its
network of State Occupational Information Coordinating Committees (SOICCs) have
developed methods to coordinate, integrate, and deliver occupational, educational, and
labor market information that is collected by Federal and State agencies.
NOICC/SOICC activities are based on three integrated themes: (1) developing,
delivering, and using occupational, labor market, and career information; (2) linking
education and work through career development; and (3) providing training in
developing, delivering, and using data for planning, guidance, and career development
programs. The NOICC/SOICC network supports employment, training, and vocational
and technical program planning at the State and local levels and career development
and exploration by youth and adults. NOICC and SOICC initiatives support school-to-
work transition teams and workforce investment strategies, such as One-Stop Career
Centers, that help prepare the Nation’s workers to meet the needs of employers both
now and in the future.
NOICC members represent 10 Federal agencies and include officials of the
Departments of Labor, Education, Commerce, Defense, and Agriculture. SOICC
members represent vocational rehabilitation, employment security, job training,
economic development, higher education, vocational and technical education, and
other organizations involved in preparing workers to enter and succeed in the labor
market.

80Includes Department of Education funds.
81One-Stop Career Centers consolidate the delivery of a variety of training andemployment services regardless of their funding sources and the individual
142
Highlights of PY 1993 and 1994 Activities
The NOICC/SOICC network is a customer-driven program that focuses on State
and local information needs. Major initiatives for PY 1993 and 1994 are summarized
below.
Support for State OccupationalInformation Coordinating Committees
In both Program Years 1993 and 1994, NOICC allocated approximately $6.9
million to State Occupational Information Coordinating Committees for basic State
operations.80 These funds (an average of $123,000 per State) supported SOICC staff,
State and local occupational information systems, and career information delivery.
NOICC also allocated $10,000 in PY 1993 and $14,000 in PY 1994 in supplemental
funds to each SOICC to support career development training of counselors, educators,
and others to enable them to better support career planning and counseling needs of
youth and adults.
Occupational InformationSupport System
NOICC completed work on a new microcomputer occupational information
system (Micro-OIS) and occupational labor market information database (OLMID) and
released these systems in PY 1994. OLMID is serving as the key database to organize
labor market information in all nine of the States that received funding to implement
One-Stop Career Centers.81 The Micro-OIS will be used in at least eight of these

agencies/programs traditionally involved in service delivery. They generally provide asingle point of access to all services and clients can access services regardless of theirreason for seeking the services.
Under Job Training 2000, the Department awarded grants of $50,000 to eachState in 1992 to plan services integration and One-Stop Career Center Systems. Thefollowing year, grants of approximately $200,000 each were awarded to 10 PrivateIndustry Councils (PICs) in nine States to plan and implement Job Training 2000demonstration projects.
For more information about one-stop career centers, see Dale W. Berry andMona A. Feldman, Evaluation of One-Stop Career Center Demonstration Projects(Arlington, Va.: TvT Associates, 1995) and Dale W. Berry and Mona A. Feldman, AGuide for Planning and Operating One-Stop Career Centers (Arlington, Va.: TvTAssociates, 1995). These two studies are summarized in Chapter 2 of this publication.
143
States. It is designed to provide information to support program planning by JTPA,
vocational-technical education, and other employment-related training programs, and to
help meet many of the occupational needs of employers.
Because occupational projections are one of the most fundamental types of
information needed to support workforce preparation efforts, during the Report period,
NOICC sponsored a fourth round of training in the development of occupational and
industry projections. Attended by staff from nearly every State, the training focused on
keeping staff up to date in the latest projection techniques.
Also during the period, the NOICC-sponsored State Training Inventory (STI)
database grew to include over 17,000 schools offering more than 215,000 education
and training programs. STI provides State and multistate regional information on
school offerings to support human resource and workforce development programs,
including JTPA, school-to-work, and one-stop career centers.
Career Information Delivery
During the period, automated statewide career information delivery systems
(CIDS) were operating in nearly 19,000 sites in 47 States. The systems served over
eight million customers. In recent years, greater emphasis has been placed in

144
expanding CIDS access to adults. NOICC supported a study and released a report on
The Use of Career Information Systems in State Employment Security Agencies to
encourage such expansion. Eight of the nine States that received One-Stop Career
Center funds have used their statewide CIDS to provide career information to their
customers. In addition, 48 States published career information in a tabloid newspaper
format during the Report period. In PY 1994, over five million copies were published
and distributed to schools and colleges; the Job Service; welfare, and vocational
rehabilitation offices; JTPA service delivery sites; and libraries. In several States,
career information tabloids were directly linked to classroom curricula and video
presentations.
Career Development Activities
Over 100,000 copies of the Get a Life Career Development Portfolio, designed
for use at the elementary, mid- and high school levels, were distributed during PY 1993.
In PY 1994, NOICC supplemented the publication with a personal career guide entitled
School-To-Work Transition Planner, designed for use by students in the last two years
of high school and/or the first two years of postsecondary education. It is especially
useful for students in Tech Prep programs. NOICC also began testing a pilot version of
an adult career planner called Work Life in PY 1994. The planner was tested with
dislocated workers, veterans in employment transition, welfare recipients, and
community college and university students.
The Career Development Training Institute (CDTI), established by NOICC
through a special appropriation from the Congress, completed in PY 1994 the third and
last year of its first grant. During PY 1993 and 1994, the CDTI completed its
documentation of career development training activities, conducted two national
teleconferences (one of which had more than 10,000 participants), developed a number
of training programs related to school-to-work transition, and conducted “Improved
Career Decision Making” and “Employee Career Development” train-the-trainer
sessions for thousands of career development facilitators in schools, the Job Service,

82Additional information about these activities can be obtained from the NOICCStatus Report, June 30, 1994.
145
JTPA, and vocational rehabilitation agencies. It also initiated a new training program
called “Workforce in Transition,” and published a number of studies and training
materials. During the Report period, an estimated 40,000 individuals benefitted from
career development capacity building activities provided through the CDTI and
SOICCs.82

1
CHAPTER 2
RESEARCH ANDEVALUATIONFINDINGS

2
RESEARCH ANDEVALUATIONFINDINGSINTRODUCTION
This chapter summarizes the findings of major research and evaluation projects
completed in Program Years 1993 and 1994, which cover the period July 1993 through
June 1995. The Employment and Training Administration provided full or partial
funding for these projects.
The reports are grouped into five categories. The first category, Labor Market
Studies of Specific Groups, presents summaries of seven studies that focus on specific
population groups that need varying degrees of assistance in order to enter and
succeed in the labor market. It also includes a summary of a national journal,
sponsored by the Department, that discusses poverty and joblessness in the United
States.
The second category, Meeting the Needs of Dislocated Workers, includes five
summaries of programs that help workers who lose their jobs through mass layoffs or
plant shutdowns.
The third category, Building Tomorrow’s Workforce, provides an overview of
three studies of programs that better prepare students to make the transition from
school to work.
Summaries of three studies that investigated creative ways of speeding
unemployment insurance recipients’ return to work are presented under the fourth
category, Helping the Nation’s Unemployed.

3
The final category, Program Development and Improvement, includes three
studies that focus on improving the nation’s unemployment insurance system.
The projects discussed in this chapter were designed to look at specific aspects
of a variety of issues of interest to the Department. Because many of these issues are
complex, readers are cautioned that no single study can provide a complete picture of
any particular subject area. Furthermore, the context in which a study is conducted
often has an impact on the applicability of its findings.
Furthermore, the summaries are not intended to represent all of the information
provided in the full study reports. More information can be found in the reports
referenced in the footnotes. Because organizations undertaking research projects
sponsored by the Department are encouraged to state their findings and express their
judgments freely, all conclusions described in this section are those of the researchers
and do not necessarily represent the views of the Department of Labor.
The annotated bibliography at the end of this chapter lists all reports covered in
this and previous editions (dating to PY 1985) of the Training and Employment Report
of the Secretary of Labor. Information about how to obtain copies of the publications is
provided in the bibliography’s introduction.
I. LABOR MARKET STUDIES OF SPECIFIC GROUPS
The studies summarized in this section of the Report focus on a number of
special worker groups that are of concern to the Department. These groups include
farmers and ranchers who have been forced to leave their farms, migrant and seasonal
farmworkers, the homeless, people with disabilities, immigrants, and the nation’s poor.
The first study report summarized in this section provides information about the
Farmers and Ranchers Demonstration Project which was funded by the Department in
July 1990 and implemented in Iowa, Minnesota, North Dakota, and South Dakota. The
projects operated for three and a half years and enrolled 1,550 participants. The
project’s two goals were to help financially stressed farmers keep their farms and to

4
help those who were forced to leave farming find alternative employment. The
researchers concluded that the programs achieved a modest degree of success in
finding off-farm employment for their participants.
As part of the demonstration effort, the Department supported the publication of
a guidebook to help practitioners provide more effective services to dislocated farmers
and ranchers. The guidebook discusses the unique situation faced by many farmers
and provides information about ways to design training and employment services that
can best help this special population group. It is the second report summarized in this
section.
In addition to the problems faced by farmers and ranchers, the Department has
long recognized that migrant and seasonal farmworkers face major challenges as they
attempt to improve their long-term economic situation. Many of these individuals have
few opportunities to move from seasonal farmwork into year-round jobs. They often live
in inadequate housing, experience health problems, and experience a high incidence of
injury. The third study report summarized in this section looks at the programs
operated under Title IV, Section 402 of the Job Training Partnership Act that are
designed to help this population group. These programs, administered directly by the
Department, operate in 47 States and Puerto Rico. The investigation of Section 402
programs revealed that many were effectively serving the target population.
Because up to one million individuals may be homeless in the United States,
Congress enacted the McKinney Homeless Assistance Act in 1987. Section 731 of the
Act authorized the Job Training for the Homeless Demonstration Program, which was
designed to help practitioners and policymakers learn more about ways to help
homeless people enter and succeed in the labor market. The fourth study report
summarized in this section presents findings from a study of the demonstration. The
researchers found that it is feasible to establish job training and employment programs
to serve homeless people, although they must offer a wide array of services and form
linkages with other service providers.
The fifth summary describes the findings of a study of a five-year demonstration
that relies on supervisors, coworkers, family members, friends, and others to provide

5
the training and supervision needed to help people with disabilities obtain jobs and
perform satisfactorily in those jobs. In 1992, the Departments of Labor and Health and
Human Services began supporting the demonstration to develop model school-to-work
programs that use this “natural supports” approach. Projects are operating in six States
with a total funding of $1.5 million per year. A study of the early years of the
demonstration revealed that almost all individuals with severe mental retardation or
other developmental disabilities were capable of working in an employment setting with
natural supports.
The sixth and seventh studies included in this section focus on demonstration
programs that provided immigrants with training and other support necessary to speed
their entry into the labor market. One of the studies focused on a 15-month project in
the San Diego area that integrated education, training, employment, and social services
in an effort to address the multiple barriers to economic integration which confront many
legal immigrants. The project began in the summer of 1992 and enrolled 156 clients.
Of these, 117 were placed in full-time employment.
The other immigration-related demonstration studied was conducted in the
Seattle area and offered training in specific occupational areas to 54 participants. The
researchers concluded that the project, which operated from September 1992 through
November 1994, identified several strategies that can help limited English-speaking
refugees and immigrants receive training and other assistance.
Finally, a national journal, sponsored by the Department, is summarized at the
end of this section. The 10th edition of Evaluation Forum focuses on a number of
issues that should be considered in crafting future anti-poverty policies.
HELP FOR FARMERS AND RANCHERS
Overview
Throughout its history, the Department of Labor has been concerned about

1The crisis was the result of a significant increase in farm debt which peaked atthe beginning of the 1980s, combined with the weakening of export markets, thedecline in commodity prices, and a corresponding decline in net farm income and landvalues. As a consequence, many farmers experienced high levels of debt anddiminished earning opportunities. Many farmers were forced to give up their farms.
2The Farmers and Ranchers Demonstration was authorized by Congress underSection 324 of EDWAA in 1988.
6
worker dislocation (workers who lose their jobs permanently because of plant closures,
mass layoffs, increased foreign imports, economic shifts, etc.). Job loss due to
economic conditions has been a chronic feature of American agriculture.
Although urbanization and agricultural consolidation resulted in the loss of over
four million American farms over the past 60 years, until the 1980s much of the decline
in farm employment had been voluntary—as operators of smaller and less efficient
farms left to pursue more attractive nonfarm jobs.
During the 1980s, however, a significant number of individuals involved in
farming lost their jobs involuntarily as farm operators, who borrowed heavily during the
1970s to expand their operations, found themselves financially overextended during the
farm credit crisis of the 1980s.1 Because many farm owners were forced to leave
farming with enormous debts, the impact of this dislocation on these individuals, their
workers, and their communities may have been more severe than in previous decades.
In response to this situation, the Department of Labor developed the Farmers
and Ranchers Demonstration Project under the Economic Dislocation and Worker
Adjustment Assistance (EDWAA) Act.2 Funds were made available to four States to
develop innovative strategies to provide training and employment services for
dislocated and at-risk farmers and ranchers, their spouses and dependents, and
farmhands. The demonstration projects were: Farm/Works in Iowa, the Farm Project in
Minnesota, the Farmer/Rancher Demonstration Project in North Dakota, and the
Agricultural Community in Transition program in South Dakota. The projects operated
from July 1, 1990 through September 30, 1993. Chart 5 shows the location of these
3Mary G. Visher, Stephen Walsh, and Ronald D’Amico, Serving DislocatedFarmers: An Evaluation of the EDWAA Farmers and Ranchers Demonstration (Oaklandand Menlo Park, Calif.: Berkeley Planning Associates and Social Policy ResearchAssociates, 1994).
4According to the Bureau of the Census, the combined value of farm operators’real estate and non-real estate debt rose fourfold, from $53 billion in 1970 to $195billion by 1981.
7
projects.
An evaluation of the demonstration3 revealed that the projects met recruitment
goals, outreach efforts were important in enrolling participants, participants commonly
reported severe financial distress, and two-thirds of the participants were engaged in
off-farm employment after program termination.
The report outlines trends in farm dislocation (focusing on States with programs
included in the demonstration), provides estimates of current and future numbers of
farmers at risk of dislocation, discusses the history of training and employment
programs for farmers over the past several decades, describes the demonstration
projects, presents the results of an analysis of quantitative data produced for the study,
provides an assessment of the effectiveness of the various training and employment
strategies used in the demonstration, and offers conclusions and recommendations for
the Department of Labor.
Background: The Farm Crisis
The evaluation report notes that the 1970s had been characterized by a dramatic
expansion of agricultural exports (brought about by worldwide food shortages and the
declining value of the dollar). Prices for farm commodities rose appreciably and land
values increased. Based on these developments, many farmers took advantage of low
interest rates to expand production by investing in new machinery and expanding their
land holdings.4
8
However, during the first half of the 1980s, expanded overseas production and
U.S. economic policies that resulted in an increase in the value of the dollar compared
to trading partners’ currencies made U.S. agricultural products less attractive
overseas—resulting in a decline in agricultural exports from 1981 to 1985. As the index
of prices received declined while the index of prices paid climbed upward, Federal
macroeconomic policies caused real interest rates to rise to unprecedented levels.
These factors, combined with a sharp decrease in real estate values, made it difficult
for farmers to meet their debt obligations and cash expenses of their farm operations.
A number of farmers attempted to improve their financial position by reducing costs,
increasing the value of sales by improving farm management to increase yields,
restructuring liabilities, or liquidating some assets. In cases where these efforts were
not successful, many farmers were forced to cease farming.
The report points out that although complete data on farm exits was not
available, an analyses conducted by the U.S. Department of Agriculture suggested that
between 200,000 and 300,000 individuals left farming over the period 1980-88.
The report also puts this situation in perspective by providing historical
information about previous declines in the number of farms and individuals involved in
farming. The researchers point out that although the number of farms in the United
States had been declining since the 1930s, a significant portion of this decline was the
result of a reallocation of labor out of farming and into sectors where financial returns
were higher. For the most part, farmers of smaller and less efficient farms exited
agriculture in favor of more attractive nonfarm employment. During the farm financial
crisis of the 1980s, however, many farmers were squeezed out of the industry, rather
than leaving voluntarily for better opportunities.
As these individuals left farming during the first half of the 1980s, many
experienced few alternative employment opportunities, particularly in nonmetropolitan
areas. Furthermore, occupations with the greatest growth in the 1980s required fairly
well-developed technical skills, making the transition from a farm to an off-farm career
more difficult. Given this trend, a large number of displaced and at-risk farmers were in
need of readjustment and retraining services.
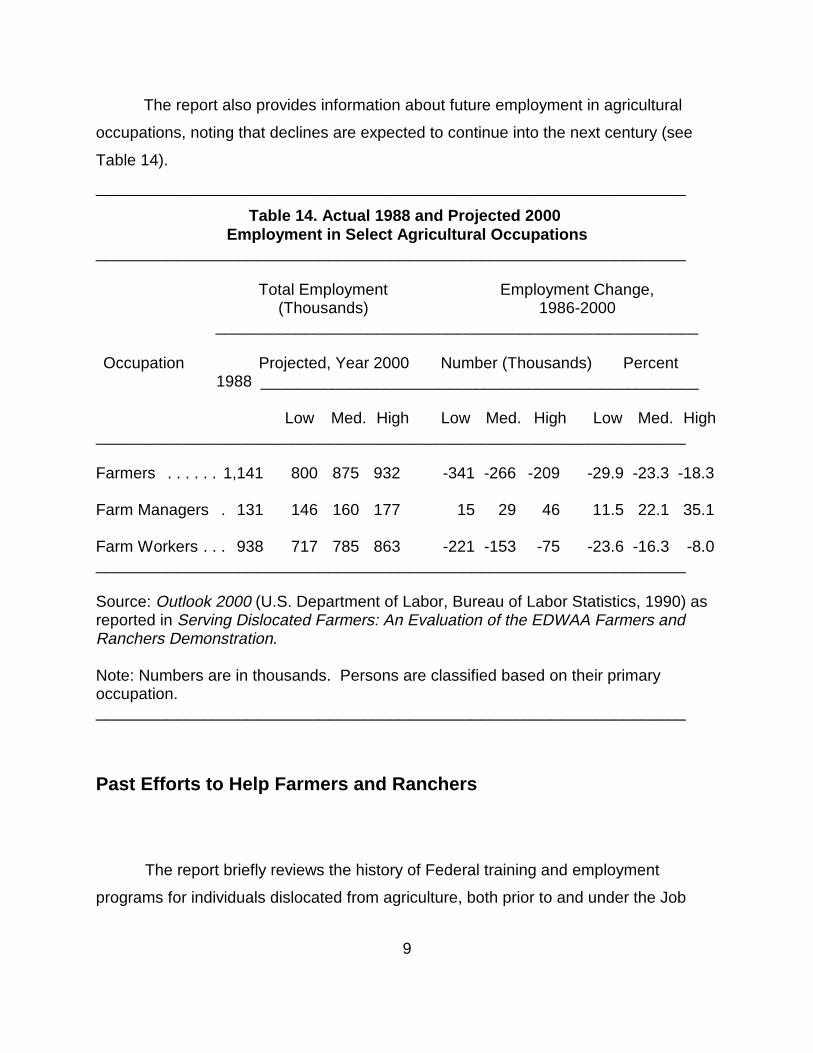
9
The report also provides information about future employment in agricultural
occupations, noting that declines are expected to continue into the next century (see
Table 14).
__________________________________________________________________
Table 14. Actual 1988 and Projected 2000 Employment in Select Agricultural Occupations
__________________________________________________________________
Total Employment Employment Change,(Thousands) 1986-2000
______________________________________________________
Occupation Projected, Year 2000 Number (Thousands) Percent1988 _________________________________________________
Low Med. High Low Med. High Low Med. High__________________________________________________________________
Farmers . . . . . . 1,141 800 875 932 -341 -266 -209 -29.9 -23.3 -18.3
Farm Managers . 131 146 160 177 15 29 46 11.5 22.1 35.1
Farm Workers . . . 938 717 785 863 -221 -153 -75 -23.6 -16.3 -8.0__________________________________________________________________
Source: Outlook 2000 (U.S. Department of Labor, Bureau of Labor Statistics, 1990) asreported in Serving Dislocated Farmers: An Evaluation of the EDWAA Farmers andRanchers Demonstration.
Note: Numbers are in thousands. Persons are classified based on their primaryoccupation.__________________________________________________________________
Past Efforts to Help Farmers and Ranchers
The report briefly reviews the history of Federal training and employment
programs for individuals dislocated from agriculture, both prior to and under the Job
10
Training Partnership Act (JTPA). The researchers note that although agencies like the
Farm Labor Service and its successor, the Rural Manpower Service, provided some
services to rural areas as far back as the Great Depression, the programs were small
and quite different from subsequent programs.
During the 1960s, the Manpower Development and Training Act and the
Economic Opportunity Act provided training and employment services on a national
scale. Although these programs focused primarily on urban areas, some services to
rural residents were pioneered. The authors point out that the enactment of the
Comprehensive Employment and Training Act of 1973 did little to change the training
and employment situation for farmers.
Throughout the 1980s, the Department of Labor provided some national
discretionary funding to a variety of State and local programs for thousands of farmers
and ranchers through discretionary JTPA Title III funding. For almost 10 years, these
programs represented the Department’s primary mechanism for addressing farm
dislocation.
In addition to allowing the use of discretionary funds for farmers and ranchers,
JTPA changed the way that previous training and employment programs operated by
giving Governors considerable authority in interpreting the program’s regulations. By
1986, 21 States had modified JTPA eligibility rules to better serve dislocated farmers
and farmworkers. Amendments to the legislation in 1986 and subsequent regulations
further expanded eligibility for JTPA Title III services to include self-employed persons
who were in the process of going out of business. This definition further aided in
providing assistance to farmers. The regulations also expanded eligibility to include
family members working on farms.
In 1988, EDWAA changed the way States distributed funds to substate areas
under JTPA Title III, adding farmer-rancher economic hardship criteria to States’

11
allocation formulas. Subsequent regulations further expanded eligibility to include
workers on farms that were failing.
The EDWAA legislation also made possible the Farmers and Ranchers
Demonstration—the first legislatively mandated employment and training program for
persons leaving agriculture. The Department awarded initial grants to four States in
July 1990 for this initiative.
Farmers and RanchersDemonstration Projects
The report provides profiles of the various demonstration sites in Iowa,
Minnesota, North Dakota, and South Dakota. These four demonstration projects
operated for three and a half years and enrolled a total of 1,550 participants.
For each demonstration, the researchers describe the economic context in which
the programs operated; provide an overview of the history, administration, goals,
service delivery structure, and innovations of each program; discuss the integration and
coordination of the demonstration projects with other programs; provide information
about the target population and eligibility criteria; discuss outreach and recruitment
efforts; outline the services provided to participants; summarize certain noteworthy
features of the projects; and describe the program experience of selected participants.
The researchers also point out that over the three and a half years of operations, the
four demonstration projects had the opportunity to adjust their programs
considerably—often in response to lower-than-expected enrollments. The projects
were encouraged by the Department of Labor to experiment with their approaches to
serving dislocated farmers and ranchers.
Chart 6 shows selected features of the demonstration efforts at the outset of
each project. The major features of each demonstration are highlighted below as well

12
as any significant changes made as the projects evolved.
Iowa
The EDWAA Farmers and Ranchers Demonstration, known locally as
Farm/Works, operated in two of Iowa’s sixteen substate areas (SSAs). The
demonstration that operated in SSA #7, in the agriculturally rich northeastern part of the
State, was headquartered in Waterloo/Cedar Rapids and covered a six-county area
with a total population of about 210,000. The demonstration that operated in SSA #14
was based in Creston (a small town in the southcentral part of the State) and covered a
seven-county area whose residents were generally poorer than those in SSA #7.
The Farm/Works demonstration had two goals: 1) to help financially stressed
farmers keep their farms; and 2) to help those who were forced to leave farming to find
alternative employment.
The model for Farm/Works was derived from a previous JTPA Title III
discretionary grant-funded project for farmers which operated in both SSAs in the two
years prior to the start up of the new program. Fundamental principles of Farm/Works
were based on this previous Title III project and included:
4 Strong, local (SSA) control of the program;
4 Staff with farm backgrounds who were familiar with the community;
4 Adequate time for counseling and rapport-building between staff and farmer
participants; and
4 Retention of the farm as a desirable and valid objective.
The demonstration was characterized by extensive counseling and
assessment, generous support services, and many choices of occupational skills
training (with a strong emphasis on long-term classroom training). Farmers whose
operations seemed viable were also offered legal and financial services, farm

13
management courses, and off-farm employment to enhance their chances of keeping
their farms. Job search assistance and placement, as well as on-the-job training
services were also provided. The project featured strong case management, with each
SSA employing a specialist with a farm background whose time was fully dedicated to
the demonstration’s clients.
The Farm/Works demonstration used the same eligibility criteria applicable to
farmers and other self-employed individuals in the State’s overall EDWAA program.
It emphasized long-term training (funding allowed many participants to begin two-year
training programs). Some participants were able to complete four-year programs that
they began prior to the demonstration. Occupational training in a classroom
environment was offered through community colleges, the State university, private
colleges and other private training programs. Participants took courses in such
occupations as nursing, welding, mechanics, and drafting. Only a few participants
received on-the-job training.
Participants also received support services to cover certain training-related
expenses, as well as medical, counseling, legal, and financial assistance.
The researchers point out that, with the award of a grant from the Secretary of
Labor’s reserve funds, the State will continue to serve at-risk dislocated farmers after
the demonstration ends.
Minnesota
Minnesota’s Dislocated Farmers Project was designed and managed by staff of
the Southwest Minnesota Private Industry Council (unlike the other demonstration
projects, Minnesota’s State EDWAA agency played a very minor role in designing and
operating the program). Day-to-day operations fell under the jurisdiction of the substate
area’s three offices which were responsible for all local JTPA services. Each office
integrated the demonstration project with existing services. Demonstration participants
underwent the same assessment and were eligible for the same services as other JTPA
clients.

14
The project differed from mainstream JTPA services in two ways. First, it
targeted clients who were at risk of dislocation from the farm or ranch as well as those
who were already dislocated. Second, two new outreach staff were added to recruit at-
risk and dislocated farmers.
Minnesota’s use of existing EDWAA staff and facilities allowed the State to
build on existing coordination efforts. Long-standing cooperative agreements
established by EDWAA gave participants access to numerous services and agencies,
including the Job Service, community action programs, rehabilitation agencies, and
other human service agencies. Demonstration staff also made new contacts with the
Department of Agriculture’s Farm Advocate Program, with farm management
instructional programs at area technical colleges, and with local farm lenders.
Participants received assistance which included basic readjustment services,
support services, relocation assistance, job development/placement, classroom
training, on-the-job training, and entrepreneurial training. Classroom occupational
training was a service priority, and most of the participants received this service through
the Southwestern Technical College.
Minnesota provided entrepreneurial training as part of its project design and
greatly improved this training in the demonstration’s final year by working with a local
foundation to introduce a loan fund to provide start-up capital to supplement
entrepreneurial training. The researchers point out that this effort was particularly
important because the scarcity of jobs in rural agricultural areas, combined with the
wide range of skills that farmers often have, makes job creation through
entrepreneurship an attractive option.
The researchers also note that in Minnesota, the end of the demonstration
resulted in a decline in services to farmers. Dislocated farmers were still eligible for
EDWAA services, but at-risk farmers could not be served and outreach activities were
severely curtailed.
North Dakota

5The Agricultural Mediation Service is a division of the State Department ofAgriculture.
15
North Dakota’s Farmer/Rancher Demonstration Project recruited at-risk and
dislocated farmers and ranchers (and their spouses, dependents, and farmhands) into
what was essentially a traditional EDWAA program, with three main differences.
First, the demonstration aggressively recruited participants primarily by using
Agricultural Mediation Service (AMS) negotiators as outreach workers.5
Second, the project was housed separately from local Job Service offices.
(The project used two offices, each staffed by a team consisting of one Job Service
employee and one AMS negotiator.) Third, the project promoted early intervention by
targeting individuals who were at risk of farm dislocation.
Eligible participants included farmers and ranchers, their spouses, their adult
children who worked full-time on the farm, and farmhands. Applicants had to be
employed on a financially at-risk farm.
Most participants received an initial assessment, and a service plan was
developed during their first office visit. (Enrollees underwent the same assessment
process as other Job Service participants.)
Unlike the mainstream EDWAA program, Job Service staff designed the
demonstration to include a case management component. A Job Service staff
member, assigned to the demonstration, worked with participants throughout their
program experience to inform them about available services, and help them develop a
service plan. The staff member remained available to work with the client throughout
the entire program experience.
Participants were eligible to receive basic skills training, as well as a range of
occupational retraining courses. They enrolled in courses at State colleges and
universities, community colleges, and a number of proprietary technical schools.
Several participants enrolled in technical schools outside of the State for specific
training programs. Although the demonstration encouraged long-term training, on-the-
job training was also available (mainly for participants who required more immediate

16
employment). Many on-the-job training opportunities arose from demonstration project
staff contacts with employers, and most of the contacts led to full-time, unsubsidized
employment. Participants who sought to improve their existing farm operations were
offered farm management training.
The study report points out that North Dakota’s demonstration project began in
two small, independent offices, but eventually expanded to cover the entire State. This
change had the effect of diminishing services to farmers and ranches, while increasing
overall enrollment. The researchers also found that as the demonstration ended, staff
planned to use the lessons learned to better serve farmers and ranchers under the
existing JTPA system. Coordination efforts between the Job Service and the
Agricultural Mediation Service that were initiated during the demonstration were
expected to continue after the demonstration ended.
South Dakota
South Dakota, a single substate area State, was the only grantee to provide
services to farmers statewide. The demonstration was known as the Agricultural
Community in Transition (ACT) program and was managed by the State EDWAA
coordinator. Service delivery was provided through one of the 19 Job Service offices
located throughout the State and through 10 Career Learning Centers (private,
nonprofit JTPA service providers).
The program model was based on a previous program, known as Rural
Renaissance, an employment and training program for farmers who experienced
difficulty during the mid-1980s.
The ACT program was originally designed with the premise that participants
could be recruited, enrolled, served, and placed by using existing institutions and staff.
However, one year after the demonstration began, it had enrolled few participants. As
a result, additional staff were hired exclusively for the ACT program and enrollment
increased significantly later in the demonstration.

17
In addition to targeting farmers who had already lost their farms, ACT recruited
farmers who were at-risk of farm loss and who needed help if they were to keep their
farms. These individuals were referred to Adult Farm/Ranch Business Management
Courses.
The researchers pointed out that, at the local level, relations between the two
key agencies, the Career Learning Centers and the Job Service, were somewhat weak,
and outreach and coordination efforts were not as effective as they might have been.
Eligibility criteria for the program were relatively liberal; clients did not need to
show proof that their businesses were actually failing. The program offered a full array
of EDWAA services, including assessment, counseling, legal services, support
services, basic readjustment services, classroom occupational skills training, on-the-job
training, and job placement.
The Career Learning Centers specialized in providing basic readjustment
services which included assessment, vocational counseling, preemployment training,
referrals to training, short-term clerical “brush-up” courses, and some job placements.
ACT clients, however, did not receive referrals for financial, legal, or mental health
counseling. In some areas of the State, job search assistance was provided by Career
Learning Center staff, and, in other areas, through Job Service Offices.
Occupational skills training was available through one of the four vocational-
technical colleges in the State or through private training facilities. Long-term training
was not heavily used by ACT or other JTPA clients. After January 1992, the ACT
program referred eligible farmers to the South Dakota Division of Vocational
Education’s Adult Farm Ranch Business Management Program which focused on
helping farmers use computers to manage their operations.
The researchers found that after improving upon its original plans by hiring
specialized outreach staff, South Dakota returned to its predemonstration arrangements
for serving farmers and ranchers at the end of the formal demonstration. Although
farmers and ranchers would continue to be served, they might not be served any
differently than they would have been before the demonstration.

18
Enrollment Patterns andParticipant Characteristics
The study report points out that all of the demonstration projects experienced
some difficulty in recruiting farmers and ranchers into training and employment
programs, primarily because these individuals were often reluctant to enter into
government-funded programs. Also, a significant portion of the population group was
hesitant to admit that their farms were failing. For these and other reasons, the
demonstration projects were slow to build up their caseloads (although Iowa moved
quicker than the other sites, primarily because it had recent experience serving farmers
under a previous discretionary grant).
By the end of the demonstration, South Dakota, Iowa, and Minnesota had
enrolled approximately 350 participants each. North Dakota enrolled over 500
individuals.
In reviewing participant characteristics, the researchers found that they were
dislocated farmers and ranchers or those at risk of dislocation, their family members,
and their employees. About one-half of the participants were farmers, one-quarter were
spouses of farmers, and about six percent were other family members. Nine percent of
the participants were hired farm hands who were adversely affected by farm failures.
About nine percent of the participants indicated that they or their spouses had already
left farming at least six months before enrollment.
Almost all of the participants in the four States were white, non-Hispanics.
Most had attained at least a high school education, and about half had attended some
postsecondary education. On average, participants were relatively young; in each
program, three-quarters of the participants were under age 45. Relatively few were age
55 or older. Table 15 shows selected demographic characteristics of the demonstration
participants.

19
__________________________________________________________________Table 15. Selected Demographic
Characteristics of Demonstration Participants(Percent)
__________________________________________________________________
Characteristic Overall Iowa Minnesota North SouthDakota Dakota
__________________________________________________________________
Race/ethnicity:White (non-Hispanic) . . . . . 99.3 99.7 100.0 98.8 98.7Other . . . . . . . . . . . . . . . . . . . 0.7 0.3 0.0 1.2 1.3
Education:Current high school student . NA 2.4 0.9 0.0 NADropout . . . . . . . . . . . . . . . . . NA 3.0 4.6 7.4 NAHigh school graduate . . . . . . NA 50.3 42.1 46.4 NASome postsecondary . . . . . . NA 44.3 52.4 46.2 NA
Basic skills proficiency:Has limited English-speaking proficiency . . . . . . . . . . . . . 0.1 0.0 0.0 0.2 0.0Reads below the seventh grade level . . . . . . . . . . . . 4.1 1.2 1.2 4.8 8.8
Respondent is:Single parent . . . . . . . . . . . . . 3.7 4.2 5.2 3.0 2.8Parent in a two-parent household . . . . . . . . . . . . . NA NA 63.1 NA 81.1Another family member . . . . . NA NA 17.1 NA 4.1Independent individual . . . . . NA NA 14.6 NA 12.0
Number of cases . . . . . . . . . 1,476 332 328 498 318__________________________________________________________________
Note: Data were provided for all participants from the States’ ManagementInformation System (MIS). Iowa and North Dakota did not provide information on theirparticipants’ family status, beyond indicating whether the respondent was a single headof household.
Source:Serving Dislocated Farmers: An Evaluation of the EDWAA Farmers andRanchers Demonstration. __________________________________________________________________
The report also reviews preprogram income and finances, noting that overall,
20
about 30 percent of the participants reported a total net family income that was less
than zero, and another 30 percent had incomes of less than $10,000. In about 60
percent of the cases, one or both household heads were employed off-farm in the year
before enrollment. Seventeen percent of the participants reported that they had been
unemployed at least 15 of the 26 weeks prior to program enrollment.
In comparing the characteristics of the demonstration participants with EDWAA
participants in general, the researchers found that, for the most part, their
characteristics were similar.
Services and Outcomes
The report describes the types of services received by participants, highlights the
differences in service priorities across the demonstration projects, and provides
information about the shorter-term and longer-term outcomes obtained by terminees.
The following are some of the findings.
Regarding services received and provided, the researchers found:
4 About 80 percent of the participants received retraining of some kind, with
rates of retraining especially high in Minnesota and South Dakota and lowest
(but still above 70 percent) in North Dakota.
4 Retraining usually took the form of occupational classroom training, which was
completed by over one-half of all persons served. Only small numbers
completed basic skills training, and only about 15 percent completed on-the-job
training.
4 The duration of participation varied widely. About 21 percent received services
for no more than three months; another 22 percent received services from three
months to six months; 26 percent received services from six months to one year;
and the remaining 31 percent received services for longer than one year.
4 Expenditures per participant varied widely. They were lowest in South Dakota
(at $1,700), intermediate in North Dakota (about $3000), and highest in Iowa and
Minnesota (about $3,700).

21
4 Iowa allocated more of its expenditures for basic readjustment assistance
(slightly less than one-third of its funds) than any other program (reflecting
lengthy recruitment and counseling). Iowa also spent more than any other
program on supportive services (about 16 percent of its total funds).
Consequently, it spent a smaller proportion of its funds on retraining (about 37
percent). Minnesota and South Dakota spent over 70 percent of their funds on
retraining. North Dakota’s expenditures were intermediate between these
extremes, with 60 percent of its dollars allocated for retraining and 20 percent
allocated for basic readjustment services.
4 Only about half of those who were already dislocated received retraining, and
their duration of participation was among the briefest. By contrast, almost 90
percent of dependents of farmers received retraining, and they participated for
almost one year, on average.
4 Compared to formula-funded EDWAA clients served by the SSAs, all
programs except North Dakota were more likely to provide demonstration
participants with retraining and to serve them for longer periods of time. In North
Dakota, demonstration participants were about as likely to receive retraining as
other EDWAA clients. In all programs, per participant expenditures were
appreciably larger in serving demonstration participants than formula-funded
clients.
Regarding short-term outcomes, the researchers found:
4 About two-thirds of participants were still living on a farm just after termination
and about one-half were still farming.
4 Many participants (about 80 percent in Iowa and smaller numbers elsewhere)
were working off-farm three months after termination. Those who left farming
were much more likely to have off-farm jobs than those who were still farming.

22
4 Those who were employed were working in a wide variety of jobs and their
earnings were usually fairly modest. After three months, 25.9 percent had
weekly earnings of $200 or less; 32.8 percent had weekly earnings between
$201 and $300; 25.9 percent had weekly earnings between $301 and $400; and
15.5 percent had weekly earnings of over $400. After three months of
employment, 55.2 percent had fringe benefits that included health insurance for
“self only.” Just over 40 percent had health insurance for their families; 32.8
percent had retirement benefits; and 59.7 percent had paid vacation or sick
leave.
4 Participants who were employed off-farm before enrollment were more likely to
be employed off-farm at program termination, with 66 percent of those employed
off-farm before enrollment still employed off-farm three months after program
termination.
4 For those who left farming, hourly wages increased by an average of $2.00 per
hour in Iowa, $1.50 per hour in Minnesota, $.90 in South Dakota, and about $.30
in North Dakota.
Regarding long-term outcomes, the researchers found:
4 Although one-half of the participants were still farming shortly after program
termination, only one-third were still farming one year later. (Thus, displacement
from farming was, in many cases, forestalled only temporarily.)
4 Among the one-third of participants who were still farming over one year after
program termination, 43.6 percent reported that the financial condition of their
farm was better than it had been a year ago (suggesting that their farms may
have rebounded from their earlier difficulties).
23
4 Rates of off-farm employment did not increase over this period. However,
among those employed off-farm both shortly after termination and one year later,
earnings and access to fringe benefits appeared to have increased modestly.
Fifteen months after termination, 22.4 percent of the participants who left farming
reported weekly earnings of over $400, compared to 15.5 percent who earned
over $400 per week three months after program termination. Also, at 15 months
after termination, 68.7 percent reported that they had health insurance for
themselves, compared to only 55.2 percent who reported “self only” health
insurance three months after termination.
Study Conclusions and Recommendations
Following a brief discussion on effective strategies used to reach and serve
farmers, the study report provided a number of conclusions and several policy
recommendations. These are listed below.
Conclusion #1. While there may be periods and places where the rates of
decline in the agricultural sector slow down or accelerate, the displacement of farmers
and ranchers has become a chronic feature of the American economy. Periodically,
however, catastrophic events such as a drought, flood, or sharp market changes
temporarily worsen conditions for farmers, placing an unusually high number of them at
risk.
Related Policy Implication. Rural SSAs should be encouraged to include
farmers in their dislocated worker caseloads, and SSAs can learn to meet the
employment and training needs of farmers. Technical assistance should be provided to
SSAs to help with this effort. Discretionary funds appear to be an appropriate and
effective mechanism for responding to unusual needs but they should not be used to
address normal rates of decline in the farming sector.
Conclusion #2. Assessing the need for employment and training services in a
local area is technically very difficult, and can exceed the capacities of local programs.
24
Nonetheless, good estimates of the numbers of farmers likely to enroll in programs is a
critical element of successful program design.
Related Policy Implication. Technical assistance should be provided to SSAs
to aid in the estimation of the number of potential farmer participants. State-level JTPA
offices can also support this activity. SSAs should be encouraged to contact
agricultural organizations for help in estimating levels of need.
Conclusion #3. Farmers, for a variety of reasons, are often difficult to reach
and reluctant to accept assistance. However, through the use of aggressive, intensive
outreach methods, the programs were able to achieve and even surpass their
enrollment goals, serving a relatively high proportion of eligible farmers in their areas.
Related Policy Implication. Aggressive outreach is a necessity for enrolling
farmers into JTPA programs. SSAs designing services to help farmers should be
strongly encouraged to hire or train specialized outreach staff to recruit farmers.
Conclusion #4. While allowances should be made to acknowledge the unusual
efforts needed to enroll farmers, excessive resources devoted to this activity do not pay
off, either in the number of farmers enrolled, or in employment-related outcomes.
Related Policy Implication. Although SSAs should be encouraged to
concentrate resources on outreach, this should not occur at the expense of more
substantial services, such as retraining.
Conclusion #5. All four programs eventually prioritized enrolling at-risk farmers
rather than dislocated farmers. Many project staff began to see their mission as saving
as many farms as possible. Frequently, JTPA funds were used to forestall farm
dislocation, rather than to provide an opportunity for farmers to achieve economic self-
sufficiency through off-farm employment.
Related Policy Implication. In funding future programs for farmers and
ranchers, the Department of Labor may wish to clarify program goals, eligibility
guidelines, and activities that are allowable and appropriate.
Conclusion #6. Those programs that succeeded in building strong ties with
organizations that serve or regularly come into contact with the farming population
reported many payoffs, including enhanced outreach and expanded services to

25
participants.
Related Policy Implication. While coordination and cooperative linkages with
community organizations benefit all JTPA participants, for SSAs serving farmers, such
linkages are essential. Local programs may need assistance in identifying and
establishing contacts with organizations, especially those with close ties to the
agricultural community.
Conclusion #7. Once enrolled, farmers often prove to be model participants,
availing themselves of the full range of services and faithfully attending counseling
sessions, classes, or on-the-job training. Negative terminations were rare.
Related Policy Implication. The type and intensity of retraining services as
delivered through mainstream EDWAA programs appear to be at least as appropriate
for farmers as they are for other dislocated workers.
Conclusion #8. The close, personal, and ongoing relationships between clients
and staff that were a hallmark of the demonstration were the most often-mentioned
factors underlying project successes.
Related Policy Implication. The case management model, which has been
shown to be highly effective for delivering employment and training services to
dislocated workers and the economically disadvantaged in general, should be strongly
encouraged for programs serving farmers.
Conclusion #9. The programs achieved a modest degree of success in finding
off-farm employment for the participants. While participation in the programs led to an
increase in the percentage of participants who increased their nonfarm employment,
the rate of increase is lower than the rate achieved by nonfarm EDWAA participants,
and many participants who entered the program as at-risk farmers were still farming a
year after termination, without supplemental income.
Related Policy Implication. SSAs should target services to those farmers who
are reasonably motivated to leave farming as their primary livelihood and/or to increase
off-farm employment. Also, job placement activities can be enhanced by encouraging
self-employment. SSAs should explore opportunities for linking up with rural
development activities in their areas. Finally, relocation assistance should be actively
6Mary G. Visher, Stephen Walsh, and Ronald D’Amico, Serving DislocatedFarmers: An Evaluation of the EDWAA Farmers and Ranchers Demonstration (Oaklandand Menlo Park, Calif.: Berkeley Planning Associates and Social Policy ResearchAssociates, 1994). Highlights of this publication are included in this chapter of theTraining and Employment Report of the Secretary of Labor.
7Liz Wiegardt and Phyllis Weinstock, From the Farm to the Job Market: A Guideto Employment and Training Services for Farmers and Ranchers (Oakland and MenloPark, Calif.: Berkeley Planning Associates and Social Policy Research Associates,1994).
26
encouraged for those participants who are unable to find jobs in their local areas.
PROVIDING TRAINING AND EMPLOYMENT SERVICES FOR FARMERS AND RANCHERS
Overview
As part of its evaluation of the Economic Dislocation and Worker Adjustment
Assistance (EDWAA) Farmers and Ranchers Demonstration,6 the Department of Labor
supported the development and publication of a guidebook to help practitioners provide
effective services for dislocated farmers and ranchers.7
The guidebook describes why farmers require certain types of services; provides
information about how to initiate programs and identify services for this special group;
discusses ways to design services that are responsive to the special characteristics,
circumstances, and values of farmers and ranchers; and offers suggestions for State
JTPA officials about how they can support local efforts to serve farmers under EDWAA.
The publication also contains a resource list for practitioners which provides program
contacts, and lists the titles of various reports and other publications that supply
information about worker dislocation and services to farmers.

27
How Farmers DifferFrom Other Clients
The authors introduce the topic of farmer dislocation by providing information
about how farmers differ from other clients. Differences noted include:
4 They often do not have a clear layoff date (the process of losing a farm or
ranch may take many years);
4 Because job loss happens individually (rather than in large groups), farmers
and ranchers are not made aware of available services through traditional
“rapid response” activities;
4 Farmers and ranchers generally do not receive unemployment benefits,
severance packages, and options to continue health insurance;
4 They have little or no possibility of being recalled or transferred and there
is no option to retire;
4 Losing a farm or ranch often means losing a whole way of life;
4 Because both spouses often have made their living working on the farm, and
sometimes their grown children have as well, the loss of a farm or ranch often
affects entire families;
4 In many cases, all of their resources have been spent trying to save their
farms; and
4 They may be faced with ongoing complex legal conditions, such as
bankruptcy or foreclosure.
The authors also point out that farmers and ranchers face a variety of challenges
to becoming reemployed that differ from other dislocated workers because they often
live in geographically remote, sparsely populated areas; face a local rural economy with
few reemployment opportunities; lack specialized skills; experience intense grief over
the loss of their farm or ranch; have pressing needs for immediate income; and often
have difficulty qualifying for financial assistance for retraining.

28
The Increase inFarmer Dislocation
The increase in farmer dislocation resulted from the farm crisis of the 1980s, in
which lenders often restructured farm debt by providing loans with high yearly payments
or large payments due at the end of the loan term. Depressed commodity prices and
adverse weather conditions also contributed to an increase in farm failures.
In describing which farmers most need services, the authors point out that the
middle-sized farms (those with between $10,000 and $100,000 in yearly sales) often
lack sufficient capital to ride out periods of financial stress—they are large enough to
require a full-time work commitment from farmers and ranchers, but fail to provide a
large enough income to sustain the operation through difficult financial circumstances.
Operators of smaller farms, on the other hand, sometimes known as “hobby farms” or
“rural residences” may have enough off-farm income during periods of economic stress
to sustain farm activities. Large farms are not as affected by economic conditions. As
Chart 7 indicates, 37 percent of all farms in the United States are middle-sized farms.
Start-Up Activities
The guidebook offers a number of preliminary activities that may be undertaken
to initiate services that are responsive to local needs. These include:
4 Assessing the extent of farm and ranch dislocation in a specific area;
4 Determining the characteristics and needs of potential farmer and rancher
clients;
4 Identifying possible funding sources;
4 Building networks with other organizations involved with farmers and
ranchers; and
4 Recruiting, training, and supervising staff.

29
Assessing the Need for Services
The authors point out that before designing programs and providing services, it is
important to estimate the extent of farm dislocation in the local community. The
guidebook offers examples of ways to generate rough estimates of the extent of farm
dislocation by:
4 Gathering and analyzing statistics from local lenders about the number of
agricultural loans that are past due;
4 Reviewing reports from experts, such as agricultural economists at State
universities or the State Department of Agriculture, about the extent of farm
dislocation statewide and within a local area; and
4 Taking note of the number of calls received from rural “hotlines,” particularly
calls about farm financial concerns.
Several examples of ways that have been used to estimate and document the
need for services for farmers are provided in the guidebook.
Determining the Characteristics and Needs of Potential Clients
The guidebook describes the differences between methods used to determine
the needs and characteristics of workers who have lost their jobs through mass layoffs
and plant closings and dislocated farmers and ranchers, noting that the formal surveys
used to obtain information about large groups of laid-off workers are not necessarily
appropriate for farmers. Rather, more informal ways of gathering information about this
particular client group need to be used, including:
4 Forming task forces made up of farmers and others in the community who
come in contact with farmers;
4 Identifying and interviewing former farmers who have established new
careers off the farm; and
4 If resources are available, surveying at-risk and dislocated farmers to help to

30
determine the extent of need, the characteristics of potential clients, and the
demand for specific services.
Identifying Funding Sources
The guidebook offers advice and provides examples of ways to find funds to
establish and operate programs for dislocated farmers. The authors briefly discuss the
use of JTPA Title II-A funds and funds that may be available through the EDWAA
program. The limitations of using these funding sources are noted.
The publication points out that since the farm crisis of the 1980s, the JTPA Title
III National Reserve Account has been a primary source of funding for training and
employment programs serving farmers. These funds, however, generally support short-
term projects. Examples of some National Reserve Account projects are provided. The
authors also note that some States have used their JTPA Title III State discretionary
funds either to support special projects targeted toward farmers and ranchers or to
supplement formula funds for substate areas that experience significant farm
dislocation.
Examples of the use of various State funding sources and nongovernmental
funds are also provided.
Developing Networks
The guidebook also provides helpful advice on ways to build connections among
community organizations at a variety of levels. The authors suggest that these
networks are important because they can: 1) help assess the need for services, 2) help
design services, 3) serve as a source of referrals to programs for farmers; 4) provide
services beyond the scope of a particular program; and 5) develop a coordinated
response to the larger issue of rural decline. The authors list a number of individuals
and organizations that should be a part of such a network. These include employers in
the community, various training providers, lending institutions, human service agencies,

31
farmer and rancher organizations, churches, and agencies that directly serve financially
distressed farmers.
Strategies for network building include establishing task forces made up of
concerned individuals in a particular community who have a strong interest in the issues
that relate to farm dislocation, who bring valuable resources such as knowledge, skills,
and contacts, and who are affiliated with organizations that can be of assistance. The
importance of personal networking by both program administrators and case managers
with their counterparts in other organizations is also discussed.
Recruiting, Training, andSupervising Staff
The guidebook also provides several tips on how to find, hire, and train
appropriate field staff. Suggestions such as hiring people with farm backgrounds,
finding individuals with good listening skills, and who have good self-management skills
are offered. Field staff should also be willing to work flexible hours and spend a lot of
time traveling. Recruitment strategies, necessary qualifications, and training efforts are
briefly highlighted. The authors discuss several issues related to managing field staff.
They also provide an overview of the office support necessary for field staff.
Addressing the Special Needsof Farmers and Ranchers
The guidebook’s third chapter describes several ways to design employment and
training services that are responsive to the special characteristics, circumstances, and
values of farmers and ranchers. The authors describe the adjustments that need to
be made to basic training and employment programs in an effort to better serve this
special population group. Of special concern are the services (outreach, assessment,
case management, and supportive services) that bring clients into the program and
subsequently provide the support that enables them to successfully participate in core

32
activities such as job search assistance and classroom training. Following are several
specific activities described in the publication.
Outreach Efforts
The authors note that one of the most challenging aspects of setting up
programs for farmers and ranchers is the establishment of an effective outreach
strategy. Because many farmers and ranchers are unlikely to seek aid in times of
difficult circumstances, it is important that program managers seek out this special
group, gain their trust, and convince them that there is help available.
One of the keys to a successful outreach effort is the hiring of specialized staff to
conduct this activity. The authors point out that many of the most successful programs
place a high priority on hiring individuals with farming backgrounds to perform outreach
and intake tasks. In this regard, the guidebook offers several helpful tips from
experienced outreach workers. These include:
4 Meeting with potential clients on several occasions;
4 Reaching out to individuals rather than to groups (because farmers and
ranchers become dislocated one at a time, rather than through mass layoffs and
because they are unlikely to discuss their difficulties in a group setting);
4 Conducting farm visits to provide program information directly to the target
group;
4 Ensuring that dislocated farmers and ranchers know who to call if they need
additional help;
4 Reaching out to both men and women in the farm family;
4 Dressing and conversing appropriately for the farm population when
performing farm visits; and
4 Avoiding the use of lengthy enrollment forms or complex information
handouts during initial visits.
Because making potential clients aware of available assistance is one of the
most important aspects of program operations, the guidebook also offers several tips

33
for outreach workers that can help them to take advantage of the media and personal
networking efforts to reach dislocated farmers. Examples of effective newspaper
advertisements and press releases are provided, along with tips for appropriate
personal networking initiatives.
Tailoring Services to Farmersand Intake/Enrollment Efforts
Another important aspect of successful farmer and rancher programs is the way
in which the service process is tailored to the particular population group. The
guidebook highlights a number of issues for program managers to consider in designing
initial “preparation for training or job search” services. These are:
4 Services need to be provided by someone with whom farmers are
comfortable (i.e., staff need to have farm backgrounds or at least have extensive
knowledge of the characteristics, circumstances, and values of farmers).
4 Services need to be provided in a place where farmers will be at ease
because farmers typically are more reluctant than most other training and
employment clients to go to a JTPA office. Services, therefore, need to be
provided on the farm or at least in an office that does not have “government
assistance” connotations; and
4 Services need to be provided in a way that feels comfortable to farmers
(unlike other dislocated workers, who are often laid-off in rather large numbers
and may derive support from participating in services as a group, farmers may
not feel comfortable in such a setting).
The authors discuss these special considerations in detail, providing information
about the timing and preferable location of intake and enrollment efforts. They also
emphasize the need to work with as many members of the family as possible. Other
strategies include setting up flexible schedules to discuss programs with farmers, and
making paperwork as “user-friendly” as possible.

34
Case Management
Another important feature of successful farmer/rancher programs is the case
management approach to service delivery. In addition to providing examples of
successful case management efforts, the authors highlight many of the most important
features of effective case management strategies. They suggest that:
4 One staff person should be assigned to each participating farmer to serve as
the main point of contact throughout the farmer’s participation in the program.
The case manager should directly deliver many services such as assessment,
counseling, and job search assistance, and coordinate all other needed
services, providing referrals as needed. The case manager should also regularly
check the client’s progress.
4 Because services need to be highly individualized, case managers should
ensure that all services are tailored to the client’s needs and interests
(programs should be designed to fit the farmer rather than having the farmer fit the
program);
4 The case manager should form a trusting personal relationship with the
client—contact should be frequent and should take place on the farm as often
as possible; and
4 Caseloads should be smaller than for most other employment and training
clients (20 to 30 clients is a desirable level).
In describing variations in the design of case management services, the authors
note that it is important to vary caseloads based on client needs. Disruptions in staff
continuity should be minimized, and a team approach to case management may be
appropriate. The authors also note that experienced case managers know that services
for farmers cannot be provided on a standard nine-to-five schedule. Because many
case managers spend several days a week visiting clients on their farms, it is helpful for
them to maintain some regular office hours so that clients know when they can be
reached.

35
The authors also stress the importance of confidentiality because farmers and
ranchers often place a particularly high value on their privacy. Several tips are provided
to help case managers maintain client confidentiality.
Assessment and Service Planning
Because services need to be tailored specifically for farmers and ranchers,
assessment and service planning are important aspects of program operations. The
authors note that while the basic approach is similar to those carried out for other
dislocated workers, some special considerations arise in making the process both
comfortable and useful for farmers. Components of assessment and service planning
may include:
4 Informal assessment of farm status, need for supportive services, and
interests;
4 Assessment of vocational skills and basic skills;
4 Exploration of career preferences and values; and
4 Development of a service plan.
The authors suggest that in tailoring assessment and service planning to farmers
and ranchers, outreach workers and case managers should:
4 Conduct as much of the assessment process as possible at the farm, through
informal conversations, before proceeding to formal or group testing;
4 Match the choice of tests to the individual, and explain to the farmer which
tests are most appropriate;
4 Conduct a thorough assessment of transferable skills;
4 Use the assessment process to build confidence and self-esteem;
4 Keep the farmer actively involved in service planning; and
4 Be prepared to accommodate a farmer’s special situation.

36
Job Search and Placement Assistance
The guidebook suggests that typically, job search assistance services do not
need to differ from the way they are provided to dislocated workers in order to be
responsive to the needs of farmers and ranchers. However, a few considerations are
noted that can make these activities most useful for this population group. The
publication includes tips about tailoring basic readjustment services to farmers and
ranchers and offers suggestions about the best ways to develop effective resumes for
farmers. The need for relocation assistance is also discussed.
Retraining and Supportive Services
The authors note that while some dislocated farmers seek job placements after
receiving counseling and job search assistance only, most find that they need to be
retrained in order to obtain jobs with adequate wages and opportunities for
advancement. The publication highlights each type of retraining (classroom
occupational training, on-the-job training, entrepreneurial training, and basic skills
training) by describing its utility for farmers and discussing considerations that are
relevant in tailoring the service to meet the needs of farmers. The publication also
highlights the experiences of a few farmers and ranchers who received various
retraining services.
Because distressed farmers and ranchers are more likely to successfully
complete training and find jobs if they and their families receive a range of supportive
services during their program experience, the authors discuss the complex set of
financial, legal, medical, and mental health problems that may interfere with training
and job search efforts. They point out that dislocated farmers and ranchers have
unique needs for supportive services because:
4 Unlike some other dislocated workers, farmers do not have the resources to
support themselves during retraining (i.e., unemployment insurance,

37
continuation of medical benefits, and severance packages);
4 Farmers rarely receive government benefits such as Aid to Families with
Dependent Children, food stamps, and Pell Grants because they are reluctant
to apply for them or because they have assets (such as land) that disqualify
them from receiving these services;
4 Often, by the time they enroll in a training program, farmers have no funds left
on which to live;
4 Because most farmers and ranchers live in remote rural areas, transportation
expenses for classroom training can be prohibitive;
4 Farmers and their families may need medical services; and
4 Many farmers may also need mental health services in order to move ahead
with retraining or a job search.
The authors suggest that program operators often find that funds available for
supportive services are scarce, relative to the level of need. Several suggestions are
provided in the publication for ways to stretch scarce resources to deliver supportive
services.
Suggestions for StateJTPA Officials
Although the guidebook is directed toward practitioners, the authors briefly
examine several areas in which State JTPA programs can support local efforts to serve
farmers and ranchers under EDWAA. These suggestions include prioritizing services to
farmers and ranchers as a statewide goal, providing technical assistance and training to
this particular group, clarifying rules and regulations as they relate to serving farmers
and ranchers, facilitating access to special funding sources, fostering coordination by
helping to establish good working relationships with other State agencies that serve this
population group, and monitoring the progress of local EDWAA programs to ensure that
farmers have been recruited into these programs.

8The National Agricultural Workers Survey (NAWS) was designed to provideinformation on the impact of the 1986 Immigration Reform and Control Act onfarmwork.
38
EVALUATING PROGRAMS FOR MIGRANT AND SEASONAL FARMWORKERS
Overview
Estimates included in the Report of the Commission on Agricultural Workers
(1992) place the number of individuals who performed any hired farmwork during the
year at about 2.5 million persons (including domestic workers, legally admitted foreign
nationals, and undocumented foreign workers).
It is widely recognized that many workers who rely primarily on agricultural
employment for their livelihood experience chronic deprivation and are afforded few
opportunities for improving their employment situation. Housing for these workers often
fails to satisfy even the most basic requirements for sanitation. Furthermore, the
physical health of migrant and seasonal farmworkers is often poor, due to the lack of
regular medical care, a high incidence of injury, and numerous other factors.
Because many migrant and seasonal farmworkers are employed only a small
percentage of the year, their chances for economic improvement are few. Department
of Commerce estimates show, for example, that about one-third of hired farmworkers
work less than 25 days during the year and another 20 percent work fewer than 150
days. Consequently, although weekly earnings during peak harvest periods may seem
adequate, annual earnings of most migrant and seasonal farmworkers are quite
meager. The National Agricultural Workers Survey (NAWS)8 found that although the
pay of this group amounted to about $4.85 per hour during 1990, average earnings for
the year from farm and nonfarm work were only between $5,000 to $7,170. Equally
important, migrant and seasonal farmworkers typically do not receive employer-
provided benefits such as medical insurance or paid vacation, and coverage by

9There were no programs operating in Alaska, Rhode Island, or the District ofColumbia.
39
Unemployment Insurance and Workers’ Compensation varies throughout the country.
All of these conditions make the task of providing effective training and
employment programs for eligible workers quite challenging. These individuals often
face considerable barriers to obtaining nonagricultural employment. These obstacles
include low levels of education, poor English skills, poor health, inferior housing, and
few assets to sustain them through a period of retraining. Compounding the problem is
the fact that these workers may have only limited or no experience outside of
agriculture, and consequently lack job skills that make them competitive in the labor
market.
Department of Labor efforts to help this population group began as early as 1971
with the National Migrant Labor Program which was authorized under the Manpower
Development and Training Act. Special provisions for establishing services for migrant
and seasonal farmworkers continued under Title III of the Comprehensive Employment
and Training Act of 1973.
The current training and employment program for this group of workers is
authorized under Title IV, Section 402, of the Job Training Partnership Act (JTPA). It is
administered nationally by the Department of Labor. In Program Year (PY) 1992 (July
1, 1992 through June 30, 1993), services were provided through 53 programs, with one
program providing services in each of 47 States, five serving California, and one serving
Puerto Rico.9 Most of the grants to operate programs for these individuals were
awarded to community-based organizations (CBOs), which are nonprofit organizations
providing services to groups in need. Some CBOs operate programs in several States
under separate grants. Several other grants are operated by agencies of State
governments.
Researchers conducting an evaluation of the JTPA Title IV Migrant and
Seasonal Farmworker (MSFW) program were impressed with the dedication of program
operators and found that many programs were effectively serving the target
10Marlene Strong and Ron D’Amico, Evaluation of the JTPA Title IV Migrant andSeasonal Farmworker Program (Oakland and Menlo Park, Calif.: Berkeley PlanningAssociates and Social Policy Research Associates, 1994).
40
population.10
The evaluation report provides an overview of the working and living conditions
of migrant and seasonal farmworkers in the United States; describes the Federal
Government’s response to the situation; outlines the evaluation’s objectives, timelines,
and study components; presents a conceptual framework and quality of training model
which was developed for the study; describes the sampling design used to determine
which program sites would be included in the study; discusses the characteristics of
individuals who were eligible to participate in the program and the characteristics of
actual participants; reviews the services provided to participants (including pretraining,
classroom training, on-the-job training, supportive services, and placement services and
outcomes); notes factors that influenced program design; and offers several
recommendations based on the study’s findings. The report also includes a glossary of
terms associated with MSFW programs, and provides a list of references and other
technical information.
Conceptual Frameworkand Quality of Training Model
The activities of the study (including site visits) were guided by a conceptual
framework and a model of quality training. The conceptual framework—developed
during the study’s design phase—takes into account various federal, State, and local
factors that affect service delivery, and ultimately, outcomes attained by program
participants. The framework provided a system-level picture of the Migrant and
Seasonal Farmworker program (see Chart 8) . The researchers used these system-
level factors to guide their first round of program site visits and their subsequent
evaluation efforts.

11See, Deborah Kogan et al., Improving the Quality of Training Under JTPA:Summary of Findings (Oakland, Calif.: Berkeley Planning Associates and SRIInternational, 1990).
41
In addition, a generic client-level model of quality training, developed during a
previous study11 and modified to be more specific to the MSFW program, was also used
as a guide in evaluating many components of the program. Quality training criteria
were developed for the following areas of program design and operations:
4 Client recruitment, selection, and assignment to services. A program
should have a clear understanding of its eligible population and know the
needs of the subset of the eligible population it elects to serve. Its
program design should be flexible and change as the needs of the eligible
population change. Outreach and recruitment practices and assessment
procedures should be tailored to the needs of the eligible population and
should be sufficient to match applicants to available training options (or
refer them to alternative services if the program cannot serve them).
Assessment results should be used to develop a service plan and
employment goals appropriate for each applicant.
4 Program design and management. Programs should have designed
their available services to meet the needs of the eligible population. The
training provided should also meet the needs of employers in the local
labor market, and be aimed at year-round, stable jobs. Training should be
provided in a way that is sensitive to the needs of MSFW clients, including
being of sufficient intensity to increase their employment potential.
Programs should also maintain oversight of training activities in order to
monitor service quality.
4 Provision of training. The actual training activities should have clear
objectives, enroll appropriate participants, and meet the needs of
prospective employers. In addition, they should follow effective methods
of service delivery, which means they should have a logical sequence and

12At the State level, the 51 MSFW programs in the samplingpool were divided into three equal-sized (17 programs each)strata based on their PY 1991 allocations (“small” consisted ofprograms with allocations of less than $770,000; “medium”consisted of programs with allocations of at least $770,000 butno more than $1,320,000; and “large” consisted of programs withPY 1991 allocations in excess of $1,320,000). The programs werealso divided into two strata based on the percent of termineeswho were migrants from among all those who received employment ortraining services. (This dimension was chosen because it washypothesized that the service designs for highly mobile migrantworkers would differ from those for the more stable seasonalpopulation.) A cross-tabulation of the strata defined by
42
job-relevant content, be matched to the learners’ level, stress “training for
transfer” and active learning, spend class time effectively, include
systematic evaluation of student progress, coordinate occupational skills
training with basic skills remediation and needed supportive services, link
well with job development/job placement activities, and respond to the
cultural and language barriers of MSFW participants.
4 Job placement policies and practices. Programs should have clear
placement goals for each participant and adequate activities to attain
these goals. In making placements, they should take into account both
employer needs and client skills and goals. Job placements should be at
the highest level appropriate to clients’ levels of employability, and should
emphasize quality outcomes, including stable, year-round employment, at
least the minimum wage, safe working conditions, and opportunities for
advancement.
Chart 9 shows the client-level model of quality training used for the study.
The research team used several data sources to assess how well the program was
meeting the quality training criteria that had been developed. Information was obtained
from two rounds of site visits to 18 programs, and data were extracted and reviewed
from a sample of six terminee case files at each program in an effort to obtain
information about how observed service strategies actually worked for particular clients.
Client-level databases obtained from a nonrandom sample12 of programs were also
allocation and percent of migrants produced a six-cell table. Programs were chosen randomly from within each of the six cells.
43
used to help the researchers examine the characteristics of clients who obtained quality
jobs and better understand the kinds of service strategies that led to these outcomes.
Characteristics of the Eligible Population andProgram Participants
After describing the methodology used to determine the location of
program sites to be visited (noting that research staff conducted two rounds of site visits
to 18 of the 53 program sites—one visit during each of the two years of the study), the
report focuses on a description of the characteristics of eligible individuals and program
participants. The researchers chose the National Agricultural Workers Survey and the
Agricultural Work Force Survey to estimate the characteristics of the population eligible
for MSFW program services. Details about the surveys are briefly discussed in the
study report and their relative strengths and weaknesses are described.
In reviewing survey data about the eligible population, the researchers
determined that eligible individuals represent an extremely disadvantaged population
with very low levels of education, severe English language deficiencies, and primarily
racial and ethnic minority groups. The researchers also point out that the population
group served by MSFW programs has one of the most severe educational and basic
skills deficiencies of any group served in the JTPA system.
Grantee Service Strategiesand Operations
Training Services
The researchers describe the range of services funded under Section 402

44
MSFW grants and discuss the variations in service emphasis and mix that were
observed in the sampled programs. These are highlighted below.
4 The number of participants who received only supportive services actually
exceeded the number who received training and employment services. In
Program Year 1991, for example, 57 percent of all terminees nationally received
only supportive services, while 43 percent received training and employment
services. The researchers point out that the “supportive services only” category
typically consisted of vouchers or in-kind assistance for families who needed
food, transportation, or housing assistance. The amounts of this assistance
were generally quite small (about $50 per family).
4 Classroom training and on-the-job training were the main forms of skills
training available to participants. Classroom training generally took the form of
basic skills training or vocational skills training, although there were a few
programs that combined these into an integrated set.
4 Basic skills classroom training was generally aimed at improving the language
and mathematics skills of participants, and/or helping them to obtain an
educational credential, usually the General Educational Development (GED)
diploma. Other kinds of basic skills training included Adult Basic Education
classes.
4 It was not easy to meet farmworkers’ needs for vocational skills classroom
training. The type of training varied both from State-to-State and within grantee
service areas. Although all grantees could refer participants to existing public
and private training institutions for vocational classroom training, these
institutions were not evenly distributed throughout the country (mostly
concentrated in urban areas).
4 On-the-job training offered several advantages for migrant and seasonal
farmworkers. It provided them with immediate income (which many of these
individuals, who were heads of households, needed) and the skills learned had
clear job relevance. It was also well suited to spread-out rural areas because, in
cases where there were few classroom training venues, it was helpful to look to

45
employers themselves to provide training to participants who live nearby. In
addition, the MSFW grantees often had more flexibility in matching participants
to on-the-job training positions than in connecting them to appropriate classroom
training. Training could begin whenever there was a job opening, rather than
waiting for the beginning of a semester or school year. Disadvantages of
on-the-job training were also noted. In particular, the skills learned may be
relevant to only one employer (rather than skills that can be applied more broadly
in future jobs). Also, because employers may have little knowledge of how to
train employees, the training may be of low quality.
4 The relative emphasis on classroom versus on-the-job training changed over
time. The study report points out that in Program Year 1990, half of the
programs in the sample placed a greater emphasis on classroom training in their
service designs, and half emphasized on-the-job training. In Program Year
1991, however, there was an increase in the number of MSFW programs
emphasizing classroom training. Several factors may have accounted for this
shift, including the Department’s increased emphasis on reaching harder-to-
serve individuals and the desire to provide long-term training services designed
to help participants obtain higher-wage jobs.
4 Work experience and tryout employment were used less often by the sample
programs than classroom and on-the-job training. However, for a small portion
of the programs sampled in the study, work experience formed a significant part
of their service design. Four of the 18 programs included in the study enrolled
10 percent or more of their terminees in work experience or tryout employment,
which was above the national median.
4 Most of the MSFW program participants received training assistance
(orientation to the world of work, job related counseling and testing, vocational
exploration, or job development and placement).
In addition to describing the range and mix of services provided to participants,
the study report also provides insight into the selection and use of various organizations
and institutions to provide services to program participants. It also presents information

46
about the use of non-Section 402 funding and the coordination of other funds to help
migrant and seasonal farmworkers.
Regarding decisions about who would provide services to MSFW participants,
the researchers found that very few of the sampled programs used service providers to
provide administrative or upfront services (e.g., recruitment, assessment, and
counseling). Rather, they generally use their own staff for these functions. The
researchers point out that this differs considerably from the practice of Service Delivery
Areas in the JTPA Title II program.
Every program in the study sample used existing service providers for training on
a individual-referral basis. That is, program staff would often pay tuition for MSFW
participants to attend existing vocational training in the community. In addition, several
programs had worked with local vocational-technical schools to develop short-term
training courses that met the needs of participants for vocational training (thus, taking
advantage of the existing vocational training infrastructure in their communities).
In investigating the extent to which MSFW grantees supplemented their JTPA
Section 402 grants with other funds, site visit staff collected information about overall
organizational budgets and information about how program funds were spent. The
researchers found that, in six of the 18 sample programs studied, no other resources
beyond the MSFW funding were used to supplement program operations (although
some in-kind resources were used). Eight of the 18 sample programs had a moderate
amount of resources other than the Section 402 grant, representing about 15 percent of
their total budget. Four of the programs had a substantial amount of resources (equal
to 50 percent or more of their overall budgets) to supplement their Section 402 grants.
The sources of these outside funds varied from State to State, with the most common
sources of non-Section 402 funds coming from education and human services
agencies. Most of these additional funds were used to provide supportive services for
MSFW participants while they were in training.
In reviewing how well MSFW programs and activities were coordinated with
programs operated by other agencies, the researchers found that all of the programs
studied engaged in interagency coordination of some kind, primarily in order to enhance

47
the resources that they could offer their clients, and, in some cases, in order to
contribute to the improvement of policies and programs for farmworkers across the
State or region. For most of the grantees, coordination was closest and most effective
with other agencies in their “cultural network” (i.e., with agencies whose main mission
was to serve Hispanics or farmworkers). Coordination between the sample programs
and local JTPA Title II-A and II-B agencies was generally weak. The researchers also
point out that long-standing relationships with State employment agencies were a key
part of several programs’ coordination activities.
PreTraining Services
Before training can begin or other services can be provided, MSFW programs
must recruit and enroll eligible participants and assess their needs. The research study
report describes the variation in the client mix across the sampled programs and
provides information about targeting decisions that give rise to the variation. The study
also assessed the consistency between targeting, outreach and recruitment strategies,
service capabilities, and client needs.
The researchers found that assessment practices varied among the sampled
programs. In the case of basic skills assessment, the emphasis on formal assessment
varied widely. This variation was attributed to differences in clientele and service
design among the programs. Programs that served a more homogeneous clientele and
that offered limited training options tended to rely less on formal testing. Programs that
used service providers for training tended to test some, but not extensively, preferring to
leave most assessment to the better-trained service provider personnel. Finally,
programs that served a diverse clientele and/or offered a variety of training options
used the greatest amount of formal testing. Overall, programs had reduced the number
of basic skills tests that they administered to clients to an average of one or two.
Other findings related to pre-training services are highlighted below.
4 For vocational skills, emphasis on formal assessment had been reduced
significantly. All programs included in the study group conducted informal

48
interviews to assess vocational skills and only a few also administered formal
tests.
4 All programs in the study group used an employability development plan to
develop, document, and monitor client services, although they varied in the
degree of vocational exploration, service options, and alleviation of barriers
provided to each client. Programs also tended to rely heavily on client input in
determining career goals.
4 Availability of service options and attention to performance standards were
cited as reasons for the variation in the amount of support that programs
provided to clients to help them overcome barriers to training. In many
programs, clients with significant barriers tended to be placed in on-the-job
training or directly into jobs. Some program staff noted that this was the case for
clients who lacked the ability, time, or financial resources to remain in classroom
training. The researchers point out that efforts to address these barriers, such
as provision of tailored training and counseling, stipends, and supportive
services are increasing, but more are needed.
4 Researchers found an increasing trend toward one-on-one approaches or one-
on-one combined with team approaches to case management. Program staff
found that intense, personal interaction with clients was necessary to keep them
in training. As this trend continued, program managers realized the need for
formally trained staff, and several programs had changed or were contemplating
changing staff qualifications.
Classroom Training
All of the programs in the study group offered some basic skills classroom
training, and, with the exception of one program, all offered some vocational classroom
training.
The researchers examined various aspects of these two forms of training. The
study report provides a description of each type of classroom training, offers information

49
about the types of organizations providing the training, discusses the intensity and
duration of instruction, notes the types of clients who received each kind of classroom
training, and briefly discusses the quality of instruction. The report also includes
information about the mix of vocational and basic skills classroom training provided to
MSFW participants.
Basic Skills Classroom Training
The researchers point out that MSFW programs need to ameliorate clients’ basic
skills deficiencies if they are to significantly and permanently improve their ability to
compete in the mainstream labor market. Although all of the sampled programs
considered basic skills upgrading important, the researchers found that the programs’
demonstrated level of commitment to remediation varied considerably.
Several programs used basic skills remediation only to prepare clients for
vocational training, and many more placed a greater emphasis on providing
prevocational training (e.g., English as a Second Language, Adult Basic Education, and
General Educational Development preparation) over providing remediation for its own
sake. Other grantees, however, placed more emphasis on remediation of basic skills
without vocational training, believing that improvement in this area alone could often
improve clients’ employability.
In an effort to meet the needs of harder-to-serve individuals and provide quality
training, the programs studied appeared to struggle to find the right balance between
basic skills remediation and vocational training. Highlights of the review of basic skills
classroom training provided in the study sites are shown below.
4 Although a variety of basic skills training was available in many programs,
there were some gaps. Four programs in the study group had no English-as-a-
Second Language training available, and for the remaining programs, it was not
uniformly available at all field offices or for participants who wanted it as a stand-
alone service.
4 Another gap was the availability of Adult Basic Education or General

50
Educational Development courses tailored to the farmworker population.
Programs that offered in-house instruction tailored this instruction to the needs of
migrant and seasonal farmworkers. However, when participants were referred to
programs in the community, they seldom found intensive instruction or bilingual
teachers. The researchers suggest that because a significant number of
farmworkers could benefit from both basic and vocational skills instruction, such
tailoring could mean the difference between program completion and dropping
out.
4 Skills centers offering integrated training (addressing clients’ needs for both
basic skills remediation and vocational skills training) are one way to meet the
needs of MSFW program participants, although they are not appropriate for all
areas.
Vocational Classroom Training
The researchers point out that although it has the greatest potential to advance
the well-being of farmworkers and their families, vocational classroom training is also
the most difficult and challenging service to provide. The barriers to providing this form
of training are many and hard to overcome. These challenges include low levels of
basic skills among the farmworker population; the lack of providers able to supply
quality training tailored to the target population’s needs; the relative high expense of this
service compared to either basic skills training or on-the-job training, the higher risk in
terms of both cost and placement rates (when compared to on-the-job training as a
vocational training option); the difficulty that clients have supporting themselves during
lengthy training programs; and the need to provide costly relocation assistance to
migrant workers interested in vocational classroom training.
The study report notes that in spite of these barriers, vocational classroom
training provides the best opportunity for farmworkers to find permanent nonagricultural
jobs that will improve their socioeconomic position. Highlights of the review of this form
of training are listed below.

51
4 It is difficult to provide vocational classroom to the farmworker population.
While the researchers found that the quality of vocational classroom training was
quite high, it was not available and accessible to many MSFW program
participants.
4 The availability of different types of vocational classroom training varied. For
instance, within service areas, rural areas were less well served than urban
areas, and in-house programs, while very accessible to those with poor basic
skills, offered training in only a limited number of occupational areas.
4 While programs that served many better-educated, literate seasonal workers
with vocational classroom training were appropriate, the cost of such training
may have limited the amount of funds available for basic skills instruction for
migrant farmers with limited English-speaking ability.
4 The researchers suggest that a greater emphasis should be placed on
increasing the availability of vocational classroom training when making planning
decisions.
Relationships Between Vocationaland Basic Skills Classroom Training
Because the need of farmworkers for both basic skills and vocational skills
training is an issue that cuts across both major sections of the study report, the
researchers examined ways in which the sampled programs addressed both of these
needs. In identifying the appropriate mix of basic and vocational skills required to help
migrant and seasonal farmworkers, the researchers suggest that programs should: (1)
tailor basic skills training and vocational classroom training classes to the specific
needs of farmworkers; and (2) integrate basic skills training and vocational classroom
training in the training and curricula available to farmworkers. Table 16 shows the
distribution of the sample programs studied with respect to the level in which programs
are integrated and tailored to the specific needs of farmworkers.
__________________________________________________________________

52
Table 16. Format of Classroom Training in the Sample Programs__________________________________________________________________
Basic Skills Training Basic Skills Training Neither Basic
Level and Vocational Tailored, Vocational Skills Trainingof Classroom Training Classroom Training Nor Vocational
Integration Tailored Not Tailored Classroom TrainingTailored
__________________________________________________________________
Fully integrated . . . . . . . . . . . . . 4 -- --
Partially integrated . . . . . . . . . . -- 2 1
Not integrated . . . . . . . . . . . . . . -- 7 4__________________________________________________________________
Source: Evaluation of the JTPA Title IV Migrant and Seasonal Farmworker Program.__________________________________________________________________
The researchers point out that tailoring classes to the farmworker population is a
particularly important factor in providing quality classroom training, and that key
features of this tailoring include: instructors who are bilingual and/or familiar with the
cultural experiences of farmworkers, class schedules compressed into short time
periods in response to farmworkers’ urgent need to begin full-time jobs, and curricula
matched to farmworkers’ skill levels.
The study also suggests that integration of basic skills and vocational skills
training is an important factor in providing quality training, and there are two dimensions
regarding this integration. The first is the integration of training packages, in which
clients are given the opportunity to pursue both basic skills training and vocational
classroom training, either concurrently or consecutively, rather than being tracked into
one or the other. The second dimension relates to the actual curriculum content. An
integrated English-as-a Second Language class, for example, might use exercises
based on vocabulary and situations specific to occupations for which participants were

53
being trained. Classes integrated on this dimension usually involved concurrent basic
skills and vocational training.
In looking at the relationships between vocational and basic skills classroom
training, the study report describes the MSFW programs in terms of those that: (1)
operated tailored and integrated basic and vocational training; (2) operated partially
integrated programs; (3) operated nonintegrated programs with tailored basic skills
training; and (4) operated programs with no integration and no tailoring. The
researches concluded that although most programs will be unable to achieve both
tailoring and integration, some degree of either tailoring or integration can, and should
be, achieved in most programs.
On-The-Job Training
On-the-job training (OJT) is an alternative to vocational classroom training that
offers the advantage of providing immediate income to participants. It is also job
relevant and uses an active (“learning by doing”) approach. Participants immediately
apply their newly learned skills to the job.
The researchers point out that to be effective, the match of participants to
employers must be carefully conducted so that participants receive training in new
skills. In addition, quality training must be provided, and the skills that employers
provide should be transferable to other occupational contexts. Furthermore, OJT
should provide participants with access to jobs that they would not have obtained
otherwise.
The study report describes how the programs studied delivered OJT services,
offers an evaluation of the quality of training provided through OJT, and identifies
factors that enhance OJT quality. Highlights of the OJT investigation, are shown below.
54
4 The responsiveness of OJT matched to the participants’ skills and needs
varied considerably across the 56 OJT positions reviewed.
4 Ten OJTs were highly responsive to participants’ needs and provided wages
of more than $5 per hour with benefits. In addition, in most instances,
participants had multiple, often serious barriers to employment and were
provided with additional training prior to or concurrent with OJT to alleviate those
barriers.
4 Nine OJTs were also responsive to participants’ needs, offering wages with
benefits to participants with low skills and little nonagricultural work experience.
They were of appropriate duration to impart the skills that participants needed
which were also transferable from one occupation to the next. The jobs were
stable and promoted long-term employment.
4 In 17 cases, OJTs were marginally responsive. Although the positions
typically provided participants with immediate employment, they were not
necessarily responsive to all of their needs. Wages tended to be low, and none
provided benefits. The skills imparted in these OJTs were often low, and some
participants with severe basic skills deficiencies received no remediation.
4 Twenty OJTs were inappropriate. The positions were largely unresponsive to
participants’ needs. They included eight OJTs in which participants were laid off
during or shortly after permanent job placement.
4 While no specific program characteristics were exclusively identified as
promoting OJT responsiveness, some general trends were observed. For
example, many of the marginal and unresponsive OJTs occurred at programs
that placed a high emphasis on OJT in their service design. In addition, most of
the OJTs provided through group OJT contracts were also marginal or
unresponsive. These two trends underscore the importance of providing
appropriate matches between participants and employers and the need for
greater monitoring and oversight of OJT conducted through group arrangements
or with employers used repeatedly for OJT.
55
Supportive Services
The study report notes that MSFW programs offer two types of supportive
services: (1) support for training (which includes both training-related supportive
services (TRSS) and stipends for training; and (2) supportive services only (SSO).
These two components have similar service content but different target populations and
purposes.
The researchers found that a barrier to successful completion of training for
many farmworkers is their inability to meet basic needs for food, shelter, medical care,
and transportation while in training. All of the programs studied made an effort to
provide a variety of stipends and training-related supportive services, or referred clients
elsewhere for these services. Regarding the provision of supportive services only, the
researchers suggest that this component is used to respond to the most severe needs
of clients who were not willing or able to participate in training. They note that this is a
logical role for programs to play because of their unique accessibility to migrant and
seasonal farmworkers, who have few, if any, other sources of support in times of
emergency. However, unlike support for training, the SSO component was not linked to
employment and training, and had no clearly defined goals other than to temporarily
alleviate hardship in order to allow farmworkers to continue in agricultural employment.
The report provides insight into these two types of services by providing an
overall discussion of support provided for training, reviewing eligibility for and types of
training, discussing funding of support for training, describing how training-related
supportive services were assessed, reviewing eligibility for and types of supportive
services only, providing information about the extent to which programs emphasized
integration of supportive services only, and discussing the role of supportive services
only in MSFW programs. Highlights of the review of supportive services, are shown
below.
13These quantitative data sources were a client-level database from nine of theprograms visited for the study and information obtained through case file reviews at all18 programs visited.
56
4 Programs vary in their use of non-Section 402 funds. In some programs, non-
Section 402 funds are a significant source of funding for both kinds of supportive
services, but are used in large part as a substitute rather than a supplement to
Section 402 supportive service funds, thus freeing Section 402 funds for training.
4 Although SSO is not immediately related to the programs’ employment and
training mission, it provides humanitarian aid that is valuable. Both SSO and
support for training can contribute to employment and training goals in different
ways. SSO can enhance outreach to hard-to-serve migrants who might benefit
from training in the future, and training-related supportive services and stipends
can make it possible for these and other workers to actually enroll in and
complete intensive classroom training.
4 Given the limited resources available, it is important that all types of supportive
services and stipends be carefully targeted and efficiently delivered to ensure
that they serve those most in need and are integrated with larger program goals
and priorities.
Placement Services and Outcomes
The study report presents information about the placement services provided to
participants. It then discusses outcomes experienced by MSFW participants, drawing
on both qualitative site visit data as well as several quantitative data sources developed
for the study.13
Placement Services

57
Job placement services can be divided into two groups: indirect placements,
which provide services for clients who have completed training programs, and direct
placements, which provide services to clients who are “job ready,” and thus do not need
additional services.
Indirect Placements. Two approaches for indirect placements were used in the
study sites. In one approach, the goal was simply to match the client with an employer;
in the other, the client developed job search skills as part of the job placement process.
All of the programs studied provided one-on-one job placement counseling for
those who completed a training program. In half of the programs, counseling consisted
mainly of the counselor providing job leads to the client and, when needed, advice on
personal grooming, job protocols, and resume writing. In these programs, the
counseling was oriented towards getting a specific job. In two of these programs,
clients in classroom training were placed in jobs by the classroom training service
provider. In the remaining half of the programs, in addition to one-on-one counseling,
clients received job search skills training. Four of the programs featured special
sessions or workshops that focused on job search skills. Other programs incorporated
job related skills into their in-house classroom training curricula.
The researchers found that even after training, clients often had lower levels of
qualifications than other workers. Therefore, job developers usually focused on
obtaining entry-level jobs for program participants.
Direct Placements. The sample programs varied in their emphasis on direct
placements. Six programs, rarely, if ever, placed participants directly (in most cases,
job-ready clients were referred to local Job Service offices). Five programs did not
promote direct placements (although they claimed that five to 15 percent of their
placements were direct). Seven programs claimed that a substantial proportion (15-33

58
percent) of their placements were direct. In these programs, “training assistance only”
was perceived as an important service component.
The researchers also found that followup practices for both indirect and direct
placements services varied. Some program operators viewed followup initiatives after
job placement as purely an administrative matter which was necessary to collect
information for reporting purposes. Others used followup contacts to provide additional
services to participants.
Services Received and Outcomes
Noting that a national client-level data base had not yet been developed for
MSFW programs, information about the types of clients receiving various services, the
kinds of outcomes achieved by various types of clients, and the effect on outcomes of
various services was obtained by reviewing data from nine of the 18 sample programs
in the study (for a total of 4,426 individual cases of Program Year 1991 terminees).
The study report provides information about the characteristics of clients who
terminated after receiving different types of service. Some highlights this section are
noted below:
4 Women were more likely to receive classroom training than on-the-job training,
while men were more evenly divided between the two services.
4 A substantial portion of men (40 percent) obtained classroom training.
4 Migrant farmworkers were more likely to receive classroom training than
seasonal farmworkers (probably due to their increased need for language
training).
4 The vast majority of participants who were students received classroom
training, while more high school graduates received work experience.
4 Blacks and other nonwhite minorities had higher-than-average participation in
59
work experience and training assistance, and were least likely to receive on-the-
job training. (This was probably because blacks and other minorities were not
evenly distributed through the research sample.)
4 Hispanic terminees were more likely to receive OJT than any other group.
4 The younger the participants, the more likely they were to receive classroom
training.
4 Participants with limited English-speaking ability were about as likely to receive
classroom training as those without limitations.
4 Fifty-nine percent of the clients were placed in a job and 17 percent obtained
an employability enhancement. The 24 percent who received another
termination were most likely individuals who dropped out of training.
4 Males were more likely to obtain a job than females.
4 Seasonal workers were more likely to obtain a job than migrants.
4 Among ethnic groups, whites were the most likely to be employed and blacks
the least likely. Hispanic participants had the highest employability
enhancement rate, most likely reflecting their higher participation in language
training, and the lowest negative termination rate.
4 Participants of prime working age (22-44) were the group most likely to be
employed at termination.
4 Regarding wages at termination, males received a higher average hourly wage
than females ($5.30 versus $4.95). White males received the highest average
wage among males ($5.87) and Hispanic males received the lowest ($5.15).
Among females, Hispanic women received the lowest wage ($4.78), and a few
“other” minority females received the highest ($6.45).
4 Seasonal workers averaged about $.40 more per hour than migrants and high
school graduates made more than high school dropouts ($5.37 versus $5.09).
4 Terminees from on-the-job training were more likely to be employed at
termination, although they earned a lower average wage.
4 Terminees from on-the-job training were more likely to retain their jobs at

60
followup and were more likely to have benefits.
The researchers also used multiple regression equations to examine the
relationship between services and outcomes, while holding client characteristics
constant. Their analysis provided information about the likelihood of placement and
wage levels for various client characteristics and services received.
The study also investigated the impact of employability enhancements (entered
non-Section 402 training, returned to full-time school, completed an additional level of
education, completed worksite training objectives, or obtained a basic skills or
occupational skills proficiency) on program design and reviewed the characteristics of
clients who received various employability enhancements. Table 17 summarizes the
type of enhancement obtained, by client characteristics.
Factors Influencing ProgramDesign and Outcomes
The study report reviews several ways in which Federal policies, State and local
level factors, and program resources shaped service design, the operation of classroom
training and on-the-job training, coordination and resource leveraging, and the use of
supportive services.
Among the Federal policies and practices examined were the effect of
performance standards, eligibility guidelines, cost category and funding limits, the
Immigration Reform and Control Act of 1986, and the provision of technical assistance
from the Federal Government.
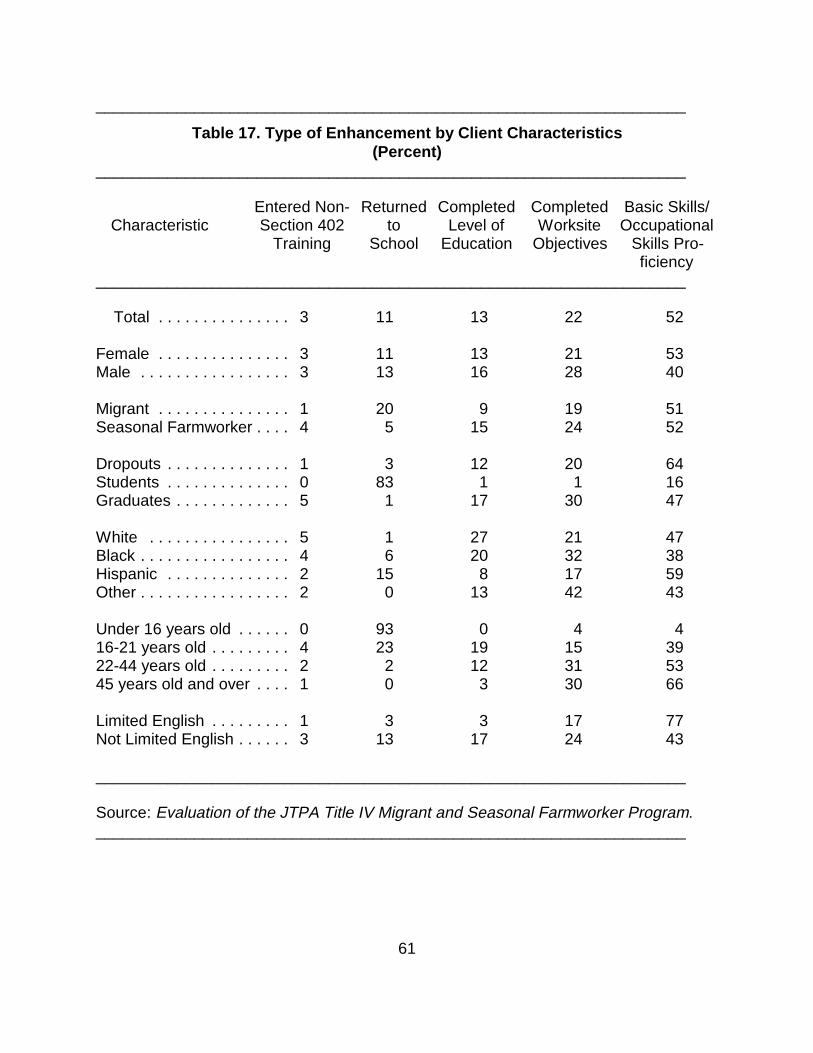
61
__________________________________________________________________
Table 17. Type of Enhancement by Client Characteristics(Percent)
__________________________________________________________________
Entered Non- Returned Completed Completed Basic Skills/Characteristic Section 402 to Level of Worksite Occupational
Training School Education Objectives Skills Pro-ficiency
__________________________________________________________________
Total . . . . . . . . . . . . . . . 3 11 13 22 52
Female . . . . . . . . . . . . . . . 3 11 13 21 53Male . . . . . . . . . . . . . . . . . 3 13 16 28 40
Migrant . . . . . . . . . . . . . . . 1 20 9 19 51Seasonal Farmworker . . . . 4 5 15 24 52
Dropouts . . . . . . . . . . . . . . 1 3 12 20 64Students . . . . . . . . . . . . . . 0 83 1 1 16Graduates . . . . . . . . . . . . . 5 1 17 30 47
White . . . . . . . . . . . . . . . . 5 1 27 21 47Black . . . . . . . . . . . . . . . . . 4 6 20 32 38Hispanic . . . . . . . . . . . . . . 2 15 8 17 59Other . . . . . . . . . . . . . . . . . 2 0 13 42 43
Under 16 years old . . . . . . 0 93 0 4 416-21 years old . . . . . . . . . 4 23 19 15 3922-44 years old . . . . . . . . . 2 2 12 31 5345 years old and over . . . . 1 0 3 30 66
Limited English . . . . . . . . . 1 3 3 17 77Not Limited English . . . . . . 3 13 17 24 43
__________________________________________________________________
Source: Evaluation of the JTPA Title IV Migrant and Seasonal Farmworker Program.__________________________________________________________________

62

63
State and local environmental factors reviewed included the effects of the
agricultural context (i.e., the number and characteristics of farmworkers and the
duration and timing of periods of peak demand for farm labor, variations in race, ethnic
origin, and participant characteristics throughout various geographical areas, limited
English-speaking ability, etc.), and the effects of the nonagricultural context (i.e.,
cyclical economic factors, population density, urban versus. rural concentration of
clients, and the extent and type of training providers and nonagricultural employers in
MSFW service areas). The review of the effect of program resources included the size
of the Section 402 allocation across programs studied, and multistate versus single-
State grantees. Some findings based on the investigation of the above factors are
noted below.
4 Although it was difficult to disentangle specific effects of Federal policies in
designating grantees and allocation levels, all programs admitted that funds met
only a fraction of the need. The overall funding level was usually felt as more of
a constraint than limitations of various cost categories.
4 State and local environments influenced program service designs and
operations, often in ways that were difficult to predict. Client characteristics
varied from region to region and within regions (and sometimes within service
areas). Client flows could be disrupted by unexpected events such as natural
disasters or shifts in weather patterns. Programs in different areas also
operated in different social and economic environments, which influenced the
kinds of programs they designed, the training available, and the eventual
outcomes for their clients.
4 Because programs operate in different environments, no one program design
is appropriate for the country as a whole. Thoughtful planning that considers
and addresses the needs of the particular eligible population in light of the
constraints of the social and economic environment is needed.

64
Recommendations
The study report presents a number of recommendations for actions that could
be taken at the local and Federal levels to further improve the MSFW program. These
recommendations are summarized below.
4 MSFW program resources for employment and training services should be
further focused on the hard-to-serve.
4 Programs should institute specialized recruitment techniques to reach migrant
and hard-to-serve seasonal farmworkers.
4 Programs should use their supportive services-only components as
recruitment devices for employment and training services.
4 Programs should offer a range of basic skills training, preferably in-house or
otherwise tailored.
4 Programs should make available vocational classroom training that is tailored
to the needs of farmworkers.
4 Programs should improve their on-the-job training practices by more carefully
matching clients to available positions, ensuring that reimbursements are used
for extraordinary training costs, and monitoring better the quality of training.
4 The Department of Labor should consider raising or eliminating the current 15
percent cost limit on supportive services only, thus giving programs more
freedom to respond to fluctuating needs. It should also consider whether full-
fledged eligibility determination, including documentation of work history and
income, is necessary for services with low value (e.g., under $50).
4 Programs should reserve the bulk of supportive services-only funds for
migrants away from their homes, and emphasize connections to existing
community resources for seasonal workers.
4 Support for training should be sufficient to allow MSFW clients to maintain
themselves through training.

14M. Burt and B. Cohen, America’s Homeless: Number, Characteristics, andPrograms that Serve Them (Washington, D.C.: Urban Institute, July 1989).
65
4 Programs that contract with providers for services should increase their
oversight to ensure that the needs of farmworkers are being met.
4 Programs should examine their staff qualifications to determine whether the
needs of farmworkers are being met. The Department should continue to
encourage and support capacity-building activities that improve the qualifications
of existing staff.
4 Departmental capacity building and technical assistance efforts should be
expanded to enhance the quality of all facets of the Section 402 program design
and operations.
4 Further clarification needs to be provided to MSFW programs about the
purposes of employability enhancements.
4 The Department of Labor should provide further clarification about whether it
will monitor programs based on the performance relative to standards or relative
to their plans.
4 A system whereby eligibility determination can be transferred across Section
402 programs should be facilitated by the Department of Labor.
JOB TRAINING FOR THE HOMELESS
Overview
A study conducted by the Urban Institute estimated that more than one million
individuals were homeless in the United States at some time during 1987, and that their
number grew rapidly between 1983 and 1987.14 Several factors are contributing to
changes in the size and characteristics of the homeless population. These include:
economic restructuring, which has led to job loss and changing skill requirements; a

15Recent information about the Job Training for the Homeless DemonstrationProgram is presented in Chapter 1 of this volume.
16John W. Trutko et al., Employment and Training For America’s Homeless:Report on the Job Training for the Homeless Demonstration Program (Washington,
66
lack of affordable housing; more restrictive eligibility requirements for welfare and
disability benefits; the deinstitutionalization and lack of mental health care services for
mentally ill persons; and the recent economic recession.
In response to the increase in the number of homeless people throughout the
Nation, Congress enacted the McKinney Homeless Assistance Act (Public Law 100-77)
in 1987. The legislation provides for emergency shelter, food, health care, mental
health care, housing, education, job training, and other community services for the
nation’s homeless. Section 731 of the McKinney Act authorized the Job Training for the
Homeless Demonstration Program (JTHDP). Under this Section, the Department of
Labor was authorized to plan, implement, and evaluate a job training demonstration
program for homeless individuals.15 The demonstration was designed to provide
information and direction for future training efforts for homeless people.
Two supporting goals were to: (1) gain information on how to provide effective
employment and training services for homeless individuals; and (2) learn how States,
local public agencies, private nonprofit organizations, and private businesses can
develop effective systems of coordination to address the causes of homelessness and
meet the needs of these individuals.
A study of JTHDP, which assessed its ability to provide effective employment
and training services to this target population, revealed that it is feasible to establish
programs at the local level to serve a significant minority of the homeless population,
although these programs must offer a wide array of services and form linkages with
other service providers.16

D.C.: James Bell Associates, Inc., 1994).
67
The study report presents an overview of JTHDP’s history; provides information
about participant characteristics (including a description of key subpopulations served
by the program and a comparisons between the JTHDP participant population and the
JTPA population); discusses program design and implementation efforts as well as
services provided and service coordination; presents program and participant
outcomes; and offers several findings, conclusions, and implications. It also contains a
lengthy appendix which includes synopses of JTHDP projects.
Program Background
The study report notes that JTHDP is the first comprehensive nationwide
Federal program specifically designed to train homeless individuals and place them in
jobs. Local projects, which received funds directly from the Department of Labor, may
serve the full spectrum of the homeless population or emphasize assistance to
subgroups within the general homeless population, such as supported work for mentally
ill persons, families with children, single men, single women, or youth.
Grantees were encouraged to collaborate with other Federal, State, and local
programs serving homeless individuals. Although projects were given wide latitude in
how to structure their service delivery, they were required to provide or arrange for the
following services:
4 Outreach, intake, and enrollment;
4 Case management and counseling;
4 Assessment and employability development planning;
4 Necessary alcohol and other drug abuse assessment and counseling with

17For findings from an evaluation of the exploratory phase, see Lawrence N.Bailis, Margaret Blasinsky, Stephanie Chesnutt, and Mark Tecco, Job Training for the
68
referral as appropriate to outpatient and/or inpatient treatment;
4 Other supportive services (e.g., child care, transportation, mental health
assessment/counseling/referral to treatment, other health care services,
motivational skills training, and life skills training);
4 Job training services, including remedial education and basic skills/literacy
instruction; job search assistance and job preparatory training; job counseling;
vocational and occupational skills training; work experience; and on-the-job
training;
4 Job development and placement services;
4 Postplacement followup and support services (e.g., additional job placement
services, training after placement, self-help support groups, and mentoring); and
4 Housing services (e.g., emergency housing assistance, assessment of
housing needs, referrals to appropriate housing alternatives, and development of
strategies to address gaps in the supply of housing for participants).
Although the projects differed in their approach to providing services for the
homeless, a generalized “logic model” was developed in 1989 to help local project
operators and those responsible for monitoring and evaluating project implementation
and outcomes. As Chart 10 illustrates, the logic model incorporates: (1) a “traditional”
sequence of employment and training services; (2) a wide range of supportive services;
and (3) case management which ties services to participant needs.
JTHDP was implemented in three phases. Beginning in September 1988, the
Department of Labor awarded a total of $7.7 million to 32 local grantees to begin the
demonstration, test its feasibility, help shape the direction of its subsequent phases,
and develop a methodology for program evaluation. This “exploratory” phase lasted 12
months (September 1988 through August 1989).17

Homeless: Report on Demonstration’s First Year (Rockville, Md.: R.O.W. Sciences,Inc., 1991). Highlights of this first-year study can be found in the 1994 edition of theTraining and Employment Report of the Secretary of Labor.
69
Two phases followed, which are termed “Phase I” and “Phase II” by the
researchers. Phase I was an extension of the exploratory phase from September 1989
through April 1991. During this period, the Department provided $17 million to fund 45
projects. These projects were selected through a competition from nearly 300
candidate sites (15 of these projects had been funded under the exploratory phase).
Phase II was the result of an initiative (implemented in May 1991) to place greater
emphasis on enrolling adults, provide comprehensive supportive services, increase job
placement and retention, and provide transitional housing during training and
permanent housing after job placement.
Table 18 provides an overview of JTHDP implementation experience and
outcomes, by phase.
70
__________________________________________________________________
Table 18. Overview of JTHDP Implementation Experience and Outcomes, by Phase
__________________________________________________________________
Characteristic/ Exploratory Phase I Phase II TotalOutcome
__________________________________________________________________
Duration . . . . . . . . . . . Sept. 1988- Sept. 1989- May 1991- Sept 1988-Aug. 1989 April 1991 April 1992 April 1992
Funding (in millions) . . . . . . . . $7.7 $17.0 $8.5 $33.2Project sites . . . . . . . . . . . . . . . . 32 45 20 62Number of participants . . . . . 7,396 13,920 6,740 28,056Number trained . . . . . . . . . . 4,600 10,629 4,980 20,209Number placed in employment . . . . . . . . . . . . . 2,435 4,676 2,351 9,462Number of housing upgrades . . . . . . . . . . . . . . . 1,993 4,935 2,847 9,775Percent of participants placed in jobs . . . . . . . . . . . . . 33% 34% 35% 34%Percent of participants placed in jobs who were employed at 13 weeks . . . . . . 40% 43% 53% 44%__________________________________________________________________
Note: There were 62 sites that participated during part or all of the three phases. During Phase I, 15 of 32 exploratory sites were re-funded. In Phase II, 20 of the PhaseI sites were refunded. The Tucson Indian Center was added as a grantee inSeptember 1991 (bringing the total number of JTHDP sites to 63); however, it was notincluded in the analysis because results from the first year of operation were not yetavailable.
Source: Quarterly reports submitted to the Department of Labor’s Employment andTraining Administration by JTHDP sites as reported in Employment and Training ForAmerica’s Homeless: Report on the Job Training for the Homeless DemonstrationProgram.__________________________________________________________________

18The analyses were based on participant-based data collected by JTHDP sitesand entered into a management information system. JTHDP sites participated in thissystem voluntarily. Data were available on 71 percent of the 20,660 participants servedduring Phase I and Phase II.
71
The study report provides a State-by-State listing of JTHDP projects funded
during Phase I and Phase II.
Participant Characteristics
JTHDP was designed to respond to the diversity of the homeless population by
serving a wide spectrum of homeless individuals. A few sites targeted services to
homeless individuals with mental illness or chemical dependency. Some sites also
targeted battered women or families.
Combining statistical information from Phase I and Phase II, the research report
provides an overview of the basic characteristics of JTHDP participants, including their
demographic characteristics, education and employment histories, reasons for
homelessness, and housing situation prior to JTHDP participation. Characteristics of
several homeless subgroups are also provided, along with a comparison of JTHDP
participant characteristics with the general homeless population, and with the Job
Training Partnership Act Title II-A participants.18 Highlights of this analysis follow.
4 Participants ranged in age from 14 to 79; the average age was 32. Fifty-one
percent were between 22 and 34 years of age, and 36 percent were between 35
and 54 years of age.
4 Sixty-five percent were male and 35 percent were female. The higher
proportion of males reflected the generally higher proportion of men within the

19Transitional housing is short-term housing for homeless persons (includinghalfway houses for recovering alcoholics, chemically dependent individuals, and/or ex-offenders) that permits limited length of residency (usually up to 24 months) or housing(including halfway houses) for the mentally, emotionally, or physically disabled thatincludes supportive services, some degree of supervision, and subsidized rent.
72
homeless population in the United States and the greater availability of income
support for women with children through the Aid to Families with Dependent
Children program.
4 Fifty-two percent of the participants were black; 38 percent were white. Other
racial and ethnic groups included persons of Hispanic origin (seven percent),
American Indians and Alaskan Natives (two percent), and Asian/Pacific
Islanders (less than one percent).
4 Sixty-one percent of the participants were single and never married at the time
they entered the program; only about 10 percent were married. About 40
percent had dependent children.
4 Sixty-four percent had completed high school, and 22 percent had completed
one or more years of college.
4 Almost all participants (99 percent) had been employed at some time prior to
their entrance into the program, although only 11 percent were employed at the
time of intake.
4 Two-thirds of the participants had no public- or private-sector health insurance;
about 30 percent received health insurance through government-sponsored
programs.
4 Half of the participants spent the night before they applied for services in a
shelter, and nine percent were living on the street (about 20 percent indicated
they had stayed with a friend or relative, and 13 percent lived in transitional
housing19 facilities). Most of the participants had recently become homeless
prior to entry, although 27 percent had been homeless for more than six months,
and four percent had been homeless for more than four years prior to program
entry.

20Categories are not mutually exclusive. Because participants may cite severalreasons for their homelessness, percentages do not add to 100 percent.
73
4 When asked to identify factors that contributed to their homelessness, 53
percent noted job loss or lack of work, 38 percent were unable to pay rent, 28
percent lacked affordable housing, and 15 percent had been evicted. Also,
fourteen percent cited personal crises, including divorce or termination of a
personal relationship; seven percent noted other disabling conditions including
mental illness; and four percent noted a physical disability as the reason for their
homelessness. Other problems, including family illness (three percent),
termination of public assistance (four percent), loss of housing due to sale or
conversion (two percent), or runaway/transient, (one percent) were also cited.20
4 About 11 percent of the participants were identified as being mentally ill.
4 The largest identifiable participant subgroup, unmarried males, accounted for
59 percent of the participants. Of these, 28 percent were veterans, about one-
fourth had children, 24 percent received State or local general assistance, and
74 percent lacked health insurance.
4 About one-fourth of the participants were part of an entire family that was
homeless. Seventy-four percent of these individuals were under 35 years of age
and 82 percent were female.
Because it is difficult to estimate the size and composition of the Nation’s
homeless population, the researchers developed a national probability-based sample of
1,704 homeless adults who used either soup kitchens or shelters in cities with
populations of 100,000 or more during a seven-day period to identify differences
between the characteristics of the individuals who were served through the program
and the homeless population in general. Substantial differences were found. Although
men constituted a majority of both groups (81 percent of the shelter and meal program
users were men compared to 65 percent of JTHDP participants), program participants
were generally younger, somewhat more likely to be black, and better educated. In

74
addition, users of soup kitchens and shelters in the sample had been homeless an
average of 39 months (with 21 percent having been homeless for less than four
months). Participants in JTHDP, on the other hand, had been homeless for an average
of only nine months, with 61 percent having been homeless less than four months.
In comparing the characteristics of the JTHDP population with adult JTPA
participants, the researchers found that their characteristics were much more like those
of the homeless individuals served under JTPA rather than the characteristics of the
general homeless population.
Program Design, Implementation,Services, and Coordination
Programs that serve the homeless often face individuals with multiple barriers to
attaining economic self-sufficiency. Service mix and delivery strategies, the sequence
of training, and coordination with other service providers, are important aspects of
program design and implementation for this population group. The research report
describes and assesses services and coordination strategies employed by the JTHDP
sites to meet the diverse employment and training needs of homeless individuals.
In the area of program design, the report notes that JTHDP grantees
represented a wide range of organizations, including JTPA Service Delivery Areas,
mental health organizations, shelters, agencies operated under city governments,
community action committees, and education agencies. These organizations used a
variety of approaches in their attempt to help homeless individuals attain economic self-
sufficiency. Although numerous approaches were found in the investigation of the
various program sites, certain design elements were common to most Phase I and
Phase II projects. These were:
4 Extensive case management (a client-centered, goal-oriented process for

75
assessing clients’ service needs and helping them to obtain those services by
promoting participant self-sufficiency, self-determination, and guided self-help),
as the means through which program services were tailored to meet individual
client needs;
4 Availability of remedial and basic skills training;
4 Provision of vocational/occupational skills training;
4 Availability of a wide variety of supportive services;
4 Provision of placement and post-placement services, with a growing emphasis
on post-placement services as a key to job retention, housing retention, and
long-term stability;
4 Availability of shelter placements, transitional housing placements, and
assistance in securing permanent housing, with increasingly formal housing
linkages during Phase II; and
4 Extensive coordination with community agencies—sometimes on an agency-
by-agency basis and sometimes through coordinated, community-wide systems
of linkages—with an increasing tendency toward the latter approach in Phase II
sites.
The researchers also point out that several sites modified their programs as they
gained experience in serving homeless individuals. Examples of these changes
included more systematic outreach strategies (e.g., regularly scheduled visits to
shelters and referrals from other homeless-serving agencies), the use of more reliable
and valid assessment tools and practices (especially as they relate to mental health and
chemical dependence problems), and a shift from sequential service delivery systems
to systems that were more tailored to participant needs.
In the area of program services, the research report points out that in addition to
basic training and employment activities, JTHDP sites supplemented their services to
include case management, housing services, and supportive services. The study report
provides findings in six key areas related to program services: (1) initial services

76
(outreach, intake, and assessment); (2) case management; (3) education and training
services; (4) job development, placement, and postplacement services; (5) housing
services; and (6) supportive services. Highlights of each of these areas are provided
below.
Initial Services
Traditional outreach efforts (recruiting interested persons, identifying appropriate
clients, and assessing training and service needs) were challenging because of the
transiency of homeless people and their often tenuous ties with community agencies.
Approaches used to find this special population group included word of mouth, posters,
weekly trips to soup kitchens and shelters, and linkages with halfway houses. As
programs became more established, they developed more extensive referral networks
with homeless-serving agencies. As programs matured, many reported deemphasizing
individual client outreach in favor of outreach activities aimed at agencies that had
frequent contact with homeless people.
All sites used a standardized intake process, and most used some form of
standardized assessment procedure which usually included tests of vocational aptitude
or preference, education and basic skill levels, and mental or physical health. By Phase
II, at least half of the sites had intensified their assessment of drug and alcohol use
through interviews, meetings with substance abuse counselors, and/or formal
assessment instruments.
Case Management
All 20 Phase II sites and all but one of the 45 Phase I sites used some form of
case management, although local definitions of case management varied widely.

77
There was general agreement that case management systems hinged upon
participants having a single case plan (Employability Development Plan) and that trust-
building and coordination among involved staff and agencies were critical when
participants had more than one case manager. By Phase II, in most sites, case
managers were maintaining regular contact with their participants at least weekly or bi-
weekly. The average caseload during Phase II ranged from 15 to 30 active cases per
manager.
Education and Training Services
Although all sites provided remedial education and basic skills/literacy training,
relatively few participants expressed a preference for such training. Most of the
participants were interested in moving as quickly as possible to secure a job. Sites
used a combination of direct service and referral to make educational services more
available, and some sites made educational services a prerequisite for skills training
and encouraged all high school dropouts to obtain their General Equivalency Degree.
The most frequently requested and used training services were job search
assistance, job preparatory training, and job counseling. Vocational and occupational
skills training included both short- and longer-term training and typically incorporated
classroom and “hands-on” training. Program participants usually preferred short-term
training.
Work experience was used by eight of the Phase II sites, most often for special
population subgroups such as participants recovering from substance abuse and
mental illness.
Job Development, Placement,and Postplacement

78
Almost half of the Phase II sites designated one or more staff members to work
primarily on job development and placement, and encouraged participants who had
obtained jobs, upon termination from the program, to attend postplacement support
groups. Some Phase II sites directed their efforts toward identifying higher quality job
placements as a way to increase retention, while other sites continued their financial
support services for participants who began working or tied housing upgrades to
continued employment of postprogram participants.
In 15 of the Phase II sites, case managers or job counselors maintained contact
with employed participants periodically for 13 weeks after they were placed in jobs.
Housing Services
Housing services provided by the JTHDP sites included operating shelters,
transitional housing, or group homes; referrals to providers of such housing; housing
counseling and home management skills training; financial assistance with move-in
expenses or rent; mediation with landlords; and involvement in affordable housing
development within local communities.
Phase II programs placed a much greater emphasis on housing services than
did Phase I programs (to some extent, this was because of a greater emphasis placed
on this service by the Department of Labor). Encouraged by a memorandum of
understanding between the Department of Labor and the Department of Housing and
Urban Development (HUD), eight Phase II sites developed formal agreements, and
eight others developed informal agreements with their local HUD offices to help provide
housing for program participants.

79
Phase II was also characterized by an increase in the number of sites that hired
housing coordinators or arranged for housing expertise to be available to case
managers and participants.
Supportive Services
Providing homeless individuals with quality training and employment services
required the provision of a flexible array of supportive services. These services were
provided not only through the use of JTHDP funds, but through other Federal or private
funds as well. Sites also used cooperative agreements, referral networks, and other
strategies to meet participant needs.
Transportation was the most commonly provided support service. In addition,
over three-quarters of the projects in both phases offered training or counseling aimed
at increasing participant self-esteem, chemical dependence counseling or treatment,
and health care. During both phases, about three-fourths of the sites provided clothing,
and about half provided tools, work equipment, and special work clothing. About 60
percent offered hygiene products and services.
About 70 percent of the sites in both phases offered or arranged for child care.
Some sites made available other supportive services such as mental health counseling,
telephone services or voice mail, help in obtaining drivers’ licenses and other
identification, and vocational rehabilitation services. Most sites provided some degree
of life skills training, often emphasizing money management.
Coordination and Linkages
The research report discusses the importance of coordination and linkages

80
among various programs that can help homeless individuals, describes the scope and
characteristics of JTHDP linkages, and reviews the barriers to service coordination that
occurred in some program sites. Highlights of the findings are noted below.
4 The Department of Labor requirement that sites establish housing intervention
strategies strengthened housing linkages for some of the projects that were
operated by job training agencies. (A number of projects had discerned this
need early on and moved to develop them in Phase I.)
4 Although there was great variety among the sites in the intensity and types of
services provided through linkages with other organizations, all Phase I and
Phase II sites established linkages. In both phases of the program, the most
common types of services provided through linkages with other agencies were
supportive services and housing. About 90 percent of the sites during both
phases provided some training services through linkages with other service
providers. At least 11 of these arrangements involved Private Industry Councils
or the JTPA Service Delivery Area.
4 Barriers to service coordination generally involved legal requirements,
administrative arrangements, and other factors such as “turf” or personality
issues. Administrative barriers included difficulty in working with staff from other
agencies, local implications of the Department of Labor/Housing and Urban
Development memorandum of understanding (some housing agencies were not
aware of the document and some were not able to negotiate agreements with
JTHDP grantees because of federal and local requirements that gave priority to
specific groups of homeless individuals), the amount of time required to plan and
implement coordination, high staff turnover, and lack of political support from
local elected officials and other community leaders.
Program and ParticipantOutcomes
The study report analyzes program outcomes based on aggregate site-level

21Because grantees collected limited participant-level data during the exploratoryphase, only Phase I and II data were analyzed in the research report. Outcomes fromthe exploratory phase can be found in Job Training for Homeless: Report onDemonstration’s First Year, which is summarized in the 1994 edition of the Training andEmployment Report of the Secretary of Labor.
22The remaining 24 percent did not receive training services, but did receivesupport, placement/postplacement, housing, and/or information and referral services.
81
data, and provides a more in-depth analysis of outcomes based on participant-level
data (analyzing outcomes by type of client and type of obstacles faced in gaining
employment).
Site-Level Analysis
Over the two and a half year period of Phases I and II, the program served
20,660 homeless individuals.21 As Chart 11 shows, of those served, 76 percent (15,609
participants) received at least one training service22; 34 percent (7,027 participants)
obtained jobs; and 38 percent (7,782 participants) obtained upgraded housing. Of the
7,027 participants who obtained employment, 46 percent (3,232 participants) were still
employed 13 weeks after their initial job placement.
Participants who received training services received an average of about nine
weeks of these services during both phases.
The average hourly wage at placement was $5.09 for the two phases combined.
Three occupational categories accounted for 70 percent of job placements

23Defined as manual occupations generally not requiring specialized training(e.g., car washers and garage laborers).
82
during Phases I and II: service workers (37 percent); laborer positions23 (21 percent);
and office/clerical positions (13 percent). Most of these positions required low skill
levels. Of the remaining six occupational categories, two—operatives (e.g., truck
drivers and electronic assemblers) and sales positions—accounted for 14 percent of
the placements. The moderate- to high-skilled jobs, including craft workers (e.g.,
electricians and plumbers), professionals, technicians, and officials/managers,
accounted for the remaining 15 percent of placements. The occupational categories of
participants are shown in Chart 12. The study report points out that the relatively high
proportion of job placements in low-skilled positions appeared to be the result of low
levels of skills that many homeless participants brought to the program and their urgent
need to find a job.
The percentage of those placed in jobs, who were employed 13 weeks later,
increased between Phase I (43 percent) and Phase II (53 percent). The researchers
suggest that this was the result of experience gained during Phase I. Of those
employed 13 weeks after program termination, the average hourly wage was $6.47
(both phases combined).
There was an increase in the percentage of participants who upgraded their
housing from Phase I (35 percent) to Phase II (42 percent), suggesting that the
Department of Labor’s emphasis during Phase II, on sites establishing strategies for
their participants to secure transitional and permanent housing, had a positive impact.
The average training cost per participant for both phases of the program was
$1,342. There was virtually no change in the average training cost between Phase I
and Phase II, and the average cost per job placement was $2,982 for both phases
combined.

83
Participant-Level Analysis
In analyzing program outcomes based on participant-level data, the researchers
note that, although data were available for only 71 percent of program participants,
participant-level data closely matched site-level data on key outcome measures. Key
findings of the participant-level analysis are highlighted below.
4 Long-term homeless participants—a group that might have been considered
relatively “hard-to-serve”—had a placement rate of 32 percent, which was only
slightly below the 35 percent average for all participants.
4 There were some notable differences in placement rates by participant
characteristics. JTHDP participants were somewhat more likely to be placed if
they were over 22 years of age, male, white, nondisabled veterans, more highly
educated, employed at the time of intake to JTHDP, earned some wage income
during the six months preceding intake, had private health insurance at the time
of intake, lived in transitional housing rather than on the street at time of intake,
and were homeless less than six months prior to intake.
4 Mentally ill participants and participants who were homeless for at least six
months or longer had the lowest placement rates among the subgroups profiled,
although these placement rates were only slightly below the 35 percent average
for all participants. (Some mentally ill participants were involved in “supported
work.”)
4 There were relatively minor differences in employment retention rates (the
percentage of individuals placed who were employed 13 weeks later) across
participant characteristics and subgroups, although participants were more likely
to be employed 13 weeks after initial termination if they were female, had
dependent children, were employed at the time of JTHDP intake, had private
health insurance, Medicaid, or Medicare at the time of intake, lived in transitional
housing at the time of intake rather than on the street, and were homeless one
year or less prior to intake.

84
4 Twenty-six percent of program participants, during both phases combined, had
secured permanent housing when last contacted by program staff. In
comparison to their housing status at intake, participants were substantially less
likely to be housed in shelters, less likely to be on the street, less likely to be
living with friends or relatives, and more likely to be in transitional housing.
Findings, Implications,and Recommendations
The study report presents several findings relating to the design of effective
employment and training services for homeless individuals. These are:
4 Employment and training programs can successfully serve a wide spectrum of
the homeless population.
4 A wide variety of public and private agencies can successfully establish and
operate employment and training programs for homeless individuals.
4 Programs for homeless persons must offer a wide array of services (including
housing services), often requiring linkages with other service providers.
4 Programs serving homeless individuals require comprehensive assessment
and ongoing case management.
4 Employment and training programs for homeless persons need to provide
short-term job search/placement services.
4 Long-term followup and support is needed to effectively serve homeless
persons.
4 JTHDP suggests that over one-third of homeless participants in a mature
national employment and training program would be likely to secure jobs, and
nearly half of those securing jobs would be likely to be employed 13 weeks later.
4 JTHDP suggests that about 40 percent of homeless participants in a mature
national employment and training program would be likely to upgrade their

85
housing, and about one-fourth would secure permanent housing.
4 Average training and placements costs for employment and training programs
for the homeless are likely to vary substantially across sites depending upon the
types of participants served and types of training provided.
Based on the study’s findings, the researchers offer several implications, which
are summarized below.
4 Implication #1. Access of America’s homeless persons to employment and
training services through JTPA Title II-A could be enhanced. Strategies that
JTPA Service Delivery Areas should consider in order to increase the number of
homeless individuals served and ensure effective service delivery include:
expanding outreach and recruitment practices to include linkages with homeless-
serving agencies; incorporating a housing intervention strategy into JTPA
programs; expanding their current coordination arrangements to ensure that
homeless participants have access to a wide range of support services; seeking
State incentive grant set-asides to enhance their ability to meet the various
needs of homeless people; and providing additional training to their staff and to
their service providers on the needs of homeless people.
4 Implication #2. Encourage programs to use a long-term job retention and
housing strategy. Some strategies available to strengthen retention and followup
include: life skills and housing management skills training; regular postplacement
contact of case managers with participants to identify and rectify problems early;
mentoring programs; postplacement support groups at which attendance is
encouraged; and continued referral to and provision of supportive services as
needed during the followup period.
4 Implication #3. Extend the period for tracking employment and housing
outcomes.
4 Implication #4. Encourage local housing authorities to target participants for
transitional and permanent housing opportunities.
4 Implication #5. When funding permits, provide multi-year grants to successful

24Supported employment is premised on the belief that manypersons who are traditionally in sheltered workshops or who areconsidered unable to benefit from rehabilitation services canperform substantial work in regular work sites if given thenecessary long-term support. Three basic models of supportedemployment have been developed. In the “individual placement”model, individuals with severe disabilities are placed in a jobin which their immediate coworkers are generally persons withoutdisabilities. In this model, a job coach helps the individuallearn the job. In the “enclave” model, two or more persons withsevere disabilities are placed in close proximity in a specifiedpart of the work environment. Supervision is often provided by ajob coach not directly hired by the business. In the “work crew”model, two or more individuals with disabilities are transportedto an employment site for special tasks. After completing theirwork, they are transported to another site. A job coach mayoften accompany each crew.
86
programs.
HELPING YOUTH WITH DISABILITIES MOVE FROM SCHOOL TO WORK
Overview
The number of individuals who receive public income support because they have
a disability that prohibits them from succeeding in the labor market continues to
increase. As a consequence, “supported employment” efforts for these individuals
have grown in recent years.24
Based on reports from 42 States, it has been estimated that the number of

87
supported employment participants nationwide during in FY 1991 was slightly over
90,000–approximately 15,000 higher than the previous year and almost triple the
number of participants in 1988. Most of these individuals had a primary diagnosis of
mental retardation (62.8 percent) or mental illness (22.2 percent).
However, initial reports on the success of traditional supported employment
practices have been mixed. Scattered information, mostly from a few sites, indicates
that although supported employment using a job coach tends to substantially increase
the earnings of workers with severe disabilities, the cost of this effort, when compared
to sheltered workshops, tends to exceed the increase in participant earnings.
A new model for providing supported employment services for individuals with
very severe disabilities evolved in the mid-1980s. Described as the “natural supports”
model, it differs from previous models in that it was designed to rely on supervisors, co-
workers, family members, friends, and other work-site and nonwork-site personnel to
provide the training and supervision needed to help individuals with disabilities perform
satisfactorily on their jobs.
Rather than using job coaches who train the employees and/or work with them
until they are capable of doing the job on their own, the natural supports model uses
“employment facilitators” to work with the employee’s supervisors, co-workers, company
human resources staff, and other company personnel to show them how to train and
supervise workers with disabilities. The facilitators also work with the families of
persons with severe disabilities. They may also help other community resources (such
as bus drivers) in assisting people with disabilities.
In 1992, the Departments of Labor and Health and Human Services began
supporting a five-year demonstration to develop model school-to-work transition
programs that emphasize natural support systems and expand opportunities for
competitive, compensated employment for youth with moderate to severe disabilities.

88
Total funding for the project is $1.5 million per year (one-half provided by the
Department of Labor and the other half provided by the Department of Health and
Human Services). Projects are operating in six States.
The projects demonstrate techniques for combining educational services and
vocational support to enable students with severe disabilities to make the transition
from school to regular work. They make use of natural supports that are available for
training and supporting all workers. Projects are successful if they achieve this
objective and are adopted by schools, adult service providers, vocational rehabilitation
agencies, and other organizations that have an influence on the transition of students
with severe disabilities from school to work.
Several requirements are placed on the demonstration sites. These are noted
below.
4 They must combine two interacting activities–transition from school to work
and employment in community-based regular job sites.
4 They must target students with severe disabilities ages 13 to 25. Eighty
percent of the funds must be used to help students 16 years of age and over.
4 Individual Transition Plans (ITPs) must be developed for each student assisted
by the project (these plans must be coordinated with the Individualized
Education Plans (IEPs) which are required for students with disabilities and
include plans to provide individuals with all benefits to which they are entitled).
4 As part of the transition process, students with disabilities must be placed on a
variety of naturally supported jobs in regular employment sites while in school.
4 After leaving the school system, students must be placed in jobs using natural
supports and maintain the job placement.
4 Although the projects need not provide all supports required by students, they
must combine the resources and expertise of a wide range of organizations
(e.g., the school system, traditional adult service providers, the Supplemental
Security Income (SSI) program, JTPA services, vocational rehabilitation

25Rima Azzam, Ronald Conley, and Arthur Mitchell, Evaluationof Transition to Work Demonstration Projects Using a NaturalSupports Model (Washington, D.C.: Pelavin Research Institute,1995).
89
agencies, employers, and others).
4 Project accomplishments and procedures must be disseminated.
An evaluation of the early years of demonstration effort revealed that almost all
individuals with severe mental retardation or other developmental disabilities were
capable of working in an employment environment with natural supports.25
The study report discusses the background and purpose of the evaluation effort;
describes the project sites, structures, goals, and expectations; provides information
about support services and coordination; outlines the demonstration’s
accomplishments; discusses the project’s costs; notes barriers and problems
encountered; describes capacity-building efforts, the continuity of services, and
changes to existing systems; and presents a number of findings and issues related to
future directions of similar efforts. The publication’s appendix provides additional
information obtained through interviews at the various demonstration sites.
The Demonstration Projects
Six projects, located in California, Maryland, Massachusetts, Minnesota, New
Hampshire, and Oregon are being funded. In two cases, awards were made solely to
university-based organizations (New Hampshire and Oregon). In two other projects,
awards were made to a consortium that includes both a university and a private
nonprofit firm (California and Massachusetts). In the remaining two sites, grants were
awarded to projects that involve private nonprofit organizations (Maryland and

90
Minnesota). A brief overview of each of these projects follows.
California
The natural supports project operated by the San Francisco State University
Foundation of California (SFSUF) is located in the School of Special Education. Two
major subcontractors are also involved; San Diego State University Foundation
(SDSUF) and Integrated Resources Institute (IRI) in Orange County. IRI has extensive
experience with natural supports. The project operates in San Francisco and San
Diego.
In San Francisco, the project’s three employees work closely with the transition
coordinators of two local school districts, who are primarily responsible for finding jobs
for students with severe disabilities. Project staff also work with four special education
teachers in three high schools in San Francisco and with five adult service agencies in
the area that support employment for persons with severe disabilities. Similar
procedures have also been implemented in San Diego.
In addition to assisting students to work in naturally supported jobs, the project
seeks to improve the community living and social skills of the students. Through
student centered planning, the social networks of the students are reviewed and ideas
for improvement (based on the students’ interests) are examined.
Maryland
The grant award in Maryland was made to a nonprofit job development and
placement agency which serves as a facilitator rather than a provider of services. Staff
include a peer advocacy facilitator, four employment facilitators, and a clerk. The

91
grantee subcontracts activities to an adult service agency. Two job developers were
hired specifically for the project. The project expands existing partnerships that have
been established by the grant recipient and a local public school system, the
Montgomery County Private Industry Council, local advocacy groups, a foundation,
employers, and adult service providers.
The primary goal of the Maryland project is to develop and implement a
comprehensive system that promotes the successful school-to-adult life transition of
200 youth and young adults with moderate, severe, or multiple disabilities. The project
emphasizes developing peer supports among school students (i.e., students without
disabilities assist students with disabilities with their school work and in other ways to
help them participate in the school environment).
Massachusetts
The Institute for Community Inclusion, a joint venture of the University of
Massachusetts at Boston and Children’s Hospital Boston, was the primary grantee for
the Massachusetts project. The Institute works with six school districts and matches
each with an adult service provider.
Project staff work with the schools and the service providers to develop improved
school-to-work transition procedures. They also develop community-based jobs with
natural supports. Adult service provider staff train supervisors and co-workers.
Employers are contacted and offered training and other assistance to help them
employ workers with disabilities using natural supports. This training generally involves
educating the co-workers on how to modify and demonstrate work-related tasks and
how to communicate with the new employees with severe disabilities. Project staff
usually train adult service providers who, in turn, train employers and co-workers.

92
The Massachusetts project seeks to develop a comprehensive model to help
students with disabilities make the transition from school to work and adult life using
natural supports. The project is attempting to establish and refine a transition planning
model using demonstration sites and a broad dissemination plan that includes training,
technical assistance, outreach through conference presentations and publications, and
the development of monographs and manuals that illustrate effective model
procedures.
Minnesota
A statewide nonprofit organization, the Parent Advocacy Coalition for
Educational Rights, received grant funds in Minnesota. The organization provides
workshops, individual advocacy assistance, and written information to individuals with
disabilities and their families.
The Minnesota project focuses on promoting employment with natural supports
at both individual and system levels. Three agencies with long histories of providing
supported employment opportunities for adults with disabilities received a subcontract
from the grant recipient to help develop career plans and supported employment with
natural supports for project participants.
The adult service agencies provide services directly to project participants. They
also provide technical assistance to school staff on career planning, job development,
and job support. Each of the agencies hires job developers and job coaches to work
directly with the school districts. Once a job developer has located and arranged a job
for students, job coaches provide ongoing training and assistance to the school, co-
workers, and employers until the natural supports are in place.

93
The Minnesota project identifies and demonstrates strategies that promote
permanent competitive employment using natural supports for students in the process
of making the transition from school to work. It also promotes work integration and job
satisfaction, and increases the involvement of students and their families in developing
employment opportunities with natural supports.
New Hampshire
The University of New Hampshire was the grant recipient in this project, which
operates in six areas in the State. In each of these areas, the project works with high
school educators and local adult service providers to facilitate the use of natural
supports. (Most of the project’s resources are concentrated in one school district.)
The project also features subcontracts with adult service agencies and schools
for additional support. Project staff work closely with the State vocational rehabilitation
counselor at each site, and, in a few cases, with local mental health agencies.
Few direct services are provided. Rather, project staff provide technical
assistance and training to schools, employers, and adult service providers on
implementing the natural supports model.
The project attempts to change the school-to-work transition process used by
schools for students with disabilities by developing a system of career planning and
preparation that involves after school and weekend jobs along with access to vocational
education classes for students with disabilities.
Oregon
The University of Oregon’s Specialized Training Program was awarded the

94
project grant in that State. Project staff serve primarily as facilitators and trainers. They
work with businesses, schools, school districts, trade associations, and school-business
partnerships to help them develop their capacity to implement a natural supports model.
Staff focus on training school staff and employers rather than on students. The project
emphasizes work place analysis in which project staff attempt to change the culture and
attitudes of the work place and help co-workers learn how to provide training and other
supports necessary for workers with severe disabilities.
Of all of the projects, the Oregon project has developed the least intrusive
approach for helping students with disabilities make the transition to unsubsidized
employment. It also focuses on students with the most severe disabilities.
Support Services and Coordination
The study report describes the types of support services provided by the projects
and discusses how the various organizations involved coordinate project components.
School-based assistance, work-based assistance (e.g., job experience, job placement,
and transition out of the school system), and various student support services (e.g.,
housing, the inclusion of students with severe disabilities in classes with nondisabled
students, student and family counseling, and parent counseling) are discussed. The
authors offer several conclusions based on their investigation of support services and
program coordination. These include:
4 Vocational rehabilitation agencies were not heavily involved in the vocational
services provided to transition students in any of the projects except in New
Hampshire, where the agency was the primary adult agency involved with the
schools. All sites did, however, receive some vocational rehabilitation agency
funding or vocational services.
4 There was usually an effort to place students as clients of traditional adult
agencies after leaving school.

95
4 After students left school, they were generally accepted as clients by either
vocational rehabilitation agencies or mental retardation/developmental
disabilities agencies. They were generally not accepted by both agencies.
4 In all sites, the school system was financially responsible for providing services
to students with disabilities until the age of 22. (In most cases, traditional adult
service agencies do not fund any services for students with disabilities until after
they leave school.)
4 Mental health agencies rarely provide financial support to project operations.
4 The primary agencies involved in coordination efforts include schools, adult
service providers, and vocational rehabilitation programs.
4 In every site except Minnesota, project personnel frequently work directly with
students with disabilities and their families in developing school programs and
jobs. (This differed from the stated intent of the projects.)
4 Project staff stated that families varied in the extent to which they collaborate
with project personnel to help children with disabilities.
4 Project staff indicated problems in coordinating activities with adult service
providers.
Accomplishments
The researchers point out that as designed, the demonstration projects were
intended to enhance the postschool employment success of students with disabilities.
This can be measured by analyzing their level of earnings, the degree of integration at
the worksite (workers with severe disabilities working with nondisabled employees), the
types of jobs obtained, and the level of worker satisfaction.
The study report describes the numbers and characteristics of individuals served
by the demonstrations; outlines the procedures for selecting participants in the various

96
demonstration sites; provides information about hours of work and earnings; discusses
how jobs for participants were found; describes why employers hired participants;
discusses changes in attitudes of school personnel, parents, adult service providers,
and employers that resulted from project efforts; and provides an overview of alternative
models that could help individuals with severe disabilities.
In summarizing the demonstration’s accomplishments, the researchers point out
that:
4 The six demonstration projects enrolled a total of about 335 individuals with
disabilities (although a greater number of individuals may have participated in
the demonstration).
4 About four-fifths of the participants were 19 or over; about three-fifths were
male. Almost all had mental retardation as a primary disability.
4 The projects attempted to recruit participants with the most severe disabilities.
4 Hours of work were somewhat less than expected for individuals who had left
the school system; most of the participants worked less than half time.
4 The most frequently used method for locating jobs for participants was by
direct calls to potential employment sites. Most respondents interviewed for the
evaluation felt that a more effective method of finding jobs for participants should
be developed.
4 School practices and the attitudes of school personnel changed markedly as a
result of the activities of the six demonstration projects.
4 Most employers indicated that they needed substantial upfront assistance
when employing individuals with severe disabilities.
Project Costs
The researchers point out that obtaining an accurate measure of the costs of the

97
projects using natural supports was difficult because of the multiple organizations
involved (i.e., one would need an accounting of costs incurred by schools, adult service
agencies, projects, employers, parents, and other organizations). However, the report
points out that considerations that should be reviewed when analyzing costs include: (1)
overall costs incurred as a result of the transition from school to work activities; (2)
differences among costs for persons placed in jobs with natural supports; (3) the
benefits of using natural supports versus the costs associated with this effort; and (4)
variances in the ratio of benefits to costs among persons placed in jobs with natural
supports.
The authors describe the importance of costs as a factor in evaluating program
success, and offer the following conclusions:
4 Some of the procedures (e.g., the student centered planning activity)
developed through the projects resulted in some cost increase for school
systems.
4 There was mixed reaction of schools to increased costs; some were moving in
the direction of enhanced services even before the projects, while others would
adopt enhancements only if they were shown to be effective.
4 Most parents reported little expense associated with the projects.
4 Employers believed that costs incurred were relatively minor and were not a
major consideration in their decision to hire and retain workers with disabilities.
4 It is anticipated that costs will be lower in a naturally supported environment for
many students and adults with severe disabilities than they would be in a more
traditional work environment.
4 It is unlikely that empirical data to fully validate observations about program
costs will become available.
Barriers and Challenges

98
The study report points out that if projects such as the transition to work
demonstration effort are to fully succeed, they may need to overcome a number of
potential barriers. These can be divided into two types. First, there are factors directly
related to individuals which may present challenges in achieving program goals (e.g.,
behavior problems or language problems). Second, there may be challenges related to
bringing about long-term system change (e.g., transportation problems or the
reluctance of staff at existing organizations to change from known procedures to new
ones). Some of these challenges are noted below.
4 Inability to maintain gainful employment with natural supports.
4 Locating suitable jobs for individuals with disabilities.
4 Behavioral problems (i.e., a small number of participants may not fit well into
the work environment because of threatening behavior, unwillingness to follow
directions, etc.).
4 Successfully placing individuals with multiple disabilities (e.g., the existence of
physical as well as mental disabilities).
4 Adult service provider funding issues (e.g., insufficient funds to support the
level of services required, lack of incentives for adult providers to begin assisting
students with disabilities until they leave the school system, etc.).
4 Family reluctance to use natural supports for their children.
4 Skepticism of some adult service providers regarding the natural support
method.
4 Transportation problems.
4 Over dependence on job coaches.
4 Work disincentives (i.e., the belief that a reduction in public support payments
will occur as income rises).
4 Employer and adult service agency staff turnover (making it necessary to
reestablish natural supports).
4 Other barriers such as language barriers, lack of career plans, certain family
99
problems, personal hygiene, personal maturity, lack of knowledge about how
service systems work, and co-worker attitudes.
The study report also discusses several issues related to the requirement of a
strong JTPA component that must be incorporated into the demonstration projects.
State and local JTPA Service Delivery Areas, Private Industry Councils, and other JTPA
organizations must participate in the project’s initiatives. The authors note that there
were substantial efforts made by the project sites to work with JTPA including
participation in advisory panels, the use of JTPA funds to support employment of
students with disabilities at all sites, and extensive discussions with JTPA staff at the
local and State levels on methods of involving JTPA in the transition projects.
In general, however, JTPA programs were not seen as a major resource to the
projects. Challenges associated with making better use of the JTPA program that were
reported by project staff included:
4 JTPA performance standards may have created disincentives for local JTPA
programs to provide services to individuals whose earnings were expected to be
very low.
4 Excessive paperwork involved in working with the JTPA system and difficulties
associated with ensuring that program participants were qualified as JTPA
recipients.
4 Differences in target populations.
4 Limited availability of JTPA funds.
4 Differences in procedures; JTPA service providers tended to attempt to
employ groups of workers rather than individuals.
4 A decreased need for JTPA services once participants obtained jobs and no
longer needed wage subsidies.
The authors also point out that uncertainties regarding future funding for the
project may have resulted in the loss of key personnel and the reduction of project

100
expansion plans and evaluation activities.
Capacity-Building, Continuity ofServices, and Systems Change
The study report points out that because the projects were not expected to
continue indefinitely, their effectiveness must be measured by the extent to which the
changes that they bring about among school systems, State and local mental
retardation and developmental disability agencies, State and local mental health and
other agencies, adult service providers, the vocational rehabilitation system, parents,
employers, and others remain after the demonstration has ended. Based on the
project’s evaluation, the researchers found that:
4 The projects had a significant impact on individuals in a limited number of
firms, schools, and adult service providers.
4 Although schools involved with the project made use of improved transition
procedures that were stimulated by the project, these procedures had not yet
been extended to all students in any one site.
4 All of the project sites had an ongoing and long-standing commitment to
serving individuals with severe disabilities and all sites (except Minnesota) had
an ongoing and long-standing commitment to enabling persons with disabilities
to obtain integrated employment using natural supports. Staff involved with the
projects plan to use other grant funds and other sources of support to continue
to work in this area once the original project funding ends.
4 Each project has developed training materials and guidelines for program
activities which will continue to be available to schools and to adult service
providers.
4 Although all of the projects worked closely with selected school sites and adult
service providers, the lack of a systemwide policy commitment and the time and
resource costs associated with transition procedures may adversely affect

101
capacity build up in the future.
4 Without the continued stimulus provided by the project in gaining support for
changes in transition to work practices in school districts and with adult service
providers, the gains that have been made by the project might not be fully
maintained.
Future Directions
Following are some of the more important conclusions drawn from the
information gathered during the site visits and in materials reviewed for the project’s
evaluation.
4 Almost all persons with severe mental retardation or other developmental
disabilities are capable of working in integrated employment with natural
supports.
4 The jobs in which students were placed after leaving school often fell short of
what should be achieved. Most jobs had few hours and, in a few cases,
individuals were hired because of the willingness of the employer to perform a
“public service” rather than based on the economic benefits to be received from
hiring the individuals.
4 There are a number of obstacles associated with fully implementing a natural
supports approach to providing jobs for persons with severe disabilities. These
include difficulties in identifying appropriate jobs; inappropriate behavior on the
part of some students with severe disabilities, challenges associated with
multiple disabilities, certain funding procedures for some of the organizations
involved, skepticism about the naturally supported employment model,
transportation difficulties, staff turnover, work disincentives associated with
public income support and health care financing, and lack of experience among
some job developers or employment facilitators.
4 Services provided by vocational rehabilitation agencies, schools, adult service

102
providers, and various agencies must be coordinated in an effort to help
students with severe disabilities make the transition from school to work.
4 The projects had an impact on the practices of schools and some adult service
providers.
Because methods of improving educational procedures for individuals with
severe disabilities and for enabling them to participate in meaningful employment are
changing rapidly, the authors suggest that a number of questions need to be
considered as these efforts progress. These are noted below.
4 Is the use of natural supports a viable method for assisting individuals with
severe disabilities to become employed?
4 Should the use of natural supports for individuals with severe disabilities be
significantly expanded?
4 Should all students with severe disabilities be offered integrated employment
with natural supports when they leave the school system?
4 Should students with disabilities be offered the experience of working in a
workshop?
4 For students slated to move into employment with natural supports, should
their initial vocational experiences always be based on jobs with natural
supports?
4 How can more and improved job opportunities with natural supports be made
available to individuals with severe disabilities?
4 How can funding arrangements with adult service providers and State
vocational rehabilitation agencies be modified to encourage (or at least not
discourage) the provision of natural supports?
4 What changes need to be made in the school systems to encourage the use
of natural supports?
4 What changes need to be made by adult service providers to encourage the
use of natural supports?

26For additional information about recent efforts to helpimmigrants enter the labor force, see Vicki Asakura and DavidSnedeker, Immigration Demonstration Grant Final Evaluation Report(Seattle, Wash.: Seattle-King County Private Industry Council,1995) which is summarized in this chapter of the Training andEmployment Report of the Secretary of Labor.
103
4 How can greater coordination among the different agencies serving students
with disabilities be achieved?
4 How can transportation problems be reduced?
4 How can work disincentives be reduced?
4 How can parents be more involved in planning efforts to assist their children
with disabilities?
4 How can the JTPA program increase its role in the transition from school to
work for students with severe disabilities?
4 What evaluation strategies should be instituted?
INTEGRATING TRAINING AND EMPLOYMENT SERVICES FOR IMMIGRANTS
Overview
Immigrants comprise eight percent of the nation’s workforce–about 15 million
workers. Of these, about six million are of Hispanic origin. The Department of Labor
continued its efforts to obtain information about the best ways to help immigrants
become assimilated into the workforce by supporting the San Diego Immigrant Training
Demonstration Project (IDP). The project targeted Latin American immigrants in North
San Diego County and offered an integrated service model that addressed their needs
for training, employment, English language skills, and supportive services.26
In July 1992, the Department of Labor awarded a 15-month grant to the San
Diego Consortium & Private Industry Council to conduct the IDP through September

27San Diego Immigrant Training Demonstration Project: FinalEvaluation Report, 1992-1994 (San Diego, Calif.: San DiegoConsortium & Private Industry Council, 1995).
104
1993. The grant was extended through October 1994. The project consisted of a
system of integrated education, training, employment, and social services that
attempted to address the multiple, interrelated barriers to full economic and social
integration typically confronting legal immigrants. The project was based on a
partnership between the San Diego Consortium & Private Industry Council and
SER/JOBS for Progress, Inc. It relied largely on SER’s experience in providing similar
services to the region’s migrant farmworker and day laborer population, primarily in
North San Diego County.
A study of the IDP revealed that from July 1992 through October 1994, 156
individuals were enrolled as project clients and that 117 participants were placed in full-
time employment at an average wage of $5.10 per hour. Furthermore, about 84
percent of these individuals were still employed 13 weeks after placement.27
The study report provides background information about the target population
and the region in which the project operated; discusses the project’s service strategy,
goals, and objectives; describes the IDP’s planned outcomes and performance
standards; provides information about the evaluation’s methodology and sources of
data; discusses the services provided to participants; addresses issues related to
project implementation; offers information about project linkages and coordination
efforts; describes the project’s outcomes; presents various characteristics of the clients
served; discusses overall project effectiveness; and offers a number of conclusions and
recommendations.
Service Strategy, Goals, and Objectives

105
The immediate goal of the IDP demonstration was to help participants achieve
functional English language skills, job skills, and career-track employment. Other
objectives included increasing participants’ basic functional skills, self-esteem, job
retention and job-changing skills, and helping them to maintain safe housing. The
various project goals and their supporting objectives are described in the report.
The system goal was to refine the San Diego model of integrated services to
more effectively address the English language, training, and employment needs of the
Latin American immigrant population. The service goal was to continue to provide the
target population with training and placement opportunities that would help them
successfully participate in the region’s economy. The goal of the evaluation effort was
to build local and national knowledge about which project services were the most
effective in assisting immigrants of Hispanic origin.
The study report offers details of the project’s planned outcomes and
performance standards. As originally envisioned, the project expected to conduct
recruitment efforts and orientation for a total of 620 individuals and provide intake and
assessment services for 200 prospective participants. Program designers anticipated
130 job placements over a two-year period.
Evaluation Methodology
All data and analysis for the project were based on information derived from the
Consortium’s management information system, case files, and interviews with IDP staff
and clients. The evaluation effort attempted to determine if: (1) the type, form,
frequency, and duration of project services contributed to clients’ obtaining and
maintaining stable employment and housing and achieving personal goals; (2) the
implementation of the various project components occurred as planned: (3) the system
of linkages and coordination available to the project’s partners increased the resources

106
available to address the needs of recent immigrants; (4) project outcomes indicated that
the IDP had achieved its goals; (5) clients were representative of the local immigrant
population and if the target population was reached and served; (6) the IDP was cost-
effective compared to other immigrant training and employment programs; and (7)
conclusions could be drawn regarding the effectiveness of the IDP model.
Project Services
The report describes the various project services which included coordination;
outreach, intake, and orientation; assessment and enrollment; case management; job
search assistance; job training; supportive services; job placement efforts; and followup
and postplacement services.
Regarding coordination efforts, the author notes that coordination between the
project partners did contribute to overall success of the IDP.
In the area of outreach, intake, and orientation, the report points out that by the
project’s second year, outreach became unnecessary and was no longer considered a
goal (there was an adequate supply of clients). SER staff conducted weekly orientation
sessions throughout the duration of the project, and enrollment efforts were such that
clients were routinely turned away.
All prospective clients passed through a preliminary screening process to
determine their motivation, physical and emotional capabilities, and willingness and
ability to follow through on case plan objectives. Typical assessment instruments
included a basic skills test, a preemployment survey, and an educational assessment.
After enrollment, clients worked with a case manager to develop an individual service
strategy and to obtain supportive services.

107
Case management represented the cornerstone of IDP services. Case
managers served as counselors, brokers, liaisons, advocates, and role models. They
provided clients with assessment, supportive services, sustained contact, and direction
needed to achieve case plan goals. Case managers were also experienced in serving
the immigrant population.
In the area of job search assistance, all clients were required to attend a one
half-day job search assistance class upon enrollment. They received regular job
counseling after enrollment.
Regarding job training, IDP enrollees were eligible to enroll in local JTPA training
programs administered by the San Diego Consortium & Private Industry Council,
although it was rare for them to enter JTPA training because of their minimal English
language skills and the length of the occupational training (IDP enrollees wanted to
enter the workforce as soon as possible).
Case managers used information obtained from the initial interview and
assessment to determine appropriate supportive services. These included referrals to
emergency shelters or low-cost housing, food, clothing, haircuts or other hygiene
considerations, transportation assistance, child care, tools, uniforms, medical and
dental care, and help with obtaining identification or other documents.
In the area of job placement, the report notes that after two years, the
demonstration had placed 117 enrollees in full-time employment at an average wage of
$5.10 per hour. Eighty-four percent of these individuals were still employed 13 weeks
after placement. Nearly all placements were in manufacturing and service industry
occupations. Major employers included a golf club manufacturer, an automotive parts
producer, a garment manufacturer, and a precast concrete manufacturer.
Followup and postplacement services were provided to clients, although these
108
services were largely voluntary.
Project Implementation
Although no major programmatic changes were made as the program entered its
second year, staff refocused their efforts to ensure effective English-as-a-second
language training. They also strengthened their ties with local employers. The report
points out that the primary cause of attrition during the first year of the project was
excessive enrollments, ineffective assessment procedures, and poor timing (a number
of clients enrolled in the project only to return to their families for the Christmas holiday
period).
The author also notes that the low placement wages achieved by the project
were a reflection of the region’s low prevailing wage structure.
Linkages and Coordination
The demonstration relied on formal linkages with a variety of nonprofit
organizations, city and county agencies, homeless shelters, training providers, and
private sector employers to augment the housing, employment, and in-house services
offered to IDP participants. Eight organizations are listed in the report as key linkages
for the project.
Outcomes
Planned versus actual outcomes for both years of the project are shown in Table

109
19. As the table shows, 156 participants were enrolled and 117 were placed in jobs.
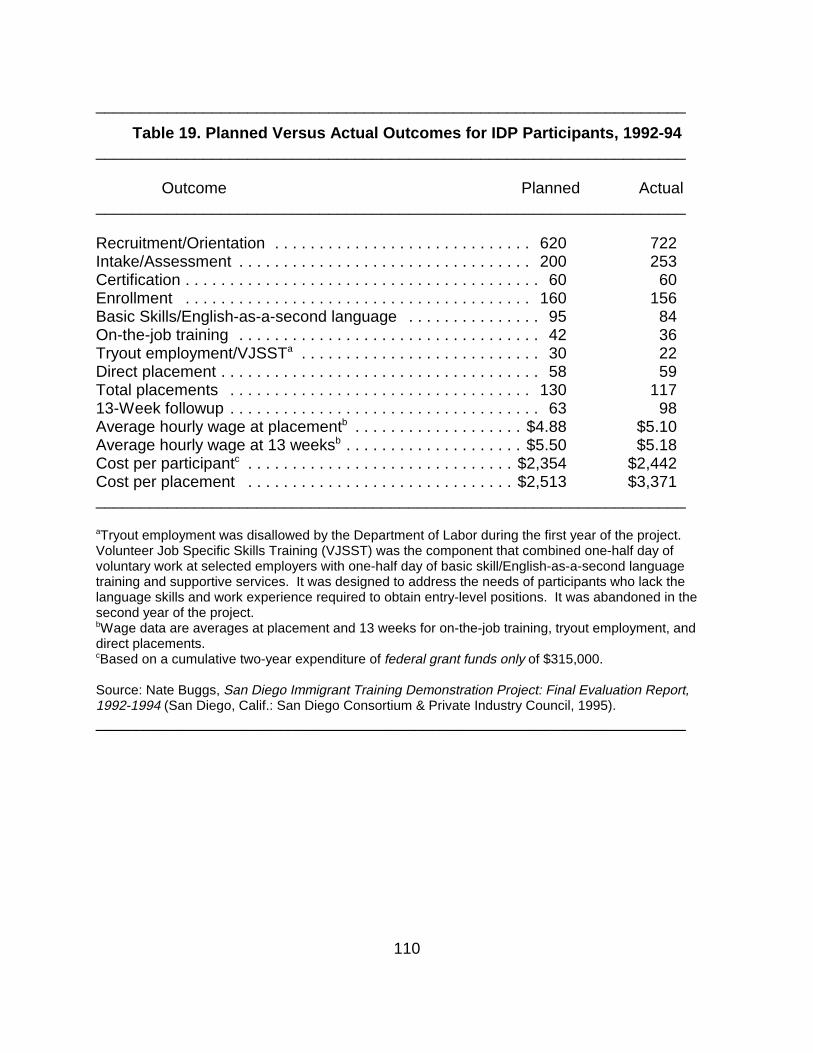
110
__________________________________________________________________
Table 19. Planned Versus Actual Outcomes for IDP Participants, 1992-94__________________________________________________________________
Outcome Planned Actual__________________________________________________________________
Recruitment/Orientation . . . . . . . . . . . . . . . . . . . . . . . . . . . . . 620 722Intake/Assessment . . . . . . . . . . . . . . . . . . . . . . . . . . . . . . . . . 200 253Certification . . . . . . . . . . . . . . . . . . . . . . . . . . . . . . . . . . . . . . . . 60 60Enrollment . . . . . . . . . . . . . . . . . . . . . . . . . . . . . . . . . . . . . . . 160 156Basic Skills/English-as-a-second language . . . . . . . . . . . . . . . 95 84On-the-job training . . . . . . . . . . . . . . . . . . . . . . . . . . . . . . . . . . 42 36Tryout employment/VJSSTa . . . . . . . . . . . . . . . . . . . . . . . . . . . 30 22Direct placement . . . . . . . . . . . . . . . . . . . . . . . . . . . . . . . . . . . . 58 59Total placements . . . . . . . . . . . . . . . . . . . . . . . . . . . . . . . . . . 130 11713-Week followup . . . . . . . . . . . . . . . . . . . . . . . . . . . . . . . . . . . 63 98Average hourly wage at placementb . . . . . . . . . . . . . . . . . . . $4.88 $5.10Average hourly wage at 13 weeksb . . . . . . . . . . . . . . . . . . . . $5.50 $5.18Cost per participantc . . . . . . . . . . . . . . . . . . . . . . . . . . . . . . $2,354 $2,442Cost per placement . . . . . . . . . . . . . . . . . . . . . . . . . . . . . . $2,513 $3,371__________________________________________________________________
aTryout employment was disallowed by the Department of Labor during the first year of the project. Volunteer Job Specific Skills Training (VJSST) was the component that combined one-half day ofvoluntary work at selected employers with one-half day of basic skill/English-as-a-second languagetraining and supportive services. It was designed to address the needs of participants who lack thelanguage skills and work experience required to obtain entry-level positions. It was abandoned in thesecond year of the project.bWage data are averages at placement and 13 weeks for on-the-job training, tryout employment, anddirect placements.cBased on a cumulative two-year expenditure of federal grant funds only of $315,000.
Source: Nate Buggs, San Diego Immigrant Training Demonstration Project: Final Evaluation Report,1992-1994 (San Diego, Calif.: San Diego Consortium & Private Industry Council, 1995).__________________________________________________________________
111
Client Characteristics
The study found that the typical IDP client at intake was 35 years old, an
unattached Hispanic male, educated to the Mexican “primaria” level (roughly grades
one - six), who had been unemployed a little more than six months during the year prior
to enrollment. Additional client characteristics are noted below.
4 A total of 84 enrollees were 30-44 years old and 54 were between the ages of
18-29.
4 Enrollees included 96 men and 60 women.
4 All clients were of Hispanic origin.
4 There were no veterans among the project’s enrollees (although this is not
surprising since they were recent immigrants).
4 About 80 percent of all enrollees had not completed a high school education
or equivalent. Twenty-one had high school degrees or higher.
4 Less than one fourth of all enrollees were single heads of households with
dependents.
4 Seven participants were receiving Aid to Families with Dependent Children
(AFDC) at the time of their enrollment, 14 were receiving unemployment
insurance, and three were receiving food stamps.
4 Fifteen participants were homeless at the time of intake. Most participants
lived either in multifamily apartments or in temporary shelters.
4 Less than 10 percent of all enrollees were employed when they entered the
program.
4 At program intake, 146 of 156 project enrollees were limited English-speaking
and 31 percent were assessed as basic skills deficient or possessing reading
skills below the seventh grade level. About 37 percent lacked significant work
history and six welfare recipients were long-term AFDC recipients.

112
Project Effectiveness
The report describes how well the project achieved its objectives. This
description is summarized below.
4 The combination of IDP services (case management, basic skills and English-
as-a-second language training, on-the-job training, and job search assistance)
did help clients obtain jobs and housing.
4 Most of the project’s performance goals were achieved by the end of the
second year, although not all project services were implemented as planned.
4 The project’s success in placing and retaining its enrollees proved that the
target population, recent immigrants from Latin America, were highly motivated
and ready to accept the responsibility of full-time employment. However, the
same drive to work (fueled by economic necessity) prevented their continued
participation in basic skills training or English-as-a-second language after they
were placed in jobs.
4 The project would not have been possible without the strong linkages among
the partners, public agencies, businesses, and homeless service providers.
4 The IDP model effectively prepared immigrant clients for work and helped
them find entry-level jobs at reasonable wages.
4 IDP clients were representative of the local recent immigration population.
4 The project reached and served its targeted population.
4 Effective client assessment, case management, supportive services, access to
English-as-a-second language instruction at convenient hours, strong ties to
employers, and coordination among partners were the most significant factors in
determining the project’s effectiveness.
4 Inadequate planning, staff turnover, and the lack of access to additional
publicly funded English-as-a-second language classes tended to undermine the

113
project’s effectiveness.
4 The average cost of providing comprehensive training services to an IDP
enrollee was just over $2,000 (federal portion only); the average cost of placing
an IDP enrollee in a job was $2,692. By contrast, the average cost per
placement for the Consortium’s JTPA Title II-A adult programs was
approximately $4,500.
Conclusions and Recommendations
Interviews with IDP participants confirmed that the shift in program emphasis to
English-as-a-second language instruction in the program’s second year was
appropriate. All of the participants interviewed in 1994 cited access to this type of
training as the primary reason for their participation (the promise of employment was a
secondary motivation). Based on this finding and the anticipated increase in the
number of immigrants in need of English language training, the author recommends
that the Department of Labor and other Federal agencies increase funding for English
language training.
HELPING IMMIGRANTS SUCCEED IN THE LABOR MARKET
Overview
As part of its ongoing efforts to test innovative ways to help certain segments of
the population become prepared for, enter, and succeed in the workforce, the
Department of Labor sponsored a project in Seattle that provided a small number of
limited English speaking Hispanic and Asian immigrants with prevocational English-as-
a-second language instruction, transitional English-as-a-second language instruction

28Vicki Asakura and David Snedeker, ImmigrationDemonstration Grant Final Evaluation Report (Seattle, Wash.:Seattle-King County Private Industry Council, 1995).
114
linked with skills training, case management, support services, and job placement
assistance.
The demonstration, a partnership between the Seattle-King PIC and two
community based organizations (the Asian Counseling and Referral Services [ACRS]
and El Centro de la Raza) operated from September 1992 through November 1994. It
received $315,000 in Department of Labor funds and provided services to 54
participants. During the first year, participants had the option of selecting skills training
from four vocational areas–painting, carpentry, certified nursing assistant, and
housekeeping. In the second year, skills training was offered only in the area of
certified nursing assistant.
A report, based on a review of the demonstration’s two-year activities, suggests
that the project was successful and that the program design was effective in meeting
the training and employment needs of limited English speaking refugees and
immigrants.28 The report summarizes the demographics of the individuals served by
the project and their employability outcomes. It also discusses various findings
regarding client recruitment, targeting, and eligibility; client assessment; curriculum
development; instruction; and other services such as case management and support
services.
Client Demographics
More women than men were enrolled in the project. The study report notes that
both agencies (ACRS and El Centro de la Raza) served participants with a similar mix

115
of educational levels. Most of the participants were in the 25-45 age bracket and most
were Asians or Hispanics, the two groups targeted by the demonstration.
Twenty-three of the participants were receiving public assistance when they
enrolled in the project.
The report provides demographic information as it relates to performance
outcomes, noting that of the 15 participants enrolled in the first year (phase 1) of the
ACRS program, 13 were placed in jobs, with an average wage at placement of $7.07.
Ten of the 15 El Centro participants in phase 1 were placed in jobs, with an average
wage at placement of $6.58. In phase 2 (the program’s second year) nine of the 13
participants enrolled in ACRS’ program were placed in jobs, with an average wage at
placement of $6.78. During the same phase, 11 of the 13 El Centro participants were
placed in jobs with an average wage at placement of $6.69.
The report provides information about planned versus actual job placements, as
well as placements by education, age, and public assistance status.
Recruitment, Targeting, and Eligibility
The report points out that meeting eligibility and training criteria was sometimes
a problem in the first year of the demonstration, and that better results were obtained
during the project’s second year. Applicants were identified by both organizations
through word of mouth, referrals from other agencies, and from former students. In the
second year, ACRS sent out 300 announcements to service providers, ethnic
newspapers, and others, and made phone calls to generate referrals. Also during the
second year, El Centro used a Spanish language radio program to obtain publicity
about the program.
The report emphasizes that meeting and documenting income eligibility and
immigration status were factors that screened out some potential Hispanic participants.

116
By the close of the first year, project staff had developed several recommendations that
would improve the recruitment phase of future classes. These were:
4 Defining and/or clarifying eligibility criteria at the beginning of the grant,
particularly if it differs from existing programs;
4 Expanding the assessment process and tools to screen prospective
participants; and
4 Allocating more time for outreach and recruitment prior to program startup.
In the second year of the program, staff suggested restructuring and broadening
recruitment and assessment activities with consideration given to determining
oral and written English abilities as well as math skills, age, health, physical
ability, and income. Staff also suggested greater instructor involvement in the
assessment and recruitment process. These changes were implemented in the
second year.
Assessment
The authors point out that assessment was a key element in designing and
operating the project. The Comprehensive Adult Student Assessment System
(CASAS) was used to determine English language and basic skill levels. During phase
2, assessment efforts improved and included better assessment of language, basic
skills (reading and math), physical ability, as well as interest and aptitude for training
and employment in the field of certified nursing assistants.
The report emphasizes that, given the language and skill levels of the
participants and the levels needed to reach the first year’s occupational goals, success
did not always seem feasible due to the limited duration of the program.
As a result of the first year experiences, project staff developed a number of
recommendations related to improving the demonstration’s assessment phase.
Implemented in the second year of the project, these suggestions were:

117
4 Instructors should be more involved in the assessment and the case
managers need to be better informed about the skill training curriculum and
expectations so that they could do a better job with the assessment;
4 The initial assessment should be done before occupational tracks are chosen,
and, if multiple occupational tracks are offered, students should receive an
orientation to all occupational areas before they selected one area; and
4 The assessment should include an appraisal of other job requirements such
as physical abilities.
In the second year, both organizations used the CASAS reading, math, and
listening tests as well as a physical screening questionnaire to determine suitability for
training.
Curriculum Development
The authors point out that the decision to offer training in four occupational areas
proved to be somewhat for difficult for project staff to carry out and that the staff who
developed the training curriculum were not involved in selecting the occupations for
which training was to be provided. The curriculum developers later suggested that the
project needed a mix of training options that would meet the needs of both the
participants and the local labor market. The decision to focus on only one occupational
area during the second phase (certified nursing assistant) eased these difficulties.
The report points out a number of approaches that were used to adapt
curriculum to employer needs, particularly in the prevocational and job-specific English-
as-a-second language classes. ACRS, for example, found that using actual work place
texts, field trips, guest speakers, and video tapes helped in this area. In addition,
during the project’s second phase, staff made greater use of group work, tutoring, and
computers. They divided the classroom into “stations” to respond to the needs of

118
students with different language levels and provided at least three months of intensive
language training. Language instructors and skill training instructors also coordinated
their efforts.
Innovations were also developed to adapt the training curriculum to meet the
needs of limited-English-speaking participants.
Instruction and Other Services
Project staff learned in the first year that some instructional approaches were
more effective than others. Group work, tutoring, and integration of English-as-a-
second language with job skills training were found to be the most effective teaching
approaches.
Staff also found that “other services,” particularly case management and support
services, were important in ensuring participant success. Because case management
focuses on problem-solving and establishing connections with other services, it
provided participants with needed support during each phase of their training.
The project also offered support services to a few participants. These included
transportation and child care as well as supplementary English-as-a-second language
and basic skills instruction at the Private Industry Council’s Learning Center.
Project Summary
The report notes that many of the staff concerns and comments regarding the
program centered around the selection process and limitations of the vocational skills

119
training options. Strategies that could be used to ensure success in similar efforts are
noted in the study report. These include:
4 English-as-a-second language/basic skills and skills training linked with
transitional job/occupational specific English-as-a-second language instruction.
4 Transitional occupational specific English-as-a-second language instruction
offered prior to and concurrent with skills training.
4 Postplacement English-as-a-second language services that provide additional
support to participants once they are placed in the job.
4 A certified nursing assistant practicum at one site to facilitate coordination and
feedback with the training instructor.
4 Sufficient funds for support services, including child care.
4 A team teaching approach.
4 A comprehensive assessment process involving a team of case managers and
instructors.
4 Regular coordination meetings with case managers and instructors as well as
project management for sharing program information and curriculum materials,
planning, problem-solving, and staff development.
4 Sufficient lead time for program implementation, including timely notification of
ongoing funding for continuity of staffing and services.
OVERCOMING POVERTY IN THE UNITED STATES
Overview

29Ann Bonar Blalock, Editor, Evaluation Forum–AmericanPoverty: The Role of Education, Training and EmploymentStrategies in the New Anti-Poverty Struggle (Washington, D.C.:U.S. Department of Labor, 1994).
120
The Department of Labor continued its efforts to stimulate interest in policy
analysis, research, and program evaluation as useful tools for policymaking, planning,
and improving social programs by publishing the 10th edition of Evaluation Forum in
1994.29 Evaluation Forum is a national journal for program professionals in related
human service fields: basic education, vocational education, employment and training,
welfare, labor market and labor force change, and economic development.
Major Articles
The 10th edition focuses on a number of important issues to be considered in
determining the nature of future anti-poverty policies.
The publication sets the context with three articles that provide an overview of
poverty in America: one on the nature of poverty in the 1990s, based on reports
produced by the U.S. Bureau of the Census, the U.S. General Accounting Office, the
Children’s Defense Fund, the Center for the Study of Social Policy, the Center on
Budget and Policy Priorities, and the Institute for Research on Poverty; one that
presents a review of research on poverty and a number of conclusions about anti-
poverty policy; and another summarizing and analyzing the positions of two policy
experts on ameliorating the high level of American poverty.
An article describing the “underclass poor” reexamines inner-city ghetto poverty.
This article presents a synthesis of research and expert opinion on underclass poverty,
with particular attention paid to the impact of joblessness, income inequality, single

121
parenthood, and cultural isolation.
Three articles deal with welfare system issues: one reconsiders the chronology
of work/welfare approaches since the 1960s; another reviews and analyses a
publication about the transition from welfare to work, including State work/welfare
innovations that have contributed to the development of the national JOBS program;
and another provides a perspective on the effectiveness of work/welfare programs.
In addressing issues related to the homeless poor, the publication presents three
articles: one examines recent research on homelessness and its implications for social
policy; another discusses the design and results of the National Commission for
Employment Policy’s study of JTPA’s role in improving the employment opportunities of
homeless people; and the third reviews the major findings of the Department’s
evaluation of the Job Training for the Homeless Demonstration Program.
The 1994 edition of Evaluation Forum also includes a commentary by the
Secretary of Labor on workforce policy as it relates to a macro-level context for
developing anti-poverty policies and the text from interviews with two nationally
recognized leaders in the field of anti-poverty policy.
Evaluation issues and activities related to poverty in America are also presented.
These include a review of a book analyzing new trends in welfare policy in Western
Europe; an evaluation of an innovative Washington State welfare reform project; a
review of evaluations of new welfare reform models associated with the Job
Opportunities and Basic Skills program and their implications for national welfare
reform; and a discussion of current welfare reform positions accompanied by a
commentary on potential problems with new welfare approaches.
The publication concludes with descriptions of selected Federal research in
education, training, employment, and economic development conducted by various

122
Federal agencies, the Congress, and private research firms, and a brief listing of recent
books, articles, and working papers on poverty issues.
II. MEETING THE NEEDS OF DISLOCATED WORKERS
The summaries in the previous section exemplify the Department’s continued
concern for members of specific population groups who face multiple barriers to labor
force participation.
Of equal concern is the widespread phenomenon of worker dislocation. These
workers, who have lost their jobs because of mass layoffs or plant closings, generally
have higher skills and longer work histories than members of the specific population
groups served in programs noted in the previous section. However, because of their
rather specific skills and attachment to specific industries, many of these workers are
forced to find employment in different occupational areas, thus requiring varying
degrees of training and supportive services.
Title III of JTPA authorizes employment-related services for dislocated workers
through the Economic Dislocation and Worker Adjustment Assistance (EDWAA)
program. Services include basic readjustment, such as early intervention assistance,
job search, job and career counseling, and relocation assistance; retraining; support
services; and, in some cases, needs-related payments.
The first publication summarized in this section–A Guide to Well-Developed
Services for Dislocated Workers–was produced as part of a study of EDWAA’
implementation. It was published to help EDWAA practitioners share information about

123
strategies to help dislocated workers that have been developed through the program.
The second summary focuses on worker dislocation in the defense industry.
Prompted by an anticipated 30 percent drop in defense spending between 1987 an
1997, researchers looked into the Defense Conversion Adjustment program, which is
administered under Section 325 of JTPA. Twelve demonstration sites were funded in
November 1992; seven additional grants were awarded in November 1993. The
projects tested innovative approaches to helping dislocated defense workers that were
not otherwise found in standard JTPA Title III or defense conversion activities
supported by other funding sources. The researchers found that efforts to build closer
linkages between economic development and worker retraining were among the more
innovative aspects of the demonstration project designs.
The next summary focuses on efforts to help dislocated workers become
entrepreneurs. Initiated in June 1991, the EDWAA Job Creation Demonstration was
set up to explore the effectiveness of Community Development Corporations in
expanding opportunities for dislocated workers through entrepreneurial training and
linkages with local economic development activities. The demonstration achieved
significant results from the self-employment training.
The fourth study was undertaken to see if dislocated workers could become
reemployed faster if they received services early in their unemployment spell.
Researchers investigated the effectiveness of the Worker Profiling and Reemployment
Services System, which identifies unemployment insurance claimants who are likely to
be dislocated workers and refers them to reemployment services early in their
unemployment spell. The researchers found that a combination of early intervention
and job search assistance resulted in a substantial cost savings to the Federal
Government.
The final study included in this section also focuses on the extent to which
30The Department of Labor sponsored a three-year study of EDWAA which wasconducted by Social Policy Research Associates, Berkeley Planning Associates, andSRI International. For information about the implementation of the EDWAA legislation,see, Katherine P. Dickinson, Deborah J. Kogan, Kevin J. Rogers, and Mary Visher,Study of the Implementation of the Economic Dislocation and Worker Adjustment Act(Menlo Park, Calif.: SRI International, 1992). This study was summarized in theTraining and Employment Report of the Secretary of Labor which covered the periodPY 1991 and FY 1992. For information about the implementation of the EDWAAlegislation at the State, substate, and service-provider levels, see, Katherine P.Dickinson, Deborah J. Kogan, Kevin J. Rogers, and David Drury, Study of theImplementation of the Economic Dislocation and Worker Adjustment AssistanceAct—Phase II: Responsiveness of Services (Menlo Park, Calif.: Social Policy ResearchAssociates; Oakland, Calif.: Berkeley Planning Associates; and Menlo Park, Calif.: SRIInternational, 1993). For information about how EDWAA programs were organized, thetypes of dislocated workers served, the services provided, and the outcomes achievedby dislocated workers, see, Katherine P. Dickinson, Suzanne D. Kreutzer, Deborah J.Kogan, and Richard W. West, Study of the Implementation of the Economic Dislocationand Worker Adjustment Assistance Act: Report on the Survey of EDWAA SubstateAreas (Menlo Park, Calif.: Social Policy Research Associates, 1993). These twostudies were also summarized in the Training and Employment Report of the Secretaryof Labor which covered the period PY 1992 and FY 1993. For additional EDWAAinformation, see David Drury, Stephen Walsh, and Marlene Strong, Evaluation of theEDWAA Job Creation Demonstration (Oakland, Calif.: Berkeley Planning Associates,
124
unemployment insurance claimants who might benefit from reemployment services
could be identified early in their unemployment spells. The New Jersey Unemployment
Insurance Reemployment Demonstration Project, which began in 1986, examined how
such a reemployment program could be implemented. The researchers found that
overall, the project reduced the amount of unemployment insurance benefits received.
SERVICES FOR DISLOCATED WORKERS
Overview
As part of a study of the implementation of the Economic Dislocation and
Worker Adjustment Assistance Act (EDWAA),30 the Department of Labor sponsored a
1994). This evaluation report is summarized in this chapter of the Training andEmployment Report of the Secretary of Labor .
31Katherine Dickinson, et al., A Guide to Well-Developed Services For DislocatedWorkers (Menlo Park, Calif.: Social Policy Research Associates; Oakland, Calif.:Berkeley Planning Associates; and Menlo Park, Calif.: SRI International, 1994).
125
guidebook for EDWAA practitioners (including State and substate area policymakers,
program planners, and service providers) to share information about effective strategies
to help dislocated workers obtain new jobs under a variety of local conditions.31
The guidebook presents a framework that substate areas can use to determine
how responsive their services are in meeting the needs of dislocated workers. It also
provides examples of creative initiatives developed by substate areas in a variety of
economic environments to address those needs.
The publication’s introductory section briefly describes its purpose and
objectives, the characteristics of dislocated workers, key components of early
intervention strategies, options for delivering retraining services, and the methodology
of the EDWAA study as it relates to how the publication was developed.
The remainder of the guidebook is organized by the types of services that
dislocated workers need—early intervention services; services to develop
reemployment plans (including assessment, career exploration, service planning,
supportive services, and case management); basic readjustment services (including job
search training and assistance and crisis adjustment, job readiness, and relocation
services); and retraining services (including classroom training in basic skills, classroom
training in occupational skills, and on-the-job training). A number of issues related to
program organization and staffing are also discussed in the publication.
126
A variety of forms used to profile clients’ interests, skills, and experience are
included in the guidebook’s appendix along with a sample goals statement, skills and
support plan, educational plan, and other data-gathering and planning instruments.
Early Intervention Services
The authors point out that programs for dislocated workers should help them
adjust to their new circumstances and find new jobs by providing services as soon as
possible. Thus, substate-level staff involved in rapid response and early intervention
services must respond to a number of challenges. They need to:
4 Learn about area layoffs;
4 Obtain cooperation and input from employers and workers in developing
services;
4 Provide timely information about what opportunities are available in the current
labor market and what resources are available to help affected workers
(essential in helping dislocated workers develop reemployment plans);
4 Link rapid response efforts to early recruitment into services (matching
dislocated workers with needed services either before a layoff or as soon after
as possible); and
4 Provide experienced staff and a smooth transition to ongoing services.
The guidebook provides information about a number of strategies that respond
to each of the above challenges. Examples of two successful early intervention
strategies are also provided—one in an urban area with large-scale dislocations, and
one in a rural area with smaller-scale layoffs.
Regarding the first challenge, three strategies are suggested that can be used by

127
substate staff to find out about local layoffs. These are:
4 Informing employers about the Worker Adjustment and Retraining Notification
(WARN) Act through direct mailings, toll-free numbers, and annual employer
forums;
4 Learning about layoffs by developing networks with employers or labor
representatives (including Private Industry Council members, standing Labor-
Management Committees, experienced contractors who provide retraining
services for employers, “brokering” State or private resources to help employers
access resources, and through other community sources such as State and local
elected officials, State Job Training Coordinating Council members, Chambers
of Commerce, etc.); and
4 Learning about layoffs from other government agencies, especially the
Employment Service and Unemployment Insurance systems, and economic
development agencies.
Regarding the second challenge, obtaining cooperation and input from
employers and workers in developing services, the guidebook suggests several
methods that can be used to obtain needed cooperation. The authors also point out
that the benefits of establishing close relationships with employers include identification
of affected workers, obtaining information about the skills of these workers, obtaining
on-site space and release time for worker orientation, the ability to provide on-site
prelayoff services and financial assistance, and the ability to place affected workers in
other jobs in the early stages of a layoff.
Meetings with employers can be particularly effective in obtaining their early
cooperation in a layoff situation. Substate area staff should emphasize to the employer
the benefits of cooperation with rapid response efforts (e.g., improving worker morale,
increasing productivity, and reducing absenteeism). They should also inform employers
about the flexibility of services available, and work to establish trust between the
employer and various service providers.

128
Another key to successful early intervention is obtaining cooperation from unions
or from worker representatives, thus ensuring greater acceptance of EDWAA services
by the dislocated workers. Unions and worker representatives can also provide
important information to program designers and operators about the affected workers
(including their need for crisis assistance, basic skills remediation, and retraining).
They can also help identify the workers’ skills and help determine the transferability of
those skills to other industries or occupations. Unions or worker representatives can
also provide peer support. The guidebook discusses several strategies used by
substate areas to involve unions or employee organizations in designing and delivering
EDWAA services.
In addition to employer and union cooperation, input from affected workers
themselves can be useful in planning early intervention services. The authors note that
many substate areas conducted surveys of affected employees for this purpose. The
publication also provides examples of how these surveys were used.
Regarding the third challenge, providing timely information about what
opportunities are available in the current labor market and what resources may be
available to help affected workers, the authors suggest that Labor-Management
Committees can be useful in the early stages of layoffs because they may provide a
vehicle for obtaining cooperation of both employers and worker representatives. The
publication discusses the benefits of these committees and some of the problems that
can arise in establishing them.
The guidebook notes that flexibility is the key in establishing these committees in
plants that lack union representation. The authors point out that many nonunionized
plants have some type of worker group in place that can identify appropriate individuals
to represent the workers, and, in some cases, personnel staff can be asked to identify
individuals who have good leadership and communication skills to represent workers.

129
In order to reduce the time required to establish these committees, the authors
suggest that establishing standing Labor-Management Committees can often be
helpful. Examples of different types of these Committees are provided.
Special assistance is needed by dislocated workers who are about to lose long-
held jobs. Not only do they need timely information about the status of the labor
market, they also need help in coping with job loss and an understanding of the type of
help available to develop reemployment plans. The guidebook offers several
suggestions:
4 Offer comprehensive orientation sessions to provide information about a wide
range of community assistance, what to expect from being laid off, experiences
of former dislocated workers, local labor market opportunities, and names and
addresses of relevant agencies to contact.
4 Schedule multiple meetings in cases where a comprehensive orientation
session might provide too much information for workers to absorb.
4 Involve family members by inviting them to orientation sessions, providing
child care at the sessions, and by establishing “spouse support groups.”
4 Respond to smaller-scale layoffs by providing orientation sessions similar to
those for larger layoffs, holding smaller, more limited sessions, or providing
employers with orientation materials to distribute to workers.
4 Respond to layoffs in cases where employers are not cooperating by obtaining
information about potential dislocated workers from the unemployment insurance
system or from unions and employee groups. In cases where employers will not
allow on-site orientation meetings, workers can receive written materials, off-site
orientations, or information by telephone or through the mail.
Regarding the fourth challenge, linking rapid response to early recruitment into
services, the authors suggest that although rapid response mechanisms may be in

130
place, they may not always accomplish their intended goal of quickly linking workers to
services because workers do not always take full advantage of these initiatives. The
guidebook offers three strategies that substate areas might use to better accomplish
this: (1) providing prelayoff services; (2) recruiting workers quickly into ongoing EDWAA
services; and (3) linking workers to services with other agencies to help them cope with
being laid off.
Examples of five strategies that substate areas have used to provide prelayoff
services to dislocated workers are presented in the publication: (1) establishing on-site
centers, generally staffed by EDWAA staff to tailor services to the needs of workers, to
increase worker participation, and to provide peer support; (2) establishing off-site
centers in cases where workers may resent the employer; (3) offering group workshops
which may be more appropriate for smaller-scale layoffs or for layoffs with relatively
little advance warning, and when offered off-site, do not require employer cooperation;
(4) providing individual services, especially in cases of very small layoffs, to help
workers begin developing reemployment plans prior to layoff; and (5) providing
prelayoff retraining in cases of large-scale layoffs with adequate advance notice.
Also, because it may be difficult for many substate areas to link affected workers
to their ongoing programs soon after layoff, several methods have been used by
substate areas to help workers benefit from these ongoing services. Examples of these
initiatives include conducting eligibility determination at the orientation meeting, issuing
Certificates of Continuing Eligibility to workers who attend an orientation session, and
enrolling clients directly into EDWAA at the orientation meeting. Substate staff can also
followup with dislocated workers who attend orientation meetings to encourage them to
apply for ongoing EDWAA services.
The authors point out that in an effort to help workers take advantage of the
services provided by other agencies, many substate areas have had agency
representatives make presentations at orientations and/or disseminate written materials

131
about the services available in the community. In addition, after enrolling clients in
EDWAA, several substate areas frequently referred clients to other services as part of
the service planning process.
In response to the final challenge, providing experienced staff, the guidebook
discusses the importance of ensuring that experienced, well-qualified staff respond to
layoffs and closures.
Although States are responsible for responding to large-scale layoffs under
EDWAA, subsequent amendments to the legislation allowed States to contract with
other entities, such as substate areas, to provide services. The advantages of State-
led rapid response efforts are noted in the publication. They include consistency in
conducting rapid response efforts, more rapid gain in staff experience (by responding to
a greater number of layoffs), easier access to State resources and better coordination
with other agencies, and increased employer cooperation at the State level.
Advantages of substate-led rapid response include better linkages between rapid
response activities and recruitment into services, more consistently available staff, and
better knowledge of local conditions.
Services to Develop Reemployment Plans:Assessment, Career Exploration, and Service Planning
In order to help dislocated workers develop appropriate reemployment plans,
service providers must implement a responsive, client-centered approach to
assessment and service planning. In this regard, the guidebook suggests that substate
areas need to meet several challenges. They must:
4 Develop assessment strategies that are appropriate for dislocated workers;
4 Help dislocated workers to identify their career goals; and
4 Help them to identify any barriers to achieving career goals.

132
Examples of initiatives that have helped dislocated workers develop
reemployment plans are provided, as is a list of resources that can be useful in this
regard.
In discussing appropriate assessment procedures, the guidebook points out that
there are three important considerations. The first is assessment for “explicit
purposes”—deciding what information is needed and how it will be used. By identifying
the purposes of assessment, the substate area will be able to determine what needs to
be assessed, when assessment should occur, and the best method for assessment.
The authors note that assessment should not be used to screen clients out of a
particular program and that it not only provides information, but it also affects the clients
either negatively or positively. (If clients find the assessment process useful and
interesting, it may increase their motivation and commitment to participate in services.)
The second consideration is “individualized” assessment. Because dislocated
workers are so diverse in their previous backgrounds and skill levels, the amount and
type of information each needs to make appropriate reemployment plans will vary
based on their skill levels and educational background. Strategies used by substate
area staff to individualize assessment include tailoring a specific set of assessment
tools to each client, developing several sets of assessment tools to be used for different
types of workers, and using additional assessment tools for workers who have less
formal education.
The third consideration is the validity and reliability of the assessment procedure
and tools. The guidebook suggests that in addition to formal paper-and-pencil or
performance tests, self-reporting information from clients, observations of their
behavior, and career-exploration exercises can be used to obtain information about
clients’ needs, interests, and abilities. The authors note that staff should keep in mind
that assessment procedures are only valid if they measure what they are intended to

133
measure and if they are consistent.
The publication provides information about several strategies that can be used to
help determine the occupational interests, aptitudes, and transferable skills of
dislocated workers. These include both formal tests and self-assessment exercises to
determine occupational interests, values, and transferable skills. Examples of each of
these are provided in the guidebook.
One-on-one interviews between clients and vocational counselors may also help
in determining their interests, aptitudes, and skills. One advantage of this strategy is
that it is highly individualized. On the other hand, these interviews may require more
staff time (and thus, they may be more costly) and rely on the expertise and training of
the interviewer.
In discussing the second challenge, the need to help dislocated workers to
select appropriate career goals, the publication notes that virtually all substate areas
provide clients with some career information as part of the service planning interview.
Some areas have developed additional strategies to help dislocated workers explore
careers and labor market opportunities. These include using automated career
exploration systems such as the Guide for Occupational Exploration and the Dictionary
of Occupational Titles; requiring clients’ to conduct their own research about labor
market opportunities, and arranging for speakers or presentations about the labor
market. Examples of these approaches are provided.
The guidebook also points out that once occupational interests and career goals
are identified, it is important that staff look closely at clients’ basic educational skills in
order to determine if a lack of these skills will prevent them from achieving success.
Considerations that are important in designing appropriate basic skill assessments
include: (1) the level of formal education may not be a good indicator of whether basic
skills remediation is required; (2) basic skills assessment procedures should be

134
individualized (using a test appropriate for many levels of basic skills proficiency, or
using a range of assessment instruments may be helpful in this regard); and (3) basic
skills testing should not be threatening to dislocated workers. Several examples of
basic skills assessment mechanisms are provided in the guidebook.
Substate area staff must also be prepared to assess the need for a number of
other services, such as basic readjustment services, supportive services, and the need
for income while clients are looking for a new job.
To meet clients’ needs for basic readjustment services (e.g., specialized job
search assistance, stress management, and world-of-work training), some substate
areas have developed formal assessment instruments. In other cases, observation of
clients’ behavior during counseling interviews or workshops may help to identify special
needs. Asking clients about their needs and arranging for a specialist to help assess
the need for special services can also be helpful.
Several procedures are noted in guidebook that can help staff identify various
supportive service needs (e.g., physical requirements, environmental conditions,
transportation, family problems, child care, etc.). These include the use of
questionnaires to be filled out by clients before a service planning session, interview
checklists used by counselors, and observation of clients during service planning
sessions or during workshops.
Finally, assessing income needs is an important component in service planning.
Substate areas that provide needs-related payments must systematically determine if
clients need such assistance. The authors also suggest that in areas where these
payments are not available, staff should help clients determine their eligibility for other
types of assistance such as Pell grants or student loans.

135
In addressing the fourth challenge, the need to develop comprehensive service
plans, the guidebook points out that this planning is the culmination of the assessment
and career exploration process. The authors provide information in two important areas
related to service plan development: (1) the content of service plans; and (2) balancing
clients’ preferences with their need for appropriate services.
The guidebook notes that substate areas with the most responsive client service
plans have developed structured procedures to guide their development. These service
plans contain several important components, including clear career goals; immediate
and long-term career goals; services that address all potential barriers to employment;
a sequence of service with estimated timetables for achieving intermediate milestones;
a clear definition of the responsibilities of clients, counselors, case managers, service
providers, and outside agencies; and provisions to update career goals and needed
services as necessary.
Substate area staff must also balance dislocated workers’ preferences for
services while encouraging them to participate in appropriate services that will lead to
stable employment with adequate wages. Strategies used to encourage acceptance of
appropriate services include promoting active client involvement in service planning,
counseling clients on the services needed to achieve stable employment in high-quality
jobs, and providing for a gradual evolution of service plans as clients absorb new
information about their career options and their related training requirements. The
guidebook expands on each of these strategies and provides examples of successful
assessment, career exploration, and service planning efforts.
A list of appropriate publications, assessment instruments, and career
exploration materials is also provided.
Services to Develop Reemployment Plans:Supportive Services and Case Management

136
In addition to assessment, career exploration, and service planning strategies,
substate areas must also provide needed supportive services and develop effective
case management strategies. The authors point out that substate areas face several
challenges in this regard, including:
4 Ensuring that participants have access to needed income support during
participation;
4 Providing participants with appropriate support services; and
4 Assessing progress over time.
Each of these challenges is discussed in detail and specific examples of how
they have been addressed at the substate level are provided.
In responding to the first challenge, the authors point out that helping dislocated
workers focus on their income needs allows them to make informed decisions about
program participation and reduces the likelihood that they will drop out before
completing their training. The guidebook offers several strategies to address this issue,
which may include providing needs-related payments or participation allowances using
EDWAA funds; helping participants obtain income support from other programs such as
Unemployment Insurance; trade readjustment allowances; State-funded benefits;
student financial aid programs; and income support programs such as Food Stamps,
public assistance grants, and JTPA Title II-A supportive service payments for workers
who also qualify as economically disadvantaged. In addition to providing details about
each of these strategies, examples of how some substate areas have developed
income-support strategies are included in the guidebook.
Regarding the second challenge, providing participants with needed supportive
services, the authors suggest that not only is it important to address the income needs
of dislocated workers, other supportive services such as helping with expenses while
they are receiving training (e.g., child care, tools, and uniforms), and personal or family

137
needs (e.g., health or dental health needs, emergency food or shelter, clothing, and
assistance with personal crises such as legal problems or substance abuse) must also
be provided. The authors suggest that it is important to identify the need for supportive
services before the particular need interferes with the clients’ progress toward
completing retraining or readjustment services.
One disadvantage of providing a wide range of supportive services with EDWAA
funds is that it may reduce the total amount of funds available for other services. Thus,
some substate areas have established strong linkages with other public and private
agencies that can provide additional services. These include charitable organizations
for contributions of food, clothing, and emergency shelter, health and mental health
providers, and sources of legal assistance.
At a minimum, substate staff should be prepared to inform clients of these
services; ideally, they should be prepared to make specific service referrals based on
individual participants’ needs. The authors point out that this can be accomplished
through active referrals to other agencies (and subsequently tracking client progress as
they receive these supportive services) or by purchasing supportive services (using
EDWAA funds) from other agencies when necessary. Examples of each of these
strategies are provided in the publication.
Finally, the third challenge, assessing participants’ progress over time, requires
that substate staff be prepared to track participants’ progress throughout their program
experience and respond to problems that may endanger successful completion of basic
readjustment or training services. In addition, case managers must assess clients’
progress toward short- and long-term goals and provide them with ongoing
encouragement and support. Factors that might affect the ability of case managers to
perform all of these functions include large caseloads and certain client characteristics
(e.g., clients with less formal education may need additional help securing services and
some may need more support and encouragement during program participation).

138
The guidebook offers several examples of different organizational arrangements
that substate areas have used to provide effective case management services. These
include:
4 Using case managers who specialize in either classroom training or job search
activities. Once clients complete their training, they are handed over to
managers with expertise in job search efforts. This system helps clients take
advantage of case managers with concentrated areas of expertise.
4 Using training providers to provide case management services and, in some
cases, to provide placement services.
4 Developing and using a case management “pool” which allows staff to share
the responsibilities for all in-house services and to make in-person meetings with
clients as convenient as possible.
4 Using a team case management approach in which case management
responsibilities for each client are shared by a team that reviews each client’s
progress. Each team member can offer unique insight and experience to each
case.
No matter which organizational arrangement is used, it must: (1) provide
continuous case management services and ensure smooth transition from one service
to another; (2) ensure that case managers are well-informed about participants’
attendance and performance in specific training or readjustment services; and (3) link
ongoing case management to each participant’s written service plan and goals.
The guidebook discusses the various roles of the case manager, including
tracking participant status through regular contacts with participants, assessing
progress toward their goals, and continually providing encouragement and support.
Examples of each of how each of these functions have been carried out in substate
areas are provided.

139
Basic Readjustment Services:Job Search Training and Assistance
Basic readjustment services discussed in the guidebook include job search
training and assistance as well as crisis adjustment, job readiness, and relocation
services.
The guidebook notes several challenges associated with providing job search
training (the first four challenges listed below) and job search assistance (the last two
challenges). These are:
4 Providing dislocated workers with labor market information and training in job
search methods;
4 Making job search training and assistance available to all participants;
4 Meeting the job search training needs of workers with different skill levels and
work maturities;
4 Linking job search training to job search assistance;
4 Providing ongoing support for participants during job search; and
4 Matching participants to jobs in keeping with their skills and previous wage
levels.
The authors discuss several strategies for providing quality job search training
based on the above challenges.
Regarding the first challenge, providing dislocated workers with labor market
information and training in job search methods, the authors point out that the most
commonly used strategies for providing this service are: (1) one-on-one assistance from
a counselor or job developer; (2) stand-alone workshops (provided directly by EDWAA
or through referral to the Employment Service); and (3) job search training as a
component of more comprehensive workshops covering assessment, crisis adjustment,

140
or world-of-work skills. These approaches are discussed in detail and examples of
each are provided.
Regarding the second challenge, making job search training and assistance
available to all participants, the authors suggest that integrated workshops held at the
assessment and service planning stage are especially well suited for this and are often
mandatory for all participants. In addition, job search training can be provided to
classroom training participants by requiring the inclusion of a job search component in
occupational skills classes.
In describing strategies to meet the needs of workers with different skill levels
and work maturities (the third challenge), the guidebook notes that one strategy for
tailoring job search training to the diverse needs of clients is through one-on-one
assistance from the counselor or job developer. A second strategy consists of offering
job search training in the form of short topical modules or seminars to meet the needs
of different dislocated populations. Several examples of modular workshops operated
at the substate level are provided.
Regarding the fourth challenge, linking job search training and job search
assistance services, the guidebook describes four methods that have been used to
ensure that participants make a smooth transition from job search training to job search
assistance. These are: (1) describing the substate area’s job search support services
and facilities as a regular feature of the job search workshop; (2) introducing workshop
participants to staff who will later assist with job search; (3) having Employment Service
representatives present for part of the workshop; and (4) having graduation
requirements for the workshop to ensure that participants are capable of conducting a
job interview before they are allowed to proceed to job development activities.
The fifth challenge relates to job search assistance–providing ongoing support
for participants during their job search. The authors point out that this can be

141
accomplished by providing individual support for self-directed job search initiatives, by
promoting mutual support among participants (through job clubs and motivational
workshops), or by providing facilities for self-directed job search efforts (telephones,
word processors, clerical support, library facilities, access to job listings, and having
counselors or job developers on hand to provide help as needed).
The final challenge in the area of job search assistance, matching participants to
jobs in keeping with their skills and previous wage levels, can be accomplished by: (1)
using Job Banks and matching job orders to participants; (2) conducting employer
outreach and developing jobs for individual participants; and (3) offering job fairs and
employer presentations for clients. Examples of these activities are provided.
Two case examples are also included in the guidebook. One describes
comprehensive services (including services tailored to managerial and technical
workers), and the other provides information about an intensive workshop with strong
case management during job search.
Basic Readjustment Services:Crisis Adjustment, Job Readiness, and Relocation Services
The final component of basic readjustment services involves crisis adjustment,
job readiness training, and, in some cases, relocation services. Several challenges
faced by substate area staff are noted in this regard. Staff must:
4 Help dislocated workers manage the stress of being laid off;
4 Help clients adjust financially;
4 Help clients develop appropriate workforce skills; and
4 Provide relocation assistance, when appropriate.

142
Strategies for meeting each of these challenges are discussed. In the area of
stress management services, the guidebook points out that there are four stages most
commonly experienced by dislocated workers: disbelief (or denial), anger, depression,
and acceptance of the job loss. In addition to helping dislocated workers address each
stage of job loss, some substate areas have further helped clients by teaching them
about the physical and emotional ways of coping with stress, helping them alter their
negative behavior, or helping them to improve their self-esteem.
Because financial insecurity is often a major source of stress for dislocated
workers, providing financial management services is another important activity
undertaken by substate area staff. Strategies for providing this service include helping
clients develop budgets, helping them work with creditors, providing counseling about
maintaining or replacing employee benefits (e.g., managing severance pay, maintaining
health insurance, etc.), and helping dislocated workers determine if they are eligible for
other income assistance programs such as unemployment insurance, trade
readjustment assistance, food stamps, or Pell grants.
Several strategies are noted that can help clients become better prepared for
their new jobs. These include instruction in communication skills, conflict resolution,
and organizational skills.
Regarding relocation assistance, the guidebook suggests that, while most
substate areas studied did not emphasize this type of assistance, it was used
effectively in a few areas. Some programs provided newspapers from other regions,
long distance telephone privileges, employer directories, and listings of jobs in other
regions and States. In addition, some areas helped dislocated workers with out-of-area
job search expenses or moving expenses.
The guidebook includes an example of a substate area initiative that met the
basic crisis adjustment and job readiness needs of clients and provided relocation
143
assistance. An example of a customized crisis adjustment and job readiness initiative
designed to meet the special needs of dislocated workers is also provided. A brief
listing of relevant publications is included.
Retraining Services:Classroom Training in Basic Skills
The guidebook notes that substate areas must help clients whose basic skills
deficiencies prohibit them from obtaining new jobs or may limit their access to
occupational training for better jobs. Pointing out that clients often have diverse
educational backgrounds and skills, the authors suggest that substate areas face two
challenges in their efforts to offer basic skills classroom training. They must:
4 Provide high-quality basic skills training that meets the varied needs of
dislocated workers; and
4 Promote basic skills curricula that are appropriate for dislocated workers.
Regarding the first challenge, the authors suggest that referring clients to
existing basic skills training providers may help meet their diverse needs. This strategy
offers substate areas two advantages. First, it allows them to offer a wide range of
training options to meet individual needs, and second, it reduces program costs.
Disadvantages of this strategy include the possibility of reduced local funds available for
basic skills training, and the programs themselves may not be geared to the specific
needs of the dislocated workers. In overcoming these disadvantages, the guidebook
suggests that substate area staff must know the training approaches used by each
basic skill provider and they must be able to match participants to programs that are
successful in training participants with similar backgrounds and needs. It is also
important that dislocated workers are enrolled in EDWAA while receiving remedial
classroom training to ensure that they complete basic skills instruction.

144
Another strategy is to provide basic skills training through in-house skill centers.
The advantage of this strategy is that it gives programs maximum control over almost
all aspects of basic skills instruction and it is easier to set up case management
procedures to monitor participant progress and to provide EDWAA services at the same
time. However, substate areas must bear the cost of developing and maintaining in-
house training facilities. They must also ensure that they have expert instructional staff,
develop appropriate basic skills curricula, and operate efficient in-house centers.
The authors offer two suggestions that might help substate areas provide quality
in-house basic skills remediation efforts. First, they can use facilities that are also
available for participants in JTPA Title II-A programs. This will help reduce instructional
costs by distributing operating costs between the two programs. Second, they can
develop a separate basic skills program specifically for dislocated workers. This
strategy gives programs more control over the operation of the skills center and
participants may be less likely to be intimidated by the training environment because
they are surrounded by their peers.
Regarding the second challenge, promoting basic skills curricula that are
appropriate for dislocated workers, the guidebook points out that those that meet
clients’ diverse needs include vocationally relevant instructional materials, efficient
training schedules, and a nonthreatening environment. Each of these aspects of quality
curricula are described in detail and appropriate examples are offered. Case examples
of the integration of basic skills remediation with vocational classes and the use of a
joint remedial skill center are also provided.
Retraining Services: ClassroomTraining in Occupational Skills
In addition to basic skills classroom training, dislocated workers often need

145
occupational skills classroom training. Challenges faced by substate areas in providing
this training include:
4 Providing a wide range of occupational training options;
4 Providing training that prepares dislocated workers for jobs paying high wages;
4 Encouraging workers without marketable skills to participate in retraining; and
4 Providing flexible scheduling.
The authors suggest that strategies to provide a wide range of retraining options
include arranging for referrals to local educational institutions (ensuring that vocational
programs respond to occupations in demand, are vocationally relevant, and are
comprehensive enough to enable clients to obtain jobs beyond the entry level),
permitting EDWAA clients to select courses among a number of public and private
course offerings, and developing new training programs for dislocated workers. The
guidebook discusses the advantages and disadvantages of these strategies and
provides examples how substate areas have implemented these strategies.
In responding to the challenge of preparing dislocated workers for high-wage
jobs in demand occupations, the authors stress that detailed information about labor
markets and labor market trends is essential in targeting training to jobs that are
available. This can be accomplished through surveys of occupational demand at a
local or regional level and by having individuals seek training in a particular field to
document the availability of jobs in that field.
Another strategy to prepare clients for high-wage jobs is to provide training that
builds on their existing skills. The objective of enhancing existing skills is to prepare
dislocated workers for a lateral move into another skilled job rather than beginning at
the bottom of a new career ladder. Developing training linked to economic
development or entrepreneurship efforts may also help provide high-wage jobs for
some clients.

146
Regarding the third challenge, encouraging workers without marketable skills to
participate in retraining, the authors suggest two approaches: (1) developing short-term
classes to introduce dislocated workers to classroom training in a “safe” setting (classes
are designed to provide some skills enhancement while encouraging participants to
continue with additional retraining at existing educational institutions); and (2) providing
academic counseling and support for clients. This strategy allows clients to receive on-
campus support such as counseling and case management.
In designing strategies to promote flexible scheduling of retraining options, the
guidebook suggests that substate areas may use existing opportunities for open-
entry/open-exit training or they may tailor existing programs to meet the scheduling
needs of dislocated workers.
Examples of comprehensive occupational skills training and short-term, intensive
training tailored to the specific needs of dislocated workers are provided.
Retraining Services:On-the-Job Training
The guidebook points out that on-the-job training serves several important
functions. It provides short-term training in new skills for clients who need immediate
income; it takes full advantage of clients’ transferable skills, particularly where those
skills can be enhanced; it provides training in occupations for which no classroom
training is available locally; and it helps classroom training graduates overcome hiring
barriers due to their lack of practical work experience in a new field.
Challenges associated with designing and delivering effective on-the-job training
services include:
4 Matching clients to jobs in higher-skilled occupations;

147
4 Developing individualized training plans; and
4 Helping employers provide effective training.
The authors point out that developing appropriate job openings is the first step in
matching clients to appropriate on-the-job training positions. Several strategies may be
used in accomplishing this objective. First, substate areas may identify potential on-
the-job training positions through general job development activities. Second, on-the-
job training positions may be developed for specific participants (matching clients’
employment goals with appropriate potential employers). Third, clients themselves may
seek out potential positions. Finally, “reverse referrals” may also be used, in which
employers who are familiar with on-the-job training refer prospective employees to
substate area staff to determine whether they qualify for a training subsidy. (The
authors discourage this approach.)
A second step in matching clients to on-the-job training positions is to assess
whether a particular position is appropriate for a specific client. In accomplishing this,
staff can use interviews with clients, formal assessment tests, or performance tests to
determine the appropriateness of an on-the-job training opportunity.
The final step in this matching process is to evaluate the suitability of employers
who might provide the training. Several aspects of the employers and their positions
should be considered by substate staff, including whether the wage and skill levels are
appropriate for clients, whether the job can provide stable employment, whether on-the-
job training is actually needed, whether the company provides appropriate working
conditions and employee benefits, and the employer’s ability to carry out on-the-job
training.
Regarding the second challenge, developing individualized training plans for on-
the-job training participants, the authors suggest that several factors should be
considered. First, the skills required for these positions must be analyzed. Next, the

148
number of training hours and wage reimbursement levels must be determined. Finally,
there must be an assurance that trainees with satisfactory performance will be retained
as regular employees.
The authors offer suggestions about how to conduct a thorough job analysis,
discuss ways to determine the length of training, and provide information about how to
design on-the-job training contracts that retain workers once training is complete.
In expanding on the third challenge, helping employers provide effective skills
training, the authors suggest that substate staff can provide seminars for employers on
work site training techniques. Appropriate monitoring efforts are also discussed.
Case examples of on-the-job training programs are described and publications
that may be useful in setting up on-the-job training programs are noted.
Organizational Issues
The guidebook highlights some of the ways that substate areas promote high
quality services through organization and staff development techniques, which were
adopted to address two important challenges:
4 Promoting high-quality, client-centered services; and
4 Developing staff skills and avoiding staff “burnout.”
Several strategies are offered for promoting high-quality, client-centered
services. These include viewing services from the client’s perspective, emphasizing
continuous improvement of services, collecting and analyzing data to improve services,
and involving outside agencies (e.g., classroom training providers and other human
service agencies) in quality improvement efforts.

32For more information about programs to help dislocated workers, see DavidDrury, Stephen Walsh, and Marlene Strong, Evaluation of the EDWAA Job CreationDemonstration (Oakland, Calif.: Berkeley Planning Associates, 1994). See alsoKatherine Dickinson, et al., A Guide to Well-Developed Services For DislocatedWorkers (Menlo Park, Calif.: Social Policy Research Associates; Oakland, Calif.:Berkeley Planning Associates; and Menlo Park, Calif.: SRI International, 1994). Thesereports are summarized in this chapter of the Training and Employment Report of theSecretary of Labor .
149
Strategies suggested to avoid staff burnout include emphasizing staff
development, as well as the use of a team approach in assisting dislocated workers.
The guidebook provides an example of an effort to implement total quality
management for substate staff in one program and an example of a program that
emphasized high-quality services.
EASING JOB LOSS IN THE DEFENSE INDUSTRY
Overview
In addition to overseeing the Economic Dislocation and Worker Adjustment
Assistance Act (EDWAA), which provides retraining and other assistance for workers
who have lost their jobs through plant closings and mass layoffs,32 the Department of
Labor designed and implemented an important initiative aimed at easing the transition
to new employment of individuals who have been adversely affected by cutbacks in
defense spending.
Between 1987 and 1997, Department of Defense (DOD) outlays are projected to

33In absolute terms, these reductions will amount to an average reduction of $10billion per year over a 10-year period. As a percentage of gross national product,defense outlays are expected to fall from six percent in 1987 to three and a half percentin 1997.
34Defense Conversion Commission, Adjusting to the Drawdown (Washington,D.C.,1992); and U.S. Congress, Office of Technology Assessment, After the Cold War:Living with Lower Defense Spending (Washington, D.C., 1992).
150
drop by 30 percent.33 Defense procurement will be hardest hit, with expenditures for
DOD contractors estimated to decrease by $46 billion during this 10-year period.
Expenditures for military personnel may decline by $25 billion over the same
period.34
This decrease in defense spending will affect individual defense-industry
workers and military personnel, firms that are dependent on the defense industry, and
communities with high concentrations of defense-related activities.
Defense workers and military personnel who have lost their jobs, or who can
expect to lose their jobs because of decreased expenditures for defense, as well as laid
off civilian DOD employees, will need to find new employment opportunities in the
nondefense sector. These workers share similar characteristics: (1) they have relatively
high levels of education and technical skills; (2) they lack information about nondefense
occupations and employers; (3) they have extensive job-related experience and training
that may not be reflected in formal educational credentials; and (4) they have
experience in a defense industry “corporate culture” that emphasizes top-down
decision-making rather than participatory work teams and technical quality over cost
control and efficiency.
In response to this situation, the National Defense Authorization Act of 1991

151
allocated $150 million to the Department of Labor to operate the Defense Conversion
Adjustment Program (DCA), which is administered under Section 325 of Title III of the
Job Training Partnership Act (JTPA). Twelve DCA demonstration grants were awarded
in November 1992 (with a total of about $5 million in funding) and seven additional
grants (with a total of about $3.4 million in funding) were awarded in November 1993.
These projects were funded to design and implement innovative approaches that were
not otherwise found in standard JTPA Title III or defense conversion activities
supported by other funding sources. Areas of potential innovation included:
4 Use of grantee organizations and administrative entities not generally
responsible for dislocated worker services;
4 Targeting of demonstration activities and services to individuals and groups
not generally included in EDWAA services, including defense-dependent firms
and adversely affected communities as well as individual workers dislocated or
at risk of dislocation as a result of the reductions in defense spending;
4 Provision of a wide range of services and activities related to defense
conversion objectives (e.g., formation of community task forces, business
development assistance, entrepreneurial training, workforce training in high
performance workplace skills and total quality management concepts, and
training in technical fields for individual workers); and
4 Coordination of DCA demonstration activities with other defense conversion
activities such as economic development or community adjustment funding.
An interim report, based on an evaluation of the implementation of the DCA
demonstration, describes the Federal Government’s response to the decrease in
defense spending, discusses various strategies taken to prevent layoffs from defense-
related firms, provides information about strategies used to help defense workers who
have lost their jobs (or who are about to lose their jobs), and outlines strategies used to
plan appropriate responses for military base closures and cutbacks in defense
35Mary G. Visher and Deborah Kogan, Evaluation of the Defense ConversionAdjustment Demonstration: Interim Report on Implementation (Oakland, Calif.: BerkeleyPlanning Associates and Menlo Park, Calif.: Social Policy Research Associates, 1994).
152
industries.35
Study Methodology
The evaluation of the DCA demonstration was designed to: (1) describe and
document the implementation and short-term outcomes of the demonstration projects
as they relate to the specific problems faced in defense-related dislocations; (2) identify
exemplary approaches to the specific problems faced in defense-related dislocations;
and (3) identify the factors that contribute to or impede the success of various
responses to defense conversion.
Qualitative data on project designs, implementation experiences, and outcomes
were collected through site visits to each project (conducted between October 1983 and
February 1994). The researchers also reviewed project proposals and quarterly
progress reports that were submitted to the Department of Labor.
Although the DCA demonstrations were awarded under five different
categories–dislocation aversion, increased worker mobility, community planning,
economic development, and locally initiated projects, the various demonstration
approaches that were taken can be described using three conceptual models. (Some
demonstrations could be categorized as using a single model, while others developed
designs that combined multiple models.) These three models are briefly summarized
below.

153
The Dislocation Aversion Approach
In this approach, defense-dependent firms received help in restructuring their
operations in order to compete in commercial markets. In contrast to traditional
EDWAA services which help individual workers, this approach was designed to reduce
dislocations through early intervention for the entire firm in order to preserve the jobs of
at-risk workers. Chart 13 depicts the basic components of this approach. Projects
using this approach helped firms to:
4 Assess their strengths and weaknesses and find opportunities for conversion
or diversification;
4 Develop detailed strategic plans for conversion or diversification, including
developing financing for implementing the strategic plan;
4 Reorganize their workplace to implement improved technologies and more
flexible production procedures, or to transform worker roles and responsibilities;
4 Provide technical assistance and training to managers on marketing,
reorganization of production, financial restructuring, recordkeeping, and total
quality management, as needed; and
4 Retrain workers in needed technical skills or high-performance workplace skills
necessary to help the firm compete in broader markets.
The Worker Mobility Approach
While the Dislocation Aversion Approach was designed to help companies avoid
laying off workers, the Worker Mobility Approach helps dislocated workers once they
have lost their jobs (or once dislocation is unavoidable). The demonstrations using this

154
approach tested innovative ways of increasing mobility for workers affected by the
decrease in defense spending. Chart 14 shows the basic components of this approach.
The study report points out that after identifying a group of workers laid off from
defense-related employment, the worker mobility approach attempts to intervene as
soon as possible to help affected workers become reemployed in high quality jobs that
offer high wages, benefits, and job security. Projects using this approach may:
4 Provide services that respond to the crisis adjustment needs of dislocated
workers (e.g., personal and family counseling, financial counseling, and stress
management);
4 Assess individual skills and interests, identify employment barriers and
transferable skills, help workers explore occupational choices, and develop
individual employment goals and strategies;
4 Identify occupations that can benefit from the skills of dislocated workers and
help these workers transfer their skills to these jobs through skills certification,
short-term skills enhancement, or longer-term retraining;
4 Help interested individuals start small businesses or joint ventures that transfer
technology developed in the defense sector to commercial applications;
4 Train workers in the cultural and organizational differences between defense-
oriented and commercially-oriented workplaces;
4 Assist workers to market their defense/military work experience to commercial
employers; and
4 Help workers identify job opportunities in other regions of the country and plan
for relocation, if necessary.
Although many of these design elements are incorporated into other projects
such as EDWAA, the worker mobility demonstrations were built on the premise that
innovative responses to the specific challenges of worker mobility in the context of
defense conversion were needed.

155
The Community Planning Approach
This approach addresses the need for community action to ease the impact of
mass layoffs in the defense industry in a geographical area or in cases where a large
military facility closes down. The community planning approach emphasizes activities
needed to develop a coherent and unified community response to the local situation
and to coordinate available resources to further the selected response. Chart 15 shows
the basic components of this approach. It includes activities such as:
4 Developing effective coalitions that involve State and local officials, public and
private agencies, and interest groups and agreeing on a process for reaching
consensus on key goals;
4 Collecting and analyzing information about the direct and indirect impacts of
defense cutbacks on the local community;
4 Identifying decisions to be made and alternative options for preventing
dislocations (e.g., options for facility reuse, alternative strategies to prevent
further dislocations through services to at-risk firms and workers, possible
service designs and delivery approaches to help dislocated workers adjust, and
analyzing an area’s potential for regional economic development);
4 Identifying available community assets and resources;
4 Using the agreed upon participatory decision process, developing a coherent
and comprehensive plan for the community response that coordinates the
activities of all agencies and individuals; and
4 Mobilizing Federal, State, and community resources needed to develop the
plan and oversee its implementation.
The approach helps communities to identify innovative models that link
workforce development issues and retraining initiatives to plans for longer-term regional
economic development and/or reuse of military facilities.

156
Preventing LayoffsFrom Defense Firms
The study report provides information about efforts to prevent layoffs in six
projects that had dislocation aversion components. These projects were:
4 The Management Assistance and Technology Transfer Program, administered
by the St. Louis County Economic Council in St. Louis, Missouri.
4 The Long Island Defense Diversification Project, administered by the New
York State Department of Economic Development in Long Island, New York.
4 The Strategic Skills Program, administered by the Industrial Services Program
in Massachusetts, which serves the entire State of Massachusetts.
4 The Business Roundtables, administered by a Private Industry Council-led
Consortium in San Diego County, California.
4 The Sargent Controls Project, administered by the Regional Reemployment
Center in Pima County, Arizona.
4 The Machinists Project, administered by the International Association of
Machinists in Burbank, California.
The authors use examples from each of these projects in discussing four key
implementation topics: (1) project goals; (2) recruitment and selection of firms; (3)
services; and (4) project organization. Within each of these topics, important
challenges faced by the projects during the early months of the demonstration are
noted. The authors compare and contrast the experiences of the six projects and
categorize the projects based on how they reacted to or planned for these challenges.
Short descriptions of various aspects of some of the projects are highlighted to
illustrate a particular category of strategies or approaches.
The publication also includes detailed profiles of the dislocation aversion

157
projects. The profiles present information about the context in which the projects
operated, project planning activities, goals, organization, funding, coordination with
other efforts, services provided to firms and workers, and preliminary outcomes.
In summarizing the implementation experiences of the dislocation aversion
projects, the researchers point out that the first challenge that project designers faced
was to set goals that were realistic, measurable, and closely tied to targeting and
service strategies. Most of the projects included in their formal goal statements an
expectation that participating firms would reduce their dependence on the defense-
related activities (as measured by factors such as a reduction of the total sales to a
defense customer or the marketing of a commercial application for a defense product).
A few projects avoided conversion as a goal that could be reached within the
demonstration period. These projects focused on providing services that would
enhance defense-dependent firms’ capabilities to compete in any market.
The second challenge was to identify and enroll firms that were in need of and
could benefit from services that the projects planned to offer. As such, targeting
strategies appropriate to the goals and service strategy were important during the
demonstration’s implementation phase. About half of the projects targeted firms that
had recently begun investing resources in conversion and diversification, and about half
recruited firms that were substantially more advanced in their conversion processes.
While half the projects used detailed recruitment and selection procedures to choose
the firms that most closely matched their target group, the other half practiced more
open recruitment practices.
Another challenge facing project designers was to create or arrange services
that were appropriate to the characteristics and needs of participating firms. The
services to be offered had to be well articulated with the conversion plans and goals of
the firms. The process of assisting defense-dependent, at-risk firms tended to follow
three stages: (1) collecting and assessing information needed to determine the firm’s

158
weaknesses and strengths and to develop a strategic plan for change; (2) developing a
strategic conversion plan; and (3) providing training to employees to prepare them for
conversion processes. About half the projects emphasized services to firms designed
to build commitment or inform and prepare management for developing strategic
conversion plans.
Several dislocation aversion projects emphasized services that built commitment
among company managers and provided information to management about workforce
skills, technological capacities, and other factors important to the conversion process.
(Half the projects skipped this phase, assuming that the firms had already completed
this process.) These projects emphasized training to employees, and to a lesser
extent, managers. The types of training varied. Some projects emphasized training in
skills such occupational training to use new machines, while others emphasized
communication skills, teamwork, and sensitivity training for managers.
The fourth challenge faced by project designers was to administer activities to
maximize firm participation and effort, while ensuring that project managers remained
active partners in selecting and delivering services. While some projects adopted a
“hands-off” approach (offering firms wide discretion in selecting and monitoring
consultant services), others featured close, collaborative relationships with firms,
keeping tighter control over the services that firms received.
Assisting DislocatedDefense Workers
The study report points out that among the first round of DCA grantees, six
projects included elements of worker mobility strategies in their approaches. These
were:
4 Project EARN, administered by McDonnell Douglas Corporation in Titusville,

159
Florida and operated jointly with its partner, Brevard Community College.
4 StepOut, operated by Arizona State University, in Tempe Arizona, in
association with the Arizona Governor’s Office for Women.
4 MilCert, operated by the Clemson University College of Education in Clemson,
South Carolina.
4 A project in San Diego, California, operated by a partnership of agencies led
by the San Diego Consortium and Private Industry Council.
4 A project operated by the Center for Commercial Competitiveness in
association with the State University of New York at Binghamton, New York.
4 A project administered by the International Association of Machinists and
Aerospace Workers in Burbank, California, in association with the Verdugo
Private Industry Council.
The authors summarize the distinguishing features of these demonstration
approaches and identify some of the challenges they faced in the areas of project goals
and objectives, client targeting, service design, and project organization. Detailed
profiles of the worker mobility projects are also provided which offer information about
the context in which the projects operated, project planning activities, goals,
organization, funding, coordination with other efforts, services provided to firms and
workers, and preliminary project outcomes.
In summarizing various aspects of the worker mobility projects, the authors note
that project designers and operators faced several challenges in addressing the needs
of defense industry workers or military personnel who were either dislocated or who
expected to be dislocated.
The first challenge was to identify high-quality reemployment opportunities for
dislocated defense workers, many of whom had advanced technical skills and earnings.
This was a particularly difficult task because a number of the projects operated in labor
markets with limited high-quality job openings. The demonstrations tested several

160
strategies to meet this challenge, including: (1) providing services to help individuals set
and pursue individual reemployment goals; (2) offering skills enhancement training to
give participants an advantage in seeking new jobs in similar occupations; (3) training
participants for jobs in emerging industries or “niche” occupations that could use their
transferable skills; and (4) promoting entrepreneurship in high-technology fields.
A second challenge was to develop clear client targeting goals and effective
procedures to recruit and enroll members of the intended target groups. The authors
note that recruitment of military personnel had been difficult for the two projects that
initially targeted this group. One project gave up trying to recruit military personnel
altogether and the other project, which targeted separated military personnel, contacted
prospective participants in advance of the layoff and recruited personnel stationed
throughout the United States as well as overseas.
Projects that served civilian defense workers fell into two groups: those with
inclusive recruitment goals that intended to serve as many affected workers as
possible, and projects with selective recruitment goals that screened applicants for
qualifications and interests appropriate to the specific occupations targeted by the
project. Four methods were used to meet client targeting goals: (1) attempting to recruit
at-risk workers from defense contractors prior to layoff announcements; (2) participating
in rapid response activities scheduled once layoffs were announced; (3) selecting
appropriate applicants from the pool of dislocated workers enrolled in local JTPA Title
III programs; and (4) contacting individual dislocated workers through discussions with
employers, personal networks, and public media announcements.
The study report points out that projects with inclusive recruitment goals had the
most success using on-site outreach activities directed toward employees of defense-
dependent firms that had announced layoffs or that expected layoffs. Projects with
more selective recruitment goals had the most success in reaching appropriate
applicants by using public media announcements and by reviewing the existing pool of

161
local JTPA Title III enrollees.
The third challenge faced by the worker mobility demonstrations was to offer
applicants a mix of basic readjustment, retraining, and supportive services, and to
ensure that these services were appropriate to the specific employment barriers faced
by dislocated workers and separated military personnel. Rather than offering a mix of
services, these demonstrations emphasized either basic readjustment services or
retraining. When offered, basic readjustments services tended to be narrow, with little
attention to crisis adjustment needs. Neither of the projects that emphasized basic
readjustment services tailored the content of these services to meet specific aspects of
the transition from defense-related to commercial employment.
Projects that emphasized retraining services provided either very short-term or
very long-term training. Only one project offered any supportive services or financial
support to participants using demonstration funds. The authors suggest that the
absence of financial support became a problem in several projects that offered long-
term services.
The final challenge faced by the worker mobility demonstrations was to develop
an organizational structure to promote innovative and effective services to the targeted
population. Projects addressed this challenge by giving the lead administrative role to
agencies that were distinct from the JTPA Title III substate agencies by promoting
partnerships among local agencies (e.g., economic development agencies, educational
institutions, and substate administrative entities). While this organizational structure
encouraged the development of new occupational training designs and enabled
projects to link worker mobility and economic development objectives, it also prevented
projects from developing a full range of responsive services.
Community PlanningProjects

162
Two projects received funding under the community planning category:
4 The Castle Air Force Base Closure Community Planning Project (referred to
as the Merced Project), administered by the Merced County Department of
Economic and Strategic Development, California.
4 The Philadelphia Naval Base and Shipyard Community Planning Project
(referred to as the Philadelphia Project), administered by the Pennsylvania
Department of Labor and Industry.
A third project, the San Diego Defense Conversion Project in California, which
was funded under the worker mobility category, also included a strategy that included a
community planning approach.
The study report describes the events or conditions that the communities were
responding to and analyzes the experiences of the projects in the context of three key
goals. These were: (1) establishing a functional planning body or participation of the
local employment and training community in a planning body; (2) collecting and
assessing information on the effects of closure on local businesses and workers; and
(3) identifying a viable plan to respond to the reemployment needs of dislocated
workers or the needs of at-risk firms. Detailed profiles of the two projects are provided.
In summarizing the study of the projects in the community planning category, the
researchers point out that the two projects were quite different. One eventually evolved
into a worker mobility strategy project, while the other evolved into a dislocation
aversion strategy project. Although neither served as a good example of a “typical
community planning” model, the researchers suggest that the projects’ experiences
during the first two years exemplified several challenges (and strategies to deal with
those challenges) that may be expected in community planning projects.
First, the fact that one project struggled to find a meaningful role for itself within a
163
complex environment where many organizations were already involved in planning
activities, while the other project experienced no such difficulty, underscores the
importance of understanding the effects of contextual factors on community planning
activities.
Second, while one project did not attempt to become involved with a larger
planning body, and the other did, neither seemed to be highly successful in integrating
its objectives with the objectives of other planning bodies.
Finally, both projects made significant progress in achieving their other
objectives, such as collecting and analyzing information about the impact of closures or
massive downsizing on local businesses, or information about the skill levels of affected
workers that may prove important in helping them to find new jobs.
A final report is expected to be published in the spring of 1996.
Conclusions
Several conclusions are offered throughout the study report. They are
summarized below.
4 Regarding the implementation experience of the dislocation aversion projects,
the researchers note that the six projects which were the first round grantees are
testing strategies to avert job loss by working with at-risk firms and workers to
stabilize and improve the firms’ chances for survival. The authors note that the
dislocation aversion approach is the most innovative of all the approaches
funded by the DCA demonstration.
4 Regarding the worker mobility projects, the authors suggest that these projects
differ from many other dislocated worker programs in their attempts to prepare
groups of dislocated defense workers for reemployment in specific occupational
niches offering high-quality jobs. Among the more innovative aspects of the
36See, for example, Katherine Dickinson, et al., A Guide to Well-DevelopedServices For Dislocated Workers (Menlo Park, Calif.: Social Policy ResearchAssociates; Oakland, Calif.: Berkeley Planning Associates; and Menlo Park, Calif.: SRIInternational, 1994), Mary G. Visher, Stephen Walsh, and Ronald D’Amico, ServingDislocated Farmers: An Evaluation of the EDWAA Farmers and RanchersDemonstration (Oakland and Menlo Park, Calif.: Berkeley Planning Associates andSocial Policy Research Associates, 1994), Liz Wiegardt and Phyllis Weinstock, Fromthe Farm to the Job Market: A Guide to Employment and Training Services for Farmersand Ranchers (Oakland and Menlo Park, Calif.: Berkeley Planning Associates andSocial Policy Research Associates, 1994), and Mary G. Visher and Deborah Kogan,Evaluation of the Defense Conversion Adjustment Demonstration: Interim Report onImplementation (Oakland, Calif.: Berkeley Planning Associates and Menlo Park, Calif.:Social Policy Research Associates, 1994). Each of these reports is summarized in thisChapter of the Training and Employment Report of the Secretary of Labor.
164
demonstration project designs are efforts to build closer linkages between
economic development and worker retraining. The authors also point out that
the worker mobility projects that promote individual entrepreneurship are
breaking new ground in their efforts to use small business start-ups as catalysts
for regional economic development.
4 In the area of community planning projects, the study report notes that
although the two projects in this area were highly dissimilar, both made
significant progress in achieving their objectives.
HELPING DISLOCATED WORKERS TOBECOME ENTREPRENEURS
Overview
As a number of the studies summarized in this chapter of the Training and
Employment Report of the Secretary of Labor indicates, the Department of Labor has
designed, implemented, and sponsored numerous initiatives to assist the general
dislocated worker population, as well as special groups such as farmers and defense
workers.36 These efforts have incorporated diverse strategies in their program designs

37Community Development Corporations are generally private, nonprofitorganizations, governed by a board of local residents, business, and civic leaders, withby-laws or a mission statement affirming a focus on economic development. Theygenerally deal with low-income areas and populations, including communities affectedby plant closures.
38National Congress for Community Economic Development, Against All Odds,March 1989; and Changing the Odds, December, 1991, Washington, D.C.
165
to help workers who have lost their jobs through plant closings or mass layoffs receive
the training and services they need to find new jobs.
The Economic Dislocation and Worker Adjustment Assistance Act (EDWAA) Job
Creation Demonstration represents one such strategy. Initiated in June 1991, one of its
directives was to explore the effectiveness of Community Development Corporations
(CDCs)37 and similar organizations in expanding opportunities for dislocated workers
through entrepreneurial training and by establishing linkages with local economic
development activities.
CDCs encompass a wide variety of organizations with disparate aims, clients,
and activities. These organizations created over 54,600 permanent jobs between 1986
and 1990, and helped retain an additional 35,888 jobs in their communities during this
same period.38
A study of the demonstration revealed that one of its key components,
microbusiness training, produced total employment rates that matched outcomes from
traditional EDWAA retraining services, although average initial earnings from
participants who became self-employed were much lower than the average EDWAA
39David Drury, Stephen Walsh, and Marlene Strong, Evaluation of the EDWAAJob Creation Demonstration (Oakland, Calif.: Berkeley Planning Associates, 1994).
166
wage at termination.39
The study’s objectives included:
4 Assessing the effectiveness of the EDWAA Job Creation demonstrations, both
in absolute terms and against the background of other CDC-led job creation
efforts and mainstream EDWAA reemployment training;
4 Providing technical assistance for data collection activities, information
exchange, and dissemination to the EDWAA demonstrations; and
4 Examining the CDC-linked job creation efforts as a whole, with special
emphasis on the projects that served dislocated workers as a target group or
that had service models applicable to dislocated workers.
Demonstration grantees were not held to a specific service model. Rather, they
could change and improve their service arrangements as needed, within the general
guidelines of the demonstration and JTPA legislation. Because the demonstration was
not designed to yield net impact estimates, random assignment was not used and there
was no experimental control group.
The researchers used a variety of methods to address the study’s objectives.
Members of the research team visited each project four times during the demonstration
period. During these visits, they interviewed demonstration project administrators,
trainers, counselors, and other service delivery staff, as well as curriculum designers,
and participants. Training sessions and other activities were observed and participant
case files and data collection procedures were reviewed. EDWAA staff in the substate
areas served by the demonstrations were also interviewed, and information about
substate area client characteristics and outcomes was collected.
167
The study report provides an overview of the job creation field as a whole, with
special emphasis on CDCs, self-employment training, microbusiness lending, and
programs targeted to dislocated workers and other disadvantaged populations. It
includes profiles of the six Job Creation Demonstration projects, discusses recruitment,
curriculum design, the search for business startup capital, coordination with
Unemployment Insurance and EDWAA, and several implementation issues faced by
the demonstrations. Participant characteristics are described, along with an analysis of
both short- and longer-term program outcomes. The study report also explores the
potential of job creation for dislocated workers in mainstream EDWAA programs, and
compares outcomes from the demonstration projects with other self-employment
programs.
Profiles of five supplementary case study programs and participant-level data
items collected from the demonstrations are provided in the publication’s appendix.
The Job Creation Demonstration
Job Creation demonstration grants were awarded to six community development
organizations:
4 MAN-TRA-CON (formerly Illinois Farmers Union-Training) in southern Illinois;
4 The Muskegon Economic Growth Alliance (MEGA) of Muskegon, Michigan;
4 The Greater Atlanta Small Business Project (GRASP) of Atlanta, Georgia;
4 Friends of Children of Mississippi (FCM) in Jackson, Mississippi;
4 HACER, Inc. in the borough of the Bronx, New York City; and
4 The Center for Practical Solutions (CPS) in Hauppauge, Long Island.
In addition to providing demonstration-funded services, one of the grantees
(MAN-TRA-CON) operated as a JTPA substate grantee, and another (MEGA) was a
168
major subcontractor for the local substate EDWAA grantee. All grantees were private
nonprofit organizations with some prior degree of involvement in economic
development activities. The service areas of the demonstration projects reflected the
diversity of CDC service areas nationwide, ranging from rural areas covering several
thousand square miles, to sections of the inner city.
Funding for the demonstration was provided in two stages–an initial 15-month
grant period ending in September 1992, and an option year extending through
September 1993. Grant awards totaled $4.9 million across both periods, with individual
grants ranging from about $607,000 to $925,000.
Services provided centered on self-employment training and assistance for
starting microbusinesses. During the first grant period, three grantees also offered
reemployment training or job search assistance oriented to existing businesses. During
its 27-months of operation, the demonstration projects enrolled a total of 645 self-
employment and 351 reemployment participants.
A Review of Job Creation Efforts
Before discussing the specific EDWAA Job Creation Demonstration projects, the
study report provides information about job creation in general. It describes how these
efforts support EDWAA goals, provides an overview of how CDCs and other
organizations support local economic development efforts (discussing various types of
job creation projects and outlining several microenterprise program strategies), and
provides examples of microenterprise development programs.
In their discussion of the job creation field, the authors point out that job creation
strategies have the potential for addressing problems of worker dislocation at several

40Local Economic Development Corporations are a broad category oforganization that is usually defined to include CDCs. In practice, the distinctionbetween CDCs and other LEDCs has blurred considerably over the past 10 years, andthere is now a great deal of overlap in the types of activities in which they engage.
41Microenterprises are generally defined as businesses with less than fiveemployees and with initial credit needs of under $15,000.
169
levels. They can target new, expanding, or relocating industries to take advantage of
skills already acquired by a community’s dislocated workers. Job creation efforts in a
particular industry can also have a “multiplier effect” that increases overall employment
in an area as new businesses buy or lease space, purchase equipment and services
from other local firms, and augment the local tax base. Thus, owners and employers
“recycle” their income throughout the community by purchasing goods and services.
These efforts also help promote organization and capacity-building at the local level.
The researchers note that CDCs and Local Economic Development
Corporations (LEDCs)40, working in conjunction with city or county economic
development offices and redevelopment agencies, enterprise zones, small business
development centers and minority business development centers, community colleges,
loan and industrial revenue bond programs, private foundations, and JTPA Title II and
Title III programs, are often at the center of job creation efforts. The study report
describes these activities and provides examples of job creation initiatives that are
typically undertaken by these organizations. These include commercial and industrial
development, business enterprises (CDCs may have for-profit components that
become involved with business ventures, or they may make equity investments in
businesses managed by others), customized training, and microenterprise41
development.
Because they are important components of job creation efforts, the study report
provides information about microenterprise program strategies, pointing out that

170
microbusiness entrepreneurs typically require varying amounts of capital, but often lack
the income and assets to qualify for any type of commercial loan. The study report
reviews some sources of loan funding, which may include State funds, Federal funds
(including the Small Business Administration’s Microloan Demonstration Program),
private foundations, and commercial capital (which is often limited in relation to
demand). Loans may be made to individuals, or to groups known as “peer lending
circles,” which generally consist of four to six borrowers.
In addition to capital, many potential entrepreneurs also need the knowledge and
skills required to start and operate new businesses. The researchers point out that
microenterprise development programs address this need by providing a variety of
training activities, which may be offered on a one-to-one basis or to groups, in
classrooms with a set curriculum, or informally on an as-needed basis by a business
mentor.
New entrepreneurs can also benefit from supportive and affordable work
environments. Small business “incubators” have been developed to meet this need.
These facilities offer a range of support to new businesses which may include low rent,
office support for accounting and purchasing, access to office machines, bulk
purchasing pools to obtain lower prices on materials, help in locating capital, and
management guidance. Technology-oriented incubators may also offer specialized
tools and facilities for product development. Some may provide linkages with corporate
or university-based research groups.
Incubators can create jobs in two other ways. First, short-term construction jobs
and training opportunities may be created as the incubator facility itself is rehabilitated
and prepared for use (many business incubators are developed in existing facilities
which are rehabilitated for this purpose). Secondly, the new businesses supported by
incubators may hire small numbers of employees, which may increase as successful
businesses expand and eventually leave the incubator.
171
Several examples of microenterprise development programs are provided,
including special programs that target women, ethnic groups, recipients of income
support payments, low income individuals, and dislocated workers.
The EDWAA Job CreationDemonstration Projects
The study report includes synopses of each of the six EDWAA Job Creation
Demonstration projects. Information about the setting, organization, major services
provided, and distinctive features of the projects is provided. Highlights of these
synopses follow.
BEST Program
The BEST program was characterized by close ties with the mainstream
EDWAA program, open-entry/open-exit classroom training, multiple approaches to
training, startup counseling, and business-oriented computer training for participants.
Recruitment and lack of access to loan capital were the major problems encountered.
The study report provides details of the program, noting that MAN-TRA-CON (for
“management, training, and consulting”) received a total of $908,000 in demonstration
funds over the two grant periods. The program provided self-employment training to 67
dislocated workers in southern Illinois. Fifty-four percent of the enrollees started
businesses during the grant period, and created 18 additional employee jobs. The
program’s service model and training curriculum were suitable for dissemination to both
urban and rural areas.
172
The program served a 2,400 square-mile area with a population of about
220,000. The area had experienced a decline in high-sulfur coal production and major
layoffs also occurred in retail department stores, printing, and service industries.
Unemployment in the five-county area averaged 11.4 percent in August 1993.
Throughout the initial grant period, MAN-TRA-CON, a nonprofit community-
based organization, subcontracted with staff of the Small Business Incubator Program
which was operated by the Office of Economic and Regional Development at Southern
Illinois University for business training and follow-up services. Entrepreneurship
classes were held at a community college as well as at the incubator facility.
(Administrative changes at the Incubator in 1992 resulted in shifting the training
subcontract to American Enterprise Systems (AES) and all business training activities
were later consolidated at the AES site, with little disruption to the program.)
Although a third of its participants were former coal miners, the BEST program
was designed for the general dislocated worker population. All participants were co-
enrolled in the mainstream EDWAA program in order to make them eligible for support
services and occupational skills training if needed.
Staff developed their own training model and materials. Training consisted of
three, 13-week phases. Using an open-entry/open-exit approach, the classroom
training was modularized into marketing, management, and finance units. The second
component of the training was the BEST Club—less formal meetings which covered
such topics as time and stress management, and business-related computer skills. The
program also offered monthly seminars covering topics such as taxes, market research,
and franchising.
After completing classroom training, participants were eligible for 26 weeks of
business plan development and startup assistance. Technical assistance was available
for up to two years after enrollment. A computer lab was set up at the AES site,

173
offering intensive training in word processing and accounting software. A computer
package was also developed to help participants develop their business plans.
Muskegon Economic Growth Alliance (MEGA)Job Creation Demonstration Program
The MEGA program was characterized by close ties to the business community
as well as the substate area service provider. It offered a wide range of both
reemployment and self-employment training. Like MAN-TRA-CON, it took full
advantage of existing EDWAA arrangements for occupational skills training, on-the-job
training, and basic skills training. Through its ties to a Small Business Development
Center and other economic development activities, MEGA offered training services to
relocating and expanding businesses, and provided support for EDWAA participants
who were interested in starting microbusiness. The program’s chief implementation
problems were a lack of access to capital, problems in coordinating individual technical
assistance for business startups, and staff turnover in key positions.
The program offered services to dislocated workers primarily from Muskegon
and Oceana Counties in western Michigan. In addition to its role as one of the largest
economic development organizations in the area, MEGA served as the main EDWAA
service provider for the substate area. The project’s major goal was to demonstrate
how local economic development entities could work closely with mainstream EDWAA
programs to provide more comprehensive services. It was funded at $804,800 over the
two grant periods and accepted 104 self-employment participants and 263
reemployment participants. Forty-six percent of the self-employment trainees started
businesses, and 79 percent of the reemployment terminees found unsubsidized
employment.
The researchers point out that the local economy in the area served by the
174
program had historically relied on the manufacturing sector, and that this sector had
declined over the past decade. MEGA, a private, nonprofit community organization
formed in 1988 to address serious economic problems confronting Muskegon County,
had become a focal point for local economic development and training efforts.
As part of the intake process, applicants who expressed interest in self-
employment received an assessment followed by a group orientation session.
Individual interviews with the project coordinator, in which participants could discuss
their business ideas, were then conducted.
Once enrolled, self-employment participants attended a 12-week (or more
intensive six-week) business class covering such topics as marketing, legal issues,
management, and financing. Regular classroom sessions were supplemented by group
meetings featuring speakers from the business community.
Participants who had completed their business plans could apply for supportive
services payments of up to $3,000 (later changed to $1,000).
During the startup phase, participants were eligible for ongoing technical
assistance from the Small Business Development Center, supportive services, and
classroom training for work-related skills, supplemented by entrepreneur support group
meetings.
Participants in the demonstration’s reemployment service track received basic
readjustment services and classroom or on-the-job training. All were co-enrolled in
EDWAA. Reemployment participants went through an extensive two and a half day
assessment that included reading and math tests, values clarification exercises, interest
and ability surveys, and career exploration. Demonstration funds were also used to
expand on-the-job training and job development efforts in a four-county area, with
special targeting of new and expanding employers. The on-the-job contracts that

175
resulted from these efforts were then funded through the substate area using JTPA
Title III formula funds. (The reemployment track was dropped in the grant’s option year
as the program focused on self-employment training.)
Friends of the Children of Mississippi Project
The Friends of the Children of Mississippi (FCM) project demonstrated ways to
use grassroots-level organizing techniques to promote microbusiness training in poorly
served rural areas. Many aspects of the program were designed to meet the special
needs of low-skilled, long-term unemployed individuals. The demonstration featured a
strong emphasis on self-help, family and community needs, and modest, but practical,
steps to overcome difficult circumstances. Apart from external obstacles like the lack of
capital and a stagnant local economy, the project’s greatest difficulties stemmed from
its highly decentralized organization.
Operating largely within seven counties in Mississippi, the project offered
microbusiness training and referrals for basic skills and occupational training, as well as
an extensive personal motivational and life-skills workshop. Over the course of the
demonstration, the program was awarded $677,565 in Department of Labor funds. It
enrolled 142 participants in its self-employment track and 19 in its reemployment track.
Of those in self-employment, 47 percent started businesses, creating 35 full- or part-
time jobs in addition to the owners’ positions. Fifty-three percent of those in the
reemployment track found jobs or entered academic training programs.
The project operated in a dispersed area of central Mississippi which covered
about 4,200 square miles, with a total population of about 175,000. Although some
manufacturing jobs were available in the area, farming and transfer payments were the
largest sources of income. Per-capita incomes were among the lowest in the United
176
States and unemployment rates ranged from six to 25 percent during the demonstration
period. The true extent of unemployment may have been obscured by the area’s low
labor force participation rates.
The study report provides details of the program, noting that the service
infrastructure for training and business development was spread thinly across the
region.
Although the bulk of FCM’s (a nonprofit corporation) activities centered on the
Head Start program, it also operated a Self-Employment Initiative Demonstration
(SEID) grant for Aid to Families with Dependent Children recipients, and a SEID-type
program for dislocated workers under a JTPA Title III subcontract.
The researchers found that FCM’s service delivery arrangements were the most
decentralized of all the demonstrations.
Recruitment was accomplished through brochures, notices posted in
Employment Service and other service agency offices, public service announcements
and word of mouth. Relatively few participants were referred by the substate area.
After intake, all participants were required to complete a three-week, 27-hour
workshop which combined basic skills testing with training in stress management,
personal finances, job search “world of work,” and self-motivation. Participants entered
either the microbusiness training or reemployment track upon completion of the
workshop. Reemployment participants were originally offered immediate job search
and placement assistance, referral for General Educational Development (GED)
equivalency degree preparation, and referral for occupational skills training or academic
course work leading to a two-year associate’s degree. (The reemployment track was
dropped in the grant’s option year.)
42About six participants received building maintenancetraining.
177
Microbusiness candidates were screened using the Small Business
Administration Entrepreneurial Quiz, a family needs assessment, and a personal
interview. This track was oriented primarily toward simple enterprises that would help
participants become economically self-sufficient with relatively little startup capital. It
was a six-week, 72-hour course that provided a basic introduction to marketing,
production, business management, and accounting. After completing this training,
participants received three additional weeks of individual help in refining their business
plans.
In its final year, the program provided supportive service payments for business
startup expenses. (Fifty grants were made at an average of about $1,130 each.)
Informal peer groups, known as ACCESS (“assist, comfort, cultivate, encourage,
support and sustain”) were developed, and informal incubators were developed by
project participants to share space and facilities.
Project Excel
In New York City’s South Bronx, HACER, Inc. operated Project Excel, a program
designed to provide both self-employment and reemployment training to Spanish-
speaking dislocated workers.
The project offered an innovative approach to self-employment for
disadvantaged clients in a troubled community. It provided fairly short-term training in
essentially a single occupation (home-based child care), combined with substantial
individual support.42

178
Self-employment candidates were trained and certified to provide child care
services in their own homes. The reemployment training track was dropped as a
medical supplies company, which was the focal point of training and placement
activities, lost the contract under which it planned to hire participants. Nevertheless,
118 self-employment participants and 69 reemployment participants received training,
resulting in 41 home-based child care businesses and 39 job placements.
HACER received a total of $935,428 in funding over the course of the
demonstration.
The study report provides details of the program, suggesting that on almost any
index of social or economic well-being, the South Bronx would rank at or near the
bottom. One bright spot was the fact that Port Morris, the central neighborhood of
Project Excel was a local employment center, with nearly 400 businesses and over
20,000 workers. Warehousing, shipping, packing, and industrial supply businesses
accounted for many of these positions, as did a number of small manufacturers.
The unemployment rate in the South Bronx was as high as 12 percent during the
demonstration and this figure did not include a large number of discouraged workers
who were no longer in the labor force.
HACER, Inc. was established in 1979 as a nonprofit community-based
organization. Many of the project’s participants became aware of the program through
public service announcements on a local Spanish-language radio station. Local
unemployment insurance offices and word of mouth referrals also provided the
demonstration with clients.
Excel’s assessment procedures consisted of a math test, a vocabulary and
reading test, and a test of oral proficiency. The researchers note that Excel targeted

179
applicants who were in the greatest need of services and that this strategy may have
had negative effects on the program’s outcomes relative to other demonstration
grantees.
After assessment, participants received self-employment or reemployment
services, depending on their preference. The project’s self-employment track offered
only one course, which centered on in-home day care and helped participants gain
State certification. One of the reasons that the program targeted family day care was
that participants could operate this business without learning English. (This differed
significantly from the other demonstration efforts which provided general business
tracks for self-employment participants.) The family day care course met twice a week
for two hours over a period of 10 weeks. Participants also attended GED and English-
as-a-second language courses, depending on their needs and interests. After the
course, participants worked with project staff to complete applications for State
certification. They also received an in-kind stipend of equipment required for
certification (e.g, fire extinguishers and other required equipment).
As originally designed, the project’s reemployment track was intended to train
and place individuals with a local medical supply firm. Because these jobs never
materialized, the customized training component for those in the reemployment track
was never implemented. However, basic skills classes, supplemented with job search
assistance, which were originally developed for the reemployment track, continued for
the life of the program on an open-entry/open-exit basis, while HACER job developers
attempted to find alternative employment for these participants.
In the final months of the demonstration, the project began working on a
reemployment initiative that would provide jobs for participants in a worker-owned home
cleaning business.
Project New Ventures

180
Project New Ventures was operated by the Greater Atlanta Small Business
Project (GRASP), a nonprofit organization founded in 1987 as a joint project of Fulton
County and the City of Atlanta. GRASP was established to help expand and stabilize
the local economy by fostering small business growth.
The project offered substantially longer training than its counterparts in the
demonstration and served dislocated workers along with low-income individuals.
Demonstration clients were actually a minority of all participants served by GRASP.
Implementation problems faced by the project included staff turnover during the first
year of the program and a lack of startup capital for participants.
GRASP received $607,426 in funding and served 66 clients, 30 of whom started
businesses.
Although the project served the entire Atlanta metropolitan area, with a
population of 2.7 million, 80 percent of its clients and businesses were located in Fulton
county, which includes the city of Atlanta. Primarily a service-oriented city with a
relatively healthy economy, Atlanta had been hit by several large-scale layoffs and
business closings. Since the end of 1990, the city had lost over 13,000 jobs in large-
scale dislocations alone.
GRASP served both existing and startup businesses in several programs, and
received funding from a number of local and Federal sources. In addition to Project
New Ventures, the organization operated a business development initiative that
provided technical assistance and mentoring to new and existing businesses in
economically depressed areas, a management assistance program that provided
services and training to owners of existing small businesses, a Small Business
Administration-funded program that provided marketing assistance to existing

181
businesses, a demonstration project that provided entrepreneurial training to low-
income individuals, and a project that assisted entrepreneurs in two low-income target
areas.
Although GRASP had always provided mentoring, technical assistance, and
counseling for existing small businesses, classroom training was not originally offered.
In 1990, however, the organization developed its own classroom training. Curricula
emphasized practical knowledge and trainers with hands-on experience from the
business community were recruited. An entirely new curriculum was developed for
Project New Ventures to help participants start their businesses.
In addition to serving demonstration participants, Project New Ventures (with
some funding from other sources) served a number of clients who were not in the
demonstration.
Client recruitment was carried out through print advertisements and public
service announcements. Prospective candidates attended an orientation seminar,
completed an application, and went through an initial assessment that included
personality, vocational interest, and aptitude tests.
GRASP staff found that the best candidates for entrepreneurship had good basic
skills, some work or business experience, a strong desire for achievement, good
business ideas, and some savings, assets, or other personal financial resources. Staff
considered these factors and looked closely at personality and motivation in selecting
participants.
The project’s business training involved two phases. The first phase consisted
of 22 weeks of classroom training, with an additional two weeks of business plan
refinement. The training featured four modules–business feasibility, business basics,
marketing, and business plan development. Training culminated in the production of a

182
final business plan. The second phase, business development and startup, followed.
Clients worked with a mentor who provided ongoing technical assistance and
counseling throughout the business startup phase.
During most of the demonstration, GRASP did not provide startup capital for
demonstration-funded programs, although five clients received loans late in the
demonstration period.
The Center for Practical Solutions
The Center for Practical Solutions (CPS), based in Hauppauge, Long Island,
operated a self-employment program that underwent a series of changes over time.
CPS began the demonstration with an ambitious and innovative model for regional
revitalization, but ended with a self-employment program quite similar in approach to
other demonstration grantees. The project’s major service was self-employment
training, although a variety of additional services, including business planning, sales
training, and goal setting seminars complemented this effort. CPS’s major
implementation difficulties resulted from an overly ambitious organizational mission, an
open admissions policy in the project’s first year, and a lack of startup capital.
CPS originally planned to retrain dislocated defense workers as entrepreneurs
and cooperated with local industries to develop new products and services. It received
$972,248 in funding and served 148 clients, helping 72 of them to create new
businesses.
The organization’s service area consisted of Long Island’s two suburban
counties, Nassau and Suffolk, with a combined total population of 2.6 million. In the
early 1990s, defense cutbacks, combined with a lengthy recession, resulted in record
job losses for the area.

183
CPS was founded in 1990 as a nonprofit membership organization to work with
dislocated professionals and local business to advance peacetime economic growth on
Long Island. In the demonstration’s first year, CPS organized its activities within a
matrix of business and industry areas. It employed business planners with special
expertise in technology, engineering, marketing, public relations, information services,
and research. The business planners organized participants into industry area groups,
composed of five to 10 participants who were developing businesses in the same
technical area (e.g., biotechnology, trade, or information processing).
The organization experienced a number of changes at the beginning of its
second year. Industry areas were dropped, the number of staff was reduced, and the
initial goal of revitalizing the local economy was scaled back.
A major focus of CPS services in the first year was the development of business
ideas among participants. This was abandoned the second year as project staff
became more selective in their acceptance of new applicants. Also after the first year,
the program broadened its target group from defense professionals to dislocated
workers in general.
Recruitment efforts included a mix of press releases, paid advertising, and
presentations to professional and business associations.
As originally designed, the CPS self-employment training combined classroom
training with an innovative team approach to business development. The team
approach was dropped the second year as it distracted participants from business
development.
Upon enrollment, clients were guided toward an entrepreneurial skills training
class which addressed various components of business plans. Self-employment
184
participants also received a range of services, including weekly meetings devoted to
entrepreneurial concepts, sales, and public speaking, plus occasional seminars on
topics such as team-building or goal-setting. During both years of the project, business
planners (experienced business people) served as mentors to participants.
Service Models andImplementation Issues
Based on four rounds of site visits conducted between December 1991 and
August 1993, the study report highlights issues related to client targeting, project
design, service model development, and project implementation which were found
throughout the various demonstrations. Key observations which cut across most of the
demonstration projects are noted below.
4 For the most part, the demonstrations employed two basic service models:
training and support for microenterprise development, and occupational or job
search training for individuals seeking work in existing businesses.
4 All six demonstrations had a self-employment component, which was usually
the projects’ main emphasis.
4 Demonstration grantees were engaged in an appropriate but somewhat
narrow set of activities centered on individual training.
4 Overall project designs were shaped to some degree by their goals and
specific target populations; there were substantial differences in the types of
dislocated workers recruited by the various demonstrations.
4 All of the demonstration’s self-employment programs were variations on a
generalized service model (see Chart 16), which began with recruitment,
orientation, and general assessment, followed by classroom training in business
skills and personal development training. Participants then developed business
plans, received technical assistance and support to begin their businesses, and
received some type of post-startup assistance.

185
4 Two basic approaches to recruitment were used. Two organizations, which
were established substate entities, relied on existing recruitment channels used
by the substate area for the general JTPA Title III population. The other projects
recruited largely through independent channels such as newspaper
advertisements and public service announcements.
4 Eligibility determination procedures were difficult for CDCs and other
organizations that had no prior EDWAA experience.
4 All but one of the demonstrations tested applicants for basic literacy and
mathematical skills. Four basic assessment and screening elements were
common in all of the programs: (1) a written assessment of business-specific
abilities and interest; (2) an interview with experienced program staff; (3)
demonstrating commitment and reliability by attending personal development
training; and (4) psychological testing.
4 All grantees were offered some form of classroom training for self-
employment, although courses differed considerably in their length and format,
particularly during the demonstration’s first year. Several factors related to
classroom training were common in each of the grantees–it should be relatively
short, provide an adult learning approach, be supplemented with individual
business counseling as well as emotional support, allow for differences in the
types of business that participants want to start, take in to account various
ethnicity and gender issues, and integrate business plans into the curriculum.
4 All of the demonstrations’ service models included a step in which participants
developed business plans; those with integrated classroom training worked best.
4 Although all grantees provided individual help during the business startup
phase, the intensity and quality of the help differed considerably.
4 The lack of access to startup capital was a significant problem in all of the
demonstrations and all of the grantees stressed the need for Federal support in
this area. (After exhausting several avenues for obtaining microloans and
financial support for participants, five of the six grantees eventually obtained
Department of Labor approval to provide supportive services payments that

186
served some of the same functions as working capital grants).
4 Although four of the original grantee proposals highlighted ties with business
incubators, the effects of these linkages on demonstration services were indirect,
at best. Incubators did not fulfill the roles they are usually expected to play in
self-employment programs.
The report also discusses a number of general organizational issues relating to
the demonstration projects. These include project staffing, organizational capacity and
experience, and project linkages to mainstream EDWAA programs and to
unemployment insurance.
The researchers provide examples of implementation problems encountered by
the various projects including staff recruitment, management, and matching staff
expertise to the needs of participants at different stages of their training. Several basic
staffing principles for self-employment components were noted, including: (1) staff
responsible for business instruction, individual technical assistance, and the business
aspects of assessment should have small- or microbusiness experience; (2) qualified
in-house staff or consultants should be used to help participants understand various
areas related to finance/accounting, marketing, and law; (3) staff must be accountable
to the program in some way, even if they are not employed by it (service designs should
be cautious about relying on volunteers); and (4) if warranted by the size of the
program, the positions of the director, administrative assistant, and instructor/mentor
should be full-time positions.
In the area of organizational capacity and experience, the study report suggests
that fundamental changes in programs, as they evolved, may have been reduced if the
grantees had greater experience in self-employment training and technical assistance,
and stronger organizational linkages to other organizations involved with local
community development.
187
Regarding linkages with mainstream EDWAA programs, the study found that
most of the grantees did establish closer ties with EDWAA over the course of the
demonstration, especially for referrals into self-employment tracks.
The report also points out that establishing good relations with the
unemployment insurance system was an important aspect of the demonstrations for a
number of reasons. Although problems with unemployment insurance coordination
were not as serious as expected overall, they did call for adaptive responses on the part
of some grantees.
Finally, in the area of dissemination activities, the researchers found that all of
the grantees took steps to generate local publicity about their activities.
Analysis of Participant-Level Data
Based on data collected through forms completed by program participants, the
researchers were able to analyze various participant characteristics (including sex, age,
ethnicity, and education), work experience (including occupation and industry at layoff,
as well as earnings at layoff, job tenure, and self-employment experience), and receipt
of unemployment insurance and other benefits (including the reasons for their eligibility
and the time between their layoff and application for benefits). The researchers also
used client data to compare participant characteristics with those of mainstream
EDWAA clients.
The study report presents outcomes for clients who had enrolled in self-
employment components (including business startups and survival rates). Business

188
characteristics six months after startup are also presented (including types of business
started, hours, the amount of participants’ financial resources invested in their
businesses, sales and earnings, employees and business partners, location, and the
types of business organizations formed). The report also includes information about
reemployment outcomes for those participants who were enrolled in self-employment
tracks but failed to start new businesses.
Selected demographics of self-employment participants are shown in Table 20.
Overall, just over half of the participants were male (52.4 percent), and almost 55
percent were 30-44 years old. Forty-five percent were white, while 31.1 percent were
black, and 22.8 percent were Hispanic. Just under one third (31.1 percent) had some
post-high school education.
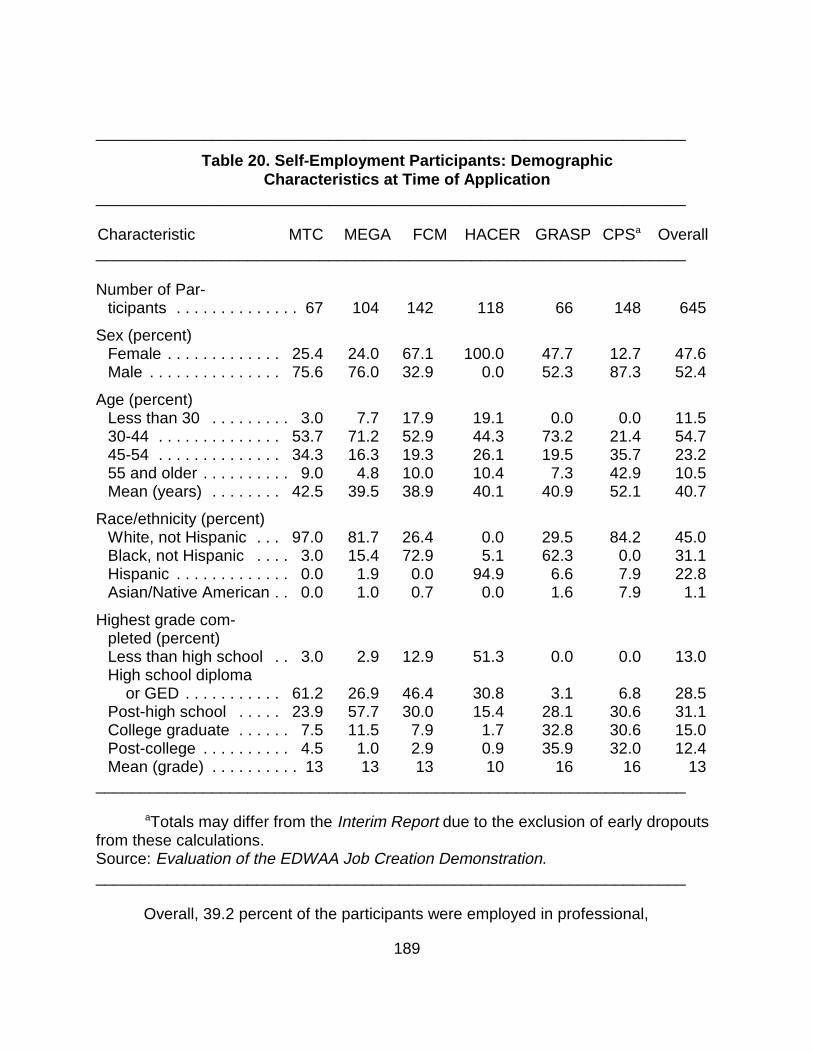
189
__________________________________________________________________
Table 20. Self-Employment Participants: DemographicCharacteristics at Time of Application
__________________________________________________________________
Characteristic MTC MEGA FCM HACER GRASP CPSa Overall__________________________________________________________________
Number of Par-ticipants . . . . . . . . . . . . . . 67 104 142 118 66 148 645
Sex (percent)Female . . . . . . . . . . . . . 25.4 24.0 67.1 100.0 47.7 12.7 47.6Male . . . . . . . . . . . . . . . 75.6 76.0 32.9 0.0 52.3 87.3 52.4
Age (percent)Less than 30 . . . . . . . . . 3.0 7.7 17.9 19.1 0.0 0.0 11.530-44 . . . . . . . . . . . . . . 53.7 71.2 52.9 44.3 73.2 21.4 54.745-54 . . . . . . . . . . . . . . 34.3 16.3 19.3 26.1 19.5 35.7 23.255 and older . . . . . . . . . . 9.0 4.8 10.0 10.4 7.3 42.9 10.5Mean (years) . . . . . . . . 42.5 39.5 38.9 40.1 40.9 52.1 40.7
Race/ethnicity (percent)White, not Hispanic . . . 97.0 81.7 26.4 0.0 29.5 84.2 45.0Black, not Hispanic . . . . 3.0 15.4 72.9 5.1 62.3 0.0 31.1Hispanic . . . . . . . . . . . . . 0.0 1.9 0.0 94.9 6.6 7.9 22.8Asian/Native American . . 0.0 1.0 0.7 0.0 1.6 7.9 1.1
Highest grade com-pleted (percent)Less than high school . . 3.0 2.9 12.9 51.3 0.0 0.0 13.0High school diploma or GED . . . . . . . . . . . 61.2 26.9 46.4 30.8 3.1 6.8 28.5Post-high school . . . . . 23.9 57.7 30.0 15.4 28.1 30.6 31.1College graduate . . . . . . 7.5 11.5 7.9 1.7 32.8 30.6 15.0Post-college . . . . . . . . . . 4.5 1.0 2.9 0.9 35.9 32.0 12.4Mean (grade) . . . . . . . . . . 13 13 13 10 16 16 13
__________________________________________________________________
aTotals may differ from the Interim Report due to the exclusion of early dropoutsfrom these calculations.Source: Evaluation of the EDWAA Job Creation Demonstration.__________________________________________________________________
Overall, 39.2 percent of the participants were employed in professional,

190
technical, or managerial positions prior to layoff, and the largest percentage (42.6
percent) were in the manufacturing industry at layoff. The mean hourly wage at layoff
was $12.41 and the mean number of years in their prior job was 5.6. Slightly less than
18 percent had been self-employed at some time in their careers.
At the time of program application just under half (49.2 percent) of the self-
employment participants were receiving unemployment insurance and the mean
number of weeks that participants received unemployment insurance was 15. A
significant percentage (43.6 percent) were receiving unemployment insurance because
of their recent layoff and the mean time between layoff and application was 54.6 weeks.
Just under 10 percent of the self-employment participants were receiving Aid to
Families with Dependent Children at the time of program application and 15.3 were
receiving food stamps.
Demonstration participants differed from mainstream EDWAA clients in several
ways. Although overall, the demonstration projects served males and females in
proportions that were very similar to the national average for JTPA Title III (EDWAA)
programs, demonstration participants were generally older and better educated.
In reviewing the outcomes of the demonstration’s self-employment component,
the researchers found that even though the actual number of businesses started varied
widely across the various projects, about 45 percent of the self-employment participants
started businesses. Of these, over two-thirds (76.3 percent) were still in business 12
months after startup.
Almost half of the new businesses started were in the service sector and the
mean time spent working on the businesses, across all projects, was 39 hours per
week. During the six-month period between startup and followup, participants invested
an average of $8,200 of their own savings in their businesses. Also, on average,
participant businesses had attained cumulative gross sales of more than $15,200
during the six-month followup period (although 24 percent of the participants reported
sales of less than $500 during this period). Overall, 12 percent of the new businesses
had paid employees. Although participants typically operated their new businesses
from their homes, about one in five had moved to commercial space within six months
43Substate area programs were contacted in Arizona, California, Massachusetts,Michigan, Missouri, New York, Texas, and Washington; State-level officials wereinterviewed in Delaware, Georgia, Massachusetts, Michigan, and Mississippi.
191
after startup. Seventy-three percent of the new businesses were set up as sole
proprietorships.
The researchers also looked at the outcomes for participants in the three
demonstration sites that offered reemployment tracks (MEGA, FCM, and HACER). The
study report notes that by the time of termination, 72 percent of all reemployment
participants served under the demonstration had found employment. This rate was
identical to the national average for EDWAA participants.
Job Creation in OngoingEDWAA Programs
The researchers suggest that if any significant expansion of job creation
activities for dislocated workers is to occur, it will be in the context of EDWAA or some
other ongoing program rather than through separate demonstration efforts. For this
reason, they investigated the experience of some State and substate programs involved
with self-employment training within mainstream EDWAA operations. The researchers
reviewed several EDWAA programs in an attempt to explore the range of service
delivery arrangements used for self-employment training and to assess administrative,
financial, and other barriers to the wider replication of job creation efforts in the EDWAA
system. Information was obtained from 11 substate areas in eight States,
supplemented by discussions with State-level officials in five States.43
Based on their investigation, the researchers determined that four basic service
models had been implemented (or were being considered) by EDWAA substate areas
to help dislocated workers who were seeking entrepreneurial training. These are
summarized below.
192
4 Model 1: Class-sized subcontracts for microbusiness classroom training, with
follow-on support provided by the training contractor, a CDC, an incubator
facility, or the local Small Business Development Center.
4 Model 2: Self-employment training conducted by substate area staff, with
technical assistance provided in-house or by referral to a Small Business
Development Center or CDC.
4 Model 3: Individual referral contracts with a local CDC or small business
incubator for self-employment training and support.
4 Model 4: Referrals to the Small Business Development Center, community
college courses, or other forms of entrepreneurial training that do not involve
enrollment in EDWAA, or further substate area involvement.
The study report provides profiles of several EDWAA-funded microenterprise
programs that used a variety of service models.
In summarizing their findings about the ability of mainstream EDWAA programs
to provide successful self-employment opportunities, the researchers note that State
and substate area staff pointed to the JTPA performance standards and other
administrative regulations as barriers to expanding microenterprise training. The study
report discusses definitional, reporting, and service design issues arising from the
incompatibility of microenterprise initiatives and mainstream EDWAA arrangements.
The report also points out that after JTPA performance standards and administrative
requirements, lack of access to capital was the barrier most frequently cited by the
sample of EDWAA respondents. Several unemployment insurance regulations were
also noted that posted obstacles for microenterprise programs that worked with
dislocated workers.
Conclusions andPolicy Recommendations
The study report offers several conclusions about the effectiveness of
microbusiness training based on the demonstrations’ experiences, as well as those of

193
other CDCs and EDWAA programs that were engaged in job creation. These
conclusions follow.
4 The EDWAA Job Creation Demonstration achieved significant results from
self-employment training. However, it was not designed to measure net impacts,
and the extent to which outcomes are due to demonstration activities is not
known.
4 Self-employment training under the demonstration produced total employment
rates that matched outcomes from traditional EDWAA retraining services, but
initial earnings from self-employment were much lower than average EDWAA
wage at termination.
4 Microenterprise strategies offer a number of longer-term benefits for
individuals and communities if program sponsors are prepared to accept the
risks involved.
4 Self-employment is a viable strategy only for a small subset of the dislocated
worker population. Programs need to develop selection and screening
procedures to ensure that participants are highly motivated, aware of the risks
and work involved, and are prepared to focus on a specific business idea.
4 Training for entrepreneurship is fundamentally different from reemployment
training. Its goal is not merely to provide business skills, but to help develop a
new and viable organization, a business entity, that will support the participant.
This basic difference has a number of implications for program design and
service delivery.
4 It is vital for self-employment programs targeting dislocated workers to provide
access to capital. For many participants, training alone is not sufficient to ensure
successful outcomes.
4 Establishing good working relations with State and local unemployment
insurance offices is particularly important for self-employment programs targeting
dislocated workers. Programs that fail to reach a firm understanding with
unemployment insurance about allowable activities risk the loss of benefits for
their participants.
194
4 Although the Job Creation demonstration projects were not subject to EDWAA
performance standards, these and certain other administrative requirements
have posed serious obstacles for mainstream EDWAA programs seeking to
become involved in microbusiness training.
4 If the Department of Labor wishes to expand the scope of self-employment
training for dislocated workers, initiatives that could be pursued include: (1)
providing training and technical guidance for substate areas interested in offering
microenterprise training; (2) providing incentives for substate areas to expand
local linkages with CDCs and similar organizations that are experienced in
microbusiness and other forms of job creation; and (3) supporting the expansion
of microlending opportunities for dislocated workers.
HELPING DISLOCATED WORKERS THROUGH EARLY INTERVENTION
Overview
Throughout its history, the Unemployment Insurance program has provided
temporary financial assistance for millions of workers whose job loss was primarily
caused by variations in the business cycle. In the past, most unemployed workers
received UI payments while they looked for a job which was generally similar to the one
lost.
Recently, however, global competition and rapidly evolving technologies have
resulted in job losses for millions of American workers. A large percentage of these
“dislocated” workers must find new jobs that require different skills than those needed
for their previous job. As a result, these workers may need additional education,
training, and other reemployment assistance.
The vast majority of dislocated workers are already served by the UI program.
While most of these workers need the temporary income provided by UI benefits, they
may also need reemployment services to help them make the transition from their

44The Worker Profiling and Reemployment Services System:Legislation, Implementation Process and Research Findings(Washington, D.C.: U.S. Department of Labor, Employment andTraining Administration, Unemployment Insurance Service, 1994).
45The language is found in Public Law 103-6, Section 4,“Profiling of New Claimants” and Public Law 103-152, Section 4,“Worker Profiling.”
195
previous jobs to new ones. Further compounding their problem is the fact that
dislocated workers often delay their job search–believing that they will eventually return
to their old jobs.
The Worker-Profiling and Reemployment Services System
The Worker Profiling and Reemployment Services System (WP/RS) is an early
intervention approach that helps dislocated workers speed their return to productive
employment. It consists of two components: (1) a set of criteria–a “profile”–that can be
used to identify UI claimants who are likely to exhaust their UI benefits before they find
a new job; and (2) various reemployment services. Profiling selects those UI claimants
who are likely to be dislocated workers out of the broad population of UI claimants and
refers them to reemployment services early in their unemployment spell. Over the next
several years, profiling may be used to select about two million dislocated workers from
the eight to nine million UI initial claimants.
Under the WP/RS system, individuals identified as probable dislocated workers
receive a set of reemployment services which are customized to their individual needs.
Followup information on referred claimants is collected from organizations providing
such services and then forwarded to the UI program.
In 1994, the Office of Legislation and Actuarial Services of the Department of
Labor’s Unemployment Insurance Service published a report44 that contains Federal
legislative language on profiling.45 It also contains a variety of public releases by the

46The following releases are included: (1) UnemploymentInsurance Program Letter No. 13-94, which includes a copy ofPublic Law 103-152–Unemployment Compensation Amendments of1993–“Provisions Affecting the Federal-State UnemploymentCompensation Program”; (2) Unemployment Insurance Program LetterNo. 13-94, Change 1, which provides draft language “Failure toParticipate in Reemployment Services”; and (3) UnemploymentInsurance Program Letter No. 41-94, “Unemployment InsuranceProgram Requirements for the Worker Profiling and ReemploymentServices System.”
47 This material includes (1) Unemployment Insurance ProgramLetter No. 45-93, “Profiling of Unemployment InsuranceClaimants”; (2) Field Memorandum No. 35-94, “Implementation of aSystem of Profiling Unemployment Insurance Claimants andProviding Them with Reemployment Services”; (3) Field MemorandumNo. 35-94, Change 1, “Supplement No. 1–Questions and AnswersSupplementing Field Memorandum No. 35-94, Implementation of aSystem of Profiling Unemployment Insurance Claimants andProviding Reemployment Services”; and (4) Field Memorandum No.35-94 Change 2, “Supplement No. 2–Questions and AnswersSupplementing Field Memorandum No. 35-94, Implementation of aSystem of Profiling Unemployment Insurance Claimants andProviding Reemployment Services.”
48This includes: (1) UIS Information Bulletin No. 4-94,“Profiling Modeling Paper–Profiling Dislocated Workers for EarlyReferral to Reemployment Services”; (2) UIS Information BulletinNo. 11-94 “The Worker Profiling and Reemployment AssistanceSystem: Identification Methods, Test State Analyses and Provisionof Technical Assistance”; and (3) UIS Information Bulletin No.15-94, “Worker Profiling and Reemployment Services Test State:Development of the Maryland Model.”
49 The report contains a copy of UIS Informational Bulletin12-94, “Department of Labor Report, Reemployment Services: A
196
Department of Labor which help States interpret profiling-related legislation.46
The report also includes material to support and provide technical assistance to
States in implementing profiling legislation.47
Information about profiling mechanisms is also included in the publication,48
along with research on profiling and reemployment services.49

Review of Their Effectiveness.”
197
How the Worker-Profiling and Reemployment Services System Works
Chart 17 shows how the Department of Labor envisions the operation of the
Worker Profiling and Reemployment Services Systems model. Essentially, it will
operate as follows:
4 An individual files a new claim for unemployment benefits at a UI local office or
through rapid response efforts. Data elements needed for profiling are collected
from claimants through the initial claim and/or work registration process and
entered into a computer database that will be used to profile claimants. Labor
market information data (e.g., employment change by industry) necessary for
profiling are also entered in the database.
4 The first UI payment triggers the profile. First, claimants who are on recall or
are covered by a union hiring hall agreement are excluded. Then the remaining
claimants are assigned a probability of long-term unemployment through a
statistical model.
4 A list of claimants who are potentially eligible for referral to service providers is
then created by the State’s computer system at a local office level. Claimants
are ranked, highest to lowest, in order of their probability of exhausting benefits.
4 The UI agency and service provider jointly determine the number of profiled UI
claimants to be selected and referred. This referral agreement involves a
coordinated and ongoing interaction between UI and the service provider to
match the local supply of reemployment services with the local demand for
services by referred UI claimants. This referral agreement establishes the
number of claimants that should be referred and who can be provided the
reemployment services.

198
4 The UI agency notifies selected claimants that they have been identified as
likely dislocated workers and will be referred to reemployment services, why the
reemployment services are being offered, and when and where to report.
Referred claimants will also be informed that continuing eligibility for
unemployment benefits is contingent upon their participation in reemployment
services.
4 Based on notification by the UI agency, selected claimants report to the
designated service provider. Also, the service provider receives notification by
the UI agency that the claimant has been referred.
4 The service provider conducts an orientation for referred claimants and notifies
the UI agency that the claimant was or was not present, and whether the
claimant was appropriately referred.
4 The service provider conducts an assessment and, in consultation with the
claimant, develops an individual service plan. The plan is a compact between
the claimant and the service provider that specifies a customized set of
reemployment services for which participation is required.
4 The claimant participates in reemployment services based upon the service
plan and continues to submit weekly certifications to UI attesting to her/his
continued participation for receipt of benefits.
4 The service provider notifies the UI agency upon claimant completion or
termination of participation in reemployment services based upon the service
plan.
4 Upon completion or termination of a service plan for any circumstances, the
service provider furnishes the UI agency with the service plan record, which
contains followup information relating to the services received.
In addition to providing technical material associated with profiling, the report
briefly reviews the findings of recent research efforts related to profiling; describes
legislation to implement worker profiling; discusses the purpose of worker profiling and
how it works; describes various reemployment services; and provides technical
assistance on the development of a profiling model based on national data and State-
50See Walter Corson and Joshua Haimson, The New JerseyUnemployment Insurance Reemployment Demonstration Project: Six-Year Followup and Summary Report (Princeton, N.J.: MathematicaPolicy Research, Inc., 1994) which is summarized in this Chapterof the Training and Employment Report of the Secretary of Labor.
51The results of this research were summarized in a paperwritten by staff of the Department of Labor’s Office of the ChiefEconomist, released as UIS Information Bulletin 12-94. Thispaper is included in its entirety in the report.
199
specific profiling and reemployment systems.
Research Results
The authors point out that results from the New Jersey UI Reemployment
Demonstration Project50 indicate that the combination of early intervention of dislocated
workers plus intensive job search assistance can be effective in speeding the
reemployment of dislocated workers if they are required to participate in such an effort.
Research further indicates that this combination of early intervention and job search
assistance resulted in a substantial cost savings to the Federal Government (when
compared to a control group of UI claimants). 51
The report provides highlights of a number of other evaluations related to worker
profiling and suggests that several job search experiments have demonstrated that:
4 Additional job finding services can reduce UI receipt and unemployment in a
cost effective way.
4 Nearly all of the combinations tried by five experiments reduced UI receipt.
4 More intensive treatments tended to have greater effects.
4 Nearly all of the treatments had benefits that exceeded the costs to the UI
system.
4 Some type of job search assistance should be made available to all UI
claimants.

200
4 Policymakers might want to consider tying eligibility for additional UI benefits to
participation in some activity such as a job club or other program that accelerates
job search.
4 Evaluations of earlier demonstration projects for displaced workers in specific
sites provide a basis for optimism about the effectiveness of job search
assistance.
Legislation
The report describes two pieces of legislation enacted to implement worker
profiling. The first, Public Law 103-6, Section 4, “Profiling of New Claimants,” called for
the Secretary of Labor to establish a worker profiling program. State participation was
voluntary. The FY 1994 Federal budget included $9 million to establish such a program
and another $9 million was requested for FY 1995.
Public Law 103-6 was later superseded by Section 4, “Worker Profiling,” of
Public Law 103-152 which amended the Social Security Act by adding a new
subsection that required the State Agency charged with administering State
unemployment compensation laws to establish and use a system of profiling all new UI
claimants for regular compensation.
Section 303 (j) (1) of the Social Security Act defines the worker profiling system.
The Act states that the system:
(A) Identifies which claimants are likely to exhaust regular compensation and will
need job search assistance services to make a successful transition to new
employment;
(B) Refers such claimants to reemployment services, such as job search
assistance services available under any State or Federal law;
(C) Collects followup information relating to the services received by such
claimants and the employment outcomes of such claimants subsequent to
receiving such services and uses this information in making identifications

52This Field Memorandum and two subsequent supplements areincluded in their entirety in the report.
201
pursuant to (A) above; and
(D) Meets such other requirements as the Secretary of Labor determines are
appropriate.
Public Law 103-152 also added Section 303 (a) (10) to the Social Security Act. It
requires that UI claimants who are referred to reemployment services participate in
those services or similar services as a condition of eligibility for UI benefits unless the
claimant has already completed the services or has a justifiable cause for not
participating.
The report includes the text of several documents that help define “justifiable
cause” and further describe UI program requirements under the profiling amendments
to Section 303 of the Social Security Act.
Worker Profiling and ReemploymentServices System
Based on Public Law 103-152, the Department issued a Field Memorandum (FM
35-94) which discusses the purpose of WP/RS and how the profiling mechanism works.
It also includes recommendations by the Department for providing reemployment
services, particularly job search assistance. The report briefly reviews the contents of
the memorandum.52
Technical Assistance
The report also describes how the Department fulfilled its role for providing
technical assistance to the States under the authorizing legislation for worker profiling.
This was accomplished by developing a model based on national data. The author
describes this model, noting that it uses a two-step approach. The first step consists of

53The results of the Maryland initiative are summarized inUIS Information Bulletins 11-94 and 15-94; both of thesedocuments are included in the report.
202
“characteristic screens” which exclude UI claimants who are not permanently
separated. The second step is an assessment of the likelihood of benefit exhaustion of
the remaining workers, based on a statistical model that combines several of their
characteristics.
The model produces a list of individuals ranked from highest to lowest based on
their probability of exhausting UI benefits. Claimants on this list can be referred to
reemployment services, beginning with those who have the highest probability of
benefit exhaustion and working down the list until resources available for services have
been exhausted. (The author points out that the model is subject to modification by
individual States to meet their particular needs.)
Also in the area of technical assistance, the report describes the three phases of
technical assistance provided to States. First, the Department worked with the State of
Maryland to develop a State-specific profiling mechanism.53 The model developed in
Maryland confirmed the appropriateness of the approach taken in the national model.
The second phase consisted of implementing WP/RS in five prototype
States–Delaware, Florida, Kentucky, New Jersey, and Oregon. The Department helped
these States make their profiling systems more efficient and productive by providing
labor market information needed for worker profiling from its Bureau of Labor Statistics.
These prototype States will also produce alternative approaches that can be used by
the remaining States when they implement their WP/RS in the third phase of
implementation.
54See Jacob M. Benus, et al., Self-Employment Programs: ANew Reemployment Strategy, Final Report on the UI Self-EmploymentDemonstration (Bethesda, Md.: Abt Associates, Inc., 1994). Thisreport is discussed in detail in this Chapter of the Training andEmployment Report of the Secretary of Labor.
55For preliminary findings based on a review of the NewJersey Unemployment Insurance Reemployment Demonstration Project,see Patricia Anderson, Walter Corson, and Paul Decker, The NewJersey Unemployment Insurance Reemployment Demonstration Project:
203
ACCELERATING DISLOCATED WORKERS’ RETURN TO EMPLOYMENT
Overview
The Unemployment Insurance system has historically promoted reemployment
for workers who involuntarily lose their jobs by requiring them to look for work and
referring them to local Job Service offices for job placement assistance, counseling,
and other services.
Innovations such as the UI self-employment demonstration project, which is
described in this chapter, also speed up reemployment by helping unemployment
insurance recipients start their own businesses.54
Another important reemployment effort, which began operating in 1986, was the
New Jersey Unemployment Insurance Reemployment Demonstration Project. It was
designed to test whether the UI system could be used to identify displaced workers
early in their unemployment spells and provide them with alternative, early intervention
services to help them quickly return to work.
An initial evaluation of the demonstration and a first followup evaluation were
conducted which provided insight into various aspects of the project.55 A second
Followup Report, Unemployment Insurance Occasional Paper 91-1(Princeton, N.J.: Mathematica Policy Research, Inc., 1990). Thisreport was summarized in the Training and Employment Report ofthe Secretary of Labor which covered the period July 1990-September 1991. For additional study findings related to the NewJersey project, see Walter Corson et al., The New JerseyUnemployment Insurance Reemployment Project, UnemploymentInsurance Occasional Paper 89-3 (Princeton, N.J.: New JerseyDepartment of Labor and Mathematica Policy Research, Inc., 1989). This report was summarized in the Training and Employment Reportof the Secretary of Labor which covered the period July 1988-September 1990.
56Walter Corson and Joshua Haimson, The New JerseyUnemployment Insurance Reemployment Demonstration Project: Six-Year Followup and Summary Report (Princeton, N.J.: MathematicaPolicy Research, Inc., 1994).
204
followup study56 which extended the analysis of the demonstration for about six years
after initial UI claims were filed, revealed that the project succeeded in targeting
claimants who, in the absence of the demonstration, would have experienced more
severe long-run reemployment difficulties. In addition, the job search assistance,
training, and reemployment bonuses provided to the demonstration’s participants
(described in detail below) probably contributed to the project’s positive longer-term
impacts, and they generally generated jobs that were more stable than those found by
control group members.
The positive results of the New Jersey Demonstration resulted in the enactment
of national legislation requiring States to establish Worker Profiling and Reemployment
Services systems.
The first part of the study report provides background information about the New
Jersey demonstration, describes its impacts on UI receipt and earnings, includes
information about the demonstration’s targeting strategies, and offers a cost-benefit
analysis. The report’s second part provides a summary of the New Jersey project and
57 The sites corresponded to State UI offices.
205
presents several policy considerations.
The New Jersey UI Reemployment Demonstration Project
The demonstration was initiated by the U.S. Department of Labor through a
cooperative agreement with the New Jersey Department of Labor and began operating
in July 1986. It was implemented in 10 randomly chosen sites in New Jersey57. The
project’s three objectives were to:
4 Examine the extent to which UI claimants who might benefit from
reemployment services could be identified early in their unemployment spells;
4 Assess the policies and adjustment strategies that could help such workers
become reemployed; and
4 Examine how such a reemployment program should be
implemented–particularly the importance of establishing operational linkages
between the UI, ES, and JTPA programs.
Demonstration-eligible individuals were identified in the week after their first UI
payment and randomly assigned to either one of three treatment groups which were
provided alternative packages of reemployment services, or to a control group which
received only existing UI services.
Since a major objective of the demonstration was to provide reemployment
services to workers who were likely to face prolonged spells of unemployment, the
project incorporated a few sample “screens” to identify experienced workers who were
likely to be displaced permanently from their jobs. The following eligibility screens were

206
chosen for the demonstration:
4 First Payment. Claimants who did not receive a first UI payment were
excluded. Claimants who did not receive a first UI payment within five weeks
after their initial claim were also excluded. In addition, individuals who were
working and, consequently, who received a partial first payment were also
excluded (because their job attachment meant that they had not necessarily
been displaced). Individuals applying for special claims (e.g., unemployment
compensation for ex-servicemembers or Federal civilian employees, interstate
claims, and combined wage claims) were also excluded.
4 Age. Workers under the age of 25 were excluded from the demonstration in
order to eliminate the broad category of young workers who have traditionally
shown limited attachment to the labor market and whose employment problems
might be quite different from those of older, more experienced workers.
4 Tenure. Claimants were required to have worked for their last employer for at
least three years prior to applying for UI benefits and could not have worked full
time for any other employer during the three-year period. This was required in
order for participants to exhibit a substantial attachment to a job.
4 Temporary Layoffs. Because the demonstration’s treatments were not
intended for workers who were temporarily laid off, individuals who both
expected to be recalled and who had a specific recall date were excluded.
4 Union Hiring-Halls. Individuals who were typically hired through union hiring
halls were also excluded from the demonstration because they typically exhibit a
unique attachment to a specific labor market.
Three treatment packages for enhancing employment were provided for
treatment group participants: (1) job search assistance only; (2) job search assistance
plus training or relocation assistance; and (3) job search assistance plus a
reemployment bonus.
By the end of sample selection in June 1987, a total of 8,675 UI claimants were

207
offered one of the three packages and 2,385 claimants who were receiving existing UI
services were used as a control group for future comparisons. Services continued into
the fall of 1987 to ensure that all eligible individuals could receive the full set of
demonstration services.
The initial components of all three treatments (job search assistance services)
were the same: notification, orientation, testing, a job-search workshop, and an
assessment/counseling interview. These services were delivered sequentially, early in
the claimants’ unemployment spells. Beginning with the assessment/counseling
interview, the nature of the three treatments differed. These are described in more
detail below.
The “Job Search Assistance Only” Group
In this group, claimants were told that as long as they continued to collect UI they
were expected to maintain periodic contact with the demonstration office, either directly
with staff to discuss their job-search activities or by engaging in job search-related
activities at a resource center in the office. The resource center offered job-search
materials and equipment, such as job listings, telephones, and occupational and
training literature. Claimants were encouraged to used the center and were told that, if
they did not come to the office periodically, Employment Service (ES) staff would
contact them and ask them to do so. These periodic followup contacts were to occur at
two, four, eight, 12, and 16 weeks following the assessment interview.
The “Job Search Assistance PlusTraining or Relocation” Group

58Claimants recalled by their former employer could notreceive a bonus. Neither could those who were employed by arelative or in temporary, seasonal, or part-time jobs.
208
UI claimants in this group were also informed about the resource center and their
obligation to maintain contact during their job search. They were also told about the
availability of classroom and on-the-job training and were encouraged to pursue training
if interested. Staff from the local Job Training Partnership Act Service Delivery Area
program operator worked directly with these claimants to develop the training options.
These claimants were also told about the availability of relocation assistance, which
could be used for out-of-area job search and moving expenses by those who elected
not to pursue training.
The “Job Search Assistance PlusReemployment Bonus” Group
Claimants in this treatment group were offered the same set of job search
assistance services as the first treatment group as well as a bonus for rapid
reemployment. The maximum reemployment bonus equaled one-half of the claimant’s
remaining UI entitlement at the time of the assessment interview. This amount was
available if the claimant started working either during the assessment week or within the
next two weeks. The potential bonus declined at a rate of 10 percent of the original
amount per week, until it was no longer available.58 Claimants who received a bonus
received 60 percent of the bonus if they remained employed for four weeks, and the
remainder if they remained employed for 12 weeks.
Summary of the Initial and FirstFollowup Evaluation Findings
209
The initial evaluation of the New Jersey project revealed that the eligibility
screens directed services to about one-quarter of the UI claimant population. The most
important screen was the tenure requirement, which excluded individuals who had not
worked for their pre-UI employer for at least three years. The net result of applying the
eligibility screens was an eligible population that contained a substantial proportion of
older individuals, clients whose prior job was in a declining industry, and individuals with
other characteristics usually associated with the displaced worker population and with
difficulties in becoming reemployed.
The initial evaluation also revealed that, compared with a sample of individuals
who were not eligible for the demonstration, the eligible population experienced
considerably longer periods of UI collection and longer unemployment spells, on
average. Thus, the eligibility screens appeared to have directed the demonstration’s
services toward a population that generally faced reemployment difficulties during the
year after their initial layoff.
The researchers also found that the project achieved its objectives of increasing
the level of reemployment services to eligible UI claimants and of providing these
services early in the unemployment spell. Three-quarters of the treatment group
claimants attended the initial orientation, and three-quarters of this group continued
through the initial set of job-search services to the assessment/counseling interview.
The level at which demonstration-eligible claimants received these services was
substantially higher than the level at which individuals in the control group received
them through existing service delivery arrangements.
Other key findings of the initial and first followup evaluation studies included:
4 Early intervention services are effective.
4 Programs that provide services for these individuals should be linked.
4 The demonstration succeeded in maintaining ongoing contact with treatment
group members after they received initial services.

210
4 The rate of training receipt for members of the second treatment group (“job
search assistance plus training or relocation” group) was also higher than rates
for comparable groups of claimants whose exposure to training opportunities
came through the regular JTPA service environment in New Jersey.
4 Estimates of the impacts of the treatments on UI receipt showed that all three
treatments reduced the amount of benefits collected over the initial benefit year;
by .47 weeks per claimant for the “job search assistance only” group, .48 weeks
for the “job search assistance plus training or relocation” group, and .97 weeks
for the “job search assistance plus reemployment bonus” group. Estimates from
the first followup study also showed further reductions in UI receipt in the second
year after layoff.
4 There was evidence that all three treatments increased employment and
earnings in the year following the initial UI claim, although not in subsequent
years.
4 Comparisons of the earnings impacts for the “job search assistance plus
training or relocation treatment” with those for the “job search assistance only”
treatment suggest that the training component had no additional impact.
4 Both classroom (occupational skills) and on-the-job training enhanced trainees’
earnings.
4 The early benefit-cost analysis indicated that, relative to existing services, all
three treatments offered net benefits to claimants and to society as a whole. The
“job search assistance only” treatment and the “job search assistance plus
reemployment bonus” treatment also led to net gains for the government as a
whole and for the agencies involved in the demonstration.
4 The “job search assistance plus training or relocation” treatment was relatively
expensive for the government.
Findings from the Second Followup Study
59Compared with the approximately three-year period coveredby the first followup evaluations.
211
Because the impacts of the training provided by the project were expected to
occur over a relatively long period of time, a second followup evaluation was performed
to extend the analysis of the demonstration’s impacts on its participants by about six
years.59 The study report describes the data that were analyzed for the second
followup study. Following are highlights of the most recent study’s findings based on:
(1) the demonstration’s impact on UI receipt and employment and earnings; (2) the
impacts of its training; (3) the targeting of its services; and (4) the project’s costs versus
its benefits.
Impact on UI Receipt andEmployment and Earnings
Regarding the project’s impact on UI receipt and employment/earnings, the
researchers found that:
4 Overall, the project reduced the amount of UI benefits received, both in the
initial benefit year and in subsequent years.
4 Compared to a control group, the demonstration’s treatments reduced UI
benefit receipt by about three-quarters of a week for the “job search assistance
only” treatment, by one and a half weeks for the “job search assistance plus
training or relocation assistance” treatment, and by nearly two weeks for the “job
search assistance plus reemployment bonus” treatment. These findings suggest
that each of the treatments probably contributed to the longer-term impacts and
that the treatments, in general, generated jobs that were more stable than those
60This finding differs from the first followup study’sconclusion which attributed longer-run impacts solely to the “jobsearch assistance” component of the treatments.
61However, only a relatively small number of claimantsparticipated in training, so the impacts of training would needto be quite large to be detected. Thus, the researchers examinedthe earnings experiences of trainees directly to determine
212
found by control group members.60
4 The “job search assistance plus reemployment bonus” treatment increased
earnings initially, although none of the treatments had statistically significant
longer-run impacts on the probability of working, the amount of earnings, or
weeks worked. Since the variation in earnings among claimants was quite large,
however, modest earnings impacts consistent with the UI impact estimates could
still have occurred.
4 An examination of earnings for employed control group members showed that
nominal annual earnings remained below base-period levels until the fourth year
after the initial UI claim. Even by the sixth year, earnings for employed
individuals had not kept pace with inflation. These findings suggest that, on
average, claimants were unable to obtain reemployment in jobs with the same
earnings potential as that of their pre-UI jobs.
Impacts of Training
Regarding the impacts of training, the researchers found that:
4 The second followup study revealed that, although participation in training was
expected to increase the long-run earnings of trainees, comparisons of the
earnings impacts of the “job search assistance plus training or relocation”
treatment group with those of the “job search assistance only” group suggest that
the training component had no additional impact.61

whether their pattern of earnings suggested that training mayhave had an impact not detected in the treatment groupcomparison. This analysis suggested that both classroom(occupational skills) and on-the-job training did enhancetrainees’ earnings .
62See the report entitled, The Worker Profiling andReemployment Services System: Legislation, Implementation Processand Research Findings (Washington, D.C.: U.S. Department ofLabor, Employment and Training Administration, UnemploymentInsurance Service, 1994) which is summarized in this Chapter ofthe Training and Employment Report of the Secretary of Labo r.
213
Targeting of Services
Highlights of the findings related to targeting of services are shown below.
4 The demonstration’s eligibility screens succeeded in identifying a group of UI
claimants who experienced relatively greater reemployment problems in the
short term–as reflected by the number of weeks of employment and UI receipt in
the first year of followup.
4 During the full six years of followup, the group targeted by the demonstration
continued to experience large reductions in earnings relative to their base-year
earnings. These earnings reductions were considerably larger than those
realized by noneligibles.
4 Based in part on the demonstration’s design and initial findings, the
Unemployment Compensation Amendments of 1993 mandated that States
identify workers likely to exhaust their UI benefits (through a “worker profiling”
process) and refer them to reemployment services.
This initiative is called “Worker Profiling and Reemployment Services.”62 The
researchers found that the group targeted by profiling experienced somewhat greater
reemployment problems than did the New Jersey project eligibles, as reflected in both
214
groups’ employment and UI receipt. These differences were apparent not only in the
year following their initial claims but also during the full six years of followup.
Upon examining differences in impacts of the New Jersey demonstration’s
treatments among workers targeted or not targeted by profiling, the researchers found
some evidence that treatment impacts were greater for the targeted group, particularly
UI impacts. This suggests that the reemployment services offered in New Jersey,
which emphasized job search assistance, may have a greater effect on UI receipt when
offered to the high probability of exhaustion, harder-to-serve group identified through
worker profiling.
Benefit-Cost Analysis
The results of a benefit-cost analysis suggest that all three treatments offered
net benefits to claimants and to society as a whole relative to existing services. The
“job search assistance only” treatment and the “job search assistance plus
reemployment bonus” treatment also led to net gains for the government as a whole
and for the Department. The researchers also found that the “job search plus training
or relocation” treatment was expensive for the government.
The authors note that these findings suggest that it may be possible to fund the
“job search assistance only” and the “job search assistance plus reemployment bonus”
treatments from the savings in UI benefits and increased UI tax collections.
The researchers estimate that the “job search assistance only” treatment would
pay for itself from the perspective of the Department, while the “job search assistance
plus reemployment bonus” treatment would lead to modest net benefits for the
Department. On the other hand, the “job search assistance plus training or relocation”
treatment could not be funded solely from the savings in UI benefits and increased UI
215
tax collections. Rather, it would require either a reduction in funding for other programs,
or an increase in taxes because it appears to create net costs to the government as a
whole.
Policy Analysis andConsiderations
The second section of the report, which summarizes the New Jersey
demonstration, also includes several policy considerations that relate to the
demonstration’s various treatments, targeting of services, participation requirements,
interagency coordination, and selection of services. Highlights of these considerations
are presented below.
4 Overall, the evaluation’s generally positive findings suggest that the
demonstration’s treatments represent potentially useful reemployment policies
that can be directed toward UI claimants. In short, early intervention services are
effective.
4 Generally, the objective of targeting services toward displaced workers who
would experience reemployment difficulties was achieved.
4 The demonstration’s treatments were most successful at promoting
reemployment for individuals facing hard-core, structural unemployment
problems (including individuals with the highest likelihood of UI benefit
exhaustion).
4 Longer-term, more intensive services are probably needed for some portion of
those displaced workers who face major structural dislocations.
4 Evidence suggests that UI and ES staff successfully implemented the
requirement that claimants report for initial job-search assistance services.
4 Linkages among the UI, ES, and JTPA systems appeared to have been
strengthened in the demonstration. This was an important element in the
success of the demonstration.

63However, the researchers point out that this findingshould not be viewed as indicating that training should not beoffered. Training, although expensive to the government, may bethe only option to improve the earnings of individuals withoutmarketable skills.
216
4 Each treatment component appeared to contribute to impacts on UI receipt
and earnings, although the benefit-cost analysis provided the strongest support
for the “job search assistance only” treatment.
4 A reemployment bonus offer did not appear to improve labor market outcomes
sufficiently to make the combination of mandatory job search assistance plus the
bonus offer a more successful treatment than mandatory job search assistance
alone.
4 Because the cost of training was high (even though a small percentage of
individuals received training), adding the training or relocation assistance offer to
the basic “job search assistance” services raised costs to the government without
generating sufficient UI savings or taxes to offset these costs.63
III. BUILDING TOMORROW’S WORKFORCE
If the nation’s economic growth is to continue into the next century, it is important
that businesses and educators work together to identify the skills necessary to succeed
in various occupational fields and to ensure that young people are equipped with the
skills needed to succeed in tomorrow’s workplace. Three studies are summarized in
this section.
The first study focuses on the need to enhance work experience for young
people in the “secondary” labor market. During 1993, more than three million 16- to 19-
year-olds worked part-time, and almost two million more worked full-time in secondary
labor markets. About 70 percent of 16-to-19-year-olds work in secondary labor market
occupations related to sales, clerical work, labor, and services. It is perhaps the major
64The School-To-Work Opportunities Act of 1993 (P.L. 103-239), was signed intolaw on May 4, 1994 and is jointly administered by the U.S. Departments of Labor andEducation. It was designed to help States and localities design and implement effectiveSchool-To-Work systems or expand existing programs. The Act established specificcomponents and goals of School-To-Work programs throughout the Nation. Thisincluded a work-based learning component that outlined skills to be mastered, paid
217
employer of young, minority, inner-city workers. The researchers found that secondary
labor market jobs might be used to further youth development and their eventual
transition into the primary labor market by providing adult interest and support, offering
the opportunity to show and take initiative on the job, reinforce academic skills
(including the opportunity to use them in the context of the job), and recognize and
provide feedback on the youth’s performance. They also could be used to support
transitions to stable long-term employment.
The second study summarized in this section discusses the concept of
identifying and standardizing the skills required to succeed in various jobs. These “skill
standards” may be useful in better preparing students for future employment in
tomorrow’s more demanding workplaces.
The final study summary provides information obtained from an evaluation of
school-to-work demonstration projects which were initiated in September 1990. Fifteen
grantees designed and implemented school-to-work/youth apprenticeship
demonstrations in 22 locations. The researchers found that employer involvement is
often the key to successful programs.
SKILL STANDARDS IN THE SECONDARY LABOR MARKET
Overview
In recent years, the Department of Labor has supported a number of initiatives
designed to provide young people with the skills they need to become productive
members of an increasingly demanding labor market. The School To Work
Opportunities Act,64 for example, attempts to address this need by supporting and

work experience, workplace mentoring, general workplace competencies, andinstruction in industry elements. Also included was a school-based learning componentcovering career exploration and counseling, high academic standards, a skill certificate,and student evaluation methods. A “connecting activities” component was alsoincluded which outlined certain requirements for matching students with employers;providing technical assistance for employers; providing training for teachers, mentors,and counselors; helping students find jobs or continue their education; establishinglinkages with employer strategies for skills upgrading; and providing postprograminformation. The Act provided development grants for all States to plan and createcomprehensive statewide systems and provided five-year implementation grants toStates that had completed the development process and are ready to begin operatingSchool-To-Work systems. It also provided waivers of certain statutory and regulatoryprogram requirements to allow other Federal funds to be coordinated with School-To-Work programs. Direct implementation grants to localities that were ready to implementSchool-To-Work systems, but that were in States that had not yet receivedimplementation grants were also made available. The Act also provided grants directlyto high-poverty areas.
218
promoting the development of a national system that connects school-based and work-
based learning in order to help the Nation’s youth make the transition from education to
employment. Encouraged by the Act and other Federal, State, and local initiatives,
youth apprenticeship, tech prep, cooperative education, and career academy programs
have increased significantly over the past several years.
Several of these new efforts, however, may be limited in their ability to reach
young people who need the most assistance in securing stable employment. Many of
them favor academically oriented students and some fail to fully engage youth who
have dropped out of school or who are still enrolled but have little interest in the world of
work. Furthermore, some programs, even if implemented widely, are unlikely to be
available to large numbers of young people who move directly from high school to the
workplace.
One way to overcome these limitations is to design initiatives that stress the
involvement of employers in better preparing young workers to meet the demands of
today’s labor market.

65The secondary labor market is a widely used but loosely defined term thatencompasses the entry-level stratum of the labor market. Jobs within the secondarylabor market are often part-time and pay the minimum wage. They are furthercharacterized by high turnover, limited training needs, low skill requirements, andgenerally require routine tasks to be performed. They are generally concentrated in theretail, clerical, and hospitality sectors, especially restaurant, supermarket, and fast-foodchains.
66For more information about the secondary labor market and/or “dual economy,”see Stephen F. Hamilton, Apprenticeship for Adulthood: Preparing Youth for the Future(New York, N.Y.: The Free Press, 1990). See also Charles Brown, “Dead-End Jobsand Youth Unemployment,” in Richard B. Freeman and David A. Wise (eds.), TheYouth Labor Market Problem: Its Nature, Causes, and Consequences (Chicago, Ill.:The University of Chicago Press, 1982); David R. Howell, Employment Restructuring inthe 1990s: Implications for Low Skilled Youth in NYC (New York, N.Y., discussion paperprepared for “Youth in the Future New York City Workforce” conference held at the NewSchool for Social Research, 1993); and Toby L. Parcel and Charles W. Mueller,Ascription and Labor Markets: Race and Sex Differences in Earnings (New York, N.Y.:Academic Press,1983).
219
Entry-level jobs in the “secondary” labor market65 are the largest and most
important vehicle through which many young people gain both income and initial work
experience.66 The features of most secondary labor market jobs raise concerns about
their potential as productive learning experiences. For the most part, these jobs offer
low wages and limited raises. Many provide little or no formal skill training, and
opportunities for advancement are infrequent. Also, because profit margins are greatly
affected by labor costs, employers in the secondary labor market are often hesitant to
experiment with new training techniques.
As currently configured, many of these jobs fall short of meeting the economic,
developmental, and educational needs of young people. They may also fall short of
meeting the needs of primary labor market employers, who are finding an increasing
need for higher and more varied skills in their employees.
While the school-to-work initiatives mentioned above are generally successful in
linking schools with the workplace, the Department has an interest in exploring the
developmental potential of the workplace itself, especially in the areas of defining and

67Keith MacAllum and Patricia Ma, Skills, Standards and Entry-Level Work(Philadelphia, Pa.: Public/Private Ventures, 1995).
68A history of the SCANS Commission can be found in SCANS: Roadmap to theFuture, a report based on a series of articles written by Dale Hudelson that appeared inVocational Education Weekly over a three-year period from 1990-1992, published bythe American Vocational Association. With the issuance of its final reports in 1993, theSCANS Commission dissolved.
220
building on the skills and competencies that private employers view as critical. This
interest raises several policy concerns, specifically:
4 The ability of public policy to devise effective strategies that seek to capitalize
on the educational and developmental potential of private-sector, entry-level
jobs;
4 The feasibility of using the secondary labor market in a formal way to promote
skill development in youth.
4 The ability of youth to develop useful and transferable skills in these jobs; and
4 The feasibility of assessing, documenting, and certifying these skills.
In an attempt to better understand these issues, the Department sponsored a
year-long study67 which was carried out as the third phase of research under the Youth
Research and Technical Assistance Project (YRTAP). The study was aimed at
analyzing how skill standards and the Secretary’s Commission on Achieving Necessary
Skills68 (SCANS) framework in particular fit with emerging efforts to enhance the career
development and trajectory of young workers who find naturally occurring work
experiences in the secondary labor market.
The study report compiled and synthesized information that addressed the
following issues: (1) recent policies regarding youth and work which culminated in the
School to Work Opportunities Act of 1993; (2) the current configuration of school-to-
work programming and skill standards initiatives; and (3) the nature of the secondary
labor market (the jobs that youth hold in it and the potential of using that context for skill
development).

221
The report provides an overview of recent public policies concerning youth and
work; reviews school-to-work strategies; describes the skill standards movement;
discusses the rationale, challenges, and opportunities for using the secondary labor
market as a context for youth development and a stepping stone for career
development; provides a vision of what an ideal work experience in the secondary labor
market might look like; examines the “high-performance workplace” concept and its
implications for entry-level workers in the secondary labor market; and offers specific
recommendations for initiatives aimed at improving school-to-work programming
through enrichment of youth’s naturally occurring work experiences.
It concludes with a number of recommendations and suggested initiatives. An
appendix presents the framework for a proposed secondary labor market
demonstration and analyzes its strengths and weaknesses, and provides supplemental
information about the work of the SCANS Commission.
School-To-Work Policy and Current Initiatives
The report provides a brief discussion of the history and assumptions of public
policy as they relate to youth and work. An examination of the School-to-Work
Opportunities Act follows, along with a review of the limitations of current school-to-work
models.
The researchers note that over the past 10 years, the search for ways to better
prepare the American work force has focused on education and school reform.
Recently, however, an emphasis on labor force skills, training, and productive
employment has forced a reconsideration of public policy regarding youth and work.
The report points out that, despite the presence of a few prominent federal
initiatives, such as the Job Training Partnership Act, public policy over the past decade
has largely relied on market forces to create jobs. At issue in the present school-to-
work agenda is not just youth employment per se, but productive and meaningful
employment. The researchers further suggest that because the quality of jobs is

222
intricately linked to the skills they require, creating a coherent “school-to-work transition
system” to move youth into and through the labor market has become a critical item on
the national agenda.
In reviewing the ability of the School-to-Work Opportunities Act to help students
make the transition from the classroom to productive employment in today’s labor
market, the researchers point out that most States implemented the legislation by
building on existing vocational education and job training efforts (i.e., tech prep, youth
apprenticeship, cooperative education, and career academies). The benefits and
limitations of these models are reviewed. Among the findings, the researchers suggest:
4 As they currently stand, the school-to-work models are heavily weighted
toward the education system; to rely solely on restructuring the school
experience while neglecting work experience may result in a missed opportunity
to enhance adolescents’ career development. Thus, concerted efforts should be
undertaken to identify and enhance learning opportunities in the workplace.
4 While the concept of school-to-work as it has been interpreted so far implies a
one-time, one-way transition, the fact is that many students and workers
experience alternating spells of work and learning.
4 In addition to being unable to address the out-of-school population, current
school-to-work strategies cannot be relied on to help those young people who
are most disaffected with school. (While some may remain in school, they may
be isolated from many of the newer school-to-work programs.)
4 Additional avenues to the world of work need to be pursued.
Youth in the Secondary Labor Market
During 1993, more than three million 16- to 19-year-olds worked part-time, and
almost two million more worked full-time in secondary labor markets. Although the
number of jobs in the secondary labor market has increased significantly in recent
years, many of these jobs offer few opportunities for young workers to mature or to

69Ivan Charner and Bryna S. Fraser, Fast Food Jobs (Washington, D.C.: NationalInstitute for Work and Learning, 1984).
223
sample various work experiences.
About 70 percent of 16-to-19-year-olds work in secondary labor market
occupations related to sales, clerical work, labor, and services. In addition, the
secondary labor market is perhaps the major employer of young, minority, inner-city
workers.
The report discusses the rationale for enhancing the secondary labor market
work experience, noting that it remains the largest and most important vehicle for work
experience, income, and eventual connection to careers and roles in society. The
researchers suggest that secondary labor market jobs might be used to further youth
development by providing adult interest and support, offering the opportunity to show
and take initiative on the job, reinforce academic skills (including the opportunity to use
them in the context of the job), and recognize and provide feedback on the youth’s
performance. They also could be used to support transitions to stable long-term
employment.
Work Experience and Skill Development
The report outlines what a more constructive secondary labor market work
experience would entail, discusses the feasibility of using the workplace for adolescent
and career development, and outlines national trends and developments that might
expedite these efforts. It also delineates the incentives for private-sector employer
participation in initiatives to upgrade secondary labor market jobs, and suggests how
such initiatives fit with broader efforts to upgrade American workplaces.
The researchers suggest that there is evidence that young workers in secondary
labor market jobs gain more than just short-term economic benefits from their work.
For example, a survey of youth workers69 in the secondary labor market food industry

224
found that:
4 The vast majority of hourly employees learned how to operate a cash register,
food preparation machines, and other machines. Ninety percent of the survey
respondents felt that their job taught them the skills associated with food
preparation, 70 percent developed skills related to training, almost 50 percent
learned supervisory skills, and 40 percent learned inventory control.
4 Fast food employees also learned employability skills, including dealing with
customers, taking directions, getting along with coworkers, being on time, being
dependable, being well groomed, managing their own money, saving for what is
wanted, and getting along on a certain amount of money.
4 Younger employees, minority employees, lower socioeconomic background
employees, and less schooled employees all appeared to get more out of these
jobs than others.
The report points out that strengthening secondary labor market jobs would
require building on these existing benefits and developing structures and supports to
further youth development and facilitate transitions to long-term stable employment.
Specifically, more constructive work experience in the secondary labor market might
result by:
4 Adding more varied tasks and skill requirements to the work itself to encourage
greater use of school-taught academic skills and more on-the-job learning of
competencies valued by the industry and reflected in industry-based standards.
4 Modifying supervisory practices to encourage personal growth and skill
development through greater coaching, assessment, feedback, and certification
of skills attained.
4 Where appropriate, planning a sequence of work experiences over two to four
years—with the same or different employers—in order to broaden and deepen
both personal growth and skill development.
4 Providing external supports that include some combination of case
management, career guidance, remedial education, life skills training, and other
services, including the opportunity for regular reflection on and integration of

70For a discussion of skill standards, see Voluntary Skill Standards andCertification: Skill Standards-A Primer, which is summarized in this Chapter of theTraining and Employment Report of the Secretary of Labor.
225
work-based learning experiences.
4 Providing advice on future career plans, which might include entering full-time
employment that could lead to a career, finishing high school or obtaining a
General Educational Development credential, and/or moving on to
postsecondary education at a four-year college, a two-year technical institute or
community college, or a higher-level skills certification program.
The report describes national-level issues related to the feasibility of enhancing
work in the secondary labor market, such as the need for staffed entities under
employer influence or control which set the standards and assemble, design, and
monitor work-based learning experiences in places of private employment.
The researchers reviewed constraints faced by individual employers in improving
secondary labor market jobs. They note that reducing turnover rates was a powerful
motivator to spark their interest in this effort. It is also important to limit time constraints
placed on employers, ensure that their role is well defined, and to provide incentives
that offset direct costs employers might need to assume in hiring youth.
The potential benefits to employers for improving the secondary labor market are
outlined, and the researchers discuss the relationship between the secondary labor
market and high-performance workplaces. Some examples of high-performance
workplace techniques in the fast food industry are provided.
The report describes the importance of using skill standards to improve jobs in
the secondary labor market, noting that broadly defined skill standards provide a
framework for ensuring that workers have the portable skills necessary to make value-
added contributions on the job and can move easily up a career ladder or move from
one career to another70. When skill standards are connected to educational curricula
and training programs (as is the ultimate goal of the School-to-Work Opportunities Act),
they may serve to create a system of lifelong learning opportunities with certificates of

226
mastery and competency that are recognized by employers nationally and
internationally. Advocates claim that national skill standards will help secure:
4 Greater worker mobility and portability of credentials.
4 Higher wages, greater employment security, and more job opportunities.
4 More efficient recruitment, screening, and placement.
4 Clearer goals and direction for students.
4 More consistent, targeted instruction.
4 Greater accountability by education and training providers.
4 Higher-quality products and services.
4 Higher consumer confidence and satisfaction.
The report briefly describes past efforts to address skill standards and provides
information about current skill standards projects. A listing of currently funded national
skill standards projects, by industry, is provided in the report, along with a description of
the implications of skill standards for school-to-work strategies.
Recommendations and Suggested Initiatives
Policy Recommendations
The researchers offer several policy recommendations that could serve to guide
future initiatives. These are:
4 The work side of the school-to-work transition should be more energetically
pursued.
4 Opportunities to leverage naturally occurring work experiences that facilitate
adolescents’ personal and career development must be identified and exploited.
4 Efforts to develop and recognize a full range of workplace certification
techniques should be expanded.
4 A wider range of attainable work-learning opportunities should be made

227
available for disadvantaged youth.
Suggested Initiatives
In addition to the policy recommendations, the report offers a number of specific
initiatives that could be used to implement the policy recommendations. These are
divided into community-centered strategies, national initiatives, and research initiatives.
Community-Centered Strategies. For most young people, the process of
attaining work experience and connecting to the secondary labor market happens at the
local level, particularly among employers in neighborhoods and communities where
they live. Locally based strategies and interventions thus are crucial for enhancing the
developmental opportunities and supports that young workers accrue through their jobs,
while helping employers retain young workers and enhance their job performance.
Community-centered strategies, therefore, might concentrate on supporting and
enriching local workplaces. For example, in well-defined neighborhoods, between 15
and 25 entry-level businesses could be invited to provide a set of supports to their
young employees, including additional supervisory time, programs to recognize and
reward positive job performance, strengthened interactions between schools and
employers, and incentives for job retention and good school performance. Such an
initiative could take place either through local community-based youth-serving
organizations or schools (or a combination of the two).
Another local strategy might focus on building on summer youth employment, in
which opportunities are provided to blend in summer youth training and employment
programs. A sequence could be developed which includes summer employment,
school activities, and part-time work over several years. The sequence would maintain
a focus on reinforcing educational attainment, providing continuity between different
jobs and educational experiences, offering increased challenges and rewards to youth,
compiling information about skill attainments, and focusing on long-term careers.
Establishing formal connections to training and careers in service-sector
industries, such as hospitality and tourism, might be another community-centered
228
strategy to improve the experiences of young people in the secondary job market. In
addition, establishing local “training centers” which would embody many aspects of the
“apprenticeship” approach to training might strengthen the transitional potential of entry-
level work.
Finally, in cases where career-connected jobs within or near communities are
sparse, there is potential in closing the geographical distance between young workers in
inner cities and permanent jobs in more distant locations through “reverse commuting”
schemes. Transporting young people from neighborhoods which may have fewer
career-connected jobs to suburban locations may result in more attractive, better-
paying jobs which have career connections.
National Initiatives. The researchers suggest that two complementary
approaches might be explored and developed at the national level—upgrading training
and supervision in entry-level jobs, and establishing certification programs. In the first
case, efforts could focus on designing more developmentally oriented training and
supervision practices among nationally known fast food franchises and other high-
volume employers of young people. These efforts might center on the attainment of
“youth development” milestones. Secondly, certification programs could be established
by secondary labor market employers. These programs would help youth to build
portfolios of their work and education experiences, using skills and milestones that are
recognized and valued by employers.
Research Initiatives. The authors suggest that efforts could be made to study
and evaluate initiatives undertaken by major fast food chains to provide incentives to
young workers. A second line of research could focus on the long-term effects of entry-
level work experiences on youth in order to determine whether and what social,
psychological, and economic benefits accrue from early work experiences in the
secondary labor market. Finally, it is suggested that a study be designed to analyze the
degree to which employers would be willing and able to enhance work and supervisory
practices, and whether these changes could be effective in promoting positive corporate
outcomes as they relate to improving the work experiences of young people in the
secondary labor market.

71For a more detailed discussion of the Department of Labor’s efforts in the areaof skill standards and certification, see the Introduction to the Program Activities chapterin the previous edition of the Training and Employment Report of the Secretary ofLabor. Also, see the summary of the evaluation report, Skills, Standards, and Entry-Level Work in this chapter.
229
USING SKILL STANDARDS TO IMPROVE THE NATION’S WORKFORCE
Overview
American businesses are responding to international competition by continually
stressing quality in every phase of operations, using the latest technology, and
reorganizing the way work is performed. In this new work environment, current workers,
as well as new entrants to the labor market, are finding that they must continually
master new skills in order to prepare themselves for a number of job changes over the
course of their careers. At the same time, employers are finding that a better
understanding of the skills required to accomplish new and more complex tasks is
essential if they are to ensure that their employees are capable of responding to
changing work requirements.
Skill standards, used to define the common core of knowledge required for
broad-based occupational clusters, represent an important tool in helping both
employers, employees, and educators respond to these needs.
Against a backdrop of concern about the vocational preparation of noncollege
bound students and the academic preparation of students in general, national attention
relating to education reform and the development of voluntary skill standards has
increased markedly in recent years.71
In response to this concern, the National Advisory Commission on Work-Based
Learning was established. One of the Commission’s objectives is to focus attention on
the need for a national system to promote the voluntary use of skill standards. In

72Joan L. Wills, Skill Standards: A Primer (Washington, D.C.: Center forWorkforce Development, Institute for Educational Leadership, 1995).
230
addition, after hearings were held throughout the country to assess interest in pursuing
this strategy, which was overwhelmingly supportive, the Departments of Labor and
Education provided funds for 22 pilot projects to identify standards in a wide variety of
industries. Following this effort, the Goals 2000: Educate America Act was signed into
law in March 1994. Title V of the Act, the National Skill Standards Act of 1994, created
the National Skill Standards Board (NSSB) to serve as a catalyst for developing a
voluntary system of skill standards.
In an effort to provide basic information about the development and use of skill
standards, the Institute for Educational Leadership’s Center for Workforce Development
produced a Primer72 which provides an overview of the skill standards concept,
describes the history of the skill standards movement, discusses current efforts to build
a skill standards system, offers details about the characteristics of an “ideal” skill
standards system, and outlines some of the key tasks facing the NSSB. The Primer
also includes a bibliography and a listing of skill standards demonstration projects.
The Emergence ofSkill Standards
After describing a number of early publications and reports that focused attention
on education reform and upgrading academic quality, the Primer outlines the evolution
of the skill standards movement by briefly describing: (1) the findings of the
Commission on the Skills of the American Workforce; (2) the establishment of the
Secretary’s Commission on Achieving Necessary Skills; (3) efforts of the National
Advisory Commission on Work-Based Learning; (4) public hearings held throughout the
country to assess interest in the skill standards concept; (5) the development of
specifications for creating cooperative agreements with a number of industry coalitions;
(6) funding by the Departments of Labor and Education of 22 pilot projects in the area

231
of skill standards; and (7) the enactment in March 1994 of the Goals 2000: Educate
America Act, which established the NSSB.
The Primer briefly discusses the NSSB’s areas of responsibility and notes that
the legislative vision of the Goals 2000 Act (which focused on education reform) was
that skill standards should be used by:
4 The nation for ensuring the development of a highly skilled, high-quality, high
performance workforce, including front line workers;
4 Industries to inform training providers and prospective employees of needed
skills;
4 Employers to evaluate the skill levels of prospective employees and assist with
the training of current employees;
4 Labor organizations to enhance employment security through portable
credentials and skills;
4 Workers to obtain certifications of skills, pursue career advancement, and
enhance their abilities to reenter the workforce;
4 Students and entry-level workers to determine needed skill levels and
competencies for the workforce;
4 Training providers and educators to ascertain appropriate training services;
and
4 Government to evaluate publicly funded training; facilitate transition to high-
performance work organizations; increase opportunities for minorities and
women in the workforce; and facilitate linkages with other national efforts aimed
at enhancing workforce skills, such as school-to-work opportunities, vocational
technical education, and job training programs.
The Primer describes the composition of the NSSB and the nature of the
partnerships formed to develop standards for various occupations, as well as the
rationale for using the Goals 2000 Act as a catalyst for the skill standards movement.
Building a Skill Standards System

232
Historical Foundation
In describing the base upon which the skill standards system has been
developed, the Primer highlights several important initiatives which led to the
development of skill standards. These include:
4 The Carl D. Perkins Vocational and Applied Technology Act Amendments of
1990 (P.L. 101-392);
4 Initiatives led by the Department of Labor to improve the quality of federally
sponsored training programs;
4 The Department of Education’s funding of a report on skill standards systems
in education and industry in the United States and six other countries;
4 The awarding of 22 grants and cooperative agreements which initiated skill
standards development and implementation in a variety of industries;
4 The historical use of work-linked, knowledge-based standards by professional
societies or craft guilds throughout the country;
4 National experience with self-regulation of credentialing through nonpublic
organizations; and
4 Government participation in licensure requirements for some occupations.
Education- and Industry-Driven Skill Standards
In addition to these national activities, the Primer addresses skill standards
systems which have been developed and used by educational institutions and various
industries.
In discussing education-driven skill standards systems, the author suggests that
the primary approach of the vocational education system has been to use task lists (i.e.,
a listing of specific duties of a common set of jobs found in most enterprises) to
establish the skill requirements needed for entry-level or intermediate jobs. These lists

73Australia, Canada, Denmark, Germany, Japan, and the United Kingdom.
233
then become the basis for developing curricular, instructional, and evaluation criteria to
ensure that students acquire the skills they need for specific jobs. About 700
committees, using industry volunteers, exist across the country to help States develop
skill standards for educational institutions. In addition, a substantial portion of the
education-driven skill standards are developed as part of consortia, such as the
Vocational Technical Education Consortium of the States, with member States regularly
adding to the pool of standards and task lists.
Linkages are also emerging between the occupational skill requirements
identified through a job analysis process for individuals and the program performance
standards used for vocational-technical education programs established under the Carl
D. Perkins Vocational and Applied Technology Act Amendments of 1990.
In the area of industry-driven skill standards initiatives, the Primer points out that
about 400 professional societies and industry-based associations are involved in
promoting and issuing some form of skills-based credential. Credentialing activities can
include prescribing education and experience qualifications for certification candidates;
establishing for potential accredited institutions qualifications for curriculum, faculty, and
facilities; administering competitive examinations; and conducting assessment visits.
For many industry groups, these activities are self-regulating and privately driven. The
Primer outlines several common features associated with industry-driven skill standards
programs. These are noted below.
Lessons fromOther Countries
Because the experience of other countries in developing skill standards may be
useful as the United States faces the challenge of building a national skill standards
system, the Primer includes the experience of six countries73 in the creation of a
national system of skill standards certification. (Each of these countries has developed

74The revised Dictionary of Occupational Titles, known as the OccupationalInformation Network, or O*NET, is an information system that includes concise, up-to-date occupational (job content) and labor market (wages, supply, demand) information. The system offers users data on the increasing cognitive demands of jobs and newways of thinking and managing that focus on quality, variety, speed, and customerservice. Because it is helpful in identifying and describing the skills, knowledge, andcompetencies needed to produce high performance workplaces, it assists educators tobetter prepare students to meet future workplace challenges and it helps employers tobetter select, train, and place workers in appropriate jobs. The O*NET also helpsworkers to identify the skills needed to maintain livable wages and achieve their careergoals.
234
systems to meet its own purposes.) The author suggests that these systems can be
divided into one of three categories:
4 The “initial preparation” model (Germany and Denmark) which focuses on the
school-to-work transition of young people attending compulsory school.
4 The “craft certification” approach (Japan and Canada) which meets the needs
of more mobile adult workers, such as construction workers.
4 The “comprehensive” model (United Kingdom and Australia) which relies on
occupational core standards (broad-based competencies that must be achieved
by all persons in an occupation regardless of their particular jobs) and industrial
core standards (specific knowledge and skills that must be mastered for work in
specialized areas).
Because the legislative intent for establishing voluntary academic and
occupational skill standards in the United States falls into the third category, more
extensive details of the Australian and United Kingdom models are provided in the
Primer.
Related Activities
The author notes that while the National Advisory Commission on Work-Based
Learning was exploring a more coherent national skill standards effort, an Advisory
Panel on the Dictionary of Occupational Titles74 was reconstructing and revitalizing the

235
basic occupational classification system used in the United States. Also, a technical
advisory group established by the National Education Goals Panel was supporting the
organizations establishing academic standards in such areas as science, mathematics,
and geography. Definitial issues related to the term “standard” were addressed.
The Ideal SkillStandards System
Based on a study conducted by the Institute for Educational Leadership, the
Primer lists several characteristics of an ideal skill standards system. The author
suggests that such as system would:
4 Be widely accessible to students and workers regardless of age;
4 Respond to changes and differences in local and individual needs through
flexibility in education and training provided (e.g., types of institutions, full-time
versus part-time);
4 Be able to meet the needs of individuals regardless of the types of education
and training they are pursuing (e.g., initial preparation, continual, upgrading, or
remedial);
4 Allow career paths within and between industries;
4 Be explicit, so that firms, educators, training providers, and individuals know
what the standards are and where information about them can be obtained;
4 Be competency-based;
4 Formally assess and certify an individual’s skills through an independent third
party;
4 Be progressive and modular, so that people can build upon blocks of
competencies and adapt to technological, organizational, and market changes to
improve their prospects or to explore their potential; and
4 Have a common framework and use common language when describing skill
levels across industries and occupations, so that both individuals and employers
can understand easily workplace expectations. The framework should progress

236
from initial (entry) qualifications through several levels to mastery and/or
specialization recognition.
Key Tasks of the NationalSkill Standards Board
The Primer describes the tasks of the National Skill Standards Board as outlined
in the law as: (1) to identify broad occupational clusters for skill standards around which
to organize the voluntary system; (2) to recognize voluntary partnerships; and (3) to
establish objective criteria for purposes of endorsements. In addition, the skill
standards to be developed should provide credentials (through formal assessments);
be useful for institutions of higher education, labor organizations, trade associations
and employers providing formalized training; and be useful for School-to-Work
Opportunity Systems explicitly.
The Primer points out that the Board needs to ensure that occupational clusters
are organized around common skill sets and are sufficiently broad so that individuals do
not become trapped in narrow, job-specific programs of study. It also suggests that
employers must actively participate in building the skill standards system. Furthermore,
while meeting the needs of employers, occupational clusters selected by the Board
must also be meaningful for secondary and postsecondary educational institutions,
apprenticeship programs, other work-site trainers, and developers of study programs
and articulation agreements among education and training institutions.
The importance of creating and maintaining a viable coalition among
representatives from business, organized labor, educational institutions, community-
based organizations, State and local governments, and nongovernmental civil rights
organizations with respect to developing the skill standard system is also stressed.
As it carries out its responsibilities relating to the development of skill standards,
the creation of credentials based on attainment of the standards, and assessment

237
mechanisms associated with determining whether standards have been met, the author
suggests that the NSSB consider the quality and respectability of assessment
mechanisms; the effective use of skill standards by higher education, organized labor,
trade groups, and employers; and the use of the credentials within the School-to-Work
Opportunity System.
The NSSB is also responsible for ensuring quality throughout the skill standards
system. In this regard, the Board must take into account: (1) the relationship between
the skill standards and various existing international standards; (2) requirements of
high-performance work organizations; (3) previously established apprenticeship
standards; and (4) consistency with the content and performance standards certified by
the National Educational Standards and Improvement Council.
The publication briefly describes the NSSB’s mandate to ensure that standards
are compatible with existing Federal civil rights laws, updated regularly, and portable.
Finally, the Primer discusses the Board’s requirement for developing an
infrastructure to support the total skill standards system, noting that this task will be
accomplished through the following activities:
4 Conducting research;
4 Identifying and maintaining a catalog of skill standards (domestic and
international);
4 Acting as a clearinghouse and facilitator;
4 Developing common nomenclature relating to skill standards;
4 Encouraging the development of and adoption of curricula and training
materials;
4 Providing funding and technical assistance to voluntary partnerships; and
4 Promoting the development of a coherent system.
HELPING STUDENTS MOVE FROM SCHOOL TO WORK
Overview

75For more information about youth entering the secondary labor market, seeKeith MacAllum and Patricia Ma, Skills, Standards and Entry-Level Work (Philadelphia,Pa.: Public/Private Ventures, 1994), which is summarized in this chapter of the Trainingand Employment Report of the Secretary of Labor.
76Robert I. Lerman and Hillard Pouncy, “The Compelling Case for YouthApprenticeships,” The Public Interest, no. 101, Fall 1990, pp. 62-77.
77See the discussion of the School-To-Work Opportunities Act and otherinitiatives in Keith MacAllum and Patricia Ma, Skills, Standards and Entry-Level Work
238
Each year, about half of the Nation’s high school graduates go directly into the
job market. Because an increasing number of jobs require higher level skills than many
high school graduates possess, a large number of these new workers must begin their
careers through the secondary labor market75—in positions that require few skills and
offer low pay, few or no fringe benefits, little training, and few opportunities for
advancement. Typically, these young people go through a string of part-time and low-
paying jobs in the first three to five years after they leave high school. Many also
experience frequent unemployment, and some will never leave the secondary labor
market.
In looking at ways to better prepare students for entry-level jobs and subsequent
careers, there is evidence that many “traditional” high school vocational education
programs, which historically have prepared non-college-bound young people for the
labor market, no longer provide them with the full range of skills needed to succeed in
today’s jobs. Furthermore, according to one study, fewer than three of every 10
graduates of vocational education programs find jobs that require skills they learned in
school.76
In recent years, the Departments of Labor and Education have supported
several initiatives designed to help the U.S. education system develop programs and
practices to help students acquire the skills that employers require and make a
successful transition into well-paying jobs.77 The School-to-Work Transition/Youth

(Philadelphia, Pa.: Public/Private Ventures, 1994).
78Walter Corson and Marsha Silverberg, The School-to-Work/YouthApprenticeship Demonstration: Preliminary Findings (Princeton, N.J.: MathematicaPolicy Research, Inc., 1994).
239
Apprenticeship Demonstration, sponsored by the Department of Labor, helped
educators to combine elements of several innovative school-to-work programs and link
the classroom and the workplace through a series of school- and work-based learning
initiatives.
Preliminary findings, based on a review of the demonstration’s early activities,
suggest that these demonstration programs used a diverse set of approaches that
could be helpful in planning, designing, and implementing future school-to-work
programs.
The study report presents the policy background for the demonstration effort,
describes the key elements of youth apprenticeship, and discusses each of the
demonstration efforts undertaken by the various grantees.78 The report also highlights
implementation lessons relevant for developing similar programs on a larger scale.
The Demonstration Projects
The demonstration projects were initiated by the Department of Labor in
September 1990. The Department awarded two-year grants to six organizations to plan
and implement projects in nine sites. In the fall of 1992, five of the original six grantees
were subsequently awarded an additional year of funding and 10 new two-year grants
for youth apprenticeship demonstrations were awarded. (Nine of the 10 new grants
went to new organizations and one went to a prior grantee for an additional project.)
The 15 grantees designed and implemented school-to-work/youth apprenticeship
demonstrations in 22 locations. Most of the projects focused on manufacturing
occupations, particularly ones in the field of metalworking. Table 21 provides

240
information about the location and status of the grantees.
Visits to each of the sites were made by the researchers in the spring of 1993
(two earlier visits had also been made to each of the initial sites). At the time, the sites’
experience in operating their programs was somewhat limited; many programs had
been operating for a relatively short period of time and some sites had not yet enrolled
students. The study report provides an overview of each site’s program as it existed in
spring 1993. Program highlights are noted below.
Boston Private Industry Council
The Boston Private Industry Council (PIC) received two grants from the
Department. One supported the ProTech Health Care Project, a four-year program (the
last two years of high school and two post-high school years) designed to prepare
students from three Boston high schools for careers in health care. Most ProTech
Health Care students enrolled as juniors and took classes together in applied math,
science, and health careers. They spent one day each week at one of four participating
hospitals and began part-time employment at one of the hospitals during the second
semester of their junior year. In their senior year, students took one course each
semester at an area community college while they completed their academic classes.
Upon high school graduation, the students attended either a two- or four-year college
and worked part-time during the school year and full-time during summers at one of the
hospitals. The project completed its second year of operation in the 1992-93 school
year.
241
__________________________________________________________________
Table 21. Location and Status of Youth Apprenticeship Grantees__________________________________________________________________
Grantee Location Occupa- Date of First Number ofName of Sites tions Student Par- Students
ticipation (Spring/Sum-mer 1993)
__________________________________________________________________
1990 Grantees:Boston Private In- dustry Council (ProTech Health Care) . . . . . . . . . . . . . . . . Boston, Mass. Allied Health Fall 1991 108
MechTech, Inc. . . . . . . . . . Baltimore, Md. Metalworking Summer 1993 6
Pennsylvania Youth Apprenticeship Program . . . . . . . . . . . . . Lancaster, Pa. Metalworking Fall 1992 14
Lycoming County, Pa. Metalworking Fall 1991 21Montgomery County, Pa. Metalworking Fall 1992 15Pittsburgh, Pa. Metalworking Fall 1992 18Philadelphia, Pa. Metalworking Fall 1992 9York, Pa. Metalworking Fall 1992 18
Sears/Davea . . . . . . . . . . . Du Page County, Ill. Appliance repair Fall 1991 19
Workforce LA Youth Academies . . . . . . . . . . . Los Angeles, Calif. — Fall 1990 520
1992 Grantees:Boston Private In- dustry Council (ProTech Financial . . . . . Financial Services) . . . . . . . . . . . . . Boston, Mass. services Sept. 1993 NA
Craftmanship 2000 . . . . . . Tulsa, Okla. Metalworking Sept. 1992 16
__________________________________________________________________
242
__________________________________________________________________
Table 21. Location and Status of Youth Apprenticeship Grantees (continued)__________________________________________________________________
Grantee Location Occupa- Date of First Number ofName of Sites tions Student Par- Students
ticipation (Spring/Sum-mer 1993)
__________________________________________________________________
Manufacturing Technology Metalworking/
Partnership Flint, Mich. Manufacturing Sept. 1992 50
Gwinnett Youth Ap- prenticeship Program Lawrenceville, Ga. — Sept. 1993 NA
Illinois State Boardof Education Chicago, Ill. Metalworking Sept. 1992 22
Rockford, Ill. Metalworking Sept. 1992 13Whitehall, Ill. Food service July 1993 NA
Middle Georgia Aerospace Middle, Ga. Aerospace Sept. 1993 NA
OaklandWorks Oakland, Calif. — Sept 1993 NA
Scripps Ranch High School San Diego, Calif. — Sept. 1993 NA
Seminole County/ Siemens Seminole Electronics/
County, Fla. Telecommu-nications Sept. 1992 19
Toledo PrivateIndustry Council Toledo, Oh. Industrial auto- April 1993 8
mation and robotics, draftingand architecture,medical and dental assisting.
__________________________________________________________________
NA = not available.
Source: Walter Corson and Marsha Silverberg, The School-to-Work/Youth Apprenticeship
Demonstration: Preliminary Findings (Princeton, N.J.: Mathematica Policy Research, Inc., 1994).
__________________________________________________________________

243
A second grant supported the ProTech Financial Services project which
prepared students from three Boston high schools for careers in banking, insurance, or
financial services. Participating high school students took applied academic classes,
received help from mentors at work sites, and worked part-time during the school year
and full-time during the summer months in the financial services field. After graduation,
they attended a two-year college with the goal of obtaining an associate’s degree.
During their college experience, they worked part-time in the banking, insurance, or
financial services field.
Craftsmanship 2000
This four-year project, which began in the 1992-93 school year, prepared
students from public schools in Tulsa, Oklahoma for careers in metalworking. In their
first year of participation (their junior year in high school) students attended Tulsa
Technical Center instead of their regular high schools. They received a bimonthly
stipend as well as financial bonuses for academic performance. Sponsoring companies
employed the students during the summer and provided employee mentors. The
companies provided work-site instruction throughout the school year which increased in
intensity as students progressed through the program. After graduation, participating
students attend Tulsa Junior College for two years and continued to receive work-site
instruction and summer employment.
Gwinnett Youth Apprenticeship
Reviewed in the planning stage, this project was operated by the county school
system with no specific occupational focus. It attempted to develop four-year

79Because the Whitehall program was still in the planning stage when the studywas undertaken, it was not included in the site visits.
244
apprenticeship programs in three Gwinnett County, Georgia high schools. Program
operators planned to first solicit employers for jobs and to subsequently build the
program around these jobs. In the early stages, the school system provided students
with experience working as teacher’s aides and clerical workers. One employer,
Gwinnett Aeronautics, provided students with experience working on propeller engines.
Students planned to apply for available jobs, and, if accepted, they would be released
from school to work for a specified number of hours. They were to take regular courses
as well as an elective course that would provide “personalized” instruction linked to
work-site experience. At the time of the study, a postsecondary education component
was being arranged with the area’s two-year technical school.
Illinois State Board of Education
The Illinois State Board of Education sponsored youth apprenticeship sites in
Rockford, Chicago, and Whitehall. The Rockford and Chicago sites prepared students
for metalworking careers and began operating in the 1992-93 school year. At the time
of the research project, the Whitehall site was preparing to begin in fall 1993 to prepare
students for food service management careers79.
The Rockford site was a four-year program (the final two years of high school
and two years at a community college). Successful students received associate’s
degrees. Beginning in their junior year of high school, students received vocational
instruction in a simulated work environment at an employer facility each morning and
attended applied academic classes at their high school in the afternoon. Students
worked full-time for six weeks, one week at each of the sponsoring employers during
the summer. They also took a related community college course for the rest of the

245
summer. Students worked part-time during their senior school year and were
encouraged to attend a local community college for two years after high school (while
working part-time).
The Chicago site prepared students from Senn Metropolitan Academy for
careers in metalworking through a three- or four-year program (students entered the
program in their junior or senior year in high school). Students visited employer
sponsors for an orientation and shadowing experience during their spring break.
Students who entered as juniors worked full-time during the summer and part-time
during their senior year. After graduation, they were encouraged to attend
metalworking classes at local community colleges while working in the metalworking
industry.
Manufacturing Technology Partnership
Beginning in fall 1992, the General Motors/United Auto Workers’ Manufacturing
Technology Partnership (MTP) program in Flint, Michigan prepared high school
students to enter General Motors’ (GM) Skilled Trades Apprenticeship Program.
Students received academic instruction in high school in the morning and received
vocational instruction–geared towards the General Motors Apprenticeship Test–at the
local vocational technical school in the afternoon. The students worked two additional
hours each day in a training center at a local GM plant, and the company employed the
students for eight weeks during the summer months. Upon high school graduation,
students took the GM Apprenticeship Test. High-scoring students were eligible to enter
apprenticeships as electricians, sheetmetal workers, tool and die makers, welders,
drafters, or machinists. If no positions were available, students could attend a local
community college for two years at GM’s expense.
MechTech, Inc.

246
This four-year program prepared students from Baltimore area high schools for
careers in the machine tool trades. Successful students received an associate’s
degree in computer-integrated manufacturing from a local community college and were
registered as apprentices with the Maryland Apprenticeship and Training Council. High
school juniors and seniors received academic instruction in their local high schools,
vocational instruction in the area vocational technical school, and work experience after
school and during the summer. Students were expected to attend community college
and to continue part-time employment after high school as they worked toward their
associate’s degrees.
Middle Georgia Aerospace
In the planning stage at the time of the research study, this project was a four-
year effort to train students for careers as aircraft structural mechanics. Initiated by
companies from the local aerospace industry, the program selected high school juniors
from three school districts, each paired with a postsecondary technical school and one
of the three aerospace firms in the partnership (Boeing, Northrop, and McDonnell-
Douglas). Students received academic and vocational instruction from their high school
using an applied academic curriculum. Technical schools helped high schools develop
and implement vocational curricula. Although students were not placed at the work site
during the school year, a business mentor met with each student regularly to monitor
school progress and provide information about the business environment. Following
high school, each company selected several graduates for its apprenticeship program.
Postsecondary program participants received advanced training in aircraft structural
technology at local technical schools (leading to an associate’s degree).
OaklandWorks

247
Beginning in summer 1993, this project was designed to enhance an existing
career academy/magnet program in four high schools in Oakland, Calif. Each high
school focused on a different occupational theme—media, health care, law and
government, and computers. Students in the career academies were clustered in three
academic courses related to the occupational focus of the academy, as well as a
relevant lab course. Work-related experiences began in the 10th grade with the
assignment of a business mentor. Students participated in job shadowing in the 11th
grade and received a paid internship for several weeks the following summer. Short-
term internships were offered in the senior year for some participants.
Pennsylvania Youth Apprenticeship Program
Developed by the Pennsylvania Department of Commerce, the Pennsylvania
Youth Apprenticeship Program (PYAP) was a four-year program that focused primarily
on careers in metalworking (although one program model was later adapted to the
health care industry). Programs operated in six sites throughout the Commonwealth
(five began operating in the 1992-93 school year and one began the previous year).
Students began in the 11th grade. The program was a “school-within-a-school”
initiative in which participating students took most or all of their classes together. Three
days each week, 11th and 12th grade high school students attended academic classes
which featured a curriculum designed especially for the program. Students also worked
two days a week in various firms. They continued to work and were encouraged to
attend relevant community college programs after high school graduation.
Scripps Ranch High School
Beginning in fall 1993, the Scripps Ranch High School project combined work-

248
site experience and other apprenticeship features into a model high school. The
curricula was structured around four career paths—engineering technology,
biotechnology, business, and arts and humanities. All of these paths were developed
with input from the business community. The project featured interdisciplinary
instruction (vocational and academic) and guest speakers, as well as special career-
oriented educational events. Ninth and 10th grade students focused on building strong
academic foundations and participated in job shadowing. Eleventh and 12th grade
students chose career paths and selected courses to suit their educational and
occupational goals. They were also allowed to hold part-time jobs either after school or
during a portion of the school day.
Sears/Davea
Beginning in the 1991-92 school year, this project, a collaborative effort among
the National Alliance of Business, Sears, and the DuPage County Area Vocational
Education Authority (Illinois), prepared high school students for careers in the appliance
repair industry. Sears developed a comprehensive curriculum that combined principles
of physics and applied technical exercises in a course on appliance repair which was
offered at the Davea career center. Students attended academic classes in their high
schools for part of the day and spent the other part at the Davea career center. Work-
site experiences involved students rotating individually through one-week internships at
three different Sears service center departments.
Seminole County/Siemens
Beginning in the 1992-93 school year, this project was initiated by the Siemens
Stromberg-Carlson company to train electronic technicians. It recruited juniors from
Seminole County’s (Florida) two high school electronics programs and provided work

249
site experience at the company’s facility. Students attended high school each day,
taking tech-prep electronics courses or their equivalent. They also spent three hours
per day, twice a week, at the company’s training facility. Students received instruction
in job-related skills using a curriculum adapted from the one used by the company in its
apprenticeship program in Germany. Following high school, students continued to work
part-time at Siemens and enrolled in the company’s apprenticeship program, which was
offered at the local community college. Successful students received an associate’s
degree as an electronic technician.
Toledo Private Industry Council
Enrolling its first students in spring 1993, this was a two-year program that
prepared selected students from three Toledo high schools for careers in robotics,
industrial automation, drafting and architecture, computer-aided design and
manufacturing, and medical and dental assisting. (Carpentry and insurance data
processing were added the following year.) Students in regular vocational technical
classes were interviewed and evaluated by participating employers and began part-time
employment in their junior year of high school. The academic curriculum was tied to the
specific vocational area and classes were taught jointly by a vocational teacher and a
math teacher. Upon high school graduation, students received a diploma, a certificate
of competency, and a portfolio that documented their competencies and work
experiences.
Workforce LA Youth Academies
This was a citywide effort in Los Angeles to encourage continued school
attendance and promote general employability skills for high school students who were
at risk of dropping out. About 500 high school juniors and seniors were placed in paid,

250
part-time employment four afternoons per week to gain work experience. They
attended regular classes and spent one afternoon each week in a special class to
improve their basic skills and prepare them for work. Most of the students worked in
Los Angeles city government agencies, and a few students were employed at a
telecommunications firm.
Program Participation
The researchers reviewed the initial experiences of the project sites in enrolling
students to gather information about how program design and various external factors
affected participation. They examined factors that affected program size and the types
of students who participated. They also looked into a number of issues that influenced
students’ continued participation. Highlights from this investigation are noted below.
4 Most of the programs were quite small and most did not expect to enroll more
than 20 to 30 students annually in each school in any single occupational
cluster. This was due primarily to the fact that it was difficult to obtain
participation from employers and to recruit eligible students.
4 Differences among programs in occupational objectives, location, entrance
requirements, and other factors affected the characteristics of students served.
4 Some students were likely to drop out of school-to-work programs during the
school year (most programs experienced declines in enrollment of about 10 to
20 percent during the first year of operation). Reasons for this included
students’ difficulty in keeping up academically, leaving school entirely, deciding
that an occupation was not of interest once they learned more about it, or
deciding that they wanted to switch to college preparatory coursesMeeting
Student Expectations

251
The study report points out that students who participated in the 15
demonstration programs came from diverse backgrounds and had different
expectations about how programs were likely to affect them both educationally and
occupationally. Based on a series of focus groups conducted with students, the
researchers describe student career and educational goals, discuss why students
entered school-to-work programs, provide information about how the students thought
they benefitted from participating in programs, and outline some of the problems
experienced by participating students. The researchers found that:
4 Many students who enrolled in the programs had decided to attend college
before they enrolled. Most intended to pursue two-year degrees or certificates at
community or technical colleges.
4 Few students entered demonstration programs with a concrete interest in or
plan for pursuing a job in the field that was the focus of their program. Instead,
most of the students viewed the programs as a way of “trying out” a possible
occupation. In a few of the demonstration sites, a number of students did enter
programs with a well-defined interest in a particular occupation or related field.
4 Students entered school-to-work programs for a variety of reasons. These
included the need for income (school-to-work programs generally paid more than
other part-time jobs available to high school students), the need for financial
assistance, the need for work experience while in high school, or the desire to try
out a possible career or trade.
4 Students, including those who did not intend to pursue careers in the target
occupations, generally believed that their program experience has a positive
effect on them.
4 Problems encountered or program features disliked by participants included
unrealistic expectations, a lack of preparation for work-site positions and
employer expectations, a lack of understanding of the rules governing program
or employer assistance in paying for postsecondary education, delays in
program implementation and program changes, and disappointment with certain
program features. Some students also expressed concern about the availability

252
of jobs at the end of their program experience.
School-Based Learning
A key component of school-to-work programs is their ability to deliver in-school
instruction that provides the basic skills, occupational competencies, and broad
employability skills required for successful entry into the workforce. Because these
programs are designed to offer improved teaching methods which emphasize hands-
on, student-centered learning that is relevant to students’ career interests, students are
expected to become more engaged in learning and to acquire skills more readily.
Students are also expected to receive career guidance that exposes them to a broad
range of occupational opportunities, helps them identify career interests, and
encourages them to develop educational plans that meet their career goals. In
addition, special program arrangements are expected to promote student entry into
postsecondary education.
The researchers investigated a number of issues related to the school-based
learning component, including: (1) the characteristics of the school setting (i.e., type of
school and school schedule); (2) the effectiveness of school-to-work curriculum,
including its content (its emphasis on vocational instruction, integration of academic and
vocational education, and link to work-site activities), and the instructional methods
used; (3) career guidance and counseling support; and (4) linkages to postsecondary
education. Selected findings based on this review are noted below.
4 The extent of the demonstration’s impact on schools in participating programs
varied significantly and it may be difficult to isolate the school-based component
of school-to-work programs from regular high school offerings.
4 School-to-work programs that take place within a vocational center or special
facility are more occupationally focused, offering not only a strong vocational
program, but also applied academic courses geared toward the target

253
occupations.
4 The scheduling characteristic that appears most critical to the effectiveness of
a school-to-work program is the grouping of participants in key classes.
Clustering students is vital to implementing an integrated curriculum in which
academic courses reflect the program’s occupational theme.
4 Regarding the content of school-to-work curriculum, the researchers point out
that the school-based component of programs that offer practical technical
instruction as well as academic education may better equip students with the
skills they need to enter the workforce in their targeted occupation.
4 The most frequent strategy for integrating academic and vocational education
was the development or purchase of curricula that enhanced the occupational
context (and in some cases, the instructional approach) of academic courses. In
addition, applied academic curricula developed specifically for use in the
demonstration programs tended to be more occupationally relevant.
4 Regarding the linkage of school-based learning with work-site activities, the
researchers suggest that the extent to which the programs’ school-based
curricula are linked effectively to work-site experiences has lagged far behind the
implementation of applied academic curricula. Furthermore, for programs that
had placed students at work sites, substantial diversity in students’ workplace
experiences hindered school- and work-based integration efforts, and programs
that had not institutionalized methods of communication between teachers and
employers had more difficulty linking school curricula to work-site activities.
4 Changes in instructional methods are important in delivering curricula for
school-to-work initiatives; time and the commitment of teachers are the critical
elements for successful implementation of contextual learning strategies.
Because contextual learning techniques (which are preferable in the school-
based component of school-to-work programs) require more experimentation,
creativity, and responsiveness from teachers, applied academic curricula that
call for these techniques are viewed as harder to teach than other courses.
4 Career exposure and counseling are important parts of school-to-work

254
programs, and they are often the weakest part of the programs. Most program
participants have about the same level of opportunities for career awareness as
other students in their schools.
4 Regarding linkages to postsecondary education, because most of the
demonstration efforts were in the early stages of development at the time the
study was conducted, it was unclear to what extent plans for these linkages
would be implemented. A rather wide variety of efforts to promote
postsecondary education and training were observed.
Work-Based Learning
Work-based learning—a key component of effective school-to-work programs—
generally provides students with paid work experience under the supervision of a job
coach or mentor and includes a formalized sequence of training that leads to
progressively higher skills and pay. The researchers suggest that implementing the
work-based learning component of the school-to-work model has proved more difficult
than the implementation of the school-based component.
The report discusses various features of the demonstration programs’ work-site
experiences and describes a number factors that have influenced the inclusion of these
features. The “intensity” (their timing, duration, and wages provided) of work-based
learning experiences are described; the extent to which students’ work-site training is
shaped by a formal curriculum or training plan is examined; the role, selection, and
training of work-site coaches and/or mentors is outlined; and various challenges created
by relying on large and small employers for work-based learning experiences are
explored. The researchers caution that their analysis of work-site issues was limited by
the programs’ degree of work-site implementation (only seven programs had engaged
students in such an experience). Highlights of the findings of work-site experiences
follow.

255
4 Work-based experiences ranged from short-term, unpaid job shadowing and
internships, to paid part-time employment for a year or more. Wages, when
offered, ranged from the Federal minimum to more than $7.00 per hour. Most
programs did not provide extended paid work-site experiences during the
students’ junior year; many did not begin any workplace exposure until the
summer before 12th grade.
4 Only a few of the demonstration programs had structured training plans for
their work-based learning components. Although students might have been
developing increasingly higher levels of skills at work sites, training or instruction
appeared to be provided primarily on an “as-needed” basis.
4 Regarding job coaches and mentors (adults who supervise students at the
work site), the researchers found that many of the demonstration programs had
a designated staff person responsible for each student and that mentors in
several of the programs had received training to help them in their role.
4 The biggest problem most school-to-work programs faced was obtaining firm
commitments from employers to provide work-site positions. Some of the
demonstration programs were built around a single employer; others relied on
multiple firms and/or small businesses for work-based learning opportunities.
Larger firms could generally employ more students and can offer students a
broader exposure to industry skills. Although students who worked in smaller
firms tended to receive more attention and guidance from coworkers, smaller
firms generally offered limited exposure to the particular occupation or industry
(because they often specialized in a particular aspect of production or type of
service and used a narrower range of equipment).
Integrating School and Work
Not only must school-to-work programs feature well-structured school- and
work-based learning components, it is critical that these components be carefully linked

256
in order to ensure that competencies learned in the classroom are useful at work (and
vice versa) and reinforce the acquisition of basic and technical skills.
The researchers found that although the programs studied were making some
progress in integrating school- and work-based learning, very few, if any, had achieved
it in a systematic way. They note that integrating these two components requires two
steps. First, teachers and employers must exchange information about the type and
pace of students’ activities and skill development that will take place at school and at
work. Second, this information must be used to develop curricula that incorporate work-
site tasks and issues into classroom instruction and projects (workplace activities must
be structured to reflect the academic and vocational skills being taught in school).
Most programs studied provided opportunities for school and employer staff to
meet before the start of the program or at the beginning of the school year to discuss
expectations about school-site and work-site activities. In some cases, ongoing
communication was formalized through regularly scheduled meetings of teachers and
mentors. Other programs, however, relied on a more ad hoc approach to teacher-
employer communication.
The researchers found that linking work-site tasks to school curricula occurred
sporadically and in different ways, even within individual programs. Factors that
affected the extent and success of the programs’ efforts to integrate school-based and
work-based learning include:
4 Grouping students in key classes (students in similar workplaces should be
grouped together in the classroom setting as much as possible).
4 The flexibility and willingness of teachers to frequently adapt curricula.
Teachers must modify school instruction and projects to coordinate with work-
site activities during a program’s planning stages as well as on an ongoing basis.
4 Classroom teachers’ visits to student worksites to gain knowledge of the target
occupation and to become exposed to equipment, tasks, and terminology.

257
4 Teachers having planning time in order to effectively integrate school- and
work-based learning. This time may be used for discussions with mentors or
other teachers and for developing new projects and tasks that incorporate
workplace activities.
4 Encouraging consistency in workplace experiences for individual students. It
is easier for teachers to incorporate work-site skills into classroom instruction if
students’ experiences at the workplace are similar.
Program Partnerships
The research report describes the roles played by various organizations in
developing and implementing the school-to-work/youth apprenticeship demonstration
programs. It discusses the roles played by high schools and employers; examines the
roles of third parties (such as Private Industry Councils, Chambers of Commerce, or
State agencies) in initiating, designing, and implementing programs; provides
information about the involvement of other organizations (i.e., community colleges and
unions); and addresses several issues related to recruiting employers to participate in
school-to-work programs.
Regarding the roles of high schools and employers, the researchers point out
that high schools are the points of recruitment for program participants and provide
academic and vocational instruction. High schools or school districts may also initiate
school-to-work programs, recruit employers, develop school curricula, coordinate school
and worksite activities, and provide administrative support for program efforts. The
researchers suggest that the schools studied had assumed these roles, and that in
most sites studied, schools have been primarily developing school-based curricula for
programs. Student recruitment and teaching follows once a program is operational.
None of the programs initiated by schools at the time of the study had secured firm
commitments from employers.
258
In most sites, employers were recruited to provide work experience and work-site
training. Also, in most sites, employers participated in student recruitment. In four of
the sites, employers had been largely responsible for initiating and developing the
school-to-work programs.
The study report points out that a major challenge facing program operators is
the recruitment of participating employers. The researchers found that employer
recruitment was most difficult for sites that relied on small employers to take a few
students and that recruitment efforts required not only access to employers, but the
ability to convince them that participation is worthwhile.
Resources Used in ProgramPlanning and Implementation
The research report presents information obtained during site visits about the
use (or planned use) of Department of Labor funds to plan and implement the
programs. (Resources from schools, employers, and third party organizations were
also used.)
The report notes that the school-to-work/youth apprenticeship sites received
Department of Labor grants that, in total, ranged from more than $1 million for the 1990
grantees to $250,000 for the 1992 grantees. Five of the grantees said that the grants
provided the impetus and the main support for developing their programs. The
remaining sites indicated that their Labor Department grant strengthened an existing
effort to develop a program.
In most cases, the grants were used by staff who were engaged in program
planning and by staff who directed and coordinated program operations after they
259
began. Grant funds were also used to support a variety of activities that stretched the
capacities of existing school and employer budgets (i.e., to support curriculum
development or to pay for teacher workshops on curriculum implementation). Funds
were also used to pay for release time for teachers to visit work sites, and several sites
used grant funds to purchase special supplies or to upgrade equipment. A few sites
used funds to offset costs borne by employers.
The study report also provides illustrations of how funds were used for program
planning and offers examples of how funds were used for program operations (e.g.,
linkages between school and workplace activities and ongoing program development,
in-school instruction, and various workplace activities).
Study Conclusions
The researchers point out that the 15 Department of Labor grantees were
developing programs using a diverse set of approaches that could provide guidance for
planning, designing, and implementing future school-to-work programs. They suggest,
however, that any conclusions or lessons based on the demonstration programs’
experiences must be viewed with some caution because most programs were still in the
early stages of planning or implementation at the time of the site visits (spring 1993).
Major conclusions presented in the study report are noted below.
4 It is critical to the effectiveness of a school-to-work program that the students
who are placed at work sites in a particular industry or occupation be grouped
together in key school classes.
4 Integrating academic and vocational instruction, or modifying academic
material to integrate with workplace learning, is particularly difficult when
students split their time between a home high school and a special vocational-
technical center.
4 Although the ideal model encourages both structured, progressive skill

260
development and paid work experience, in practice, it may be difficult to
implement the two types of work-site activities simultaneously.
4 If workplace training that provides broad exposure to an industry is a program
objective, staff will need to play an active role in structuring work-site activities or
finding ways to compensate for unintended but more narrow work-based
learning.
4 The challenges of integrating school and work are similar to, but even greater
than, those of integrating academic and vocational instruction.
4 Many school-to-work/youth apprenticeship programs are likely to target
students who are motivated, interested in the program’s selected occupation,
and show some academic promise. Programs that initially target a wider range
of students, including economically or educationally disadvantaged youths, are
likely over time to experience some pressure to increase entrance requirements.
4 Program expansion will be necessary to reduce per-student costs, but these
costs are still likely to be substantially higher than current education spending,
even after full-scale operations are achieved. The long-run visibility of programs
is likely to depend on clear evidence that they enhance student outcomes.
4 Although expanding programs is desirable, a number of factors are likely to
limit the size of most programs. These include difficulties in recruiting employers
to participate, student interest in these programs, entrance requirements, and
class size.
4 Recruiting employers to provide paid work-site training and work experience
for students is an ongoing process that is a challenging and important priority for
most programs.
4 Organizations with access to employers are likely to help in developing work-
based learning positions, but employers’ assessments of their own benefits and
costs of providing these positions will ultimately determine if they participate.
IV. HELPING THE NATION’S UNEMPLOYED

261
The three studies summarized in this section focus on the concept of assisting
unemployed individuals to become self-employed.
The first summary provides information obtained from an evaluation of the
Washington State Self-Employment and Enterprise Development (SEED)
demonstration. The demonstration tested various packages of self-employment
assistance (a combination of financial payments and business development services)
for unemployment insurance recipients who had been permanently laid off. The
researchers found that the SEED program increased the likelihood of having a business
and receiving business income.
The second and third summaries also focus on the SEED program as well as
another self-employment demonstration which operated in Massachusetts. The
researchers concluded that in both demonstrations, treatment group members were
more likely than control group members to become self-employed.
THE WASHINGTON STATE SELF-EMPLOYMENT DEMONSTRATION
Overview
The Washington State Self-Employment and Enterprise Development (SEED)
demonstration was the first federally sponsored program in the United States designed
to help unemployed workers start their own businesses. SEED, along with a similar
effort conducted in Massachusetts, tested packages of self-employment assistance–a
combination of financial payments and business development services– for UI
recipients on permanent layoff.

262
The SEED Demonstration
The SEED demonstration was initiated in September 1989 in one site and
expanded to five additional sites in February 1990. Demonstration intake activities
continued through early September 1990 and business support services remained
available to participants through March 1991.
Details of the demonstration are provided elsewhere in this Chapter of the
Training and Employment Report of the Secretary of Labor under the heading “From
Unemployment to Self-Employment: Interim Report on the UI Self-Employment
Demonstration,” which summarizes the study report: Self-Employment as a
Reemployment Option: Demonstration Results and National Legislation. Following is a
brief overview of the demonstration.
4 The intake process began with the targeting of new UI claimants (i.e.,
individuals filing a claim for a new benefit year). Certain potential participants
were excluded: persons filing interstate claims; persons filing claims backdated
more than 14 days; claimants who were employer-attached (i. e., on standby) or
who were full-referral union members; and claimants under 18 years of age.
4 UI claimants interested in self-employment were recruited through letters
which invited them to attend a meeting to learn more about the SEED program.
4 An “awareness day” meeting was held to provide interested claimants with
information about the demonstration. They received basic information about the
risks and rewards of self-employment and key features of the SEED
demonstration were described.
4 Application packets were provided to interested attendees at the awareness
day meeting.
4 Individuals who applied to enter the demonstration were randomly assigned

80In signing the agreement, claimants waived all claimsagainst the project for financial losses.
81These were: completion of training modules, development ofa business plan, setting up a business bank account, satisfyinglicensing requirements, and obtaining adequate financing.
82Because the remaining entitlement at any point in theclaim was the maximum benefit payable less the amount of UIbenefits already paid out in the form of bi-weekly payments, theamount of the lump-sum payment depended on the participant’s UIentitlement, as well as the time taken to achieve the milestones.
263
into a treatment group or a control group. The treatment group received SEED
services while the control group did not. (The control group received regular UI
payments and services.)
4 Within two weeks following their random assignment, treatment group
members were scheduled to attend a set of four training modules which covered
business feasibility, marketing, finance and accounting, and organization and
management. Approximately 20 hours of classroom time were spent on these
topics over four days during a one-week period. Attendance at the first module
was required, in part to ensure that participants signed an agreement which
included a list of project requirements and a list of program services.80
4 Participants developed individualized business plans with the assistance of
business development specialists. Help was also provided through optional
monthly “entrepreneur club” meetings.
4 Business development specialists serving as case managers conducted a
“milestone review” for each client. After completing five milestones,81
participants were eligible to receive a lump-sum payment equal to their
remaining UI entitlement at the time, in addition to the bi-weekly UI payments
received prior to completing their milestones, while engaged in their business
startup activities.82

83Because the lump-sum payments were paid out of Federalresearch funds, rather than State UI funds, they did not affect aparticipants’ UI net balance available.
84Jacob M. Benus, Terry R. Johnson, and Michelle Wood, FirstImpact Analysis of the Washington State Self-Employment andEnterprise Development (SEED) Demonstration, UnemploymentInsurance Occasional Paper 94-1 (Bethesda, Md.: Abt Associates,Inc., 1994). See also Jacob M. Benus et al., Self-EmploymentPrograms: A New Reemployment Strategy, Final Report on the UISelf-Employment Demonstration (Bethesda, Md.: Abt Associates,Inc., 1994) which is summarized in this Chapter of the Trainingand Employment Report of the Secretary of Labor. See also JacobM. Benus, Michelle L. Wood, and Neelima Grover, Self-Employmentas a Reemployment Option: Demonstration Results and NationalLegislation, Unemployment Insurance Occasional Paper 94-3(Bethesda, Md.: Abt Associates, Inc. 1994) which is alsosummarized in this Chapter. For earlier information about theWashington State demonstration, see Terry R. Johnson and JaniceJ. Leonard, Washington State Self-Employment and EnterpriseDevelopment (SEED) Demonstration, Interim Report: Implementationand Process Analysis (Seattle, Wash.: Battelle Human AffairsResearch Centers, 1991).
264
4 Participants whose businesses closed were allowed to return to the regular UI
program after receiving their lump-sum payment and draw the remainder of their
UI entitlement in the form of bi-weekly payments provided they met the normal
UI eligibility requirements, including the work search requirement.83
Chart 18 shows the SEED intake and assessment process. A total of 755 new
UI claimants were enrolled in SEED’s six sites and offered demonstration services; 752
new UI claimants who applied to SEED were assigned to the control group. Chart 19
shows the business startup services provided to members of the SEED treatment
group.
A study of the SEED demonstration revealed that it increased the likelihood of
being self-employed, accelerated the timing of entry into self-employment, and
increased earnings from self-employment.84 The study report provides an overview of
265
the demonstration; discusses its experimental and operational design; reviews sources
of data used to evaluate the effort; outlines the demonstration’s implementation
activities and participants’ perceptions of the program; provides information about
SEED’s impacts on self-employment, wage and salary employment, and total
employment and earnings; reviews the demonstration’s impacts using administrative
data; describes its impacts on job creation and satisfaction; and offers a number of
conclusions based on the evaluation effort.
Implementation Results
Highlights from an analysis of followup survey data on program experiences are
noted below.
4 Only a relatively small fraction of invited UI claimants were interested enough
in self-employment to attempt to qualify for selection into the demonstration. Of
the 42,350 targeted new UI claimants who received an invitation letter to attend
a meeting about the SEED demonstration, 7.5 percent attended the meeting and
4.6 percent submitted an application to participate in SEED.
4 Recruitment and intake procedures were implemented as designed, with
individuals, on average, being randomly assigned within four weeks from their
effective date of UI claim.
4 The 1,507 claimants who were randomly assigned (755 members of the
treatment group and 752 control group members) represented 3.6 percent of the
targeted UI claimants.
4 Participants tended to be older, more educated, more likely to be in
professional, managerial, or technical occupations, and had higher pre-claim
earnings than the broader group of targeted claimants. In addition, many had a
working spouse and substantial assets.
266
4 The evaluation revealed that the program met its objective of early
intervention; treatment group members received training services, on average,
within 5.5 weeks after their effective date of claim.
4 Business training services were provided consistently across all six
demonstration sites. Participants who attended business training modules and
individual counseling sessions gave both the sessions and the instructors high
ratings.
4 About 60 percent of the treatment group received a lump-sum payment equal
to their remaining UI benefits after achieving the five milestones.
4 The average lump-sum payment was $4,225, and the average length of time
after random assignment until receipt of the payment was 7.8 weeks.
4 The most common use of lump-sum payments was for business startup
expenses.
4 Among treatment group members who received specific SEED services, the
aspects of the program they found most useful were the waiver from the UI work
search requirement, the lump-sum payment, and business training.
Self-Employment Impacts
The researchers measured the effects of SEED by calculating the difference in
the outcomes of the treatment and control groups. The researchers found that the
demonstration increased the likelihood and accelerated the timing of entry into self-
employment, leading to higher self-employment earnings. The demonstration did not,
however, affect the treatment group’s survival rate in self-employment. Specifically, the
researchers found that:
4 The demonstration increased the likelihood of being self-employed during the
observation period by 25 percentage points. Fifty-two percent of the treatment
group was self-employed at some time during the observation period compared

267
to 27 percent for the control group.
4 Demonstration services had a greater impact in raising the likelihood of self-
employment for females than for males.
4 Treatment group members’ entry into self-employment was accelerated by
about six months.
4 Both treatment and control group members tended to start businesses in the
service industry sector.
4 Availability of demonstration services did not affect the survival rate in self-
employment; approximately one-third of the businesses in both the treatment
and control groups failed in the first year.
4 Total time in self-employment was increased by about four months over the
entire followup period.
4 Total earnings from self-employment increased by about $3,000 over the
observation period.
4 Average gross monthly earnings from self-employment increased by about
$150.
Wage and Salary Employment Impacts
The study revealed that the positive impacts on self-employment of SEED
participants may coincide with negative program impacts on wage and salary incomes
for individuals who did not become self-employed. The researchers found that:
4 Participation in SEED delayed reemployment in a wage and salary job by
approximately one month.
4 SEED reduced the likelihood of wage and salary employment during the
observation period by five percentage points.
4 Treatment group members became reemployed in a wage and salary job

268
approximately one month later than control group members and, over the entire
observation period, worked one month less in wage and salary employment than
control group members.
4 SEED reduced total earnings from wage and salary employment over the
observation period by approximately $2,500.
4 The SEED program had no impact on average monthly earnings from wage
and salary employment.
Impacts on Total Employment and Earnings
Because the demonstration had positive impacts on a number of self-
employment outcomes and negative impacts on various wage and salary incomes, the
researchers analyzed the combined self-employment and wage and salary experience
of treatment and control group members. They found that the demonstration had
significant positive impacts on the likelihood of employment and the duration of
employment during the observation period. However, it did not significantly affect the
combined earnings from wage and salary employment and self-employment. Among
the main findings were:
4 SEED increased the likelihood of employment (either wage and salary or self-
employment) during the observation period by about five percentage points).
4 Treatment group members worked about two months more in total during the
observation period than control group members.
4 SEED had no significant impact on total earnings or on average monthly
earnings during the observation period.
Impacts Using Administrative Data
269
In an effort to enhance their analysis of several key study outcomes, the
researchers reviewed additional data which were obtained from administrative (rather
than survey) sources. These data were used to examine the demonstration’s impacts
on business activity, State tax payments, and UI benefit receipt. The researchers point
out that the findings derived from administrative records were consistent with the results
based on survey data. The main findings from the impact analysis using administrative
data are summarized below.
4 SEED increased the likelihood of having a business and receiving business
income.
4 The demonstration did not affect the rate of business failure.
4 Gross business income, State sales taxes, and business and occupation taxes
were significantly higher for the treatment group than for the control group.
4 SEED did not affect the likelihood of working in UI-covered employment at
some time during the benefit year.
4 Treatment group members worked fewer hours in non-UI-covered employment
and obtained lower earnings in UI-covered employment than control group
members.
4 The demonstration reduced the length of the first spell of UI benefit payments
by about six weeks.
4 Although SEED reduced the length of UI benefit payments, it actually
increased the amount of total benefits paid to treatment group members by
slightly over $1,000 per claimant (i.e., after taking into account the lump-sum
payments–paid from Federal research funds–treatment group members received
an average of $4,858 as compared to $3,777 for the control group).
Indirect Impacts on Job Creation andJob Satisfaction
The researchers found that the demonstration may also have had indirect
270
impacts on the employment of treatment group members (e.g., increasing the number
of businesses created, the number of jobs for nonparticipants, and job satisfaction).
The researchers compared the employment level (other than the owners) in treatment
group business with the employment level in control group businesses and obtained
information about job satisfaction from treatment and control group members. Their
main findings in this regard include:
4 Within the 21-month followup period, SEED led to the creation of 49 net new
jobs for nonparticipants in addition to the jobs created for the self-employed
participants.
4 SEED increased the employment of family members in the newly created
businesses, but did not affect the employment of nonfamily members in the
businesses.
4 The demonstration did affect the job satisfaction level of demonstration
participants. While the demonstration may not have had a direct impact on job
satisfaction, it may have had an indirect impact because self-employment may
provide more job satisfaction than wage and salary employment. The
researchers found that self-employed individuals were more satisfied than those
employed in wage and salary jobs with the type of work they do; their degree of
independence; their work hour flexibility; and their physical work environment
(although wage and salary employees were more satisfied with fringe benefits
and the number of hours worked).
Conclusions
The researchers suggest that self-employment programs like SEED represent
viable policy tools for promoting rapid reemployment of UI claimants, although the cost-

85The cost-effectiveness of the SEED program is discussed in, Self-Employment Programs: A New Reemployment Strategy, Final Report onthe UI Self-Employment Demonstration which is summarized in thisChapter.
271
effectiveness of such programs remains unanswered.85
Specifically, they found that the demonstration dramatically increased the
likelihood of being self-employed, accelerated the timing of entry into self-employment,
and increased earnings from self-employment. They also found that the demonstration
generally had negative impacts on wage and salary outcomes (i.e., it delayed
reemployment and reduced earnings from wage and salary employment).
In combining self-employment and wage and salary outcomes, the researchers
found that the demonstration had significantly positive impacts on employment
outcomes (it increased the likelihood of being employed and increased the total time
employed) and had no significant impacts on total earnings. An analysis of the
demonstration’s impact on job creation revealed that it had a significant impact on the
employment of family members but no impact on the employment of nonfamily
members.
FROM UNEMPLOYMENT TO SELF-EMPLOYMENT: INTERIM REPORTON THE UI SELF-EMPLOYMENT DEMONSTRATION
Overview
As part of its effort to help unemployed workers find new jobs, the Department of
Labor sponsored two demonstration projects during the late 1980s and early 1990s that

86The demonstration effort began in September 1987 with theselection of Washington State as the site for a self-employmentproject. Section 9152 of the Omnibus Budget Reconciliation Actof 1987, enacted in December 1987, authorized the Department toproceed with UI self-employment projects in other States. Thefollowing year, the Department initiated a second self-employmentproject in Massachusetts.
87For details about the Washington State Self-Employment andEnterprise Development (SEED) demonstration, see Jacob M. Benus,Terry R. Johnson, and Michelle Wood, First Impact Analysis of theWashington State Self-Employment and Enterprise Development(SEED) Demonstration, Unemployment Insurance Occasional Paper 94-1 (Bethesda, Md.: Abt Associates, Inc., 1994) which is summarizedin this chapter of the Training and Employment Report of theSecretary of Labor. A final report on the UI self-employmentdemonstration was also published by the Department; see Jacob M.Benus et al., Self-Employment Programs: A New ReemploymentStrategy, Final Report on the UI Self-Employment Demonstration(Bethesda, Md.: Abt Associates, Inc., 1994) which is alsosummarized in this chapter. For earlier information about theWashington State demonstration, see Terry R. Johnson and JaniceJ. Leonard, Washington State Self-Employment and EnterpriseDevelopment (SEED) Demonstration, Interim Report: Implementationand Process Analysis (Seattle, Wash.: Battelle Human AffairsResearch Centers, 1991). Early information about theMassachusetts demonstration can be found in Jacob M. Benus etal., Massachusetts UI Self-Employment Demonstration: InterimReport to Congress (Bethesda, Md.: Abt Associates, Inc., 1991). See also Stephen A. Wandner, et al., Self- Employment Programsfor Unemployed Workers, Unemployment Insurance Occasional Paper92-2 (Washington, D.C.: U.S. Department of Labor, 1992). For anoverview of self-employment programs in Western Europe and earlyself-employment activities in the United States, see Steven A.Wandner and Jon C. Messenger, “From Unemployed to Self-Employed:Self-Employment as a Reemployment Option in the United States,”
272
helped unemployment insurance recipients start their own businesses.86 The UI self-
employment demonstration projects, conducted in Washington State and in
Massachusetts, tested packages of self-employment assistance for UI recipients on
permanent layoff. These packages included a combination of financial payments (“self-
employment allowances”) and business development services (business training,
counseling, technical assistance, and peer support).87

prepared for the Association of Public Policy Analysis andManagement’s 13th Annual Research Conference, October 1991. Seealso New Forms of Activity for the Unemployed and Measures toAssist the Creation of Self-Employment: Experiences andOpportunities in Combatting Unemployment, Unemployment InsuranceOccasional Paper 93-2 (Washington, D.C.: U.S. Department ofLabor, 1993).
88Jacob M. Benus, Michelle L. Wood, and Neelima Grover,Self-Employment as a Reemployment Option: Demonstration Resultsand National Legislation, Unemployment Insurance Occasional Paper94-3 (Bethesda, Md.: Abt Associates, Inc. 1994).
273
Each project was jointly operated by the State employment security agency and
the economic development agency. The employment security agency paid the self-
employment allowances, while the State economic development agency, along with
local service providers, provided business development services to project participants.
The Washington demonstration offered financial assistance to eligible
participants in the form of lump-sum UI payments, while the Massachusetts project
offered biweekly payments equal to an individual’s regular UI benefits.
A comparative analysis of the Washington and Massachusetts demonstrations
revealed that both increased the likelihood of self-employment and both accelerated the
timing of entry into self-employment.88 The study report summarizes the impacts of the
two demonstrations based on a first round of post-project followup surveys. It presents
information about the experimental and operational design of both projects, describes
data sources used in the analysis, compares the implementation procedures followed in
the two demonstrations, discusses the demonstrations’ impacts on employment and
earnings, and describes other outcomes such as the programs’ impact on job creation
and unemployment insurance receipt.
89The final report on each of the two demonstrations whichis summarized in this Chapter, covers the first three years afterrandom assignment.
90Early impacts of the SEED demonstration are described inJacob Benus et al., Does Self-Employment Work for the Unemployed?First Impact Analysis of the Washington State Self-Employment andEnterprise Development (SEED) Demonstration (Bethesda, Md.: AbtAssociates, Inc., 1993) which is summarized in this Chapter ofthe Training and Employment Report of the Secretary of Labor.
274
A second section of the publication focuses on recent national legislation
authorizing self-employment assistance (SEA) programs. The legislation and
Department guidance to States in developing their SEA programs are included.
The Demonstration Projects
The analysis presented in the study report covers, on average, the first 19
months after participants were randomly assigned to either a treatment or a control
group in Massachusetts and the first 21 months after random assignment in
Washington.89 The researchers briefly describe each project, noting that the
Washington Self-Employment and Enterprise Development (SEED) Demonstration was
initiated on a pilot basis in one site beginning in September 1989 and was then
implemented in five additional sites in February 1990. SEED enrollments continued
through early September 1990, with business support services available through March
1991. The demonstration used a classical experimental design, with random
assignment to either a treatment or a control group of eligible claimants interested in
starting their own businesses. A total of 755 new UI claimants were enrolled in SEED
in six sites and 752 new UI claimants who applied to SEED were assigned to the
control group. (Control group individuals were not eligible to receive SEED services,
but remained eligible for regular UI benefits and services.)90

275
The Massachusetts Enterprise Project began operating in May 1990, with
enrollment taking place in three phases. The first phase took place in May- September
1990, the second phase took place April-October 1991, and the third phase took place
March 1992 through April 1993. The study report reviews the preliminary results from
the first two enrollment periods. During that time, a total of 521 UI claimants were
randomly assigned to either the treatment group (263) or to the control group (258).
Experimental and Operational Designs
The researchers compare and contrast the experimental and operational design
features of both demonstrations, noting that both projects targeted new UI claimants
and both excluded persons filing interstate claims, claimants on temporary layoff (or
full-referral union members), and individuals under 18 years old. The Washington
demonstration also excluded individuals filing claims backdated more than 14 days and
the Massachusetts project excluded claimants eligible for less than 26 weeks of
benefits. Because the authorizing legislation for the Massachusetts project required
that it focus on UI claimants who were likely to exhaust their benefits, these individuals
were further targeted.
The intake and assessment process for each program is shown in Chart 20. As
the Chart shows, both projects recruited claimants who were interested in self-
employment. These clients were then sent a letter inviting them to attend an initial
information session held at the local UI office where the UI claim was filed.
Individuals who were still interested in the program after the information sessions
received and completed applications which included personal background information
and a description of their proposed business idea. Applications were subsequently
reviewed by project staff and clients and were then randomly assigned to either the
treatment group (eligible to receive business development services and financial
276
assistance from the demonstration) or to a control group.
Chart 21 illustrates the business startup and financial assistance services
provided by the two demonstrations.
Massachusetts
As Chart 21 indicates, clients in the Massachusetts project attended an
Enterprise Seminar, a one-day session conducted by business experts. Within two
weeks of the seminar, participants were required to attend an individual counseling
session with a business counselor. (Participants were encouraged to attend additional
counseling sessions.) Massachusetts participants were also required to attend
“enterprise workshops,” which covered issues such as marketing, personal
effectiveness, cash flow, financing, legal requirements and insurance, and
bookkeeping/taxes. During the period, participants were encouraged to develop a
business plan and received help from their counselors to develop the plan. Following
the workshops, participants were eligible to receive self-employment allowances (or
stipends) equal to their regular bi-weekly UI benefits.
Participants were exempt from the regular UI work search requirements while
enrolled in the program and their earnings from self-employment were disregarded in
calculating their self-employment allowance amount. Treatment group members could
collect self-employment allowances through week 24 of their UI claim and, because
they were eligible for up to 30 weeks of UI benefits, they had to chose between
continuing with their self-employment activities full-time or returning to UI for up to six
weeks of remaining eligibility and meeting the work search requirements.
Additional support was provided in Massachusetts through a loan program
sponsored by a local bank.

277
Washington
The business startup services provided in the Washington demonstration
differed somewhat from those provided in Massachusetts. Within two weeks following
their random assignment, treatment group members were scheduled to attend a set of
four training modules which covered business feasibility, marketing, finance and
accounting, and organization and management. Individualized business plans were
then developed by participants in Washington with the assistance of a business
development specialist. Help was also provided through Entrepreneur Club meetings
which were scheduled monthly.
Participants received their regular UI payments and were eligible for a lump-sum
payment of an amount equal to their remaining available UI benefits; they received their
regular bi-weekly payments while engaged in business startup activities and became
eligible for the lump-sum self-employment payment when they had completed five
milestones: (1) completion of the training modules; (2) development of business plans;
(3) setting up a business bank account; (4) satisfying all licensing requirements; and (5)
obtaining adequate financing. Because the remaining entitlement at any point in the
claim was the maximum benefits payable, less the amount of UI benefits already paid
out in the form of bi-weekly payments, the amount of the lump-sum payment depended
on the participants’ UI entitlement, as well as the time taken to achieve the milestones.
Business development specialists conducted the “milestone review” to determine
if all objectives had been attained and whether the lump-sum payment would be made.
Participants in Washington whose businesses closed were allowed to return to
the regular UI program after receiving their lump-sum payment and draw the remainder
of their UI entitlement in the form of bi-weekly payments provided they met the normal
91Because the lump-sum payments were paid out of Federalresearch funds, rather than State UI funds, they did not affect aparticipants’ UI net balance available.
278
UI eligibility requirements, including the work requirement.91
Data Sources
The study report reviews the sources of data used for the study. These included
a Participant Tracking System (PTS)–an on-line database system developed by the
Department which, among other functions, provided data on individual participant
characteristics, demonstration services, and UI payment information.
Two followup telephone surveys were also conducted by research staff. The
first was administered to both participant groups and to the control groups
approximately one and a half to two years after random assignment. The second
survey was administered one year after the first survey. The surveys collected detailed
pre- and post-program information on both the treatment and control groups about
employment, earnings, periods of unemployment, periods of time spent looking for
work, demographic characteristics, and experiences with the programs. The overall
response rate to the telephone interviews for both the treatment and control groups was
about 80 percent.
Demonstration Implementation
The study report reviews the implementation of both projects, presenting
information about program participation rates, the timing and use of program services,
and participants’ opinions about the services.

279
The report points out a number of changes that occurred in the Massachusetts
project after its initial 1990 implementation and discusses their effects on participant
characteristics. The authors note that although some significant changes occurred in
the delivery of business assistance services in 1991, participant characteristics between
the two years remained substantially the same. From 1990 to 1991, however, the
application rate (the percentage of information session attendees who submitted
applications) dropped from 69 percent to 59 percent, although the combination of
attendance rates and application rates yielded about the same overall application rates
in both years. The rate of participation in business services did not change between
1990 and 1991. There was, however, a significant increase in the percentage of
treatment group members who attended at least one bi-weekly workshop (77.1 percent
in 1990 versus 89.9 percent in 1991).
The researchers suggest that the changes in program implementation between
1990 and 1991 in Massachusetts did not affect program participation levels.
In discussing the timing of project activities in Massachusetts, the researchers
point out that for most activities, the elapsed time between consecutive activities was
significantly lower in 1991 than in 1990, most likely reflecting improved organization in
the delivery of program services that resulted from experience with early program
implementation.
In comparing the implementation of the demonstrations in Massachusetts and
Washington, the study report points out that the response rate to the invitations to
attend the information session was significantly higher in Washington. The application
rate among information session attendees in Massachusetts was only slightly higher
than in Washington (63 percent versus 61 percent). Despite some differences in the
application review process, both demonstrations had similar random assignment rates.
(In Massachusetts, 81.7 percent of all applications were deemed acceptable and were
92This was due largely to the fact that Massachusetts was awage-request State while Washington was a wage-reporting State.
280
randomly assigned to either the treatment or control groups, while the percentage was
78.0 in Washington.)
Ninety-two percent of the participants in Massachusetts who were assigned to
the treatment group attended the first training session (the “enterprise seminar”), while
85 percent of the Washington participants attended their first training session. More
than 90 percent of all treatment group members in Massachusetts attended at least one
individual counseling session, while only 70 percent of Washington participants
attended such a session.
The researchers suggest that the goal of early intervention may have been more
effective in the Washington demonstration, as the average number of days between the
benefit year begin date and the date of attendance at the orientation session in
Massachusetts was 33 days, compared to 18 days in Washington.92
Overall, while a higher percentage of Massachusetts treatment group members
attended the first key training activity (either the enterprise seminar for the
Massachusetts project or the first training module in Washington), 83 percent of the
Washington treatment group members attended all training modules, compared to only
46 percent of the Massachusetts treatment participants.
In addition, the researchers found that the Massachusetts participants used the
counseling that was available to them more extensively than the Washington
participants; Massachusetts participants received an average of 6.5 hours of counseling
each, while Washington participants received about 1.5 hours of counseling.
Participants were also surveyed regarding their opinions of the demonstration’s
business assistance services. Treatment group participants in both projects indicated
281
that they had positive opinions about the quality of the business services they received.
Employment and Earnings
Using data from the first followup survey, the study report presents information
about the impacts of the demonstrations on participants by describing their self-
employment experiences and earnings.
In addressing participants’ self-employment experiences, the study report
examines the impact of the two demonstrations on the likelihood of entering self-
employment, the elapsed time between random assignment and the start of self-
employment, the likelihood of being self-employed at the time of the followup survey,
the likelihood of self-employment termination, the total time spent in self-employment,
and the earnings from self-employment since random assignment.
The researchers found that treatment group participants in both States were
significantly more likely than control group members to have at least one self-
employment experience following random assignment. The research revealed that in
Massachusetts, 43.2 percent of the treatment group participants had one self-
employment spell, versus 27.7 percent of the control group individuals. In Washington,
48.8 percent of the treatment group participants had one self-employment spell, versus
25.3 percent of the control group individuals.
In addition, in Massachusetts, treatment group members started their first self-
employment spell 2.4 months earlier than control group members. In Washington,
treatment group members started their first self-employment spell 5.9 months before
control group members. Treatment group participants in both demonstrations were
more likely to continue to be self-employed at the time of the followup survey than
control group members.

282
In Massachusetts, control group members spent an average of 2.3 months in
self-employment, while the treatment group spent an average of 3.9 months in self-
employment. In Washington, control group members spent an average of 1.9 months
in self-employment, while treatment group members spent an average of 5.8 months in
self-employment.
In reviewing self-employment earnings, the researchers found that the
Enterprise Project in Massachusetts did not have a significant impact on self-
employment earnings, while the Washington SEED project did, although the lack of
significant impacts in Massachusetts may reflect the relatively small sample for the first
two years of project enrollment.
In looking at program impacts, the researchers analyze the number of wage and
salary jobs held by treatment and control group members, discuss the effects of the
demonstrations on the likelihood of having a wage and salary job at the time of the
survey, note the mean elapsed time to the beginning of the first wage and salary spell
and the time spent in wage and salary employment since random assignment, and
present information about participant earnings from wage and salary jobs since random
assignment.
The study found that in Massachusetts, treatment group members were slightly
more likely than control group members to have at least one wage and salary spell after
enrollment in the demonstration (63 percent versus 60 percent), although these
differences were not statistically significant. However, in Massachusetts, treatment
group members worked about one month more than control group members in wage
and salary employment. On the other hand, in Washington, treatment group members
were less likely than control group members to have at least one wage and salary job
(70 percent versus 75 percent) and treatment group members worked about one month
less in wage and salary employment. This difference was statistically significant. Thus,

283
the results suggest that the Massachusetts demonstration increased the wage and
salary employment of treatment group members, while the Washington demonstration
reduced the wage and salary employment of treatment group members.
The researchers also found that the Washington demonstration delayed the start
of the first wage and salary job spell by about one month, while the Massachusetts
demonstration had no significant impact on the timing of a first wage and salary job
after random assignment.
In Massachusetts, treatment group members earned significantly more than their
control group counterparts in total wage and salary earnings as well as in average
monthly wage and salary earnings since random assignment. On the other hand, in
Washington, total wage and salary earnings for treatment group members were less for
control group members during the observation period, although there was no impact on
average monthly wage and salary earnings during the observation period.
Combining self-employment outcomes with a number of wage and salary
outcomes, the researchers determined that both demonstrations had a positive and
significant impact on the likelihood of having either wage and salary employment or
self-employment during the observation period. Both demonstrations also had a
positive and significant impact on the likelihood of having a wage and salary job and/or
being self-employed at the time of the followup survey.
Both demonstrations also had a positive impact on the total time employed.
Regarding earnings estimates, the researchers found that in Massachusetts, the
impacts were positive and significant for both total earnings and monthly earnings
during the observation period. The Washington program, however, did not have a
significant impact on total earnings or on average monthly earnings.
284
Impacts on Job Creationand UI Outcomes
In addition to providing employment for new business owners, small businesses
often generate wage and salary employment for others. Therefore, the researchers
investigated the demonstration’s impacts on the wage and salary employment of
nonparticipants. The researchers found that in Massachusetts, among the 91
businesses operated by treatment group members at the time of the followup survey,
23 businesses (25 percent) had a family member employed in the business.
Among the 63 businesses started by control group members in Massachusetts,
14 businesses (22 percent) employed a family member. Similar proportions were found
in Washington, where among the 223 businesses operated by treatment group
members, 49 businesses (22 percent) employed a family member and among the 128
control group businesses, 27 businesses (21 percent) employed a family member.
Little difference was found in the propensity of treatment and control group
members to employ nonfamily members.
In investigating the impacts of the demonstration on the receipt of UI benefits,
the researchers developed three main measures of UI benefit receipt: (1) number of
weeks of the first spell of UI receipt; (2) total amount of UI benefits received during the
first benefit year; and (3) the UI exhaustion rate. The study found that the
Massachusetts demonstration reduced the length of the first UI spell by about two
weeks and the Washington demonstration reduced its length by about six weeks.
Regarding program impacts on UI benefits received during the first year, the
researchers found that the Massachusetts demonstration had a significant negative
impact on UI benefit receipt during the initial benefit year (i.e., the treatment group
285
received considerably less in total UI benefits over the first year than did the control
group). Because the Washington demonstration offered a lump-sum payment in
addition to regular UI benefits, treatment group members in the Washington program,
on average, received over $1,000 more in UI payments than control group members.
Implementation Summary
In summarizing the main findings from their analysis of program implementation,
the researchers point out:
4 In Washington, 7.5 percent of the 42,350 targeted new UI claimants invited to
a meeting about the SEED demonstration attended the meeting. In
Massachusetts, 3.8 percent of the 26,170 invitees attended a meeting about the
Enterprise project.
4 In both demonstrations, the recruitment and intake procedures were
implemented as designed, meeting program objectives of early intervention. In
Washington, attendance at the information session occurred on average 18 days
after the benefit year begin date; in Massachusetts, this interval was, on
average, 33 days.
4 In Washington, the 1,507 claimants who were randomly assigned to either the
treatment or control groups represented 3.6 percent of the targeted UI claimants.
In Massachusetts, the 521 claimants who were randomly assigned represented
2.0 percent of the targeted UI claimants.
4 In Washington, treatment group members began training, on average, within
six weeks of the effective date of their UI claim. In Massachusetts, training
began within nine weeks.
4 In both States, a high proportion of treatment group members participated in
program services such as business training and counseling.
4 Program design differences led to greater use of counseling services in

286
Massachusetts than in Washington. The mean number of hours of counseling in
Massachusetts was 6.5, while the mean number of hours in Washington was
1.5.
4 In Washington, about 60 percent of the treatment group received a lump-sum
payment (equal to their remaining UI benefits) after achieving five program
milestones. The average lump-sum payment was $4,225. There was no such
payment in Massachusetts; instead, participants received biweekly self-
employment payments equal to their regular UI benefits.
In summarizing the main findings from their analysis of the program’s impacts on
employment and earnings, the researchers suggest that:
4 In both of the demonstrations, treatment group members were more likely than
control group members to be self-employed at some point during the observation
period.
4 In both demonstrations, treatment group members entered self-employment
earlier than control group members.
4 Treatment group members were nearly twice as likely as control group
members to be self-employed at the time of the followup survey in both
demonstrations.
4 Neither demonstration had an impact on the likelihood of ending a self-
employment spell during the observation period.
4 In Massachusetts, there was no statistically significant effect on earnings from
self-employment. In Washington, treatment group members earned significantly
more than control group members from self-employment.
4 In both demonstrations, treatment group members spent more time in self-
employment than control group members.
In summarizing the main findings from their analysis of the program’s wage and
salary impacts, the researchers conclude:
4 In Massachusetts, the demonstration did not reduce the likelihood of wage and

287
salary employment during the followup period. In Washington, on the other
hand, the demonstration did reduce the likelihood of wage and salary
employment.
4 In Massachusetts, the demonstration increased the treatment group’s
likelihood of wage and salary employment at the time of the followup survey; in
Washington, the demonstration did not affect wage and salary employment at
followup.
4 The Massachusetts demonstration increased the time worked in wage and
salary employment by one month. The Washington demonstration reduced the
time in wage and salary employment by one month.
4 The Massachusetts demonstration did not affect the mean elapsed time to the
start of the first wage and salary job. The Washington demonstration, on the
other hand, delayed the start of the first wage and salary job.
4 In Massachusetts, the demonstration increased the duration of wage and
salary employment; in Washington, it reduced the duration of such employment.
4 The Massachusetts demonstration increased total and average monthly wage
and salary earnings; the Washington demonstration, on the other hand, reduced
total wage and salary earnings.
4 Both demonstrations increased the likelihood of employment (in either wage
and salary or self-employment) during the observation period.
4 Both demonstrations increased the total time employed during the observation
period.
4 The Washington demonstration had no impact on either total earnings or on
average monthly earnings during the observation period. The Massachusetts
demonstration, on the other hand, had substantial positive impacts on these
earnings.
In summarizing the main findings from their analysis of the program’s impacts on
job creation and UI outcomes, the researchers point out that:
4 Neither demonstration had any statistically significant impact on the
288
employment of nonparticipants (family and nonfamily employees, excluding the
business owner(s)).
4 Both demonstrations significantly reduced the length of the first unemployment
spell.
4 Excluding the lump-sum payment in Washington, treatment group members
drew fewer UI benefits than control group members during the first benefit year.
4 Including the lump-sum payment, however, Washington treatment group
members received higher total payments than control group members during the
benefit year. (The Massachusetts demonstration did not have a lump-sum
payment.)
Conclusions
Following are the major conclusions presented in the study report.
4 Both demonstrations increased the likelihood of self-employment and both
accelerated the timing of entry into self-employment.
4 The Massachusetts demonstration had positive impacts on wage and salary
employment outcomes, while the Washington demonstration had negative
impacts on wage and salary employment.
4 If self-employment and wage and salary employment outcomes are taken
together, both demonstrations had positive impacts on these combined
outcomes.
4 The Washington demonstration had a positive impact on self-employment
earnings and a negative impact on wage and salary earnings. When self-
employment earnings and wage and salary earnings are combined, there were
no observable impacts on total earnings in Washington.
4 In Massachusetts, no significant self-employment earnings impacts were
observed, but there were positive wage and salary earnings impacts. Combining
earnings from self-employment and wage and salary employment yielded a
93Information from an interim evaluation of the WashingtonState and Massachusetts demonstrations can be found in Jacob M.Benus, Michelle Wood, and Neelima Grover, Self Employment as aReemployment Option: Demonstration Results and NationalLegislation, Unemployment Insurance Occasional Paper 94-3(Bethesda, Md.: Abt Associates, Inc., 1994) which is summarizedin this Chapter of the Training and Employment Report of theSecretary of Labor. For details about the Washington State Self-Employment and Enterprise Development (SEED) Demonstration, seeJacob M. Benus, Terry R. Johnson, and Michelle Wood, First ImpactAnalysis of the Washington State Self-Employment and EnterpriseDevelopment (SEED) Demonstration, Unemployment InsuranceOccasional Paper 94-1 (Bethesda, Md.: Abt Associates, Inc., 1994)which is also summarized in this chapter. Earlier informationabout the Washington State demonstration can be found in Terry R.Johnson and Janice J. Leonard, Washington State Self-Employmentand Enterprise Development (SEED) Demonstration, Interim Report:Implementation and Process Analysis (Seattle, Wash.: BattelleHuman Affairs Research Centers, 1991). Early information aboutthe Massachusetts demonstration can be found in Jacob M. Benus etal., Massachusetts UI Self-Employment Demonstration: InterimReport to Congress (Bethesda, Md.: Abt Associates, Inc., 1991).
289
significant positive impact on total earnings.
4 Self-employment programs like Washington State’s SEED and Massachusetts’
Enterprise Project represent viable tools for promoting the rapid reemployment
of UI claimants. While the impacts of such self-employment programs on
earnings remain ambiguous, their impact on employment outcomes appears
robust.
FROM UNEMPLOYMENT TO SELF-EMPLOYMENT: FINAL REPORTON THE UI SELF-EMPLOYMENT DEMONSTRATION
Overview
Unemployment Insurance self-employment demonstration projects, conducted in
Washington State and in Massachusetts,93 tested packages of self-employment

See also Stephen A. Wandner, et al., Self-Employment Programs forUnemployed Workers, Unemployment Insurance Occasional Paper 92-2(Washington, D.C.: U.S. Department of Labor, 1992).
94The packages included a combination of financial payments(“self-employment allowances”) and business development services(business training, counseling, technical assistance, and peersupport).
95Each project was jointly operated by State employmentsecurity and economic development agencies.
96Jacob M. Benus, et al., Self-Employment Programs: A NewReemployment Strategy, Final Report on the UI Self-EmploymentDemonstration (Bethesda, Md.: Abt Associates, Inc., 1994).
290
assistance for UI recipients on permanent layoff.94
The demonstrations also tested the ability of the U.S. employment security and
economic development systems to work together95 and help UI recipients to become
employed by starting their own businesses. Based on the positive findings of early
evaluations of the two self-employment demonstrations, the North American Free Trade
Agreement (NAFTA) Implementation Act (P.L. 103-182) authorized States to establish
self-employment assistance programs for unemployed workers. By the end of 1994,
California, Connecticut, Maine, New York, and Rhode Island had enacted enabling
legislation to implement these programs. In 1995, Delaware, Maryland, Minnesota, and
Oregon enacted self-employment assistance legislation.
A report presenting final impact estimates of the two UI self-employment
demonstrations largely reinforces earlier findings and underscores the prior conclusion
that self-employment is a viable policy tool to promote the rapid reemployment of
unemployed workers.96 The study report provides background information about the
two demonstrations, discusses their experimental and operational designs, outlines and
291
compares their implementation, describes sources of data used in evaluating the
programs, analyzes and compares the impacts of each demonstration, and provides
information about the benefits and costs of the demonstrations.
Findings
Because details of the two demonstrations can be found in this Chapter of the
Training and Employment Report of the Secretary of Labor under the heading “From
Unemployment to Self-Employment: Interim Report on the UI Self-Employment
Demonstration,” and because final study results reinforce the interim report’s
preliminary findings and conclusions, only the main findings from the final study are
presented here.
Regarding the analysis of the implementation of the two demonstrations, the
researchers found that:
4 In Washington, 7.5 percent of the 42,350 targeted new UI claimants invited to
a meeting about the SEED demonstration attended that meeting. In
Massachusetts, 4.2 percent of the 63,921 invitees attended a meeting about the
Enterprise Project.
4 In both demonstrations, the recruitment and intake procedures were
implemented as designed, meeting the program objective of early intervention.
In Washington, attendance at the information session occurred on average 18
days after the initial UI claim date; in Massachusetts, this interval was on
average 33 days. The longer interval in Massachusetts relative to Washington
was largely due to the fact that Washington was a wage-reporting State for UI
purposes and Massachusetts was a wage-request State (i.e., Massachusetts
had to request wage data from employers to determine claimants’ eligibility for UI
97Massachusetts procedures were later changed and both arenow wage-reporting States.
98The milestones were: completion of training modules,development of a business plan, setting up a business bankaccount, satisfying licensing requirements, and obtainingadequate financing.
292
benefits) during the demonstration.97
4 In Washington, the 1,507 claimants who applied (and were randomly assigned
to either the treatment or control groups) represented 3.6 percent of the targeted
UI claimants. In Massachusetts, the 1,222 applicants who were randomly
assigned represented 1.9 percent of the targeted claimants.
4 In Washington, treatment group members began training services, on
average, within six weeks of their initial claim date. In Massachusetts, training
services began within nine weeks.
4 In both States, a high proportion of treatment group members participated in
program services such as business training and counseling. In Washington, for
example, approximately 85 percent of the treatment group attended the first
training session and 70 percent received some counseling. In Massachusetts,
the proportions were even higher.
4 Program design differences led to greater use of counseling services in
Massachusetts than in Washington. The mean hours of counseling in
Massachusetts was 7.5 hours per participant, while the mean number of hours in
Washington was 1.5.
4 In both States, treatment group members received regular benefit payments
while developing their businesses. In Washington, however, treatment group
members were also eligible for a lump-sum payment (equal to their remaining
available UI benefits) after achieving five program milestones.98 A total of 451
treatment group members (60 percent) received a lump-sum payment averaging
$4,225. There was no lump-sum payment in Massachusetts.

99The first Washington followup survey was conducted, onaverage, 21 months after random assignment; a total of 1,204sample members (or 80 percent) responded to the survey. InMassachusetts, the first telephone followup survey was conducted,on average, 19 months after random assignment; 449 sample members(or 80 percent) responded to this survey. The second followupsurvey in each State was conducted approximately one year afterthe first survey.
293
The study report points out that the analyses of both demonstrations were based
largely on data from an on-line database system developed by the Department of Labor
to provide information about project participants and project services, as well as on two
telephone surveys.
The authors present the impact results of the demonstration for two observation
periods–the period from random assignment to the first followup survey, and the period
from random assignment to the second followup survey.99 Results from the longer
observation period (approximately 31 months in Massachusetts and 33 months in
Washington) revealed that:
4 The Washington SEED program had a very large and positive impact on the
self-employment experiences of UI claimants. Treatment group members were
much more likely than control group members to have a self-employment
experience, to spend more time per year in self-employment, and were more
likely to remain self-employed at the time of the second followup survey. The
demonstration increased claimants’ self-employment earnings by over $1,600
per year.
4 In contrast to the Washington demonstration, the Massachusetts Enterprise
Project had significant positive impacts on only some of the self-employment
outcomes analyzed. Specifically, treatment group members were more likely
than control group members to have a self-employment experience and to spend
more time per year in self-employment. However, in contrast to the Washington

294
demonstration, treatment group members in Massachusetts were not
significantly more likely than controls to be self-employed at the time of the
second survey. Furthermore, the Massachusetts demonstration did not have a
significant impact on self-employment earnings.
4 In Washington, the estimated program impacts on wage and salary
employment measures were consistently negative. Specifically, the Washington
program significantly reduced claimants’ likelihood of and number of months per
year working in wage and salary employment. It also reduced their earnings
from wage and salary employment by about $1,800 per year.
4 In Massachusetts, the estimated impacts on wage and salary outcomes were
positive, but generally insignificant, although the project increased claimants’
earnings from wage and salary employment by over $3,000 per year.
4 The Washington demonstration did not significantly increase the combined
likelihood of employment in either a wage and salary job or in self-employment.
It did however increase the time worked per year and increased the likelihood of
being employed at the time of the second survey. On the other hand, the
impacts on total earnings (self-employment and wage and salary earnings) were
not statistically significant. Thus, the demonstration’s positive impact on self-
employment earnings together with its negative impact on wage and salary
earnings resulted in a zero impact on claimants’ total earnings.
4 The effect of the Massachusetts project on total employment and earnings
outcomes (self-employment plus wage and salary employment), on the other
hand, was large and consistent. The Massachusetts demonstration significantly
increased the likelihood of finding employment, the time worked per year, and
the likelihood of being employed at the time of the second survey. In addition,
the demonstration increased combined annual earnings by nearly $6,000.
4 The Washington demonstration had a significant positive impact on the
employment of nonparticipants (family and nonfamily employees, excluding the
business owner(s)) during the 33-month observation period. The researchers
estimated that the Washington SEED demonstration created a total of 316

295
nonparticipant jobs, while control group businesses created 128 nonparticipant
jobs. The Massachusetts demonstration did not have a significant impact on
nonparticipant job creation.
4 The Washington demonstration significantly increased receipt of total UI
benefits. Taking into account both the regular UI benefits and the lump-sum
payments provided to treatment group members who met the required
milestones for starting a business, the Washington SEED demonstration
increased total benefits by about $1,000. In Massachusetts, on the other hand,
benefits were reduced by nearly $900.
4 The Massachusetts demonstration was cost effective for participants,
nonparticipants (taxpayers), society as a whole, and the government. The
Washington State demonstration was cost effective from participants’ and from
society’s perspectives. However, it had a net cost to the government (and thus
to tax payers).
The researchers suggest that the results of the final study of the two
demonstrations indicate that self-employment assistance programs are a cost-
effective approach in promoting the rapid reemployment of unemployed workers.
They recommend that these programs be permanently incorporated into the U.S.
employment security and economic development system.
V. PROGRAM DEVELOPMENT AND IMPROVEMENT
This final section contains summaries of three studies related to the
Unemployment Insurance program.
The first summary provides information obtained from an examination of the
effects of an alternative “base period” for determining eligibility for monetary UI benefits.
The study stemmed from a concern that, as currently set up in most States, workers
with low wage rates and intermittent labor force attachment might be disproportionately

100Other requirements may also be imposed such as minimumbase period weeks of employment (with earnings above a specifiedthreshold in each week), minimum base period hours worked, andminimum combined earnings for the two highest quarters of thebase period.
296
excluded from UI eligibility.
The second summary looks at various scenarios related to hypothetical changes
to the taxable wage base for unemployment insurance.
The final study summarized in this section provides information about extended
benefits (EB) programs which are designed to go into effect (“triggered”) when
unemployment reaches a certain level.
In response to a Congressional request, the Department sponsored a study that
examined the implications of using alternative triggers for extended UI benefits.
ALTERNATIVE UNEMPLOYMENT INSURANCE BASE PERIODS
Overview
Eligibility for monetary UI benefits depends on worker earnings during a “base”
period–a 12-month interval which precedes filing the claim for benefits. In determining
benefits, most States rely on workers’ base period earnings during the earliest four
calendar quarters of the five completed quarters immediately preceding the claim. In
order to be qualified for UI payments, worker earnings during the full 12 months of the
base year (or base period) and during the three months of highest earnings (the high
quarter) must exceed minimum thresholds as specified in the State’s UI statute.100
101Although exceptions may be made in situations of illnessand injury when earnings from a longer base period can beconsidered.
102Wayne Vroman, The Alternative Base Period in UnemploymentInsurance: Final Report (Washington, D.C.: The Urban Institute,1995).
103The States were Maine, Massachusetts, Ohio, Rhode Island,Vermont, and Washington.
297
In most States, claimants who do not satisfy the regular base period earnings
requirements cannot receive UI benefits.101 Since earnings requirements are typically
expressed as minimum dollar thresholds, workers with low wage rates and intermittent
labor force attachment might be disproportionately excluded from UI eligibility.
An examination of the effects of an alternative base period (in which the last four
completed quarters immediately proceeding the claim are used in determining UI
eligibility) focused on the numbers and characteristics of workers who would qualify for
benefits under such a period. The study revealed that this alternative base period
would raise the number of monetarily eligible UI claimants by six to eight percent and
that low-wage, part-time, and intermittent workers would benefit disproportionately in
determining UI eligibility.102
Using information supplied by six States which employed alternative base
periods in determining monetary UI eligibility,103 and tabulations of micro data from three
States, the researcher describes various options regarding the choice of the base
period for making UI eligibility determinations and provide information about the
demographic profile of workers who would be eligible for benefits under an alternative
base period.

298
The author also considers the effects of the alternative base period on potential
and actual benefit outlays and estimates its effects on aggregate UI trust fund outlays.
A number of issues related to UI program administration as it relates to an alternative
base period are also raised in the study report.
The Alternative Base Period
The report points out that Maine, Ohio, Rhode Island, and Washington use the
four most recent completed quarters as their alternative base periods. Massachusetts
uses the last 52 weeks as its alternative base period, and Vermont uses two alternative
base periods; the last four quarters or (for those still ineligible for UI benefits) the last
three completed quarters plus earnings in the current quarter. Base periods and high
quarter earnings requirements in the six States that use alternative base periods are
shown in Table 22 which provides a summary of the effects of the alternative base
period on UI eligibility.
As the table shows, only three States (Maine, Rhode Island, and Vermont) have
a high quarter requirement, and, in Maine, this requirement covers earnings in the
highest two quarters. Ohio’s base period requirement is 20 weeks of employment,
during which earnings are at least equal to 27.5 percent of the average weekly wage,
while Washington State requires 680 hours of work in the base period. The table also
shows that across the six States, claimants who achieved eligibility under the alternative
base period made up from six to 10 percent of the total pool of eligible applicants. For
five of the six States, the additions fall into a narrow band from six to eight percent of
total eligibles.
299
__________________________________________________________________
Table 22. Descriptive Detail on States with Alternative Base Periods__________________________________________________________________
Detail Maine Massachu- Ohio Rhode Vermont Washing-setts Island ton
__________________________________________________________________
Date started . . . . . . . . . . Sept. 1992 Oct. 1993 Oct. 1988 Oct. 1992 Jan. 1988 July 1987
Regular base period . . . First four First four First four First four First four First fourof last five of last five of last five of last five of last five of last fivecompleted completed completed completed completed completedquarters quarters quarters quarters quarters quarters
Alternative base period . Last four Last 52 Last four Last four Last four Last fourcompleted weeks completed completed completed completedquarters quarters quarters quarters or quarters
last threecompletedquartersplus currentquarter
Base period earningsrequirement - 1993 . . . . . 6 X Annual 30 X Weekly 20 Weeks 400 X 140% X 680
AWWa benefit @ 27.5% minimum high hoursamount AWWa wage quarter$1,800 earnings
$1,628
High quarter earningsrequirement - 1993 . . . . . 2 X Annual -- -- 200 X $1,163 --
AWWa in minimum2 quarters wage
__________________________________________________________________
300
__________________________________________________________________
Table 22. Descriptive Detail on States with Alternative Base Periods (continued)__________________________________________________________________
Detail Maine Massachu- Ohio Rhode Vermont Washing-setts Island ton
__________________________________________________________________
Recent Experiences:
Time period . . . . . . . . 1993 1994 (I-II) 1990 1993 1994 (I-II) 1990
Percent eligibleunder alternativebase period . . . . . . . . 8% 7% 8% 8% 10% 6%
Weekly benefitamount - regularbase period . . . . . . . . $159 -- $171 $213 $165 $173
Weekly benefitamount - alterna-tive base period . . . . . $126 -- $137 $157 $120 $122
__________________________________________________________________
aAverage weekly wage.Source: All information presented in this table is based on discussions with Stateofficials and tabular data summaries supplied by the States, as reported in TheAlternative Base Period in Unemployment Insurance: Final Report.__________________________________________________________________
301
Conclusions
The author notes that the main argument for offering the alternative base period
relates to equity, in that many low wage and intermittent workers who do not satisfy
regular base period monetary eligibility requirements do achieve eligibility under the
alternative base period. Their ineligibility arises simply because a large share of their
recent earnings is not considered when regular base period determination procedures
are followed. Because the purpose of UI is to provide temporary and partial wage loss
replacement for individuals who have become unemployed through no fault of their
own, having an alternative base period helps UI to fulfill its mission for a wider range of
claimants, particularly those with low wages and more intermittent employment
patterns.
The author also suggests that, although there are UI trust fund and
administrative considerations in offering the alternative base period, neither pose
especially large burdens on UI programs.
In addition, the study report points out that the strongest argument for specifying
the last four completed quarters as the alternative base period is the potential for using
automated earnings records in making eligibility determinations.
The author summarizes four main conclusions, which are noted below.
4 The presence of an alternative base period raises the number of monetarily
eligible claimants by six to eight percent. The increase is even larger in a State
like Vermont where earnings from the current quarter are also used to assess
eligibility.
4 Low-wage, part-time, and intermittent workers benefit disproportionately from
the alternative base period. Since these workers usually experience above
average unemployment rates, arguments that stress the role of UI in social
protection can be made to support the wider use of alternative base period
arrangements.
4 The presence of the alternative base period has noticeable effects on UI

104Includes UI program administration in all States, as wellas Federal administration and several specialized Federal benefitprograms.
302
benefit outlays and short run effects on UI trust fund balances. Because it
enhances the eligibility of low wage workers more than other workers, the
proportionate increase in benefit outlays is less than the increase in the number
of beneficiaries. It is estimated that the number of UI recipients would increase
by six-eight percent and that annual benefit payouts would increase by four-six
percent.
4 The administration of an alternative base period would entail extra costs.
Because of time and resource constraints, this report did not cover several areas
of interest to the Department. Therefore, the Department is conducting additional
research which will gather information about: administrative costs imposed on States
and employers for expanded wage record searches; the impact over time on claims
volume and trust fund solvency; the types of employers that could report wage data
more rapidly; and the feasibility of using the latest four quarters as the base period for
claimants filing after the completion of the first or second month following the end of a
quarter. The project is scheduled for completion in July 1997.
INCREASING THE FEDERAL TAXABLE WAGE BASE FORUNEMPLOYMENT INSURANCE
Overview
The Unemployment Insurance system104 is financed by a 6.2 percent gross tax
rate applied to the Federal taxable “wage base.” The wage base is currently the first
$7,000 paid annually in wages to each employee by covered employers. Employers in
States with UI programs approved by the Federal Government and with no delinquent
Federal UI loans may credit 5.4 percentage points against the 6.2 percent tax rate (for a

105The temporary surtax was first added to the permanent FUTAtax rate in 1976 by Public Law 94-566. Since 1976, authorizationfor the surtax has been extended repeatedly. The Omnibus BudgetReconciliation Act of 1987 (Public Law 101-203) extended the 0.2percent surtax through 1990. In 1990, the surtax was extendedagain through 1995. Most recently, the surtax was continuedthrough 1996 under the Emergency Unemployment Compensation Act of1991 (Public Law 102-164).
106Michigan, New York, and South Carolina were exceptions;taxing only the first $3,000 of wages in 1939. A Federal taxablewage base equal to the Social Security tax base ($3,000) becameeffective January 1, 1940.
303
tax rate of 0.8 percent).
States are required to levy UI payroll taxes on State wage bases that are equal
to the Federal taxable wage base, although they may set their own wage bases above
the Federal minimum.
The current 0.8 percent Federal Unemployment Tax Act (FUTA) rate has two
components: a permanent tax rate of 0.6 percent and a temporary surtax rate of 0.2
percent.105 UI tax revenues are deposited into one of 59 separate accounts that make
up the Federal Unemployment Trust Fund. These funds are managed by the U.S.
Treasury.
Federal and State Taxable Wage Bases
Since the inception of UI in the 1930s, the Federal taxable wage base has
changed four times. Between 1937 and 1939, there was no Federal wage base.
Between 1940 and 1971, the Federal wage base was set at $3,000. It was increased
to $4,200 in 1972 and to $6,000 in 1978. It has been at $7,000 since 1983.
Originally, the Social Security Act did not provide for a taxable wage base for the
UI program and both Federal and State contribution rates applied to total wages.106 In
the early 1970s, however, the ratio of taxable payrolls to total payrolls had declined

107Robert F. Cook et al., The Effects of Increasing theFederal Taxable Wage Base for Unemployment Insurance,Unemployment Insurance Occasional Paper 95-1 (Silver Spring, Md.:KRA Corporation, 1995).
304
from 0.93 in 1940 to 0.45 in 1971. Subsequently, the tax base was increased to
$4,200. In the mid-1970s, the UI program faced financing problems once again, and by
1978 the tax base increased to $6,000. The taxable wage base was increased to
$7,000 in 1983 and has remained at that level.
In 1990, average earnings in taxable covered employment were slightly above
$23,000. The gap between average annual earnings of covered workers and the
Federal taxable wage base has since increased. The growing gap means that the
taxable share of covered wages is declining. For example, in 1990, only 37.6 percent
of covered wages were taxable compared to 92.8 percent in 1940. This means that
even though the statutory Federal tax rate doubled between the late 1960s and the late
1980s from 0.4 to 0.8 percent, the effective tax rate–or the amount of FUTA revenue
collected as a percent of the total covered wages–only fluctuated between 0.2 and 0.3
percent of total wages during this period.
Not only have Federal taxable wage bases increased over the years, most State
UI programs now have taxable bases that exceed the $7,000 Federal level. In fact, 41
States had tax bases above the Federal level–more than at any other point in the
history of the Federal-State UI system.
A study of the effects of any further increases in the UI Federal taxable wage
base revealed that increasing the wage base would result in: (1) an immediate increase
in Federal payroll taxes (unless the Federal tax rate is reduced by an amount that
offsets the increase in the tax base); (2) higher State UI payroll taxes in States where
the taxable wage base falls below the new (higher) Federal tax base; and (3)
subsequent reductions in State UI tax rates as UI trust fund balances increase and
experience-rating provisions come into play.107
The study report offers a history and overview of the UI system, discusses the
rationale for raising the Federal taxable wage base, and explores the various effects of

305
an increase in the wage base.
Rationale for Raising the Federal Taxable Wage Base
The authors suggest that there are essentially four reasons for raising the
Federal taxable wage base.
First, because the real value of the taxable wage base has decreased
substantially since the program’s inception, the UI tax burden has become unevenly
distributed across low- and high-wage firms. As the real value of the taxable wage
base has declined, low-wage employers have had to pay taxes on a higher proportion
of their employees’ wages, thus paying a higher effective tax rate than their high-wage
counterparts.
Second, trust fund contributions have been adversely affected. In most States,
benefit formulation is tied to a higher and ever-increasing portion of wages.
Contributions, however, are not tied to a similar base. As a result, there has been a
decline in State trust fund balances and it has become more difficult for States to
provide adequate benefits during recessions.
Third, the use of trust fund surcharges is inversely related to the level of the trust
fund. This relationship has encouraged increases in the average UI tax rate structure
concurrent with cyclical downturns. Increasing taxes during recessionary periods may
be undesirable from a macroeconomic perspective because this may delay economic
recovery and prolong periods of high unemployment.
Fourth, the gap between total covered wages and the Federal taxable wage
base has widened considerably since the inception of the UI program. At the start of
the program in 1939, the Federal taxable wage base represented 100 percent of total
wages; by 1992, the taxable wage base represented only 36 percent of total wages. In
addition, average annual wages are currently more than three times the taxable wage

108The weighted average wage in these States in 1991 was veryclose (98.7 percent) to the weighted average wage of all States.
306
base.
The study report points out that for the above reasons, many researchers and
policymakers have advocated raising the Federal taxable wage base. Assuming the
States also raise the State wage bases to the new Federal level and enact no
subsequent change in the tax rate, an increase in the taxable wage base would reduce
the tax inequity between low- and high-wage firms and industries, improve trust fund
balances, and eliminate part of the difference between average covered wages and the
wage base.
Study Methodology
The researchers obtained universe wage record data from four States (Colorado,
Maryland, Missouri, and Texas) for Calendar Years 1990 and 1991.108 A State-by-State
simulation model was developed based on historical relationships between the taxable
wage base and the taxable wage proportion of total wages. Combined with estimates
of the elasticities of demand and factor substitution obtained from a review of the
theoretical literature, a model was derived to provide estimates of the employment
effects of raising the Federal taxable wage base to various levels using different
assumptions of model parameters.
The universe data from the four States were also used to estimate the revenue
effects on the Federal and State trust funds of raising the Federal taxable maximum
(assuming conformity by the States). The researchers used a sample of firms stratified
by industry and size to estimate payroll tax increases and changes in effective tax rates
for different sizes of firms, firms in different industries, firms with different experience
rated State tax rates, average wage levels, and for firms at the minimum and maximum
tax rates for the State. Similar results were also estimated assuming revenue neutral
offsetting tax rate changes by the States.

307
The study’s State-by-State macromodel of employment and revenue effects
allows employment and trust fund revenue effects to be estimated for the effects of
increases in State, Federal, and total UI taxes.
Study Findings
Findings in the study are presented based on the macromodel estimates,
universe data, and sample data. Highlights of the study’s findings, based on these
categories are shown below.
Macroeconomic Estimates
4 Increasing the Federal tax base to $28,000 would raise Federal tax
contributions by $7.2 billion per year and, assuming conformity and no change in
State tax rates or experience rating, raise State tax contributions by $15.4 billion
annually.
4 Complete elimination of the cap on Federal taxable wages would raise Federal
tax contributions by $11.2 billion and State revenues by $25.4 billion.
4 With a modest elasticity of labor demand and a low labor supply elasticity,
raising the taxable wage base to $14,000 would reduce employment by slightly
less than 100,000.
4 Increased Federal UI taxes account for a measurable share of the total
employment effect. Just over one-third of the reduction associated with
increasing the Federal tax base to $14,000 is due to higher Federal taxes, the
remainder is due to higher State tax bases.
4 Eliminating the taxable wage base (i.e., making all UI-covered wages taxable)
would reduce employment by 381,000, less than 0.5 percent of covered
employment.

308
Universe Data
4 Based on universe data from the sample States, doubling the taxable wage
base to $14,000 would increase Federal trust fund contributions by more than 50
percent.
4 Tripling the taxable wage base to $21,000 would roughly double the
contributions to the Federal trust fund.
4 The current Federal wage base covers roughly one-third of total wages in the
States. Raising this to $14,000 would raise that percentage to roughly 55
percent of total wages.
4 Raising the Federal wage base to $65,000 would translate into more than 90
percent of wages in the sample States being covered.
Sample Data
4 The taxable wage proportion increases the most for the largest firm sizes as
the taxable wage base increases from $7,000 to $65,000. As the wage base
increases, relative differences in the effective tax rate tend to diminish, reducing
the relative disadvantage of the smaller firm sizes.
4 Raising the taxable wage base would cause all industries to pay more and
result in some convergence of the effective tax rates. It would also increase the
effective tax rate for high-wage industries more than for low-wage industries.
4 The taxable wage portion increases within each experience-rated tax rate
category as the taxable wage increases. However, there seems to be no
discernable relationship between the taxable wage proportion and the
experience-rated tax rate.
4 Raising the taxable wage base would increase the taxable wage proportion.
This would result in a significant convergence of effective tax rates among firms
with differing average wages.
309
4 Minimum tax rate firms (with the exception of Missouri which has a zero
minimum tax rate) are paying more than their benefit charges. This only
increases as the taxable wage base increases. Among firms with maximum
rates on wages, raising the taxable wage base to $14,000 would, essentially,
remove the ineffective charges in all the States examined (except for Missouri,
where ineffective charges would still be one percent of UI taxes for maximum tax
rate firms).
4 If each State reduced its average tax rate to raise the same amount of revenue
with a higher tax base as it does currently, the difference in the effect by firm size
would be negligible, as would be the effect on firms with different experience-
rated rates. However, the revenue effect on industries with high and low wages
would be substantial, as would the effect on firms with higher and lower average
wages. With the exception of the highest wage category (average wages near or
in excess of $65,000), this revenue effect would be substantial.
EXTENDED UNEMPLOYMENT INSURANCE BENEFIT TRIGGERS
Overview
Most recipients of unemployment insurance receive income support through
State UI programs which provide up to 26 weeks of benefits. Extended benefit
programs offer additional weeks of UI payments when unemployment rates are high.
Since 1970, these programs have included a permanent Extended Benefits (EB)
program and a series of temporary programs which operated during major recessions.
Extended benefits programs are designed to go into effect (“triggered”) when
unemployment reaches a certain level. The permanent EB program and most
temporary programs have historically used the unemployment rate among the
population covered by the UI program (known as the insured unemployment rate, or
IUR) to determine either when extended benefits are made available or the number of

109As a result, in 1991, the TUR was used as an alternativetrigger in a temporary extended benefits program.
110Walter Corson and Anu Rangarajan, Extended UI BenefitTriggers (Princeton, N.J.: Mathematica Policy Research, Inc.,1994).
310
weeks benefits are extended.
In recent years, however, dissatisfaction with the IUR as a “trigger” for extended
benefits has caused policymakers and members of Congress to examine the use of the
unemployment rate among the entire population (TUR) as an alternative trigger for
EB.109
In response to a Congressional request, the Department sponsored a study
which examined the implications of using alternative IUR- and TUR-based triggers for
extended UI benefits.110 The examination included alternative trigger rates and trigger
definitions that, in many cases, included a “threshold” requirement (a requirement that
the current IUR or TUR exceed 120 or 110 percent of the average rate in the
corresponding period during the previous two years).
The examination considered the degree to which alternative triggers and trigger
rates would have provided extended benefits coverage to the UI population during the
past decade and how this coverage would have been distributed by labor market, stage
of the business cycle, calendar quarter, and region of the country.
The study report describes the historical use of triggers in extended benefits
programs, provides definitions of triggers used in the analysis, discusses coverage and
labor market performance of alternative extended benefits triggers, outlines their
performance during business cycle stages, provides information based on an analysis
of their seasonal and regional performance, and discusses several factors affecting the
availability of extended benefits (including national employment and unemployment
patterns and their potential effects on the IUR, State eligibility requirements, and benefit
generosity).
111The triggering mechanism used a moving 13-week average ofthe IUR in a State to determine when extended benefits–whichprovide a maximum of 13 additional weeks of benefits to eligibleclaimants–would be available.
311
Historical Use of Triggers
The researchers provide information about various trigger rates and definitions
that have been used to extend UI benefits over the past several decades. The study
report points out that the permanent UI extended benefits program was enacted as part
of the Employment Security Amendments of 1970 which, unlike two previous temporary
extensions of UI benefits, incorporated a mechanism to trigger extended benefits
automatically when unemployment increased beyond a specific level.111 EB was
triggered when the 13-week average IUR for a State equaled or exceeded four percent
and was at least 120 percent of the State’s average IUR in the corresponding calendar
period during the previous two years. Benefits were made available in all States,
regardless of the State IUR when the national IUR (averaged over a 13-week period)
equaled or exceeded 4.5 percent.
In the early 1980s the EB program was modified substantially. The Omnibus
Budget Reconciliation Act of 1981 instituted several changes in the EB triggering
formula which made it more difficult for States to become and remain eligible for the
program. These changes included the elimination of the national trigger, elimination of
EB claimants from the IUR trigger rate calculation, and an increase in the State trigger
rate from four to five percent (or to six percent if the 120 percent criterion was waived).
It has been estimated that these changes led to a reduction in first payments
under the EB program by about 24 percent in late 1982 and 1983–a recessionary
period of high national unemployment rates. The changes in the trigger rates
accounted for much of the decline. Actual first payments under the EB program during
this period declined by as much as 55 percent from the level that would have been
expected, on the basis of the relationship between EB program first payments and the

112This period was chosen primarily because monthlyseasonally adjusted data on the TUR by State were availablebeginning in 1978 and because two years of data (1978 and 1979)before the beginning of the simulation period were needed tocompute the thresholds used in some of the simulations. Thisperiod also included a wide range of labor market conditions,from an initial recessionary period, to a period of recovery, toa subsequent recession.
113Some of the Bureau of Labor Statistics data used for thedistributional analysis were unavailable for Puerto Rico. Inthese cases, the analysis included the 50 States plus theDistrict of Columbia.
312
TUR in the 1970s.
The study report also notes that a number of temporary extended benefits
programs (enacted during recessionary periods) have used triggers to determine when
extended benefits would be available or to determine the duration of extended benefits
in a State. In most cases, the IUR has been used as the trigger in these temporary
programs, but in several cases alternative triggers have been used. Both the
Temporary Compensation program established by the Emergency Unemployment
Compensation Act of 1971 and the Emergency Unemployment Compensation Program
established in November 1991 used an adjusted IUR designed to account for benefit
exhaustions. The study report compares the triggers in these two temporary programs
with each other and with the basic EB program.
Study Methodology
The researchers analyzed the performance of alternative extended benefits
triggers by simulating the performance of alternative triggers from 1980 through 1991.112
The simulations included all 50 States plus the District of Columbia and Puerto Rico.113
For each State, monthly Bureau of Labor Statistics data on the TUR and weekly UI data
on the IUR were used to compute an on-off indicator for each trigger for each month (in
313
the case of the TUR-based triggers) and each week (in the case of the IUR-based
triggers). When the trigger definition included a threshold requirement, these on-off
indicators considered not only the current level of the unemployment rate (TUR or IUR)
but also the rate in the corresponding period in two prior years.
Similarly, the on-off indicator for the adjusted IUR was computed using weekly
IUR data and monthly data on the number of UI exhaustees.
Monthly or weekly indicators were then aggregated to quarterly measures for
each State, showing the proportion of time the State would have been on extended
benefits during each quarter. These quarterly indicators were then combined with
State-level BLS data on the components of employment and unemployment and UI
data on exhaustions to create a data set for the analysis. This data set was then used
to examine the degree of coverage of the unemployed provided by alternative triggers
and to examine the distributional impacts of alternative triggers relative to labor market
conditions, business cycle stages, seasons, and the geographic regions.
Additional data on UI eligibility conditions by State were added to the data set to
explore the effect that eligibility conditions and other factors may have had on the
availability of extended benefits.
Study Findings
Based on their analysis, following are the key findings presented in the study.
4 The TUR-based trigger rates included in the Emergency Unemployment
Compensation program and in changes to the permanent EB program provide
substantially more extended benefits coverage of UI exhaustees than the IUR-
based trigger rates also used in these two programs.
4 The imposition of thresholds has a major impact on coverage. When a
threshold is used, a substantially lower trigger rate is needed to provide the
same coverage as a given trigger rate without a threshold. Triggers with
thresholds also tend to direct benefits to States and time periods with worsening
labor market conditions. Triggers without thresholds do a better job of directing

314
benefits to States and time periods with high current rates of long-term
unemployment. The performance of mechanisms that trigger extended benefits
when either of two rates is satisfied–a lower rate with a threshold and a higher
rate without a threshold–falls between that of the comparable triggers with and
without thresholds.
4 The performance of TUR- and IUR-based triggers providing equal extended
benefits coverage shows that the TUR-based triggers are better at directing
benefits to States and time periods experiencing high current rates of long-term
unemployment. The IUR-based triggers are better at directing benefits to States
and time periods experiencing worsening labor markets. Because the TUR
triggers are based on seasonally adjusted unemployment rates, they provide
approximately equal coverage to exhaustees regardless of the season. The
IUR-based triggers provide less equal coverage because they rely on data that
are not seasonally adjusted. The TUR-based triggers also appear better at
directing extended benefits coverage to regions with high unemployment rates.
4 Regarding how differences in State UI eligibility requirements and the shift
from a manufacturing to a service economy might affect the availability of
extended benefits, the researchers found that the restrictive State eligibility
criteria tended to have a negative and statistically significant effect on the IUR,
while State benefit generosity had a positive and statistically significant effect on
the IUR. However, the magnitude of these estimates effects was fairly small.
Also, the proportion of unemployment in manufacturing had a positive and
significant effect on the IUR in the first half of the 1980s, but it had an
insignificant effect when the entire decade was considered.

ANNOTATED BIBLIOGRAPHYOF RESEARCH ANDEVALUATION REPORTSCOMPLETED DURINGPROGRAM YEARS 1985-94

ANNOTATEDBIBLIOGRAPHY
Following is a bibliography of research and evaluation reports completed orreviewed by ETA from PY 1985 through PY 1994 (July 1985 through June 1995). Eachreport is listed by title, contractor/grantee, and contract/grant number (as appropriate).
Many of the reports are available free from ETA’s Office of Policy and Research,Room N–5637, 200 Constitution Avenue, N.W., Washington, D.C. 20210. Most arealso available in paper or microfiche through the National Technical Information Service(NTIS), Operations Division, Springfield, Va. 22151, (703) 487–4650. NTIS numbersare provided for reports.
Access of Female Workers to On-the-Job Training–University of Kentucky, 1989. Examines the impact of on-the-job training on gender wage differences.Grant Number: 99-8-3435-75-002-02NTIS Number: PB 90-205352/AS
Administrative and Policy Studies of Unemployment Insurance QualifyingRequirements–The Policy Research Group, Inc., 1985. Analyzes various State UIqualifying requirements in terms of distribution of benefits, costs, and paperworkburden.Contract Number: 20-11-82-26NTIS Number: PB 86-104544/AS
AFDC Recipients in JTPA–Westat, Inc., 1987. Two volumes. Focuses on Title II-Aparticipants who were receiving Aid to Families with Dependent Children at the time ofprogram entry.Contract Number: 99-6-0584-77-066-01
The Alternative Base Period in Unemployment Insurance: FinalReport–(Unemployment Insurance Occasional Paper 95-3)–Urban Institute, 1995. Examines the effects of alternative base period arrangements for determining monetaryeligibility for unemployment insurance benefits.Contract Number: K-4244-3-00-80-30, Task Order 8.NTIS Number: PB95-232401
Alternative Methods for Evaluating the Impact of Training on Earnings–EconomicsResearch Center, University of Chicago, 1983. Considers the problems of estimatingthe impact of training on earnings.Contract Number: 20-17-82-20

America and the New Economy–American Society for Training and Development,1991. Examines the impact of changing competitive standards, new technologies, andemerging organizational structures on jobs and skill requirements in the Americanworkplace.Grant Number: 99-6-0705-75-079-02NTIS Number: PB 91-219527
American Poverty: The Role of Education, Training and Employment Strategies inthe New Anti-Poverty Struggle–(Evaluation Forum, Issue 10)–U.S. Department ofLabor, Employment and Training Administration, 1994. A review journal foremployment and training professionals; includes numerous articles on the topic ofpoverty in America and interviews with individuals who have extensive knowledge onthe topic. Also includes information about recent research efforts and availableresources.
An Analysis of the Impact of CETA Programs on Components of Earnings andOther Outcomes–SRI International, 1984. Focuses on estimating the impact ofparticipation in the Comprehensive Employment and Training Act program on earningsand the composition of earnings changes.Contract Number: 20-06-82-22
An Analysis of the Impact of CETA Programs on Participants’ Earnings–SRIInternational, 1984. Estimates the net impact of CETA programs on participants'postprogram earnings.Contract Number: 20-06-82-21
An Analysis of Pooled Evidence from the Pennsylvania and WashingtonReemployment Bonus Demonstrations (Unemployment Insurance Occasional Paper92-7)–Mathematica Policy Research, Inc., 1992. Analyzes the experience of a mergedsample of unemployment insurance claimants in two demonstrations that testedreemployment bonuses for unemployed workers.Contract Number: 99-7-0805-04-137-01 NTIS Number: PB 93-160703
An Analysis of UI Trust Fund Adequacy–ICF Incorporated, 1987. Analyzes Statebenefit financing in the unemployment insurance system and suggests alternativemeasures of adequacy of the UI Trust Fund.Contract Number: 99-5-3024-04-090-01NTIS Number: PB 87-209342
Anatomy of a Demonstration: The Summer Training and Education Program(STEP) from Pilot through Replication and Postprogram Impact–Public/PrivateVentures, 1992. Analyzes the Summer Training and Education Program from its earlyconceptualization through the five-city demonstration, to its replication in over 100locations throughout the country.Grant Number: 99-6-3372-75-004-02

Assessing the Adequacy of Labor Market Information at the State and LocalLevel–Northeast-Midwest Institute, 1990. Describes findings from research on theadequacy of labor market information for State and local data users in the public andprivate sectors.Contract Number: 99-9-3436-75-050-01NTIS Number: PB 91-112953
Assessing JOBSTART Interim Impacts of a Program for SchoolDropouts–Manpower Demonstration Research Corporation, 1991. Summarizesfindings on the implementation of the JOBSTART demonstration and presentsinformation (based on two years of followup) on the difference that the program made inthe educational attainment, employment, welfare receipt, and other outcomes ofparticipants. Grant Number: 99-6-3356-75-003-02
An Assessment of Alternative Comparison Group Methodologies for EvaluatingEmployment and Training Programs–Mathematica Policy Research, Inc., 1984. Provides an empirical assessment of the reliability of net program impact estimates.Contract Number: 20-11-82-15
Assessment of the Implementation and Effects of the JTPA Title VWagner–Peyser Amendments–Phase II Final Report –Macro Systems, Inc., 1985. Process study assessing the effects of the Job Training Partnership Act Title Vamendments during PY 1984. The report is based primarily upon interviews withofficials in 16 States and 31 SDAs.Contract Number: 99-4-576-77-081-01NTIS Number: PB 86-169604/AS
An Assessment of the JTPA Role in State and Local Coordination Activities-–James Bell Associates, 1990. Assesses the role of program coordination inenhancing JTPA program effectiveness and efficiency. The report identifies majorstrategies and characteristics of coordination; assesses relative advantages anddisadvantages of coordination; identifies factors which are effective in promoting andenhancing coordination; and assesses legal, administrative, and other barriers tocoordination.Contract Number: 99-8-4701-75-065-01NTIS Number: PB 91-219519/AS
The Availability of Information for Defining and Assessing Basic Skills Requiredfor Specific Occupations–The Urban Institute, 1990. Incorporates a literature review,employer interviews, and an assessment of all available skill–measurement tests. Identifies skills that employers highly value.Contract Number: 99-9-0421-75-081-01NTIS Number: PB 91-212357
Best Practices: What Works in Training and Development (Accounting and

Evaluation)–American Society for Training and Development, 1989. Highlights theresponsibilities of human resource developers for measuring and evaluating training. Includes a discussion of the main reasons for measuring and evaluating training, thecosts of training, and the problems that impede measuring and evaluating training.Grant Number: 99-6-0705-75-079-02NTIS Number: PB 89-223705/AS
Best Practices: What Works in Training and Development (Basic Skills)–AmericanSociety for Training and Development, 1989. Assesses the skills that employers wantin their workforce, why those skills are strategically important to organizations, and whythey should be considered "basic." Examines 16 skills in detail and provides a modelfor establishing a workplace basics program.Grant Number: 99-6-0705-75-079-02NTIS Number: PB 89-181754/AS
Best Practices: What Works in Training and Development (Basic SkillsManual)–American Society for Training and Development, 1989. Companion manualto the Basic Skills text (above). Provides practical information for employers andtrainers on how to set up workplace basics programs. The model identified in the text isthe basis for the step–by–step process that is the "blueprint for success" in the manual. Grant Number: 99-6-0705-75-079-02NTIS Number: PB 89-181747/AS
Best Practices: What Works in Training and Development (Organization andStrategic Role)–American Society for Training and Development, 1989. Identifies whoreceives training in America and how training is structured, financed, and connected tothe strategic goals of employers. Suggests practical methods for connecting training toemployer goals and for influencing strategic decision–making.Grant Number: 99-6-0705-75-079-02NTIS Number: PB 89-181762/AS
Best Practices: What Works in Training and Development (TechnicalTraining)–American Society for Training and Development, 1989. Provides anunderstanding of America's technical workforce, the learning systems that keep theworkforce well–skilled, and how corporations are managing their technical trainingneeds.Grant Number: 99-6-0705-75-079-02NTIS Number: PB 89-223713/AS
Beyond the School Doors: The Literacy Needs of Job Seekers Served by the U.S.Department of Labor–Educational Testing Service, 1992.Describes the literacy needsof participants in ETA–administered programs––JTPA, Employment Service, andunemployment insurance.Contract Number: 99-8-3458-75-052-01 NTIS Number: PB 93-169191

Building a Job Service for the Year 2000: Innovative State Practices–InterstateConference of Employment Security Agencies, 1989. Analyzes innovative State JobService practices in four general areas: improving the job match process, developingapplicant jobseeking skills, recruiting workers in a labor–short economy, and improvingthe efficiency of public training and employment programs through a cooperativeservice delivery system.Grant Number: 99-7-1154-98-357-02NTIS Number: PB 90-216664
Case Studies of Exemplary Dislocated Worker Programs–CSR Incorporated, 1986. Provides descriptions of 10 projects operated under Title III of JTPA.Contract Number: 9-5-2224-61-019-01
Case Studies of JTPA Title III Projects Serving Workers Dislocated from the Steeland Copper Industries–CSR Incorporated, 1986. Describes five JTPA Title III projectsserving workers dislocated from the steel and copper industries.Contract Number: 99-5-2224-61-019-01
Child Care and the Labor Supply of Married Women–David Christopher Ribar(Doctoral Dissertation), Brown University, 1990. Uses information from the Survey ofIncome and Program Participation to provide labor supply and cross–section child caredata. Examines family demands for child care services and presents a conceptual childcare and labor supply model.Grant Number: 99-93545-98-078-04
A Comparison of the Effectiveness of JTPA Training Programs Administeredunder Tuition vs. Performance-Based Contracts in the City of Pittsburgh andAllegheny County–University of Pittsburgh and Allegheny County Commission forWorkforce Excellence, 1991. Summarizes the findings of a study that examined theeffectiveness of administering public training programs under tuition versusperformance-based contracts.Contract Number: 99-0-1500-98-003-04
Coordination of Housing and Job Training Services: A Review of Best Practicesin 12 Cities–Westat, Inc., 1992. Describes the variety of approaches 12 cities haveadopted to coordinate housing and job training services.Contract Number: 99-0-0584-75-055-01
The Cyclical Effects of the Unemployment Insurance Program: Final Report(Unemployment Insurance Occasional Paper 91-3)–Metrica, Inc., 1991. Analyzes theeffect of the unemployment insurance program as an automatic economic stabilizer. Discusses theoretical reasons that enable the UI program to stabilize the businesscycle, presents evidence of the effect of UI on the cycle, reviews literature about UI'sability to act as a stabilizer, and estimates the effect of UI on stabilizing the businesscycle.Contract Number: 99-9-4818-98-037-01

NTIS Number: PB 91-197897/AS
The Decline in Unemployment Insurance Claims Activity in the 1980s (Unemployment Insurance Occasional Paper 91-2)–The Urban Institute, 1991. Analyzes the decline in the number of unemployment insurance recipients during the1980s. Presents background information about the decline, reviews previous literature,describes new survey data on UI receipt, presents a statistical analysis of new surveydata, and discusses some of the reasons for the decline in the number of recipients.NTIS Number: PB 91-160994/AS
Development of Employment Service Performance Standards for Sub–StateAreas –Abt Associates, Inc., 1985. Concerned with updating the existing State–levelperformance standards model and applying the model to substate areas.Contract Number: 20-25-82-09NTIS Number: PB 86-144896/AS
Dilemmas in Youth Programming: Findings from the Youth Research andTechnical Assistance Project-Volumes I and II–Brandeis University andPublic/Private Ventures, 1992. Two–volume report presents findings of 10 studies ofyouth programs. Provides insight into the types of programs, services, and techniquesthat best prepare young people for jobs and careers; discusses strategies ofgovernance and management that offer the greatest opportunity for effective delivery oftraining and employment services for young people; and lists factors regarding youth,their environment, and the labor market that must be addressed in providing services toyouth.Contract Number: 99-0-1879-75-053-01NTIS Number: PB 93-167633 (Volume I); PB 93-167641 (Volume II) "Displaced Workers of 1979–1983: How Well Have They Fared?" –U.S. Departmentof Labor, Bureau of Labor Statistics, Monthly Labor Review, June 1985. Analyzes theeffects of plant closings and long–term unemployment on various age, sex, ethnic, andoccupational groups with regard to earnings, health benefits, period of unemployment,and other relevant factors.
Displaced Workers, 1981-1985–U.S. Department of Labor, Bureau of Labor Statistics,1987. Provides an update on the status, location, and demographics of displacedworkers through 1985, based on Current Population Survey data. BLS Bulletin 2289
Displaced Workers, 1985-89–U.S. Department of Labor, Bureau of Labor Statistics,1991. Provides an overview of worker displacement patterns during the 1980s anddescribes the employment situation of workers displaced during the 1985-89 period.BLS Bulletin 2382
Dual Careers, Volume 6: Fifteen Year Report on the National LongitudinalSurveys of Mature Women’s Cohort–The Ohio State University, 1985. Explores

similarities and differences of black and white mature women covering a broadspectrum of occupational and family considerations.Contract Number: 82-39-72-21NTIS Number: PB 86-144995/AS
Economic Change and the American Workforce–Jobs for the Future, Inc., 1992. Anexecutive summary of findings from a three-volume study of the economic andemployment dynamics in four States that are broadly representative of the UnitedStates. Defines specific employment and training issues associated with the neweconomic era and provides suggestions for meeting new workplace demands.Grant Number: 99-9-3485-98-009-02NTIS Numbers: PB 92-226356 (Executive Summary) and PB 91-191749 (All fourvolumes)
The Effects of Increasing the Federal Taxable Wage Base for UnemploymentInsurance–(Unemployment Insurance Occasional Paper 95-1)–KRA Corporation,1995. Provides estimates of the employment and revenue effects of raising the Federaltaxable wage base to various levels.Contract Number: 3965-2-00-80-30NTIS Number: PB95-216545
The Emerging Hispanic Underclass–The Rand Corporation, 1991. Describes trendsin wage ratios for Hispanic men from 1971 to 1987, discusses trends in their schooling,summarizes the impact of recent Hispanic immigration on the demographics of theHispanic population, and describes the results of a statistical analysis of thedeterminants of male Hispanic wages from 1971 to 1987.Contract Number: 99-8-3055-75-080-01
Employer Layoff and Recall Practices (Unemployment Insurance Occasional Paper92–3)–U.S. Department of Labor, Bureau of Labor Statistics, 1992. Explores the needsof dislocated workers; attempts to gather additional information from an employer'sperspective regarding the planning and implementation of layoffs, including theemployer's expectations prior to the onset of layoff and the method and timing ofproviding workers with layoff information.Contract Number: 99-0-3252-75-002-03NTIS Number: PB 92-174903/AS
Employer-Supported Child Care: Measuring and Understanding Its Impacts onthe Workplace–Berkeley Planning Associates, 1989. Investigates the relationshipbetween child care and productivity and includes a review of the literature. Containscase studies of seven firms deciding to provide child care for employees, traces thedecision–making process leading firms to become involved in child care, and providesan evaluation design by which to assess results.Contract Number: 99-8-3229-075-01NTIS Number: PB 90-225285/AS

The Employer’s Decision to Train Low-Wage Workers–University of Washington,1992. Uses survey data and tax records for 544 employers in Washington State toexamine the decisions of employers to train low-wage workers.Grant Number: 99-0-1897-75-104-02
Employment and Training for America’s Homeless: Report on the Job Trainingfor the Homeless Demonstration Program –James Bell Associates, 1994. Presentsthe results of an evaluation of the Job Training for the Homeless DemonstrationProgram and assesses its implications for providing effective employment and trainingservices for homeless individuals.Contract Number: 99-1-4701-79-086-01.
Enhancing Literacy for Jobs and Productivity–Council of State Policy and PlanningAgencies (now known as the Council of Governors' Policy Advisors), 1989. Providesguidance to States and organizations interested in developing statewide coordinatedpolicies aimed at raising workforce literacy levels.Grant Number: 99-7-3415-98-336-02NTIS Number: PB 89-205322
Evaluation of Existing Automated Interstate Job Finding Programs–MacroSystems, 1989. Examines various aspects of the existing interstate automated jobfinding system and a variety of alternative approaches to the existing system.Contract Number: 99-8-0576-75-030-01
Evaluation of Job Corps’ Pilot Project to Include 22-to 24-Year-Olds–ExecutiveResource Associates, Inc., 1987. Studies the value of serving 22- to 24-year-olds inJob Corps.Contract Number: 99-6-2746-35-011-01
Evaluation of the Defense Conversion Adjustment Demonstration: Interim Reporton Implementation–Berkeley Planning Associates and Social Policy ResearchAssociates, 1994. Based on an ongoing evaluation of the Defense ConversionAdjustment Demonstration–which provides innovative approaches to help workers indefense industries remain employed or to find new jobs–provides information about keydesign features of the demonstration sites and summarizes implementationexperiences during their first 12 to 14 months.Contract Number: Q-4294-3-00-87-30NTIS Number: PB96-146162
Evaluation of the EDWAA Job Creation Demonstration–Berkeley PlanningAssociates, 1994. Summarizes findings from a three-year evaluation of the EconomicDislocation and Worker Adjustment Assistance Act Job Creation Demonstration whichwas designed to explore the effectiveness of Community Development Corporations inexpanding employment opportunities for dislocated workers through entrepreneurialtraining and linkages to other economic development activities.Contract Number: 99-1-3229-71-054-01

NTIS Number: PB96-146220
An Evaluation of the Feasibility of a Substate Area Extended Benefit Program(Unemployment Insurance Occasional Paper 89-5)–Mathematica Policy Research,1989. Assesses the feasibility of developing and operating a program of extended UIbenefits at the substate level. Examines differences in labor market conditions amongsubstate areas and uses a simulation model to evaluate the targeting efficiency ofalternative substate program design options.Contract Number: 99-7-0805-04-138-01NTIS Number: PB 90-127531/AS
An Evaluation of the Federal Supplemental Compensation Program–MathematicaPolicy Research, Inc., 1986. Analyzes the effects of the Federal SupplementalCompensation Program on recipients in the economic context of the recession of the1980s.Contract Number: 99-3-2034-77-139-01NTIS Number: PB 86-163144/AS
Evaluation of the Impacts of the Washington Alternative Work Search Experiment(Unemployment Insurance Occasional Paper 91-4)–Battelle Human Affairs ResearchCenters, 1991. Describes findings from an experimental evaluation of the effectivenessof four alternative work search approaches in the UI program.Contract Numbers: 91-PS-067 and 86-PS-29NTIS Number: PB 91-198127/AS
Evaluation of the Implementation of Performance Standards Under JTPA TitleII–A–Centaur Associates, Inc., 1987. Describes the standards used to evaluateprogram management and the strengths and weaknesses of the performancemanagement system, among other items.Contract Number: 99-5-3348-77-050-01
Evaluation of the JTPA Title IV Migrant and Seasonal FarmworkerProgram–Berkeley Planning Associates and SPR Associates, 1994. Summarizes theresults of a study of the JTPA Title IV, Section 402 program for migrant and seasonalfarmworkers which assists farmworkers in obtaining or retaining upgraded agriculturalor nonagricultural employment.Contract Number: 99-1-3229-75-074-01NTIS Number: PB96-146170
An Evaluation of Short-Time Compensation Programs–Mathematica PolicyResearch, Inc., 1986. Analyzes the effects of short–time compensation programs onemployment stability of workers and demands on the Unemployment Insurance TrustFund.Contract Number: 99-3-0805-77-117-01NTIS Number: PB 86-167616/AS

Evaluation of the Transition to Work Demonstration Projects Using a NaturalSupports Model: Final Report–Pelavin Research Institute, 1995. Describes theresults of an evaluation of six projects designed to demonstrate the effectiveness ofusing “natural supports” (relying on supervisors, coworkers, family members, friends,and other personnel) to provide the training and supervision needed to help individualswith disabilities perform satisfactorily in jobs.
Evaluation Study of the Senior Community Service Employment Program–CentaurAssociates, Inc., 1986. Assesses the ability of the SCSEP program to reach and servetarget groups, provides a process description of the program, and describes satisfactionof participants and host agencies.Contract Number: 99-5-3333-77-021-01
An Examination of Declining UI Claims During the 1980s (Unemployment InsuranceOccasional Paper 88-3)–Mathematica Policy Research, Inc., 1989. Describes factorscontributing to the decline in the number of initial claims in the 1980s.Contract Number: 99-6-0805-04-097-01NTIS Number: PB 89-160048/AS
Experience Rating in Unemployment Insurance: Some Current Issues(Unemployment Insurance Occasional Paper 89-6)–U.S. Department of Labor,Unemployment Insurance Service, 1989. Looks at experience rating in unemploymentinsurance by defining important experience rating concepts, reviewing four associatedissues, examining the degree of experience rating, and critiquing an analysis of thesystem conducted by the Department of Labor.NTIS Number: PB 90-216656
Extended UI Benefit Triggers–(Unemployment Insurance Occasional Paper 94-2)–Mathematica Policy Research, Inc., 1994. Examines the implications of usingalternative triggers for extended UI benefits based on the insured unemployment rateand the total unemployment rate. Also examines how differences in State UI eligibilityrequirements and the shift from a manufacturing to a service economy may affect theavailability of extended benefits.Contract Number: 7949-002NTIS Number: PB94-178290
The Extent and Pattern of Joblessness Among Minority Men–SRI International,1989. Documents and analyzes the disparity in the labor market performance of blackand Hispanic men vis–a–vis white men, focusing specifically on labor forceparticipation, unemployment, and hours of work during a year.Contract Number: 99-8-3055-75-080-01NTIS Number: PB 89-218671/AS
Fairness in Employment Testing: Validity Generalization, Minority Issues, andthe General Aptitude Test Battery–National Research Council, 1989. Investigatesvarious aspects of the General Aptitude Test Battery related to accuracy and fairness.

Contract Number: 99-7-3239-98-101-01
Fifty Years of Unemployment Insurance-A Legislative History: 1935-1985–U.S.Department of Labor, Employment and Training Administration, 1986. Provides thebackground, framework, and detailed legislative history of the Federal-Stateunemployment insurance system.NTIS Number: PB 87-179834/AS
Financial Incentives for Employer-Provided Worker Training: A Review ofRelevant Experience in the U.S. and Abroad–The Urban Institute, 1990. Exploresseveral incentives, such as tax credits, direct government grants, and mandatorytraining programs, that could be used to encourage employers to provide additionaltraining for their employees.Contract Number: 99-9-0421-75-081-01NTIS Number: PB 91-212373
Finishing Up with Pride: A Case Study in Early Intervention Assistance forTennessee Copper Miners–Annapolis Economic Research, 1989. Describes advancenotification in connection with the Tennessee Chemical Company's mass layoff in 1987. The case study shows that early intervention assistance, when coupled with union andcompany support, can significantly increase the number of workers who can beassisted in their reemployment efforts.Contract Number: 99-8-4521-75-007-04
FIRMSTART: An Examination of Self-Employment–Corporation for EconomicDevelopment, 1989. Provides research on and policy analysis of the viability of self-employment for people who are unemployed or have low incomes. Produced as a jointeffort of three States–Massachusetts, Michigan, and New Jersey.Grant Number: 99-8-3394-98-001-02
First Impact Analysis of the Washington State Self-Employment and EnterpriseDevelopment (SEED) Demonstration–(Unemployment Insurance Occasional Paper94-1)–Abt Associates, 1994. Presents interim estimates of the impacts of the SEEDdemonstration program–a self-employment program for unemployed workers–on theemployment and earnings of participants based primarily on data from a followuptelephone survey conducted approximately 21 months after participants were randomlyassigned to either a treatment group (which received demonstration services), or to acontrol group. Contract Number: 99-8-0803-98-047-01NTIS Number: PB94-162203
Flexible Employment, Contingent Work: Implications for Workers’Benefits–Columbia University, 1990. Presents findings from research on whether, andhow, employers modify work schedules, the terms of employment, and nonwagebenefits in response to changes in labor demand and labor supply conditions. Discusses various aspects of "contingent" work, which is defined as self-employment,

part-time work, and temporary work.Contract Number: 99-8-0422-75-067-01NTIS Number: PB 92-236033
From the Farm to the Job Market: A Guide to Employment and Training Servicesfor Farmers and Ranchers–Berkeley Planning Associates and Social Policy ResearchAssociates, 1994. Describes the differences between farmers and other clients servedby training and employment programs, outlines startup activities for programs seekingto improve services to farmers, and describes how programs can be designed to meetthe needs of farmer clients. Contract Number: 99-1-3229-71-036-01NTIS Number: PB96-146147
A Guide to Assessing the Benefits and Costs of Employer Child CareAssistance–Berkeley Planning Associates, 1989. Assists employers and managers toreach decisions about whether child care benefits are appropriate for their organizationsand, if so, which types of benefits are most appropriate. For employers who alreadyprovide support for child care, the guidebook assists in determining the best approachto evaluating employer efforts.Contract Number: 99-8-3229-075-01NTIS Number: PB 90-225285/AS
A Guide to High School Redirection–High School Redirection, 1991. Providesinformation about High School Redirection, an alternative high school in New York thathelps dropouts or potential dropouts complete their education. Discusses the school'sphilosophy, student population, admissions policies, staff, administrative structure,budget, operations, and discipline. Provides information on replication efforts in sevensites.Purchase Order Number: 99-8-4671-75-010-04NTIS Number: PB 91-219501
A Guide to Well-Developed Services for Dislocated Workers–Social PolicyResearch Associates, Berkeley Planning Associates, and SRI International, 1994. Provides information about effective strategies to service dislocated workers under avariety of local conditions.Contract Number: 99-9-3104-98-084-01NTIS Number: PB96-146188
Health Status and Work Activity of Older Men: Events-History Analyses ofSelected Social Policy Issues–The Ohio State University, 1985. Describes theeffects of health, longevity, ethnicity, inherited factors, occupation, and job satisfactionon decisions to retire or remain employed.Contract Number: 82-39-72-21NTIS Number: PB 85-235497/AS
Hispanics and the American Dream: An Analysis of Hispanic Male Labor Market

Wages. Part of a two-volume report. See The Emerging Hispanic Underclass.
How Workers Get Their Training–U.S. Department of Labor, Bureau of LaborStatistics, 1985. Describes sources and uses of training to obtain jobs. Containsinformation useful in career guidance and planning education and training programs.
ICD Survey II: Employing Disabled Americans–International Center for theDisabled, 1987. Describes the responses of top managers and line supervisors toquestions on hiring policy and practices, experiences with disabled employees, andattitudes concerning reasons for not hiring disabled workers; the survey also suggestsfurther actions to promote their hiring.Grant Number: 99-6-3396-98-073-02
Immigration Demonstration Grant Final Evaluation Report–Seattle-King CountyPrivate Industry Council, 1995. Presents findings from a demonstration project thatprovided job training and employment services to Asians and Hispanics in the Seattlearea.
Impact of Advance Notice Provisions on Postdisplacement Outcomes–BostonUniversity, 1990. Examines the extent to which advance notice eases adjustmentproblems for workers displaced from their jobs due to plant closings and permanentlayoffs.Contract Number: 99-8-2152-95-082-01NTIS Number: PB 90-226648/AS
Impact Study of the Implementation and Use of the Targeted Jobs Tax CreditProgram–Macro Systems, Inc., 1986. Five volumes plus overview and summary. Looks at the effectiveness of the Targeted Jobs Tax Credit and describes its short–termnet impact on four target groups: disadvantaged youth, welfare recipients, veterans,and handicapped persons.Contract Number: 99-4-576-77-091-01
Implementation of the Job Training Partnership Act: Final Report–Westat, Inc.,1985. Studies the implementation period of JTPA Titles II–A and III during the first ninemonths of PY 1984.Contract Number: 99-3-0584-75-104-01NTIS Number: PB 85-198661
Implementing the National JTPA Study–Manpower Demonstration ResearchCorporation, 1990. Reviews various technical aspects of the implementation of theNational JTPA Study.Contract Number: 99-6-3356-77-061-01
Improving the Quality of Training Under JTPA–Berkeley Planning Associates andSRI International, 1989. Examines the quality of training provided to adults under JTPATitle II–A. Forty-three occupational training programs were visited in 15 randomly

selected SDAs.Contract Number: 99-8-3229-75-087-01NTIS Number: PB 91-212143
Intake Systems for Dislocated Worker Programs: Matching Dislocated Workersto Appropriate Services–CSR Incorporated, 1986. Concerned with intake systems forcontrolling the flow of eligible applicants for programs funded under Title III of JTPA.Contract Number: 99-5-2224-61-019-01
International Trade and Worker Dislocation: Evaluation of the Trade AdjustmentAssistance Program–Mathematica Policy Research, Inc., 1993. Offers findings from astudy of the prelayoff characteristics and postlayoff labor market experiences of TradeReadjustment Allowance recipients and describes the training provided under theprogram based on data obtained from nationally representative samples of TradeAdjustment Assistance trainees.Contract Number: 99-9-0805-75-071-01
Interorganizational Partnerships in Local Job Creation and Job Training Efforts:Six Case Studies–Cosmos Corporation, 1989. Presents examples of best practices inlinking local resources and organizations to job creation and job training initiatives. Contract Number: 99-8-4700-75-064-01NTIS Number: PB 90-131392/AS
Issues for Active State Management of the JTPA Title III Grant–Westat, Inc., 1986. A guide for State planners and managers on the grant management process for Title III.Contract Number: 99-5-2224-61-019-01
The Jacksonville Experience: Building on Success–MDC, Inc., 1988. Examines theJTPA summer youth program operated by the City of Jacksonville, Fla., during 1986and 1987. The city's program was one of the first summer programs to combineclassroom basic education and work experience.Grant Number: 99-6-3393-77-068-02
Job Corps: Evaluation of Computer–Assisted Instruction Pilot Project –ShugollResearch, Inc., 1989. Assesses the impact of computer-assisted instruction on JobCorps members' academic performance and behavior.Contract Number: 99-6-4524-77-073-01NTIS Number: PB 89-218580/AS
Job Corps Process Analysis–Macro Systems, Inc., and Mathematica PolicyResearch, Inc., 1985. Pulls together information on components of, and servicesassociated with, the program, and documents how they operate at specific centers andsupport agencies.Contract Number: 99-4-805-75-64-01
Job Development for Dislocated Workers–CSR Incorporated, 1986. Provides Title

III program operators with guidance regarding the technical issues entailed in thedesign and implementation of dislocated worker programs. Contract Number: 99-5-2224-61-019-01
Job Displacement and Labor Market Mobility–University of Massachusetts, 1990. Examines labor market mobility of dislocated workers using an analysis of matchingdata from the 1984, 1986, and 1988 Displaced Worker Supplements to the CurrentPopulation Surveys of the same years.Contract Number: 99-8-3481-75-085-01NTIS Number: PB 90-218660/AS
Job Placement Systems for Older Workers–National Caucus and Center on BlackAged, Inc., 1987. Two volumes. Describes participant characteristics, servicesprovided, and employment outcomes for a sample of JTPA three percent set–asideprograms. The study also provides 23 case studies of training and employmentprograms for older workers, and advice on designing and managing a job placementsystem for older workers. Interagency agreement with the U.S. Department of Health and Human Services, Officeof Human Development Services, Administration on Aging.NTIS Number: PB 90-205311/AS
Job Training for the Homeless: Report on Demonstration’s First Year–R.O.W.Sciences, Inc., 1991. Describes and analyzes the first year of operations of the JobTraining for the Homeless Demonstration Program. Emphasizes the need for adiversified and coordinated approach to serving the needs of the homeless population.Contract Number: 99-9-4806-79-023-01NTIS Number: PB 92-163765
JOBSTART: Net Impact Study–Manpower Demonstration Research Corp., 1991. Identifies results of a followup of JOBSTART participants over a three-year period. Assesses the impact of JOBSTART projects which provided remedial education, skillstraining, job counseling, and placement assistance within the JTPA system to dropoutyouths.Grant Number: 99-6-3356-75-003-02
JTPA Staffing and Staff Training at the State and SDA Levels–Berkeley PlanningAssociates, 1991. Summarizes the educational background, experience, and skills ofJTPA staff at the State and local levels and examines JTPA staff capabilities, theadequacy of existing staff training, and unmet staff training needs.Contract Number: 99-8-3229-75-079-01NTIS Number: PB 91-219543/AS
JTPA Title II-A Participants Who Were Receiving Public Assistance at ProgramApplication: New Enrollees and Terminees During PY 1984–Westat Inc., 1986. Describes the new enrollees and terminees who were receiving public assistance at thetime of entry into JTPA Title II–A programs.

Contract Number: 99-6-0584-75-083-01
JTPA Title II-A Participants Who Were School Dropouts at Program Application:Program Year 1986–Westat, 1988. Summarizes the characteristics and experiencesof dropouts who participated in JTPA programs.Contract Number: 99-6-0584-75-083-01
JTPA Title II-A and III Enrollments and Terminations During Program Year1988–Westat, Inc., 1990. Summarizes the characteristics and experiences of personswho participated in training programs authorized under Title II-A and Title III of JTPAduring PY 1988. Data were obtained from the Job Training Quarterly Survey.Contract Number: 99-0-0584-75-013-01
The Jump Start to Language Power Program Pilot Study (Phase II: Gary Job CorpsCenter and Clements Job Corps Center)–Helen G. Cappleman, 1988. Compares JobCorps' Jump Start experimental reading program with the regular program, and offersevidence that the Jump Start program enhances Corps members' reading performanceand attitude toward reading.Contract Number: 99-6-4488-35-014-01
Kansas Nonmonetary Expert System Prototype (Unemployment InsuranceOccasional Paper 90-1)–Evaluation Research Corporation, 1990. Reviews varioussteps involved in developing the Nonmonetary Expert System Prototype in Kansas.Contract Number: 99-7-4646-04-142-01NTIS Number: PB 90-232711
Labor Market Information: An Agenda for Congress–Northeast-Midwest Institute,1988. Evaluates the adequacy of currently available labor market information as thebasis for lawmaking and policy decisions.Grant Number: 99-8-3436-75-003-02NTIS Number: PB 91-111690/AS
Labor Market Information: A State Policymaker’s Guide–Northeast-MidwestInstitute, 1988. Describes and assesses labor market information sources andprograms of interest to State policymakers.Grant Number: 99-8-3436-75-003-02NTIS Number: PB 91-111740
Labor Shortage Case Studies: Final Report–James Bell Associates and Lewin-ICF,1992. Provides case studies of supply and demand in four occupations–specialeducation teachers, home health care workers, electrical/electronic engineers, and tooland die workers. Indicates why labor shortages may develop in these occupations;discusses adjustments that employers and workers make in response to the shortages;describes symptoms and likely consequences of labor shortages; and explains whythey may persist for extended periods.Contract Number: 99-9-4710-75-077-01

NTIS Number: PB 94-144334
Launching JOBSTART: A Demonstration for Dropouts in the JTPASystem–Manpower Demonstration Research Corporation, 1987. Describes the initialresults of the JOBSTART demonstration in 13 sites, all of them funded primarilythrough the JTPA system.Grant Number: 99-6-3356-75-003-02
Leadership in Appellate Administration: Successful State UnemploymentInsurance Appellate Operations (Unemployment Insurance Occasional Paper 89-7)–U.S. Department of Labor, Employment and Training Administration, 1989. Presents findings of a project which reviewed 15 State UI appeals units to documentthe administrative practices and procedures used to promptly decide unemploymentinsurance appeals.NTIS Number: PB 90-161183/AS
Learning a Living: A Blueprint for High Performance. A SCANS Report forAmerica 2000–U.S. Department of Labor, Secretary's Commission on AchievingNecessary Skills, 1992. Calls for a reorganization of education and work to close theskills gap and prepare the workforce for the future. Identifies three areas that mustchange, and lists several recommendations to bring about this change. Final report ofcommission.Government Printing Office Stock Number: 029-000-00440-4NTIS Number: PB 93-107449
The Learning Disabled in Employment and Training Programs–The Urban Institute,1991. Provides estimates of the extent to which adults eligible for JTPA and othereducation, employment, and training programs normally identified as "functionallyilliterate" are learning disabled. Discusses methods of testing and assessment toidentify learning disabilities in adults and presents policy recommendations for servingthis population in training and employment programs.Contract Number: 99-9-0421-75-081-01NTIS Number: PB 92-163781
The Learning Enterprise–American Society for Training and Development, 1989. Summarizes information obtained from a 30-month research effort which exploredpublic and private training practices. Summarizes diverse data that were obtainedduring the research effort.Grant Number: 99-6-0705-75-079-02NTIS Number: PB 89-218721/AS
Literacy Audit of Maintenance Workers–Interactive Training, Inc., 1990. Reviewsfindings of a national literacy audit of maintenance worker jobs in multifamily apartmentcomplexes. Presents findings from mail surveys, site visits, and telephone interviews.Contract Number: 99-8-4704-75-077-01NTIS Number: PB 90-218785/AS

Long-Term Earnings Effects of the National Supported Work (NSW) Experiment:Evidence for the Youth and AFDC Target Groups–University of Wisconsin, 1991. Investigates the long-term earnings effect of the National Supported Work experimenton recipients of Aid to Families with Dependent Children. Extends prior evaluations ofthe NSW's earnings effect by seven years. Contract Number: 99-1-3605-75-001-04NTIS Number: PB 92-239664
Low-Wage Jobs and Workers: Trends and Options for Change–Institute forWomen's Policy Research for Displaced Homemakers Network, 1989. Analyzes thecharacteristics of low-wage jobs and workers by industry, occupation, ethnicity, gender,family status, and other factors over a 10-year period from 1975-1984.Contract Number: 99-8-2438-75-081-01NTIS Number: PB 90-204595/AS
Measuring the Effect of CETA on Youth and the Economically Disadvantaged–TheUrban Institute, 1984. Describes research using the Continuous LongitudinalManpower Survey to measure the effect of employment and training programs on youthand the economically disadvantaged.Contract Number: 20-11-82-19
Measuring the Performance of Job Training Programs in Reducing WelfareDependency–New York City Department of Employment, 1985. Studies the impact ofjob training programs on reducing welfare grants.Contract Number: 21-36-82-04
A Micro Assessment of the Determinants of Productivity in the U.S.Manufacturing Industry–Massachusetts Institute of Technology, 1985. Assessesindustry-related productivity factors beyond the control of workers.Contract Number: 21-25-82-09NTIS Number: PB 86-154028/AS
Micro Consequences of Macro Policies: Employment Effects of Federal BusinessTax Incentives–Duke University, 1985. Analyzes varying effects of Federal taxesacross industries and geographic locations.Contract Number: 21-37-82-19
The National JTPA Study: Title II-A Impacts on Earnings and Employment at 18Months–Abt Associates, Inc., 1992. Reports on findings from a large-scale study ofJTPA in which 20,000 applicants were randomly assigned to participant and controlgroups. Provides interim estimates of program impact on the employment and earningsof adults and out-of-school youth during the first 18 months after their acceptance intothe program.Contract Number: 99-6-0803-77-068-01NTIS Number: PB 94-142122

A Net Impact Analysis of Differential Earnings of CETA Participants and CurrentPopulation Survey Matched Comparison Groups–College of William and Mary,Department of Economics, 1982. Analyzes the pattern of earnings of CETAparticipants entering adult-oriented programs in FY 1976. Grant Number: 24-51-79-02
New Chance: Implementing a Comprehensive Program for Disadvantaged YoungMothers and Their Children–Manpower Demonstration Research Corp., 1991. Dealswith the early experiences of the 16 New Chance sites, factors associated with projectimplementation, and early results.Contract Number: 99-9-3356-98-003-02
New Forms of Activity for the Unemployed and Measures to Assist the Creationof Self-Employment; Experiences and Opportunities in CombattingUnemployment (Unemployment Insurance Occasional Paper 93-2)–U.S. Departmentof Labor, Unemployment Insurance Service, 1993. Presented at a meeting of theGeneral Assembly of the International Social Security Association, examines a varietyof programs in 16 countries that combat unemployment by encouraging unemployedworkers to become self-employed. Department of Labor PublicationNTIS Number: PB 94-145299
New Jersey Unemployment Insurance Reemployment Demonstration Project(Unemployment Insurance Occasional Paper 89-3)–New Jersey Department of Laborand Mathematica Policy Research, Inc., 1989. Details the results of a demonstrationthat provided three different packages of reemployment services to UI recipients toaccelerate their return to work.Cooperative Agreement Number: 99-2325-04-055-05NTIS Number: PB 90-216714/AS
The New Jersey Unemployment Insurance Reemployment Demonstration Project:Follow-Up Report (Unemployment Insurance Occasional Paper 91-1)–MathematicaPolicy Research, Inc., 1990. Summarizes the purpose and features of the New JerseyUnemployment Insurance Reemployment Demonstration, describes the impacts of theprogram on UI receipt and earnings, and presents a cost-benefit analysis of thedemonstration's components.Contract Number: P31948NTIS Number: PB 91-160838
The New Jersey Unemployment Insurance Reemployment Demonstration ProjectSix-Year Follow-up and Summary Report–(Unemployment Insurance OccasionalPaper 95-2)–Mathematica Policy Research, Inc., 1995. A second followup study of theNew Jersey Unemployment Insurance Reemployment Demonstration Project coveringa six-year period. The project was designed to examine whether the UI system couldbe used to identify displaced workers early enough in their unemployment spells and

provide them with alternative, early intervention services to accelerate their return towork.Contract Number: P39803NTIS Number: PB95-225785
On the Use of Expectations Data in Micro Surveys: The Case of Retirement–TheOhio State University, 1985. Tests the accuracy of a retirement prediction model ascompared with workers' self-prediction of age of retirement.Contract Number: 82-39-72-21NTIS Number: PB 85-235497/AS
Operating Effective Reemployment Strategies for Dislocated Workers–CSRIncorporated, 1986. Addresses the question of what training and employmentinterventions work best for dislocated workers.Contract Number: 99-5-2224-61-019-01
Papers and Materials Presented at the Unemployment Insurance Expert SystemColloquium, June 1991 (Unemployment Insurance Occasional Paper 92-5)–U.S.Department of Labor, Unemployment Insurance Service, 1992. Presents papersprepared for the Unemployment Insurance Expert System Colloquium in June 1991which describe demonstration efforts to test and evaluate expert system software toenhance UI services.NTIS Number: PB 93-202695
Pathways to the Future, Volume 6: A Report on the National Longitudinal Surveysof Labor Market Experience of Youth in 1984–The Ohio State University, 1986. Describes youth training and employment experiences with the ComprehensiveEmployment and Training Act programs and explores the effects of education andtraining on earnings.Contract Number: 82-39-72-21NTIS Number: PB 86-198918/AS
Pennsylvania Reemployment Bonus Demonstration Final Report (UnemploymentInsurance Occasional Paper 92-1)–Mathematica Policy Research, Inc., 1991. Analyzesvarious aspects of the Pennsylvania Reemployment Bonus Demonstration which testedthe effect of alternative reemployment bonuses on the reemployment andunemployment receipts of UI claimants.Contract Number: 99-7-0805-04-137-01NTIS Number: PB 93-152684
Policy Evaluation and Review of the Targeted Jobs Tax Credit–TvT Associates,1991. Based on a review and synthesis of Targeted Jobs Tax Credit literature availableas of mid-1991, presents information about the goals of TJTC from various viewpoints;assesses the appropriateness of TJTC as a means of accomplishing identified goals;reviews what is known about the benefits of TJTC; outlines which groups benefit themost and the least from TJTC; reviews the administration of the program; and

examines the costs of the program.Contract Number: 99-0-3588-75-027-01
The Potential Role of Volunteerism in JTPA–The Urban Institute, 1989. Reviewsliterature and presents information from informal interviews with individuals representingnational agencies, associations, and selected JTPA Service Delivery Areas to provideinsight into the most promising areas for volunteer involvement in JTPA and methodsfor and sources of recruitment of volunteers.Contract Number: 99-9-0421-75-081-01NTIS Number: PB 91-212365
Practical Guidance for Strengthening Private Industry Councils–CSR, Inc., 1990. Reviews the elements which make an effective Private Industry Council and strategiesused by effective PICs in relating their JTPA programs to other organizations andsegments of their communities.Contract Number: 99-8-2224-75-078-01NTIS Number: PB 91-219535/AS
Productive America–The National Council for Occupational Education, 1990. Focuses on two-year colleges and the role they play in improving workforce productivityand increasing national economic vitality. Examines potential problems of specialpopulations of the future workforce and proposes models for defining workforce needsof employers and for improving two-year college education delivery systems to meetemployer needs.Grant Number: 99-9-3513-75-013-02NTIS Number: PB 90-226648/AS
Productivity Effects of Worker Participation in Decision-Making and Profits:Statistical Estimation from the Example of Worker-Owned Firms in PlywoodManufacturing–University of Idaho, 1984. Compares productivity of employee–ownedand managed plywood plants with similar plants having traditional ownership andmanagement.Contract Number: 21-16-80-28NTIS Number: PB 86-144797/AS
A Profile of JTPA Enrollments–Westat, Inc., 1989. Presents information from thelongitudinal interview component of the Job Training Quarterly Survey to describecharacteristics of persons served by JTPA and to compare these individuals withsubgroups of participants, with persons served by earlier programs, and with thepopulation eligible for JTPA.Contract Number: 99-6-0584-75-083-01
Profiling the Literacy Proficiencies of JTPA and ES/UI Populations–TheEducational Testing Service, 1992. Captures detailed information on individuals inJTPA and ES/UI programs and measures literacy skills in three areas: prosecomprehension, document literacy, and quantitative skills.

Contract Number: 99-8-3458-75-052-01NTIS Number: PB 93-169209
Referral of Long-Term Unemployment Insurance (UI) Claimants to ReemploymentServices (Unemployment Insurance Occasional Paper 89-2)–Macro Systems, Inc.,1989. Addresses the feasibility of identifying and targeting services to long-term UIclaimants who need reemployment services and have reached the later stages of theirUI benefit period.Contract Number: 99-6-0576-04-096-01NTIS Number: PB 89-153100/AS
Reemployment Services to Unemployed Workers Having Difficulty BecomingReemployed (Unemployment Insurance Occasional Paper 90-2)–U.S. Department ofLabor, Employment and Training Administration, 1990. Compiles information aboutState programs that utilize the unemployment insurance system to providereemployment services or benefits to unemployed workers having difficulty becomingreemployed.NTIS Number: PB 91-106849
A Report Card on Special Education: International Center for the Disabled SurveyIII–Louis Harris and Associates for the International Center for the Disabled, 1989. Presents results of a survey of public school educators, handicapped students, andparents of handicapped students designed to determine how well the Nation's specialeducation system serves the needs of handicapped students. Grant Number: 99-7-3396-98-021-02
Report on Benefits to Employers Providing On–Site Child Care Centers, FlexibleSpending Accounts for Dependent Child Care Costs or Child Care Resource andReferral Services –State of Wisconsin, 1989. Contains selected data related toWisconsin’s Response to Families and Work report.Contract Number: 99-8-3482-75-086-01NTIS Number: PB 90-218728
Report on Policy Academy on Families and Children At Risk–Council of Governors'Policy Advisors, 1992. Describes the Family Academy and its purpose, reviews theresults of the efforts of Family Academy teams established in 10 States, discusseschallenges associated with collaborative, strategic policy development and how Statesmeet these challenges, and provides guidance to Governors in designing policies toimprove outcomes for people in health, education, training and employment, self-sufficiency, and family functioning.Contract Number: 99-9-3415-98-022-01NTIS Number: PB 92-226364
Review of Participant Characteristics and Program Outcomes for the First ElevenQuarters of JTPA Operation (October 1983-June 1986)–Westat, Inc., 1987. Identifiespatterns in JTPA Titles II-A and III program participation and outcomes over 11

quarters, starting with Transition Year 1984.Contract Number: 99-6-0584-75-083-01
San Diego Immigrant Training Demonstration Project (I.D.P.): Final EvaluationReport, 1992-1994–San Diego Consortium & Private Industry Council, 1995. Summarizes the findings of an evaluation of a two-year project that provided LatinAmerican immigrants in north San Diego County with training, employment, Englishlanguage instruction, and supportive services.
The St. Louis Metropolitan Reemployment Project: An Impact Evaluation–AbtAssociates, 1991. Estimates the net impacts of the St. Louis MetropolitanReemployment Project, a JTPA Title III program, on participants' subsequent earnings,receipt of unemployment insurance benefits, and reemployment. Describes differencesin the project's impacts based on the types of services received by programparticipants.Contract Number: 99-6-0803-77-074-01
SCANS Blueprint for Action: Building Community Coalitions–U.S. Department ofLabor, Employment and Training Administration, 1992. Provides more than 100examples of how recommendations of the Secretary's Commission on AchievingNecessary Skills are being implemented around the country.
School-to-Work Connections: Formulas For Success–U.S. Department of Labor,Employment and Training Administration, 1992. Offers guidelines on how to set upschool-employer partnerships based on how others have planned, organized, operated,promoted, and funded their programs.NTIS Number: PB 92-199231
The School-to-Work/Youth Apprenticeship Demonstration: PreliminaryFindings–Mathematica Policy Research, Inc., 1994. Assesses the initialimplementation of several school-to-work/youth apprenticeship programs funded by theDepartment of Labor.Contract Number: 99-1-0805-75-073-01NTIS Number: PB96-146204
The Secretary’s Seminars on Unemployment Insurance (Unemployment InsuranceOccasional Paper 89-1)–Mathematica Policy Research, Inc., 1989. Containsbackground documents and summaries of discussions at three Secretary's seminarsheld in 1988 which addressed the widening gap between total and insuredunemployment; the tradeoffs between the income maintenance and reemploymentgoals of the UI system as they pertain to choosing potential UI duration policies; andalternative uses of UI.Contract Numbers: 99-6-0805-04-097-01; 99-7-0805-04-138-01; and 99-7-3434-04-006-05NTIS Number: PB 90-216649/AS

Sectoral Change and Worker Displacement–National Bureau of Economic Research,1990. Provides a comprehensive view of worker displacement and its role in theevolution of unemployment patterns over the past 25 years.Contract Number: 99-8-4518-75-083-01NTIS Number: PB 90-21923/AS
Self-Employment as a Reemployment Option: Demonstration Results andNational Legislation–(Unemployment Insurance Occasional Paper 94-3)–AbtAssociates, 1994. Offers a comparative analysis summarizing the impacts of two UIself-employment demonstration projects in Washington State and Massachusettsbased on postproject followup surveys. Also includes national legislation authorizingself-employment assistance programs.Contract Number: 99-8-0803-98-047-01NTIS Number: PB94-188679
Self-Employment Programs: A New Reemployment Strategy, Final Report on theUI Self-Employment Demonstration–(Unemployment Insurance Occasional Paper95-4)–Abt Associates, Inc., 1994. Presents final impact estimates of two demonstrationprojects in Washington State and Massachusetts that helped UI recipients create theirown jobs by starting businesses. Contract Number: 99-8-0803-98-047-01NTIS Number: PB95-225777
Self-Employment Programs for Unemployed Workers (Unemployment InsuranceOccasional Paper 92-2)–U.S. Department of Labor, Employment and TrainingAdministration, 1992. Provides an overview of the self-employment option forunemployed workers who receive unemployment insurance payments, reviews two self-employment demonstration projects to test the feasibility of implementing self-employment programs for the unemployed, and analyzes policies related to self-employment. NTIS Number: PB 92-191626/AS
Serving Dislocated Farmers: An Evaluation of the EDWAA Farmers and RanchersDemonstration–Berkeley Planning Associates and Social Policy Research Associates,1994. Concludes the evaluation of the Farmers and Ranchers DemonstrationProject–authorized under the Economic Dislocation and Worker Adjustment Act–whichprovided training and employment services to dislocated and at-risk farmers andranchers.Contract Number: 99-1-3229-71-036-01NTIS Number: PB96-146139
Shifts in Income Segmentation by Education Level–Boston University, 1989. UsesCurrent Population Survey data for May 1973 and March 1987 to analyze the changinginequality of wage rates and of shifts in the education–income stratification of workers.Contract Number: 99-8-2152-75-081-01NTIS Number: PB 90-219221/AS

Short–Time Compensation: A Handbook of Basic Source Material –U.S.Department of Labor, Employment and Training Administration, 1987. Provides aready reference for persons interested in short–time compensation programs.NTIS Number: PB 88-163589
Skill Standards: A Primer–Institute for Educational Leadership, 1995. Provides anoverview of the “skill standards” concept (the common core of knowledge required forbroad-based occupational clusters). Also describes the history of the skill standardsmovement, discusses efforts to build a skill standards system, and provides detailsabout the characteristics of such a system.NTIS Number: PB96-146196
Skills and Tasks for Jobs: A SCANS Report for America 2000–U. S. Department ofLabor, Secretary's Commission on Achieving Necessary Skills, 1991. Serves as aresource for educators and employers to use in developing curriculum to teach theSCANS competencies and foundation skills and to understand how SCANS know–howis used in specific jobs.Government Printing Office Stock Number: 029-000-00433-1NTIS Number: PB 92-181379
Skills, Standards and Entry-Level Work–Public/Private Ventures, 1995. Provides anoverview of the skill standards movement and examines the role (and limitations) ofexisting school-to-work efforts in supporting the movement. Reviews research on thepotential of work experience to foster youth development.Contract Number: 99-0-1879-75-053-01NTIS Number: PB96-146162
Strengthening Programs for Youth: Promoting Adolescent Development in theJTPA System–Public/Private Ventures, 1993. Describes the findings of aninvestigation of methods for strengthening youth programs. Presents findings of apanel of experts on critical developmental areas in the lives of young people, providesan overview of four background research papers on various youth issues, anddescribes some exemplary youth programs.Contract Number: 99-0-1879-75-053-01
Study of the Implementation of the Economic Dislocation and Worker AdjustmentAssistance Act-Phase II: Responsiveness of Services–Social Policy ResearchAssociates, Berkeley Planning Associates, and SRI International, 1993. A followup to aPhase I study of how States and substate areas implemented the key features of theEconomic Dislocation and Worker Adjustment Assistance Act. Presents findings onhow EDWAA programs operated at the State, substate, and service provider levelsduring PY 1990.Contract Number: 99-9-3104-98-084-01
Study of the Implementation of the Economic Dislocation and Worker AdjustmentAssistance Act-Report on the Survey of Substate Areas–Social Policy Research

Associates and SRI International, 1993. Presents findings of a survey of substateareas conducted as part of a study of EDWAA. Provides information about howEDWAA programs are organized, the types of dislocated workers served, the servicesprovided to participants, and the outcomes achieved by EDWAA participants.Contract Number: 99-9-3104-98-084-1
Study of Federal Funding Sources and Services for Adult Education: FinalReport–COSMOS Corporation, 1992. Synthesizes information about adult educationprograms within the Federal Government that support literacy, basic skills,English–as–a–second language, or adult secondary education. Providesrecommendations regarding Federal, State, and local level program coordination.Contract Number: LC 89-058001 (U.S. Department of Education)
Study of the Implementation of the Economic Dislocation and Worker AdjustmentAssistance Act–SRI International, 1992. Examines the design and operations of theEDWAA program at the State and substate levels during PY 1989, the year in which theEDWAA legislation was implemented. Provides program information andrecommendations to help program operators run more effective programs.Contract Number: 99-9-3104-98-084 Study of Selected Aspects of Dislocated Worker Programs: Final Report–CSRIncorporated, 1986. Summarizes the principal findings from 15 case studies of JTPATitle III projects.Contract Number: 99-5-2224-61-019-01
Study of State Management of the Job Training Partnership Act–NationalGovernors' Association, 1988. Examines how States have used the policy andmanagement tools available under JTPA to exert influence on the delivery ofemployment and training services throughout the Nation. The study focuses on Title II-A programs and the Wagner-Peyser 10 percent set-aside.Grant Number: 99-6-2189-77-064-01
A Study of Unemployment Insurance Recipients and Exhaustees: Findings from aNational Survey (Unemployment Insurance Occasional Paper 90-3)–MathematicaPolicy Research, Inc., 1990. Examines the characteristics and behavior of UIexhaustees and nonexhaustees and explores the implications of this examination forpolicy formulation.Contract Number: 99-8-0805-75-071-01NTIS Number: PB 91-129247
Summary of the JTLS Data for JTPA Title II-A Enrollments and TerminationsDuring Program Year 1984–Westat, Inc., 1985. Summarizes the characteristics andexperiences of persons who participated in training programs authorized under Title II-Aof JTPA. Data were obtained from the Job Training Longitudinal Survey (JTLS).Contract Number: 99-3-0584-77-137

Summary of the JTLS Data for JTPA Title II-A and III Enrollments andTerminations During Program Year 1985–Westat, Inc., 1986. Summarizes thecharacteristics and experiences of persons who participated in training programsauthorized under Title II-A and Title III of JTPA. Data were obtained from the JTLS.Contract Number: 99-6-0584-75-083-01
Summary of the JTQS Data for JTPA Title II-A and III Enrollments andTerminations During PY 1986–Westat, Inc., 1987. Summarizes the characteristicsand experiences of persons who participated in training programs authorized underTitle II-A and Title III of JTPA. Data were obtained from the Job Training QuarterlySurvey (JTQS), formerly the JTLS.Contract Number: 99-6-0584-75-083-01
Summary of the JTQS Data for JTPA Title II-A and III Enrollments andTerminations During PY 1987–Westat, Inc., 1988. Summarizes the characteristicsand experiences of persons who participated in training programs authorized underTitle II-A and Title III of JTPA during PY 1987. Data were obtained from the JTQS.Contract Number: 99-6-0584-75-083-01
Summary of Net Impact Results–Westat, Inc., 1984. Summarizes the research doneby Westat on the estimation of the net impact of CETA on the postprogram earnings ofparticipants.Contract Number: 23-24-75-07
Summer Training and Education Program (STEP): Report on the 1986Experience–Public/Private Ventures, 1987. Describes the results of the STEPProgram in five demonstration cities in 1986.Grant Number: 99-6-3372-75-004-02
The Temporary Help Supply Industry in the U.S.A.–Jewish Employment andVocational Service, 1989. Focuses on the changing programs and policies in thetemporary help supply industry. Considers occupational trends, pay and benefits,recruiting and retention,and industry's ability to provide employment for several targetedgroups.Contract Number: 99-8-3146-75-072-01NTIS Number: PB 90-218694
Training Partnerships: Linking Employers & Providers–American Society forTraining and Development, 1989. Summarizes research conducted by the AmericanSociety for Training and Development about partnerships in training and provides anoverview of various aspects of training published in four reports.Grant Number: 99-6-0705-75-079-02
UI Research Exchange (Unemployment Insurance Occasional Paper 88-2)–U.S.Department of Labor, Employment and Training Administration, 1988. Contains avariety of UI research information, including summaries of projects planned, in
progress, and completed; financial and legislative developments; a paper on qualitycontrol; and a paper which provides an analysis of benefit payments for positive andnegative balance employers, by industry, for Fiscal Years 1983 and 1986.NTIS Number: PB 89-160030/AS
UI Research Exchange (Unemployment Insurance Occasional Paper 89-4)–U.S.Department of Labor, Employment and Training Administration, 1989. Contains avariety of UI research information, including three papers on developing andimplementing a form of advanced computer software, called expert systems, in a UIoperating environment; the probability that a State unemployment reserve fund willremain solvent; and the work search error claimant profile.NTIS Number: PB 90-11425/AS
UI Research Exchange (Unemployment Insurance Occasional Paper 90-4)–U.S.Department of Labor, Employment and Training Administration, 1990. Includesannouncements and reports on seminars, UI personnel, legislative and financialdevelopments, and descriptions of research projects conducted by State agencies andthe UI Service.
UI Research Exchange (Unemployment Insurance Occasional Paper 92-4)–U.S.Department of Labor, Employment and Training Administration, 1992. Contains eightpapers on a variety of UI-related topics. Also presents summaries of planned and in-progress research projects; brief descriptions of seminars, meetings and significantactivities; research data and information sources; and financial and legislationdevelopments. Includes a listing of personnel involved in UI research in StateEmployment Security Agencies, a national and regional UI directory, and a listing of UIOccasional Papers published since 1977.NTIS Number: PB 93-117968
Unemployment Insurance and Employer Layoffs (Unemployment InsuranceOccasional Paper 93-1)–Arizona State University, 1992. Presents findings of the firstmicro data set which used detailed information from matched firm-worker records toanalyze the behavior of firms regarding decisions to lay off workers.NTIS Number: PB 93-205573
The Washington Reemployment Bonus Experiment Final Report (UnemploymentInsurance Occasional Paper 92-6)–W.E. Upjohn Institute for Employment Research,1992. Analyzes various aspects of the Washington Reemployment Bonus Experiment,which tested the effect of alternative reemployment bonuses on the reemployment andunemployment receipt of UI claimants.NTIS Number: PB 93-159499
What Work Requires of Schools–Secretary's Commission on Achieving NecessarySkills, U.S. Department of Labor, Employment and Training Administration, 1991. Setsforth the foundation skills and competencies that high-performance workplaces requireand that high-performance schools should produce.

Government Printing Office Stock Number: 029-000-0433-1
What Works for Dislocated Workers: Final Report–Sociometrics, Inc., 1991. Describes 10 quality JTPA Title III projects considered exemplary based on tailoredtraining, early intervention/voluntary advance notification, labor managementcooperation, linkages to trade adjustment assistance and unemployment insurance,and services for female dislocated workers.Contract Number: 99-8-4690-75-058-01
Wisconsin’s Response to Families and Work–State of Wisconsin, 1989. Includes acomparison of three types of child care benefits used in the State of Wisconsin. Theseinclude child care centers linked with employer establishments; an employee benefitenabling pretax dollars to be used to purchase child care services; and a child careresource and referral service. Authors describe each model and assess results.Contract Number: 99-8-3482-75-086-01NTIS Number: PB 90-218728
Women’s Relative Pay: The Factors That Shape Current and Future Trends–TheUrban Institute, 1989. Identifies factors that contribute to the improvement in women'spay relative to that of men in the 1980s; analyzes the potential of high-wage, high-growth jobs for increasing women's relative pay; and provides an analysis of theinfluence of women's intermittent labor force participation as it relates to relative pay.Contract Number: 99-8-0421-75-066-01NTIS Number: PB 90-218710/AS
Women’s Work, Men’s Work: Sex Segregation on the Job–National Academy ofSciences, 1986. Describes wage differentials and occupational segregation of men andwomen and looks into causes and possible short- and long-range solutions.Interagency AgreementNational Academy Press Publication
Work Search Among Unemployment Insurance Claimants: An Investigation ofSome Effects of State Rules and Enforcement (Unemployment InsuranceOccasional Paper 88-1)–Mathematica Policy Research, Inc., 1988. Looks at the effectsof work–search rules on the work-search behavior of UI claimants, their job–findingsuccess, and payment error rates.Contract Number: J-9-M-5-0052NTIS Number: PB 89-160022/AS
"Worker Displacement in a Period of Rapid Job Expansion: 1983–1987" –U.S.Department of Labor, Bureau of Labor Statistics, Monthly Labor Review, May 1990. Presents findings of a survey of displaced workers which was conducted by the Bureauof the Census. Notes that since the mid-1980s, fewer workers were displaced fromtheir jobs and the reemployment rate among them was higher.
The Worker Profiling and Reemployment Services System: Legislation,

Implementation Process and Research Findings–(Unemployment InsuranceOccasional Paper 94-4)–U.S. Department of Labor, Employment and TrainingAdministration, 1995. Contains Federal legislative language on “profiling” (using a setof criteria that can help identify UI claimants who are likely to exhaust their benefitsbefore they find a new job); a variety of public releases by the Department to interpretthe legislation and provide technical assistance to the States in their implementation ofthe legislative provisions; and research relating to worker profiling and the provision ofreemployment services.NTIS Number: PB95-172730
Workforce Quality: Perspectives from the U.S. and Japan–U.S. Department ofLabor, Employment and Training Administration, 1990. Summarizes proceedings of amajor symposium of Japanese and American officials. Examines successful Japanesepractices used to prepare workers for a technologically advanced workplace anddiscusses ways to apply these practices in the United States.NTIS Number: PB 92-146539
Workforce 2000: Work and Workers for the Twenty-First Century–Hudson Institute,1987. Identifies key trends that will characterize the remainder of the 20th century,changes in the composition of the workforce and of jobs, and the major policychallenges ahead. Grant Number: 99-6-3370-75-002-02
Workplace Basics: The Skills Employers Want–American Society for Training andDevelopment, 1988. Describes six basic skill groups, in addition to reading, writing, andcomputation, which employers look for in successful workers.Grant Number: 99-6-0705-079-02NTIS Number: PB 92-116276
Workplace Literacy and the Nation’s Unemployed Workers–U.S. Department ofLabor, Office of Strategic Planning and Policy Development, 1993. Offers findings froman analysis of the effects of workplace literacy on the labor market performance ofunemployed workers who were studied in the Department's Workplace Literacy Surveyin 1990 and identifies the determinants of workplace literacy.NTIS Number: PB 94-150513
Table A-1. Employment status of the civilian noninstitutional population 16 years and over, 1960-95 annual averages
(Numbers in thousands)
Civilian Labor Force
Employed Unemployed
Year Civiliannoninsti-
tutionalpopulation
Number Per-cent of
Pop-ulation
Total Agri-culture
Nonagri-cultural
industries
Number Percentof
LaborForce
Not in
Labor Force
1960a 117,245 69,628 59.4 65,778 5,458 60,318 3,852 5.5 47,617
1961 118,771 70,459 59.3 65,746 5,200 60,546 4,714 6.7 48,312
1962a 120,153 70,614 58.8 66,702 4,944 61,759 3,911 5.5 49,539
1963 122,416 71,833 58.7 67,762 4,687 63,076 4,070 5.7 50,583
1964 124,485 73,091 58.7 69,305 4,523 64,782 3,786 5.2 51,394
1965 126,513 74,455 58.9 71,088 4,361 66,726 3,366 4.5 52,058
1966 128,058 75,770 59.2 72,895 3,979 68,915 2,875 3.8 52,288
1967 129,874 77,347 59.6 74,372 3,844 70,527 2,975 3.8 52,527
1968 132,028 78,737 59.6 75,920 3,817 72,103 2,817 3.6 53,291
1969 134,335 80,734 60.1 77,902 3,606 74,296 2,832 3.5 53,602
1970 137,085 82,771 60.4 78,678 3,463 75,215 4,093 4.9 54,315
1971 140,216 84,382 60.2 79,367 3,394 75,972 5,016 5.9 55,834
1972a 144,126 87,034 60.4 82,153 3,484 78,669 4,882 5.6 57,091
1973a 147,096 89,429 60.8 85,064 3,470 81,594 4,365 4.9 57,667
1974 150,120 91,949 61.3 86,794 3,515 83,279 5,156 5.6 58,171
1975 153,153 93,775 61.2 85,846 3,408 82,438 7,929 8.5 59,377
1976 156,150 96,158 61.6 88,752 3,331 85,421 7,406 7.7 59,991
1977 159,033 99,009 62.3 92,017 3,283 88,734 6,991 7.1 60,025
1978a 161,910 102,251 63.2 96,048 3,387 92,661 6,202 6.1 59,659
1979 164,863 104,962 63.7 98,824 3,347 95,477 6,137 5.8 59,900
1980 167,745 106,940 63.8 99,303 3,364 95,938 7,637 7.1 60,806
1981 170,130 108,670 63.9 100,397 3,368 97,030 8,273 7.6 61,460
1982 172,271 110,204 64.0 99,526 3,401 96,125 10,678 9.7 62,067
1983 174,215 111,550 64.0 100,834 3,383 97,450 10,717 9.6 62,665
1984 176,383 113,544 64.4 105,005 3,321 101,685 8,539 7.5 62,839
1985 178,206 115,461 64.8 107,150 3,179 103,971 8,312 7.2 62,744
1986a 180,587 117,834 65.3 109,597 3,163 106,434 8,237 7.0 62,752
1987 182,753 119,865 65.6 112,440 3,208 109,232 7,425 6.2 62,888
1988 184,613 121,669 65.9 114,968 3,169 111,800 6,701 5.5 62,944
1989 186,393 123,869 66.5 117,342 3,199 114,142 6,528 5.3 62,523
1990b 189,164 125,840 66.5 118,793 3,223 115,570 7,047 5.6 63,324
1991 190,925 126,346 66.2 117,718 3,269 114,449 8,628 6.8 64,578
1992 192,805 128,105 66.4 118,492 3,247 115,245 9,613 7.5 64,700
1993 194,838 129,200 66.3 120,259 3,115 117,144 8,940 6.9 65,638
1994 196,814 131,056 66.6 123,060 3,409 119,651 7,996 6.1 65,758
1995 198,584 132,304 66.6 124,900 3,440 121,460 7,404 5.6 66,280
____________________________________________________________________________________________________________
aNot strictly comparable with data for prior years. For an explanation, see the section "Noncomparability of Labor Force Levels" inthe note on "Historical Comparability" at the beginning of this Appendix.
bData for 1990 are not directly comparable with data for 1989 and earlier years because of the introduction of a major redesign of theCurrent Population Survey (household survey) questionnaire and collection methodology. Beginning with 1990, data incorporate1990 census-based population controls, adjusted for the estimated undercount. For additional information, see "Revisions in theCurrent Population Survey Effective January 1994" and "Revisions in Household Survey Data Effective February 1996" in theFebruary 1994 and March 1996 issues, respectively, of Employment and Earnings.
Source: U.S. Department of Labor, Bureau of Labor Statistics.
Table A-2. Employment status of the civilian noninstitutional population 16 years and over by sex, 1981-95 annual averages
(Numbers in thousands)
Civilian Labor Force
Employed Unemployed
Year Civiliannoninsti-
tutionalpopulation
Number Per-cent of
Pop-ulation
Total Agri-culture
Nonagri-cultural
industries
Number Percentof
LaborForce
Not in
Labor Force
Men
1981 80,511 61,974 77.0 57,397 71.3 2,700 54,697 4,577 7.4 18,537
1982 81,523 62,450 76.6 56,271 69.0 2,736 53,534 6,179 9.9 19,073
1983 82,531 63,047 76.4 56,787 68.8 2,704 54,083 6,260 9.9 19,484
1984 83,605 63,835 76.4 59,091 70.7 2,668 56,423 4,744 7.4 19,771
1985 84,469 64,411 76.3 59,891 70.9 2,535 57,356 4,521 7.0 20,058
1986a 85,798 65,422 76.3 60,892 71.0 2,511 58,381 4,530 6.9 20,376
1987 86,899 66,207 76.2 62,107 71.5 2,543 59,564 4,101 6.2 20,692
1988 87,857 66,927 76.2 63,273 72.0 2,493 60,780 3,655 5.5 20,930
1989 88,762 67,840 76.4 64,315 72.5 2,513 61,802 3,525 5.2 20,923
1990b 90,377 69,011 76.4 65,104 72.0 2,546 62,559 3,906 5.7 21,367
1991 91,278 69,168 75.8 64,223 70.4 2,589 61,634 4,946 7.2 22,110
1992 92,270 69,964 75.8 64,440 69.8 2,575 61,866 5,523 7.9 22,306
1993 93,332 70,404 75.4 65,349 70.0 2,478 62,871 5,055 7.2 22,927
1994 94,355 70,817 75.1 66,450 70.4 2,554 63,896 4,367 6.2 23,538
1995 95,178 71,360 75.0 67,377 70.8 2,559 64,818 3,983 5.6 23,818
Women
1981 89,618 46,696 52.1 43,000 48.0 667 42,333 3,696 7.9 42,922
1982 90,748 47,755 52.6 43,256 47.7 665 42,591 4,499 9.4 42,993
1983 91,684 48,503 52.9 44,047 48.0 680 43,367 4,457 9.2 43,181
1984 92,778 49,709 53.6 45,915 49.5 653 45,262 3,794 7.6 43,068
1985 93,736 51,050 54.5 47,259 50.4 644 46,615 3,791 7.4 42,686
1986a 94,789 52,413 55.3 48,706 51.4 652 48,054 3,707 7.1 42,376
1987 95,853 53,658 56.0 50,334 52.5 666 49,668 3,324 6.2 42,195
1988 96,756 54,742 56.6 51,696 53.4 676 51,020 3,046 5.6 42,014
1989 97,630 56,030 57.4 53,027 54.3 687 52,341 3,003 5.4 41,601
1990b 98,787 56,829 57.5 53,689 54.3 678 53,011 3,140 5.5 41,957
1991 99,646 57,178 57.4 53,496 53.7 680 52,815 3,683 6.4 42,468
1992 100,535 58,141 57.8 54,052 53.8 672 53,380 4,090 7.0 42,394
1993 101,506 58,795 57.9 54,910 54.1 637 54,273 3,885 6.6 42,711
1994 102,460 60,239 58.8 56,610 55.3 855 55,755 3,629 6.0 42,221
1995 103,406 60,944 58.9 57,523 55.6 881 56,642 3,421 5.6 42,462
____________________________________________________________________________________________________________
aNot strictly comparable with data for prior years. For an explanation, see note on "Historical Comparability" at the beginning of thisAppendix.
bData for 1990 are not directly comparable with data for 1989 and earlier years because of the introduction of a major redesign of theCurrent Population Survey (household survey) questionnaire and collection methodology. Beginning with 1990, data incorporate
1990 census-based population controls, adjusted for the estimated undercount. For additional information, see "Revisions in theCurrent Population Survey Effective January 1994" and "Revisions in Household Survey Data Effective February 1996" in the
February 1994 and March 1996 issues, respectively, of Employment and Earnings.
Source: U.S. Department of Labor, Bureau of Labor Statistics.
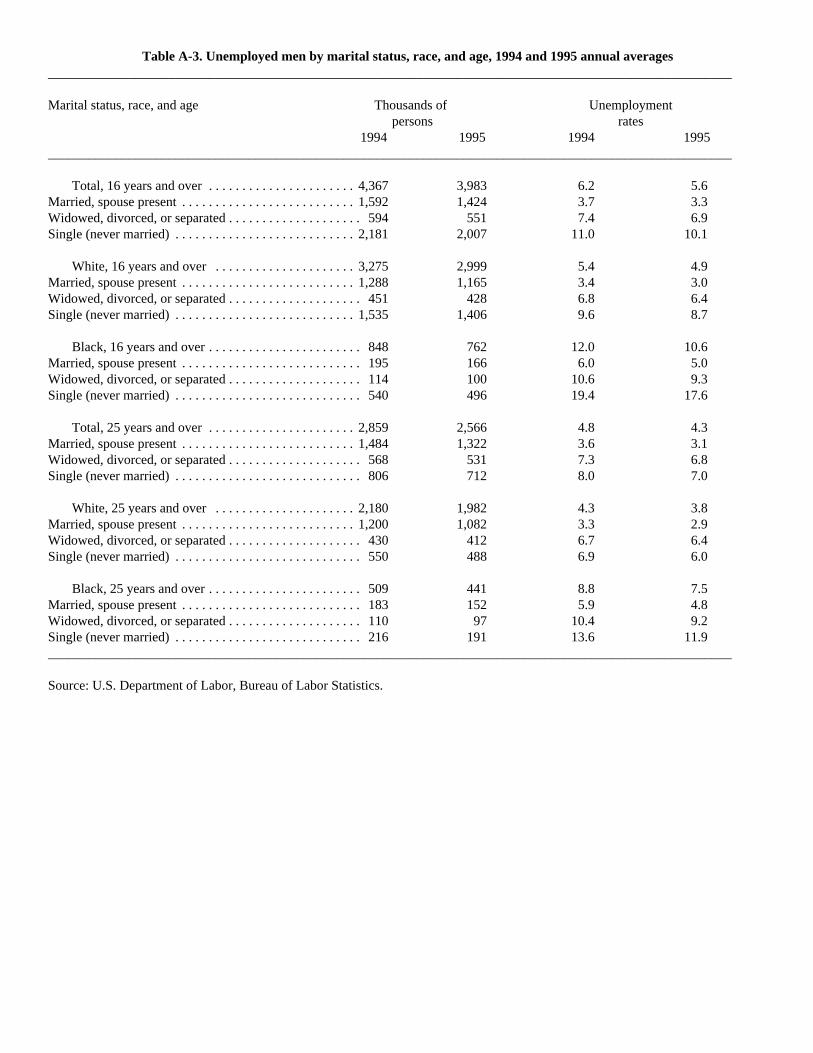
Table A-3. Unemployed men by marital status, race, and age, 1994 and 1995 annual averages______________________________________________________________________________________________________
Marital status, race, and age Thousands of Unemploymentpersons rates
1994 1995 1994 1995______________________________________________________________________________________________________
Total, 16 years and over . . . . . . . . . . . . . . . . . . . . . . 4,367 3,983 6.2 5.6Married, spouse present . . . . . . . . . . . . . . . . . . . . . . . . . . 1,592 1,424 3.7 3.3Widowed, divorced, or separated . . . . . . . . . . . . . . . . . . . . 594 551 7.4 6.9Single (never married) . . . . . . . . . . . . . . . . . . . . . . . . . . . 2,181 2,007 11.0 10.1
White, 16 years and over . . . . . . . . . . . . . . . . . . . . . 3,275 2,999 5.4 4.9Married, spouse present . . . . . . . . . . . . . . . . . . . . . . . . . . 1,288 1,165 3.4 3.0Widowed, divorced, or separated . . . . . . . . . . . . . . . . . . . . 451 428 6.8 6.4Single (never married) . . . . . . . . . . . . . . . . . . . . . . . . . . . 1,535 1,406 9.6 8.7
Black, 16 years and over . . . . . . . . . . . . . . . . . . . . . . . 848 762 12.0 10.6Married, spouse present . . . . . . . . . . . . . . . . . . . . . . . . . . . 195 166 6.0 5.0Widowed, divorced, or separated . . . . . . . . . . . . . . . . . . . . 114 100 10.6 9.3Single (never married) . . . . . . . . . . . . . . . . . . . . . . . . . . . . 540 496 19.4 17.6
Total, 25 years and over . . . . . . . . . . . . . . . . . . . . . . 2,859 2,566 4.8 4.3Married, spouse present . . . . . . . . . . . . . . . . . . . . . . . . . . 1,484 1,322 3.6 3.1Widowed, divorced, or separated . . . . . . . . . . . . . . . . . . . . 568 531 7.3 6.8Single (never married) . . . . . . . . . . . . . . . . . . . . . . . . . . . . 806 712 8.0 7.0
White, 25 years and over . . . . . . . . . . . . . . . . . . . . . 2,180 1,982 4.3 3.8Married, spouse present . . . . . . . . . . . . . . . . . . . . . . . . . . 1,200 1,082 3.3 2.9Widowed, divorced, or separated . . . . . . . . . . . . . . . . . . . . 430 412 6.7 6.4Single (never married) . . . . . . . . . . . . . . . . . . . . . . . . . . . . 550 488 6.9 6.0
Black, 25 years and over . . . . . . . . . . . . . . . . . . . . . . . 509 441 8.8 7.5Married, spouse present . . . . . . . . . . . . . . . . . . . . . . . . . . . 183 152 5.9 4.8Widowed, divorced, or separated . . . . . . . . . . . . . . . . . . . . 110 97 10.4 9.2Single (never married) . . . . . . . . . . . . . . . . . . . . . . . . . . . . 216 191 13.6 11.9______________________________________________________________________________________________________
Source: U.S. Department of Labor, Bureau of Labor Statistics.
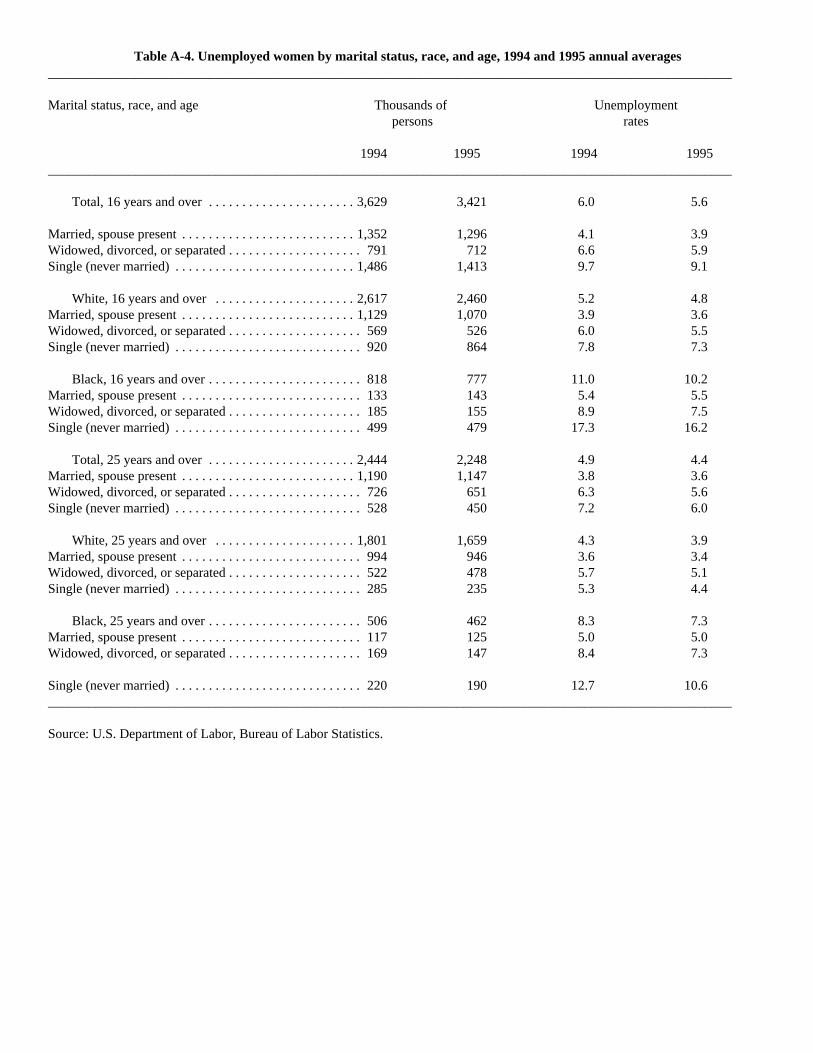
Table A-4. Unemployed women by marital status, race, and age, 1994 and 1995 annual averages______________________________________________________________________________________________________
Marital status, race, and age Thousands of Unemploymentpersons rates
1994 1995 1994 1995______________________________________________________________________________________________________
Total, 16 years and over . . . . . . . . . . . . . . . . . . . . . . 3,629 3,421 6.0 5.6
Married, spouse present . . . . . . . . . . . . . . . . . . . . . . . . . . 1,352 1,296 4.1 3.9Widowed, divorced, or separated . . . . . . . . . . . . . . . . . . . . 791 712 6.6 5.9Single (never married) . . . . . . . . . . . . . . . . . . . . . . . . . . . 1,486 1,413 9.7 9.1
White, 16 years and over . . . . . . . . . . . . . . . . . . . . . 2,617 2,460 5.2 4.8Married, spouse present . . . . . . . . . . . . . . . . . . . . . . . . . . 1,129 1,070 3.9 3.6Widowed, divorced, or separated . . . . . . . . . . . . . . . . . . . . 569 526 6.0 5.5Single (never married) . . . . . . . . . . . . . . . . . . . . . . . . . . . . 920 864 7.8 7.3
Black, 16 years and over . . . . . . . . . . . . . . . . . . . . . . . 818 777 11.0 10.2Married, spouse present . . . . . . . . . . . . . . . . . . . . . . . . . . . 133 143 5.4 5.5Widowed, divorced, or separated . . . . . . . . . . . . . . . . . . . . 185 155 8.9 7.5Single (never married) . . . . . . . . . . . . . . . . . . . . . . . . . . . . 499 479 17.3 16.2
Total, 25 years and over . . . . . . . . . . . . . . . . . . . . . . 2,444 2,248 4.9 4.4Married, spouse present . . . . . . . . . . . . . . . . . . . . . . . . . . 1,190 1,147 3.8 3.6Widowed, divorced, or separated . . . . . . . . . . . . . . . . . . . . 726 651 6.3 5.6Single (never married) . . . . . . . . . . . . . . . . . . . . . . . . . . . . 528 450 7.2 6.0
White, 25 years and over . . . . . . . . . . . . . . . . . . . . . 1,801 1,659 4.3 3.9Married, spouse present . . . . . . . . . . . . . . . . . . . . . . . . . . . 994 946 3.6 3.4Widowed, divorced, or separated . . . . . . . . . . . . . . . . . . . . 522 478 5.7 5.1Single (never married) . . . . . . . . . . . . . . . . . . . . . . . . . . . . 285 235 5.3 4.4
Black, 25 years and over . . . . . . . . . . . . . . . . . . . . . . . 506 462 8.3 7.3Married, spouse present . . . . . . . . . . . . . . . . . . . . . . . . . . . 117 125 5.0 5.0Widowed, divorced, or separated . . . . . . . . . . . . . . . . . . . . 169 147 8.4 7.3
Single (never married) . . . . . . . . . . . . . . . . . . . . . . . . . . . . 220 190 12.7 10.6______________________________________________________________________________________________________
Source: U.S. Department of Labor, Bureau of Labor Statistics.
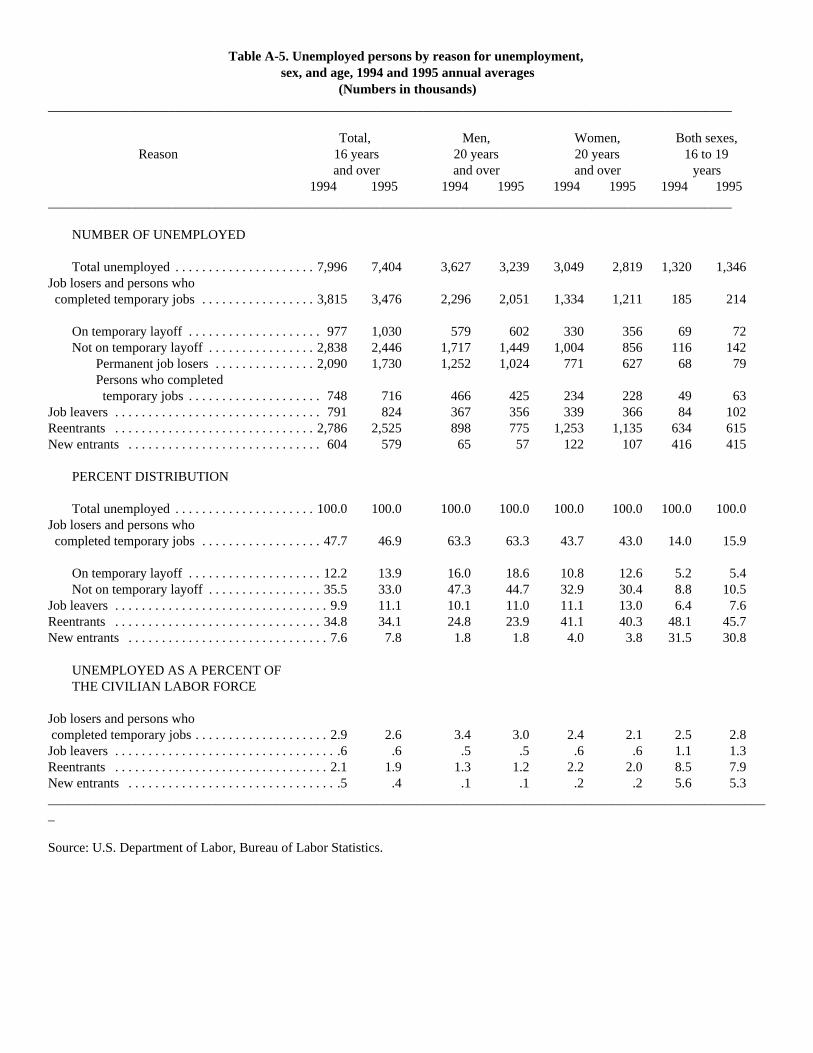
Table A-5. Unemployed persons by reason for unemployment, sex, and age, 1994 and 1995 annual averages
(Numbers in thousands)______________________________________________________________________________________________________
Total, Men, Women, Both sexes, Reason 16 years 20 years 20 years 16 to 19
and over and over and over years1994 1995 1994 1995 1994 1995 1994 1995
______________________________________________________________________________________________________
NUMBER OF UNEMPLOYED
Total unemployed . . . . . . . . . . . . . . . . . . . . . 7,996 7,404 3,627 3,239 3,049 2,819 1,320 1,346Job losers and persons who completed temporary jobs . . . . . . . . . . . . . . . . . 3,815 3,476 2,296 2,051 1,334 1,211 185 214
On temporary layoff . . . . . . . . . . . . . . . . . . . . 977 1,030 579 602 330 356 69 72Not on temporary layoff . . . . . . . . . . . . . . . . 2,838 2,446 1,717 1,449 1,004 856 116 142
Permanent job losers . . . . . . . . . . . . . . . 2,090 1,730 1,252 1,024 771 627 68 79Persons who completed temporary jobs . . . . . . . . . . . . . . . . . . . . 748 716 466 425 234 228 49 63
Job leavers . . . . . . . . . . . . . . . . . . . . . . . . . . . . . . . 791 824 367 356 339 366 84 102Reentrants . . . . . . . . . . . . . . . . . . . . . . . . . . . . . . 2,786 2,525 898 775 1,253 1,135 634 615New entrants . . . . . . . . . . . . . . . . . . . . . . . . . . . . . 604 579 65 57 122 107 416 415
PERCENT DISTRIBUTION
Total unemployed . . . . . . . . . . . . . . . . . . . . . 100.0 100.0 100.0 100.0 100.0 100.0 100.0 100.0Job losers and persons who completed temporary jobs . . . . . . . . . . . . . . . . . . 47.7 46.9 63.3 63.3 43.7 43.0 14.0 15.9
On temporary layoff . . . . . . . . . . . . . . . . . . . . 12.2 13.9 16.0 18.6 10.8 12.6 5.2 5.4Not on temporary layoff . . . . . . . . . . . . . . . . . 35.5 33.0 47.3 44.7 32.9 30.4 8.8 10.5
Job leavers . . . . . . . . . . . . . . . . . . . . . . . . . . . . . . . . 9.9 11.1 10.1 11.0 11.1 13.0 6.4 7.6Reentrants . . . . . . . . . . . . . . . . . . . . . . . . . . . . . . . 34.8 34.1 24.8 23.9 41.1 40.3 48.1 45.7New entrants . . . . . . . . . . . . . . . . . . . . . . . . . . . . . . 7.6 7.8 1.8 1.8 4.0 3.8 31.5 30.8
UNEMPLOYED AS A PERCENT OFTHE CIVILIAN LABOR FORCE
Job losers and persons who completed temporary jobs . . . . . . . . . . . . . . . . . . . . 2.9 2.6 3.4 3.0 2.4 2.1 2.5 2.8Job leavers . . . . . . . . . . . . . . . . . . . . . . . . . . . . . . . . . .6 .6 .5 .5 .6 .6 1.1 1.3Reentrants . . . . . . . . . . . . . . . . . . . . . . . . . . . . . . . . 2.1 1.9 1.3 1.2 2.2 2.0 8.5 7.9New entrants . . . . . . . . . . . . . . . . . . . . . . . . . . . . . . . .5 .4 .1 .1 .2 .2 5.6 5.3____________________________________________________________________________________________________________
Source: U.S. Department of Labor, Bureau of Labor Statistics.

Table A-6. Unemployed persons by reason for unemployment, race, and Hispanic origin, 1994 and 1995 annual averages
(Numbers in thousands)______________________________________________________________________________________________________
Reason for Total White Black Hispanic unemployment origin
1994 1995 1994 1995 1994 1995 1994 1995______________________________________________________________________________________________________
NUMBER OF UNEMPLOYED
Total, 16 years and over . . . . . . . . . . . . . . . . 7,996 7,404 5,892 5,459 1,666 1,538 1,187 1,140
Job losers and persons who completed temporary jobs . . . . . . . . . . . . . . . . . 3,815 3,476 2,972 2,710 651 584 573 559
On temporary layoff . . . . . . . . . . . . . . . . . . . . 977 1,030 800 856 134 117 139 163Not on temporary layoff . . . . . . . . . . . . . . . . 2,838 2,446 2,172 1,854 516 467 434 397
Permanent job losers . . . . . . . . . . . . . . . 2,090 1,730 1,625 1,352 354 290 310 271Persons who completed temporary jobs . . . . . . . . . . . . . . . . . . . . 748 716 547 502 162 177 123 126
Job leavers . . . . . . . . . . . . . . . . . . . . . . . . . . . . . . . 791 824 638 660 116 123 89 90Reentrants . . . . . . . . . . . . . . . . . . . . . . . . . . . . . . 2,786 2,525 1,898 1,728 729 657 402 369New entrants . . . . . . . . . . . . . . . . . . . . . . . . . . . . . 604 579 385 361 172 174 124 122
PERCENT DISTRIBUTION
Total unemployed . . . . . . . . . . . . . . . . . . . . . 100.0 100.0 100.0 100.0 100.0 100.0 100.0 100.0Job losers and persons who completed temporary jobs . . . . . . . . . . . . . . . . . . 47.7 46.9 50.4 49.6 39.0 38.0 48.2 49.1
On temporary layoff . . . . . . . . . . . . . . . . . . . . 12.2 13.9 13.6 15.7 8.1 7.6 11.7 14.3
Not on temporary layoff . . . . . . . . . . . . . . . . . 35.5 33.0 36.9 34.0 31.0 30.4 36.5 34.8
Job leavers . . . . . . . . . . . . . . . . . . . . . . . . . . . . . . . . 9.9 11.1 10.8 12.1 6.9 8.0 7.5 7.9Reentrants . . . . . . . . . . . . . . . . . . . . . . . . . . . . . . . 34.8 34.1 32.2 31.7 43.7 42.7 33.8 32.4New entrants . . . . . . . . . . . . . . . . . . . . . . . . . . . . . . 7.6 7.8 6.5 6.6 10.3 11.3 10.5 10.7
UNEMPLOYED AS A PERCENT OFTHE CIVILIAN LABOR FORCE
Job losers and persons who completed temporary jobs . . . . . . . . . . . . . . . . . . . 2.9 2.6 2.7 2.4 4.5 3.9 4.8 4.6Job leavers . . . . . . . . . . . . . . . . . . . . . . . . . . . . . . . . . .6 .6 .6 .6 .8 .8 .7 .7Reentrants . . . . . . . . . . . . . . . . . . . . . . . . . . . . . . . . 2.1 1.9 1.7 1.5 5.0 4.4 3.4 3.0New entrants . . . . . . . . . . . . . . . . . . . . . . . . . . . . . . . .5 .4 .3 .3 1.2 1.2 1.0 1.0
______________________________________________________________________________________________________
Note: Detail for the above race and Hispanic-origin groups will not sum to totals because data for the "other races" group are notpresented and Hispanics are included in both the white and black population groups.
Source: U.S. Department of Labor, Bureau of Labor Statistics.
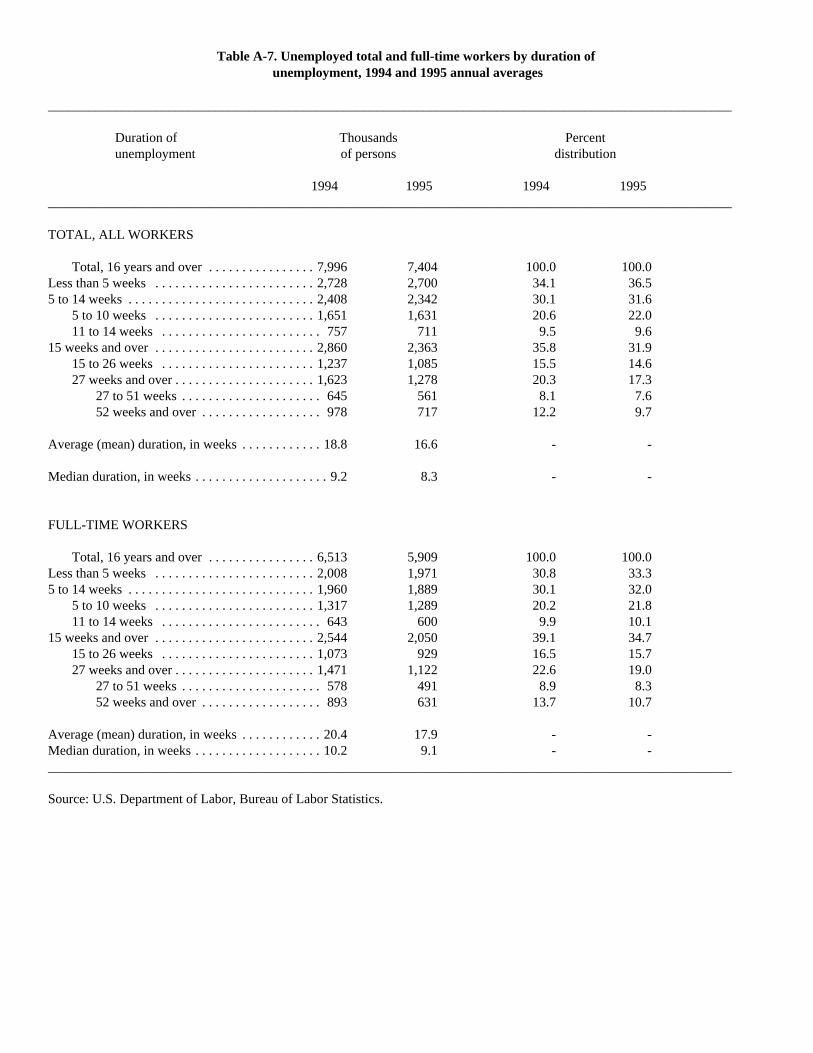
Table A-7. Unemployed total and full-time workers by duration of unemployment, 1994 and 1995 annual averages
______________________________________________________________________________________________________
Duration of Thousands Percent unemployment of persons distribution
1994 1995 1994 1995______________________________________________________________________________________________________
TOTAL, ALL WORKERS
Total, 16 years and over . . . . . . . . . . . . . . . . 7,996 7,404 100.0 100.0Less than 5 weeks . . . . . . . . . . . . . . . . . . . . . . . . 2,728 2,700 34.1 36.55 to 14 weeks . . . . . . . . . . . . . . . . . . . . . . . . . . . . 2,408 2,342 30.1 31.6
5 to 10 weeks . . . . . . . . . . . . . . . . . . . . . . . . 1,651 1,631 20.6 22.011 to 14 weeks . . . . . . . . . . . . . . . . . . . . . . . . 757 711 9.5 9.6
15 weeks and over . . . . . . . . . . . . . . . . . . . . . . . . 2,860 2,363 35.8 31.915 to 26 weeks . . . . . . . . . . . . . . . . . . . . . . . 1,237 1,085 15.5 14.627 weeks and over . . . . . . . . . . . . . . . . . . . . . 1,623 1,278 20.3 17.3
27 to 51 weeks . . . . . . . . . . . . . . . . . . . . . 645 561 8.1 7.652 weeks and over . . . . . . . . . . . . . . . . . . 978 717 12.2 9.7
Average (mean) duration, in weeks . . . . . . . . . . . . 18.8 16.6 - -
Median duration, in weeks . . . . . . . . . . . . . . . . . . . . 9.2 8.3 - -
FULL-TIME WORKERS
Total, 16 years and over . . . . . . . . . . . . . . . . 6,513 5,909 100.0 100.0Less than 5 weeks . . . . . . . . . . . . . . . . . . . . . . . . 2,008 1,971 30.8 33.35 to 14 weeks . . . . . . . . . . . . . . . . . . . . . . . . . . . . 1,960 1,889 30.1 32.0
5 to 10 weeks . . . . . . . . . . . . . . . . . . . . . . . . 1,317 1,289 20.2 21.811 to 14 weeks . . . . . . . . . . . . . . . . . . . . . . . . 643 600 9.9 10.1
15 weeks and over . . . . . . . . . . . . . . . . . . . . . . . . 2,544 2,050 39.1 34.715 to 26 weeks . . . . . . . . . . . . . . . . . . . . . . . 1,073 929 16.5 15.727 weeks and over . . . . . . . . . . . . . . . . . . . . . 1,471 1,122 22.6 19.0
27 to 51 weeks . . . . . . . . . . . . . . . . . . . . . 578 491 8.9 8.352 weeks and over . . . . . . . . . . . . . . . . . . 893 631 13.7 10.7
Average (mean) duration, in weeks . . . . . . . . . . . . 20.4 17.9 - -Median duration, in weeks . . . . . . . . . . . . . . . . . . . 10.2 9.1 - -______________________________________________________________________________________________________
Source: U.S. Department of Labor, Bureau of Labor Statistics.

Table A-8. Unemployed job seekers by sex, age, race, and active job search methods used, 1995 annual averages
______________________________________________________________________________________________________
1995
Thousands ofPersons
Methods used as a percent of total job seekers
Sex, age, and race Totalun-employed
Totaljobseekers
Employerdirectly
Sent outresumesor filledoutapplic-ations
Placedor ans-weredads
Frie-nds orrela-tives
Publicemploymentagency
Privateemploymentagency
Other Aver-agenum-ber ofmeth-odsused
Total, 16 years and over . . . . . . . . . . . 7,404 6,375 65.3 45.1 18.5 17.3 18.8 6.5 7.9 1.8016 to 19 years . . . . . . . . . . 1,346 1,274 63.0 50.8 10.4 11.4 8.8 2.5 5.3 1.5220 to 24 years . . . . . . . . . . 1,244 1,123 66.7 45.5 18.0 15.3 18.7 6.3 7.2 1.7825 to 34 years . . . . . . . . . . 1,841 1,578 66.7 44.3 19.9 18.5 22.4 7.7 7.6 1.8835 to 44 years . . . . . . . . . . 1,549 1,274 64.6 44.4 22.4 20.0 22.7 7.8 8.9 1.9145 to 54 years . . . . . . . . . . . 844 676 66.8 43.7 22.5 21.6 24.2 9.4 10.3 1.9955 to 64 years . . . . . . . . . . . 425 332 62.6 39.1 21.2 21.3 17.8 7.6 11.8 1.8265 years and over . . . . . . . . 153 117 64.6 24.2 18.0 21.4 9.7 3.7 10.5 1.52
Men, 16 years and over . . . . . . . . . . . 3,983 3,336 66.8 42.8 18.1 19.5 20.1 6.5 8.9 1.8316 to 19 years . . . . . . . . . . . 744 698 63.8 49.9 9.5 12.3 9.1 2.9 5.2 1.5320 to 24 years . . . . . . . . . . . 673 591 68.3 43.2 18.6 17.7 19.8 6.3 7.1 1.8225 to 34 years . . . . . . . . . . . 961 783 68.5 41.4 19.8 22.4 25.1 7.7 8.6 1.9435 to 44 years . . . . . . . . . . . 815 644 67.1 41.5 21.6 21.7 24.5 7.4 10.8 1.9545 to 54 years . . . . . . . . . . . 464 361 68.4 41.8 22.1 23.4 27.0 9.4 12.6 2.0555 to 64 years . . . . . . . . . . . 233 183 63.6 34.6 22.0 23.1 17.3 7.7 13.8 1.8265 years and over . . . . . . . . . 94 75 63.8 23.7 16.1 22.4 7.1 3.9 12.9 1.50
Women, 16 years and over . . . . . . . . . . . 3,421 3,039 63.6 47.7 18.9 15.0 17.4 6.6 6.8 1.7616 to 19 years . . . . . . . . . . . 602 576 62.0 52.0 11.6 10.4 8.4 2.0 5.4 1.5220 to 24 years . . . . . . . . . . . 571 533 65.0 47.9 17.2 12.5 17.4 6.2 7.2 1..7425 to 34 years . . . . . . . . . . . 880 795 65.0 47.2 20.0 14.7 19.8 7.7 6.7 1.8135 to 44 years . . . . . . . . . . . 735 630 62.0 47.4 23.3 18.1 20.9 8.3 6.9 1.8745 to 54 years . . . . . . . . . . . 381 315 64.9 45.9 23.0 19.5 20.9 9.4 7.6 1.9255 to 64 years . . . . . . . . . . . 193 149 61.3 44.6 20.1 19.0 18.3 7.4 9.3 1.8165 years and over . . . . . . . . . 60 42 66.0 25.1 21.5 19.6 14.3 3.4 6.1 1.56
White, 16 years and over . . . . . . . . . . . . 5,459 4,603 65.6 45.5 19.4 17.6 18.5 6.5 8.4 1.82
Men . . . . . . . . . . . . . . . . . 2,999 2,454 67.3 42.7 19.0 14.8 20.0 6.6 9.5 1.85Women . . . . . . . . . . . . . . . 2,460 2,150 63.8 48.7 19.9 20.0 16.8 6.4 7.3 1.78
Black, 16 years and over . . . . . . . . . . . . 1,538 1,421 64.6 45.1 15.4 15.2 20.4 6.7 5.8 1.73
Men . . . . . . . . . . . . . . . . . . 762 694 65.3 44.5 14.7 16.3 21.1 6.4 6.4 1.75Women . . . . . . . . . . . . . . . . 777 727 63.9 45.6 16.1 14.1 19.8 7.0 5.1 1.72______________________________________________________________________________________________________
Note: The jobseekers total is less than the total unemployed because it does not include persons on temporary layoff. The percent

using each method will always total more than 100 because many jobseekers use more than one method.
Source: U.S. Department of Labor, Bureau of Labor Statistics.

Table A-9. Unemployed job seekers by sex, reason for unemployment, and active job search methods used, 1995 annual averages
1995
Thousands ofpersons
Methods used as a percent of total jobseekers
Sex, age, and race
Totalunem-ployed
Totaljob-seekers
Em-ployerdirectly
Sentoutresumesor filledout appli-cations
Placedor an-sweredads
Frie-nds or rela-tives
Publicemploy-mentagency
Privateemploy-mentagency
other AverageNumberofMethodsused
Total, 16 years and over . . . . . . . . . . . . 7,404 6,375 65.3 45.1 18.5 17.3 18.8 6.5 7.9 1.80
Job losers and per- sons who completed temporary jobs1 . . . . . . . . 3,476 2,446 68.5 44.4 22.8 21.0 25.7 8.7 8.7 2.06Job leavers . . . . . . . . . . . . . 824 824 66.6 48.1 21.1 17.4 19.3 7.5 7.2 1.88Reentrants . . . . . . . . . . . . 2,525 2,525 62.6 44.2 15.2 14.2 14.2 5.0 7.9 1.63New entrants . . . . . . . . . . . 579 579 61.9 48.1 10.8 15.6 8.9 2.9 5.6 1.54
Men, 16 years and over . . . . . . . . . . . . 3,983 3,336 66.8 42.8 18.1 19.5 20.1 6.5 8.9 1.83
Job losers and per- sons who completed temporary jobs1 . . . . . . . . 2,190 1,543 70.1 40.9 21.6 22.8 26.3 8.0 9.7 2.05Job leavers . . . . . . . . . . . . . 407 407 67.2 44.3 21.8 18.5 20.9 7.3 6.9 1.87Reentrants . . . . . . . . . . . . 1,113 1,113 63.0 43.5 13.8 16.3 13.8 5.0 9.2 1.65New entrants . . . . . . . . . . . 273 273 63.7 48.3 9.8 15.0 9.3 2.7 5.7 1.54
Women, 16 years and over . . . . . . . . . . . . 3,421 3,039 63.6 47.7 18.9 15.0 17.4 6.6 6.8 1.76
Job losers and per- sons who completed temporary jobs1 . . . . . . . . 1,286 904 65.7 50.3 24.8 17.9 24.6 9.8 7.0 2.08Job leavers . . . . . . . . . . . . . 417 417 66.1 51.9 20.5 16.3 17.8 7.6 7.4 1.88Reentrants . . . . . . . . . . . . 1,412 1,412 62.2 44.7 16.3 12.5 14.6 4.9 6.8 1.62New entrants . . . . . . . . . . . 306 306 60.3 48.0 11.6 16.2 8.6 3.0 5.4 1.59______________________________________________________________________________________________________
1Data on the number of jobseekers and the jobsearch methods used exclude persons on temporary layoff.
Note: The jobseekers total is less than the total unemployed because it does not include persons on temporary layoff. The percentusing each method will always total more than 100 because many jobseekers use more than one method.
Source: U.S. Department of Labor, Bureau of Labor Statistics.

Table A-10. Persons not in the labor force by desire and availabilityfor work, age, and sex, 1995 annual averages
(Numbers in thousands)
1995
Age Sex
Category Total 16 to 24years
25 to 54years
55 yearsand over
Men Women
Total not in the labor force . . . . . . . . . . . . . . . . . . . . . . 66,280 10,922 18,854 36,503 23,818 42,462Do not want a job now1 . . . . . . . . . . . . . . . . . . . . . . 60,610 8,807 16,246 35,557 21,536 39,074Want a job1 . . . . . . . . . . . . . . . . . . . . . . . . . . . . . . . . . 5,670 2,115 2,608 947 2,282 3,388
Did not search for work in previous year . . . . . . . . 3,286 1,153 1,436 697 1,231 2,054Searched for work in previous year2 . . . . . . . . . . . . 2,384 963 1,172 250 1,050 1,334
Not available to work now . . . . . . . . . . . . . . . . . . . 791 397 350 45 302 490Available to work now . . . . . . . . . . . . . . . . . . . . 1,593 566 822 205 749 844
Reason not currently looking:Discouragement over job prospects3 . . . . . . . . 410 108 231 72 245 166Reasons other than discouragement . . . . . . . 1,182 458 591 133 504 679
Family responsibilities . . . . . . . . . . . . . . . . . 185 39 131 15 26 159In school or training . . . . . . . . . . . . . . . . . . . 245 199 44 2 131 114Ill health or disability . . . . . . . . . . . . . . . . . . 131 19 84 28 60 71Other4 . . . . . . . . . . . . . . . . . . . . . . . . . . . . . . 621 201 331 89 287 334
______________________________________________________________________________________________________
1Includes some persons who are not asked if they want a job.
2Persons who had a job in the prior 12 months must have searched since the end of that job.
3Includes believes no work available, could not find work, lacks necessary schooling or training, employer thinks too young or old,and other types of discrimination.
4Includes those who did not actively look for work in the prior 4 weeks for such reasons as child care and transportation problems, aswell as a small number for which reason for nonparticipation was not ascertained.
Source: U.S. Department of Labor, Bureau of Labor Statistics.
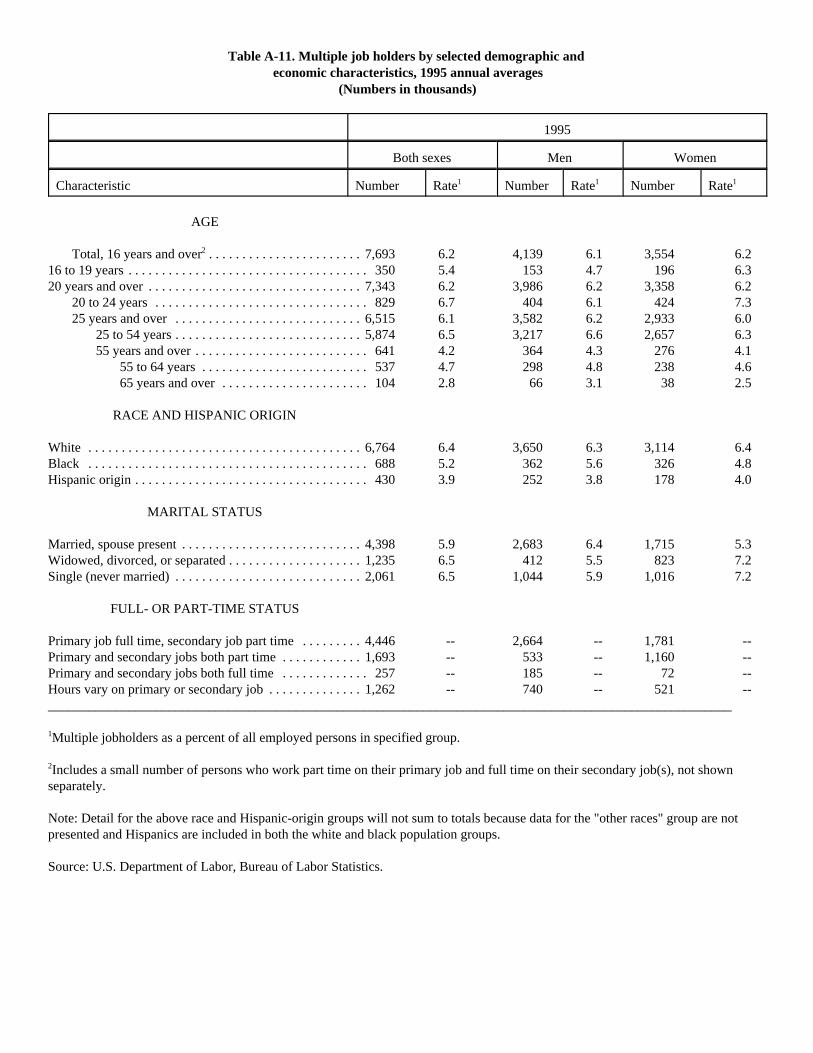
Table A-11. Multiple job holders by selected demographic and economic characteristics, 1995 annual averages
(Numbers in thousands)
1995
Both sexes Men Women
Characteristic Number Rate1 Number Rate1 Number Rate1
AGE
Total, 16 years and over2 . . . . . . . . . . . . . . . . . . . . . . . 7,693 6.2 4,139 6.1 3,554 6.216 to 19 years . . . . . . . . . . . . . . . . . . . . . . . . . . . . . . . . . . . . 350 5.4 153 4.7 196 6.320 years and over . . . . . . . . . . . . . . . . . . . . . . . . . . . . . . . . 7,343 6.2 3,986 6.2 3,358 6.2
20 to 24 years . . . . . . . . . . . . . . . . . . . . . . . . . . . . . . . . 829 6.7 404 6.1 424 7.325 years and over . . . . . . . . . . . . . . . . . . . . . . . . . . . . 6,515 6.1 3,582 6.2 2,933 6.0
25 to 54 years . . . . . . . . . . . . . . . . . . . . . . . . . . . . 5,874 6.5 3,217 6.6 2,657 6.355 years and over . . . . . . . . . . . . . . . . . . . . . . . . . . 641 4.2 364 4.3 276 4.1
55 to 64 years . . . . . . . . . . . . . . . . . . . . . . . . . 537 4.7 298 4.8 238 4.665 years and over . . . . . . . . . . . . . . . . . . . . . . 104 2.8 66 3.1 38 2.5
RACE AND HISPANIC ORIGIN
White . . . . . . . . . . . . . . . . . . . . . . . . . . . . . . . . . . . . . . . . . 6,764 6.4 3,650 6.3 3,114 6.4Black . . . . . . . . . . . . . . . . . . . . . . . . . . . . . . . . . . . . . . . . . . 688 5.2 362 5.6 326 4.8Hispanic origin . . . . . . . . . . . . . . . . . . . . . . . . . . . . . . . . . . . 430 3.9 252 3.8 178 4.0
MARITAL STATUS
Married, spouse present . . . . . . . . . . . . . . . . . . . . . . . . . . . 4,398 5.9 2,683 6.4 1,715 5.3Widowed, divorced, or separated . . . . . . . . . . . . . . . . . . . . 1,235 6.5 412 5.5 823 7.2Single (never married) . . . . . . . . . . . . . . . . . . . . . . . . . . . . 2,061 6.5 1,044 5.9 1,016 7.2
FULL- OR PART-TIME STATUS
Primary job full time, secondary job part time . . . . . . . . . 4,446 -- 2,664 -- 1,781 --Primary and secondary jobs both part time . . . . . . . . . . . . 1,693 -- 533 -- 1,160 --Primary and secondary jobs both full time . . . . . . . . . . . . . 257 -- 185 -- 72 --Hours vary on primary or secondary job . . . . . . . . . . . . . . 1,262 -- 740 -- 521 --______________________________________________________________________________________________________
1Multiple jobholders as a percent of all employed persons in specified group.
2Includes a small number of persons who work part time on their primary job and full time on their secondary job(s), not shownseparately.
Note: Detail for the above race and Hispanic-origin groups will not sum to totals because data for the "other races" group are notpresented and Hispanics are included in both the white and black population groups.
Source: U.S. Department of Labor, Bureau of Labor Statistics.
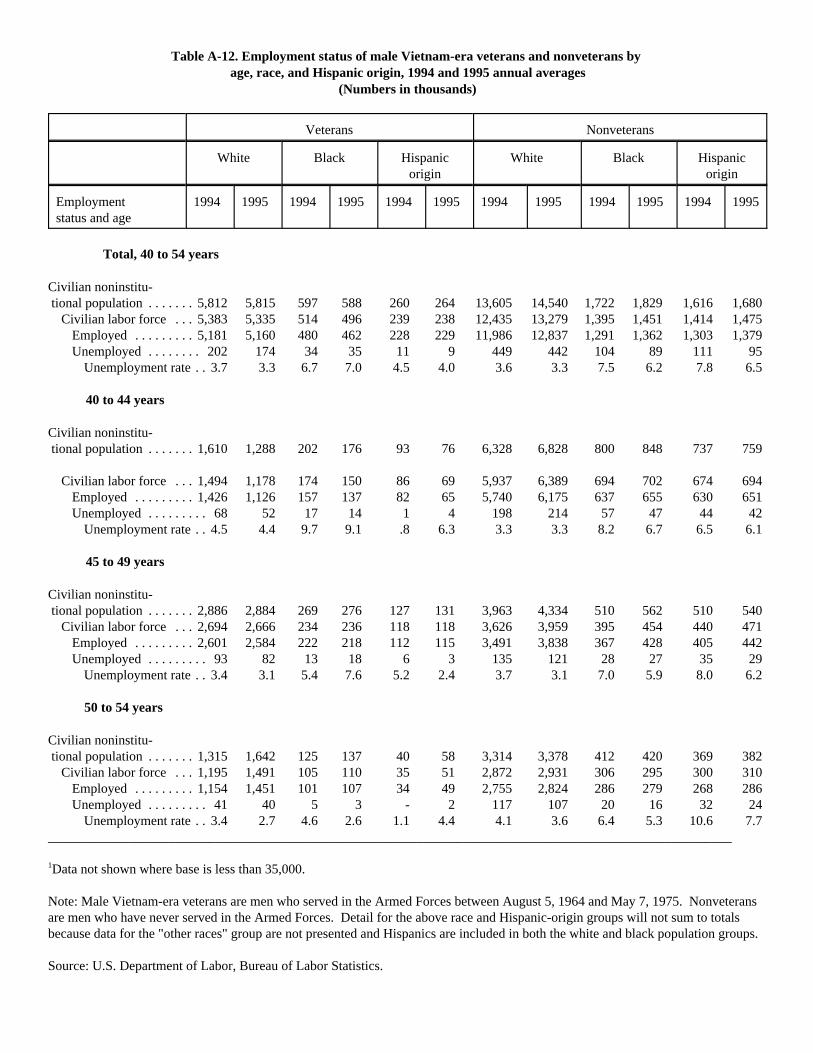
Table A-12. Employment status of male Vietnam-era veterans and nonveterans by age, race, and Hispanic origin, 1994 and 1995 annual averages
(Numbers in thousands)
Veterans Nonveterans
White Black Hispanicorigin
White Black Hispanicorigin
Employment status and age
1994 1995 1994 1995 1994 1995 1994 1995 1994 1995 1994 1995
Total, 40 to 54 years
Civilian noninstitu- tional population . . . . . . . 5,812 5,815 597 588 260 264 13,605 14,540 1,722 1,829 1,616 1,680
Civilian labor force . . . 5,383 5,335 514 496 239 238 12,435 13,279 1,395 1,451 1,414 1,475Employed . . . . . . . . . 5,181 5,160 480 462 228 229 11,986 12,837 1,291 1,362 1,303 1,379Unemployed . . . . . . . . 202 174 34 35 11 9 449 442 104 89 111 95
Unemployment rate . . 3.7 3.3 6.7 7.0 4.5 4.0 3.6 3.3 7.5 6.2 7.8 6.5
40 to 44 years
Civilian noninstitu- tional population . . . . . . . 1,610 1,288 202 176 93 76 6,328 6,828 800 848 737 759
Civilian labor force . . . 1,494 1,178 174 150 86 69 5,937 6,389 694 702 674 694Employed . . . . . . . . . 1,426 1,126 157 137 82 65 5,740 6,175 637 655 630 651Unemployed . . . . . . . . . 68 52 17 14 1 4 198 214 57 47 44 42
Unemployment rate . . 4.5 4.4 9.7 9.1 .8 6.3 3.3 3.3 8.2 6.7 6.5 6.1
45 to 49 years
Civilian noninstitu- tional population . . . . . . . 2,886 2,884 269 276 127 131 3,963 4,334 510 562 510 540
Civilian labor force . . . 2,694 2,666 234 236 118 118 3,626 3,959 395 454 440 471Employed . . . . . . . . . 2,601 2,584 222 218 112 115 3,491 3,838 367 428 405 442Unemployed . . . . . . . . . 93 82 13 18 6 3 135 121 28 27 35 29
Unemployment rate . . 3.4 3.1 5.4 7.6 5.2 2.4 3.7 3.1 7.0 5.9 8.0 6.2
50 to 54 years
Civilian noninstitu- tional population . . . . . . . 1,315 1,642 125 137 40 58 3,314 3,378 412 420 369 382
Civilian labor force . . . 1,195 1,491 105 110 35 51 2,872 2,931 306 295 300 310Employed . . . . . . . . . 1,154 1,451 101 107 34 49 2,755 2,824 286 279 268 286Unemployed . . . . . . . . . 41 40 5 3 - 2 117 107 20 16 32 24
Unemployment rate . . 3.4 2.7 4.6 2.6 1.1 4.4 4.1 3.6 6.4 5.3 10.6 7.7______________________________________________________________________________________________________
1Data not shown where base is less than 35,000.
Note: Male Vietnam-era veterans are men who served in the Armed Forces between August 5, 1964 and May 7, 1975. Nonveteransare men who have never served in the Armed Forces. Detail for the above race and Hispanic-origin groups will not sum to totalsbecause data for the "other races" group are not presented and Hispanics are included in both the white and black population groups.
Source: U.S. Department of Labor, Bureau of Labor Statistics.
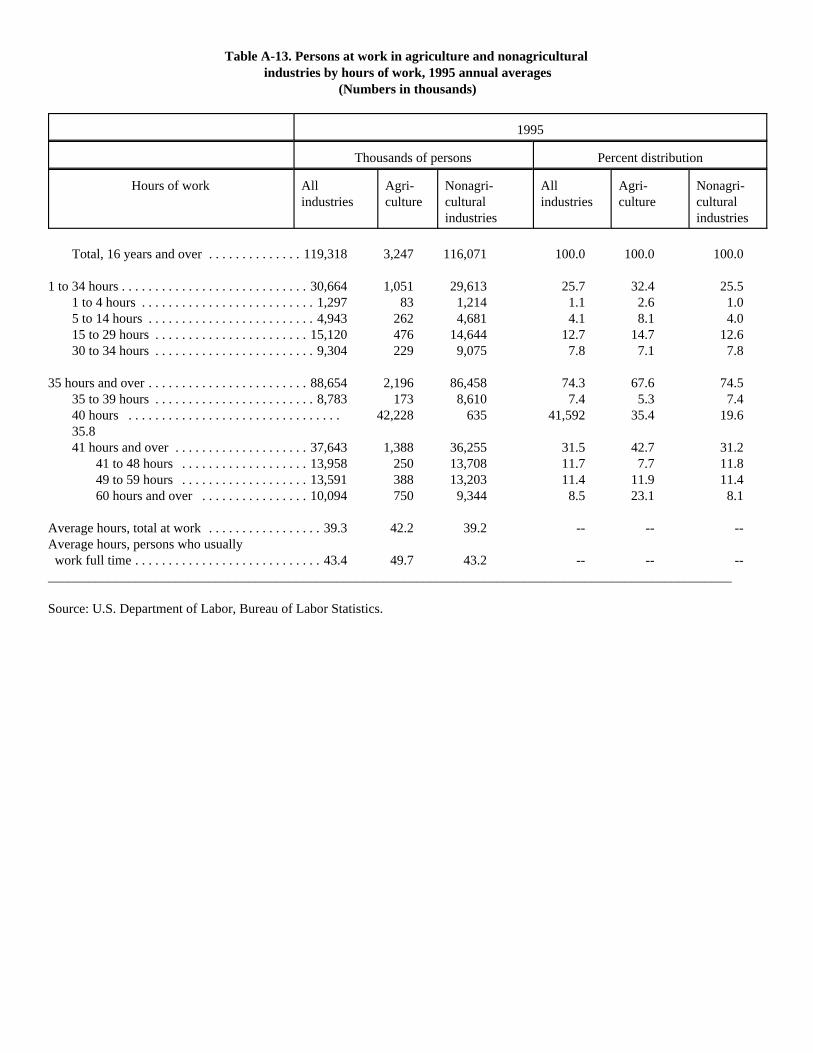
Table A-13. Persons at work in agriculture and nonagricultural industries by hours of work, 1995 annual averages
(Numbers in thousands)
1995
Thousands of persons Percent distribution
Hours of work Allindustries
Agri-culture
Nonagri-culturalindustries
Allindustries
Agri-culture
Nonagri-culturalindustries
Total, 16 years and over . . . . . . . . . . . . . . 119,318 3,247 116,071 100.0 100.0 100.0
1 to 34 hours . . . . . . . . . . . . . . . . . . . . . . . . . . . . 30,664 1,051 29,613 25.7 32.4 25.51 to 4 hours . . . . . . . . . . . . . . . . . . . . . . . . . . 1,297 83 1,214 1.1 2.6 1.05 to 14 hours . . . . . . . . . . . . . . . . . . . . . . . . . 4,943 262 4,681 4.1 8.1 4.015 to 29 hours . . . . . . . . . . . . . . . . . . . . . . . 15,120 476 14,644 12.7 14.7 12.630 to 34 hours . . . . . . . . . . . . . . . . . . . . . . . . 9,304 229 9,075 7.8 7.1 7.8
35 hours and over . . . . . . . . . . . . . . . . . . . . . . . . 88,654 2,196 86,458 74.3 67.6 74.535 to 39 hours . . . . . . . . . . . . . . . . . . . . . . . . 8,783 173 8,610 7.4 5.3 7.440 hours . . . . . . . . . . . . . . . . . . . . . . . . . . . . . . . . 42,228 635 41,592 35.4 19.635.841 hours and over . . . . . . . . . . . . . . . . . . . . 37,643 1,388 36,255 31.5 42.7 31.2
41 to 48 hours . . . . . . . . . . . . . . . . . . . 13,958 250 13,708 11.7 7.7 11.849 to 59 hours . . . . . . . . . . . . . . . . . . . 13,591 388 13,203 11.4 11.9 11.460 hours and over . . . . . . . . . . . . . . . . 10,094 750 9,344 8.5 23.1 8.1
Average hours, total at work . . . . . . . . . . . . . . . . . 39.3 42.2 39.2 -- -- --Average hours, persons who usually work full time . . . . . . . . . . . . . . . . . . . . . . . . . . . . 43.4 49.7 43.2 -- -- --______________________________________________________________________________________________________
Source: U.S. Department of Labor, Bureau of Labor Statistics.
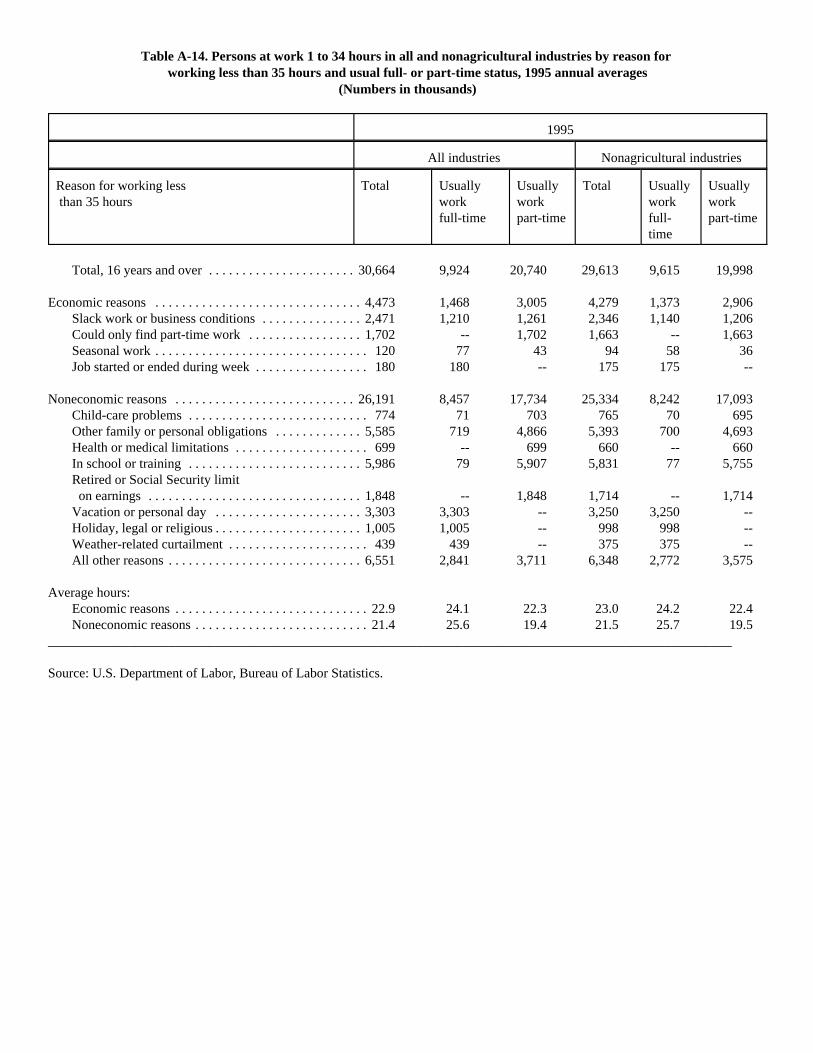
Table A-14. Persons at work 1 to 34 hours in all and nonagricultural industries by reason for working less than 35 hours and usual full- or part-time status, 1995 annual averages
(Numbers in thousands)
1995
All industries Nonagricultural industries
Reason for working less than 35 hours
Total Usually work full-time
Usually work part-time
Total Usually work full-time
Usuallywork part-time
Total, 16 years and over . . . . . . . . . . . . . . . . . . . . . . 30,664 9,924 20,740 29,613 9,615 19,998
Economic reasons . . . . . . . . . . . . . . . . . . . . . . . . . . . . . . . 4,473 1,468 3,005 4,279 1,373 2,906Slack work or business conditions . . . . . . . . . . . . . . . 2,471 1,210 1,261 2,346 1,140 1,206Could only find part-time work . . . . . . . . . . . . . . . . . 1,702 -- 1,702 1,663 -- 1,663Seasonal work . . . . . . . . . . . . . . . . . . . . . . . . . . . . . . . . 120 77 43 94 58 36Job started or ended during week . . . . . . . . . . . . . . . . . 180 180 -- 175 175 --
Noneconomic reasons . . . . . . . . . . . . . . . . . . . . . . . . . . . 26,191 8,457 17,734 25,334 8,242 17,093Child-care problems . . . . . . . . . . . . . . . . . . . . . . . . . . . 774 71 703 765 70 695Other family or personal obligations . . . . . . . . . . . . . 5,585 719 4,866 5,393 700 4,693Health or medical limitations . . . . . . . . . . . . . . . . . . . . 699 -- 699 660 -- 660In school or training . . . . . . . . . . . . . . . . . . . . . . . . . . 5,986 79 5,907 5,831 77 5,755Retired or Social Security limit on earnings . . . . . . . . . . . . . . . . . . . . . . . . . . . . . . . . 1,848 -- 1,848 1,714 -- 1,714Vacation or personal day . . . . . . . . . . . . . . . . . . . . . . 3,303 3,303 -- 3,250 3,250 --Holiday, legal or religious . . . . . . . . . . . . . . . . . . . . . . 1,005 1,005 -- 998 998 --Weather-related curtailment . . . . . . . . . . . . . . . . . . . . . 439 439 -- 375 375 --All other reasons . . . . . . . . . . . . . . . . . . . . . . . . . . . . . 6,551 2,841 3,711 6,348 2,772 3,575
Average hours:Economic reasons . . . . . . . . . . . . . . . . . . . . . . . . . . . . . 22.9 24.1 22.3 23.0 24.2 22.4Noneconomic reasons . . . . . . . . . . . . . . . . . . . . . . . . . . 21.4 25.6 19.4 21.5 25.7 19.5
______________________________________________________________________________________________________
Source: U.S. Department of Labor, Bureau of Labor Statistics.
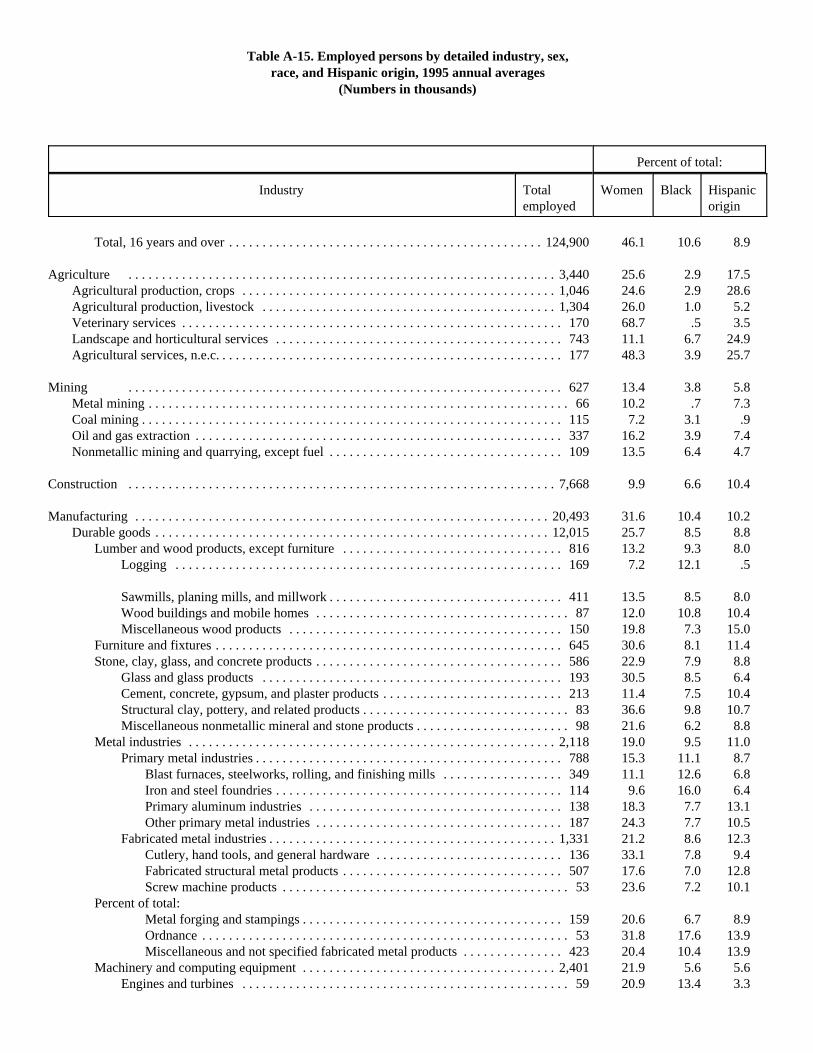
Table A-15. Employed persons by detailed industry, sex,race, and Hispanic origin, 1995 annual averages
(Numbers in thousands)
Percent of total:
Industry Totalemployed
Women Black Hispanicorigin
Total, 16 years and over . . . . . . . . . . . . . . . . . . . . . . . . . . . . . . . . . . . . . . . . . . . . . . . 124,900 46.1 10.6 8.9
Agriculture . . . . . . . . . . . . . . . . . . . . . . . . . . . . . . . . . . . . . . . . . . . . . . . . . . . . . . . . . . . . . . . . 3,440 25.6 2.9 17.5Agricultural production, crops . . . . . . . . . . . . . . . . . . . . . . . . . . . . . . . . . . . . . . . . . . . . . . . 1,046 24.6 2.9 28.6Agricultural production, livestock . . . . . . . . . . . . . . . . . . . . . . . . . . . . . . . . . . . . . . . . . . . . 1,304 26.0 1.0 5.2Veterinary services . . . . . . . . . . . . . . . . . . . . . . . . . . . . . . . . . . . . . . . . . . . . . . . . . . . . . . . . . 170 68.7 .5 3.5Landscape and horticultural services . . . . . . . . . . . . . . . . . . . . . . . . . . . . . . . . . . . . . . . . . . . 743 11.1 6.7 24.9Agricultural services, n.e.c. . . . . . . . . . . . . . . . . . . . . . . . . . . . . . . . . . . . . . . . . . . . . . . . . . . . 177 48.3 3.9 25.7
Mining . . . . . . . . . . . . . . . . . . . . . . . . . . . . . . . . . . . . . . . . . . . . . . . . . . . . . . . . . . . . . . . . . 627 13.4 3.8 5.8Metal mining . . . . . . . . . . . . . . . . . . . . . . . . . . . . . . . . . . . . . . . . . . . . . . . . . . . . . . . . . . . . . . . 66 10.2 .7 7.3Coal mining . . . . . . . . . . . . . . . . . . . . . . . . . . . . . . . . . . . . . . . . . . . . . . . . . . . . . . . . . . . . . . . 115 7.2 3.1 .9Oil and gas extraction . . . . . . . . . . . . . . . . . . . . . . . . . . . . . . . . . . . . . . . . . . . . . . . . . . . . . . . 337 16.2 3.9 7.4Nonmetallic mining and quarrying, except fuel . . . . . . . . . . . . . . . . . . . . . . . . . . . . . . . . . . . 109 13.5 6.4 4.7
Construction . . . . . . . . . . . . . . . . . . . . . . . . . . . . . . . . . . . . . . . . . . . . . . . . . . . . . . . . . . . . . . . . 7,668 9.9 6.6 10.4
Manufacturing . . . . . . . . . . . . . . . . . . . . . . . . . . . . . . . . . . . . . . . . . . . . . . . . . . . . . . . . . . . . . . 20,493 31.6 10.4 10.2Durable goods . . . . . . . . . . . . . . . . . . . . . . . . . . . . . . . . . . . . . . . . . . . . . . . . . . . . . . . . . . . 12,015 25.7 8.5 8.8
Lumber and wood products, except furniture . . . . . . . . . . . . . . . . . . . . . . . . . . . . . . . . . 816 13.2 9.3 8.0Logging . . . . . . . . . . . . . . . . . . . . . . . . . . . . . . . . . . . . . . . . . . . . . . . . . . . . . . . . . . 169 7.2 12.1 .5
Sawmills, planing mills, and millwork . . . . . . . . . . . . . . . . . . . . . . . . . . . . . . . . . . . 411 13.5 8.5 8.0Wood buildings and mobile homes . . . . . . . . . . . . . . . . . . . . . . . . . . . . . . . . . . . . . . 87 12.0 10.8 10.4Miscellaneous wood products . . . . . . . . . . . . . . . . . . . . . . . . . . . . . . . . . . . . . . . . . 150 19.8 7.3 15.0
Furniture and fixtures . . . . . . . . . . . . . . . . . . . . . . . . . . . . . . . . . . . . . . . . . . . . . . . . . . . . 645 30.6 8.1 11.4Stone, clay, glass, and concrete products . . . . . . . . . . . . . . . . . . . . . . . . . . . . . . . . . . . . . 586 22.9 7.9 8.8
Glass and glass products . . . . . . . . . . . . . . . . . . . . . . . . . . . . . . . . . . . . . . . . . . . . . 193 30.5 8.5 6.4Cement, concrete, gypsum, and plaster products . . . . . . . . . . . . . . . . . . . . . . . . . . . 213 11.4 7.5 10.4Structural clay, pottery, and related products . . . . . . . . . . . . . . . . . . . . . . . . . . . . . . . 83 36.6 9.8 10.7Miscellaneous nonmetallic mineral and stone products . . . . . . . . . . . . . . . . . . . . . . . 98 21.6 6.2 8.8
Metal industries . . . . . . . . . . . . . . . . . . . . . . . . . . . . . . . . . . . . . . . . . . . . . . . . . . . . . . . 2,118 19.0 9.5 11.0Primary metal industries . . . . . . . . . . . . . . . . . . . . . . . . . . . . . . . . . . . . . . . . . . . . . . 788 15.3 11.1 8.7
Blast furnaces, steelworks, rolling, and finishing mills . . . . . . . . . . . . . . . . . . 349 11.1 12.6 6.8Iron and steel foundries . . . . . . . . . . . . . . . . . . . . . . . . . . . . . . . . . . . . . . . . . . . 114 9.6 16.0 6.4Primary aluminum industries . . . . . . . . . . . . . . . . . . . . . . . . . . . . . . . . . . . . . . 138 18.3 7.7 13.1Other primary metal industries . . . . . . . . . . . . . . . . . . . . . . . . . . . . . . . . . . . . . 187 24.3 7.7 10.5
Fabricated metal industries . . . . . . . . . . . . . . . . . . . . . . . . . . . . . . . . . . . . . . . . . . . 1,331 21.2 8.6 12.3Cutlery, hand tools, and general hardware . . . . . . . . . . . . . . . . . . . . . . . . . . . . 136 33.1 7.8 9.4Fabricated structural metal products . . . . . . . . . . . . . . . . . . . . . . . . . . . . . . . . . 507 17.6 7.0 12.8Screw machine products . . . . . . . . . . . . . . . . . . . . . . . . . . . . . . . . . . . . . . . . . . . 53 23.6 7.2 10.1
Percent of total:Metal forging and stampings . . . . . . . . . . . . . . . . . . . . . . . . . . . . . . . . . . . . . . . 159 20.6 6.7 8.9Ordnance . . . . . . . . . . . . . . . . . . . . . . . . . . . . . . . . . . . . . . . . . . . . . . . . . . . . . . . 53 31.8 17.6 13.9Miscellaneous and not specified fabricated metal products . . . . . . . . . . . . . . . 423 20.4 10.4 13.9
Machinery and computing equipment . . . . . . . . . . . . . . . . . . . . . . . . . . . . . . . . . . . . . . 2,401 21.9 5.6 5.6Engines and turbines . . . . . . . . . . . . . . . . . . . . . . . . . . . . . . . . . . . . . . . . . . . . . . . . . 59 20.9 13.4 3.3
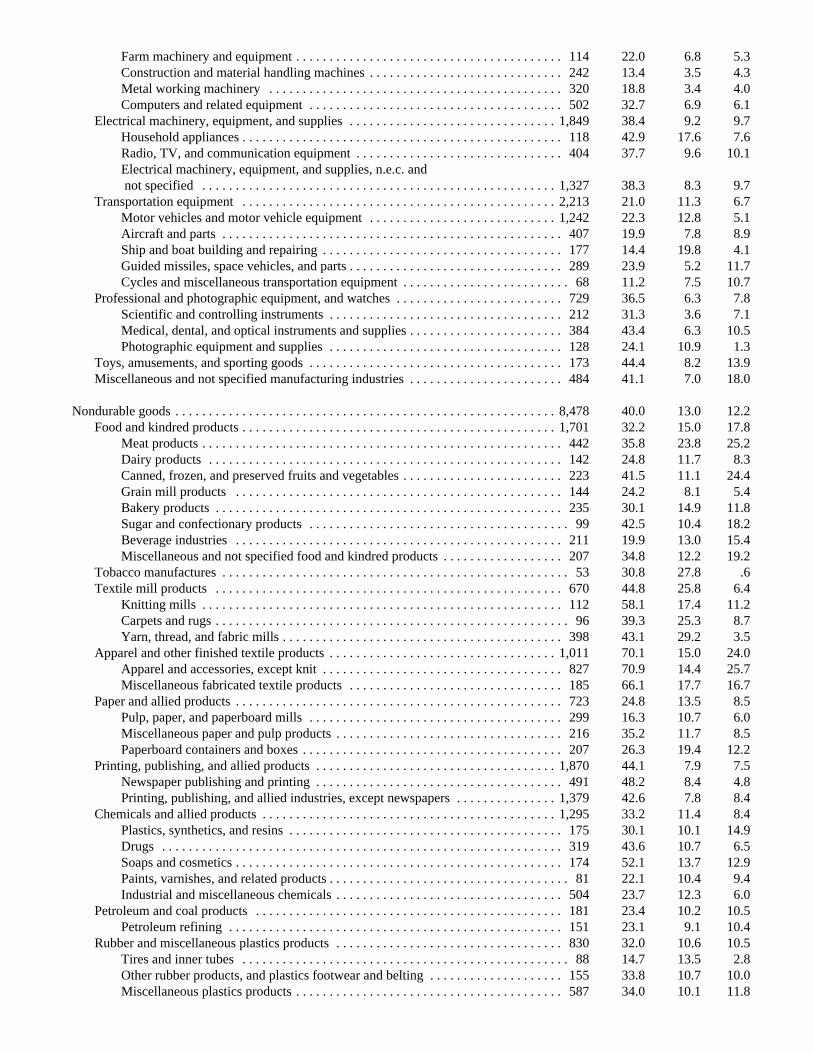
Farm machinery and equipment . . . . . . . . . . . . . . . . . . . . . . . . . . . . . . . . . . . . . . . . 114 22.0 6.8 5.3Construction and material handling machines . . . . . . . . . . . . . . . . . . . . . . . . . . . . . 242 13.4 3.5 4.3Metal working machinery . . . . . . . . . . . . . . . . . . . . . . . . . . . . . . . . . . . . . . . . . . . . 320 18.8 3.4 4.0Computers and related equipment . . . . . . . . . . . . . . . . . . . . . . . . . . . . . . . . . . . . . . 502 32.7 6.9 6.1
Electrical machinery, equipment, and supplies . . . . . . . . . . . . . . . . . . . . . . . . . . . . . . . 1,849 38.4 9.2 9.7Household appliances . . . . . . . . . . . . . . . . . . . . . . . . . . . . . . . . . . . . . . . . . . . . . . . . 118 42.9 17.6 7.6Radio, TV, and communication equipment . . . . . . . . . . . . . . . . . . . . . . . . . . . . . . . 404 37.7 9.6 10.1Electrical machinery, equipment, and supplies, n.e.c. and not specified . . . . . . . . . . . . . . . . . . . . . . . . . . . . . . . . . . . . . . . . . . . . . . . . . . . . . 1,327 38.3 8.3 9.7
Transportation equipment . . . . . . . . . . . . . . . . . . . . . . . . . . . . . . . . . . . . . . . . . . . . . . . 2,213 21.0 11.3 6.7Motor vehicles and motor vehicle equipment . . . . . . . . . . . . . . . . . . . . . . . . . . . . 1,242 22.3 12.8 5.1Aircraft and parts . . . . . . . . . . . . . . . . . . . . . . . . . . . . . . . . . . . . . . . . . . . . . . . . . . . 407 19.9 7.8 8.9Ship and boat building and repairing . . . . . . . . . . . . . . . . . . . . . . . . . . . . . . . . . . . . 177 14.4 19.8 4.1Guided missiles, space vehicles, and parts . . . . . . . . . . . . . . . . . . . . . . . . . . . . . . . . 289 23.9 5.2 11.7Cycles and miscellaneous transportation equipment . . . . . . . . . . . . . . . . . . . . . . . . . 68 11.2 7.5 10.7
Professional and photographic equipment, and watches . . . . . . . . . . . . . . . . . . . . . . . . . 729 36.5 6.3 7.8Scientific and controlling instruments . . . . . . . . . . . . . . . . . . . . . . . . . . . . . . . . . . . 212 31.3 3.6 7.1Medical, dental, and optical instruments and supplies . . . . . . . . . . . . . . . . . . . . . . . 384 43.4 6.3 10.5Photographic equipment and supplies . . . . . . . . . . . . . . . . . . . . . . . . . . . . . . . . . . . 128 24.1 10.9 1.3
Toys, amusements, and sporting goods . . . . . . . . . . . . . . . . . . . . . . . . . . . . . . . . . . . . . . 173 44.4 8.2 13.9Miscellaneous and not specified manufacturing industries . . . . . . . . . . . . . . . . . . . . . . . 484 41.1 7.0 18.0
Nondurable goods . . . . . . . . . . . . . . . . . . . . . . . . . . . . . . . . . . . . . . . . . . . . . . . . . . . . . . . . . 8,478 40.0 13.0 12.2Food and kindred products . . . . . . . . . . . . . . . . . . . . . . . . . . . . . . . . . . . . . . . . . . . . . . . 1,701 32.2 15.0 17.8
Meat products . . . . . . . . . . . . . . . . . . . . . . . . . . . . . . . . . . . . . . . . . . . . . . . . . . . . . . 442 35.8 23.8 25.2Dairy products . . . . . . . . . . . . . . . . . . . . . . . . . . . . . . . . . . . . . . . . . . . . . . . . . . . . . 142 24.8 11.7 8.3Canned, frozen, and preserved fruits and vegetables . . . . . . . . . . . . . . . . . . . . . . . . 223 41.5 11.1 24.4Grain mill products . . . . . . . . . . . . . . . . . . . . . . . . . . . . . . . . . . . . . . . . . . . . . . . . . 144 24.2 8.1 5.4Bakery products . . . . . . . . . . . . . . . . . . . . . . . . . . . . . . . . . . . . . . . . . . . . . . . . . . . . 235 30.1 14.9 11.8Sugar and confectionary products . . . . . . . . . . . . . . . . . . . . . . . . . . . . . . . . . . . . . . . 99 42.5 10.4 18.2Beverage industries . . . . . . . . . . . . . . . . . . . . . . . . . . . . . . . . . . . . . . . . . . . . . . . . . 211 19.9 13.0 15.4Miscellaneous and not specified food and kindred products . . . . . . . . . . . . . . . . . . 207 34.8 12.2 19.2
Tobacco manufactures . . . . . . . . . . . . . . . . . . . . . . . . . . . . . . . . . . . . . . . . . . . . . . . . . . . . 53 30.8 27.8 .6Textile mill products . . . . . . . . . . . . . . . . . . . . . . . . . . . . . . . . . . . . . . . . . . . . . . . . . . . . 670 44.8 25.8 6.4
Knitting mills . . . . . . . . . . . . . . . . . . . . . . . . . . . . . . . . . . . . . . . . . . . . . . . . . . . . . . 112 58.1 17.4 11.2Carpets and rugs . . . . . . . . . . . . . . . . . . . . . . . . . . . . . . . . . . . . . . . . . . . . . . . . . . . . . 96 39.3 25.3 8.7Yarn, thread, and fabric mills . . . . . . . . . . . . . . . . . . . . . . . . . . . . . . . . . . . . . . . . . . 398 43.1 29.2 3.5
Apparel and other finished textile products . . . . . . . . . . . . . . . . . . . . . . . . . . . . . . . . . . 1,011 70.1 15.0 24.0Apparel and accessories, except knit . . . . . . . . . . . . . . . . . . . . . . . . . . . . . . . . . . . . 827 70.9 14.4 25.7Miscellaneous fabricated textile products . . . . . . . . . . . . . . . . . . . . . . . . . . . . . . . . 185 66.1 17.7 16.7
Paper and allied products . . . . . . . . . . . . . . . . . . . . . . . . . . . . . . . . . . . . . . . . . . . . . . . . . 723 24.8 13.5 8.5Pulp, paper, and paperboard mills . . . . . . . . . . . . . . . . . . . . . . . . . . . . . . . . . . . . . . 299 16.3 10.7 6.0Miscellaneous paper and pulp products . . . . . . . . . . . . . . . . . . . . . . . . . . . . . . . . . . 216 35.2 11.7 8.5Paperboard containers and boxes . . . . . . . . . . . . . . . . . . . . . . . . . . . . . . . . . . . . . . . 207 26.3 19.4 12.2
Printing, publishing, and allied products . . . . . . . . . . . . . . . . . . . . . . . . . . . . . . . . . . . . 1,870 44.1 7.9 7.5Newspaper publishing and printing . . . . . . . . . . . . . . . . . . . . . . . . . . . . . . . . . . . . . 491 48.2 8.4 4.8Printing, publishing, and allied industries, except newspapers . . . . . . . . . . . . . . . 1,379 42.6 7.8 8.4
Chemicals and allied products . . . . . . . . . . . . . . . . . . . . . . . . . . . . . . . . . . . . . . . . . . . . 1,295 33.2 11.4 8.4Plastics, synthetics, and resins . . . . . . . . . . . . . . . . . . . . . . . . . . . . . . . . . . . . . . . . . 175 30.1 10.1 14.9Drugs . . . . . . . . . . . . . . . . . . . . . . . . . . . . . . . . . . . . . . . . . . . . . . . . . . . . . . . . . . . . 319 43.6 10.7 6.5Soaps and cosmetics . . . . . . . . . . . . . . . . . . . . . . . . . . . . . . . . . . . . . . . . . . . . . . . . . 174 52.1 13.7 12.9Paints, varnishes, and related products . . . . . . . . . . . . . . . . . . . . . . . . . . . . . . . . . . . . 81 22.1 10.4 9.4Industrial and miscellaneous chemicals . . . . . . . . . . . . . . . . . . . . . . . . . . . . . . . . . . 504 23.7 12.3 6.0
Petroleum and coal products . . . . . . . . . . . . . . . . . . . . . . . . . . . . . . . . . . . . . . . . . . . . . . 181 23.4 10.2 10.5Petroleum refining . . . . . . . . . . . . . . . . . . . . . . . . . . . . . . . . . . . . . . . . . . . . . . . . . . 151 23.1 9.1 10.4
Rubber and miscellaneous plastics products . . . . . . . . . . . . . . . . . . . . . . . . . . . . . . . . . . 830 32.0 10.6 10.5Tires and inner tubes . . . . . . . . . . . . . . . . . . . . . . . . . . . . . . . . . . . . . . . . . . . . . . . . . 88 14.7 13.5 2.8Other rubber products, and plastics footwear and belting . . . . . . . . . . . . . . . . . . . . 155 33.8 10.7 10.0Miscellaneous plastics products . . . . . . . . . . . . . . . . . . . . . . . . . . . . . . . . . . . . . . . . 587 34.0 10.1 11.8
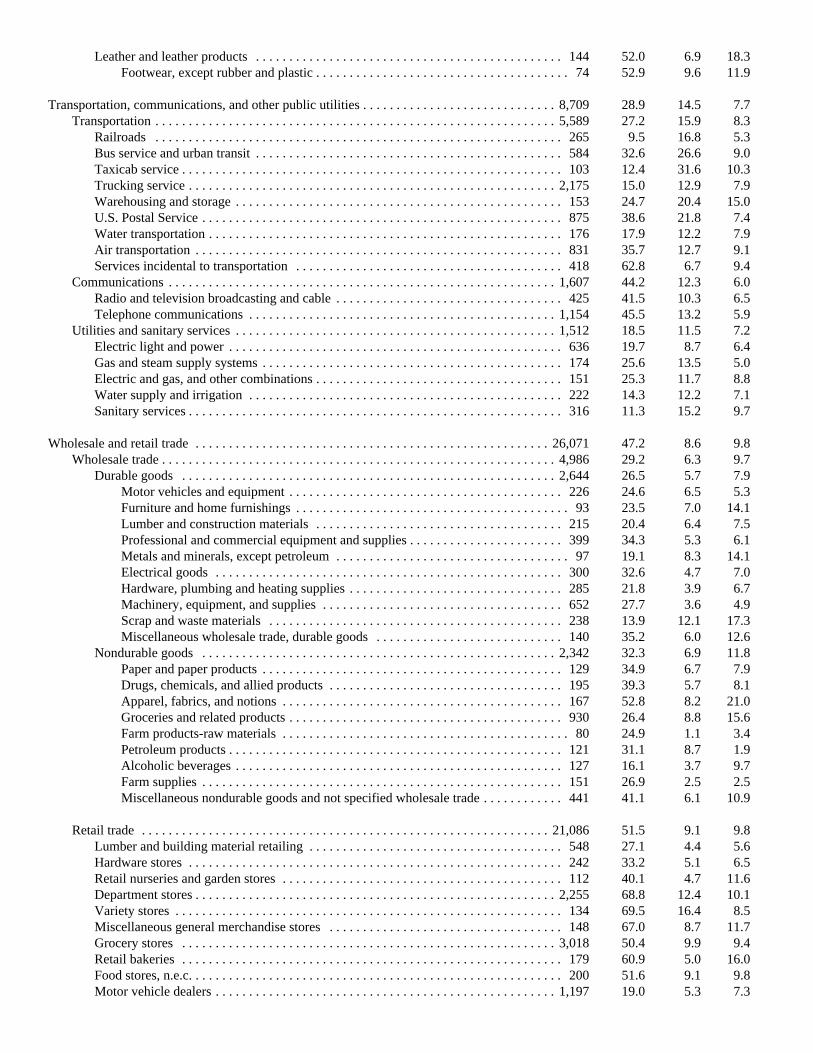
Leather and leather products . . . . . . . . . . . . . . . . . . . . . . . . . . . . . . . . . . . . . . . . . . . . . . 144 52.0 6.9 18.3Footwear, except rubber and plastic . . . . . . . . . . . . . . . . . . . . . . . . . . . . . . . . . . . . . . 74 52.9 9.6 11.9
Transportation, communications, and other public utilities . . . . . . . . . . . . . . . . . . . . . . . . . . . . . 8,709 28.9 14.5 7.7Transportation . . . . . . . . . . . . . . . . . . . . . . . . . . . . . . . . . . . . . . . . . . . . . . . . . . . . . . . . . . . . 5,589 27.2 15.9 8.3
Railroads . . . . . . . . . . . . . . . . . . . . . . . . . . . . . . . . . . . . . . . . . . . . . . . . . . . . . . . . . . . . . 265 9.5 16.8 5.3Bus service and urban transit . . . . . . . . . . . . . . . . . . . . . . . . . . . . . . . . . . . . . . . . . . . . . . 584 32.6 26.6 9.0Taxicab service . . . . . . . . . . . . . . . . . . . . . . . . . . . . . . . . . . . . . . . . . . . . . . . . . . . . . . . . . 103 12.4 31.6 10.3Trucking service . . . . . . . . . . . . . . . . . . . . . . . . . . . . . . . . . . . . . . . . . . . . . . . . . . . . . . . 2,175 15.0 12.9 7.9Warehousing and storage . . . . . . . . . . . . . . . . . . . . . . . . . . . . . . . . . . . . . . . . . . . . . . . . . 153 24.7 20.4 15.0U.S. Postal Service . . . . . . . . . . . . . . . . . . . . . . . . . . . . . . . . . . . . . . . . . . . . . . . . . . . . . . 875 38.6 21.8 7.4Water transportation . . . . . . . . . . . . . . . . . . . . . . . . . . . . . . . . . . . . . . . . . . . . . . . . . . . . . 176 17.9 12.2 7.9Air transportation . . . . . . . . . . . . . . . . . . . . . . . . . . . . . . . . . . . . . . . . . . . . . . . . . . . . . . . 831 35.7 12.7 9.1Services incidental to transportation . . . . . . . . . . . . . . . . . . . . . . . . . . . . . . . . . . . . . . . . 418 62.8 6.7 9.4
Communications . . . . . . . . . . . . . . . . . . . . . . . . . . . . . . . . . . . . . . . . . . . . . . . . . . . . . . . . . . 1,607 44.2 12.3 6.0Radio and television broadcasting and cable . . . . . . . . . . . . . . . . . . . . . . . . . . . . . . . . . . 425 41.5 10.3 6.5Telephone communications . . . . . . . . . . . . . . . . . . . . . . . . . . . . . . . . . . . . . . . . . . . . . . 1,154 45.5 13.2 5.9
Utilities and sanitary services . . . . . . . . . . . . . . . . . . . . . . . . . . . . . . . . . . . . . . . . . . . . . . . . 1,512 18.5 11.5 7.2Electric light and power . . . . . . . . . . . . . . . . . . . . . . . . . . . . . . . . . . . . . . . . . . . . . . . . . . 636 19.7 8.7 6.4Gas and steam supply systems . . . . . . . . . . . . . . . . . . . . . . . . . . . . . . . . . . . . . . . . . . . . . 174 25.6 13.5 5.0Electric and gas, and other combinations . . . . . . . . . . . . . . . . . . . . . . . . . . . . . . . . . . . . . 151 25.3 11.7 8.8Water supply and irrigation . . . . . . . . . . . . . . . . . . . . . . . . . . . . . . . . . . . . . . . . . . . . . . . 222 14.3 12.2 7.1Sanitary services . . . . . . . . . . . . . . . . . . . . . . . . . . . . . . . . . . . . . . . . . . . . . . . . . . . . . . . . 316 11.3 15.2 9.7
Wholesale and retail trade . . . . . . . . . . . . . . . . . . . . . . . . . . . . . . . . . . . . . . . . . . . . . . . . . . . . . 26,071 47.2 8.6 9.8Wholesale trade . . . . . . . . . . . . . . . . . . . . . . . . . . . . . . . . . . . . . . . . . . . . . . . . . . . . . . . . . . . 4,986 29.2 6.3 9.7
Durable goods . . . . . . . . . . . . . . . . . . . . . . . . . . . . . . . . . . . . . . . . . . . . . . . . . . . . . . . . 2,644 26.5 5.7 7.9Motor vehicles and equipment . . . . . . . . . . . . . . . . . . . . . . . . . . . . . . . . . . . . . . . . . 226 24.6 6.5 5.3Furniture and home furnishings . . . . . . . . . . . . . . . . . . . . . . . . . . . . . . . . . . . . . . . . . 93 23.5 7.0 14.1Lumber and construction materials . . . . . . . . . . . . . . . . . . . . . . . . . . . . . . . . . . . . . 215 20.4 6.4 7.5Professional and commercial equipment and supplies . . . . . . . . . . . . . . . . . . . . . . . 399 34.3 5.3 6.1Metals and minerals, except petroleum . . . . . . . . . . . . . . . . . . . . . . . . . . . . . . . . . . . 97 19.1 8.3 14.1Electrical goods . . . . . . . . . . . . . . . . . . . . . . . . . . . . . . . . . . . . . . . . . . . . . . . . . . . . 300 32.6 4.7 7.0Hardware, plumbing and heating supplies . . . . . . . . . . . . . . . . . . . . . . . . . . . . . . . . 285 21.8 3.9 6.7Machinery, equipment, and supplies . . . . . . . . . . . . . . . . . . . . . . . . . . . . . . . . . . . . 652 27.7 3.6 4.9Scrap and waste materials . . . . . . . . . . . . . . . . . . . . . . . . . . . . . . . . . . . . . . . . . . . . 238 13.9 12.1 17.3Miscellaneous wholesale trade, durable goods . . . . . . . . . . . . . . . . . . . . . . . . . . . . 140 35.2 6.0 12.6
Nondurable goods . . . . . . . . . . . . . . . . . . . . . . . . . . . . . . . . . . . . . . . . . . . . . . . . . . . . . 2,342 32.3 6.9 11.8Paper and paper products . . . . . . . . . . . . . . . . . . . . . . . . . . . . . . . . . . . . . . . . . . . . . 129 34.9 6.7 7.9Drugs, chemicals, and allied products . . . . . . . . . . . . . . . . . . . . . . . . . . . . . . . . . . . 195 39.3 5.7 8.1Apparel, fabrics, and notions . . . . . . . . . . . . . . . . . . . . . . . . . . . . . . . . . . . . . . . . . . 167 52.8 8.2 21.0Groceries and related products . . . . . . . . . . . . . . . . . . . . . . . . . . . . . . . . . . . . . . . . . 930 26.4 8.8 15.6Farm products-raw materials . . . . . . . . . . . . . . . . . . . . . . . . . . . . . . . . . . . . . . . . . . . 80 24.9 1.1 3.4Petroleum products . . . . . . . . . . . . . . . . . . . . . . . . . . . . . . . . . . . . . . . . . . . . . . . . . . 121 31.1 8.7 1.9Alcoholic beverages . . . . . . . . . . . . . . . . . . . . . . . . . . . . . . . . . . . . . . . . . . . . . . . . . 127 16.1 3.7 9.7Farm supplies . . . . . . . . . . . . . . . . . . . . . . . . . . . . . . . . . . . . . . . . . . . . . . . . . . . . . . 151 26.9 2.5 2.5Miscellaneous nondurable goods and not specified wholesale trade . . . . . . . . . . . . 441 41.1 6.1 10.9
Retail trade . . . . . . . . . . . . . . . . . . . . . . . . . . . . . . . . . . . . . . . . . . . . . . . . . . . . . . . . . . . . . 21,086 51.5 9.1 9.8Lumber and building material retailing . . . . . . . . . . . . . . . . . . . . . . . . . . . . . . . . . . . . . . 548 27.1 4.4 5.6Hardware stores . . . . . . . . . . . . . . . . . . . . . . . . . . . . . . . . . . . . . . . . . . . . . . . . . . . . . . . . 242 33.2 5.1 6.5Retail nurseries and garden stores . . . . . . . . . . . . . . . . . . . . . . . . . . . . . . . . . . . . . . . . . . 112 40.1 4.7 11.6Department stores . . . . . . . . . . . . . . . . . . . . . . . . . . . . . . . . . . . . . . . . . . . . . . . . . . . . . . 2,255 68.8 12.4 10.1Variety stores . . . . . . . . . . . . . . . . . . . . . . . . . . . . . . . . . . . . . . . . . . . . . . . . . . . . . . . . . . 134 69.5 16.4 8.5Miscellaneous general merchandise stores . . . . . . . . . . . . . . . . . . . . . . . . . . . . . . . . . . . 148 67.0 8.7 11.7Grocery stores . . . . . . . . . . . . . . . . . . . . . . . . . . . . . . . . . . . . . . . . . . . . . . . . . . . . . . . . 3,018 50.4 9.9 9.4Retail bakeries . . . . . . . . . . . . . . . . . . . . . . . . . . . . . . . . . . . . . . . . . . . . . . . . . . . . . . . . . 179 60.9 5.0 16.0Food stores, n.e.c. . . . . . . . . . . . . . . . . . . . . . . . . . . . . . . . . . . . . . . . . . . . . . . . . . . . . . . . 200 51.6 9.1 9.8Motor vehicle dealers . . . . . . . . . . . . . . . . . . . . . . . . . . . . . . . . . . . . . . . . . . . . . . . . . . . 1,197 19.0 5.3 7.3
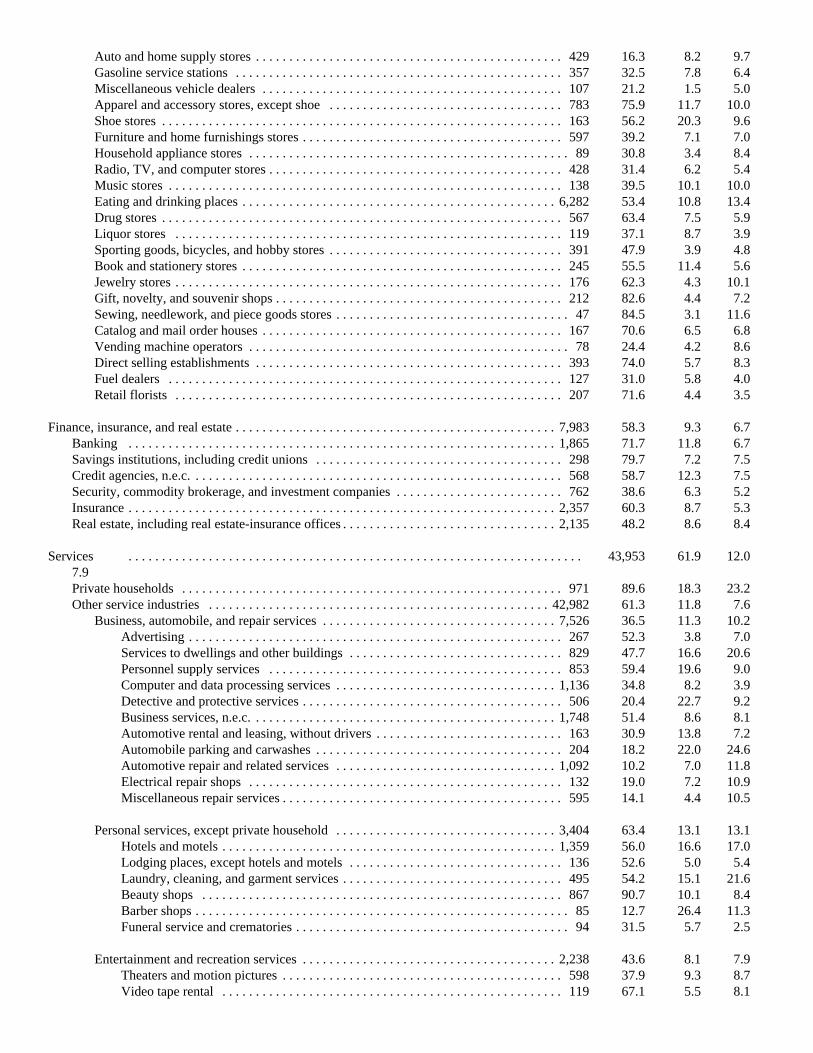
Auto and home supply stores . . . . . . . . . . . . . . . . . . . . . . . . . . . . . . . . . . . . . . . . . . . . . . 429 16.3 8.2 9.7Gasoline service stations . . . . . . . . . . . . . . . . . . . . . . . . . . . . . . . . . . . . . . . . . . . . . . . . . 357 32.5 7.8 6.4Miscellaneous vehicle dealers . . . . . . . . . . . . . . . . . . . . . . . . . . . . . . . . . . . . . . . . . . . . . 107 21.2 1.5 5.0Apparel and accessory stores, except shoe . . . . . . . . . . . . . . . . . . . . . . . . . . . . . . . . . . . 783 75.9 11.7 10.0Shoe stores . . . . . . . . . . . . . . . . . . . . . . . . . . . . . . . . . . . . . . . . . . . . . . . . . . . . . . . . . . . . 163 56.2 20.3 9.6Furniture and home furnishings stores . . . . . . . . . . . . . . . . . . . . . . . . . . . . . . . . . . . . . . . 597 39.2 7.1 7.0Household appliance stores . . . . . . . . . . . . . . . . . . . . . . . . . . . . . . . . . . . . . . . . . . . . . . . . 89 30.8 3.4 8.4Radio, TV, and computer stores . . . . . . . . . . . . . . . . . . . . . . . . . . . . . . . . . . . . . . . . . . . . 428 31.4 6.2 5.4Music stores . . . . . . . . . . . . . . . . . . . . . . . . . . . . . . . . . . . . . . . . . . . . . . . . . . . . . . . . . . . 138 39.5 10.1 10.0Eating and drinking places . . . . . . . . . . . . . . . . . . . . . . . . . . . . . . . . . . . . . . . . . . . . . . . 6,282 53.4 10.8 13.4Drug stores . . . . . . . . . . . . . . . . . . . . . . . . . . . . . . . . . . . . . . . . . . . . . . . . . . . . . . . . . . . . 567 63.4 7.5 5.9Liquor stores . . . . . . . . . . . . . . . . . . . . . . . . . . . . . . . . . . . . . . . . . . . . . . . . . . . . . . . . . . 119 37.1 8.7 3.9Sporting goods, bicycles, and hobby stores . . . . . . . . . . . . . . . . . . . . . . . . . . . . . . . . . . . 391 47.9 3.9 4.8Book and stationery stores . . . . . . . . . . . . . . . . . . . . . . . . . . . . . . . . . . . . . . . . . . . . . . . . 245 55.5 11.4 5.6Jewelry stores . . . . . . . . . . . . . . . . . . . . . . . . . . . . . . . . . . . . . . . . . . . . . . . . . . . . . . . . . . 176 62.3 4.3 10.1Gift, novelty, and souvenir shops . . . . . . . . . . . . . . . . . . . . . . . . . . . . . . . . . . . . . . . . . . . 212 82.6 4.4 7.2Sewing, needlework, and piece goods stores . . . . . . . . . . . . . . . . . . . . . . . . . . . . . . . . . . . 47 84.5 3.1 11.6Catalog and mail order houses . . . . . . . . . . . . . . . . . . . . . . . . . . . . . . . . . . . . . . . . . . . . . 167 70.6 6.5 6.8Vending machine operators . . . . . . . . . . . . . . . . . . . . . . . . . . . . . . . . . . . . . . . . . . . . . . . . 78 24.4 4.2 8.6Direct selling establishments . . . . . . . . . . . . . . . . . . . . . . . . . . . . . . . . . . . . . . . . . . . . . . 393 74.0 5.7 8.3Fuel dealers . . . . . . . . . . . . . . . . . . . . . . . . . . . . . . . . . . . . . . . . . . . . . . . . . . . . . . . . . . . 127 31.0 5.8 4.0Retail florists . . . . . . . . . . . . . . . . . . . . . . . . . . . . . . . . . . . . . . . . . . . . . . . . . . . . . . . . . . 207 71.6 4.4 3.5
Finance, insurance, and real estate . . . . . . . . . . . . . . . . . . . . . . . . . . . . . . . . . . . . . . . . . . . . . . . . 7,983 58.3 9.3 6.7Banking . . . . . . . . . . . . . . . . . . . . . . . . . . . . . . . . . . . . . . . . . . . . . . . . . . . . . . . . . . . . . . . . 1,865 71.7 11.8 6.7Savings institutions, including credit unions . . . . . . . . . . . . . . . . . . . . . . . . . . . . . . . . . . . . . 298 79.7 7.2 7.5Credit agencies, n.e.c. . . . . . . . . . . . . . . . . . . . . . . . . . . . . . . . . . . . . . . . . . . . . . . . . . . . . . . . 568 58.7 12.3 7.5Security, commodity brokerage, and investment companies . . . . . . . . . . . . . . . . . . . . . . . . . 762 38.6 6.3 5.2Insurance . . . . . . . . . . . . . . . . . . . . . . . . . . . . . . . . . . . . . . . . . . . . . . . . . . . . . . . . . . . . . . . . 2,357 60.3 8.7 5.3Real estate, including real estate-insurance offices . . . . . . . . . . . . . . . . . . . . . . . . . . . . . . . . 2,135 48.2 8.6 8.4
Services . . . . . . . . . . . . . . . . . . . . . . . . . . . . . . . . . . . . . . . . . . . . . . . . . . . . . . . . . . . . . . . . . . . . 43,953 61.9 12.07.9Private households . . . . . . . . . . . . . . . . . . . . . . . . . . . . . . . . . . . . . . . . . . . . . . . . . . . . . . . . . 971 89.6 18.3 23.2Other service industries . . . . . . . . . . . . . . . . . . . . . . . . . . . . . . . . . . . . . . . . . . . . . . . . . . . 42,982 61.3 11.8 7.6
Business, automobile, and repair services . . . . . . . . . . . . . . . . . . . . . . . . . . . . . . . . . . . 7,526 36.5 11.3 10.2Advertising . . . . . . . . . . . . . . . . . . . . . . . . . . . . . . . . . . . . . . . . . . . . . . . . . . . . . . . . 267 52.3 3.8 7.0Services to dwellings and other buildings . . . . . . . . . . . . . . . . . . . . . . . . . . . . . . . . 829 47.7 16.6 20.6Personnel supply services . . . . . . . . . . . . . . . . . . . . . . . . . . . . . . . . . . . . . . . . . . . . 853 59.4 19.6 9.0Computer and data processing services . . . . . . . . . . . . . . . . . . . . . . . . . . . . . . . . . 1,136 34.8 8.2 3.9Detective and protective services . . . . . . . . . . . . . . . . . . . . . . . . . . . . . . . . . . . . . . . 506 20.4 22.7 9.2Business services, n.e.c. . . . . . . . . . . . . . . . . . . . . . . . . . . . . . . . . . . . . . . . . . . . . . 1,748 51.4 8.6 8.1Automotive rental and leasing, without drivers . . . . . . . . . . . . . . . . . . . . . . . . . . . . 163 30.9 13.8 7.2Automobile parking and carwashes . . . . . . . . . . . . . . . . . . . . . . . . . . . . . . . . . . . . . 204 18.2 22.0 24.6Automotive repair and related services . . . . . . . . . . . . . . . . . . . . . . . . . . . . . . . . . 1,092 10.2 7.0 11.8Electrical repair shops . . . . . . . . . . . . . . . . . . . . . . . . . . . . . . . . . . . . . . . . . . . . . . . 132 19.0 7.2 10.9Miscellaneous repair services . . . . . . . . . . . . . . . . . . . . . . . . . . . . . . . . . . . . . . . . . . 595 14.1 4.4 10.5
Personal services, except private household . . . . . . . . . . . . . . . . . . . . . . . . . . . . . . . . . 3,404 63.4 13.1 13.1Hotels and motels . . . . . . . . . . . . . . . . . . . . . . . . . . . . . . . . . . . . . . . . . . . . . . . . . . 1,359 56.0 16.6 17.0Lodging places, except hotels and motels . . . . . . . . . . . . . . . . . . . . . . . . . . . . . . . . 136 52.6 5.0 5.4Laundry, cleaning, and garment services . . . . . . . . . . . . . . . . . . . . . . . . . . . . . . . . . 495 54.2 15.1 21.6Beauty shops . . . . . . . . . . . . . . . . . . . . . . . . . . . . . . . . . . . . . . . . . . . . . . . . . . . . . . 867 90.7 10.1 8.4Barber shops . . . . . . . . . . . . . . . . . . . . . . . . . . . . . . . . . . . . . . . . . . . . . . . . . . . . . . . . 85 12.7 26.4 11.3Funeral service and crematories . . . . . . . . . . . . . . . . . . . . . . . . . . . . . . . . . . . . . . . . . 94 31.5 5.7 2.5
Entertainment and recreation services . . . . . . . . . . . . . . . . . . . . . . . . . . . . . . . . . . . . . . 2,238 43.6 8.1 7.9Theaters and motion pictures . . . . . . . . . . . . . . . . . . . . . . . . . . . . . . . . . . . . . . . . . . 598 37.9 9.3 8.7Video tape rental . . . . . . . . . . . . . . . . . . . . . . . . . . . . . . . . . . . . . . . . . . . . . . . . . . . 119 67.1 5.5 8.1

Bowling centers . . . . . . . . . . . . . . . . . . . . . . . . . . . . . . . . . . . . . . . . . . . . . . . . . . . . . 58 46.0 3.1 6.8Miscellaneous entertainment and recreation services . . . . . . . . . . . . . . . . . . . . . . 1,464 43.8 8.1 7.6
Professional and related services . . . . . . . . . . . . . . . . . . . . . . . . . . . . . . . . . . . . . . . . . 29,661 68.9 12.1 6.2Hospitals . . . . . . . . . . . . . . . . . . . . . . . . . . . . . . . . . . . . . . . . . . . . . . . . . . . . . . . . . 4,961 76.1 16.2 6.0Health services, except hospitals . . . . . . . . . . . . . . . . . . . . . . . . . . . . . . . . . . . . . . 5,967 79.1 13.5 6.8
Offices and clinics of physicians . . . . . . . . . . . . . . . . . . . . . . . . . . . . . . . . . . . 1,512 73.9 4.5 6.7Offices and clinics of dentists . . . . . . . . . . . . . . . . . . . . . . . . . . . . . . . . . . . . . . 644 77.3 2.1 7.4Offices and clinics of chiropractors . . . . . . . . . . . . . . . . . . . . . . . . . . . . . . . . . . . 99 62.1 1.0 4.3Offices and clinics of optometrists . . . . . . . . . . . . . . . . . . . . . . . . . . . . . . . . . . . 73 64.5 2.2 7.6Offices and clinics of health practitioners, n.e.c. . . . . . . . . . . . . . . . . . . . . . . . . . 96 71.0 10.4 3.6Nursing and personal care facilities . . . . . . . . . . . . . . . . . . . . . . . . . . . . . . . . 1,718 86.9 24.0 6.2Health services, n.e.c. . . . . . . . . . . . . . . . . . . . . . . . . . . . . . . . . . . . . . . . . . . . 1,826 78.5 16.5 7.5
Educational services . . . . . . . . . . . . . . . . . . . . . . . . . . . . . . . . . . . . . . . . . . . . . . . . 9,894 68.4 11.2 6.6Elementary and secondary schools . . . . . . . . . . . . . . . . . . . . . . . . . . . . . . . . . 6,653 74.6 11.7 7.3Colleges and universities . . . . . . . . . . . . . . . . . . . . . . . . . . . . . . . . . . . . . . . . . 2,768 52.9 10.3 5.2Vocational schools . . . . . . . . . . . . . . . . . . . . . . . . . . . . . . . . . . . . . . . . . . . . . . . 78 59.1 12.2 3.1Libraries . . . . . . . . . . . . . . . . . . . . . . . . . . . . . . . . . . . . . . . . . . . . . . . . . . . . . . . 170 81.4 10.5 3.4Educational services, n.e.c. . . . . . . . . . . . . . . . . . . . . . . . . . . . . . . . . . . . . . . . . 224 70.3 5.2 4.9
Social services . . . . . . . . . . . . . . . . . . . . . . . . . . . . . . . . . . . . . . . . . . . . . . . . . . . . 2,979 80.8 17.5 7.7Job training and vocational rehabilitation services . . . . . . . . . . . . . . . . . . . . . . 225 61.0 14.2 5.5Child day care services . . . . . . . . . . . . . . . . . . . . . . . . . . . . . . . . . . . . . . . . . . . 831 96.0 16.3 7.5Family child care homes . . . . . . . . . . . . . . . . . . . . . . . . . . . . . . . . . . . . . . . . . . 495 97.2 10.2 8.8Residential care facilities, without nursing . . . . . . . . . . . . . . . . . . . . . . . . . . . . 424 67.5 21.1 6.1Social services, n.e.c. . . . . . . . . . . . . . . . . . . . . . . . . . . . . . . . . . . . . . . . . . . . 1,004 70.1 21.4 8.6
Other professional services . . . . . . . . . . . . . . . . . . . . . . . . . . . . . . . . . . . . . . . . . . 5,860 47.3 6.2 4.5Legal services . . . . . . . . . . . . . . . . . . . . . . . . . . . . . . . . . . . . . . . . . . . . . . . . . 1,335 55.7 5.7 4.8Museums, art galleries, and zoos . . . . . . . . . . . . . . . . . . . . . . . . . . . . . . . . . . . 101 60.8 13.1 4.1Labor unions . . . . . . . . . . . . . . . . . . . . . . . . . . . . . . . . . . . . . . . . . . . . . . . . . . . . 70 34.4 10.5 7.3Religious organizations . . . . . . . . . . . . . . . . . . . . . . . . . . . . . . . . . . . . . . . . . . . 893 48.7 7.9 5.5Membership organizations, n.e.c. . . . . . . . . . . . . . . . . . . . . . . . . . . . . . . . . . . . 349 64.5 12.1 3.2Engineering, architectural, and surveying services . . . . . . . . . . . . . . . . . . . . . . 787 21.9 3.0 5.1Accounting, auditing, and bookkeeping services . . . . . . . . . . . . . . . . . . . . . . . 693 56.6 5.9 4.3Research, development, and testing services . . . . . . . . . . . . . . . . . . . . . . . . . . 590 43.7 6.3 4.5Management and public relations services . . . . . . . . . . . . . . . . . . . . . . . . . . . . 761 42.1 5.6 3.3Miscellaneous professional and related services . . . . . . . . . . . . . . . . . . . . . . . . 281 50.9 3.1 1.8
Forestry and fisheries . . . . . . . . . . . . . . . . . . . . . . . . . . . . . . . . . . . . . . . . . . . . . . . . . . . . 152 20.0 4.8 8.6Forestry . . . . . . . . . . . . . . . . . . . . . . . . . . . . . . . . . . . . . . . . . . . . . . . . . . . . . . . . . . . 71 28.6 6.8 10.5Fishing, hunting, and trapping . . . . . . . . . . . . . . . . . . . . . . . . . . . . . . . . . . . . . . . . . . 81 12.4 3.1 6.9
Public administration . . . . . . . . . . . . . . . . . . . . . . . . . . . . . . . . . . . . . . . . . . . . . . . . . . . . . . . . . . 5,957 44.1 16.9 6.1Executive and legislative offices . . . . . . . . . . . . . . . . . . . . . . . . . . . . . . . . . . . . . . . . . . . . . . . 162 64.9 5.6 6.2General government, n.e.c. . . . . . . . . . . . . . . . . . . . . . . . . . . . . . . . . . . . . . . . . . . . . . . . . . . . 620 52.1 18.3 5.6Justice, public order, and safety . . . . . . . . . . . . . . . . . . . . . . . . . . . . . . . . . . . . . . . . . . . . . . 2,298 31.7 14.1 6.7Public finance, taxation, and monetary policy . . . . . . . . . . . . . . . . . . . . . . . . . . . . . . . . . . . . 374 60.3 14.3 4.8Administration of human resources programs . . . . . . . . . . . . . . . . . . . . . . . . . . . . . . . . . . . . 858 67.5 26.0 7.6Administration of environmental quality and housing programs . . . . . . . . . . . . . . . . . . . . . . 272 38.1 16.7 2.2Administration of economic programs . . . . . . . . . . . . . . . . . . . . . . . . . . . . . . . . . . . . . . . . . . 589 43.9 14.3 6.3National security and international affairs . . . . . . . . . . . . . . . . . . . . . . . . . . . . . . . . . . . . . . . 783 38.8 19.4 5.2
______________________________________________________________________________________________________
Note: N.e.c. is an abbreviation for "not elsewhere classified" and designates broad categories of industries which cannot be morespecifically identified. Generally, data for industries with fewer than 50,000 employed are not published separately but are includedin the totals for the appropriate categories shown.
Source: U.S. Department of Labor, Bureau of Labor Statistics.
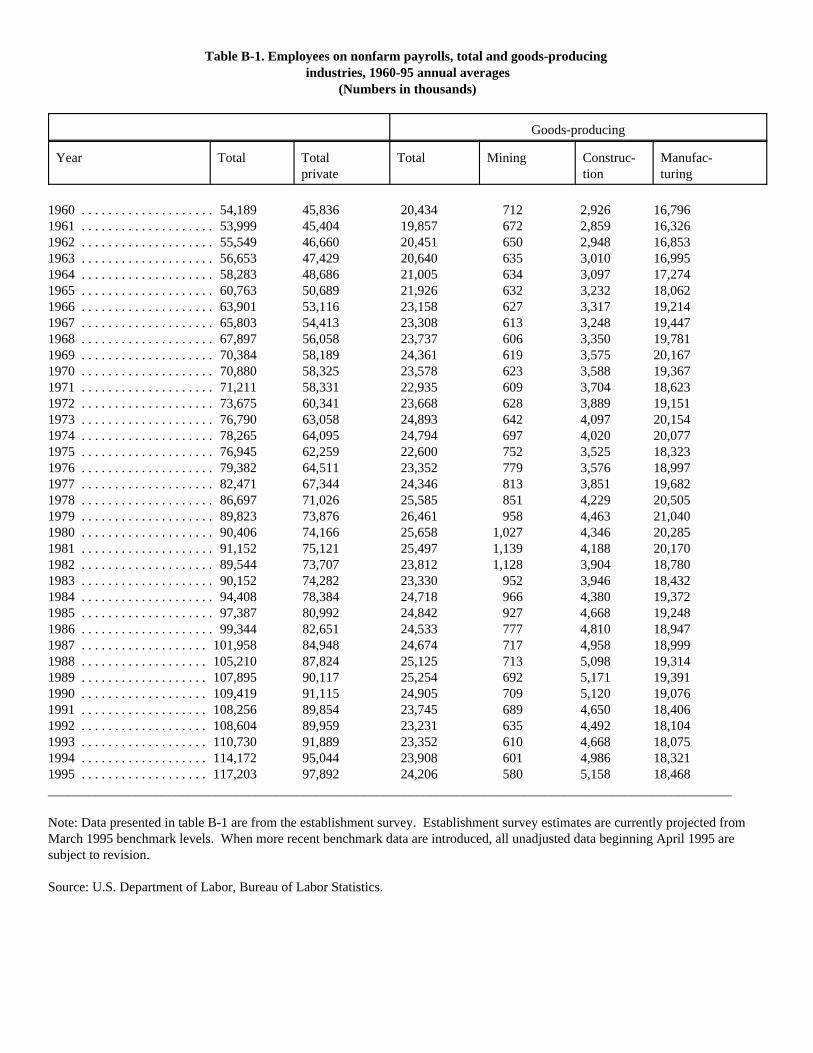
Table B-1. Employees on nonfarm payrolls, total and goods-producing industries, 1960-95 annual averages
(Numbers in thousands)
Goods-producing
Year Total Totalprivate
Total Mining Construc-tion
Manufac-turing
1960 . . . . . . . . . . . . . . . . . . . . 54,189 45,836 20,434 712 2,926 16,7961961 . . . . . . . . . . . . . . . . . . . . 53,999 45,404 19,857 672 2,859 16,3261962 . . . . . . . . . . . . . . . . . . . . 55,549 46,660 20,451 650 2,948 16,8531963 . . . . . . . . . . . . . . . . . . . . 56,653 47,429 20,640 635 3,010 16,9951964 . . . . . . . . . . . . . . . . . . . . 58,283 48,686 21,005 634 3,097 17,2741965 . . . . . . . . . . . . . . . . . . . . 60,763 50,689 21,926 632 3,232 18,0621966 . . . . . . . . . . . . . . . . . . . . 63,901 53,116 23,158 627 3,317 19,2141967 . . . . . . . . . . . . . . . . . . . . 65,803 54,413 23,308 613 3,248 19,4471968 . . . . . . . . . . . . . . . . . . . . 67,897 56,058 23,737 606 3,350 19,7811969 . . . . . . . . . . . . . . . . . . . . 70,384 58,189 24,361 619 3,575 20,1671970 . . . . . . . . . . . . . . . . . . . . 70,880 58,325 23,578 623 3,588 19,3671971 . . . . . . . . . . . . . . . . . . . . 71,211 58,331 22,935 609 3,704 18,6231972 . . . . . . . . . . . . . . . . . . . . 73,675 60,341 23,668 628 3,889 19,1511973 . . . . . . . . . . . . . . . . . . . . 76,790 63,058 24,893 642 4,097 20,1541974 . . . . . . . . . . . . . . . . . . . . 78,265 64,095 24,794 697 4,020 20,0771975 . . . . . . . . . . . . . . . . . . . . 76,945 62,259 22,600 752 3,525 18,3231976 . . . . . . . . . . . . . . . . . . . . 79,382 64,511 23,352 779 3,576 18,9971977 . . . . . . . . . . . . . . . . . . . . 82,471 67,344 24,346 813 3,851 19,6821978 . . . . . . . . . . . . . . . . . . . . 86,697 71,026 25,585 851 4,229 20,5051979 . . . . . . . . . . . . . . . . . . . . 89,823 73,876 26,461 958 4,463 21,0401980 . . . . . . . . . . . . . . . . . . . . 90,406 74,166 25,658 1,027 4,346 20,2851981 . . . . . . . . . . . . . . . . . . . . 91,152 75,121 25,497 1,139 4,188 20,1701982 . . . . . . . . . . . . . . . . . . . . 89,544 73,707 23,812 1,128 3,904 18,7801983 . . . . . . . . . . . . . . . . . . . . 90,152 74,282 23,330 952 3,946 18,4321984 . . . . . . . . . . . . . . . . . . . . 94,408 78,384 24,718 966 4,380 19,3721985 . . . . . . . . . . . . . . . . . . . . 97,387 80,992 24,842 927 4,668 19,2481986 . . . . . . . . . . . . . . . . . . . . 99,344 82,651 24,533 777 4,810 18,9471987 . . . . . . . . . . . . . . . . . . . 101,958 84,948 24,674 717 4,958 18,9991988 . . . . . . . . . . . . . . . . . . . 105,210 87,824 25,125 713 5,098 19,3141989 . . . . . . . . . . . . . . . . . . . 107,895 90,117 25,254 692 5,171 19,3911990 . . . . . . . . . . . . . . . . . . . 109,419 91,115 24,905 709 5,120 19,0761991 . . . . . . . . . . . . . . . . . . . 108,256 89,854 23,745 689 4,650 18,4061992 . . . . . . . . . . . . . . . . . . . 108,604 89,959 23,231 635 4,492 18,1041993 . . . . . . . . . . . . . . . . . . . 110,730 91,889 23,352 610 4,668 18,0751994 . . . . . . . . . . . . . . . . . . . 114,172 95,044 23,908 601 4,986 18,3211995 . . . . . . . . . . . . . . . . . . . 117,203 97,892 24,206 580 5,158 18,468______________________________________________________________________________________________________
Note: Data presented in table B-1 are from the establishment survey. Establishment survey estimates are currently projected fromMarch 1995 benchmark levels. When more recent benchmark data are introduced, all unadjusted data beginning April 1995 aresubject to revision.
Source: U.S. Department of Labor, Bureau of Labor Statistics.
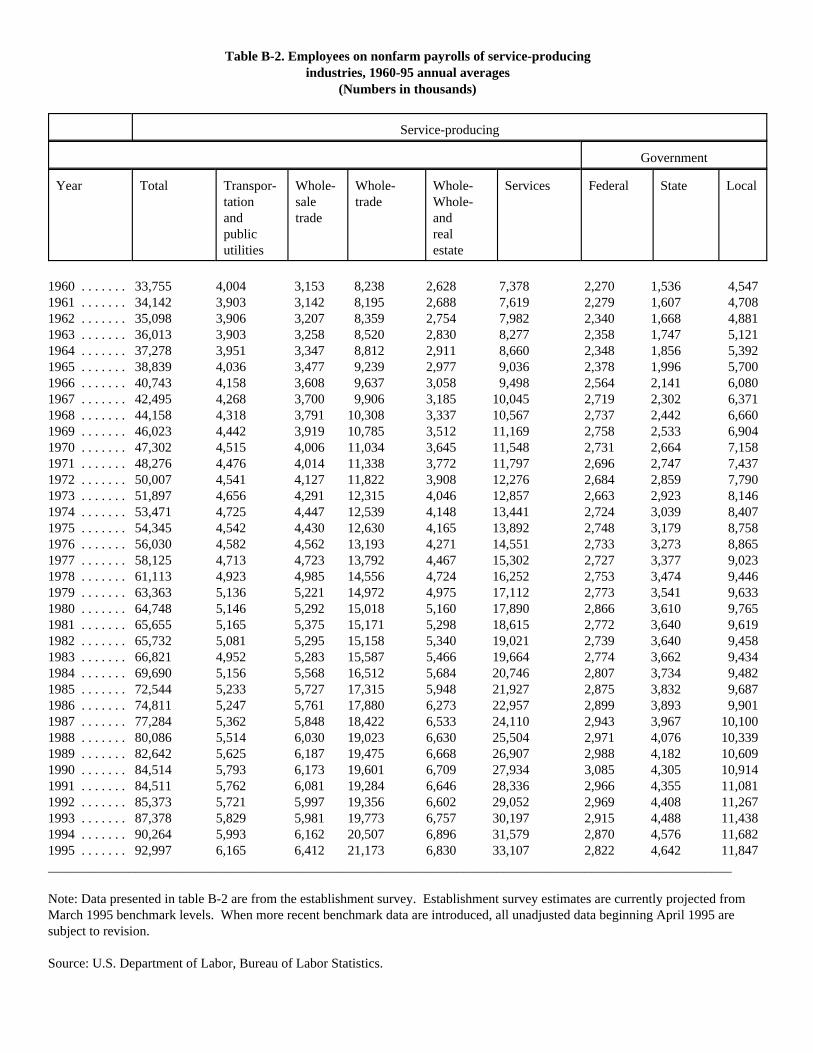
Table B-2. Employees on nonfarm payrolls of service-producing industries, 1960-95 annual averages
(Numbers in thousands)
Service-producing
Government
Year Total Transpor-tationandpublicutilities
Whole-saletrade
Whole-trade
Whole-Whole-andreal estate
Services Federal State Local
1960 . . . . . . . 33,755 4,004 3,153 8,238 2,628 7,378 2,270 1,536 4,5471961 . . . . . . . 34,142 3,903 3,142 8,195 2,688 7,619 2,279 1,607 4,7081962 . . . . . . . 35,098 3,906 3,207 8,359 2,754 7,982 2,340 1,668 4,8811963 . . . . . . . 36,013 3,903 3,258 8,520 2,830 8,277 2,358 1,747 5,1211964 . . . . . . . 37,278 3,951 3,347 8,812 2,911 8,660 2,348 1,856 5,3921965 . . . . . . . 38,839 4,036 3,477 9,239 2,977 9,036 2,378 1,996 5,7001966 . . . . . . . 40,743 4,158 3,608 9,637 3,058 9,498 2,564 2,141 6,0801967 . . . . . . . 42,495 4,268 3,700 9,906 3,185 10,045 2,719 2,302 6,3711968 . . . . . . . 44,158 4,318 3,791 10,308 3,337 10,567 2,737 2,442 6,6601969 . . . . . . . 46,023 4,442 3,919 10,785 3,512 11,169 2,758 2,533 6,9041970 . . . . . . . 47,302 4,515 4,006 11,034 3,645 11,548 2,731 2,664 7,1581971 . . . . . . . 48,276 4,476 4,014 11,338 3,772 11,797 2,696 2,747 7,4371972 . . . . . . . 50,007 4,541 4,127 11,822 3,908 12,276 2,684 2,859 7,7901973 . . . . . . . 51,897 4,656 4,291 12,315 4,046 12,857 2,663 2,923 8,1461974 . . . . . . . 53,471 4,725 4,447 12,539 4,148 13,441 2,724 3,039 8,4071975 . . . . . . . 54,345 4,542 4,430 12,630 4,165 13,892 2,748 3,179 8,7581976 . . . . . . . 56,030 4,582 4,562 13,193 4,271 14,551 2,733 3,273 8,8651977 . . . . . . . 58,125 4,713 4,723 13,792 4,467 15,302 2,727 3,377 9,0231978 . . . . . . . 61,113 4,923 4,985 14,556 4,724 16,252 2,753 3,474 9,4461979 . . . . . . . 63,363 5,136 5,221 14,972 4,975 17,112 2,773 3,541 9,6331980 . . . . . . . 64,748 5,146 5,292 15,018 5,160 17,890 2,866 3,610 9,7651981 . . . . . . . 65,655 5,165 5,375 15,171 5,298 18,615 2,772 3,640 9,6191982 . . . . . . . 65,732 5,081 5,295 15,158 5,340 19,021 2,739 3,640 9,4581983 . . . . . . . 66,821 4,952 5,283 15,587 5,466 19,664 2,774 3,662 9,4341984 . . . . . . . 69,690 5,156 5,568 16,512 5,684 20,746 2,807 3,734 9,4821985 . . . . . . . 72,544 5,233 5,727 17,315 5,948 21,927 2,875 3,832 9,6871986 . . . . . . . 74,811 5,247 5,761 17,880 6,273 22,957 2,899 3,893 9,9011987 . . . . . . . 77,284 5,362 5,848 18,422 6,533 24,110 2,943 3,967 10,1001988 . . . . . . . 80,086 5,514 6,030 19,023 6,630 25,504 2,971 4,076 10,3391989 . . . . . . . 82,642 5,625 6,187 19,475 6,668 26,907 2,988 4,182 10,6091990 . . . . . . . 84,514 5,793 6,173 19,601 6,709 27,934 3,085 4,305 10,9141991 . . . . . . . 84,511 5,762 6,081 19,284 6,646 28,336 2,966 4,355 11,0811992 . . . . . . . 85,373 5,721 5,997 19,356 6,602 29,052 2,969 4,408 11,2671993 . . . . . . . 87,378 5,829 5,981 19,773 6,757 30,197 2,915 4,488 11,4381994 . . . . . . . 90,264 5,993 6,162 20,507 6,896 31,579 2,870 4,576 11,6821995 . . . . . . . 92,997 6,165 6,412 21,173 6,830 33,107 2,822 4,642 11,847______________________________________________________________________________________________________
Note: Data presented in table B-2 are from the establishment survey. Establishment survey estimates are currently projected fromMarch 1995 benchmark levels. When more recent benchmark data are introduced, all unadjusted data beginning April 1995 aresubject to revision.
Source: U.S. Department of Labor, Bureau of Labor Statistics.
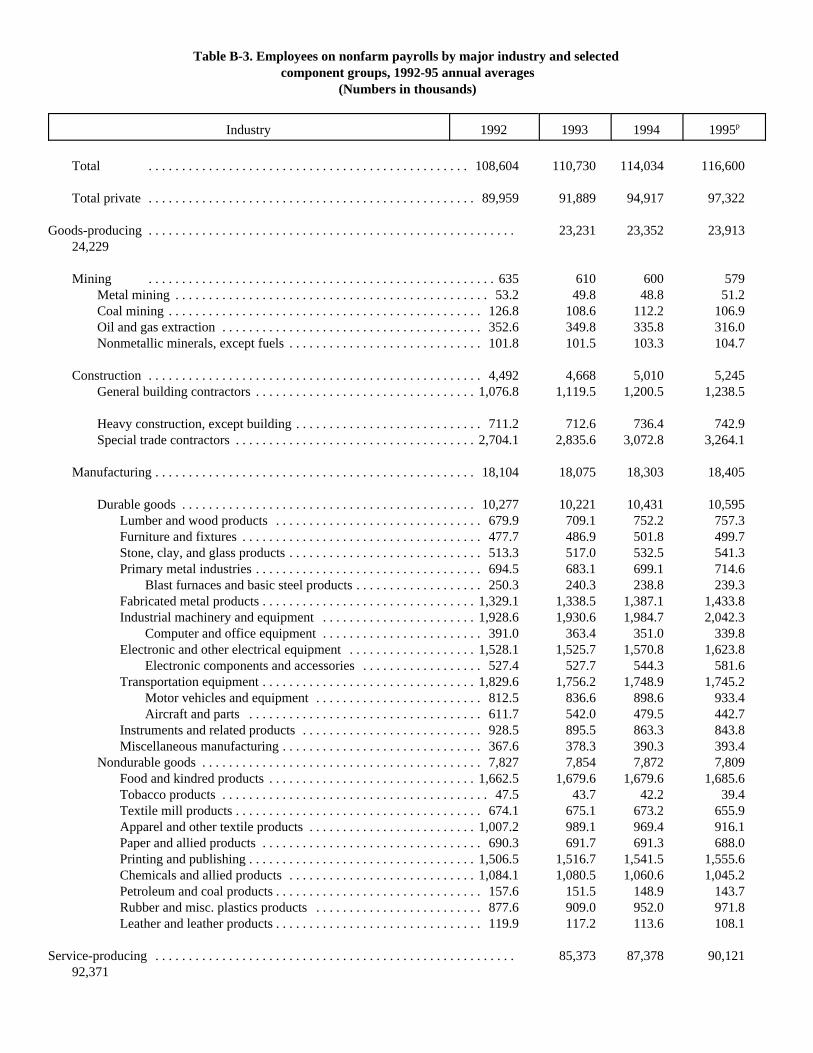
Table B-3. Employees on nonfarm payrolls by major industry and selected component groups, 1992-95 annual averages
(Numbers in thousands)
Industry 1992 1993 1994 1995p
Total . . . . . . . . . . . . . . . . . . . . . . . . . . . . . . . . . . . . . . . . . . . . . . . . 108,604 110,730 114,034 116,600
Total private . . . . . . . . . . . . . . . . . . . . . . . . . . . . . . . . . . . . . . . . . . . . . . . . . 89,959 91,889 94,917 97,322
Goods-producing . . . . . . . . . . . . . . . . . . . . . . . . . . . . . . . . . . . . . . . . . . . . . . . . . . . . . . . 23,231 23,352 23,91324,229
Mining . . . . . . . . . . . . . . . . . . . . . . . . . . . . . . . . . . . . . . . . . . . . . . . . . . . . 635 610 600 579Metal mining . . . . . . . . . . . . . . . . . . . . . . . . . . . . . . . . . . . . . . . . . . . . . . . 53.2 49.8 48.8 51.2Coal mining . . . . . . . . . . . . . . . . . . . . . . . . . . . . . . . . . . . . . . . . . . . . . . . 126.8 108.6 112.2 106.9Oil and gas extraction . . . . . . . . . . . . . . . . . . . . . . . . . . . . . . . . . . . . . . . 352.6 349.8 335.8 316.0Nonmetallic minerals, except fuels . . . . . . . . . . . . . . . . . . . . . . . . . . . . . 101.8 101.5 103.3 104.7
Construction . . . . . . . . . . . . . . . . . . . . . . . . . . . . . . . . . . . . . . . . . . . . . . . . . . 4,492 4,668 5,010 5,245General building contractors . . . . . . . . . . . . . . . . . . . . . . . . . . . . . . . . . 1,076.8 1,119.5 1,200.5 1,238.5
Heavy construction, except building . . . . . . . . . . . . . . . . . . . . . . . . . . . . 711.2 712.6 736.4 742.9Special trade contractors . . . . . . . . . . . . . . . . . . . . . . . . . . . . . . . . . . . . 2,704.1 2,835.6 3,072.8 3,264.1
Manufacturing . . . . . . . . . . . . . . . . . . . . . . . . . . . . . . . . . . . . . . . . . . . . . . . . 18,104 18,075 18,303 18,405
Durable goods . . . . . . . . . . . . . . . . . . . . . . . . . . . . . . . . . . . . . . . . . . . . 10,277 10,221 10,431 10,595Lumber and wood products . . . . . . . . . . . . . . . . . . . . . . . . . . . . . . . 679.9 709.1 752.2 757.3Furniture and fixtures . . . . . . . . . . . . . . . . . . . . . . . . . . . . . . . . . . . . 477.7 486.9 501.8 499.7Stone, clay, and glass products . . . . . . . . . . . . . . . . . . . . . . . . . . . . . 513.3 517.0 532.5 541.3Primary metal industries . . . . . . . . . . . . . . . . . . . . . . . . . . . . . . . . . . 694.5 683.1 699.1 714.6
Blast furnaces and basic steel products . . . . . . . . . . . . . . . . . . . 250.3 240.3 238.8 239.3Fabricated metal products . . . . . . . . . . . . . . . . . . . . . . . . . . . . . . . . 1,329.1 1,338.5 1,387.1 1,433.8Industrial machinery and equipment . . . . . . . . . . . . . . . . . . . . . . . 1,928.6 1,930.6 1,984.7 2,042.3
Computer and office equipment . . . . . . . . . . . . . . . . . . . . . . . . 391.0 363.4 351.0 339.8Electronic and other electrical equipment . . . . . . . . . . . . . . . . . . . 1,528.1 1,525.7 1,570.8 1,623.8
Electronic components and accessories . . . . . . . . . . . . . . . . . . 527.4 527.7 544.3 581.6Transportation equipment . . . . . . . . . . . . . . . . . . . . . . . . . . . . . . . . 1,829.6 1,756.2 1,748.9 1,745.2
Motor vehicles and equipment . . . . . . . . . . . . . . . . . . . . . . . . . 812.5 836.6 898.6 933.4Aircraft and parts . . . . . . . . . . . . . . . . . . . . . . . . . . . . . . . . . . . 611.7 542.0 479.5 442.7
Instruments and related products . . . . . . . . . . . . . . . . . . . . . . . . . . . 928.5 895.5 863.3 843.8Miscellaneous manufacturing . . . . . . . . . . . . . . . . . . . . . . . . . . . . . . 367.6 378.3 390.3 393.4
Nondurable goods . . . . . . . . . . . . . . . . . . . . . . . . . . . . . . . . . . . . . . . . . . 7,827 7,854 7,872 7,809Food and kindred products . . . . . . . . . . . . . . . . . . . . . . . . . . . . . . . 1,662.5 1,679.6 1,679.6 1,685.6Tobacco products . . . . . . . . . . . . . . . . . . . . . . . . . . . . . . . . . . . . . . . . 47.5 43.7 42.2 39.4Textile mill products . . . . . . . . . . . . . . . . . . . . . . . . . . . . . . . . . . . . . 674.1 675.1 673.2 655.9Apparel and other textile products . . . . . . . . . . . . . . . . . . . . . . . . . 1,007.2 989.1 969.4 916.1Paper and allied products . . . . . . . . . . . . . . . . . . . . . . . . . . . . . . . . . 690.3 691.7 691.3 688.0Printing and publishing . . . . . . . . . . . . . . . . . . . . . . . . . . . . . . . . . . 1,506.5 1,516.7 1,541.5 1,555.6Chemicals and allied products . . . . . . . . . . . . . . . . . . . . . . . . . . . . 1,084.1 1,080.5 1,060.6 1,045.2Petroleum and coal products . . . . . . . . . . . . . . . . . . . . . . . . . . . . . . . 157.6 151.5 148.9 143.7Rubber and misc. plastics products . . . . . . . . . . . . . . . . . . . . . . . . . 877.6 909.0 952.0 971.8Leather and leather products . . . . . . . . . . . . . . . . . . . . . . . . . . . . . . . 119.9 117.2 113.6 108.1
Service-producing . . . . . . . . . . . . . . . . . . . . . . . . . . . . . . . . . . . . . . . . . . . . . . . . . . . . . . 85,373 87,378 90,12192,371

Transportation and public utilities . . . . . . . . . . . . . . . . . . . . . . . . . . . . . . . . . 5,721 5,829 6,006 6,193Transportation . . . . . . . . . . . . . . . . . . . . . . . . . . . . . . . . . . . . . . . . . . . . . 3,498 3,615 3,775 3,929
Railroad transportation . . . . . . . . . . . . . . . . . . . . . . . . . . . . . . . . . . . 254.3 248.3 240.5 238.5Local and interurban passenger transit . . . . . . . . . . . . . . . . . . . . . . . 361.4 379.4 410.3 447.6Trucking and warehousing . . . . . . . . . . . . . . . . . . . . . . . . . . . . . . . 1,611.2 1,698.1 1,797.3 1,878.1Water transportation . . . . . . . . . . . . . . . . . . . . . . . . . . . . . . . . . . . . . 173.3 168.2 168.8 159.7Transportation by air . . . . . . . . . . . . . . . . . . . . . . . . . . . . . . . . . . . . 730.1 740.1 747.8 765.1Pipelines, except natural gas . . . . . . . . . . . . . . . . . . . . . . . . . . . . . . . . 19.2 18.4 17.6 16.5Transportation services . . . . . . . . . . . . . . . . . . . . . . . . . . . . . . . . . . . 348.4 362.5 392.4 423.2
Communications and public utilities . . . . . . . . . . . . . . . . . . . . . . . . . . . . 2,223 2,214 2,231 2,265Communications . . . . . . . . . . . . . . . . . . . . . . . . . . . . . . . . . . . . . . . 1,268.9 1,269.1 1,304.6 1,358.2
Electric, gas, and sanitary services . . . . . . . . . . . . . . . . . . . . . . . . . . 954.0 944.4 926.5 906.3
Wholesale trade . . . . . . . . . . . . . . . . . . . . . . . . . . . . . . . . . . . . . . . . . . . . . . . . 5,997 5,981 6,140 6,322Durable goods . . . . . . . . . . . . . . . . . . . . . . . . . . . . . . . . . . . . . . . . . . . . . 3,446 3,433 3,542 3,668Nondurable goods . . . . . . . . . . . . . . . . . . . . . . . . . . . . . . . . . . . . . . . . . . 2,552 2,549 2,599 2,653
Retail trade . . . . . . . . . . . . . . . . . . . . . . . . . . . . . . . . . . . . . . . . . . . . . . . . . 19,356 19,773 20,437 20,836Building materials and garden supplies . . . . . . . . . . . . . . . . . . . . . . . . . . 757.7 779.0 828.0 852.8General merchandise stores . . . . . . . . . . . . . . . . . . . . . . . . . . . . . . . . . . 2,451.0 2,488.3 2,545.4 2,538.4
Department stores . . . . . . . . . . . . . . . . . . . . . . . . . . . . . . . . . . . . . . 2,080.0 2,140.1 2,211.9 2,220.8Food stores . . . . . . . . . . . . . . . . . . . . . . . . . . . . . . . . . . . . . . . . . . . . . . 3,179.8 3,224.1 3,289.1 3,354.9Automotive dealers and service stations . . . . . . . . . . . . . . . . . . . . . . . . 1,966.3 2,013.8 2,122.5 2,213.2
New and used car dealers . . . . . . . . . . . . . . . . . . . . . . . . . . . . . . . . . 875.4 908.3 964.4 1,002.8Apparel and accessory stores . . . . . . . . . . . . . . . . . . . . . . . . . . . . . . . . 1,130.9 1,143.6 1,134.0 1,091.9Furniture and home furnishings stores . . . . . . . . . . . . . . . . . . . . . . . . . . 799.8 827.5 890.0 949.6Eating and drinking places . . . . . . . . . . . . . . . . . . . . . . . . . . . . . . . . . . 6,609.3 6,821.4 7,069.0 7,224.2Miscellaneous retail establishments . . . . . . . . . . . . . . . . . . . . . . . . . . . 2,461.4 2,475.5 2,559.5 2,610.7
Finance, insurance, and real estate . . . . . . . . . . . . . . . . . . . . . . . . . . . . . . . . . 6,602 6,757 6,933 6,948Finance . . . . . . . . . . . . . . . . . . . . . . . . . . . . . . . . . . . . . . . . . . . . . . . . . . 3,160 3,238 3,323 3,316
Depository institutions . . . . . . . . . . . . . . . . . . . . . . . . . . . . . . . . . . 2,095.7 2,088.8 2,075.4 2,055.8Commercial banks . . . . . . . . . . . . . . . . . . . . . . . . . . . . . . . . . . 1,489.5 1,497.2 1,492.3 1,492.0Savings institutions . . . . . . . . . . . . . . . . . . . . . . . . . . . . . . . . . . 345.9 324.1 307.7 282.9
Nondepository institutions . . . . . . . . . . . . . . . . . . . . . . . . . . . . . . . . 405.5 454.9 498.5 485.9Mortgage bankers and brokers . . . . . . . . . . . . . . . . . . . . . . . . . 180.2 224.8 256.5 229.1
Security and commodity brokers . . . . . . . . . . . . . . . . . . . . . . . . . . . 440.1 471.6 518.0 530.3Holding and other investment offices . . . . . . . . . . . . . . . . . . . . . . . . 219.0 222.6 231.4 243.6
Insurance . . . . . . . . . . . . . . . . . . . . . . . . . . . . . . . . . . . . . . . . . . . . . . . . . 2,152 2,197 2,237 23,243Insurance carriers . . . . . . . . . . . . . . . . . . . . . . . . . . . . . . . . . . . . . . 1,495.6 1,529.0 1,550.7 1,538.5Insurance agents, brokers, and service . . . . . . . . . . . . . . . . . . . . . . . 656.6 668.0 686.4 704.8
Real estate . . . . . . . . . . . . . . . . . . . . . . . . . . . . . . . . . . . . . . . . . . . . . . . . 1,290 1,322 1,373 1,389
Servicesa . . . . . . . . . . . . . . . . . . . . . . . . . . . . . . . . . . . . . . . . . . . . . . . . . 29,052 30,197 31,488 32,794Agricultural services . . . . . . . . . . . . . . . . . . . . . . . . . . . . . . . . . . . . . . . . 489.6 519.0 565.2 586.2Hotels and other lodging places . . . . . . . . . . . . . . . . . . . . . . . . . . . . . . 1,576.4 1,595.7 1,618.0 1,625.7Personal services . . . . . . . . . . . . . . . . . . . . . . . . . . . . . . . . . . . . . . . . . . 1,116.2 1,137.1 1,139.3 1,145.7Business services . . . . . . . . . . . . . . . . . . . . . . . . . . . . . . . . . . . . . . . . . . 5,315.3 5,734.7 6,239.0 6,639.6
Services to buildings . . . . . . . . . . . . . . . . . . . . . . . . . . . . . . . . . . . . . 805.4 823.0 854.5 877.7Personnel supply services . . . . . . . . . . . . . . . . . . . . . . . . . . . . . . . . 1,629.3 1,906.1 2,253.6 2,410.6
Help supply services . . . . . . . . . . . . . . . . . . . . . . . . . . . . . . . . 1,410.6 1,669.2 2,001.7 2,134.6Computer and data processing services . . . . . . . . . . . . . . . . . . . . . . 835.5 829.8 950.0 1,048.6
Auto repair, services, and parking . . . . . . . . . . . . . . . . . . . . . . . . . . . . . . 881.3 924.7 970.5 1,025.5Miscellaneous repair services . . . . . . . . . . . . . . . . . . . . . . . . . . . . . . . . . 347.0 348.5 333.9 342.4Motion pictures . . . . . . . . . . . . . . . . . . . . . . . . . . . . . . . . . . . . . . . . . . . . 400.9 412.0 471.2 586.0Amusement and recreation services . . . . . . . . . . . . . . . . . . . . . . . . . . . 1,188.1 1,258.2 1,344.1 1,469.9Health services . . . . . . . . . . . . . . . . . . . . . . . . . . . . . . . . . . . . . . . . . . . 8,490.0 8,755.9 9,000.7 9,269.9
Offices and clinics of medical doctors . . . . . . . . . . . . . . . . . . . . . . 1,463.1 1,506.0 1,540.5 1,587.5
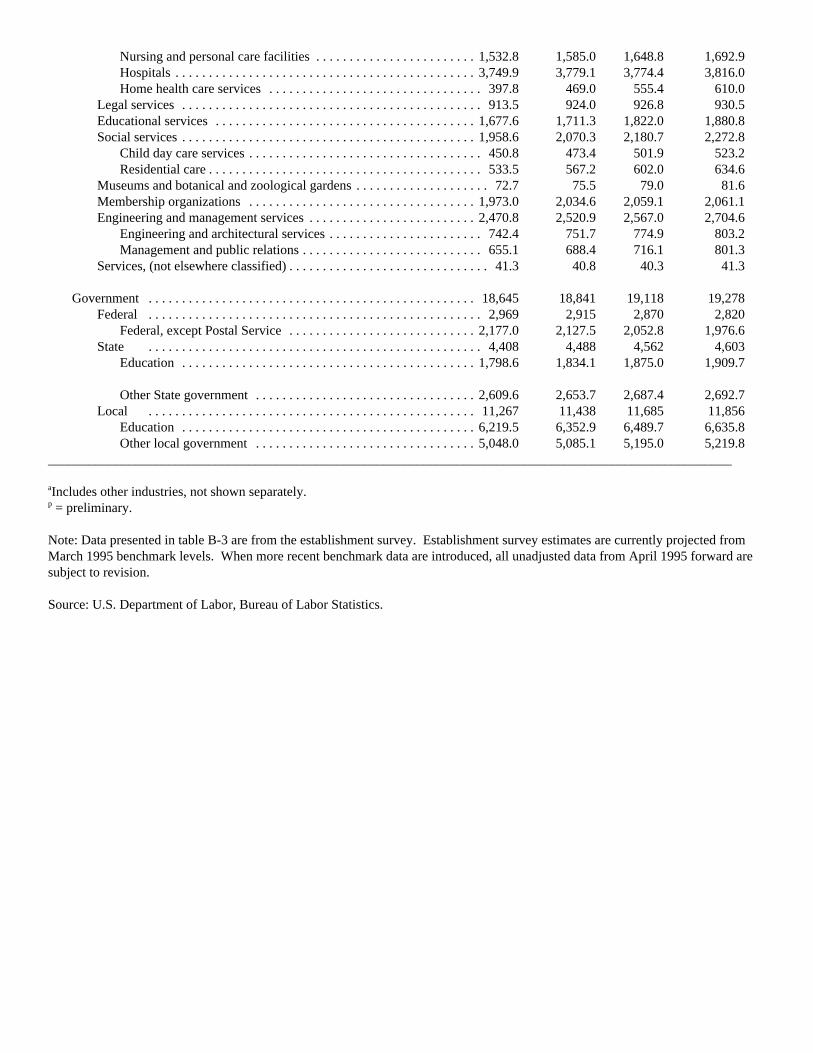
Nursing and personal care facilities . . . . . . . . . . . . . . . . . . . . . . . . 1,532.8 1,585.0 1,648.8 1,692.9Hospitals . . . . . . . . . . . . . . . . . . . . . . . . . . . . . . . . . . . . . . . . . . . . . 3,749.9 3,779.1 3,774.4 3,816.0Home health care services . . . . . . . . . . . . . . . . . . . . . . . . . . . . . . . . 397.8 469.0 555.4 610.0
Legal services . . . . . . . . . . . . . . . . . . . . . . . . . . . . . . . . . . . . . . . . . . . . . 913.5 924.0 926.8 930.5Educational services . . . . . . . . . . . . . . . . . . . . . . . . . . . . . . . . . . . . . . . 1,677.6 1,711.3 1,822.0 1,880.8Social services . . . . . . . . . . . . . . . . . . . . . . . . . . . . . . . . . . . . . . . . . . . . 1,958.6 2,070.3 2,180.7 2,272.8
Child day care services . . . . . . . . . . . . . . . . . . . . . . . . . . . . . . . . . . . 450.8 473.4 501.9 523.2Residential care . . . . . . . . . . . . . . . . . . . . . . . . . . . . . . . . . . . . . . . . . 533.5 567.2 602.0 634.6
Museums and botanical and zoological gardens . . . . . . . . . . . . . . . . . . . . 72.7 75.5 79.0 81.6Membership organizations . . . . . . . . . . . . . . . . . . . . . . . . . . . . . . . . . . 1,973.0 2,034.6 2,059.1 2,061.1Engineering and management services . . . . . . . . . . . . . . . . . . . . . . . . . 2,470.8 2,520.9 2,567.0 2,704.6
Engineering and architectural services . . . . . . . . . . . . . . . . . . . . . . . 742.4 751.7 774.9 803.2Management and public relations . . . . . . . . . . . . . . . . . . . . . . . . . . . 655.1 688.4 716.1 801.3
Services, (not elsewhere classified) . . . . . . . . . . . . . . . . . . . . . . . . . . . . . . 41.3 40.8 40.3 41.3
Government . . . . . . . . . . . . . . . . . . . . . . . . . . . . . . . . . . . . . . . . . . . . . . . . . 18,645 18,841 19,118 19,278Federal . . . . . . . . . . . . . . . . . . . . . . . . . . . . . . . . . . . . . . . . . . . . . . . . . . 2,969 2,915 2,870 2,820
Federal, except Postal Service . . . . . . . . . . . . . . . . . . . . . . . . . . . . 2,177.0 2,127.5 2,052.8 1,976.6State . . . . . . . . . . . . . . . . . . . . . . . . . . . . . . . . . . . . . . . . . . . . . . . . . . 4,408 4,488 4,562 4,603
Education . . . . . . . . . . . . . . . . . . . . . . . . . . . . . . . . . . . . . . . . . . . . 1,798.6 1,834.1 1,875.0 1,909.7
Other State government . . . . . . . . . . . . . . . . . . . . . . . . . . . . . . . . . 2,609.6 2,653.7 2,687.4 2,692.7Local . . . . . . . . . . . . . . . . . . . . . . . . . . . . . . . . . . . . . . . . . . . . . . . . . 11,267 11,438 11,685 11,856
Education . . . . . . . . . . . . . . . . . . . . . . . . . . . . . . . . . . . . . . . . . . . . 6,219.5 6,352.9 6,489.7 6,635.8Other local government . . . . . . . . . . . . . . . . . . . . . . . . . . . . . . . . . 5,048.0 5,085.1 5,195.0 5,219.8
______________________________________________________________________________________________________
aIncludes other industries, not shown separately.p = preliminary.
Note: Data presented in table B-3 are from the establishment survey. Establishment survey estimates are currently projected fromMarch 1995 benchmark levels. When more recent benchmark data are introduced, all unadjusted data from April 1995 forward aresubject to revision.
Source: U.S. Department of Labor, Bureau of Labor Statistics.
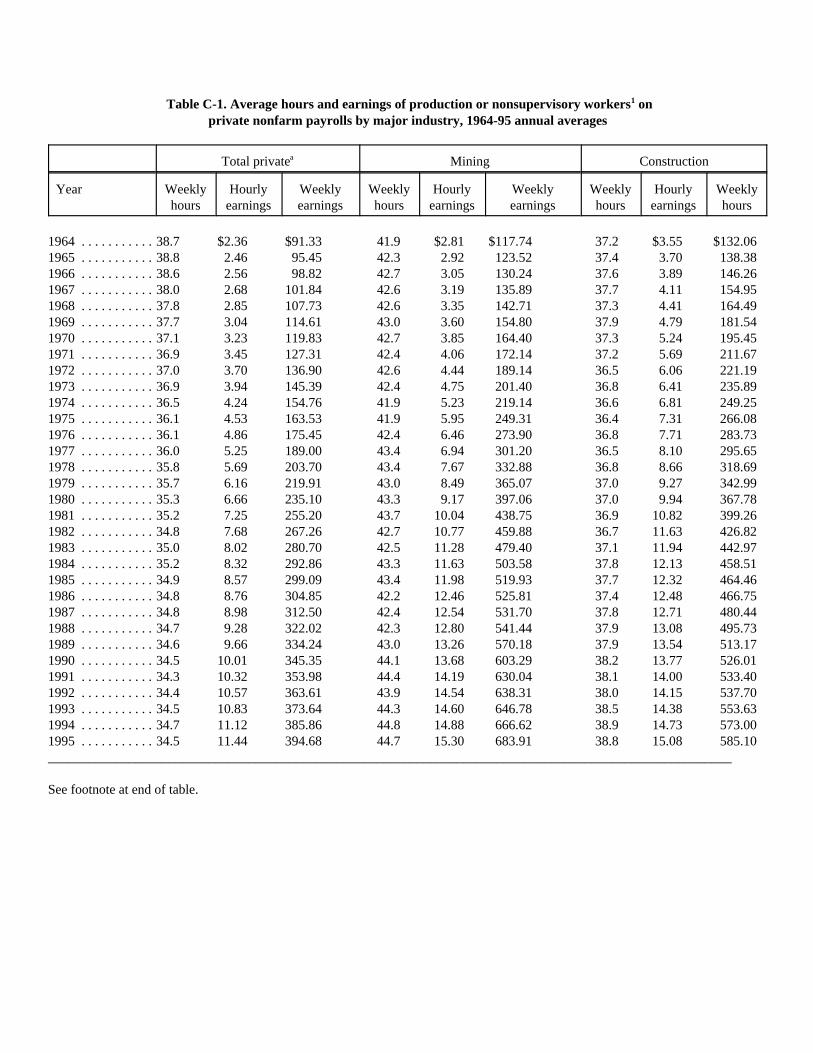
Table C-1. Average hours and earnings of production or nonsupervisory workers1 onprivate nonfarm payrolls by major industry, 1964-95 annual averages
Total privatea Mining Construction
Year Weeklyhours
Hourlyearnings
Weeklyearnings
Weeklyhours
Hourlyearnings
Weeklyearnings
Weeklyhours
Hourlyearnings
Weeklyhours
1964 . . . . . . . . . . . 38.7 $2.36 $91.33 41.9 $2.81 $117.74 37.2 $3.55 $132.061965 . . . . . . . . . . . 38.8 2.46 95.45 42.3 2.92 123.52 37.4 3.70 138.381966 . . . . . . . . . . . 38.6 2.56 98.82 42.7 3.05 130.24 37.6 3.89 146.261967 . . . . . . . . . . . 38.0 2.68 101.84 42.6 3.19 135.89 37.7 4.11 154.951968 . . . . . . . . . . . 37.8 2.85 107.73 42.6 3.35 142.71 37.3 4.41 164.491969 . . . . . . . . . . . 37.7 3.04 114.61 43.0 3.60 154.80 37.9 4.79 181.541970 . . . . . . . . . . . 37.1 3.23 119.83 42.7 3.85 164.40 37.3 5.24 195.451971 . . . . . . . . . . . 36.9 3.45 127.31 42.4 4.06 172.14 37.2 5.69 211.671972 . . . . . . . . . . . 37.0 3.70 136.90 42.6 4.44 189.14 36.5 6.06 221.191973 . . . . . . . . . . . 36.9 3.94 145.39 42.4 4.75 201.40 36.8 6.41 235.891974 . . . . . . . . . . . 36.5 4.24 154.76 41.9 5.23 219.14 36.6 6.81 249.251975 . . . . . . . . . . . 36.1 4.53 163.53 41.9 5.95 249.31 36.4 7.31 266.081976 . . . . . . . . . . . 36.1 4.86 175.45 42.4 6.46 273.90 36.8 7.71 283.731977 . . . . . . . . . . . 36.0 5.25 189.00 43.4 6.94 301.20 36.5 8.10 295.651978 . . . . . . . . . . . 35.8 5.69 203.70 43.4 7.67 332.88 36.8 8.66 318.691979 . . . . . . . . . . . 35.7 6.16 219.91 43.0 8.49 365.07 37.0 9.27 342.991980 . . . . . . . . . . . 35.3 6.66 235.10 43.3 9.17 397.06 37.0 9.94 367.781981 . . . . . . . . . . . 35.2 7.25 255.20 43.7 10.04 438.75 36.9 10.82 399.261982 . . . . . . . . . . . 34.8 7.68 267.26 42.7 10.77 459.88 36.7 11.63 426.821983 . . . . . . . . . . . 35.0 8.02 280.70 42.5 11.28 479.40 37.1 11.94 442.971984 . . . . . . . . . . . 35.2 8.32 292.86 43.3 11.63 503.58 37.8 12.13 458.511985 . . . . . . . . . . . 34.9 8.57 299.09 43.4 11.98 519.93 37.7 12.32 464.461986 . . . . . . . . . . . 34.8 8.76 304.85 42.2 12.46 525.81 37.4 12.48 466.751987 . . . . . . . . . . . 34.8 8.98 312.50 42.4 12.54 531.70 37.8 12.71 480.441988 . . . . . . . . . . . 34.7 9.28 322.02 42.3 12.80 541.44 37.9 13.08 495.731989 . . . . . . . . . . . 34.6 9.66 334.24 43.0 13.26 570.18 37.9 13.54 513.171990 . . . . . . . . . . . 34.5 10.01 345.35 44.1 13.68 603.29 38.2 13.77 526.011991 . . . . . . . . . . . 34.3 10.32 353.98 44.4 14.19 630.04 38.1 14.00 533.401992 . . . . . . . . . . . 34.4 10.57 363.61 43.9 14.54 638.31 38.0 14.15 537.701993 . . . . . . . . . . . 34.5 10.83 373.64 44.3 14.60 646.78 38.5 14.38 553.631994 . . . . . . . . . . . 34.7 11.12 385.86 44.8 14.88 666.62 38.9 14.73 573.001995 . . . . . . . . . . . 34.5 11.44 394.68 44.7 15.30 683.91 38.8 15.08 585.10______________________________________________________________________________________________________
See footnote at end of table.
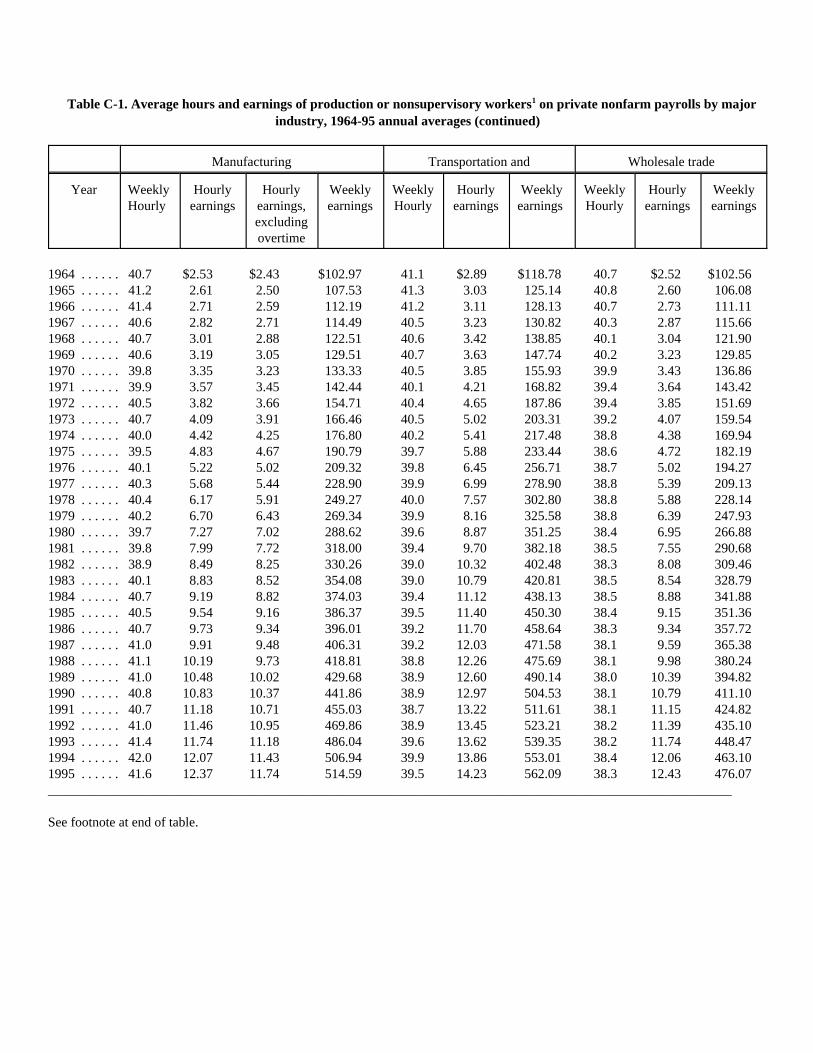
Table C-1. Average hours and earnings of production or nonsupervisory workers1 on private nonfarm payrolls by majorindustry, 1964-95 annual averages (continued)
Manufacturing Transportation and Wholesale trade
Year WeeklyHourly
Hourlyearnings
Hourlyearnings,excludingovertime
Weeklyearnings
WeeklyHourly
Hourlyearnings
Weeklyearnings
WeeklyHourly
Hourlyearnings
Weeklyearnings
1964 . . . . . . 40.7 $2.53 $2.43 $102.97 41.1 $2.89 $118.78 40.7 $2.52 $102.561965 . . . . . . 41.2 2.61 2.50 107.53 41.3 3.03 125.14 40.8 2.60 106.081966 . . . . . . 41.4 2.71 2.59 112.19 41.2 3.11 128.13 40.7 2.73 111.111967 . . . . . . 40.6 2.82 2.71 114.49 40.5 3.23 130.82 40.3 2.87 115.661968 . . . . . . 40.7 3.01 2.88 122.51 40.6 3.42 138.85 40.1 3.04 121.901969 . . . . . . 40.6 3.19 3.05 129.51 40.7 3.63 147.74 40.2 3.23 129.851970 . . . . . . 39.8 3.35 3.23 133.33 40.5 3.85 155.93 39.9 3.43 136.861971 . . . . . . 39.9 3.57 3.45 142.44 40.1 4.21 168.82 39.4 3.64 143.421972 . . . . . . 40.5 3.82 3.66 154.71 40.4 4.65 187.86 39.4 3.85 151.691973 . . . . . . 40.7 4.09 3.91 166.46 40.5 5.02 203.31 39.2 4.07 159.541974 . . . . . . 40.0 4.42 4.25 176.80 40.2 5.41 217.48 38.8 4.38 169.941975 . . . . . . 39.5 4.83 4.67 190.79 39.7 5.88 233.44 38.6 4.72 182.191976 . . . . . . 40.1 5.22 5.02 209.32 39.8 6.45 256.71 38.7 5.02 194.271977 . . . . . . 40.3 5.68 5.44 228.90 39.9 6.99 278.90 38.8 5.39 209.131978 . . . . . . 40.4 6.17 5.91 249.27 40.0 7.57 302.80 38.8 5.88 228.141979 . . . . . . 40.2 6.70 6.43 269.34 39.9 8.16 325.58 38.8 6.39 247.931980 . . . . . . 39.7 7.27 7.02 288.62 39.6 8.87 351.25 38.4 6.95 266.881981 . . . . . . 39.8 7.99 7.72 318.00 39.4 9.70 382.18 38.5 7.55 290.681982 . . . . . . 38.9 8.49 8.25 330.26 39.0 10.32 402.48 38.3 8.08 309.461983 . . . . . . 40.1 8.83 8.52 354.08 39.0 10.79 420.81 38.5 8.54 328.791984 . . . . . . 40.7 9.19 8.82 374.03 39.4 11.12 438.13 38.5 8.88 341.881985 . . . . . . 40.5 9.54 9.16 386.37 39.5 11.40 450.30 38.4 9.15 351.361986 . . . . . . 40.7 9.73 9.34 396.01 39.2 11.70 458.64 38.3 9.34 357.721987 . . . . . . 41.0 9.91 9.48 406.31 39.2 12.03 471.58 38.1 9.59 365.381988 . . . . . . 41.1 10.19 9.73 418.81 38.8 12.26 475.69 38.1 9.98 380.241989 . . . . . . 41.0 10.48 10.02 429.68 38.9 12.60 490.14 38.0 10.39 394.821990 . . . . . . 40.8 10.83 10.37 441.86 38.9 12.97 504.53 38.1 10.79 411.101991 . . . . . . 40.7 11.18 10.71 455.03 38.7 13.22 511.61 38.1 11.15 424.821992 . . . . . . 41.0 11.46 10.95 469.86 38.9 13.45 523.21 38.2 11.39 435.101993 . . . . . . 41.4 11.74 11.18 486.04 39.6 13.62 539.35 38.2 11.74 448.471994 . . . . . . 42.0 12.07 11.43 506.94 39.9 13.86 553.01 38.4 12.06 463.101995 . . . . . . 41.6 12.37 11.74 514.59 39.5 14.23 562.09 38.3 12.43 476.07______________________________________________________________________________________________________
See footnote at end of table.
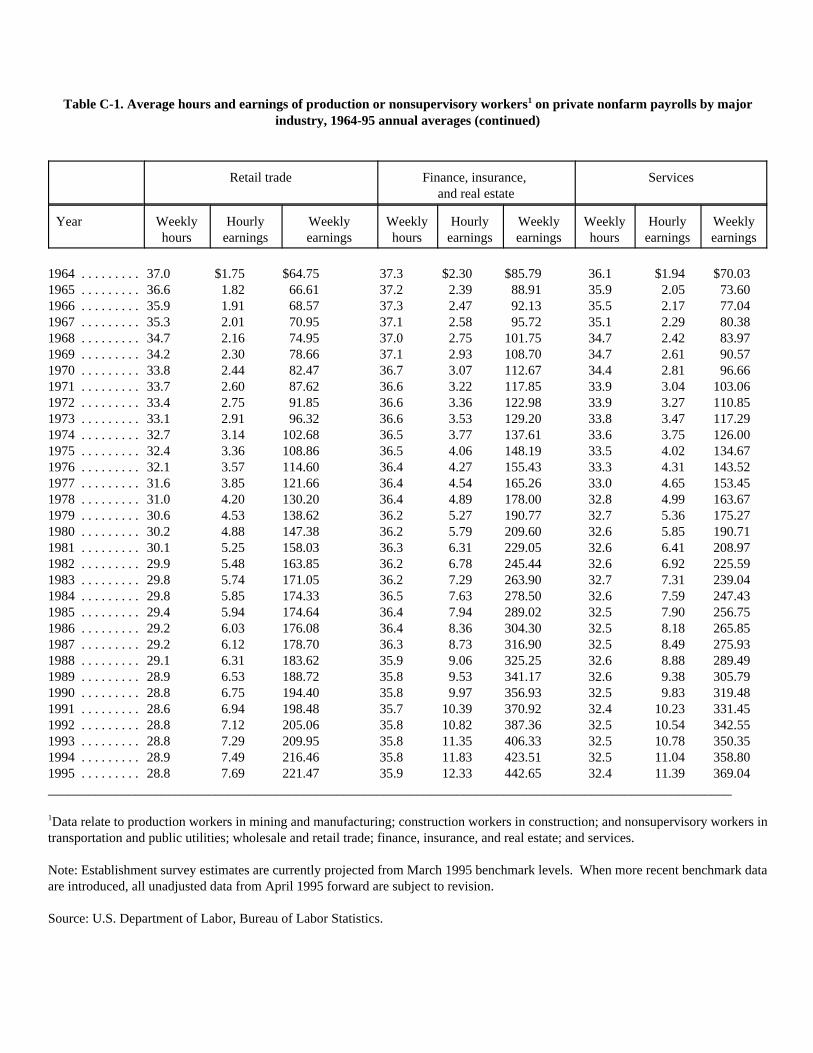
Table C-1. Average hours and earnings of production or nonsupervisory workers1 on private nonfarm payrolls by majorindustry, 1964-95 annual averages (continued)
Retail trade Finance, insurance, and real estate
Services
Year Weeklyhours
Hourlyearnings
Weeklyearnings
Weeklyhours
Hourlyearnings
Weeklyearnings
Weeklyhours
Hourlyearnings
Weeklyearnings
1964 . . . . . . . . . 37.0 $1.75 $64.75 37.3 $2.30 $85.79 36.1 $1.94 $70.031965 . . . . . . . . . 36.6 1.82 66.61 37.2 2.39 88.91 35.9 2.05 73.601966 . . . . . . . . . 35.9 1.91 68.57 37.3 2.47 92.13 35.5 2.17 77.041967 . . . . . . . . . 35.3 2.01 70.95 37.1 2.58 95.72 35.1 2.29 80.381968 . . . . . . . . . 34.7 2.16 74.95 37.0 2.75 101.75 34.7 2.42 83.971969 . . . . . . . . . 34.2 2.30 78.66 37.1 2.93 108.70 34.7 2.61 90.571970 . . . . . . . . . 33.8 2.44 82.47 36.7 3.07 112.67 34.4 2.81 96.661971 . . . . . . . . . 33.7 2.60 87.62 36.6 3.22 117.85 33.9 3.04 103.061972 . . . . . . . . . 33.4 2.75 91.85 36.6 3.36 122.98 33.9 3.27 110.851973 . . . . . . . . . 33.1 2.91 96.32 36.6 3.53 129.20 33.8 3.47 117.291974 . . . . . . . . . 32.7 3.14 102.68 36.5 3.77 137.61 33.6 3.75 126.001975 . . . . . . . . . 32.4 3.36 108.86 36.5 4.06 148.19 33.5 4.02 134.671976 . . . . . . . . . 32.1 3.57 114.60 36.4 4.27 155.43 33.3 4.31 143.521977 . . . . . . . . . 31.6 3.85 121.66 36.4 4.54 165.26 33.0 4.65 153.451978 . . . . . . . . . 31.0 4.20 130.20 36.4 4.89 178.00 32.8 4.99 163.671979 . . . . . . . . . 30.6 4.53 138.62 36.2 5.27 190.77 32.7 5.36 175.271980 . . . . . . . . . 30.2 4.88 147.38 36.2 5.79 209.60 32.6 5.85 190.711981 . . . . . . . . . 30.1 5.25 158.03 36.3 6.31 229.05 32.6 6.41 208.971982 . . . . . . . . . 29.9 5.48 163.85 36.2 6.78 245.44 32.6 6.92 225.591983 . . . . . . . . . 29.8 5.74 171.05 36.2 7.29 263.90 32.7 7.31 239.041984 . . . . . . . . . 29.8 5.85 174.33 36.5 7.63 278.50 32.6 7.59 247.431985 . . . . . . . . . 29.4 5.94 174.64 36.4 7.94 289.02 32.5 7.90 256.751986 . . . . . . . . . 29.2 6.03 176.08 36.4 8.36 304.30 32.5 8.18 265.851987 . . . . . . . . . 29.2 6.12 178.70 36.3 8.73 316.90 32.5 8.49 275.931988 . . . . . . . . . 29.1 6.31 183.62 35.9 9.06 325.25 32.6 8.88 289.491989 . . . . . . . . . 28.9 6.53 188.72 35.8 9.53 341.17 32.6 9.38 305.791990 . . . . . . . . . 28.8 6.75 194.40 35.8 9.97 356.93 32.5 9.83 319.481991 . . . . . . . . . 28.6 6.94 198.48 35.7 10.39 370.92 32.4 10.23 331.451992 . . . . . . . . . 28.8 7.12 205.06 35.8 10.82 387.36 32.5 10.54 342.551993 . . . . . . . . . 28.8 7.29 209.95 35.8 11.35 406.33 32.5 10.78 350.351994 . . . . . . . . . 28.9 7.49 216.46 35.8 11.83 423.51 32.5 11.04 358.801995 . . . . . . . . . 28.8 7.69 221.47 35.9 12.33 442.65 32.4 11.39 369.04______________________________________________________________________________________________________
1Data relate to production workers in mining and manufacturing; construction workers in construction; and nonsupervisory workers intransportation and public utilities; wholesale and retail trade; finance, insurance, and real estate; and services.
Note: Establishment survey estimates are currently projected from March 1995 benchmark levels. When more recent benchmark dataare introduced, all unadjusted data from April 1995 forward are subject to revision.
Source: U.S. Department of Labor, Bureau of Labor Statistics.
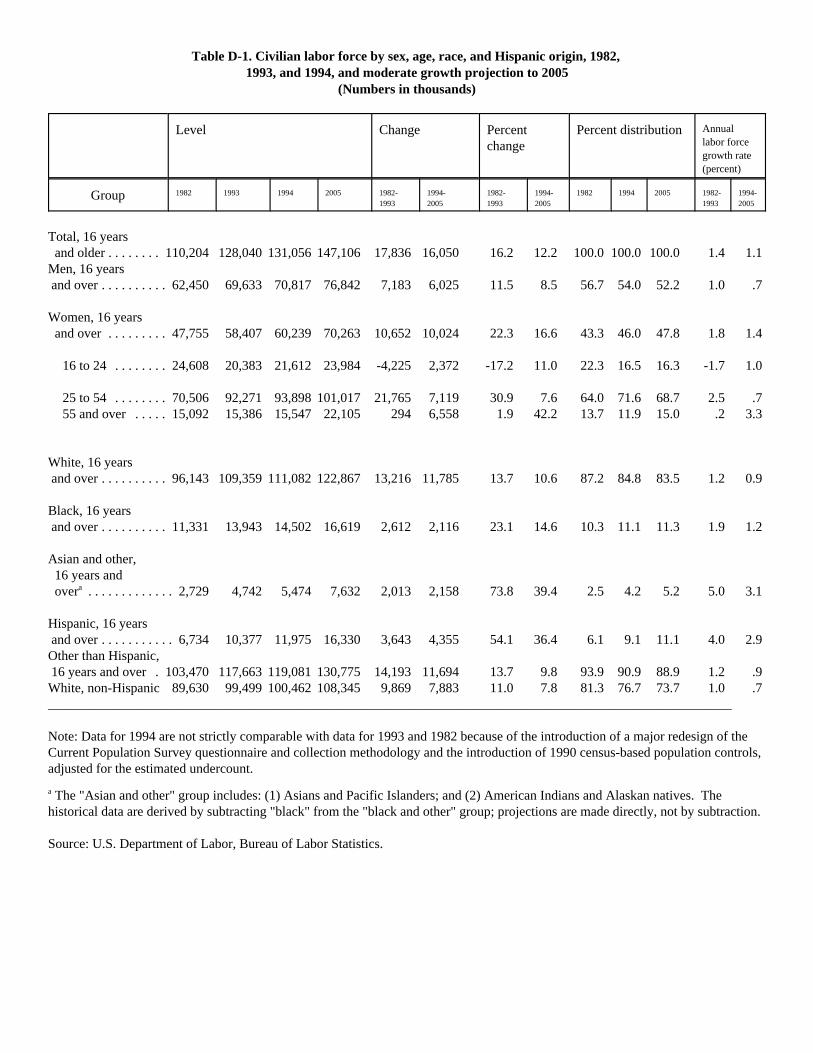
Table D-1. Civilian labor force by sex, age, race, and Hispanic origin, 1982, 1993, and 1994, and moderate growth projection to 2005
(Numbers in thousands)
Level Change Percent change
Percent distribution Annual labor force growth rate(percent)
Group 1982 1993 1994 2005 1982-1993
1994-2005
1982-1993
1994-2005
1982 1994 2005 1982-1993
1994-2005
Total, 16 years and older . . . . . . . . 110,204 128,040 131,056 147,106 17,836 16,050 16.2 12.2 100.0 100.0 100.0 1.4 1.1Men, 16 years and over . . . . . . . . . . 62,450 69,633 70,817 76,842 7,183 6,025 11.5 8.5 56.7 54.0 52.2 1.0 .7
Women, 16 years and over . . . . . . . . . 47,755 58,407 60,239 70,263 10,652 10,024 22.3 16.6 43.3 46.0 47.8 1.8 1.4
16 to 24 . . . . . . . . 24,608 20,383 21,612 23,984 -4,225 2,372 -17.2 11.0 22.3 16.5 16.3 -1.7 1.0
25 to 54 . . . . . . . . 70,506 92,271 93,898 101,017 21,765 7,119 30.9 7.6 64.0 71.6 68.7 2.5 .755 and over . . . . . 15,092 15,386 15,547 22,105 294 6,558 1.9 42.2 13.7 11.9 15.0 .2 3.3
White, 16 years and over . . . . . . . . . . 96,143 109,359 111,082 122,867 13,216 11,785 13.7 10.6 87.2 84.8 83.5 1.2 0.9
Black, 16 years and over . . . . . . . . . . 11,331 13,943 14,502 16,619 2,612 2,116 23.1 14.6 10.3 11.1 11.3 1.9 1.2
Asian and other, 16 years and overa . . . . . . . . . . . . . 2,729 4,742 5,474 7,632 2,013 2,158 73.8 39.4 2.5 4.2 5.2 5.0 3.1
Hispanic, 16 years and over . . . . . . . . . . . 6,734 10,377 11,975 16,330 3,643 4,355 54.1 36.4 6.1 9.1 11.1 4.0 2.9Other than Hispanic, 16 years and over . 103,470 117,663 119,081 130,775 14,193 11,694 13.7 9.8 93.9 90.9 88.9 1.2 .9White, non-Hispanic 89,630 99,499 100,462 108,345 9,869 7,883 11.0 7.8 81.3 76.7 73.7 1.0 .7______________________________________________________________________________________________________
Note: Data for 1994 are not strictly comparable with data for 1993 and 1982 because of the introduction of a major redesign of theCurrent Population Survey questionnaire and collection methodology and the introduction of 1990 census-based population controls,adjusted for the estimated undercount.
a The "Asian and other" group includes: (1) Asians and Pacific Islanders; and (2) American Indians and Alaskan natives. Thehistorical data are derived by subtracting "black" from the "black and other" group; projections are made directly, not by subtraction.
Source: U.S. Department of Labor, Bureau of Labor Statistics.
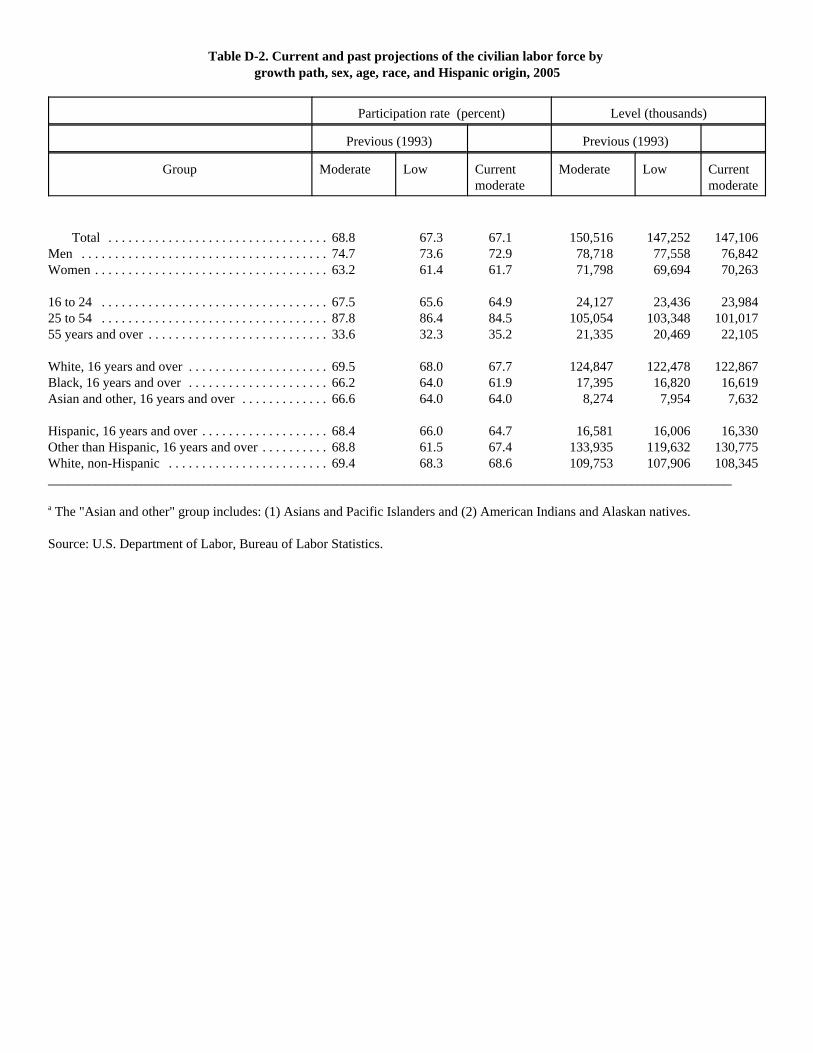
Table D-2. Current and past projections of the civilian labor force by growth path, sex, age, race, and Hispanic origin, 2005
Participation rate (percent) Level (thousands)
Previous (1993) Previous (1993)
Group Moderate Low Currentmoderate
Moderate Low Currentmoderate
Total . . . . . . . . . . . . . . . . . . . . . . . . . . . . . . . . . 68.8 67.3 67.1 150,516 147,252 147,106Men . . . . . . . . . . . . . . . . . . . . . . . . . . . . . . . . . . . . . 74.7 73.6 72.9 78,718 77,558 76,842Women . . . . . . . . . . . . . . . . . . . . . . . . . . . . . . . . . . . 63.2 61.4 61.7 71,798 69,694 70,263
16 to 24 . . . . . . . . . . . . . . . . . . . . . . . . . . . . . . . . . . 67.5 65.6 64.9 24,127 23,436 23,98425 to 54 . . . . . . . . . . . . . . . . . . . . . . . . . . . . . . . . . . 87.8 86.4 84.5 105,054 103,348 101,01755 years and over . . . . . . . . . . . . . . . . . . . . . . . . . . . 33.6 32.3 35.2 21,335 20,469 22,105
White, 16 years and over . . . . . . . . . . . . . . . . . . . . . 69.5 68.0 67.7 124,847 122,478 122,867Black, 16 years and over . . . . . . . . . . . . . . . . . . . . . 66.2 64.0 61.9 17,395 16,820 16,619Asian and other, 16 years and over . . . . . . . . . . . . . 66.6 64.0 64.0 8,274 7,954 7,632
Hispanic, 16 years and over . . . . . . . . . . . . . . . . . . . 68.4 66.0 64.7 16,581 16,006 16,330Other than Hispanic, 16 years and over . . . . . . . . . . 68.8 61.5 67.4 133,935 119,632 130,775White, non-Hispanic . . . . . . . . . . . . . . . . . . . . . . . . 69.4 68.3 68.6 109,753 107,906 108,345______________________________________________________________________________________________________
a The "Asian and other" group includes: (1) Asians and Pacific Islanders and (2) American Indians and Alaskan natives.
Source: U.S. Department of Labor, Bureau of Labor Statistics.
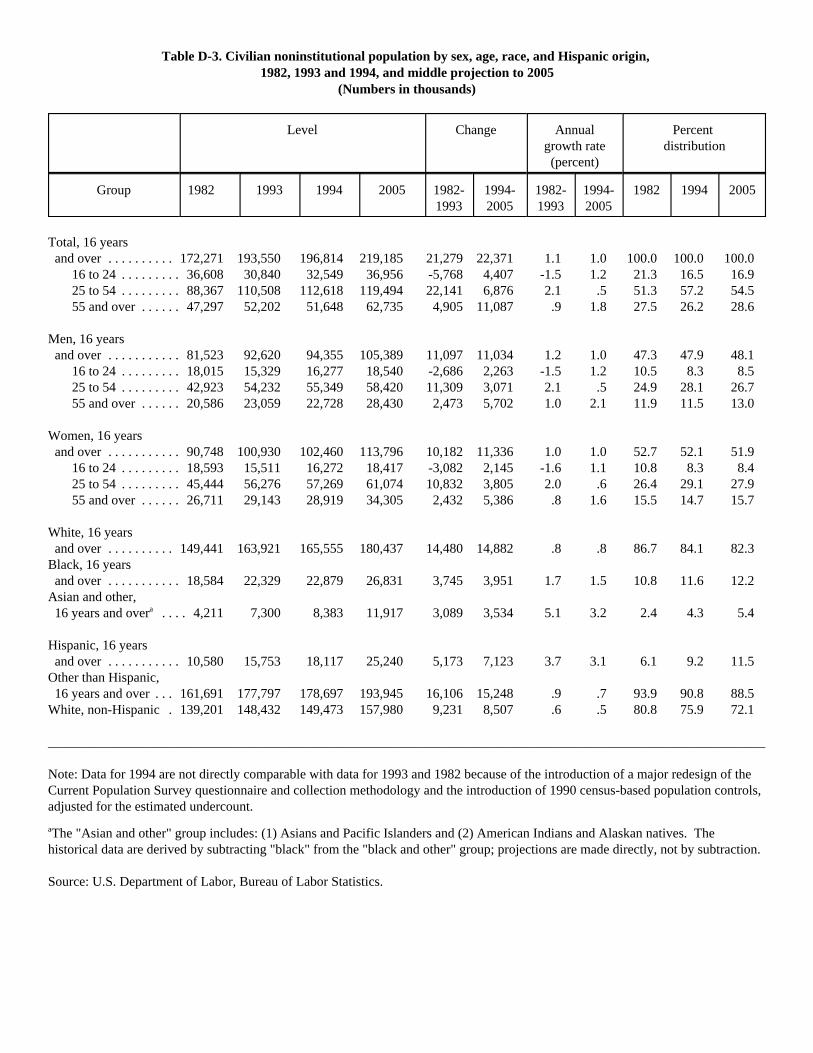
Table D-3. Civilian noninstitutional population by sex, age, race, and Hispanic origin, 1982, 1993 and 1994, and middle projection to 2005
(Numbers in thousands)
Level Change Annualgrowth rate(percent)
Percent distribution
Group 1982 1993 1994 2005 1982-1993
1994-2005
1982-1993
1994-2005
1982 1994 2005
Total, 16 years and over . . . . . . . . . . 172,271 193,550 196,814 219,185 21,279 22,371 1.1 1.0 100.0 100.0 100.0
16 to 24 . . . . . . . . . 36,608 30,840 32,549 36,956 -5,768 4,407 -1.5 1.2 21.3 16.5 16.925 to 54 . . . . . . . . . 88,367 110,508 112,618 119,494 22,141 6,876 2.1 .5 51.3 57.2 54.555 and over . . . . . . 47,297 52,202 51,648 62,735 4,905 11,087 .9 1.8 27.5 26.2 28.6
Men, 16 years and over . . . . . . . . . . . 81,523 92,620 94,355 105,389 11,097 11,034 1.2 1.0 47.3 47.9 48.1
16 to 24 . . . . . . . . . 18,015 15,329 16,277 18,540 -2,686 2,263 -1.5 1.2 10.5 8.3 8.525 to 54 . . . . . . . . . 42,923 54,232 55,349 58,420 11,309 3,071 2.1 .5 24.9 28.1 26.755 and over . . . . . . 20,586 23,059 22,728 28,430 2,473 5,702 1.0 2.1 11.9 11.5 13.0
Women, 16 years and over . . . . . . . . . . . 90,748 100,930 102,460 113,796 10,182 11,336 1.0 1.0 52.7 52.1 51.9
16 to 24 . . . . . . . . . 18,593 15,511 16,272 18,417 -3,082 2,145 -1.6 1.1 10.8 8.3 8.425 to 54 . . . . . . . . . 45,444 56,276 57,269 61,074 10,832 3,805 2.0 .6 26.4 29.1 27.955 and over . . . . . . 26,711 29,143 28,919 34,305 2,432 5,386 .8 1.6 15.5 14.7 15.7
White, 16 years and over . . . . . . . . . . 149,441 163,921 165,555 180,437 14,480 14,882 .8 .8 86.7 84.1 82.3Black, 16 years and over . . . . . . . . . . . 18,584 22,329 22,879 26,831 3,745 3,951 1.7 1.5 10.8 11.6 12.2Asian and other, 16 years and overa . . . . 4,211 7,300 8,383 11,917 3,089 3,534 5.1 3.2 2.4 4.3 5.4
Hispanic, 16 years and over . . . . . . . . . . . 10,580 15,753 18,117 25,240 5,173 7,123 3.7 3.1 6.1 9.2 11.5Other than Hispanic, 16 years and over . . . 161,691 177,797 178,697 193,945 16,106 15,248 .9 .7 93.9 90.8 88.5White, non-Hispanic . 139,201 148,432 149,473 157,980 9,231 8,507 .6 .5 80.8 75.9 72.1
___________________________________________________________________________________________________________
Note: Data for 1994 are not directly comparable with data for 1993 and 1982 because of the introduction of a major redesign of theCurrent Population Survey questionnaire and collection methodology and the introduction of 1990 census-based population controls,adjusted for the estimated undercount.
aThe "Asian and other" group includes: (1) Asians and Pacific Islanders and (2) American Indians and Alaskan natives. Thehistorical data are derived by subtracting "black" from the "black and other" group; projections are made directly, not by subtraction.
Source: U.S. Department of Labor, Bureau of Labor Statistics.
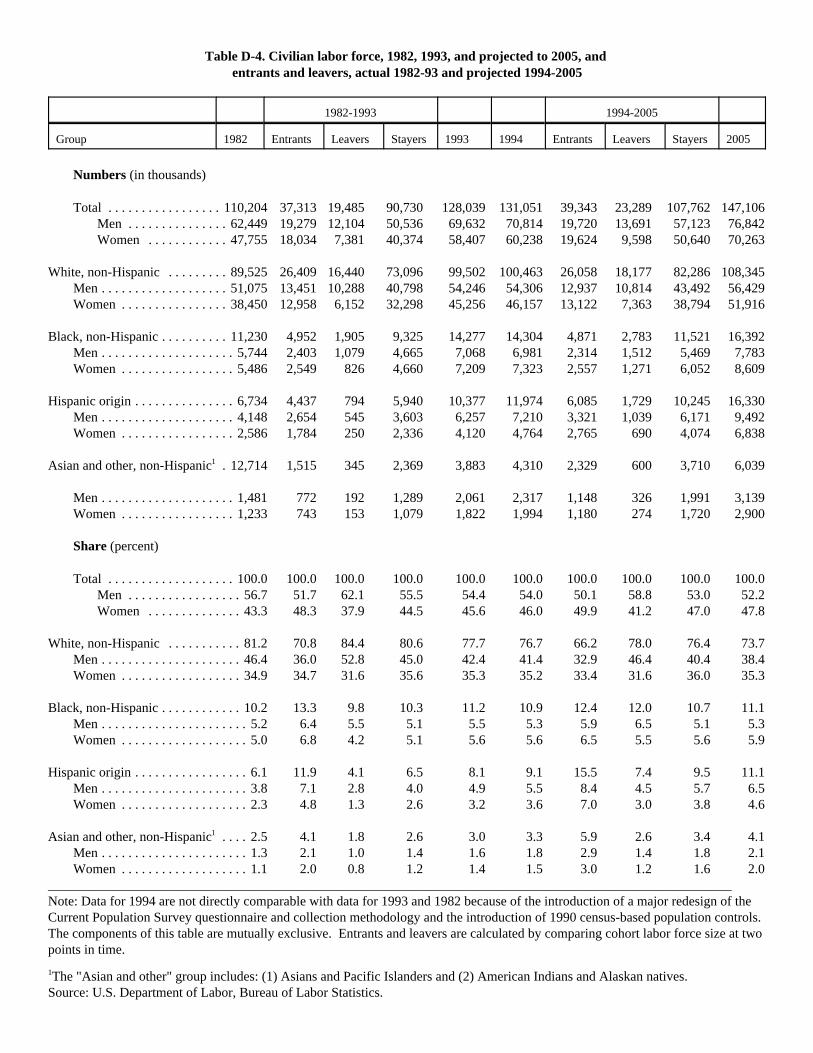
Table D-4. Civilian labor force, 1982, 1993, and projected to 2005, and entrants and leavers, actual 1982-93 and projected 1994-2005
1982-1993 1994-2005
Group 1982 Entrants Leavers Stayers 1993 1994 Entrants Leavers Stayers 2005
Numbers (in thousands)
Total . . . . . . . . . . . . . . . . . 110,204 37,313 19,485 90,730 128,039 131,051 39,343 23,289 107,762 147,106Men . . . . . . . . . . . . . . . 62,449 19,279 12,104 50,536 69,632 70,814 19,720 13,691 57,123 76,842Women . . . . . . . . . . . . 47,755 18,034 7,381 40,374 58,407 60,238 19,624 9,598 50,640 70,263
White, non-Hispanic . . . . . . . . . 89,525 26,409 16,440 73,096 99,502 100,463 26,058 18,177 82,286 108,345Men . . . . . . . . . . . . . . . . . . . 51,075 13,451 10,288 40,798 54,246 54,306 12,937 10,814 43,492 56,429Women . . . . . . . . . . . . . . . . 38,450 12,958 6,152 32,298 45,256 46,157 13,122 7,363 38,794 51,916
Black, non-Hispanic . . . . . . . . . . 11,230 4,952 1,905 9,325 14,277 14,304 4,871 2,783 11,521 16,392Men . . . . . . . . . . . . . . . . . . . . 5,744 2,403 1,079 4,665 7,068 6,981 2,314 1,512 5,469 7,783Women . . . . . . . . . . . . . . . . . 5,486 2,549 826 4,660 7,209 7,323 2,557 1,271 6,052 8,609
Hispanic origin . . . . . . . . . . . . . . . 6,734 4,437 794 5,940 10,377 11,974 6,085 1,729 10,245 16,330Men . . . . . . . . . . . . . . . . . . . . 4,148 2,654 545 3,603 6,257 7,210 3,321 1,039 6,171 9,492Women . . . . . . . . . . . . . . . . . 2,586 1,784 250 2,336 4,120 4,764 2,765 690 4,074 6,838
Asian and other, non-Hispanic1 . 12,714 1,515 345 2,369 3,883 4,310 2,329 600 3,710 6,039
Men . . . . . . . . . . . . . . . . . . . . 1,481 772 192 1,289 2,061 2,317 1,148 326 1,991 3,139Women . . . . . . . . . . . . . . . . . 1,233 743 153 1,079 1,822 1,994 1,180 274 1,720 2,900
Share (percent)
Total . . . . . . . . . . . . . . . . . . . 100.0 100.0 100.0 100.0 100.0 100.0 100.0 100.0 100.0 100.0Men . . . . . . . . . . . . . . . . . 56.7 51.7 62.1 55.5 54.4 54.0 50.1 58.8 53.0 52.2Women . . . . . . . . . . . . . . 43.3 48.3 37.9 44.5 45.6 46.0 49.9 41.2 47.0 47.8
White, non-Hispanic . . . . . . . . . . . 81.2 70.8 84.4 80.6 77.7 76.7 66.2 78.0 76.4 73.7Men . . . . . . . . . . . . . . . . . . . . . 46.4 36.0 52.8 45.0 42.4 41.4 32.9 46.4 40.4 38.4Women . . . . . . . . . . . . . . . . . . 34.9 34.7 31.6 35.6 35.3 35.2 33.4 31.6 36.0 35.3
Black, non-Hispanic . . . . . . . . . . . . 10.2 13.3 9.8 10.3 11.2 10.9 12.4 12.0 10.7 11.1Men . . . . . . . . . . . . . . . . . . . . . . 5.2 6.4 5.5 5.1 5.5 5.3 5.9 6.5 5.1 5.3Women . . . . . . . . . . . . . . . . . . . 5.0 6.8 4.2 5.1 5.6 5.6 6.5 5.5 5.6 5.9
Hispanic origin . . . . . . . . . . . . . . . . . 6.1 11.9 4.1 6.5 8.1 9.1 15.5 7.4 9.5 11.1Men . . . . . . . . . . . . . . . . . . . . . . 3.8 7.1 2.8 4.0 4.9 5.5 8.4 4.5 5.7 6.5Women . . . . . . . . . . . . . . . . . . . 2.3 4.8 1.3 2.6 3.2 3.6 7.0 3.0 3.8 4.6
Asian and other, non-Hispanic1 . . . . 2.5 4.1 1.8 2.6 3.0 3.3 5.9 2.6 3.4 4.1Men . . . . . . . . . . . . . . . . . . . . . . 1.3 2.1 1.0 1.4 1.6 1.8 2.9 1.4 1.8 2.1Women . . . . . . . . . . . . . . . . . . . 1.1 2.0 0.8 1.2 1.4 1.5 3.0 1.2 1.6 2.0
______________________________________________________________________________________________________Note: Data for 1994 are not directly comparable with data for 1993 and 1982 because of the introduction of a major redesign of theCurrent Population Survey questionnaire and collection methodology and the introduction of 1990 census-based population controls. The components of this table are mutually exclusive. Entrants and leavers are calculated by comparing cohort labor force size at twopoints in time.
1The "Asian and other" group includes: (1) Asians and Pacific Islanders and (2) American Indians and Alaskan natives.Source: U.S. Department of Labor, Bureau of Labor Statistics.
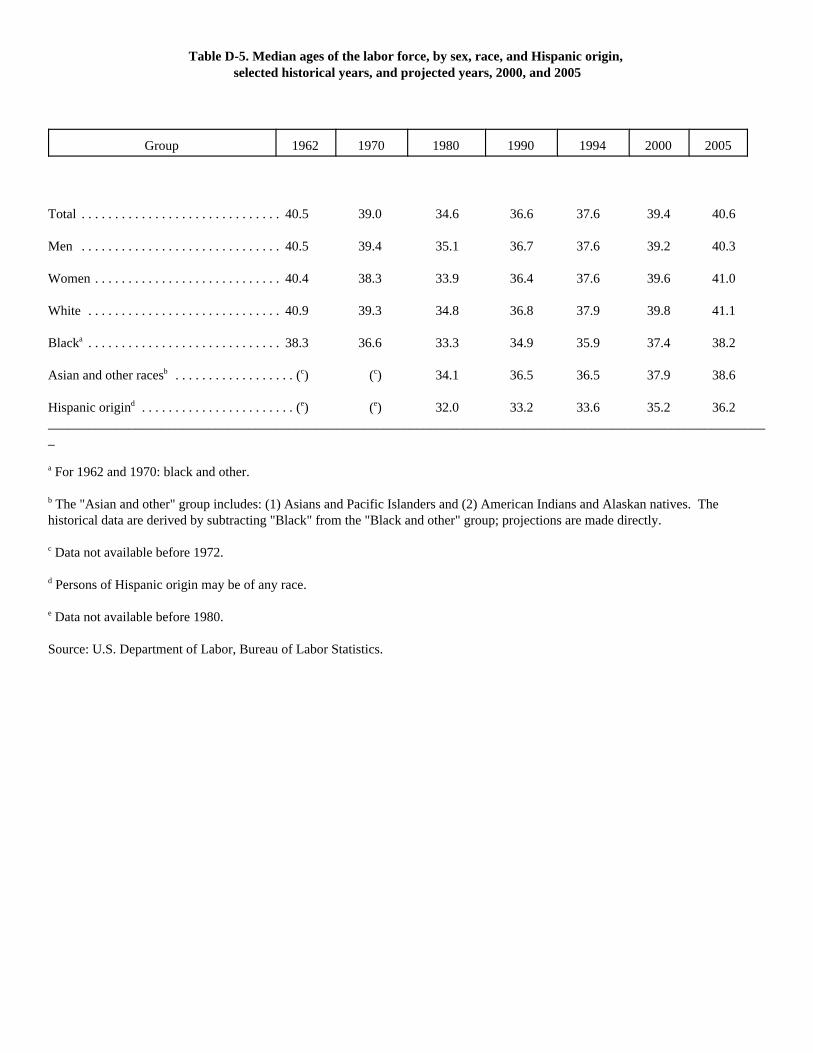
Table D-5. Median ages of the labor force, by sex, race, and Hispanic origin, selected historical years, and projected years, 2000, and 2005
Group 1962 1970 1980 1990 1994 2000 2005
Total . . . . . . . . . . . . . . . . . . . . . . . . . . . . . . 40.5 39.0 34.6 36.6 37.6 39.4 40.6
Men . . . . . . . . . . . . . . . . . . . . . . . . . . . . . . 40.5 39.4 35.1 36.7 37.6 39.2 40.3
Women . . . . . . . . . . . . . . . . . . . . . . . . . . . . 40.4 38.3 33.9 36.4 37.6 39.6 41.0
White . . . . . . . . . . . . . . . . . . . . . . . . . . . . . 40.9 39.3 34.8 36.8 37.9 39.8 41.1
Blacka . . . . . . . . . . . . . . . . . . . . . . . . . . . . . 38.3 36.6 33.3 34.9 35.9 37.4 38.2
Asian and other racesb . . . . . . . . . . . . . . . . . . (c) (c) 34.1 36.5 36.5 37.9 38.6
Hispanic origind . . . . . . . . . . . . . . . . . . . . . . . (e) (e) 32.0 33.2 33.6 35.2 36.2____________________________________________________________________________________________________________
a For 1962 and 1970: black and other.
b The "Asian and other" group includes: (1) Asians and Pacific Islanders and (2) American Indians and Alaskan natives. Thehistorical data are derived by subtracting "Black" from the "Black and other" group; projections are made directly.
c Data not available before 1972.
d Persons of Hispanic origin may be of any race.
e Data not available before 1980.
Source: U.S. Department of Labor, Bureau of Labor Statistics.
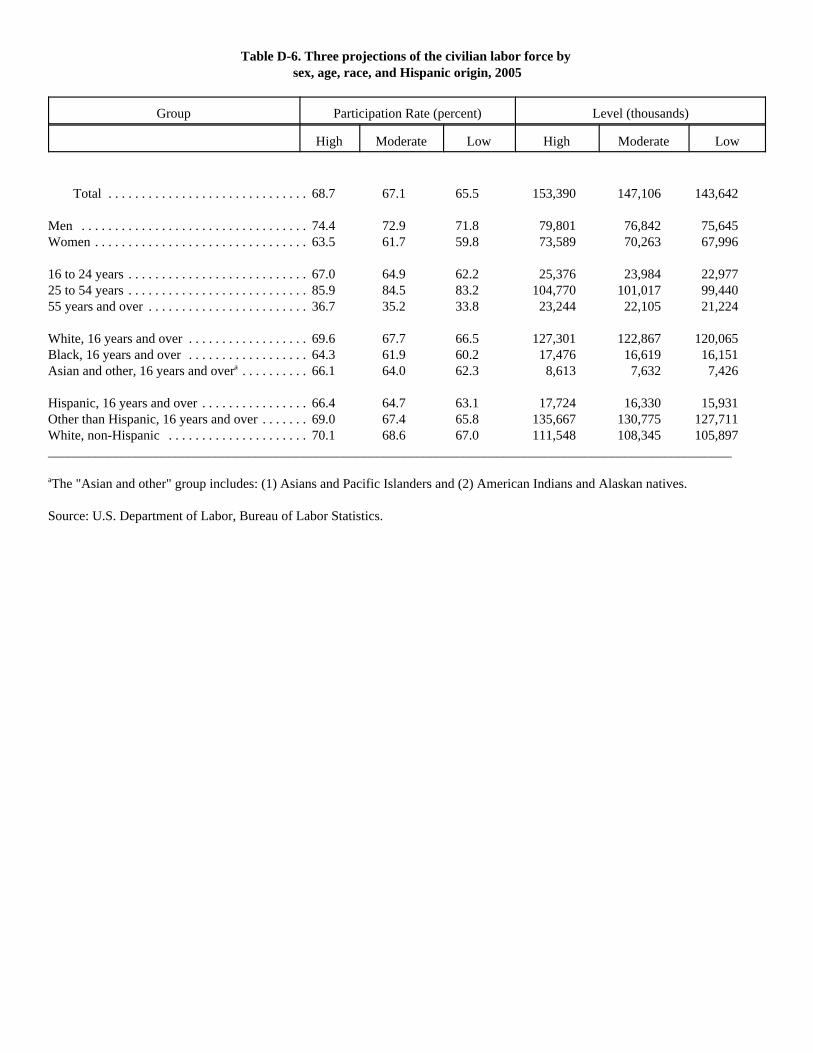
Table D-6. Three projections of the civilian labor force by sex, age, race, and Hispanic origin, 2005
Group Participation Rate (percent) Level (thousands)
High Moderate Low High Moderate Low
Total . . . . . . . . . . . . . . . . . . . . . . . . . . . . . . 68.7 67.1 65.5 153,390 147,106 143,642
Men . . . . . . . . . . . . . . . . . . . . . . . . . . . . . . . . . . 74.4 72.9 71.8 79,801 76,842 75,645Women . . . . . . . . . . . . . . . . . . . . . . . . . . . . . . . . 63.5 61.7 59.8 73,589 70,263 67,996
16 to 24 years . . . . . . . . . . . . . . . . . . . . . . . . . . . 67.0 64.9 62.2 25,376 23,984 22,97725 to 54 years . . . . . . . . . . . . . . . . . . . . . . . . . . . 85.9 84.5 83.2 104,770 101,017 99,44055 years and over . . . . . . . . . . . . . . . . . . . . . . . . 36.7 35.2 33.8 23,244 22,105 21,224
White, 16 years and over . . . . . . . . . . . . . . . . . . 69.6 67.7 66.5 127,301 122,867 120,065Black, 16 years and over . . . . . . . . . . . . . . . . . . 64.3 61.9 60.2 17,476 16,619 16,151Asian and other, 16 years and overa . . . . . . . . . . 66.1 64.0 62.3 8,613 7,632 7,426
Hispanic, 16 years and over . . . . . . . . . . . . . . . . 66.4 64.7 63.1 17,724 16,330 15,931Other than Hispanic, 16 years and over . . . . . . . 69.0 67.4 65.8 135,667 130,775 127,711White, non-Hispanic . . . . . . . . . . . . . . . . . . . . . 70.1 68.6 67.0 111,548 108,345 105,897______________________________________________________________________________________________________
aThe "Asian and other" group includes: (1) Asians and Pacific Islanders and (2) American Indians and Alaskan natives.
Source: U.S. Department of Labor, Bureau of Labor Statistics.

Table D-7. Employment by major occupational group, 1983, 1994, and projected 2005, moderate alternative projection
(Numbers in thousands)
Occupation 1983 1994 2005 Employment Change
Number Percent Number Percent Number Percent 1983-94 1994-2005
Number % Number %
Total, all occupations . . . . . . . . . 102,404 100.0 127,014 100.0 144,708 100.0 24,610 24.0 17,694 13.9
Executives, administrative, and managerial occupations . . . . . . . . . . . . . 9,591 9.4 12,903 10.2 15,071 10.4 3,312 34.5 2,168 16.8Professional specialty occupations . . . . 12,639 12.3 17,314 13.6 22,387 15.5 4,675 37.0 5,073 29.3Technicians and related support occupations . . . . . . . . . . . . . . . 3,409 3.3 4,439 3.5 5,316 3.7 1,030 30.2 876 19.7Marketing and sales occupations . . . . . 10,497 10.3 13,990 11.0 16,502 11.4 3,493 33.3 2,512 18.0Administrative support occupations, including clerical . . . . . . . . . . . . . . . . 18,874 18.4 23,178 18.2 24,172 16.7 4,304 22.8 994 4.3Service occupations . . . . . . . . . . . . . . . 15,577 15.2 20,239 15.9 24,832 17.2 4,662 29.9 4,593 22.7Agricultural, forestry, fishing, and related occupations . . . . . . . . . . . . . . . . 3,712 3.6 3,762 3.0 3,650 2.5 50 1.3 -112 -3.0Precision production, craft and repair occupations . . . . . . . . . . . . . . . 12,731 12.4 14,047 11.1 14,880 10.3 1,316 10.3 833 5.9Operators, fabricators, and laborers . . . 15,374 15.0 17,142 13.5 17,898 12.4 1,768 11.5 757 4.4______________________________________________________________________________________________________
Source: U.S. Department of Labor, Bureau of Labor Statistics.

Table D-8. Occupations with the largest job growth,1994-2005, moderate alternative projection
(Numbers in thousands)
Occupation Employment NumericalChange
PercentChange
1994 2005
Cashiers . . . . . . . . . . . . . . . . . . . . . . . . . . . . . . . . . . . . . . . . . . . . . . . . . . . . . . . . . . . 3,005 3,567 562 19Janitors and cleaners, including maids and housekeeping cleaners . . . . . . . . . . . . . . 3,043 3,602 559 18Salespersons, retail . . . . . . . . . . . . . . . . . . . . . . . . . . . . . . . . . . . . . . . . . . . . . . . . . . . 3,842 4,374 532 14Waiters and waitresses . . . . . . . . . . . . . . . . . . . . . . . . . . . . . . . . . . . . . . . . . . . . . . . . 1,847 2,326 479 26Registered nurses . . . . . . . . . . . . . . . . . . . . . . . . . . . . . . . . . . . . . . . . . . . . . . . . . . . . 1,906 2,379 473 25General managers and top executives . . . . . . . . . . . . . . . . . . . . . . . . . . . . . . . . . . . . 3,046 3,512 466 15Systems analysts . . . . . . . . . . . . . . . . . . . . . . . . . . . . . . . . . . . . . . . . . . . . . . . . . . . . . 483 928 445 92Home health aides . . . . . . . . . . . . . . . . . . . . . . . . . . . . . . . . . . . . . . . . . . . . . . . . . . . . 420 848 428 102Guards . . . . . . . . . . . . . . . . . . . . . . . . . . . . . . . . . . . . . . . . . . . . . . . . . . . . . . . . . . . . . 867 1,282 415 48Nursing aides, orderlies, and attendants . . . . . . . . . . . . . . . . . . . . . . . . . . . . . . . . . . . 1,265 1,652 387 31
Teachers, secondary school . . . . . . . . . . . . . . . . . . . . . . . . . . . . . . . . . . . . . . . . . . . . 1,340 1,726 386 29Marketing and sales worker supervisors . . . . . . . . . . . . . . . . . . . . . . . . . . . . . . . . . . 2,293 2,673 380 17Teacher aides and educational assistants . . . . . . . . . . . . . . . . . . . . . . . . . . . . . . . . . . . 932 1,296 364 39Receptionists and information clerks . . . . . . . . . . . . . . . . . . . . . . . . . . . . . . . . . . . . . 1,019 1,337 318 31Truck drivers, light and heavy . . . . . . . . . . . . . . . . . . . . . . . . . . . . . . . . . . . . . . . . . . 2,565 2,837 271 11Secretaries, except legal and medical . . . . . . . . . . . . . . . . . . . . . . . . . . . . . . . . . . . . . 2,842 3,109 267 9Clerical supervisors and managers . . . . . . . . . . . . . . . . . . . . . . . . . . . . . . . . . . . . . . . 1,340 1,600 261 19Child care workers . . . . . . . . . . . . . . . . . . . . . . . . . . . . . . . . . . . . . . . . . . . . . . . . . . . . 757 1,005 248 33Maintenance repairers, general utility . . . . . . . . . . . . . . . . . . . . . . . . . . . . . . . . . . . . 1,273 1,505 231 18Teachers, elementary . . . . . . . . . . . . . . . . . . . . . . . . . . . . . . . . . . . . . . . . . . . . . . . . . 1,419 1,639 220 16
Personal and home care aides . . . . . . . . . . . . . . . . . . . . . . . . . . . . . . . . . . . . . . . . . . . 179 391 212 119Teachers, special education . . . . . . . . . . . . . . . . . . . . . . . . . . . . . . . . . . . . . . . . . . . . . 388 593 206 53Licenses practical nurses . . . . . . . . . . . . . . . . . . . . . . . . . . . . . . . . . . . . . . . . . . . . . . . 702 899 197 28Food service and lodging managers . . . . . . . . . . . . . . . . . . . . . . . . . . . . . . . . . . . . . . . 579 771 192 33Food preparation workers . . . . . . . . . . . . . . . . . . . . . . . . . . . . . . . . . . . . . . . . . . . . . 1,190 1,378 187 16Social workers . . . . . . . . . . . . . . . . . . . . . . . . . . . . . . . . . . . . . . . . . . . . . . . . . . . . . . . 557 744 187 34Lawyers . . . . . . . . . . . . . . . . . . . . . . . . . . . . . . . . . . . . . . . . . . . . . . . . . . . . . . . . . . . . 656 839 183 28Financial managers . . . . . . . . . . . . . . . . . . . . . . . . . . . . . . . . . . . . . . . . . . . . . . . . . . . 768 950 182 24Computer engineers . . . . . . . . . . . . . . . . . . . . . . . . . . . . . . . . . . . . . . . . . . . . . . . . . . . 195 372 177 90Hand packers and packagers . . . . . . . . . . . . . . . . . . . . . . . . . . . . . . . . . . . . . . . . . . . . 942 1,102 160 17______________________________________________________________________________________________________
Source: U.S. Department of Labor, Bureau of Labor Statistics.
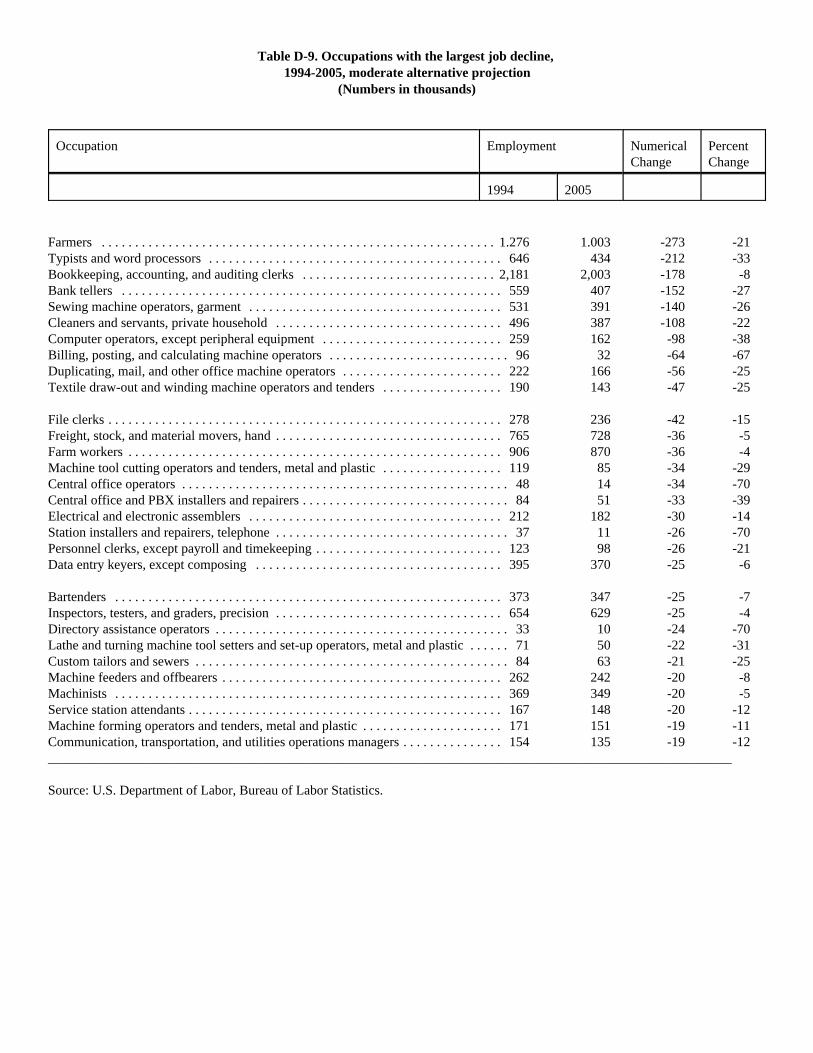
Table D-9. Occupations with the largest job decline, 1994-2005, moderate alternative projection
(Numbers in thousands)
Occupation Employment NumericalChange
PercentChange
1994 2005
Farmers . . . . . . . . . . . . . . . . . . . . . . . . . . . . . . . . . . . . . . . . . . . . . . . . . . . . . . . . . . . 1.276 1.003 -273 -21Typists and word processors . . . . . . . . . . . . . . . . . . . . . . . . . . . . . . . . . . . . . . . . . . . . 646 434 -212 -33Bookkeeping, accounting, and auditing clerks . . . . . . . . . . . . . . . . . . . . . . . . . . . . . 2,181 2,003 -178 -8Bank tellers . . . . . . . . . . . . . . . . . . . . . . . . . . . . . . . . . . . . . . . . . . . . . . . . . . . . . . . . . 559 407 -152 -27Sewing machine operators, garment . . . . . . . . . . . . . . . . . . . . . . . . . . . . . . . . . . . . . . 531 391 -140 -26Cleaners and servants, private household . . . . . . . . . . . . . . . . . . . . . . . . . . . . . . . . . . 496 387 -108 -22Computer operators, except peripheral equipment . . . . . . . . . . . . . . . . . . . . . . . . . . . 259 162 -98 -38Billing, posting, and calculating machine operators . . . . . . . . . . . . . . . . . . . . . . . . . . . 96 32 -64 -67Duplicating, mail, and other office machine operators . . . . . . . . . . . . . . . . . . . . . . . . 222 166 -56 -25Textile draw-out and winding machine operators and tenders . . . . . . . . . . . . . . . . . . 190 143 -47 -25
File clerks . . . . . . . . . . . . . . . . . . . . . . . . . . . . . . . . . . . . . . . . . . . . . . . . . . . . . . . . . . . 278 236 -42 -15Freight, stock, and material movers, hand . . . . . . . . . . . . . . . . . . . . . . . . . . . . . . . . . . 765 728 -36 -5Farm workers . . . . . . . . . . . . . . . . . . . . . . . . . . . . . . . . . . . . . . . . . . . . . . . . . . . . . . . . 906 870 -36 -4Machine tool cutting operators and tenders, metal and plastic . . . . . . . . . . . . . . . . . . 119 85 -34 -29Central office operators . . . . . . . . . . . . . . . . . . . . . . . . . . . . . . . . . . . . . . . . . . . . . . . . . 48 14 -34 -70Central office and PBX installers and repairers . . . . . . . . . . . . . . . . . . . . . . . . . . . . . . . 84 51 -33 -39Electrical and electronic assemblers . . . . . . . . . . . . . . . . . . . . . . . . . . . . . . . . . . . . . . 212 182 -30 -14Station installers and repairers, telephone . . . . . . . . . . . . . . . . . . . . . . . . . . . . . . . . . . . 37 11 -26 -70Personnel clerks, except payroll and timekeeping . . . . . . . . . . . . . . . . . . . . . . . . . . . . 123 98 -26 -21Data entry keyers, except composing . . . . . . . . . . . . . . . . . . . . . . . . . . . . . . . . . . . . . 395 370 -25 -6
Bartenders . . . . . . . . . . . . . . . . . . . . . . . . . . . . . . . . . . . . . . . . . . . . . . . . . . . . . . . . . . 373 347 -25 -7Inspectors, testers, and graders, precision . . . . . . . . . . . . . . . . . . . . . . . . . . . . . . . . . . 654 629 -25 -4Directory assistance operators . . . . . . . . . . . . . . . . . . . . . . . . . . . . . . . . . . . . . . . . . . . . 33 10 -24 -70Lathe and turning machine tool setters and set-up operators, metal and plastic . . . . . . 71 50 -22 -31Custom tailors and sewers . . . . . . . . . . . . . . . . . . . . . . . . . . . . . . . . . . . . . . . . . . . . . . . 84 63 -21 -25Machine feeders and offbearers . . . . . . . . . . . . . . . . . . . . . . . . . . . . . . . . . . . . . . . . . . 262 242 -20 -8Machinists . . . . . . . . . . . . . . . . . . . . . . . . . . . . . . . . . . . . . . . . . . . . . . . . . . . . . . . . . . 369 349 -20 -5Service station attendants . . . . . . . . . . . . . . . . . . . . . . . . . . . . . . . . . . . . . . . . . . . . . . . 167 148 -20 -12Machine forming operators and tenders, metal and plastic . . . . . . . . . . . . . . . . . . . . . 171 151 -19 -11Communication, transportation, and utilities operations managers . . . . . . . . . . . . . . . 154 135 -19 -12______________________________________________________________________________________________________
Source: U.S. Department of Labor, Bureau of Labor Statistics.
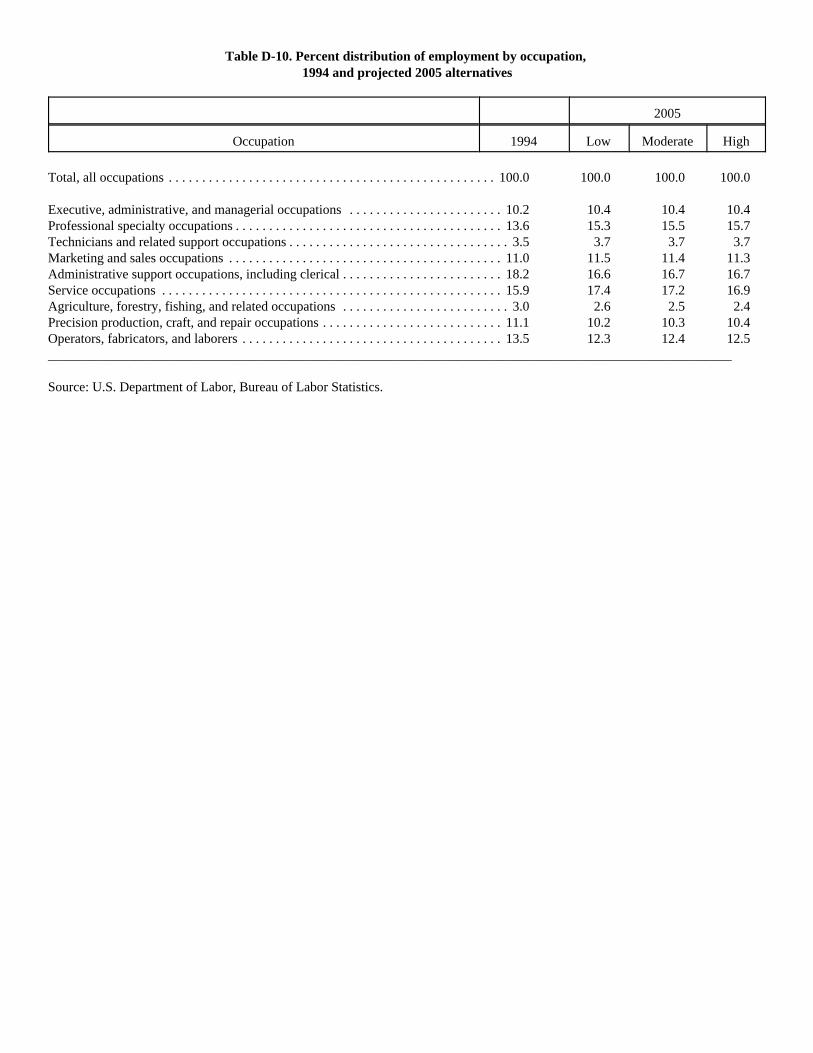
Table D-10. Percent distribution of employment by occupation, 1994 and projected 2005 alternatives
2005
Occupation 1994 Low Moderate High
Total, all occupations . . . . . . . . . . . . . . . . . . . . . . . . . . . . . . . . . . . . . . . . . . . . . . . . . 100.0 100.0 100.0 100.0
Executive, administrative, and managerial occupations . . . . . . . . . . . . . . . . . . . . . . . 10.2 10.4 10.4 10.4Professional specialty occupations . . . . . . . . . . . . . . . . . . . . . . . . . . . . . . . . . . . . . . . . 13.6 15.3 15.5 15.7Technicians and related support occupations . . . . . . . . . . . . . . . . . . . . . . . . . . . . . . . . . 3.5 3.7 3.7 3.7Marketing and sales occupations . . . . . . . . . . . . . . . . . . . . . . . . . . . . . . . . . . . . . . . . . 11.0 11.5 11.4 11.3Administrative support occupations, including clerical . . . . . . . . . . . . . . . . . . . . . . . . 18.2 16.6 16.7 16.7Service occupations . . . . . . . . . . . . . . . . . . . . . . . . . . . . . . . . . . . . . . . . . . . . . . . . . . . 15.9 17.4 17.2 16.9Agriculture, forestry, fishing, and related occupations . . . . . . . . . . . . . . . . . . . . . . . . . 3.0 2.6 2.5 2.4Precision production, craft, and repair occupations . . . . . . . . . . . . . . . . . . . . . . . . . . . 11.1 10.2 10.3 10.4Operators, fabricators, and laborers . . . . . . . . . . . . . . . . . . . . . . . . . . . . . . . . . . . . . . . 13.5 12.3 12.4 12.5______________________________________________________________________________________________________
Source: U.S. Department of Labor, Bureau of Labor Statistics.
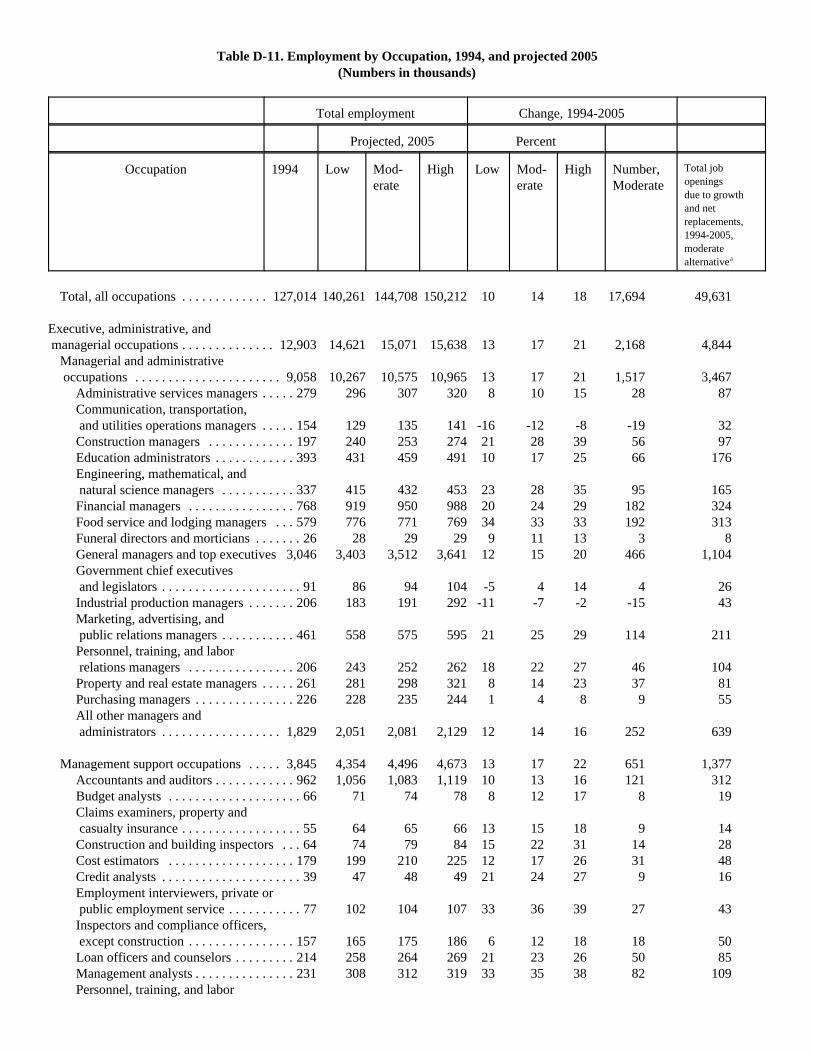
Table D-11. Employment by Occupation, 1994, and projected 2005(Numbers in thousands)
Total employment Change, 1994-2005
Projected, 2005 Percent
Occupation 1994 Low Mod-erate
High Low Mod-erate
High Number,Moderate
Total jobopeningsdue to growthand netreplacements,1994-2005,moderatealternativea
Total, all occupations . . . . . . . . . . . . . 127,014 140,261 144,708 150,212 10 14 18 17,694 49,631
Executive, administrative, and managerial occupations . . . . . . . . . . . . . . 12,903 14,621 15,071 15,638 13 17 21 2,168 4,844
Managerial and administrative occupations . . . . . . . . . . . . . . . . . . . . . . 9,058 10,267 10,575 10,965 13 17 21 1,517 3,467
Administrative services managers . . . . . 279 296 307 320 8 10 15 28 87Communication, transportation, and utilities operations managers . . . . . 154 129 135 141 -16 -12 -8 -19 32Construction managers . . . . . . . . . . . . . 197 240 253 274 21 28 39 56 97Education administrators . . . . . . . . . . . . 393 431 459 491 10 17 25 66 176Engineering, mathematical, and natural science managers . . . . . . . . . . . 337 415 432 453 23 28 35 95 165Financial managers . . . . . . . . . . . . . . . . 768 919 950 988 20 24 29 182 324Food service and lodging managers . . . 579 776 771 769 34 33 33 192 313Funeral directors and morticians . . . . . . . 26 28 29 29 9 11 13 3 8General managers and top executives 3,046 3,403 3,512 3,641 12 15 20 466 1,104Government chief executives and legislators . . . . . . . . . . . . . . . . . . . . . 91 86 94 104 -5 4 14 4 26Industrial production managers . . . . . . . 206 183 191 292 -11 -7 -2 -15 43Marketing, advertising, and public relations managers . . . . . . . . . . . 461 558 575 595 21 25 29 114 211Personnel, training, and labor relations managers . . . . . . . . . . . . . . . . 206 243 252 262 18 22 27 46 104Property and real estate managers . . . . . 261 281 298 321 8 14 23 37 81Purchasing managers . . . . . . . . . . . . . . . 226 228 235 244 1 4 8 9 55All other managers and administrators . . . . . . . . . . . . . . . . . . 1,829 2,051 2,081 2,129 12 14 16 252 639
Management support occupations . . . . . 3,845 4,354 4,496 4,673 13 17 22 651 1,377Accountants and auditors . . . . . . . . . . . . 962 1,056 1,083 1,119 10 13 16 121 312Budget analysts . . . . . . . . . . . . . . . . . . . . 66 71 74 78 8 12 17 8 19Claims examiners, property and casualty insurance . . . . . . . . . . . . . . . . . . 55 64 65 66 13 15 18 9 14Construction and building inspectors . . . 64 74 79 84 15 22 31 14 28Cost estimators . . . . . . . . . . . . . . . . . . . 179 199 210 225 12 17 26 31 48Credit analysts . . . . . . . . . . . . . . . . . . . . . 39 47 48 49 21 24 27 9 16Employment interviewers, private or public employment service . . . . . . . . . . . 77 102 104 107 33 36 39 27 43Inspectors and compliance officers, except construction . . . . . . . . . . . . . . . . 157 165 175 186 6 12 18 18 50Loan officers and counselors . . . . . . . . . 214 258 264 269 21 23 26 50 85Management analysts . . . . . . . . . . . . . . . 231 308 312 319 33 35 38 82 109Personnel, training, and labor
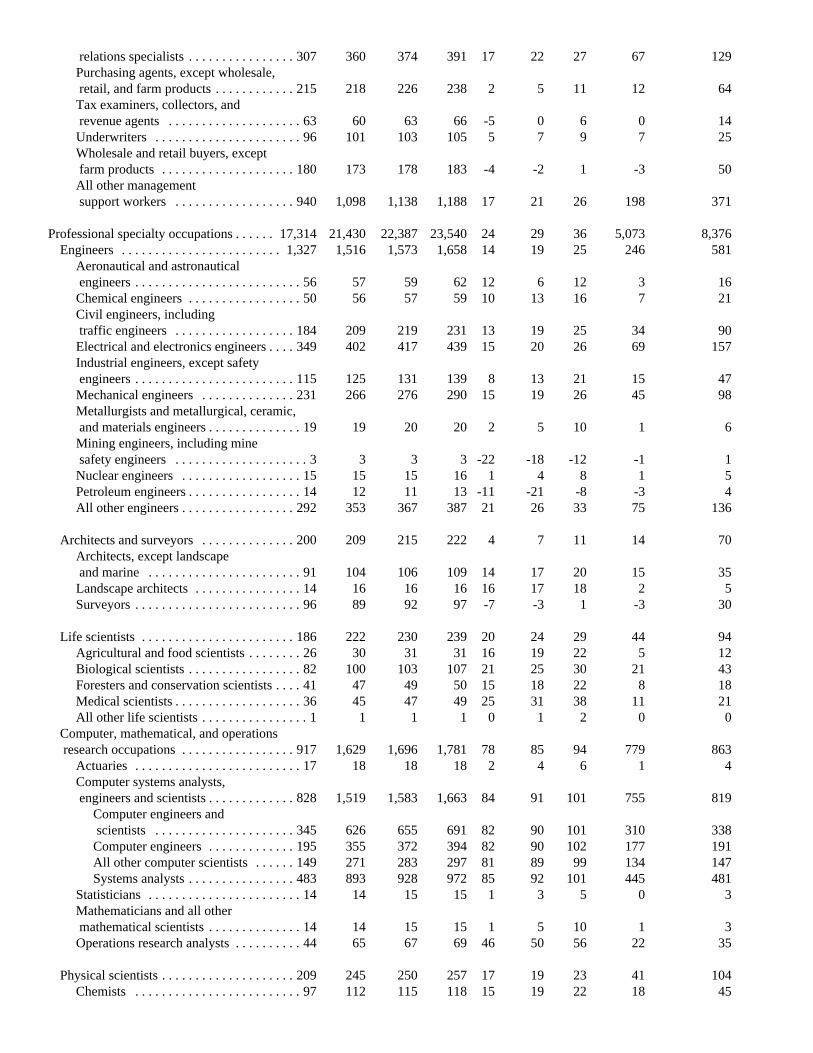
relations specialists . . . . . . . . . . . . . . . . 307 360 374 391 17 22 27 67 129Purchasing agents, except wholesale, retail, and farm products . . . . . . . . . . . . 215 218 226 238 2 5 11 12 64Tax examiners, collectors, and revenue agents . . . . . . . . . . . . . . . . . . . . 63 60 63 66 -5 0 6 0 14Underwriters . . . . . . . . . . . . . . . . . . . . . . 96 101 103 105 5 7 9 7 25Wholesale and retail buyers, except farm products . . . . . . . . . . . . . . . . . . . . 180 173 178 183 -4 -2 1 -3 50All other management support workers . . . . . . . . . . . . . . . . . . 940 1,098 1,138 1,188 17 21 26 198 371
Professional specialty occupations . . . . . . 17,314 21,430 22,387 23,540 24 29 36 5,073 8,376Engineers . . . . . . . . . . . . . . . . . . . . . . . . 1,327 1,516 1,573 1,658 14 19 25 246 581
Aeronautical and astronautical engineers . . . . . . . . . . . . . . . . . . . . . . . . . 56 57 59 62 12 6 12 3 16Chemical engineers . . . . . . . . . . . . . . . . . 50 56 57 59 10 13 16 7 21Civil engineers, including traffic engineers . . . . . . . . . . . . . . . . . . 184 209 219 231 13 19 25 34 90Electrical and electronics engineers . . . . 349 402 417 439 15 20 26 69 157Industrial engineers, except safety engineers . . . . . . . . . . . . . . . . . . . . . . . . 115 125 131 139 8 13 21 15 47Mechanical engineers . . . . . . . . . . . . . . 231 266 276 290 15 19 26 45 98Metallurgists and metallurgical, ceramic, and materials engineers . . . . . . . . . . . . . . 19 19 20 20 2 5 10 1 6Mining engineers, including mine safety engineers . . . . . . . . . . . . . . . . . . . . 3 3 3 3 -22 -18 -12 -1 1Nuclear engineers . . . . . . . . . . . . . . . . . . 15 15 15 16 1 4 8 1 5Petroleum engineers . . . . . . . . . . . . . . . . . 14 12 11 13 -11 -21 -8 -3 4All other engineers . . . . . . . . . . . . . . . . . 292 353 367 387 21 26 33 75 136
Architects and surveyors . . . . . . . . . . . . . . 200 209 215 222 4 7 11 14 70Architects, except landscape and marine . . . . . . . . . . . . . . . . . . . . . . . 91 104 106 109 14 17 20 15 35Landscape architects . . . . . . . . . . . . . . . . 14 16 16 16 16 17 18 2 5Surveyors . . . . . . . . . . . . . . . . . . . . . . . . . 96 89 92 97 -7 -3 1 -3 30
Life scientists . . . . . . . . . . . . . . . . . . . . . . . 186 222 230 239 20 24 29 44 94Agricultural and food scientists . . . . . . . . 26 30 31 31 16 19 22 5 12Biological scientists . . . . . . . . . . . . . . . . . 82 100 103 107 21 25 30 21 43Foresters and conservation scientists . . . . 41 47 49 50 15 18 22 8 18Medical scientists . . . . . . . . . . . . . . . . . . . 36 45 47 49 25 31 38 11 21All other life scientists . . . . . . . . . . . . . . . . 1 1 1 1 0 1 2 0 0
Computer, mathematical, and operations research occupations . . . . . . . . . . . . . . . . . 917 1,629 1,696 1,781 78 85 94 779 863
Actuaries . . . . . . . . . . . . . . . . . . . . . . . . . 17 18 18 18 2 4 6 1 4Computer systems analysts, engineers and scientists . . . . . . . . . . . . . 828 1,519 1,583 1,663 84 91 101 755 819
Computer engineers and scientists . . . . . . . . . . . . . . . . . . . . . 345 626 655 691 82 90 101 310 338Computer engineers . . . . . . . . . . . . . 195 355 372 394 82 90 102 177 191All other computer scientists . . . . . . 149 271 283 297 81 89 99 134 147Systems analysts . . . . . . . . . . . . . . . . 483 893 928 972 85 92 101 445 481
Statisticians . . . . . . . . . . . . . . . . . . . . . . . 14 14 15 15 1 3 5 0 3Mathematicians and all other mathematical scientists . . . . . . . . . . . . . . 14 14 15 15 1 5 10 1 3Operations research analysts . . . . . . . . . . 44 65 67 69 46 50 56 22 35
Physical scientists . . . . . . . . . . . . . . . . . . . . 209 245 250 257 17 19 23 41 104Chemists . . . . . . . . . . . . . . . . . . . . . . . . . 97 112 115 118 15 19 22 18 45
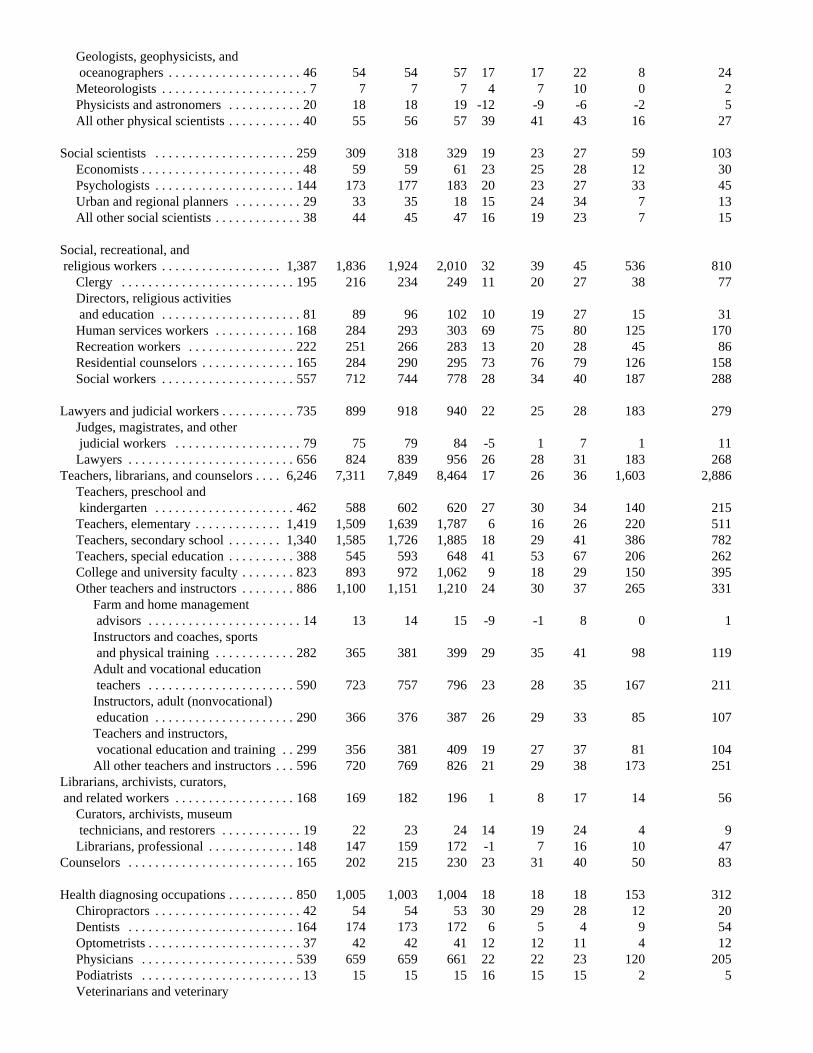
Geologists, geophysicists, and oceanographers . . . . . . . . . . . . . . . . . . . . 46 54 54 57 17 17 22 8 24Meteorologists . . . . . . . . . . . . . . . . . . . . . . 7 7 7 7 4 7 10 0 2Physicists and astronomers . . . . . . . . . . . 20 18 18 19 -12 -9 -6 -2 5All other physical scientists . . . . . . . . . . . 40 55 56 57 39 41 43 16 27
Social scientists . . . . . . . . . . . . . . . . . . . . . 259 309 318 329 19 23 27 59 103Economists . . . . . . . . . . . . . . . . . . . . . . . . 48 59 59 61 23 25 28 12 30Psychologists . . . . . . . . . . . . . . . . . . . . . 144 173 177 183 20 23 27 33 45Urban and regional planners . . . . . . . . . . 29 33 35 18 15 24 34 7 13All other social scientists . . . . . . . . . . . . . 38 44 45 47 16 19 23 7 15
Social, recreational, and religious workers . . . . . . . . . . . . . . . . . . 1,387 1,836 1,924 2,010 32 39 45 536 810
Clergy . . . . . . . . . . . . . . . . . . . . . . . . . . 195 216 234 249 11 20 27 38 77Directors, religious activities and education . . . . . . . . . . . . . . . . . . . . . 81 89 96 102 10 19 27 15 31Human services workers . . . . . . . . . . . . 168 284 293 303 69 75 80 125 170Recreation workers . . . . . . . . . . . . . . . . 222 251 266 283 13 20 28 45 86Residential counselors . . . . . . . . . . . . . . 165 284 290 295 73 76 79 126 158Social workers . . . . . . . . . . . . . . . . . . . . 557 712 744 778 28 34 40 187 288
Lawyers and judicial workers . . . . . . . . . . . 735 899 918 940 22 25 28 183 279Judges, magistrates, and other judicial workers . . . . . . . . . . . . . . . . . . . 79 75 79 84 -5 1 7 1 11Lawyers . . . . . . . . . . . . . . . . . . . . . . . . . 656 824 839 956 26 28 31 183 268
Teachers, librarians, and counselors . . . . 6,246 7,311 7,849 8,464 17 26 36 1,603 2,886Teachers, preschool and kindergarten . . . . . . . . . . . . . . . . . . . . . 462 588 602 620 27 30 34 140 215Teachers, elementary . . . . . . . . . . . . . 1,419 1,509 1,639 1,787 6 16 26 220 511Teachers, secondary school . . . . . . . . 1,340 1,585 1,726 1,885 18 29 41 386 782Teachers, special education . . . . . . . . . . 388 545 593 648 41 53 67 206 262College and university faculty . . . . . . . . 823 893 972 1,062 9 18 29 150 395Other teachers and instructors . . . . . . . . 886 1,100 1,151 1,210 24 30 37 265 331
Farm and home management advisors . . . . . . . . . . . . . . . . . . . . . . . 14 13 14 15 -9 -1 8 0 1Instructors and coaches, sports and physical training . . . . . . . . . . . . 282 365 381 399 29 35 41 98 119Adult and vocational education teachers . . . . . . . . . . . . . . . . . . . . . . 590 723 757 796 23 28 35 167 211Instructors, adult (nonvocational) education . . . . . . . . . . . . . . . . . . . . . 290 366 376 387 26 29 33 85 107Teachers and instructors, vocational education and training . . 299 356 381 409 19 27 37 81 104All other teachers and instructors . . . 596 720 769 826 21 29 38 173 251
Librarians, archivists, curators, and related workers . . . . . . . . . . . . . . . . . . 168 169 182 196 1 8 17 14 56
Curators, archivists, museum technicians, and restorers . . . . . . . . . . . . 19 22 23 24 14 19 24 4 9Librarians, professional . . . . . . . . . . . . . 148 147 159 172 -1 7 16 10 47
Counselors . . . . . . . . . . . . . . . . . . . . . . . . . 165 202 215 230 23 31 40 50 83
Health diagnosing occupations . . . . . . . . . . 850 1,005 1,003 1,004 18 18 18 153 312Chiropractors . . . . . . . . . . . . . . . . . . . . . . 42 54 54 53 30 29 28 12 20Dentists . . . . . . . . . . . . . . . . . . . . . . . . . 164 174 173 172 6 5 4 9 54Optometrists . . . . . . . . . . . . . . . . . . . . . . . 37 42 42 41 12 12 11 4 12Physicians . . . . . . . . . . . . . . . . . . . . . . . 539 659 659 661 22 22 23 120 205Podiatrists . . . . . . . . . . . . . . . . . . . . . . . . 13 15 15 15 16 15 15 2 5Veterinarians and veterinary
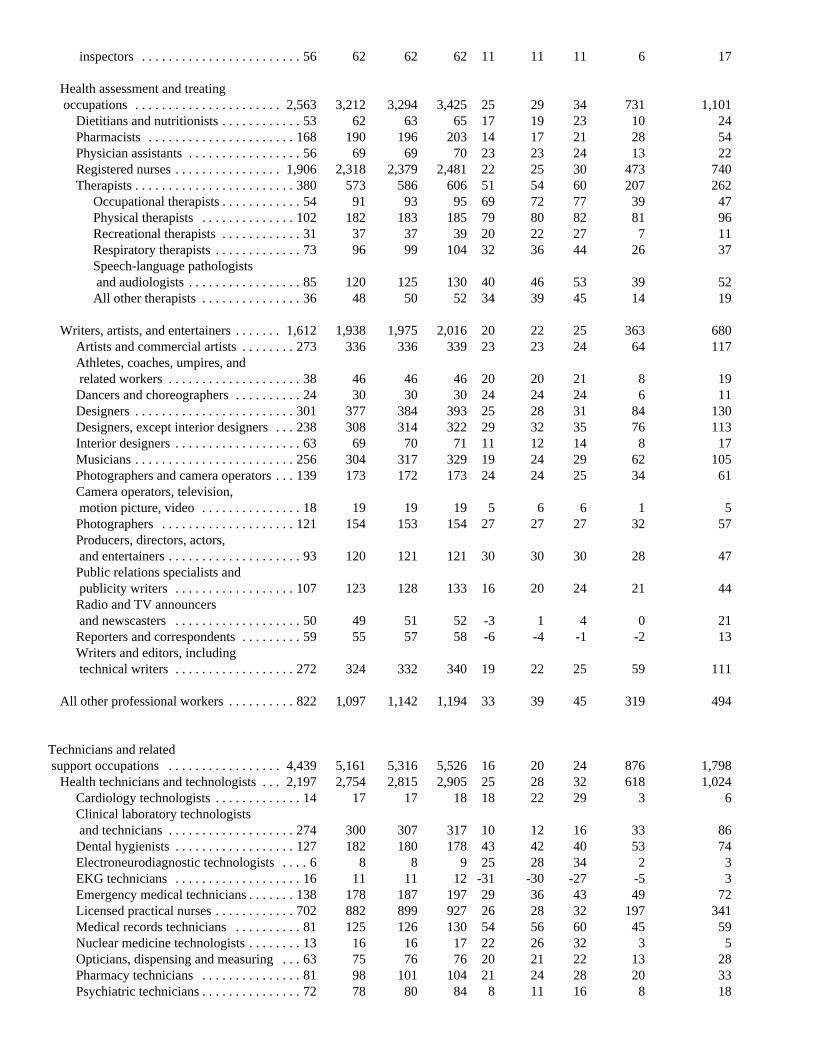
inspectors . . . . . . . . . . . . . . . . . . . . . . . . 56 62 62 62 11 11 11 6 17
Health assessment and treating occupations . . . . . . . . . . . . . . . . . . . . . . 2,563 3,212 3,294 3,425 25 29 34 731 1,101
Dietitians and nutritionists . . . . . . . . . . . . 53 62 63 65 17 19 23 10 24Pharmacists . . . . . . . . . . . . . . . . . . . . . . 168 190 196 203 14 17 21 28 54Physician assistants . . . . . . . . . . . . . . . . . 56 69 69 70 23 23 24 13 22Registered nurses . . . . . . . . . . . . . . . . 1,906 2,318 2,379 2,481 22 25 30 473 740Therapists . . . . . . . . . . . . . . . . . . . . . . . . 380 573 586 606 51 54 60 207 262
Occupational therapists . . . . . . . . . . . . 54 91 93 95 69 72 77 39 47Physical therapists . . . . . . . . . . . . . . 102 182 183 185 79 80 82 81 96Recreational therapists . . . . . . . . . . . . 31 37 37 39 20 22 27 7 11Respiratory therapists . . . . . . . . . . . . . 73 96 99 104 32 36 44 26 37Speech-language pathologists and audiologists . . . . . . . . . . . . . . . . . 85 120 125 130 40 46 53 39 52All other therapists . . . . . . . . . . . . . . . 36 48 50 52 34 39 45 14 19
Writers, artists, and entertainers . . . . . . . 1,612 1,938 1,975 2,016 20 22 25 363 680Artists and commercial artists . . . . . . . . 273 336 336 339 23 23 24 64 117Athletes, coaches, umpires, and related workers . . . . . . . . . . . . . . . . . . . . 38 46 46 46 20 20 21 8 19Dancers and choreographers . . . . . . . . . . 24 30 30 30 24 24 24 6 11Designers . . . . . . . . . . . . . . . . . . . . . . . . 301 377 384 393 25 28 31 84 130Designers, except interior designers . . . 238 308 314 322 29 32 35 76 113Interior designers . . . . . . . . . . . . . . . . . . . 63 69 70 71 11 12 14 8 17Musicians . . . . . . . . . . . . . . . . . . . . . . . . 256 304 317 329 19 24 29 62 105Photographers and camera operators . . . 139 173 172 173 24 24 25 34 61Camera operators, television, motion picture, video . . . . . . . . . . . . . . . 18 19 19 19 5 6 6 1 5Photographers . . . . . . . . . . . . . . . . . . . . 121 154 153 154 27 27 27 32 57Producers, directors, actors, and entertainers . . . . . . . . . . . . . . . . . . . . 93 120 121 121 30 30 30 28 47Public relations specialists and publicity writers . . . . . . . . . . . . . . . . . . 107 123 128 133 16 20 24 21 44Radio and TV announcers and newscasters . . . . . . . . . . . . . . . . . . . 50 49 51 52 -3 1 4 0 21Reporters and correspondents . . . . . . . . . 59 55 57 58 -6 -4 -1 -2 13Writers and editors, including technical writers . . . . . . . . . . . . . . . . . . 272 324 332 340 19 22 25 59 111
All other professional workers . . . . . . . . . . 822 1,097 1,142 1,194 33 39 45 319 494
Technicians and related support occupations . . . . . . . . . . . . . . . . . 4,439 5,161 5,316 5,526 16 20 24 876 1,798
Health technicians and technologists . . . 2,197 2,754 2,815 2,905 25 28 32 618 1,024Cardiology technologists . . . . . . . . . . . . . 14 17 17 18 18 22 29 3 6Clinical laboratory technologists and technicians . . . . . . . . . . . . . . . . . . . 274 300 307 317 10 12 16 33 86Dental hygienists . . . . . . . . . . . . . . . . . . 127 182 180 178 43 42 40 53 74Electroneurodiagnostic technologists . . . . 6 8 8 9 25 28 34 2 3EKG technicians . . . . . . . . . . . . . . . . . . . 16 11 11 12 -31 -30 -27 -5 3Emergency medical technicians . . . . . . . 138 178 187 197 29 36 43 49 72Licensed practical nurses . . . . . . . . . . . . 702 882 899 927 26 28 32 197 341Medical records technicians . . . . . . . . . . 81 125 126 130 54 56 60 45 59Nuclear medicine technologists . . . . . . . . 13 16 16 17 22 26 32 3 5Opticians, dispensing and measuring . . . 63 75 76 76 20 21 22 13 28Pharmacy technicians . . . . . . . . . . . . . . . 81 98 101 104 21 24 28 20 33Psychiatric technicians . . . . . . . . . . . . . . . 72 78 80 84 8 11 16 8 18
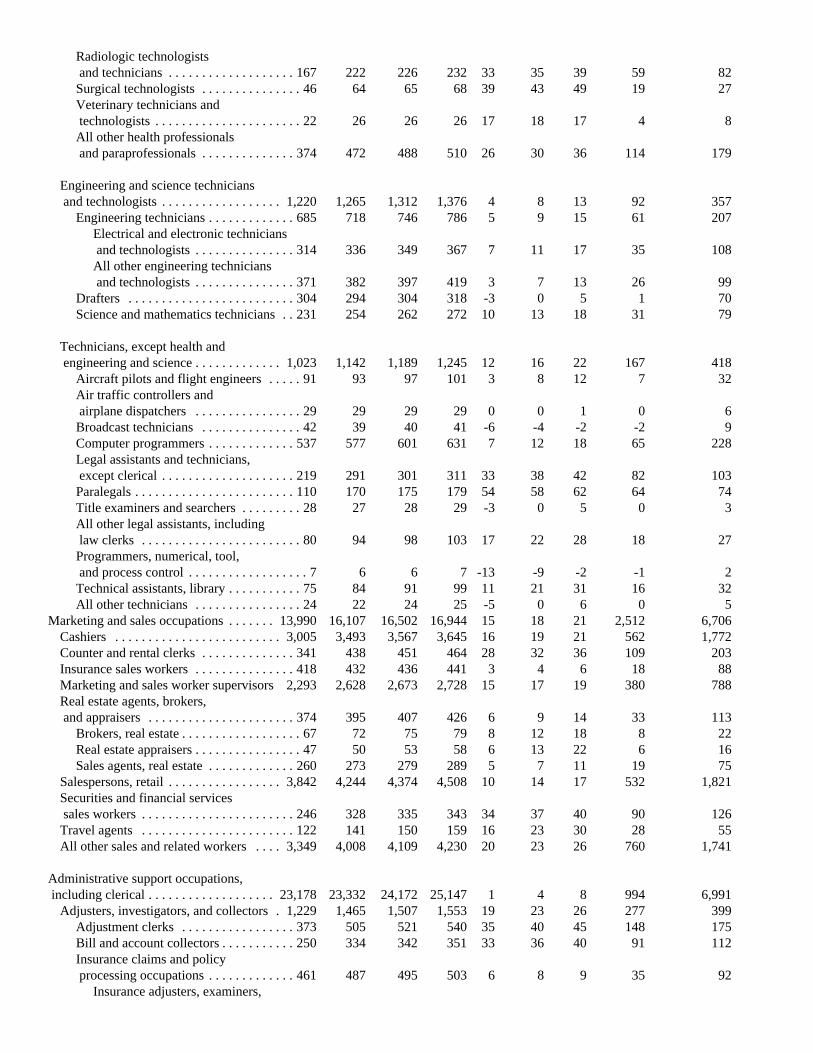
Radiologic technologists and technicians . . . . . . . . . . . . . . . . . . . 167 222 226 232 33 35 39 59 82Surgical technologists . . . . . . . . . . . . . . . 46 64 65 68 39 43 49 19 27Veterinary technicians and technologists . . . . . . . . . . . . . . . . . . . . . . 22 26 26 26 17 18 17 4 8All other health professionals and paraprofessionals . . . . . . . . . . . . . . 374 472 488 510 26 30 36 114 179
Engineering and science technicians and technologists . . . . . . . . . . . . . . . . . . 1,220 1,265 1,312 1,376 4 8 13 92 357
Engineering technicians . . . . . . . . . . . . . 685 718 746 786 5 9 15 61 207Electrical and electronic technicians and technologists . . . . . . . . . . . . . . . 314 336 349 367 7 11 17 35 108All other engineering technicians and technologists . . . . . . . . . . . . . . . 371 382 397 419 3 7 13 26 99
Drafters . . . . . . . . . . . . . . . . . . . . . . . . . 304 294 304 318 -3 0 5 1 70Science and mathematics technicians . . 231 254 262 272 10 13 18 31 79
Technicians, except health and engineering and science . . . . . . . . . . . . . 1,023 1,142 1,189 1,245 12 16 22 167 418
Aircraft pilots and flight engineers . . . . . 91 93 97 101 3 8 12 7 32Air traffic controllers and airplane dispatchers . . . . . . . . . . . . . . . . 29 29 29 29 0 0 1 0 6Broadcast technicians . . . . . . . . . . . . . . . 42 39 40 41 -6 -4 -2 -2 9Computer programmers . . . . . . . . . . . . . 537 577 601 631 7 12 18 65 228Legal assistants and technicians, except clerical . . . . . . . . . . . . . . . . . . . . 219 291 301 311 33 38 42 82 103Paralegals . . . . . . . . . . . . . . . . . . . . . . . . 110 170 175 179 54 58 62 64 74Title examiners and searchers . . . . . . . . . 28 27 28 29 -3 0 5 0 3All other legal assistants, including law clerks . . . . . . . . . . . . . . . . . . . . . . . . 80 94 98 103 17 22 28 18 27Programmers, numerical, tool, and process control . . . . . . . . . . . . . . . . . . 7 6 6 7 -13 -9 -2 -1 2Technical assistants, library . . . . . . . . . . . 75 84 91 99 11 21 31 16 32All other technicians . . . . . . . . . . . . . . . . 24 22 24 25 -5 0 6 0 5
Marketing and sales occupations . . . . . . . 13,990 16,107 16,502 16,944 15 18 21 2,512 6,706Cashiers . . . . . . . . . . . . . . . . . . . . . . . . . 3,005 3,493 3,567 3,645 16 19 21 562 1,772Counter and rental clerks . . . . . . . . . . . . . . 341 438 451 464 28 32 36 109 203Insurance sales workers . . . . . . . . . . . . . . . 418 432 436 441 3 4 6 18 88Marketing and sales worker supervisors 2,293 2,628 2,673 2,728 15 17 19 380 788Real estate agents, brokers, and appraisers . . . . . . . . . . . . . . . . . . . . . . 374 395 407 426 6 9 14 33 113
Brokers, real estate . . . . . . . . . . . . . . . . . . 67 72 75 79 8 12 18 8 22Real estate appraisers . . . . . . . . . . . . . . . . 47 50 53 58 6 13 22 6 16Sales agents, real estate . . . . . . . . . . . . . 260 273 279 289 5 7 11 19 75
Salespersons, retail . . . . . . . . . . . . . . . . . 3,842 4,244 4,374 4,508 10 14 17 532 1,821Securities and financial services sales workers . . . . . . . . . . . . . . . . . . . . . . . 246 328 335 343 34 37 40 90 126Travel agents . . . . . . . . . . . . . . . . . . . . . . . 122 141 150 159 16 23 30 28 55All other sales and related workers . . . . 3,349 4,008 4,109 4,230 20 23 26 760 1,741
Administrative support occupations, including clerical . . . . . . . . . . . . . . . . . . . 23,178 23,332 24,172 25,147 1 4 8 994 6,991
Adjusters, investigators, and collectors . 1,229 1,465 1,507 1,553 19 23 26 277 399Adjustment clerks . . . . . . . . . . . . . . . . . 373 505 521 540 35 40 45 148 175Bill and account collectors . . . . . . . . . . . 250 334 342 351 33 36 40 91 112Insurance claims and policy processing occupations . . . . . . . . . . . . . 461 487 495 503 6 8 9 35 92
Insurance adjusters, examiners,
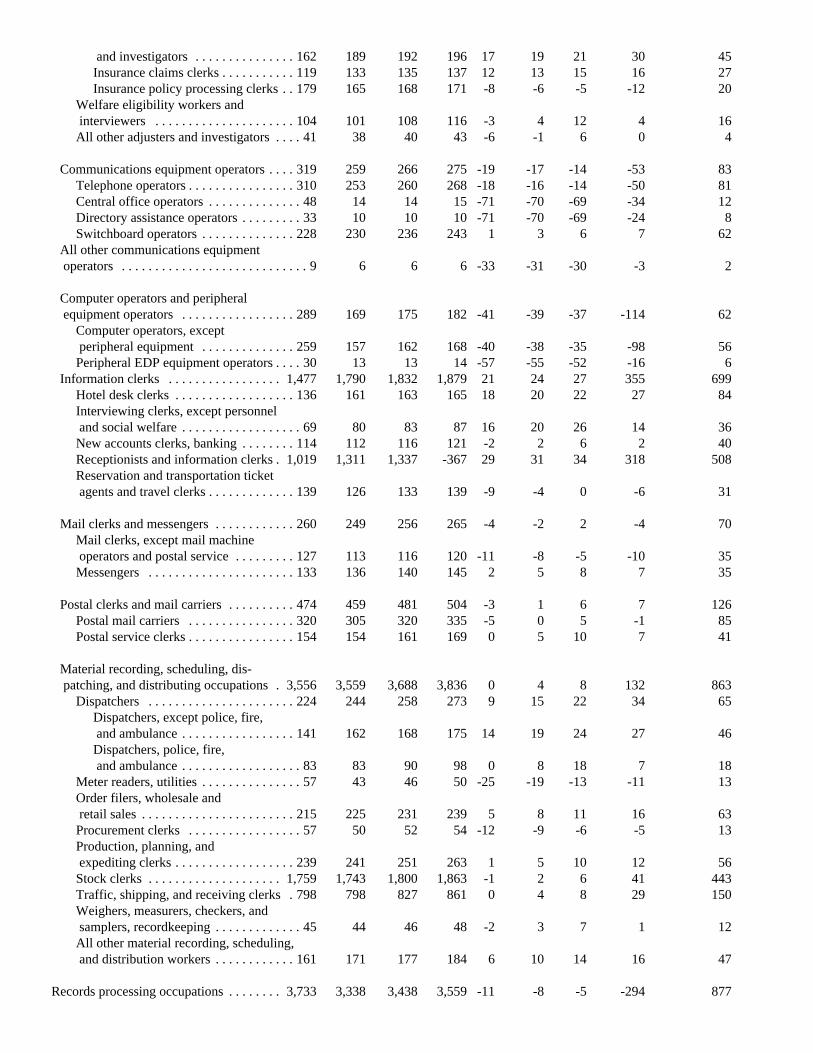
and investigators . . . . . . . . . . . . . . . 162 189 192 196 17 19 21 30 45Insurance claims clerks . . . . . . . . . . . 119 133 135 137 12 13 15 16 27Insurance policy processing clerks . . 179 165 168 171 -8 -6 -5 -12 20
Welfare eligibility workers and interviewers . . . . . . . . . . . . . . . . . . . . . 104 101 108 116 -3 4 12 4 16All other adjusters and investigators . . . . 41 38 40 43 -6 -1 6 0 4
Communications equipment operators . . . . 319 259 266 275 -19 -17 -14 -53 83Telephone operators . . . . . . . . . . . . . . . . 310 253 260 268 -18 -16 -14 -50 81Central office operators . . . . . . . . . . . . . . 48 14 14 15 -71 -70 -69 -34 12Directory assistance operators . . . . . . . . . 33 10 10 10 -71 -70 -69 -24 8Switchboard operators . . . . . . . . . . . . . . 228 230 236 243 1 3 6 7 62
All other communications equipment operators . . . . . . . . . . . . . . . . . . . . . . . . . . . . 9 6 6 6 -33 -31 -30 -3 2
Computer operators and peripheral equipment operators . . . . . . . . . . . . . . . . . 289 169 175 182 -41 -39 -37 -114 62
Computer operators, except peripheral equipment . . . . . . . . . . . . . . 259 157 162 168 -40 -38 -35 -98 56Peripheral EDP equipment operators . . . . 30 13 13 14 -57 -55 -52 -16 6
Information clerks . . . . . . . . . . . . . . . . . 1,477 1,790 1,832 1,879 21 24 27 355 699Hotel desk clerks . . . . . . . . . . . . . . . . . . 136 161 163 165 18 20 22 27 84Interviewing clerks, except personnel and social welfare . . . . . . . . . . . . . . . . . . 69 80 83 87 16 20 26 14 36New accounts clerks, banking . . . . . . . . 114 112 116 121 -2 2 6 2 40Receptionists and information clerks . 1,019 1,311 1,337 -367 29 31 34 318 508Reservation and transportation ticket agents and travel clerks . . . . . . . . . . . . . 139 126 133 139 -9 -4 0 -6 31
Mail clerks and messengers . . . . . . . . . . . . 260 249 256 265 -4 -2 2 -4 70Mail clerks, except mail machine operators and postal service . . . . . . . . . 127 113 116 120 -11 -8 -5 -10 35Messengers . . . . . . . . . . . . . . . . . . . . . . 133 136 140 145 2 5 8 7 35
Postal clerks and mail carriers . . . . . . . . . . 474 459 481 504 -3 1 6 7 126Postal mail carriers . . . . . . . . . . . . . . . . 320 305 320 335 -5 0 5 -1 85Postal service clerks . . . . . . . . . . . . . . . . 154 154 161 169 0 5 10 7 41
Material recording, scheduling, dis- patching, and distributing occupations . 3,556 3,559 3,688 3,836 0 4 8 132 863
Dispatchers . . . . . . . . . . . . . . . . . . . . . . 224 244 258 273 9 15 22 34 65Dispatchers, except police, fire, and ambulance . . . . . . . . . . . . . . . . . 141 162 168 175 14 19 24 27 46Dispatchers, police, fire, and ambulance . . . . . . . . . . . . . . . . . . 83 83 90 98 0 8 18 7 18
Meter readers, utilities . . . . . . . . . . . . . . . 57 43 46 50 -25 -19 -13 -11 13Order filers, wholesale and retail sales . . . . . . . . . . . . . . . . . . . . . . . 215 225 231 239 5 8 11 16 63Procurement clerks . . . . . . . . . . . . . . . . . 57 50 52 54 -12 -9 -6 -5 13Production, planning, and expediting clerks . . . . . . . . . . . . . . . . . . 239 241 251 263 1 5 10 12 56Stock clerks . . . . . . . . . . . . . . . . . . . . 1,759 1,743 1,800 1,863 -1 2 6 41 443Traffic, shipping, and receiving clerks . 798 798 827 861 0 4 8 29 150Weighers, measurers, checkers, and samplers, recordkeeping . . . . . . . . . . . . . 45 44 46 48 -2 3 7 1 12All other material recording, scheduling, and distribution workers . . . . . . . . . . . . 161 171 177 184 6 10 14 16 47
Records processing occupations . . . . . . . . 3,733 3,338 3,438 3,559 -11 -8 -5 -294 877
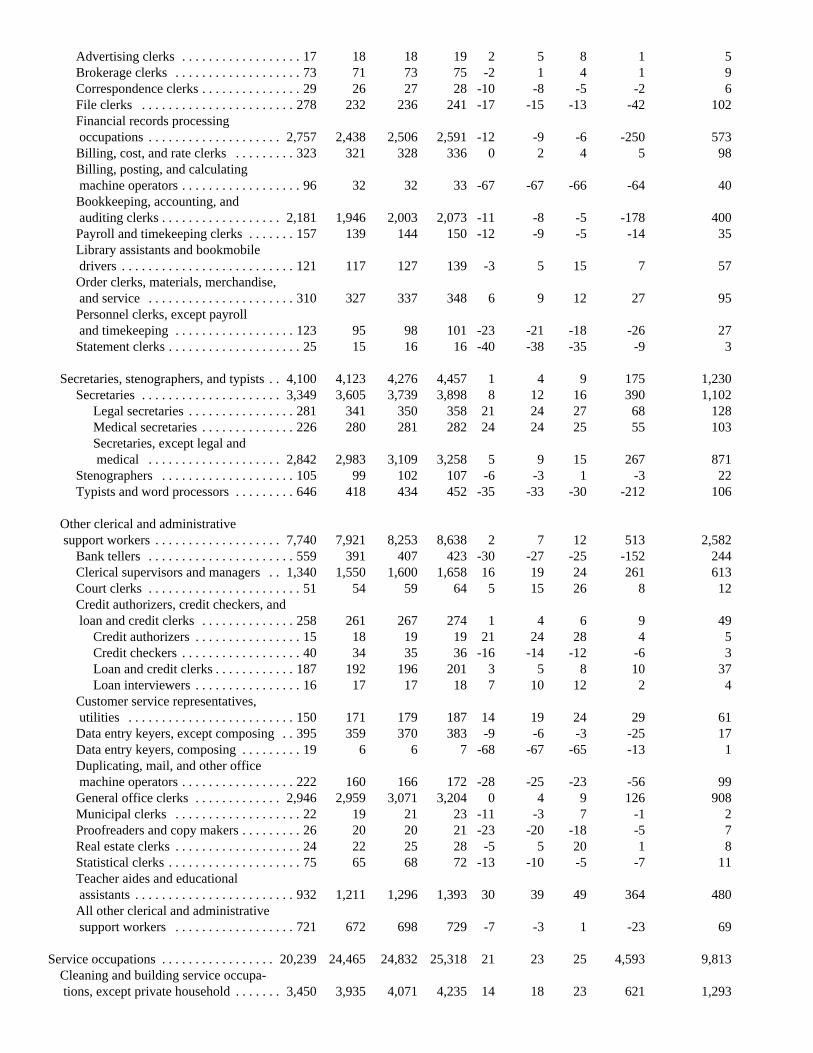
Advertising clerks . . . . . . . . . . . . . . . . . . 17 18 18 19 2 5 8 1 5Brokerage clerks . . . . . . . . . . . . . . . . . . . 73 71 73 75 -2 1 4 1 9Correspondence clerks . . . . . . . . . . . . . . . 29 26 27 28 -10 -8 -5 -2 6File clerks . . . . . . . . . . . . . . . . . . . . . . . 278 232 236 241 -17 -15 -13 -42 102Financial records processing occupations . . . . . . . . . . . . . . . . . . . . 2,757 2,438 2,506 2,591 -12 -9 -6 -250 573Billing, cost, and rate clerks . . . . . . . . . 323 321 328 336 0 2 4 5 98Billing, posting, and calculating machine operators . . . . . . . . . . . . . . . . . . 96 32 32 33 -67 -67 -66 -64 40Bookkeeping, accounting, and auditing clerks . . . . . . . . . . . . . . . . . . 2,181 1,946 2,003 2,073 -11 -8 -5 -178 400Payroll and timekeeping clerks . . . . . . . 157 139 144 150 -12 -9 -5 -14 35Library assistants and bookmobile drivers . . . . . . . . . . . . . . . . . . . . . . . . . . 121 117 127 139 -3 5 15 7 57Order clerks, materials, merchandise, and service . . . . . . . . . . . . . . . . . . . . . . 310 327 337 348 6 9 12 27 95Personnel clerks, except payroll and timekeeping . . . . . . . . . . . . . . . . . . 123 95 98 101 -23 -21 -18 -26 27Statement clerks . . . . . . . . . . . . . . . . . . . . 25 15 16 16 -40 -38 -35 -9 3
Secretaries, stenographers, and typists . . 4,100 4,123 4,276 4,457 1 4 9 175 1,230Secretaries . . . . . . . . . . . . . . . . . . . . . 3,349 3,605 3,739 3,898 8 12 16 390 1,102
Legal secretaries . . . . . . . . . . . . . . . . 281 341 350 358 21 24 27 68 128Medical secretaries . . . . . . . . . . . . . . 226 280 281 282 24 24 25 55 103Secretaries, except legal and medical . . . . . . . . . . . . . . . . . . . . 2,842 2,983 3,109 3,258 5 9 15 267 871
Stenographers . . . . . . . . . . . . . . . . . . . . 105 99 102 107 -6 -3 1 -3 22Typists and word processors . . . . . . . . . 646 418 434 452 -35 -33 -30 -212 106
Other clerical and administrative support workers . . . . . . . . . . . . . . . . . . . 7,740 7,921 8,253 8,638 2 7 12 513 2,582
Bank tellers . . . . . . . . . . . . . . . . . . . . . . 559 391 407 423 -30 -27 -25 -152 244Clerical supervisors and managers . . 1,340 1,550 1,600 1,658 16 19 24 261 613Court clerks . . . . . . . . . . . . . . . . . . . . . . . 51 54 59 64 5 15 26 8 12Credit authorizers, credit checkers, and loan and credit clerks . . . . . . . . . . . . . . 258 261 267 274 1 4 6 9 49
Credit authorizers . . . . . . . . . . . . . . . . 15 18 19 19 21 24 28 4 5Credit checkers . . . . . . . . . . . . . . . . . . 40 34 35 36 -16 -14 -12 -6 3Loan and credit clerks . . . . . . . . . . . . 187 192 196 201 3 5 8 10 37Loan interviewers . . . . . . . . . . . . . . . . 16 17 17 18 7 10 12 2 4
Customer service representatives, utilities . . . . . . . . . . . . . . . . . . . . . . . . . 150 171 179 187 14 19 24 29 61Data entry keyers, except composing . . 395 359 370 383 -9 -6 -3 -25 17Data entry keyers, composing . . . . . . . . . 19 6 6 7 -68 -67 -65 -13 1Duplicating, mail, and other office machine operators . . . . . . . . . . . . . . . . . 222 160 166 172 -28 -25 -23 -56 99General office clerks . . . . . . . . . . . . . 2,946 2,959 3,071 3,204 0 4 9 126 908Municipal clerks . . . . . . . . . . . . . . . . . . . 22 19 21 23 -11 -3 7 -1 2Proofreaders and copy makers . . . . . . . . . 26 20 20 21 -23 -20 -18 -5 7Real estate clerks . . . . . . . . . . . . . . . . . . . 24 22 25 28 -5 5 20 1 8Statistical clerks . . . . . . . . . . . . . . . . . . . . 75 65 68 72 -13 -10 -5 -7 11Teacher aides and educational assistants . . . . . . . . . . . . . . . . . . . . . . . . 932 1,211 1,296 1,393 30 39 49 364 480All other clerical and administrative support workers . . . . . . . . . . . . . . . . . . 721 672 698 729 -7 -3 1 -23 69
Service occupations . . . . . . . . . . . . . . . . . 20,239 24,465 24,832 25,318 21 23 25 4,593 9,813Cleaning and building service occupa- tions, except private household . . . . . . . 3,450 3,935 4,071 4,235 14 18 23 621 1,293
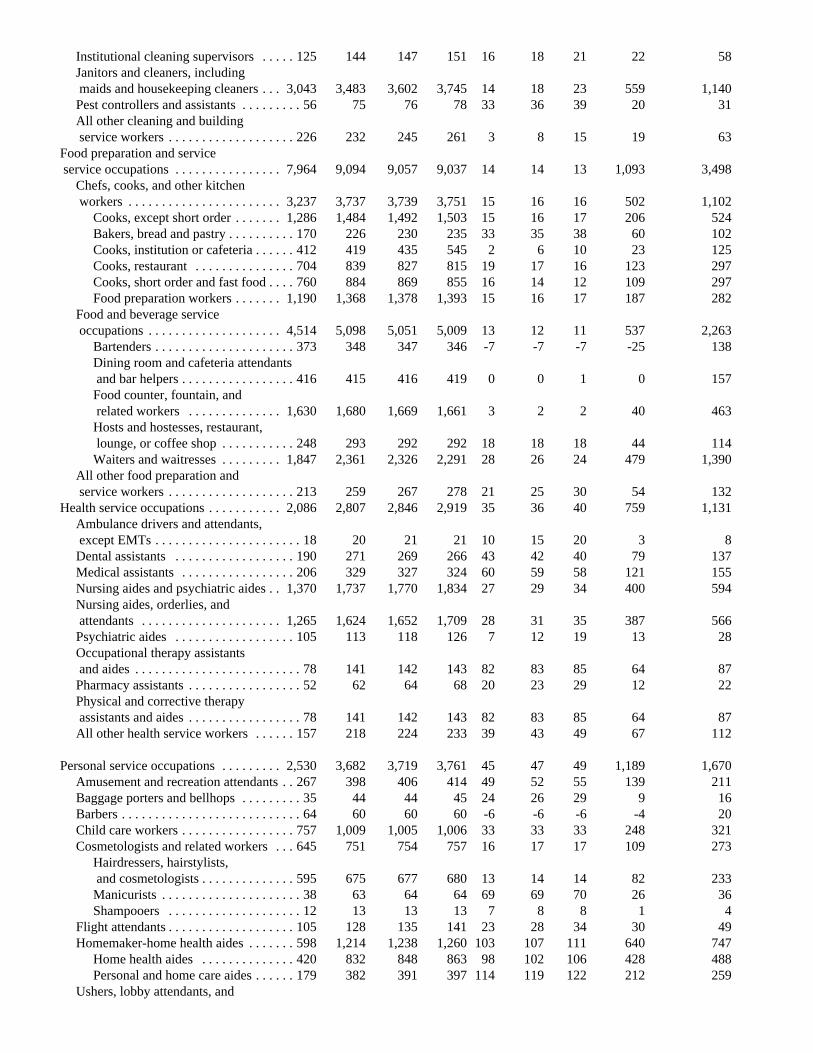
Institutional cleaning supervisors . . . . . 125 144 147 151 16 18 21 22 58Janitors and cleaners, including maids and housekeeping cleaners . . . 3,043 3,483 3,602 3,745 14 18 23 559 1,140Pest controllers and assistants . . . . . . . . . 56 75 76 78 33 36 39 20 31All other cleaning and building
service workers . . . . . . . . . . . . . . . . . . . 226 232 245 261 3 8 15 19 63Food preparation and service service occupations . . . . . . . . . . . . . . . . 7,964 9,094 9,057 9,037 14 14 13 1,093 3,498
Chefs, cooks, and other kitchen workers . . . . . . . . . . . . . . . . . . . . . . . 3,237 3,737 3,739 3,751 15 16 16 502 1,102
Cooks, except short order . . . . . . . 1,286 1,484 1,492 1,503 15 16 17 206 524Bakers, bread and pastry . . . . . . . . . . 170 226 230 235 33 35 38 60 102Cooks, institution or cafeteria . . . . . . 412 419 435 545 2 6 10 23 125Cooks, restaurant . . . . . . . . . . . . . . . 704 839 827 815 19 17 16 123 297Cooks, short order and fast food . . . . 760 884 869 855 16 14 12 109 297Food preparation workers . . . . . . . 1,190 1,368 1,378 1,393 15 16 17 187 282
Food and beverage service occupations . . . . . . . . . . . . . . . . . . . . 4,514 5,098 5,051 5,009 13 12 11 537 2,263
Bartenders . . . . . . . . . . . . . . . . . . . . . 373 348 347 346 -7 -7 -7 -25 138Dining room and cafeteria attendants and bar helpers . . . . . . . . . . . . . . . . . 416 415 416 419 0 0 1 0 157Food counter, fountain, and related workers . . . . . . . . . . . . . . 1,630 1,680 1,669 1,661 3 2 2 40 463Hosts and hostesses, restaurant, lounge, or coffee shop . . . . . . . . . . . 248 293 292 292 18 18 18 44 114Waiters and waitresses . . . . . . . . . 1,847 2,361 2,326 2,291 28 26 24 479 1,390
All other food preparation and service workers . . . . . . . . . . . . . . . . . . . 213 259 267 278 21 25 30 54 132
Health service occupations . . . . . . . . . . . 2,086 2,807 2,846 2,919 35 36 40 759 1,131Ambulance drivers and attendants, except EMTs . . . . . . . . . . . . . . . . . . . . . . 18 20 21 21 10 15 20 3 8Dental assistants . . . . . . . . . . . . . . . . . . 190 271 269 266 43 42 40 79 137Medical assistants . . . . . . . . . . . . . . . . . 206 329 327 324 60 59 58 121 155Nursing aides and psychiatric aides . . 1,370 1,737 1,770 1,834 27 29 34 400 594Nursing aides, orderlies, and attendants . . . . . . . . . . . . . . . . . . . . . 1,265 1,624 1,652 1,709 28 31 35 387 566Psychiatric aides . . . . . . . . . . . . . . . . . . 105 113 118 126 7 12 19 13 28Occupational therapy assistants and aides . . . . . . . . . . . . . . . . . . . . . . . . . 78 141 142 143 82 83 85 64 87Pharmacy assistants . . . . . . . . . . . . . . . . . 52 62 64 68 20 23 29 12 22Physical and corrective therapy assistants and aides . . . . . . . . . . . . . . . . . 78 141 142 143 82 83 85 64 87All other health service workers . . . . . . 157 218 224 233 39 43 49 67 112
Personal service occupations . . . . . . . . . 2,530 3,682 3,719 3,761 45 47 49 1,189 1,670Amusement and recreation attendants . . 267 398 406 414 49 52 55 139 211Baggage porters and bellhops . . . . . . . . . 35 44 44 45 24 26 29 9 16Barbers . . . . . . . . . . . . . . . . . . . . . . . . . . . 64 60 60 60 -6 -6 -6 -4 20Child care workers . . . . . . . . . . . . . . . . . 757 1,009 1,005 1,006 33 33 33 248 321Cosmetologists and related workers . . . 645 751 754 757 16 17 17 109 273
Hairdressers, hairstylists, and cosmetologists . . . . . . . . . . . . . . 595 675 677 680 13 14 14 82 233Manicurists . . . . . . . . . . . . . . . . . . . . . 38 63 64 64 69 69 70 26 36Shampooers . . . . . . . . . . . . . . . . . . . . 12 13 13 13 7 8 8 1 4
Flight attendants . . . . . . . . . . . . . . . . . . . 105 128 135 141 23 28 34 30 49Homemaker-home health aides . . . . . . . 598 1,214 1,238 1,260 103 107 111 640 747
Home health aides . . . . . . . . . . . . . . 420 832 848 863 98 102 106 428 488Personal and home care aides . . . . . . 179 382 391 397 114 119 122 212 259
Ushers, lobby attendants, and
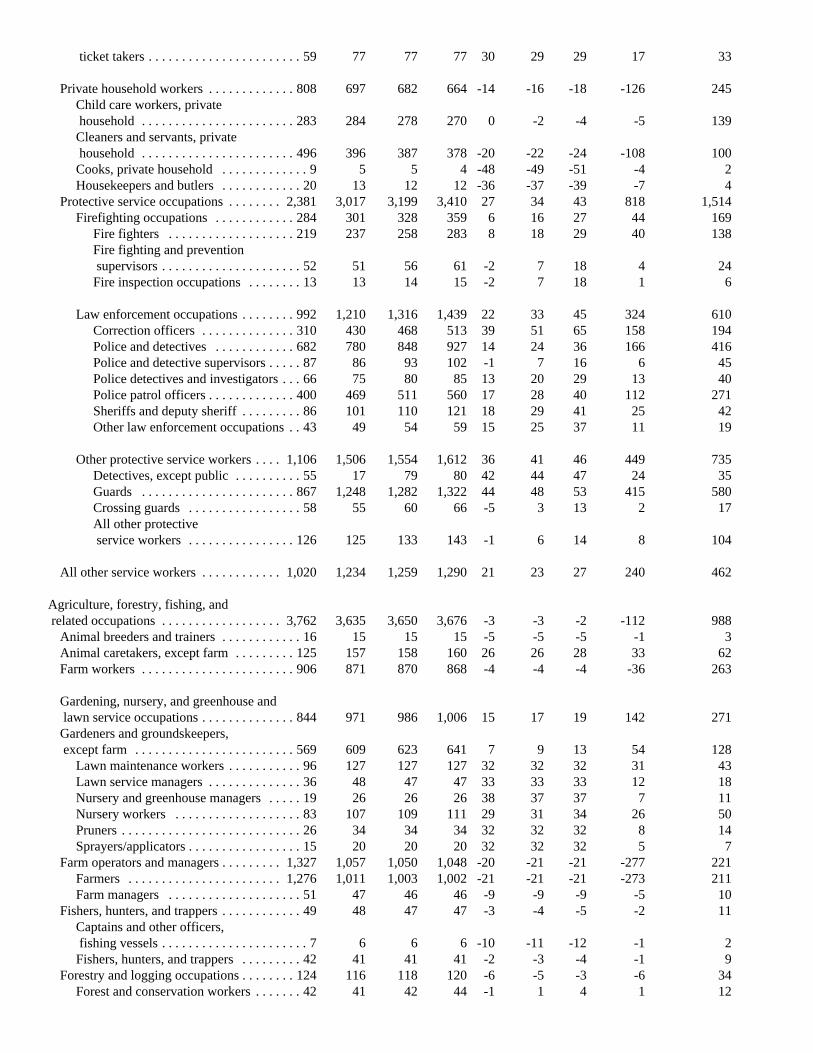
ticket takers . . . . . . . . . . . . . . . . . . . . . . . 59 77 77 77 30 29 29 17 33
Private household workers . . . . . . . . . . . . . 808 697 682 664 -14 -16 -18 -126 245Child care workers, private household . . . . . . . . . . . . . . . . . . . . . . . 283 284 278 270 0 -2 -4 -5 139Cleaners and servants, private household . . . . . . . . . . . . . . . . . . . . . . . 496 396 387 378 -20 -22 -24 -108 100Cooks, private household . . . . . . . . . . . . . 9 5 5 4 -48 -49 -51 -4 2Housekeepers and butlers . . . . . . . . . . . . 20 13 12 12 -36 -37 -39 -7 4
Protective service occupations . . . . . . . . 2,381 3,017 3,199 3,410 27 34 43 818 1,514Firefighting occupations . . . . . . . . . . . . 284 301 328 359 6 16 27 44 169
Fire fighters . . . . . . . . . . . . . . . . . . . 219 237 258 283 8 18 29 40 138Fire fighting and prevention supervisors . . . . . . . . . . . . . . . . . . . . . 52 51 56 61 -2 7 18 4 24Fire inspection occupations . . . . . . . . 13 13 14 15 -2 7 18 1 6
Law enforcement occupations . . . . . . . . 992 1,210 1,316 1,439 22 33 45 324 610Correction officers . . . . . . . . . . . . . . 310 430 468 513 39 51 65 158 194Police and detectives . . . . . . . . . . . . 682 780 848 927 14 24 36 166 416Police and detective supervisors . . . . . 87 86 93 102 -1 7 16 6 45Police detectives and investigators . . . 66 75 80 85 13 20 29 13 40Police patrol officers . . . . . . . . . . . . . 400 469 511 560 17 28 40 112 271Sheriffs and deputy sheriff . . . . . . . . . 86 101 110 121 18 29 41 25 42Other law enforcement occupations . . 43 49 54 59 15 25 37 11 19
Other protective service workers . . . . 1,106 1,506 1,554 1,612 36 41 46 449 735Detectives, except public . . . . . . . . . . 55 17 79 80 42 44 47 24 35Guards . . . . . . . . . . . . . . . . . . . . . . . 867 1,248 1,282 1,322 44 48 53 415 580Crossing guards . . . . . . . . . . . . . . . . . 58 55 60 66 -5 3 13 2 17All other protective service workers . . . . . . . . . . . . . . . . 126 125 133 143 -1 6 14 8 104
All other service workers . . . . . . . . . . . . 1,020 1,234 1,259 1,290 21 23 27 240 462
Agriculture, forestry, fishing, and related occupations . . . . . . . . . . . . . . . . . . 3,762 3,635 3,650 3,676 -3 -3 -2 -112 988
Animal breeders and trainers . . . . . . . . . . . . 16 15 15 15 -5 -5 -5 -1 3Animal caretakers, except farm . . . . . . . . . 125 157 158 160 26 26 28 33 62Farm workers . . . . . . . . . . . . . . . . . . . . . . . 906 871 870 868 -4 -4 -4 -36 263
Gardening, nursery, and greenhouse and lawn service occupations . . . . . . . . . . . . . . 844 971 986 1,006 15 17 19 142 271Gardeners and groundskeepers, except farm . . . . . . . . . . . . . . . . . . . . . . . . 569 609 623 641 7 9 13 54 128
Lawn maintenance workers . . . . . . . . . . . 96 127 127 127 32 32 32 31 43Lawn service managers . . . . . . . . . . . . . . 36 48 47 47 33 33 33 12 18Nursery and greenhouse managers . . . . . 19 26 26 26 38 37 37 7 11Nursery workers . . . . . . . . . . . . . . . . . . . 83 107 109 111 29 31 34 26 50Pruners . . . . . . . . . . . . . . . . . . . . . . . . . . . 26 34 34 34 32 32 32 8 14Sprayers/applicators . . . . . . . . . . . . . . . . . 15 20 20 20 32 32 32 5 7
Farm operators and managers . . . . . . . . . 1,327 1,057 1,050 1,048 -20 -21 -21 -277 221Farmers . . . . . . . . . . . . . . . . . . . . . . . 1,276 1,011 1,003 1,002 -21 -21 -21 -273 211Farm managers . . . . . . . . . . . . . . . . . . . . 51 47 46 46 -9 -9 -9 -5 10
Fishers, hunters, and trappers . . . . . . . . . . . . 49 48 47 47 -3 -4 -5 -2 11Captains and other officers, fishing vessels . . . . . . . . . . . . . . . . . . . . . . 7 6 6 6 -10 -11 -12 -1 2Fishers, hunters, and trappers . . . . . . . . . 42 41 41 41 -2 -3 -4 -1 9
Forestry and logging occupations . . . . . . . . 124 116 118 120 -6 -5 -3 -6 34Forest and conservation workers . . . . . . . 42 41 42 44 -1 1 4 1 12
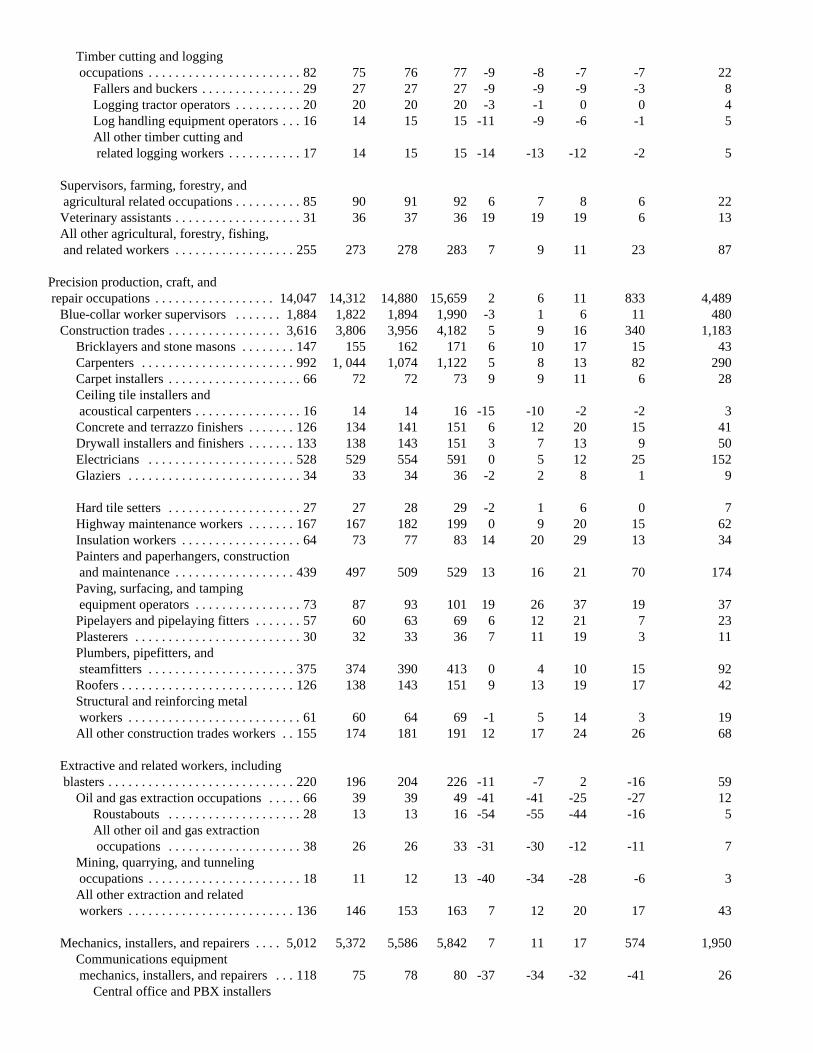
Timber cutting and logging occupations . . . . . . . . . . . . . . . . . . . . . . . 82 75 76 77 -9 -8 -7 -7 22
Fallers and buckers . . . . . . . . . . . . . . . 29 27 27 27 -9 -9 -9 -3 8Logging tractor operators . . . . . . . . . . 20 20 20 20 -3 -1 0 0 4Log handling equipment operators . . . 16 14 15 15 -11 -9 -6 -1 5All other timber cutting and related logging workers . . . . . . . . . . . 17 14 15 15 -14 -13 -12 -2 5
Supervisors, farming, forestry, and agricultural related occupations . . . . . . . . . . 85 90 91 92 6 7 8 6 22Veterinary assistants . . . . . . . . . . . . . . . . . . . 31 36 37 36 19 19 19 6 13All other agricultural, forestry, fishing, and related workers . . . . . . . . . . . . . . . . . . 255 273 278 283 7 9 11 23 87
Precision production, craft, and repair occupations . . . . . . . . . . . . . . . . . . 14,047 14,312 14,880 15,659 2 6 11 833 4,489
Blue-collar worker supervisors . . . . . . . 1,884 1,822 1,894 1,990 -3 1 6 11 480Construction trades . . . . . . . . . . . . . . . . . 3,616 3,806 3,956 4,182 5 9 16 340 1,183
Bricklayers and stone masons . . . . . . . . 147 155 162 171 6 10 17 15 43Carpenters . . . . . . . . . . . . . . . . . . . . . . . 992 1, 044 1,074 1,122 5 8 13 82 290Carpet installers . . . . . . . . . . . . . . . . . . . . 66 72 72 73 9 9 11 6 28Ceiling tile installers and acoustical carpenters . . . . . . . . . . . . . . . . 16 14 14 16 -15 -10 -2 -2 3Concrete and terrazzo finishers . . . . . . . 126 134 141 151 6 12 20 15 41Drywall installers and finishers . . . . . . . 133 138 143 151 3 7 13 9 50Electricians . . . . . . . . . . . . . . . . . . . . . . 528 529 554 591 0 5 12 25 152Glaziers . . . . . . . . . . . . . . . . . . . . . . . . . . 34 33 34 36 -2 2 8 1 9
Hard tile setters . . . . . . . . . . . . . . . . . . . . 27 27 28 29 -2 1 6 0 7Highway maintenance workers . . . . . . . 167 167 182 199 0 9 20 15 62Insulation workers . . . . . . . . . . . . . . . . . . 64 73 77 83 14 20 29 13 34Painters and paperhangers, construction and maintenance . . . . . . . . . . . . . . . . . . 439 497 509 529 13 16 21 70 174Paving, surfacing, and tamping equipment operators . . . . . . . . . . . . . . . . 73 87 93 101 19 26 37 19 37Pipelayers and pipelaying fitters . . . . . . . 57 60 63 69 6 12 21 7 23Plasterers . . . . . . . . . . . . . . . . . . . . . . . . . 30 32 33 36 7 11 19 3 11Plumbers, pipefitters, and steamfitters . . . . . . . . . . . . . . . . . . . . . . 375 374 390 413 0 4 10 15 92Roofers . . . . . . . . . . . . . . . . . . . . . . . . . . 126 138 143 151 9 13 19 17 42Structural and reinforcing metal workers . . . . . . . . . . . . . . . . . . . . . . . . . . 61 60 64 69 -1 5 14 3 19All other construction trades workers . . 155 174 181 191 12 17 24 26 68
Extractive and related workers, including blasters . . . . . . . . . . . . . . . . . . . . . . . . . . . . 220 196 204 226 -11 -7 2 -16 59
Oil and gas extraction occupations . . . . . 66 39 39 49 -41 -41 -25 -27 12Roustabouts . . . . . . . . . . . . . . . . . . . . 28 13 13 16 -54 -55 -44 -16 5All other oil and gas extraction
occupations . . . . . . . . . . . . . . . . . . . . 38 26 26 33 -31 -30 -12 -11 7Mining, quarrying, and tunneling occupations . . . . . . . . . . . . . . . . . . . . . . . 18 11 12 13 -40 -34 -28 -6 3All other extraction and related workers . . . . . . . . . . . . . . . . . . . . . . . . . 136 146 153 163 7 12 20 17 43
Mechanics, installers, and repairers . . . . 5,012 5,372 5,586 5,842 7 11 17 574 1,950Communications equipment mechanics, installers, and repairers . . . 118 75 78 80 -37 -34 -32 -41 26
Central office and PBX installers
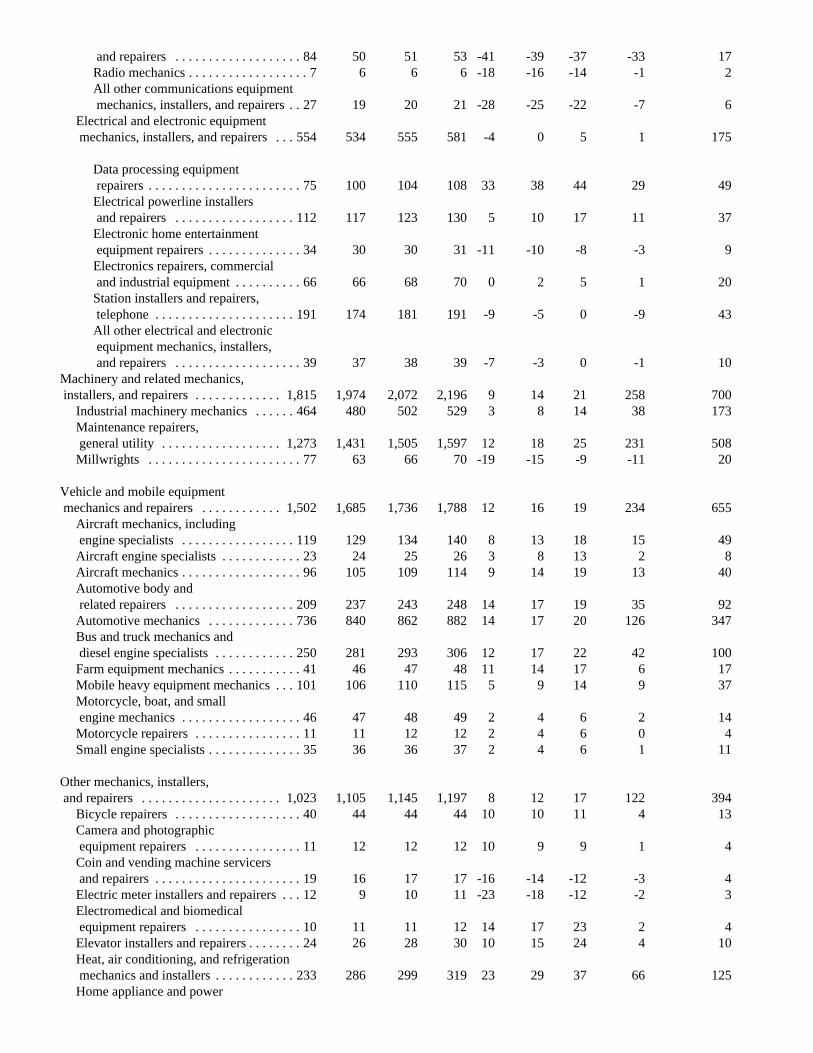
and repairers . . . . . . . . . . . . . . . . . . . 84 50 51 53 -41 -39 -37 -33 17Radio mechanics . . . . . . . . . . . . . . . . . . 7 6 6 6 -18 -16 -14 -1 2All other communications equipment mechanics, installers, and repairers . . 27 19 20 21 -28 -25 -22 -7 6
Electrical and electronic equipment mechanics, installers, and repairers . . . 554 534 555 581 -4 0 5 1 175
Data processing equipment repairers . . . . . . . . . . . . . . . . . . . . . . . 75 100 104 108 33 38 44 29 49Electrical powerline installers and repairers . . . . . . . . . . . . . . . . . . 112 117 123 130 5 10 17 11 37Electronic home entertainment equipment repairers . . . . . . . . . . . . . . 34 30 30 31 -11 -10 -8 -3 9Electronics repairers, commercial and industrial equipment . . . . . . . . . . 66 66 68 70 0 2 5 1 20Station installers and repairers, telephone . . . . . . . . . . . . . . . . . . . . . 191 174 181 191 -9 -5 0 -9 43All other electrical and electronic equipment mechanics, installers, and repairers . . . . . . . . . . . . . . . . . . . 39 37 38 39 -7 -3 0 -1 10
Machinery and related mechanics, installers, and repairers . . . . . . . . . . . . . 1,815 1,974 2,072 2,196 9 14 21 258 700
Industrial machinery mechanics . . . . . . 464 480 502 529 3 8 14 38 173Maintenance repairers, general utility . . . . . . . . . . . . . . . . . . 1,273 1,431 1,505 1,597 12 18 25 231 508Millwrights . . . . . . . . . . . . . . . . . . . . . . . 77 63 66 70 -19 -15 -9 -11 20
Vehicle and mobile equipment mechanics and repairers . . . . . . . . . . . . 1,502 1,685 1,736 1,788 12 16 19 234 655
Aircraft mechanics, including engine specialists . . . . . . . . . . . . . . . . . 119 129 134 140 8 13 18 15 49Aircraft engine specialists . . . . . . . . . . . . 23 24 25 26 3 8 13 2 8Aircraft mechanics . . . . . . . . . . . . . . . . . . 96 105 109 114 9 14 19 13 40Automotive body and related repairers . . . . . . . . . . . . . . . . . . 209 237 243 248 14 17 19 35 92Automotive mechanics . . . . . . . . . . . . . 736 840 862 882 14 17 20 126 347Bus and truck mechanics and diesel engine specialists . . . . . . . . . . . . 250 281 293 306 12 17 22 42 100Farm equipment mechanics . . . . . . . . . . . 41 46 47 48 11 14 17 6 17Mobile heavy equipment mechanics . . . 101 106 110 115 5 9 14 9 37Motorcycle, boat, and small engine mechanics . . . . . . . . . . . . . . . . . . 46 47 48 49 2 4 6 2 14Motorcycle repairers . . . . . . . . . . . . . . . . 11 11 12 12 2 4 6 0 4Small engine specialists . . . . . . . . . . . . . . 35 36 36 37 2 4 6 1 11
Other mechanics, installers, and repairers . . . . . . . . . . . . . . . . . . . . . 1,023 1,105 1,145 1,197 8 12 17 122 394
Bicycle repairers . . . . . . . . . . . . . . . . . . . 40 44 44 44 10 10 11 4 13Camera and photographic equipment repairers . . . . . . . . . . . . . . . . 11 12 12 12 10 9 9 1 4Coin and vending machine servicers and repairers . . . . . . . . . . . . . . . . . . . . . . 19 16 17 17 -16 -14 -12 -3 4Electric meter installers and repairers . . . 12 9 10 11 -23 -18 -12 -2 3Electromedical and biomedical equipment repairers . . . . . . . . . . . . . . . . 10 11 11 12 14 17 23 2 4Elevator installers and repairers . . . . . . . . 24 26 28 30 10 15 24 4 10Heat, air conditioning, and refrigeration mechanics and installers . . . . . . . . . . . . 233 286 299 319 23 29 37 66 125Home appliance and power
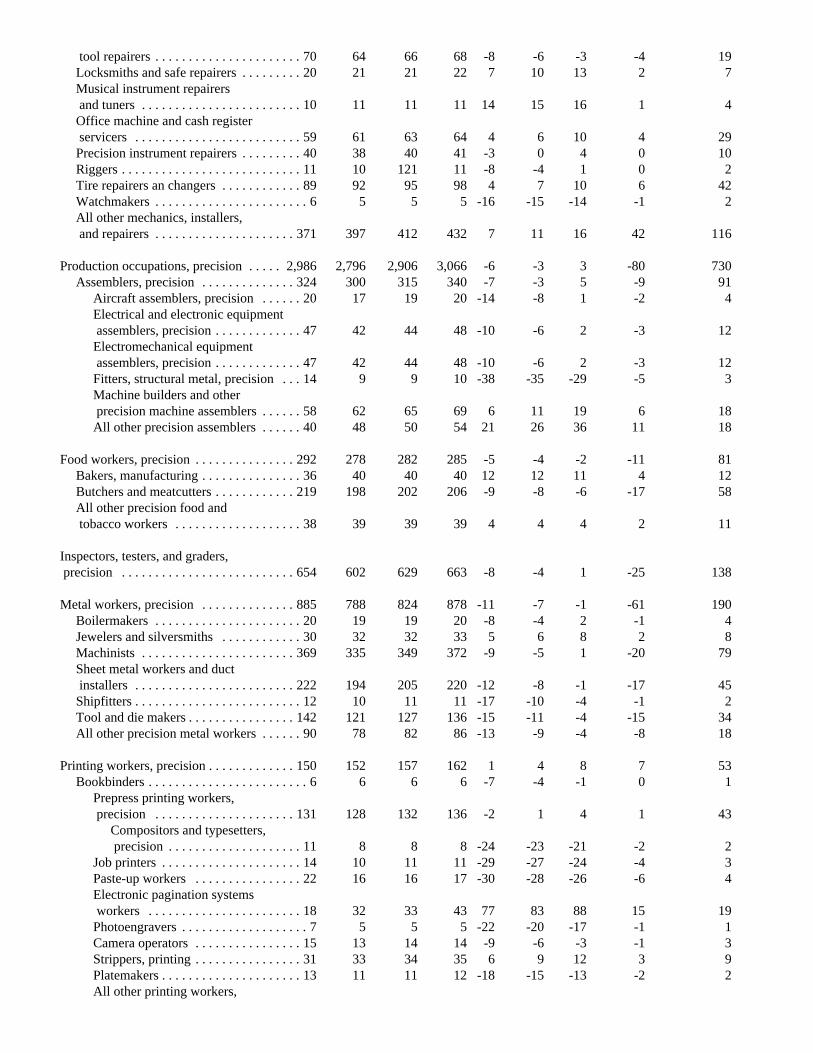
tool repairers . . . . . . . . . . . . . . . . . . . . . . 70 64 66 68 -8 -6 -3 -4 19Locksmiths and safe repairers . . . . . . . . . 20 21 21 22 7 10 13 2 7Musical instrument repairers and tuners . . . . . . . . . . . . . . . . . . . . . . . . 10 11 11 11 14 15 16 1 4Office machine and cash register servicers . . . . . . . . . . . . . . . . . . . . . . . . . 59 61 63 64 4 6 10 4 29Precision instrument repairers . . . . . . . . . 40 38 40 41 -3 0 4 0 10Riggers . . . . . . . . . . . . . . . . . . . . . . . . . . . 11 10 121 11 -8 -4 1 0 2Tire repairers an changers . . . . . . . . . . . . 89 92 95 98 4 7 10 6 42Watchmakers . . . . . . . . . . . . . . . . . . . . . . . 6 5 5 5 -16 -15 -14 -1 2All other mechanics, installers, and repairers . . . . . . . . . . . . . . . . . . . . . 371 397 412 432 7 11 16 42 116
Production occupations, precision . . . . . 2,986 2,796 2,906 3,066 -6 -3 3 -80 730Assemblers, precision . . . . . . . . . . . . . . 324 300 315 340 -7 -3 5 -9 91
Aircraft assemblers, precision . . . . . . 20 17 19 20 -14 -8 1 -2 4Electrical and electronic equipment assemblers, precision . . . . . . . . . . . . . 47 42 44 48 -10 -6 2 -3 12Electromechanical equipment assemblers, precision . . . . . . . . . . . . . 47 42 44 48 -10 -6 2 -3 12Fitters, structural metal, precision . . . 14 9 9 10 -38 -35 -29 -5 3Machine builders and other precision machine assemblers . . . . . . 58 62 65 69 6 11 19 6 18All other precision assemblers . . . . . . 40 48 50 54 21 26 36 11 18
Food workers, precision . . . . . . . . . . . . . . . 292 278 282 285 -5 -4 -2 -11 81Bakers, manufacturing . . . . . . . . . . . . . . . 36 40 40 40 12 12 11 4 12Butchers and meatcutters . . . . . . . . . . . . 219 198 202 206 -9 -8 -6 -17 58All other precision food and tobacco workers . . . . . . . . . . . . . . . . . . . 38 39 39 39 4 4 4 2 11
Inspectors, testers, and graders, precision . . . . . . . . . . . . . . . . . . . . . . . . . . 654 602 629 663 -8 -4 1 -25 138
Metal workers, precision . . . . . . . . . . . . . . 885 788 824 878 -11 -7 -1 -61 190Boilermakers . . . . . . . . . . . . . . . . . . . . . . 20 19 19 20 -8 -4 2 -1 4Jewelers and silversmiths . . . . . . . . . . . . 30 32 32 33 5 6 8 2 8Machinists . . . . . . . . . . . . . . . . . . . . . . . 369 335 349 372 -9 -5 1 -20 79Sheet metal workers and duct installers . . . . . . . . . . . . . . . . . . . . . . . . 222 194 205 220 -12 -8 -1 -17 45Shipfitters . . . . . . . . . . . . . . . . . . . . . . . . . 12 10 11 11 -17 -10 -4 -1 2Tool and die makers . . . . . . . . . . . . . . . . 142 121 127 136 -15 -11 -4 -15 34All other precision metal workers . . . . . . 90 78 82 86 -13 -9 -4 -8 18
Printing workers, precision . . . . . . . . . . . . . 150 152 157 162 1 4 8 7 53Bookbinders . . . . . . . . . . . . . . . . . . . . . . . . 6 6 6 6 -7 -4 -1 0 1
Prepress printing workers, precision . . . . . . . . . . . . . . . . . . . . . 131 128 132 136 -2 1 4 1 43
Compositors and typesetters, precision . . . . . . . . . . . . . . . . . . . . 11 8 8 8 -24 -23 -21 -2 2
Job printers . . . . . . . . . . . . . . . . . . . . . 14 10 11 11 -29 -27 -24 -4 3Paste-up workers . . . . . . . . . . . . . . . . 22 16 16 17 -30 -28 -26 -6 4Electronic pagination systems workers . . . . . . . . . . . . . . . . . . . . . . . 18 32 33 43 77 83 88 15 19Photoengravers . . . . . . . . . . . . . . . . . . . 7 5 5 5 -22 -20 -17 -1 1Camera operators . . . . . . . . . . . . . . . . 15 13 14 14 -9 -6 -3 -1 3Strippers, printing . . . . . . . . . . . . . . . . 31 33 34 35 6 9 12 3 9Platemakers . . . . . . . . . . . . . . . . . . . . . 13 11 11 12 -18 -15 -13 -2 2All other printing workers,
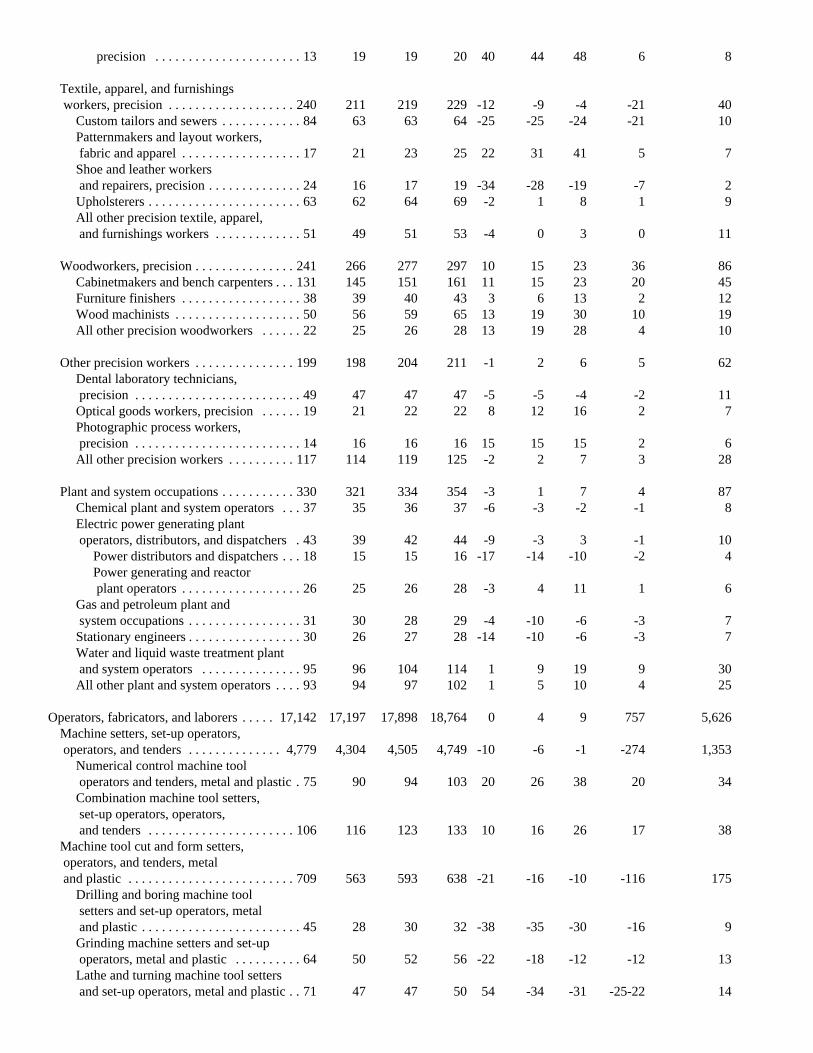
precision . . . . . . . . . . . . . . . . . . . . . . 13 19 19 20 40 44 48 6 8
Textile, apparel, and furnishings workers, precision . . . . . . . . . . . . . . . . . . . 240 211 219 229 -12 -9 -4 -21 40
Custom tailors and sewers . . . . . . . . . . . . 84 63 63 64 -25 -25 -24 -21 10Patternmakers and layout workers, fabric and apparel . . . . . . . . . . . . . . . . . . 17 21 23 25 22 31 41 5 7Shoe and leather workers and repairers, precision . . . . . . . . . . . . . . 24 16 17 19 -34 -28 -19 -7 2Upholsterers . . . . . . . . . . . . . . . . . . . . . . . 63 62 64 69 -2 1 8 1 9All other precision textile, apparel, and furnishings workers . . . . . . . . . . . . . 51 49 51 53 -4 0 3 0 11
Woodworkers, precision . . . . . . . . . . . . . . . 241 266 277 297 10 15 23 36 86Cabinetmakers and bench carpenters . . . 131 145 151 161 11 15 23 20 45Furniture finishers . . . . . . . . . . . . . . . . . . 38 39 40 43 3 6 13 2 12Wood machinists . . . . . . . . . . . . . . . . . . . 50 56 59 65 13 19 30 10 19All other precision woodworkers . . . . . . 22 25 26 28 13 19 28 4 10
Other precision workers . . . . . . . . . . . . . . . 199 198 204 211 -1 2 6 5 62Dental laboratory technicians, precision . . . . . . . . . . . . . . . . . . . . . . . . . 49 47 47 47 -5 -5 -4 -2 11Optical goods workers, precision . . . . . . 19 21 22 22 8 12 16 2 7Photographic process workers, precision . . . . . . . . . . . . . . . . . . . . . . . . . 14 16 16 16 15 15 15 2 6All other precision workers . . . . . . . . . . 117 114 119 125 -2 2 7 3 28
Plant and system occupations . . . . . . . . . . . 330 321 334 354 -3 1 7 4 87Chemical plant and system operators . . . 37 35 36 37 -6 -3 -2 -1 8Electric power generating plant
operators, distributors, and dispatchers . 43 39 42 44 -9 -3 3 -1 10Power distributors and dispatchers . . . 18 15 15 16 -17 -14 -10 -2 4Power generating and reactor plant operators . . . . . . . . . . . . . . . . . . 26 25 26 28 -3 4 11 1 6
Gas and petroleum plant and system occupations . . . . . . . . . . . . . . . . . 31 30 28 29 -4 -10 -6 -3 7Stationary engineers . . . . . . . . . . . . . . . . . 30 26 27 28 -14 -10 -6 -3 7Water and liquid waste treatment plant and system operators . . . . . . . . . . . . . . . 95 96 104 114 1 9 19 9 30All other plant and system operators . . . . 93 94 97 102 1 5 10 4 25
Operators, fabricators, and laborers . . . . . 17,142 17,197 17,898 18,764 0 4 9 757 5,626Machine setters, set-up operators, operators, and tenders . . . . . . . . . . . . . . 4,779 4,304 4,505 4,749 -10 -6 -1 -274 1,353
Numerical control machine tool operators and tenders, metal and plastic . 75 90 94 103 20 26 38 20 34
Combination machine tool setters, set-up operators, operators,
and tenders . . . . . . . . . . . . . . . . . . . . . . 106 116 123 133 10 16 26 17 38Machine tool cut and form setters, operators, and tenders, metal and plastic . . . . . . . . . . . . . . . . . . . . . . . . . 709 563 593 638 -21 -16 -10 -116 175
Drilling and boring machine tool setters and set-up operators, metal and plastic . . . . . . . . . . . . . . . . . . . . . . . . 45 28 30 32 -38 -35 -30 -16 9Grinding machine setters and set-up operators, metal and plastic . . . . . . . . . . 64 50 52 56 -22 -18 -12 -12 13Lathe and turning machine tool setters and set-up operators, metal and plastic . . 71 47 47 50 54 -34 -31 -25-22 14
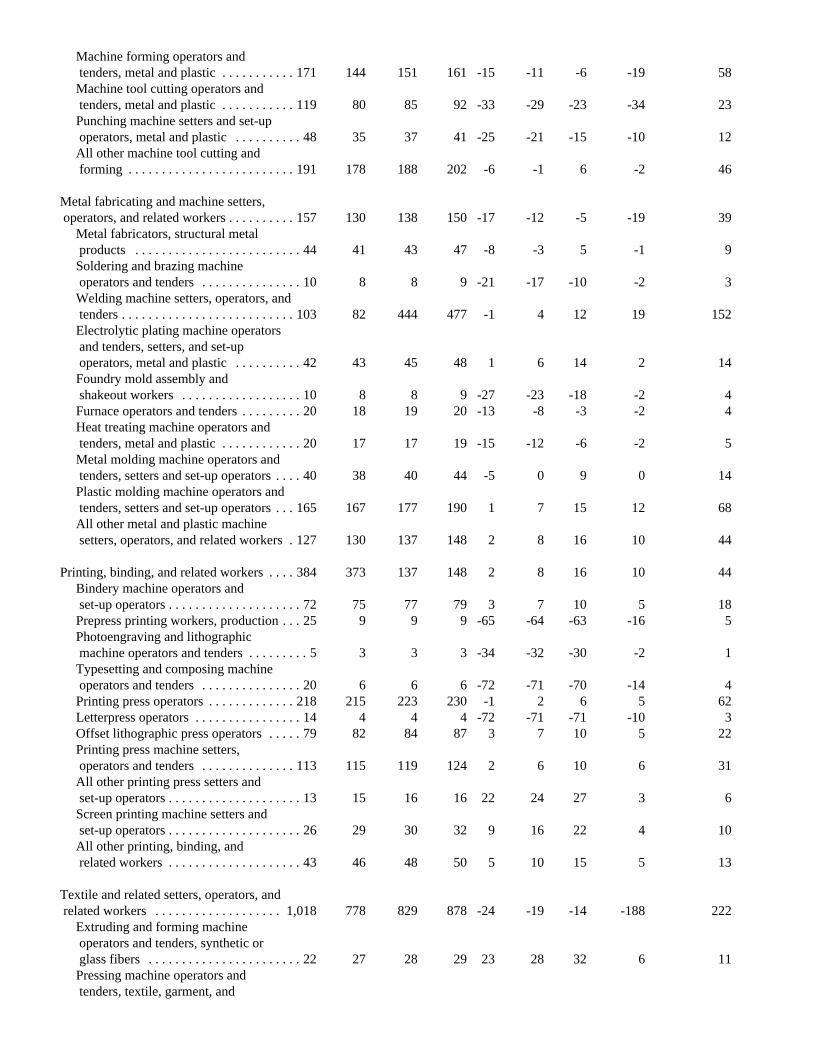
Machine forming operators and tenders, metal and plastic . . . . . . . . . . . 171 144 151 161 -15 -11 -6 -19 58Machine tool cutting operators and tenders, metal and plastic . . . . . . . . . . . 119 80 85 92 -33 -29 -23 -34 23Punching machine setters and set-up operators, metal and plastic . . . . . . . . . . 48 35 37 41 -25 -21 -15 -10 12All other machine tool cutting and forming . . . . . . . . . . . . . . . . . . . . . . . . . 191 178 188 202 -6 -1 6 -2 46
Metal fabricating and machine setters, operators, and related workers . . . . . . . . . . 157 130 138 150 -17 -12 -5 -19 39
Metal fabricators, structural metal products . . . . . . . . . . . . . . . . . . . . . . . . . 44 41 43 47 -8 -3 5 -1 9Soldering and brazing machine operators and tenders . . . . . . . . . . . . . . . 10 8 8 9 -21 -17 -10 -2 3Welding machine setters, operators, and tenders . . . . . . . . . . . . . . . . . . . . . . . . . . 103 82 444 477 -1 4 12 19 152Electrolytic plating machine operators and tenders, setters, and set-up operators, metal and plastic . . . . . . . . . . 42 43 45 48 1 6 14 2 14Foundry mold assembly and shakeout workers . . . . . . . . . . . . . . . . . . 10 8 8 9 -27 -23 -18 -2 4Furnace operators and tenders . . . . . . . . . 20 18 19 20 -13 -8 -3 -2 4Heat treating machine operators and tenders, metal and plastic . . . . . . . . . . . . 20 17 17 19 -15 -12 -6 -2 5Metal molding machine operators and tenders, setters and set-up operators . . . . 40 38 40 44 -5 0 9 0 14Plastic molding machine operators and tenders, setters and set-up operators . . . 165 167 177 190 1 7 15 12 68All other metal and plastic machine setters, operators, and related workers . 127 130 137 148 2 8 16 10 44
Printing, binding, and related workers . . . . 384 373 137 148 2 8 16 10 44Bindery machine operators and set-up operators . . . . . . . . . . . . . . . . . . . . 72 75 77 79 3 7 10 5 18Prepress printing workers, production . . . 25 9 9 9 -65 -64 -63 -16 5Photoengraving and lithographic machine operators and tenders . . . . . . . . . 5 3 3 3 -34 -32 -30 -2 1Typesetting and composing machine operators and tenders . . . . . . . . . . . . . . . 20 6 6 6 -72 -71 -70 -14 4Printing press operators . . . . . . . . . . . . . 218 215 223 230 -1 2 6 5 62Letterpress operators . . . . . . . . . . . . . . . . 14 4 4 4 -72 -71 -71 -10 3Offset lithographic press operators . . . . . 79 82 84 87 3 7 10 5 22Printing press machine setters, operators and tenders . . . . . . . . . . . . . . 113 115 119 124 2 6 10 6 31All other printing press setters and set-up operators . . . . . . . . . . . . . . . . . . . . 13 15 16 16 22 24 27 3 6Screen printing machine setters and set-up operators . . . . . . . . . . . . . . . . . . . . 26 29 30 32 9 16 22 4 10All other printing, binding, and related workers . . . . . . . . . . . . . . . . . . . . 43 46 48 50 5 10 15 5 13
Textile and related setters, operators, and related workers . . . . . . . . . . . . . . . . . . . 1,018 778 829 878 -24 -19 -14 -188 222
Extruding and forming machine operators and tenders, synthetic or glass fibers . . . . . . . . . . . . . . . . . . . . . . . 22 27 28 29 23 28 32 6 11Pressing machine operators and tenders, textile, garment, and
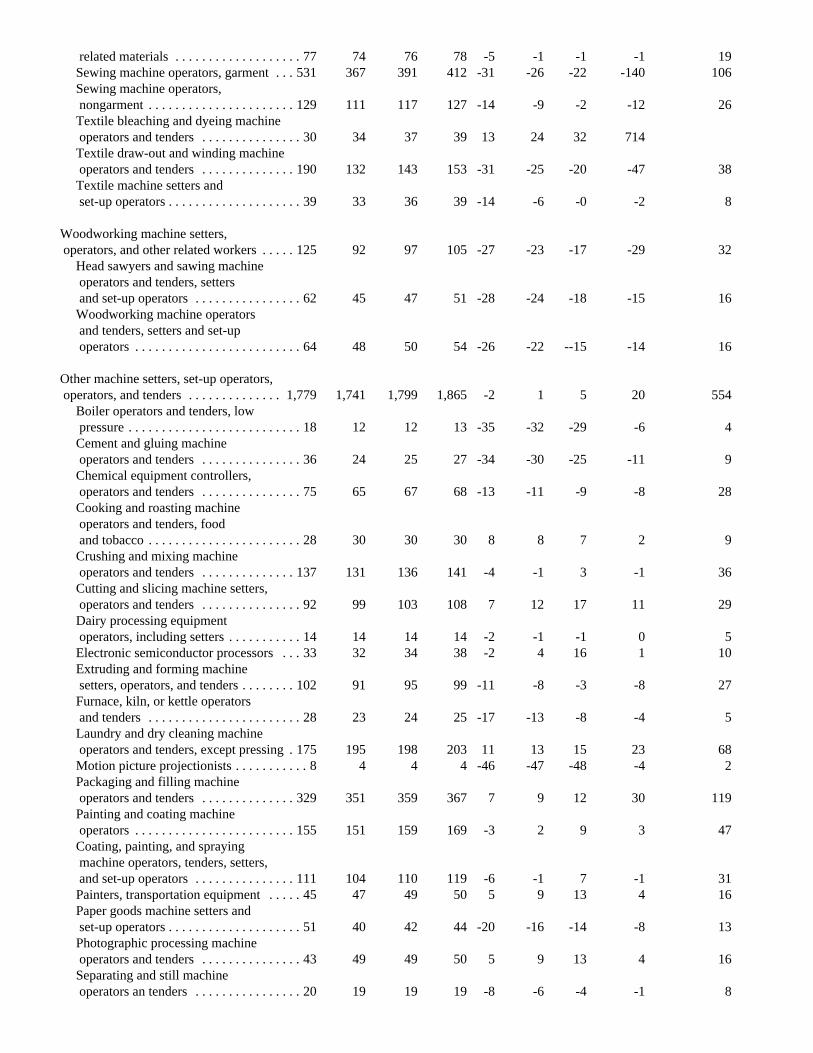
related materials . . . . . . . . . . . . . . . . . . . 77 74 76 78 -5 -1 -1 -1 19Sewing machine operators, garment . . . 531 367 391 412 -31 -26 -22 -140 106Sewing machine operators, nongarment . . . . . . . . . . . . . . . . . . . . . . 129 111 117 127 -14 -9 -2 -12 26Textile bleaching and dyeing machine operators and tenders . . . . . . . . . . . . . . . 30 34 37 39 13 24 32 714Textile draw-out and winding machine operators and tenders . . . . . . . . . . . . . . 190 132 143 153 -31 -25 -20 -47 38Textile machine setters and set-up operators . . . . . . . . . . . . . . . . . . . . 39 33 36 39 -14 -6 -0 -2 8
Woodworking machine setters, operators, and other related workers . . . . . 125 92 97 105 -27 -23 -17 -29 32
Head sawyers and sawing machine operators and tenders, setters and set-up operators . . . . . . . . . . . . . . . . 62 45 47 51 -28 -24 -18 -15 16Woodworking machine operators and tenders, setters and set-up operators . . . . . . . . . . . . . . . . . . . . . . . . . 64 48 50 54 -26 -22 --15 -14 16
Other machine setters, set-up operators, operators, and tenders . . . . . . . . . . . . . . 1,779 1,741 1,799 1,865 -2 1 5 20 554
Boiler operators and tenders, low pressure . . . . . . . . . . . . . . . . . . . . . . . . . . 18 12 12 13 -35 -32 -29 -6 4Cement and gluing machine operators and tenders . . . . . . . . . . . . . . . 36 24 25 27 -34 -30 -25 -11 9Chemical equipment controllers, operators and tenders . . . . . . . . . . . . . . . 75 65 67 68 -13 -11 -9 -8 28Cooking and roasting machine operators and tenders, food and tobacco . . . . . . . . . . . . . . . . . . . . . . . 28 30 30 30 8 8 7 2 9Crushing and mixing machine operators and tenders . . . . . . . . . . . . . . 137 131 136 141 -4 -1 3 -1 36Cutting and slicing machine setters, operators and tenders . . . . . . . . . . . . . . . 92 99 103 108 7 12 17 11 29Dairy processing equipment operators, including setters . . . . . . . . . . . 14 14 14 14 -2 -1 -1 0 5Electronic semiconductor processors . . . 33 32 34 38 -2 4 16 1 10Extruding and forming machine setters, operators, and tenders . . . . . . . . 102 91 95 99 -11 -8 -3 -8 27Furnace, kiln, or kettle operators and tenders . . . . . . . . . . . . . . . . . . . . . . . 28 23 24 25 -17 -13 -8 -4 5Laundry and dry cleaning machine operators and tenders, except pressing . 175 195 198 203 11 13 15 23 68Motion picture projectionists . . . . . . . . . . . 8 4 4 4 -46 -47 -48 -4 2Packaging and filling machine operators and tenders . . . . . . . . . . . . . . 329 351 359 367 7 9 12 30 119Painting and coating machine operators . . . . . . . . . . . . . . . . . . . . . . . . 155 151 159 169 -3 2 9 3 47Coating, painting, and spraying machine operators, tenders, setters, and set-up operators . . . . . . . . . . . . . . . 111 104 110 119 -6 -1 7 -1 31Painters, transportation equipment . . . . . 45 47 49 50 5 9 13 4 16Paper goods machine setters and set-up operators . . . . . . . . . . . . . . . . . . . . 51 40 42 44 -20 -16 -14 -8 13Photographic processing machine operators and tenders . . . . . . . . . . . . . . . 43 49 49 50 5 9 13 4 16Separating and still machine operators an tenders . . . . . . . . . . . . . . . . 20 19 19 19 -8 -6 -4 -1 8
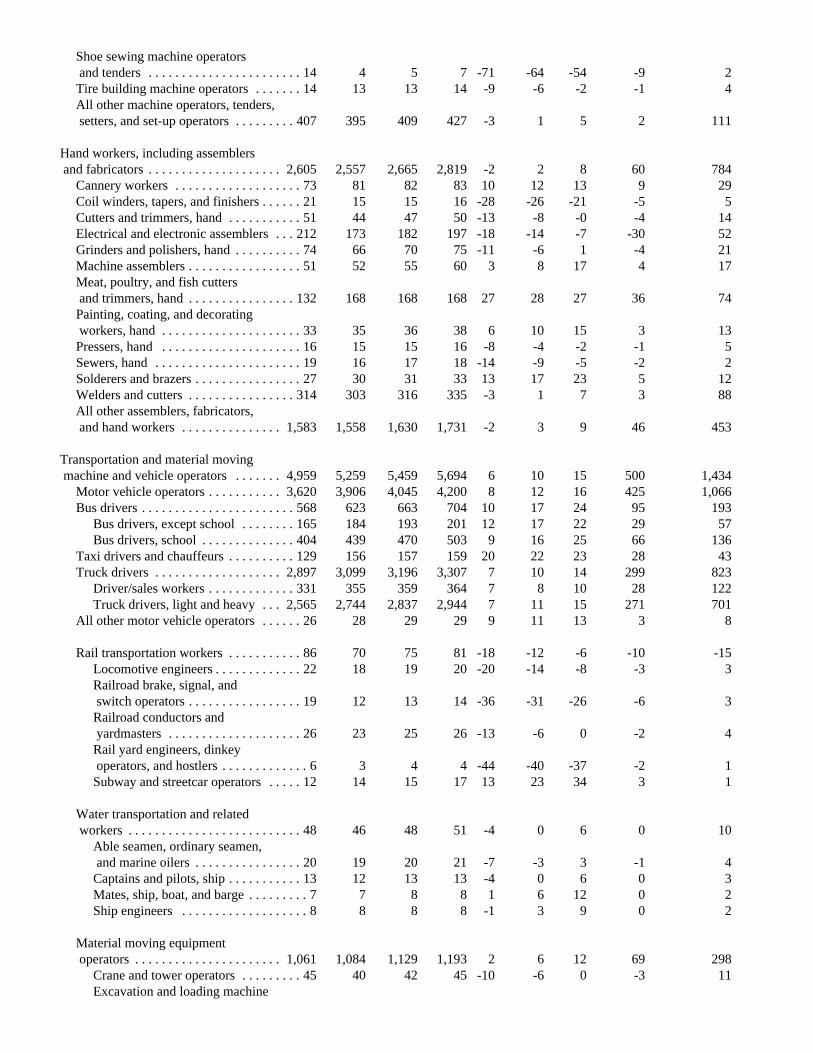
Shoe sewing machine operators and tenders . . . . . . . . . . . . . . . . . . . . . . . 14 4 5 7 -71 -64 -54 -9 2Tire building machine operators . . . . . . . 14 13 13 14 -9 -6 -2 -1 4All other machine operators, tenders, setters, and set-up operators . . . . . . . . . 407 395 409 427 -3 1 5 2 111
Hand workers, including assemblers and fabricators . . . . . . . . . . . . . . . . . . . . 2,605 2,557 2,665 2,819 -2 2 8 60 784
Cannery workers . . . . . . . . . . . . . . . . . . . 73 81 82 83 10 12 13 9 29Coil winders, tapers, and finishers . . . . . . 21 15 15 16 -28 -26 -21 -5 5Cutters and trimmers, hand . . . . . . . . . . . 51 44 47 50 -13 -8 -0 -4 14Electrical and electronic assemblers . . . 212 173 182 197 -18 -14 -7 -30 52Grinders and polishers, hand . . . . . . . . . . 74 66 70 75 -11 -6 1 -4 21Machine assemblers . . . . . . . . . . . . . . . . . 51 52 55 60 3 8 17 4 17Meat, poultry, and fish cutters and trimmers, hand . . . . . . . . . . . . . . . . 132 168 168 168 27 28 27 36 74Painting, coating, and decorating workers, hand . . . . . . . . . . . . . . . . . . . . . 33 35 36 38 6 10 15 3 13Pressers, hand . . . . . . . . . . . . . . . . . . . . . 16 15 15 16 -8 -4 -2 -1 5Sewers, hand . . . . . . . . . . . . . . . . . . . . . . 19 16 17 18 -14 -9 -5 -2 2Solderers and brazers . . . . . . . . . . . . . . . . 27 30 31 33 13 17 23 5 12Welders and cutters . . . . . . . . . . . . . . . . 314 303 316 335 -3 1 7 3 88All other assemblers, fabricators, and hand workers . . . . . . . . . . . . . . . 1,583 1,558 1,630 1,731 -2 3 9 46 453
Transportation and material moving machine and vehicle operators . . . . . . . 4,959 5,259 5,459 5,694 6 10 15 500 1,434
Motor vehicle operators . . . . . . . . . . . 3,620 3,906 4,045 4,200 8 12 16 425 1,066Bus drivers . . . . . . . . . . . . . . . . . . . . . . . 568 623 663 704 10 17 24 95 193
Bus drivers, except school . . . . . . . . 165 184 193 201 12 17 22 29 57Bus drivers, school . . . . . . . . . . . . . . 404 439 470 503 9 16 25 66 136
Taxi drivers and chauffeurs . . . . . . . . . . 129 156 157 159 20 22 23 28 43Truck drivers . . . . . . . . . . . . . . . . . . . 2,897 3,099 3,196 3,307 7 10 14 299 823
Driver/sales workers . . . . . . . . . . . . . 331 355 359 364 7 8 10 28 122Truck drivers, light and heavy . . . 2,565 2,744 2,837 2,944 7 11 15 271 701
All other motor vehicle operators . . . . . . 26 28 29 29 9 11 13 3 8
Rail transportation workers . . . . . . . . . . . 86 70 75 81 -18 -12 -6 -10 -15Locomotive engineers . . . . . . . . . . . . . 22 18 19 20 -20 -14 -8 -3 3Railroad brake, signal, and
switch operators . . . . . . . . . . . . . . . . . 19 12 13 14 -36 -31 -26 -6 3Railroad conductors and yardmasters . . . . . . . . . . . . . . . . . . . . 26 23 25 26 -13 -6 0 -2 4Rail yard engineers, dinkey operators, and hostlers . . . . . . . . . . . . . 6 3 4 4 -44 -40 -37 -2 1Subway and streetcar operators . . . . . 12 14 15 17 13 23 34 3 1
Water transportation and related workers . . . . . . . . . . . . . . . . . . . . . . . . . . 48 46 48 51 -4 0 6 0 10
Able seamen, ordinary seamen, and marine oilers . . . . . . . . . . . . . . . . 20 19 20 21 -7 -3 3 -1 4Captains and pilots, ship . . . . . . . . . . . 13 12 13 13 -4 0 6 0 3Mates, ship, boat, and barge . . . . . . . . . 7 7 8 8 1 6 12 0 2Ship engineers . . . . . . . . . . . . . . . . . . . 8 8 8 8 -1 3 9 0 2
Material moving equipment operators . . . . . . . . . . . . . . . . . . . . . . 1,061 1,084 1,129 1,193 2 6 12 69 298
Crane and tower operators . . . . . . . . . 45 40 42 45 -10 -6 0 -3 11Excavation and loading machine

operators . . . . . . . . . . . . . . . . . . . . . . 88 95 100 107 8 13 21 11 31Grader, dozer, and scraper operators . . . . . . . . . . . . . . . . . . . . . 108 107 113 122 0 5 14 6 27Hoist and winch operators . . . . . . . . . . 9 8 9 9 -9 -5 2 0 2Industrial truck and tractor operators . . . . . . . . . . . . . . . . . . . . . 464 474 493 515 2 6 11 29 132Operating engineers . . . . . . . . . . . . . 146 145 154 165 -1 5 13 7 37All other material moving equipment operators . . . . . . . . . . . . 201 214 219 229 7 9 14 18 59
All other transportation and material moving equipment operators . . . . . . . . 145 154 161 170 6 11 17 16 44
Helpers, laborers, and material movers, hand . . . . . . . . . . . . . . . . . . . . . 4,799 5,078 5,270 5,502 6 10 15 471 2,056
Freight, stock, and material movers, hand . . . . . . . . . . . . . . . . . . . . . 765 707 728 754 -8 -5 -1 -36 306Hand packers and packagers . . . . . . . . . 942 1,070 1,102 1,137 14 17 21 160 429Helpers, construction trades . . . . . . . . . . 513 549 581 630 7 13 23 68 240Machine feeders and offbearers . . . . . . . 262 232 242 253 -11 -8 -3 -20 80Parking lot attendants . . . . . . . . . . . . . . . 64 75 76 77 18 20 21 13 25Refuse collectors . . . . . . . . . . . . . . . . . . 111 107 115 123 -3 4 12 4 31Service station attendants . . . . . . . . . . . 167 143 148 151 -15 -12 -10 -20 67Vehicle washers and equipment cleaners . . . . . . . . . . . . . . . . . . . . . . . . . 249 290 299 306 16 20 23 50 133All other helpers, laborers, and material movers, hand . . . . . . . . . . . . 1,727 1,905 1,980 2,070 10 15 20 253 744
______________________________________________________________________________________________________
aTotal job openings represent the sum of employment increases and net replacements. If employment change is negative, jobopenings due to growth are zero and total job openings equal net replacements.Source: U.S. Department of Labor, Bureau of Labor Statistics.

Table D-12. Employment by Industry, 1983, 1994, and projected 2005
Industry Title Total Employment (in thousands) Annual Rate of Growth
1983 1994 2005 Employment1994-2005
Output1994-1995
Low Moderate High
Nonfarm wage and salary2 . . . . . . . . . 89,734 113,340 125,631 130,185 135,729 1.3 --
Mining . . . . . . . . . . . . . . . . . . . . . . . . . . . 952 601 450 439 509 -2.8 -.4Metal mining . . . . . . . . . . . . . . . . . . . . . 56 49 38 42 44 -1.5 1.4Coal mining . . . . . . . . . . . . . . . . . . . . . 194 112 63 70 77 -4.3 .2Crude petroleum, natural gas, and gas liquids . . . . . . . . . . . . . . . . . . . 265 168 138 105 124 -4.2 -1.9Oil and gas field services . . . . . . . . . . . 333 168 127 136 173 -1.9 3.2Nonmetallic minerals, except fuels . . . 104 104 85 88 91 -1.5 .9
Construction . . . . . . . . . . . . . . . . . . . . . 3,946 5,010 5,193 5,500 5,966 .9 1.5Manufacturing . . . . . . . . . . . . . . . . . . 18,430 18,304 16,218 16,991 18,000 -.7 2.0
Durable manufacturing . . . . . . . . . . 10,707 10,431 8,803 9,290 10,045 -1.0 2.2Lumber and wood products . . . . . . . 670 752 649 685 729 -.9 .9Logging . . . . . . . . . . . . . . . . . . . . . . . 83 82 73 74 75 -.9 .6Sawmills and planing mills . . . . . . . 193 189 140 150 161 -2.1 .1Millwork, plywood, and structural members . . . . . . . . . . . . . 207 271 236 250 269 -.7 1.3Wood containers and miscellaneous wood products . . . . . . . . . . . . . . . . 119 138 133 139 147 .0 2.2Wood buildings and mobile homes . . 69 73 67 72 78 -.1 .0
Furniture and fixtures . . . . . . . . . . . . . . 448 502 486 515 581 -.2 1.3
Household furniture . . . . . . . . . . . . . 279 284 264 280 327 -.1 1.0Partitions and fixtures . . . . . . . . . . . . 59 80 83 88 95 .9 1.2Office and miscellaneous furniture and fixtures . . . . . . . . . . . 110 138 138 146 159 .5 1.6
Stone, clay, and glass products . . . . . . . 541 533 413 434 463 -1.8 .5Glass and glass products . . . . . . . . . 165 153 118 125 133 -1.8 .4Hydraulic cement . . . . . . . . . . . . . . . 25 18 14 14 14 -2.2 .2Stone, clay, and miscellaneous mineral products . . . . . . . . . . . . . . . 167 164 115 124 136 -2.5 .2Concrete, gypsum, and plaster products . . . . . . . . . . . . . . . . . . . . . 184 198 166 172 180 -1.3 .9
Primary metal industries . . . . . . . . . . . . 832 699 508 532 565 -2.5 .1Blast furnaces and basic steel products . . . . . . . . . . . . . . . . . 341 239 150 155 163 -3.9 -.5Iron and steel foundries . . . . . . . . . . 139 125 88 92 99 -2.7 -1.2Primary nonferrous smelting and refining . . . . . . . . . . . . . . . . . . . 50 41 32 36 39 -1.2 2.3All other primary metals . . . . . . . . . . 41 44 40 40 40 -.8 1.8Nonferrous rolling and drawing . . . 184 167 130 135 141 -1.9 .0Nonferrous foundries . . . . . . . . . . . . 78 84 68 74 82 -1.2 -.2
Fabricated metal products . . . . . . . . . 1,368 1,387 1,114 1,181 1,271 -1.5 .5Metal cans and shipping containers . . . . . . . . . . . . . . . . . . . . . 60 42 27 27 27 -3.9 .9Cutlery, hand tools, and hardware . . 138 129 85 90 97 -3.2 -.2Plumbing and nonelectric heating equipment . . . . . . . . . . . . . . . . . . . . . 62 60 46 48 52 -1.9 -.3Fabricated structural metal products . . . . . . . . . . . . . . . . 416 409 299 315 339 -2.3 .4
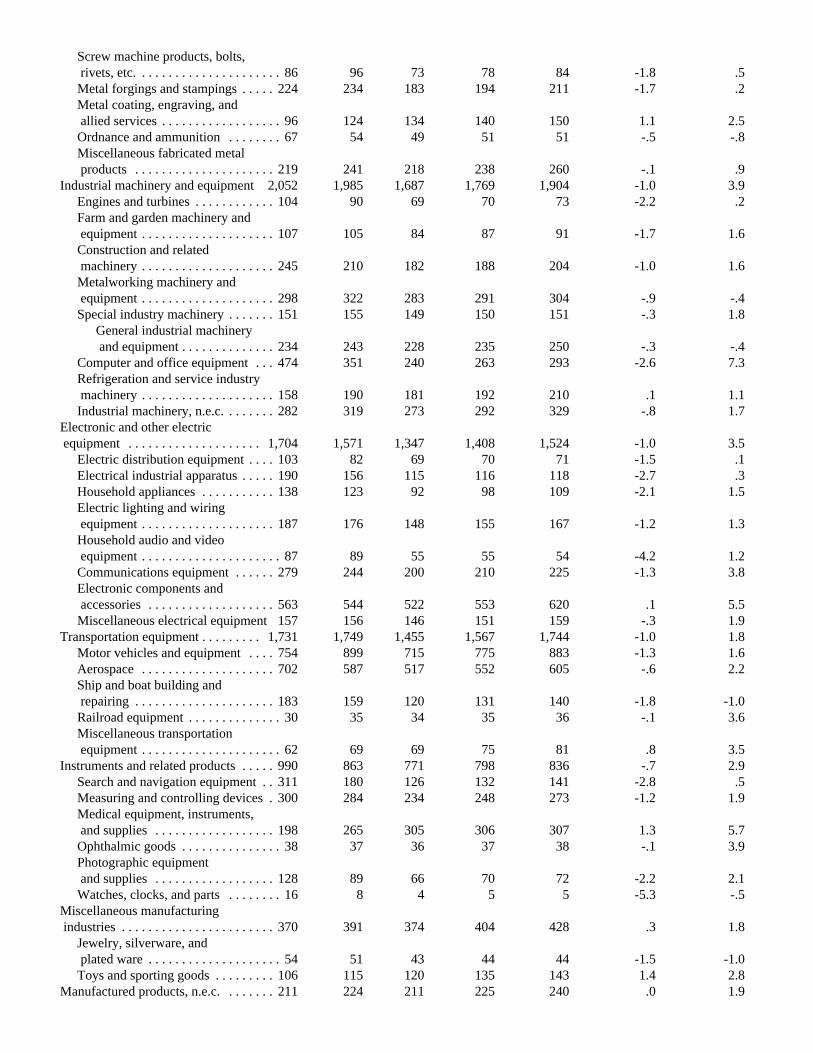
Screw machine products, bolts, rivets, etc. . . . . . . . . . . . . . . . . . . . . . 86 96 73 78 84 -1.8 .5Metal forgings and stampings . . . . . 224 234 183 194 211 -1.7 .2Metal coating, engraving, and allied services . . . . . . . . . . . . . . . . . . 96 124 134 140 150 1.1 2.5Ordnance and ammunition . . . . . . . . 67 54 49 51 51 -.5 -.8Miscellaneous fabricated metal products . . . . . . . . . . . . . . . . . . . . . 219 241 218 238 260 -.1 .9
Industrial machinery and equipment 2,052 1,985 1,687 1,769 1,904 -1.0 3.9Engines and turbines . . . . . . . . . . . . 104 90 69 70 73 -2.2 .2Farm and garden machinery and equipment . . . . . . . . . . . . . . . . . . . . 107 105 84 87 91 -1.7 1.6Construction and related machinery . . . . . . . . . . . . . . . . . . . . 245 210 182 188 204 -1.0 1.6Metalworking machinery and equipment . . . . . . . . . . . . . . . . . . . . 298 322 283 291 304 -.9 -.4Special industry machinery . . . . . . . 151 155 149 150 151 -.3 1.8
General industrial machinery and equipment . . . . . . . . . . . . . . 234 243 228 235 250 -.3 -.4
Computer and office equipment . . . 474 351 240 263 293 -2.6 7.3Refrigeration and service industry machinery . . . . . . . . . . . . . . . . . . . . 158 190 181 192 210 .1 1.1Industrial machinery, n.e.c. . . . . . . . 282 319 273 292 329 -.8 1.7
Electronic and other electric equipment . . . . . . . . . . . . . . . . . . . . 1,704 1,571 1,347 1,408 1,524 -1.0 3.5
Electric distribution equipment . . . . 103 82 69 70 71 -1.5 .1Electrical industrial apparatus . . . . . 190 156 115 116 118 -2.7 .3Household appliances . . . . . . . . . . . 138 123 92 98 109 -2.1 1.5Electric lighting and wiring equipment . . . . . . . . . . . . . . . . . . . . 187 176 148 155 167 -1.2 1.3Household audio and video equipment . . . . . . . . . . . . . . . . . . . . . 87 89 55 55 54 -4.2 1.2Communications equipment . . . . . . 279 244 200 210 225 -1.3 3.8Electronic components and accessories . . . . . . . . . . . . . . . . . . . 563 544 522 553 620 .1 5.5Miscellaneous electrical equipment 157 156 146 151 159 -.3 1.9
Transportation equipment . . . . . . . . . 1,731 1,749 1,455 1,567 1,744 -1.0 1.8Motor vehicles and equipment . . . . 754 899 715 775 883 -1.3 1.6Aerospace . . . . . . . . . . . . . . . . . . . . 702 587 517 552 605 -.6 2.2Ship and boat building and repairing . . . . . . . . . . . . . . . . . . . . . 183 159 120 131 140 -1.8 -1.0Railroad equipment . . . . . . . . . . . . . . 30 35 34 35 36 -.1 3.6Miscellaneous transportation equipment . . . . . . . . . . . . . . . . . . . . . 62 69 69 75 81 .8 3.5
Instruments and related products . . . . . 990 863 771 798 836 -.7 2.9Search and navigation equipment . . 311 180 126 132 141 -2.8 .5Measuring and controlling devices . 300 284 234 248 273 -1.2 1.9Medical equipment, instruments, and supplies . . . . . . . . . . . . . . . . . . 198 265 305 306 307 1.3 5.7Ophthalmic goods . . . . . . . . . . . . . . . 38 37 36 37 38 -.1 3.9Photographic equipment and supplies . . . . . . . . . . . . . . . . . . 128 89 66 70 72 -2.2 2.1Watches, clocks, and parts . . . . . . . . 16 8 4 5 5 -5.3 -.5
Miscellaneous manufacturing industries . . . . . . . . . . . . . . . . . . . . . . . 370 391 374 404 428 .3 1.8
Jewelry, silverware, and plated ware . . . . . . . . . . . . . . . . . . . . 54 51 43 44 44 -1.5 -1.0Toys and sporting goods . . . . . . . . . 106 115 120 135 143 1.4 2.8
Manufactured products, n.e.c. . . . . . . . 211 224 211 225 240 .0 1.9

Nondurable manufacturing . . . . . . . . . 7,723 7,873 7,415 7,700 7,955 -.2 1.8Food and kindred products . . . . . . . . 1,612 1,680 1,693 1,696 1,696 .1 1.3
Meat products . . . . . . . . . . . . . . . . . 346 451 514 515 513 1.2 1.2Dairy products . . . . . . . . . . . . . . . . . 164 149 132 133 133 -1.0 1.9Preserved fruits and vegetables . . . . 220 245 252 260 264 .5 1.4Grain mill products and fats and oils . . . . . . . . . . . . . . . . . . . 170 160 166 161 158 .0 1.4Bakery products . . . . . . . . . . . . . . . . 220 213 196 195 194 -.8 .4Sugar and confectionery products . . 103 99 89 90 90 -.9 .4Beverages . . . . . . . . . . . . . . . . . . . . 222 178 130 132 134 -2.7 .8Miscellaneous food and kindred products . . . . . . . . . . . . . . . 165 185 213 211 210 1.2 2.3
Tobacco products . . . . . . . . . . . . . . . . . . 68 42 28 26 26 -4.2 -.4Textile mill products . . . . . . . . . . . . . . . 742 673 521 568 608 -1.5 .2
Weaving, finishing, yarn, and thread mills . . . . . . . . . . . . . . . . . . . 432 358 253 281 303 -2.2 -.2Knitting mills . . . . . . . . . . . . . . . . . . 207 199 157 173 187 -1.2 .0Carpets and rugs . . . . . . . . . . . . . . . . 49 64 64 65 68 .1 1.0Miscellaneous textile goods . . . . . . . 55 52 47 49 51 -.6 1.3
Apparel and other textile products . . 1,163 969 723 772 815 -2.1 .5Apparel . . . . . . . . . . . . . . . . . . . . . . 990 755 512 547 577 -2.9 -.4Miscellaneous fabricated textile products . . . . . . . . . . . . . . . . . . . . . 173 215 211 225 238 .4 2.6
Paper and allied products . . . . . . . . . . . 654 691 674 708 730 .2 2.5Pulp, paper, and paperboard mills . . 249 232 211 218 222 .6 2.7Paperboard containers and boxes . . 191 213 216 230 240 .7 1.8Converted paper products except containers . . . . . . . . . . . . . . 214 246 247 260 267 .5 2.9
Printing and publishing . . . . . . . . . . 1,298 1,542 1,576 1,627 1,676 .5 2.5Newspapers . . . . . . . . . . . . . . . . . . . 426 450 400 413 424 .8 -.4Periodicals . . . . . . . . . . . . . . . . . . . . 100 135 156 163 169 1.7 2.1Books . . . . . . . . . . . . . . . . . . . . . . . . . 98 120 125 130 134 .8 2.7Miscellaneous publishing . . . . . . . . . 56 84 84 85 86 .1 3.6Commercial printing and business forms . . . . . . . . . . . . . . . . . . . . . . . 480 597 653 675 699 1.1 3.3Greeting cards . . . . . . . . . . . . . . . . . . 23 29 33 32 32 1.0 4.7Blank books and bookbinding . . . . . . 65 70 75 77 80 .8 2.6Service industries for the printing trade . . . . . . . . . . . . . . . . . . . . . . . . . 49 57 51 53 54 -.7 2.6
Chemicals and allied products . . . . . 1,043 1,061 1,032 1,067 1,089 .1 2.0Industrial chemicals . . . . . . . . . . . . . 314 277 253 259 260 -.6 .9Plastics materials and synthetics . . . 177 162 138 143 145 -1.1 1.4Drugs . . . . . . . . . . . . . . . . . . . . . . . . 201 263 309 325 337 1.9 4.0Soap, cleaners, and toilet goods . . . 142 153 164 165 166 .7 2.5Paints and allied products . . . . . . . . . 60 58 46 48 51 -1.6 1.4Agricultural chemicals . . . . . . . . . . . 61 55 39 43 44 -2.3 1.2Miscellaneous chemical products . . . 89 93 83 85 87 -.9 .9
Petroleum and coal products . . . . . . . . 196 149 142 140 137 -.5 2.1Petroleum refining . . . . . . . . . . . . . . 158 109 105 103 98 -.5 2.2Miscellaneous petroleum and coal products . . . . . . . . . . . . . . . . . . 37 40 37 38 39 -.5 .9
Rubber and miscellaneous plastics products . . . . . . . . . . . . . . . . . . . . . . . . 743 952 972 1,030 1,100 .7 2.9
Tires and inner tubes . . . . . . . . . . . . . 94 80 59 60 63 -2.5 .2Rubber products and plastic hose and footwear . . . . . . . . . . . . . . . . . . 171 182 158 170 185 -.6 1.9Miscellaneous plastics products, n.e.c. . . . . . . . . . . . . . . . . . . . . . . . . 478 690 755 800 853 1.4 3.4
Leather and leather products . . . . . . . . 205 114 54 65 79 -4.9 -1.9
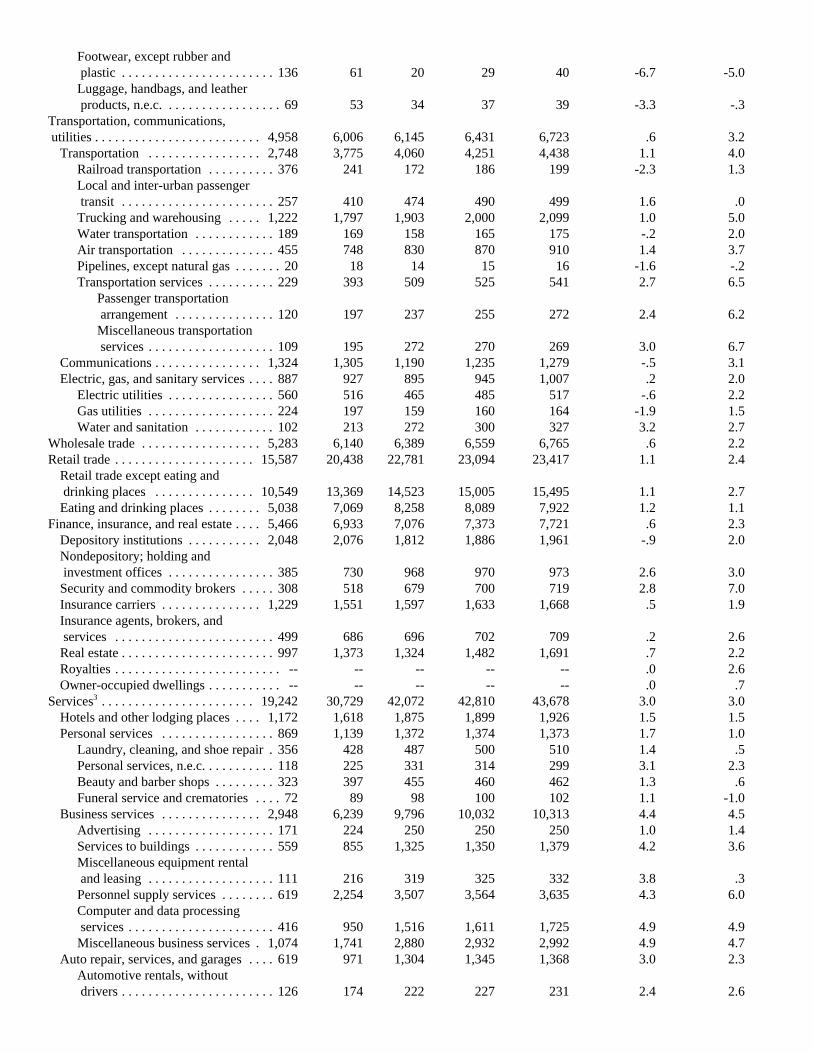
Footwear, except rubber and plastic . . . . . . . . . . . . . . . . . . . . . . . 136 61 20 29 40 -6.7 -5.0Luggage, handbags, and leather products, n.e.c. . . . . . . . . . . . . . . . . . 69 53 34 37 39 -3.3 -.3
Transportation, communications, utilities . . . . . . . . . . . . . . . . . . . . . . . . . 4,958 6,006 6,145 6,431 6,723 .6 3.2
Transportation . . . . . . . . . . . . . . . . . 2,748 3,775 4,060 4,251 4,438 1.1 4.0Railroad transportation . . . . . . . . . . 376 241 172 186 199 -2.3 1.3Local and inter-urban passenger transit . . . . . . . . . . . . . . . . . . . . . . . 257 410 474 490 499 1.6 .0Trucking and warehousing . . . . . 1,222 1,797 1,903 2,000 2,099 1.0 5.0Water transportation . . . . . . . . . . . . 189 169 158 165 175 -.2 2.0Air transportation . . . . . . . . . . . . . . 455 748 830 870 910 1.4 3.7Pipelines, except natural gas . . . . . . . 20 18 14 15 16 -1.6 -.2Transportation services . . . . . . . . . . 229 393 509 525 541 2.7 6.5
Passenger transportation arrangement . . . . . . . . . . . . . . . 120 197 237 255 272 2.4 6.2Miscellaneous transportation services . . . . . . . . . . . . . . . . . . . 109 195 272 270 269 3.0 6.7
Communications . . . . . . . . . . . . . . . . 1,324 1,305 1,190 1,235 1,279 -.5 3.1Electric, gas, and sanitary services . . . . 887 927 895 945 1,007 .2 2.0
Electric utilities . . . . . . . . . . . . . . . . 560 516 465 485 517 -.6 2.2Gas utilities . . . . . . . . . . . . . . . . . . . 224 197 159 160 164 -1.9 1.5Water and sanitation . . . . . . . . . . . . 102 213 272 300 327 3.2 2.7
Wholesale trade . . . . . . . . . . . . . . . . . . 5,283 6,140 6,389 6,559 6,765 .6 2.2Retail trade . . . . . . . . . . . . . . . . . . . . . 15,587 20,438 22,781 23,094 23,417 1.1 2.4
Retail trade except eating and drinking places . . . . . . . . . . . . . . . 10,549 13,369 14,523 15,005 15,495 1.1 2.7Eating and drinking places . . . . . . . . 5,038 7,069 8,258 8,089 7,922 1.2 1.1
Finance, insurance, and real estate . . . . 5,466 6,933 7,076 7,373 7,721 .6 2.3Depository institutions . . . . . . . . . . . 2,048 2,076 1,812 1,886 1,961 -.9 2.0Nondepository; holding and investment offices . . . . . . . . . . . . . . . . 385 730 968 970 973 2.6 3.0Security and commodity brokers . . . . . 308 518 679 700 719 2.8 7.0Insurance carriers . . . . . . . . . . . . . . . 1,229 1,551 1,597 1,633 1,668 .5 1.9Insurance agents, brokers, and services . . . . . . . . . . . . . . . . . . . . . . . . 499 686 696 702 709 .2 2.6Real estate . . . . . . . . . . . . . . . . . . . . . . . 997 1,373 1,324 1,482 1,691 .7 2.2Royalties . . . . . . . . . . . . . . . . . . . . . . . . . -- -- -- -- -- .0 2.6Owner-occupied dwellings . . . . . . . . . . . -- -- -- -- -- .0 .7
Services3 . . . . . . . . . . . . . . . . . . . . . . . 19,242 30,729 42,072 42,810 43,678 3.0 3.0Hotels and other lodging places . . . . 1,172 1,618 1,875 1,899 1,926 1.5 1.5Personal services . . . . . . . . . . . . . . . . . 869 1,139 1,372 1,374 1,373 1.7 1.0
Laundry, cleaning, and shoe repair . 356 428 487 500 510 1.4 .5Personal services, n.e.c. . . . . . . . . . . 118 225 331 314 299 3.1 2.3Beauty and barber shops . . . . . . . . . 323 397 455 460 462 1.3 .6Funeral service and crematories . . . . 72 89 98 100 102 1.1 -1.0
Business services . . . . . . . . . . . . . . . 2,948 6,239 9,796 10,032 10,313 4.4 4.5Advertising . . . . . . . . . . . . . . . . . . . 171 224 250 250 250 1.0 1.4Services to buildings . . . . . . . . . . . . 559 855 1,325 1,350 1,379 4.2 3.6Miscellaneous equipment rental and leasing . . . . . . . . . . . . . . . . . . . 111 216 319 325 332 3.8 .3Personnel supply services . . . . . . . . 619 2,254 3,507 3,564 3,635 4.3 6.0Computer and data processing services . . . . . . . . . . . . . . . . . . . . . . 416 950 1,516 1,611 1,725 4.9 4.9Miscellaneous business services . 1,074 1,741 2,880 2,932 2,992 4.9 4.7
Auto repair, services, and garages . . . . 619 971 1,304 1,345 1,368 3.0 2.3Automotive rentals, without drivers . . . . . . . . . . . . . . . . . . . . . . . 126 174 222 227 231 2.4 2.6

Automobile parking, repair, and services . . . . . . . . . . . . . . . . . . 493 796 1,082 1,119 1,137 3.1 2.0
Miscellaneous repair shops . . . . . . . . . 287 334 393 400 407 1.7 2.2Electrical repair shops . . . . . . . . . . . . 91 105 123 125 127 1.6 1.8Watch, jewelry, and furniture repair . 28 26 25 25 25 -0.5 3.2Miscellaneous repair services . . . . . 169 202 245 250 255 1.9 2.2
Motion pictures . . . . . . . . . . . . . . . . . . . 268 471 588 591 596 2.1 3.1Motion pictures . . . . . . . . . . . . . . . . 214 333 433 426 419 2.2 3.0Video tape rental . . . . . . . . . . . . . . . . 54 138 155 165 177 1.7 3.2
Amusement and recreation services . . . 853 1,344 1,846 1,844 1,848 2.9 2.4Producers, orchestras, and entertainers . . . . . . . . . . . . . . . . . . . . 94 148 197 200 204 2.8 3.0Bowling centers . . . . . . . . . . . . . . . . . 97 85 73 73 73 -1.5 -1.8Commercial sports . . . . . . . . . . . . . . . 76 106 147 137 131 2.4 1.1Amusement and recreation services, n.e.c. . . . . . . . . . . . . . . . . 586 1,005 1,431 1,434 1,441 3.3 2.6
Health services . . . . . . . . . . . . . . . . . 5,986 9,001 11,985 12,075 12,321 2.7 2.9Offices of health practitioner . . . . 1,503 2,546 3,560 3,525 3,472 3.0 3.4Nursing and personal care facilities . . . . . . . . . . . . . . . . . . . 1,106 1,649 2,377 2,400 2,474 3.5 3.1Hospitals, private . . . . . . . . . . . . . 3,037 3,774 4,175 4,250 4,451 1.1 1.6Health services, n.e.c. . . . . . . . . . . . 341 1,032 1,873 1,900 1,925 5.7 6.2
Legal services . . . . . . . . . . . . . . . . . . . . 602 927 1,240 1,270 1,300 2.9 2.9Educational services . . . . . . . . . . . . . 1,225 1,822 2,336 2,400 2,437 2.5 2.8Social services . . . . . . . . . . . . . . . . . 1,188 2,181 3,637 3,639 3,623 4.8 3.3
Individual and miscellaneous social services . . . . . . . . . . . . . . . . . 464 779 1,273 1,314 1,335 4.9 3.8Job training and related services . . . 190 298 443 425 411 3.3 .7Child day care services . . . . . . . . . . 284 502 840 800 766 4.3 1.0Residential care . . . . . . . . . . . . . . . . 251 602 1,082 1,100 1,111 5.6 5.4
Museums, botanical, zoological gardens . . . . . . . . . . . . . . . . . . . . . . . . . . 43 79 112 112 112 3.2 4.7Membership organizations . . . . . . . . 1,510 2,059 2,156 2,336 2,488 1.2 2.6Engineering, management, and related services . . . . . . . . . . . . . . . . 1,673 2,607 3,431 3,494 3,565 2.7 2.5
Engineering and architectural services . . . . . . . . . . . . . . . . . . . . . . 576 775 1,008 1,044 1,086 2.7 2.0Research and testing services . . . . . 384 563 743 745 747 2.6 5.0Management and public relations . . 327 716 1,037 1,049 1,062 3.5 1.7Accounting, auditing, and other services . . . . . . . . . . . . . . . . . . . . . . 387 553 642 656 670 1.6 1.4
Government . . . . . . . . . . . . . . . . . . . . 15,870 19,117 19,307 20,990 22,951 .9 1.0Federal government . . . . . . . . . . . . . 2,774 2,870 2,607 2,635 2,667 -.8 .2
Federal enterprises . . . . . . . . . . . . . 890 1,017 898 935 976 -.8 2.3U.S. Postal Service . . . . . . . . . . 685 818 726 760 797 -.7 2.8Federal electric utilities . . . . . . . . 43 27 24 25 27 -.9 .5Federal government enterprises, n.e.c. . . . . . . . . . . . . . . . . . . . . 162 172 148 150 152 -1.2 2.2
Federal general government . . . . 1,884 1,853 1,709 1,700 1,691 -.8 -.7State and local government . . . . . . 13,096 16,247 16,701 18,355 20,284 1.1 1.4
State and local enterprises . . . . . . . . 782 941 1,073 1,113 1,146 1.5 2.2Local government passenger transit . . . . . . . . . . . . . . . . . . . . 180 214 249 260 266 1.8 -.1State and local electric utilities . . 73 86 102 100 98 1.3 1.6State and local government enterprises, n.e.c. . . . . . . . . . . . 529 641 722 753 782 1.5 2.7
State and local general government . . . . . . . . . . . . . . . . 12,314 15,306 15,628 17,242 19,138 1.1 1.2State and local government

hospitals . . . . . . . . . . . . . . . . . . . 1,115 1,081 994 1,090 1,202 .1 -.2State and local government education . . . . . . . . . . . . . . . . . . 6,589 8,365 9,058 10,000 11,108 1.6 1.8State and local general government, n.e.c. . . . . . . . . . . . 4,610 5,860 5,576 6,152 6,829 .4 .4
Agriculture4 . . . . . . . . . . . . . . . . . . . . . 3,508 3,623 3,431 3,399 3,361 -.6 1.0Agricultural production . . . . . . . . . . . . 2,727 2,326 1,813 1,799 1,783 -2.3 .9
Agricultural services5 . . . . . . . . . . . . . . 699 1,197 1,528 1,514 1,494 2.2 2.2Forestry, fishing, hunting, and trapping . . . . . . . . . . . . . . . . . . . . . . . . . 82 100 90 87 84 -1.3 -2.3
Private households wage and salary . . . 1,247 966 818 800 779 -1.7 .4Nonagricultural self-employed and unpaid family2 . . . . . . . . . . . . . . . . . . . 7,914 9,085 10,382 10,324 10,343 1.2 --
Total6 . . . . . . . . . . . . . . . . . . . . . . . . 102,404 127,014 140,261 144,708 150,212 1.2 2.2
1Rates are based on moderate scenario.2Comparable estimate of output growth is not available.3Excludes SIC 074,5,8 (agricultural services) and 99 (nonclassifiable establishments). The data, therefore are not exactly comparablewith data published in Employment and Earnings.4Excludes government wage and salary workers, and includes private SIC 08,09 (forestry and fisheries).5Excludes SIC 08,09 (forestry and fisheries).6Employment for wage and salary workers are from the Current Employment Statistics (payroll) survey, which counts jobs, whereasself-employe, unpaid family worker, agricultural, and private household data are from the Current Population Survey (householdsurvey), which counts workers. These totals for 1983 and 1994, therefore, differ from the official employment estimates of theBureau of Labor Statistics.Note: Dash indicates data not available. n.e.c. = not elsewhere classified.Source: U.S. Department of Labor, Bureau of Labor Statistics. Historical output data are from the Bureau of Economic Analysis,U.S. Department of Commerce.
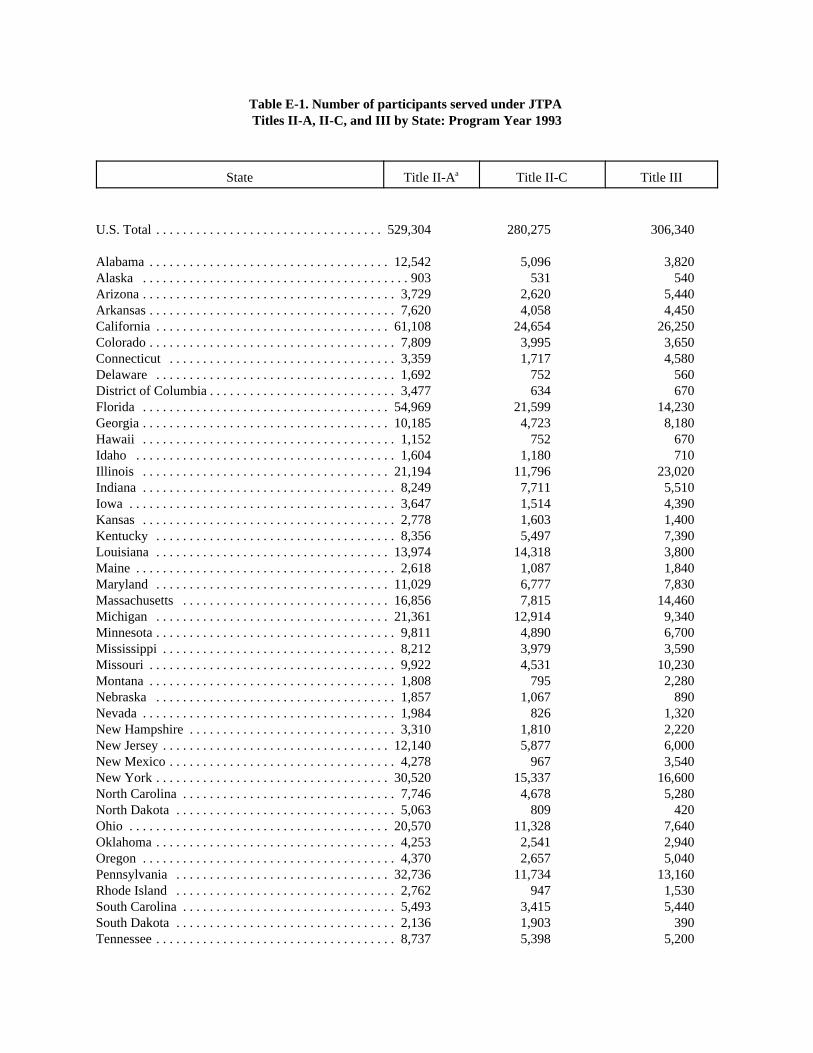
Table E-1. Number of participants served under JTPA Titles II-A, II-C, and III by State: Program Year 1993
State Title II-Aa Title II-C Title III
U.S. Total . . . . . . . . . . . . . . . . . . . . . . . . . . . . . . . . . . 529,304 280,275 306,340
Alabama . . . . . . . . . . . . . . . . . . . . . . . . . . . . . . . . . . . . 12,542 5,096 3,820Alaska . . . . . . . . . . . . . . . . . . . . . . . . . . . . . . . . . . . . . . . . 903 531 540Arizona . . . . . . . . . . . . . . . . . . . . . . . . . . . . . . . . . . . . . . 3,729 2,620 5,440Arkansas . . . . . . . . . . . . . . . . . . . . . . . . . . . . . . . . . . . . . 7,620 4,058 4,450California . . . . . . . . . . . . . . . . . . . . . . . . . . . . . . . . . . . 61,108 24,654 26,250Colorado . . . . . . . . . . . . . . . . . . . . . . . . . . . . . . . . . . . . . 7,809 3,995 3,650Connecticut . . . . . . . . . . . . . . . . . . . . . . . . . . . . . . . . . . 3,359 1,717 4,580Delaware . . . . . . . . . . . . . . . . . . . . . . . . . . . . . . . . . . . . 1,692 752 560District of Columbia . . . . . . . . . . . . . . . . . . . . . . . . . . . . 3,477 634 670Florida . . . . . . . . . . . . . . . . . . . . . . . . . . . . . . . . . . . . . 54,969 21,599 14,230Georgia . . . . . . . . . . . . . . . . . . . . . . . . . . . . . . . . . . . . . 10,185 4,723 8,180Hawaii . . . . . . . . . . . . . . . . . . . . . . . . . . . . . . . . . . . . . . 1,152 752 670Idaho . . . . . . . . . . . . . . . . . . . . . . . . . . . . . . . . . . . . . . . 1,604 1,180 710Illinois . . . . . . . . . . . . . . . . . . . . . . . . . . . . . . . . . . . . . 21,194 11,796 23,020Indiana . . . . . . . . . . . . . . . . . . . . . . . . . . . . . . . . . . . . . . 8,249 7,711 5,510Iowa . . . . . . . . . . . . . . . . . . . . . . . . . . . . . . . . . . . . . . . . 3,647 1,514 4,390Kansas . . . . . . . . . . . . . . . . . . . . . . . . . . . . . . . . . . . . . . 2,778 1,603 1,400Kentucky . . . . . . . . . . . . . . . . . . . . . . . . . . . . . . . . . . . . 8,356 5,497 7,390Louisiana . . . . . . . . . . . . . . . . . . . . . . . . . . . . . . . . . . . 13,974 14,318 3,800Maine . . . . . . . . . . . . . . . . . . . . . . . . . . . . . . . . . . . . . . . 2,618 1,087 1,840Maryland . . . . . . . . . . . . . . . . . . . . . . . . . . . . . . . . . . . 11,029 6,777 7,830Massachusetts . . . . . . . . . . . . . . . . . . . . . . . . . . . . . . . 16,856 7,815 14,460Michigan . . . . . . . . . . . . . . . . . . . . . . . . . . . . . . . . . . . 21,361 12,914 9,340Minnesota . . . . . . . . . . . . . . . . . . . . . . . . . . . . . . . . . . . . 9,811 4,890 6,700Mississippi . . . . . . . . . . . . . . . . . . . . . . . . . . . . . . . . . . . 8,212 3,979 3,590Missouri . . . . . . . . . . . . . . . . . . . . . . . . . . . . . . . . . . . . . 9,922 4,531 10,230Montana . . . . . . . . . . . . . . . . . . . . . . . . . . . . . . . . . . . . . 1,808 795 2,280Nebraska . . . . . . . . . . . . . . . . . . . . . . . . . . . . . . . . . . . . 1,857 1,067 890Nevada . . . . . . . . . . . . . . . . . . . . . . . . . . . . . . . . . . . . . . 1,984 826 1,320New Hampshire . . . . . . . . . . . . . . . . . . . . . . . . . . . . . . . 3,310 1,810 2,220New Jersey . . . . . . . . . . . . . . . . . . . . . . . . . . . . . . . . . . 12,140 5,877 6,000New Mexico . . . . . . . . . . . . . . . . . . . . . . . . . . . . . . . . . . 4,278 967 3,540New York . . . . . . . . . . . . . . . . . . . . . . . . . . . . . . . . . . . 30,520 15,337 16,600North Carolina . . . . . . . . . . . . . . . . . . . . . . . . . . . . . . . . 7,746 4,678 5,280North Dakota . . . . . . . . . . . . . . . . . . . . . . . . . . . . . . . . . 5,063 809 420Ohio . . . . . . . . . . . . . . . . . . . . . . . . . . . . . . . . . . . . . . . 20,570 11,328 7,640Oklahoma . . . . . . . . . . . . . . . . . . . . . . . . . . . . . . . . . . . . 4,253 2,541 2,940Oregon . . . . . . . . . . . . . . . . . . . . . . . . . . . . . . . . . . . . . . 4,370 2,657 5,040Pennsylvania . . . . . . . . . . . . . . . . . . . . . . . . . . . . . . . . 32,736 11,734 13,160Rhode Island . . . . . . . . . . . . . . . . . . . . . . . . . . . . . . . . . 2,762 947 1,530South Carolina . . . . . . . . . . . . . . . . . . . . . . . . . . . . . . . . 5,493 3,415 5,440South Dakota . . . . . . . . . . . . . . . . . . . . . . . . . . . . . . . . . 2,136 1,903 390Tennessee . . . . . . . . . . . . . . . . . . . . . . . . . . . . . . . . . . . . 8,737 5,398 5,200

Texas . . . . . . . . . . . . . . . . . . . . . . . . . . . . . . . . . . . . . . 31,088 21,837 19,650Utah . . . . . . . . . . . . . . . . . . . . . . . . . . . . . . . . . . . . . . . . 2,188 1,121 890Vermont . . . . . . . . . . . . . . . . . . . . . . . . . . . . . . . . . . . . . 1,588 845 1,200Virginia . . . . . . . . . . . . . . . . . . . . . . . . . . . . . . . . . . . . . 8,415 5,402 10,950Washington . . . . . . . . . . . . . . . . . . . . . . . . . . . . . . . . . . 8,543 4,505 8,930West Virginia . . . . . . . . . . . . . . . . . . . . . . . . . . . . . . . . . 3,455 2,363 2,200Wisconsin . . . . . . . . . . . . . . . . . . . . . . . . . . . . . . . . . . . . 9,401 5,910 6,650Wyoming . . . . . . . . . . . . . . . . . . . . . . . . . . . . . . . . . . . . . . 732 383 180Puerto Rico . . . . . . . . . . . . . . . . . . . . . . . . . . . . . . . . . . . 5,975 9,077 2,590________________________________________________________________________________________
aData include II-A participants enrolled under the basic program and under special State set-asides. These set-asides represent 22 percent of total funding and are used for: (1) coordination with State education programs (eightpercent of total funds); (2) incentive grants for programs exceeding performance standards or technical assistancefor programs that fail to meet standards (six percent); (3) training programs for older workers (three percent); (4)State administrative responsibilities, including support for the State Job Training Coordinating Council (fivepercent).Source: U.S. Department of Labor, Employment and Training Administration.Note: Data may not add to total due to rounding or minor reporting deficiencies.
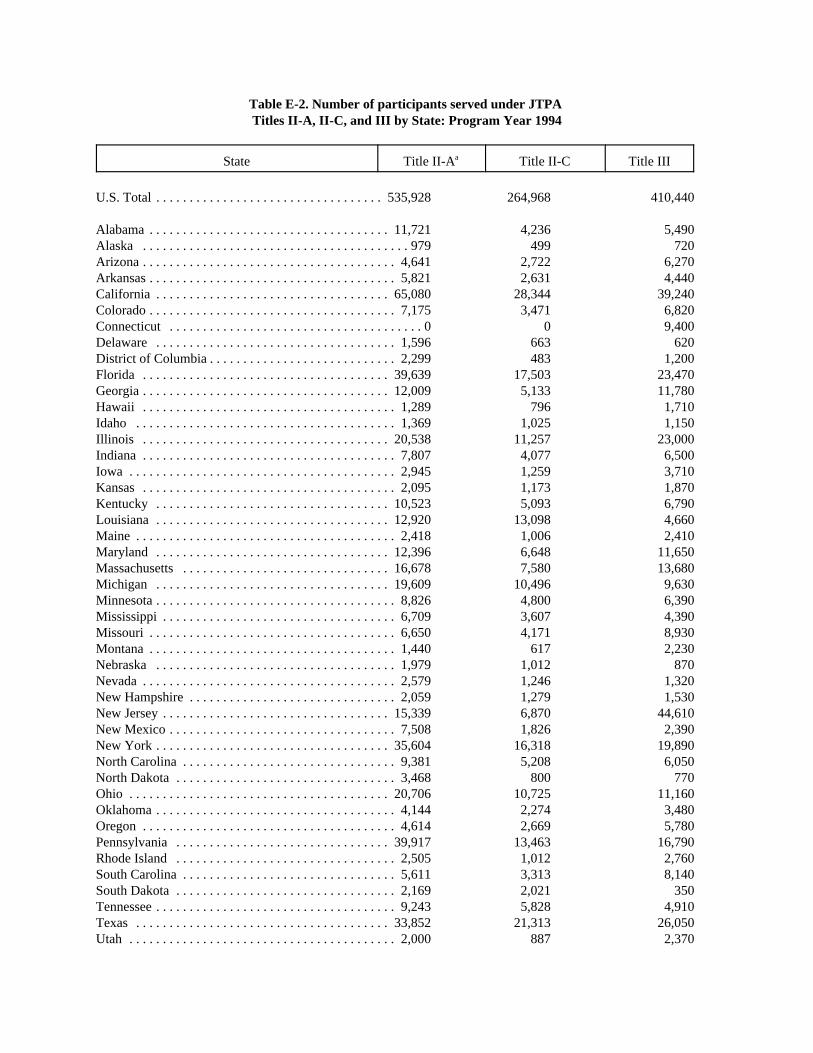
Table E-2. Number of participants served under JTPA Titles II-A, II-C, and III by State: Program Year 1994
State Title II-Aa Title II-C Title III
U.S. Total . . . . . . . . . . . . . . . . . . . . . . . . . . . . . . . . . . 535,928 264,968 410,440
Alabama . . . . . . . . . . . . . . . . . . . . . . . . . . . . . . . . . . . . 11,721 4,236 5,490Alaska . . . . . . . . . . . . . . . . . . . . . . . . . . . . . . . . . . . . . . . . 979 499 720Arizona . . . . . . . . . . . . . . . . . . . . . . . . . . . . . . . . . . . . . . 4,641 2,722 6,270Arkansas . . . . . . . . . . . . . . . . . . . . . . . . . . . . . . . . . . . . . 5,821 2,631 4,440California . . . . . . . . . . . . . . . . . . . . . . . . . . . . . . . . . . . 65,080 28,344 39,240Colorado . . . . . . . . . . . . . . . . . . . . . . . . . . . . . . . . . . . . . 7,175 3,471 6,820Connecticut . . . . . . . . . . . . . . . . . . . . . . . . . . . . . . . . . . . . . . 0 0 9,400Delaware . . . . . . . . . . . . . . . . . . . . . . . . . . . . . . . . . . . . 1,596 663 620District of Columbia . . . . . . . . . . . . . . . . . . . . . . . . . . . . 2,299 483 1,200Florida . . . . . . . . . . . . . . . . . . . . . . . . . . . . . . . . . . . . . 39,639 17,503 23,470Georgia . . . . . . . . . . . . . . . . . . . . . . . . . . . . . . . . . . . . . 12,009 5,133 11,780Hawaii . . . . . . . . . . . . . . . . . . . . . . . . . . . . . . . . . . . . . . 1,289 796 1,710Idaho . . . . . . . . . . . . . . . . . . . . . . . . . . . . . . . . . . . . . . . 1,369 1,025 1,150Illinois . . . . . . . . . . . . . . . . . . . . . . . . . . . . . . . . . . . . . 20,538 11,257 23,000Indiana . . . . . . . . . . . . . . . . . . . . . . . . . . . . . . . . . . . . . . 7,807 4,077 6,500Iowa . . . . . . . . . . . . . . . . . . . . . . . . . . . . . . . . . . . . . . . . 2,945 1,259 3,710Kansas . . . . . . . . . . . . . . . . . . . . . . . . . . . . . . . . . . . . . . 2,095 1,173 1,870Kentucky . . . . . . . . . . . . . . . . . . . . . . . . . . . . . . . . . . . 10,523 5,093 6,790Louisiana . . . . . . . . . . . . . . . . . . . . . . . . . . . . . . . . . . . 12,920 13,098 4,660Maine . . . . . . . . . . . . . . . . . . . . . . . . . . . . . . . . . . . . . . . 2,418 1,006 2,410Maryland . . . . . . . . . . . . . . . . . . . . . . . . . . . . . . . . . . . 12,396 6,648 11,650Massachusetts . . . . . . . . . . . . . . . . . . . . . . . . . . . . . . . 16,678 7,580 13,680Michigan . . . . . . . . . . . . . . . . . . . . . . . . . . . . . . . . . . . 19,609 10,496 9,630Minnesota . . . . . . . . . . . . . . . . . . . . . . . . . . . . . . . . . . . . 8,826 4,800 6,390Mississippi . . . . . . . . . . . . . . . . . . . . . . . . . . . . . . . . . . . 6,709 3,607 4,390Missouri . . . . . . . . . . . . . . . . . . . . . . . . . . . . . . . . . . . . . 6,650 4,171 8,930Montana . . . . . . . . . . . . . . . . . . . . . . . . . . . . . . . . . . . . . 1,440 617 2,230Nebraska . . . . . . . . . . . . . . . . . . . . . . . . . . . . . . . . . . . . 1,979 1,012 870Nevada . . . . . . . . . . . . . . . . . . . . . . . . . . . . . . . . . . . . . . 2,579 1,246 1,320New Hampshire . . . . . . . . . . . . . . . . . . . . . . . . . . . . . . . 2,059 1,279 1,530New Jersey . . . . . . . . . . . . . . . . . . . . . . . . . . . . . . . . . . 15,339 6,870 44,610New Mexico . . . . . . . . . . . . . . . . . . . . . . . . . . . . . . . . . . 7,508 1,826 2,390New York . . . . . . . . . . . . . . . . . . . . . . . . . . . . . . . . . . . 35,604 16,318 19,890North Carolina . . . . . . . . . . . . . . . . . . . . . . . . . . . . . . . . 9,381 5,208 6,050North Dakota . . . . . . . . . . . . . . . . . . . . . . . . . . . . . . . . . 3,468 800 770Ohio . . . . . . . . . . . . . . . . . . . . . . . . . . . . . . . . . . . . . . . 20,706 10,725 11,160Oklahoma . . . . . . . . . . . . . . . . . . . . . . . . . . . . . . . . . . . . 4,144 2,274 3,480Oregon . . . . . . . . . . . . . . . . . . . . . . . . . . . . . . . . . . . . . . 4,614 2,669 5,780Pennsylvania . . . . . . . . . . . . . . . . . . . . . . . . . . . . . . . . 39,917 13,463 16,790Rhode Island . . . . . . . . . . . . . . . . . . . . . . . . . . . . . . . . . 2,505 1,012 2,760South Carolina . . . . . . . . . . . . . . . . . . . . . . . . . . . . . . . . 5,611 3,313 8,140South Dakota . . . . . . . . . . . . . . . . . . . . . . . . . . . . . . . . . 2,169 2,021 350Tennessee . . . . . . . . . . . . . . . . . . . . . . . . . . . . . . . . . . . . 9,243 5,828 4,910Texas . . . . . . . . . . . . . . . . . . . . . . . . . . . . . . . . . . . . . . 33,852 21,313 26,050Utah . . . . . . . . . . . . . . . . . . . . . . . . . . . . . . . . . . . . . . . . 2,000 887 2,370

Vermont . . . . . . . . . . . . . . . . . . . . . . . . . . . . . . . . . . . . . 1,594 911 1,150Virginia . . . . . . . . . . . . . . . . . . . . . . . . . . . . . . . . . . . . 17,000 4,697 6,900Washington . . . . . . . . . . . . . . . . . . . . . . . . . . . . . . . . . . 9,024 4,511 11,870West Virginia . . . . . . . . . . . . . . . . . . . . . . . . . . . . . . . . . 3,226 1,928 3,800Wisconsin . . . . . . . . . . . . . . . . . . . . . . . . . . . . . . . . . . . . 8,850 4,789 6,200Wyoming . . . . . . . . . . . . . . . . . . . . . . . . . . . . . . . . . . . . . . 857 307 260Puerto Rico . . . . . . . . . . . . . . . . . . . . . . . . . . . . . . . . . . . 7,527 7,373 2,940________________________________________________________________________________________
aData include II-A participants enrolled under the basic program and under special State set-asides. These set-asides represent 22 percent of total funding and are used for: (1) coordination with State education programs (eightpercent of total funds); (2) incentive grants for programs exceeding performance standards or technical assistancefor programs that fail to meet standards (six percent); (3) training programs for older workers (three percent); (4)State administrative responsibilities, including support for the State Job Training Coordinating Council (fivepercent).Source: U.S. Department of Labor, Employment and Training Administration.Note: Data may not add to total due to rounding or minor reporting deficiencies.
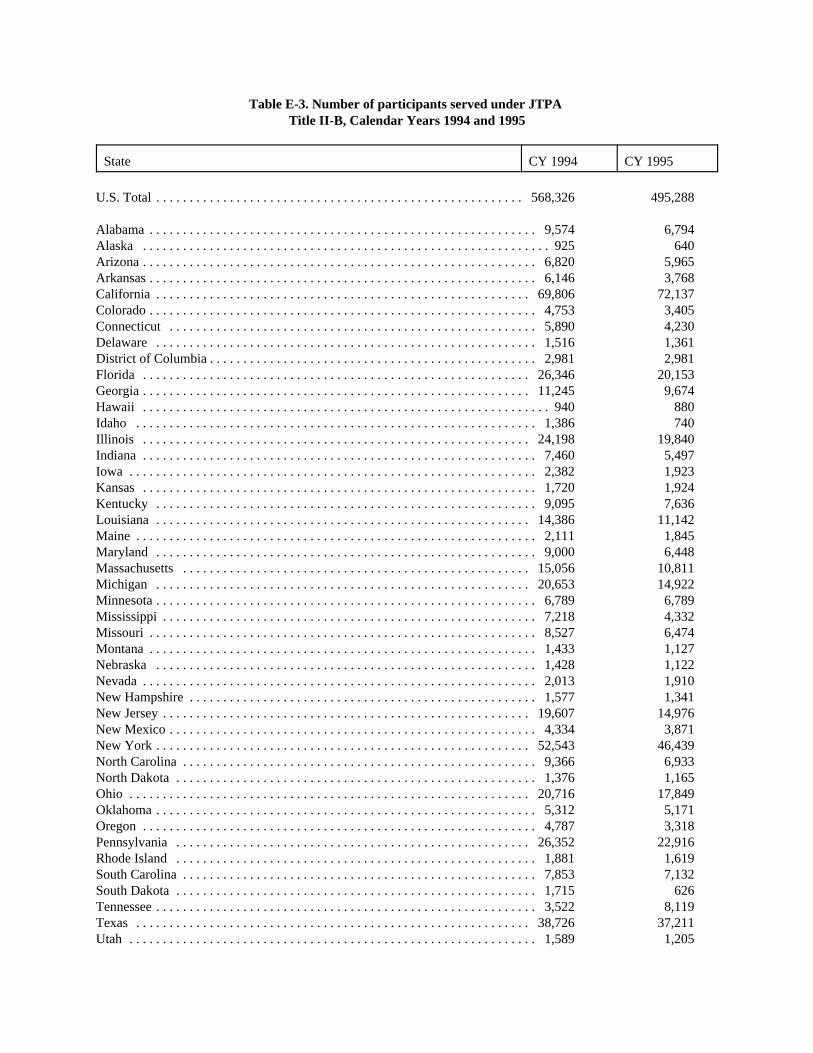
Table E-3. Number of participants served under JTPA Title II-B, Calendar Years 1994 and 1995
State CY 1994 CY 1995
U.S. Total . . . . . . . . . . . . . . . . . . . . . . . . . . . . . . . . . . . . . . . . . . . . . . . . . . . . . . . 568,326 495,288
Alabama . . . . . . . . . . . . . . . . . . . . . . . . . . . . . . . . . . . . . . . . . . . . . . . . . . . . . . . . . . 9,574 6,794Alaska . . . . . . . . . . . . . . . . . . . . . . . . . . . . . . . . . . . . . . . . . . . . . . . . . . . . . . . . . . . . . 925 640Arizona . . . . . . . . . . . . . . . . . . . . . . . . . . . . . . . . . . . . . . . . . . . . . . . . . . . . . . . . . . . 6,820 5,965Arkansas . . . . . . . . . . . . . . . . . . . . . . . . . . . . . . . . . . . . . . . . . . . . . . . . . . . . . . . . . . 6,146 3,768California . . . . . . . . . . . . . . . . . . . . . . . . . . . . . . . . . . . . . . . . . . . . . . . . . . . . . . . . 69,806 72,137Colorado . . . . . . . . . . . . . . . . . . . . . . . . . . . . . . . . . . . . . . . . . . . . . . . . . . . . . . . . . . 4,753 3,405Connecticut . . . . . . . . . . . . . . . . . . . . . . . . . . . . . . . . . . . . . . . . . . . . . . . . . . . . . . . 5,890 4,230Delaware . . . . . . . . . . . . . . . . . . . . . . . . . . . . . . . . . . . . . . . . . . . . . . . . . . . . . . . . . 1,516 1,361District of Columbia . . . . . . . . . . . . . . . . . . . . . . . . . . . . . . . . . . . . . . . . . . . . . . . . . 2,981 2,981Florida . . . . . . . . . . . . . . . . . . . . . . . . . . . . . . . . . . . . . . . . . . . . . . . . . . . . . . . . . . 26,346 20,153Georgia . . . . . . . . . . . . . . . . . . . . . . . . . . . . . . . . . . . . . . . . . . . . . . . . . . . . . . . . . . 11,245 9,674Hawaii . . . . . . . . . . . . . . . . . . . . . . . . . . . . . . . . . . . . . . . . . . . . . . . . . . . . . . . . . . . . . 940 880Idaho . . . . . . . . . . . . . . . . . . . . . . . . . . . . . . . . . . . . . . . . . . . . . . . . . . . . . . . . . . . . 1,386 740Illinois . . . . . . . . . . . . . . . . . . . . . . . . . . . . . . . . . . . . . . . . . . . . . . . . . . . . . . . . . . 24,198 19,840Indiana . . . . . . . . . . . . . . . . . . . . . . . . . . . . . . . . . . . . . . . . . . . . . . . . . . . . . . . . . . . 7,460 5,497Iowa . . . . . . . . . . . . . . . . . . . . . . . . . . . . . . . . . . . . . . . . . . . . . . . . . . . . . . . . . . . . . 2,382 1,923Kansas . . . . . . . . . . . . . . . . . . . . . . . . . . . . . . . . . . . . . . . . . . . . . . . . . . . . . . . . . . . 1,720 1,924Kentucky . . . . . . . . . . . . . . . . . . . . . . . . . . . . . . . . . . . . . . . . . . . . . . . . . . . . . . . . . 9,095 7,636Louisiana . . . . . . . . . . . . . . . . . . . . . . . . . . . . . . . . . . . . . . . . . . . . . . . . . . . . . . . . 14,386 11,142Maine . . . . . . . . . . . . . . . . . . . . . . . . . . . . . . . . . . . . . . . . . . . . . . . . . . . . . . . . . . . . 2,111 1,845Maryland . . . . . . . . . . . . . . . . . . . . . . . . . . . . . . . . . . . . . . . . . . . . . . . . . . . . . . . . . 9,000 6,448Massachusetts . . . . . . . . . . . . . . . . . . . . . . . . . . . . . . . . . . . . . . . . . . . . . . . . . . . . 15,056 10,811Michigan . . . . . . . . . . . . . . . . . . . . . . . . . . . . . . . . . . . . . . . . . . . . . . . . . . . . . . . . 20,653 14,922Minnesota . . . . . . . . . . . . . . . . . . . . . . . . . . . . . . . . . . . . . . . . . . . . . . . . . . . . . . . . . 6,789 6,789Mississippi . . . . . . . . . . . . . . . . . . . . . . . . . . . . . . . . . . . . . . . . . . . . . . . . . . . . . . . . 7,218 4,332Missouri . . . . . . . . . . . . . . . . . . . . . . . . . . . . . . . . . . . . . . . . . . . . . . . . . . . . . . . . . . 8,527 6,474Montana . . . . . . . . . . . . . . . . . . . . . . . . . . . . . . . . . . . . . . . . . . . . . . . . . . . . . . . . . . 1,433 1,127Nebraska . . . . . . . . . . . . . . . . . . . . . . . . . . . . . . . . . . . . . . . . . . . . . . . . . . . . . . . . . 1,428 1,122Nevada . . . . . . . . . . . . . . . . . . . . . . . . . . . . . . . . . . . . . . . . . . . . . . . . . . . . . . . . . . . 2,013 1,910New Hampshire . . . . . . . . . . . . . . . . . . . . . . . . . . . . . . . . . . . . . . . . . . . . . . . . . . . . 1,577 1,341New Jersey . . . . . . . . . . . . . . . . . . . . . . . . . . . . . . . . . . . . . . . . . . . . . . . . . . . . . . . 19,607 14,976New Mexico . . . . . . . . . . . . . . . . . . . . . . . . . . . . . . . . . . . . . . . . . . . . . . . . . . . . . . . 4,334 3,871New York . . . . . . . . . . . . . . . . . . . . . . . . . . . . . . . . . . . . . . . . . . . . . . . . . . . . . . . . 52,543 46,439North Carolina . . . . . . . . . . . . . . . . . . . . . . . . . . . . . . . . . . . . . . . . . . . . . . . . . . . . . 9,366 6,933North Dakota . . . . . . . . . . . . . . . . . . . . . . . . . . . . . . . . . . . . . . . . . . . . . . . . . . . . . . 1,376 1,165Ohio . . . . . . . . . . . . . . . . . . . . . . . . . . . . . . . . . . . . . . . . . . . . . . . . . . . . . . . . . . . . 20,716 17,849Oklahoma . . . . . . . . . . . . . . . . . . . . . . . . . . . . . . . . . . . . . . . . . . . . . . . . . . . . . . . . . 5,312 5,171Oregon . . . . . . . . . . . . . . . . . . . . . . . . . . . . . . . . . . . . . . . . . . . . . . . . . . . . . . . . . . . 4,787 3,318Pennsylvania . . . . . . . . . . . . . . . . . . . . . . . . . . . . . . . . . . . . . . . . . . . . . . . . . . . . . 26,352 22,916Rhode Island . . . . . . . . . . . . . . . . . . . . . . . . . . . . . . . . . . . . . . . . . . . . . . . . . . . . . . 1,881 1,619South Carolina . . . . . . . . . . . . . . . . . . . . . . . . . . . . . . . . . . . . . . . . . . . . . . . . . . . . . 7,853 7,132South Dakota . . . . . . . . . . . . . . . . . . . . . . . . . . . . . . . . . . . . . . . . . . . . . . . . . . . . . . 1,715 626Tennessee . . . . . . . . . . . . . . . . . . . . . . . . . . . . . . . . . . . . . . . . . . . . . . . . . . . . . . . . . 3,522 8,119Texas . . . . . . . . . . . . . . . . . . . . . . . . . . . . . . . . . . . . . . . . . . . . . . . . . . . . . . . . . . . 38,726 37,211Utah . . . . . . . . . . . . . . . . . . . . . . . . . . . . . . . . . . . . . . . . . . . . . . . . . . . . . . . . . . . . . 1,589 1,205

Vermont . . . . . . . . . . . . . . . . . . . . . . . . . . . . . . . . . . . . . . . . . . . . . . . . . . . . . . . . . . 1,709 1,172Virginia . . . . . . . . . . . . . . . . . . . . . . . . . . . . . . . . . . . . . . . . . . . . . . . . . . . . . . . . . . 9,016 7,334Washington . . . . . . . . . . . . . . . . . . . . . . . . . . . . . . . . . . . . . . . . . . . . . . . . . . . . . . . 7,517 6,224West Virginia . . . . . . . . . . . . . . . . . . . . . . . . . . . . . . . . . . . . . . . . . . . . . . . . . . . . . . 5,560 5,820Wisconsin . . . . . . . . . . . . . . . . . . . . . . . . . . . . . . . . . . . . . . . . . . . . . . . . . . . . . . . . . 5,401 3,857Wyoming . . . . . . . . . . . . . . . . . . . . . . . . . . . . . . . . . . . . . . . . . . . . . . . . . . . . . . . . . . . 541 510Puerto Rico . . . . . . . . . . . . . . . . . . . . . . . . . . . . . . . . . . . . . . . . . . . . . . . . . . . . . . . 55,493 54,010________________________________________________________________________________________
Source: U.S. Department of Labor, Employment and Training Administration.Note: Data may not add to total due to rounding or minor reporting deficiencies.

Table E-4. Expenditures under JTPA Titles II-A and II-C by State: Program Year 1993________________________________________________________________________________________
State Title II-A Title II-C
U.S. Total $809,931,638 $540,887,994
Alabama 17,748,578 10,488,451
Alaska 1,649,276 1.339,596
Arizona 11,365,038 8,436,940
Arkansas 9,107,210 6,528,378
California 112,885,243 63,601,586
Colorado 8,604,906 5,635,005
Connecticut 8,179,404 5,595,615
Delaware 2,045,054 1,574,200
District of Columbia 1,817,099 704,577
Florida 50,714,804 27,975,075
Georgia 17,104,438 11,103,508
Hawaii 1,998,729 1,461,613
Idaho 3,064,815 2,325,539
Illinois 39,014,580 26,306,643
Indiana 13,628,695 10,078,721
Iowa 6,424,503 3,018,089
Kansas 3,969,558 2,645,616
Kentucky 9,828,570 8,451,187
Louisiana 22,904,789 20,018,183
Maine 4,396,279 3,136,183
Maryland 10,879,750 8,876,106
Massachusetts 17,838,433 14,159,814
Michigan 34,528,906 24,561,411
Minnesota 8,098,994 5,109,713
Mississippi 10,001,501 8,413,878
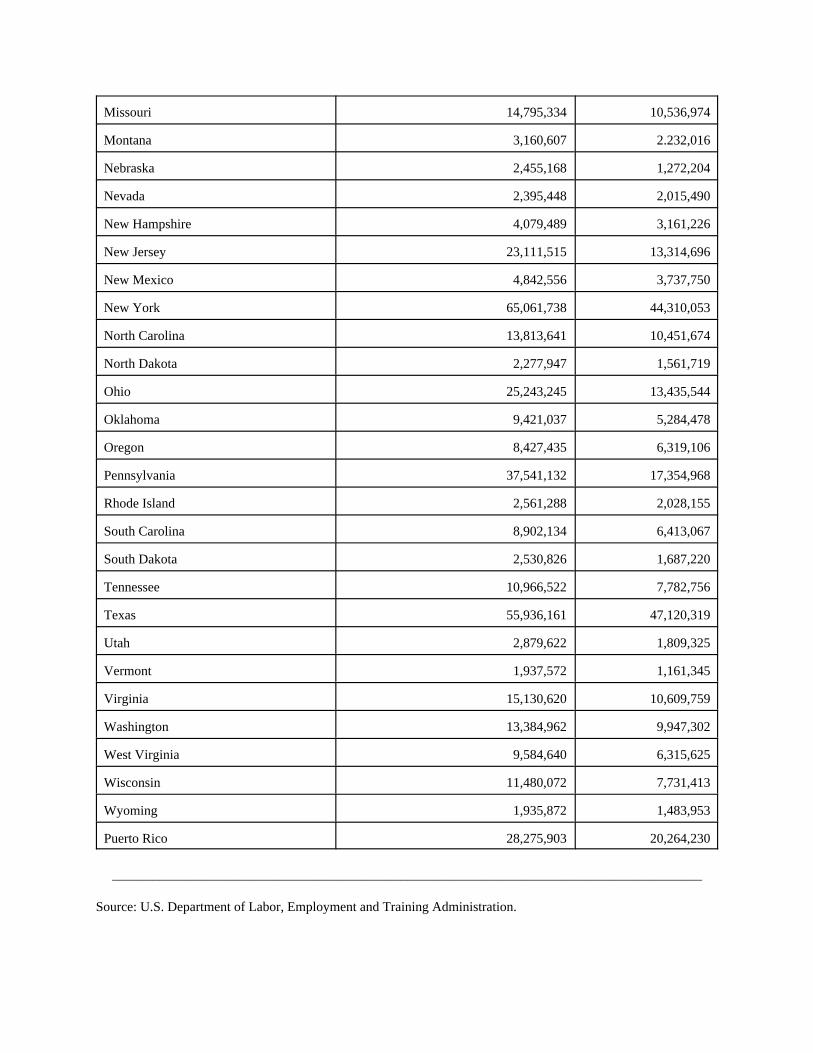
Missouri 14,795,334 10,536,974
Montana 3,160,607 2.232,016
Nebraska 2,455,168 1,272,204
Nevada 2,395,448 2,015,490
New Hampshire 4,079,489 3,161,226
New Jersey 23,111,515 13,314,696
New Mexico 4,842,556 3,737,750
New York 65,061,738 44,310,053
North Carolina 13,813,641 10,451,674
North Dakota 2,277,947 1,561,719
Ohio 25,243,245 13,435,544
Oklahoma 9,421,037 5,284,478
Oregon 8,427,435 6,319,106
Pennsylvania 37,541,132 17,354,968
Rhode Island 2,561,288 2,028,155
South Carolina 8,902,134 6,413,067
South Dakota 2,530,826 1,687,220
Tennessee 10,966,522 7,782,756
Texas 55,936,161 47,120,319
Utah 2,879,622 1,809,325
Vermont 1,937,572 1,161,345
Virginia 15,130,620 10,609,759
Washington 13,384,962 9,947,302
West Virginia 9,584,640 6,315,625
Wisconsin 11,480,072 7,731,413
Wyoming 1,935,872 1,483,953
Puerto Rico 28,275,903 20,264,230
________________________________________________________________________________________
Source: U.S. Department of Labor, Employment and Training Administration.
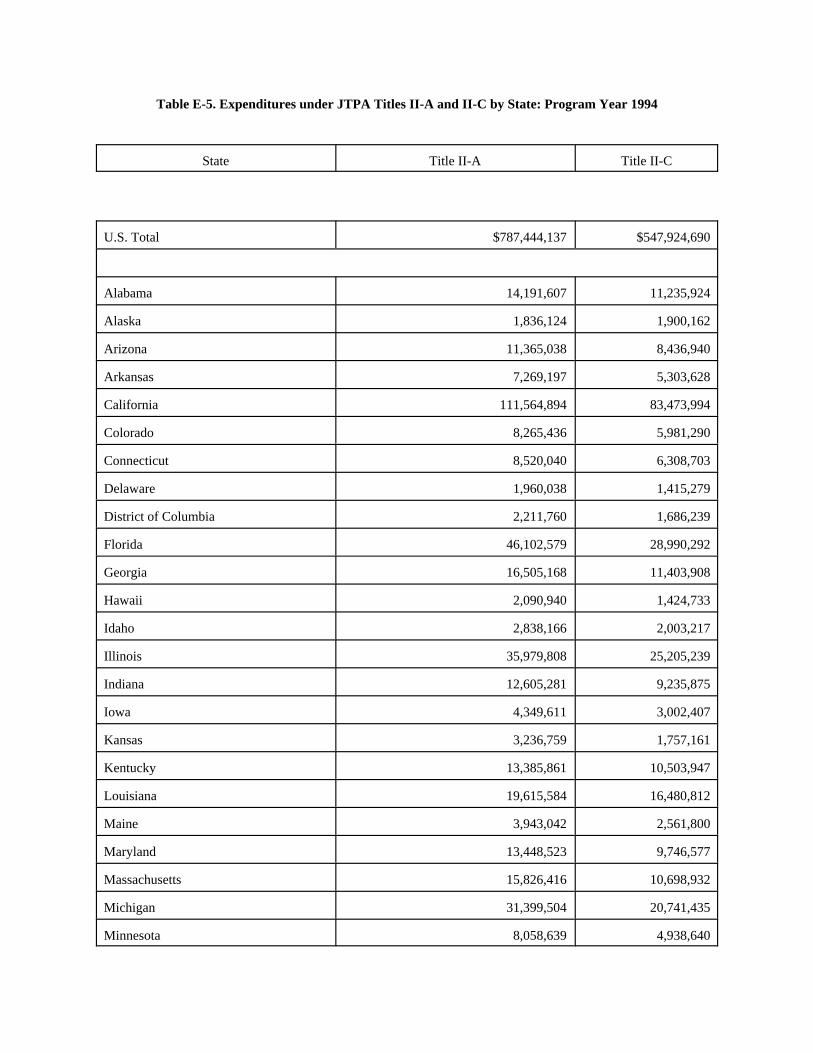
Table E-5. Expenditures under JTPA Titles II-A and II-C by State: Program Year 1994
State Title II-A Title II-C
U.S. Total $787,444,137 $547,924,690
Alabama 14,191,607 11,235,924
Alaska 1,836,124 1,900,162
Arizona 11,365,038 8,436,940
Arkansas 7,269,197 5,303,628
California 111,564,894 83,473,994
Colorado 8,265,436 5,981,290
Connecticut 8,520,040 6,308,703
Delaware 1,960,038 1,415,279
District of Columbia 2,211,760 1,686,239
Florida 46,102,579 28,990,292
Georgia 16,505,168 11,403,908
Hawaii 2,090,940 1,424,733
Idaho 2,838,166 2,003,217
Illinois 35,979,808 25,205,239
Indiana 12,605,281 9,235,875
Iowa 4,349,611 3,002,407
Kansas 3,236,759 1,757,161
Kentucky 13,385,861 10,503,947
Louisiana 19,615,584 16,480,812
Maine 3,943,042 2,561,800
Maryland 13,448,523 9,746,577
Massachusetts 15,826,416 10,698,932
Michigan 31,399,504 20,741,435
Minnesota 8,058,639 4,938,640
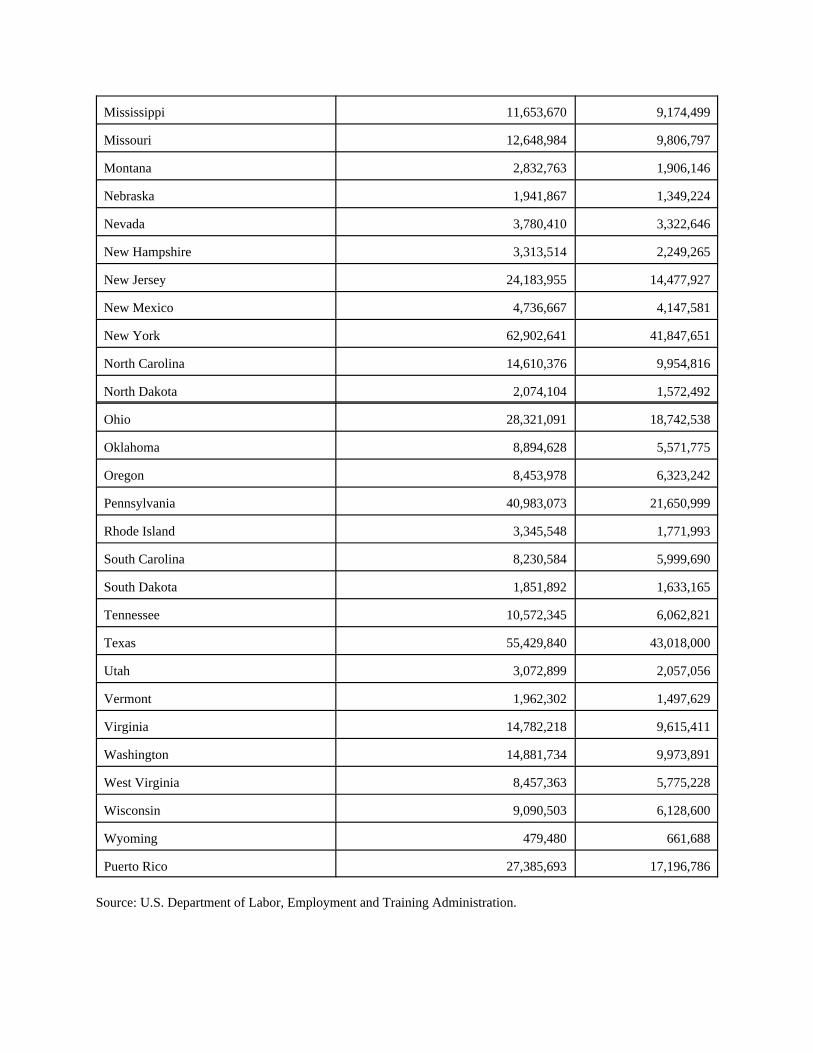
Mississippi 11,653,670 9,174,499
Missouri 12,648,984 9,806,797
Montana 2,832,763 1,906,146
Nebraska 1,941,867 1,349,224
Nevada 3,780,410 3,322,646
New Hampshire 3,313,514 2,249,265
New Jersey 24,183,955 14,477,927
New Mexico 4,736,667 4,147,581
New York 62,902,641 41,847,651
North Carolina 14,610,376 9,954,816
North Dakota 2,074,104 1,572,492
Ohio 28,321,091 18,742,538
Oklahoma 8,894,628 5,571,775
Oregon 8,453,978 6,323,242
Pennsylvania 40,983,073 21,650,999
Rhode Island 3,345,548 1,771,993
South Carolina 8,230,584 5,999,690
South Dakota 1,851,892 1,633,165
Tennessee 10,572,345 6,062,821
Texas 55,429,840 43,018,000
Utah 3,072,899 2,057,056
Vermont 1,962,302 1,497,629
Virginia 14,782,218 9,615,411
Washington 14,881,734 9,973,891
West Virginia 8,457,363 5,775,228
Wisconsin 9,090,503 6,128,600
Wyoming 479,480 661,688
Puerto Rico 27,385,693 17,196,786
Source: U.S. Department of Labor, Employment and Training Administration.
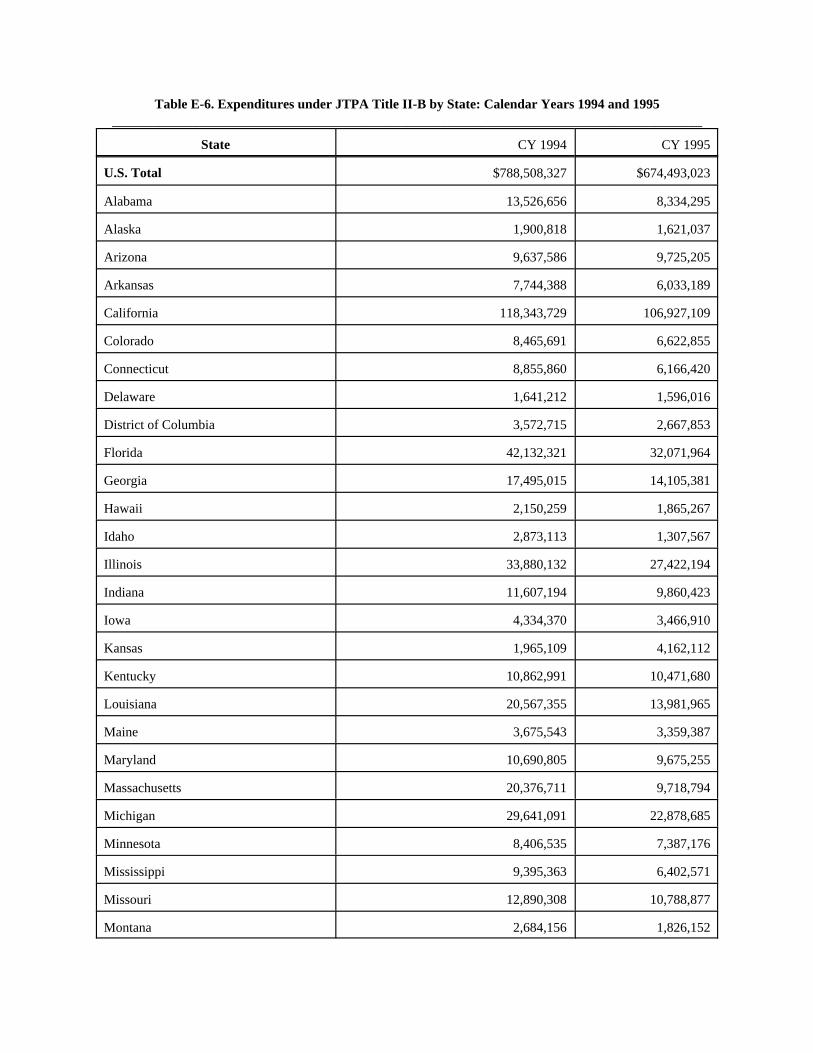
Table E-6. Expenditures under JTPA Title II-B by State: Calendar Years 1994 and 1995________________________________________________________________________________________
State CY 1994 CY 1995
U.S. Total $788,508,327 $674,493,023
Alabama 13,526,656 8,334,295
Alaska 1,900,818 1,621,037
Arizona 9,637,586 9,725,205
Arkansas 7,744,388 6,033,189
California 118,343,729 106,927,109
Colorado 8,465,691 6,622,855
Connecticut 8,855,860 6,166,420
Delaware 1,641,212 1,596,016
District of Columbia 3,572,715 2,667,853
Florida 42,132,321 32,071,964
Georgia 17,495,015 14,105,381
Hawaii 2,150,259 1,865,267
Idaho 2,873,113 1,307,567
Illinois 33,880,132 27,422,194
Indiana 11,607,194 9,860,423
Iowa 4,334,370 3,466,910
Kansas 1,965,109 4,162,112
Kentucky 10,862,991 10,471,680
Louisiana 20,567,355 13,981,965
Maine 3,675,543 3,359,387
Maryland 10,690,805 9,675,255
Massachusetts 20,376,711 9,718,794
Michigan 29,641,091 22,878,685
Minnesota 8,406,535 7,387,176
Mississippi 9,395,363 6,402,571
Missouri 12,890,308 10,788,877
Montana 2,684,156 1,826,152
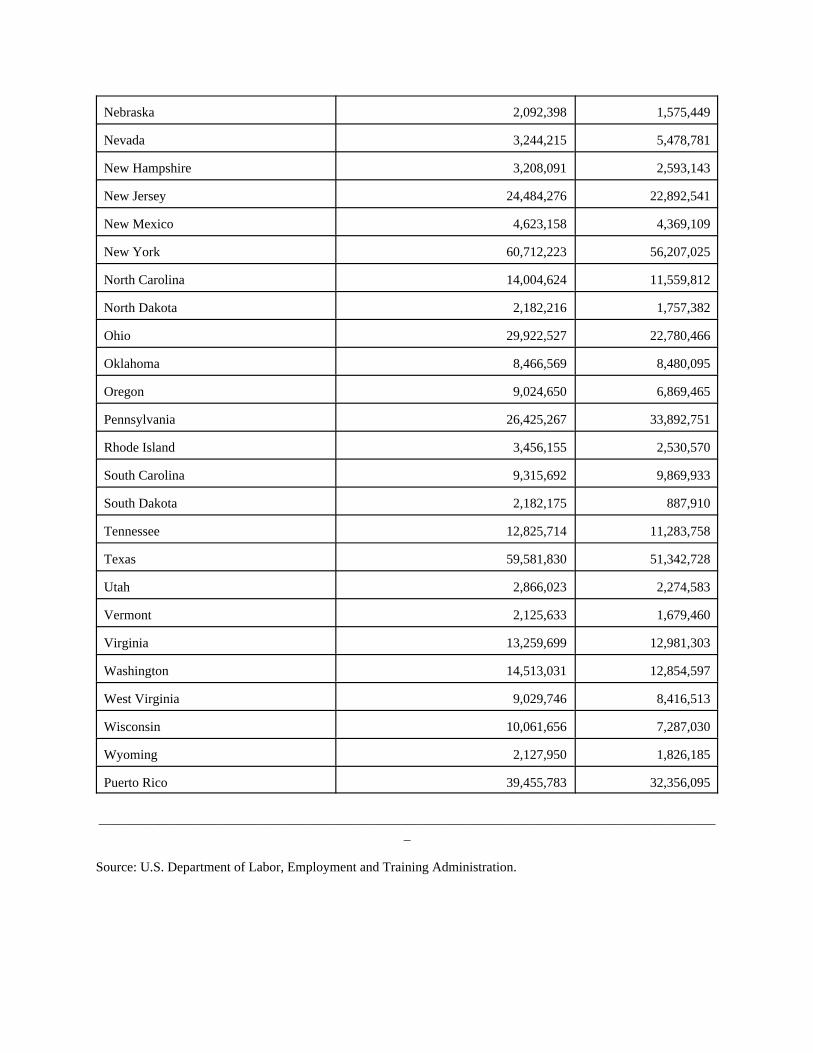
Nebraska 2,092,398 1,575,449
Nevada 3,244,215 5,478,781
New Hampshire 3,208,091 2,593,143
New Jersey 24,484,276 22,892,541
New Mexico 4,623,158 4,369,109
New York 60,712,223 56,207,025
North Carolina 14,004,624 11,559,812
North Dakota 2,182,216 1,757,382
Ohio 29,922,527 22,780,466
Oklahoma 8,466,569 8,480,095
Oregon 9,024,650 6,869,465
Pennsylvania 26,425,267 33,892,751
Rhode Island 3,456,155 2,530,570
South Carolina 9,315,692 9,869,933
South Dakota 2,182,175 887,910
Tennessee 12,825,714 11,283,758
Texas 59,581,830 51,342,728
Utah 2,866,023 2,274,583
Vermont 2,125,633 1,679,460
Virginia 13,259,699 12,981,303
Washington 14,513,031 12,854,597
West Virginia 9,029,746 8,416,513
Wisconsin 10,061,656 7,287,030
Wyoming 2,127,950 1,826,185
Puerto Rico 39,455,783 32,356,095
_____________________________________________________________________________________________
Source: U.S. Department of Labor, Employment and Training Administration.
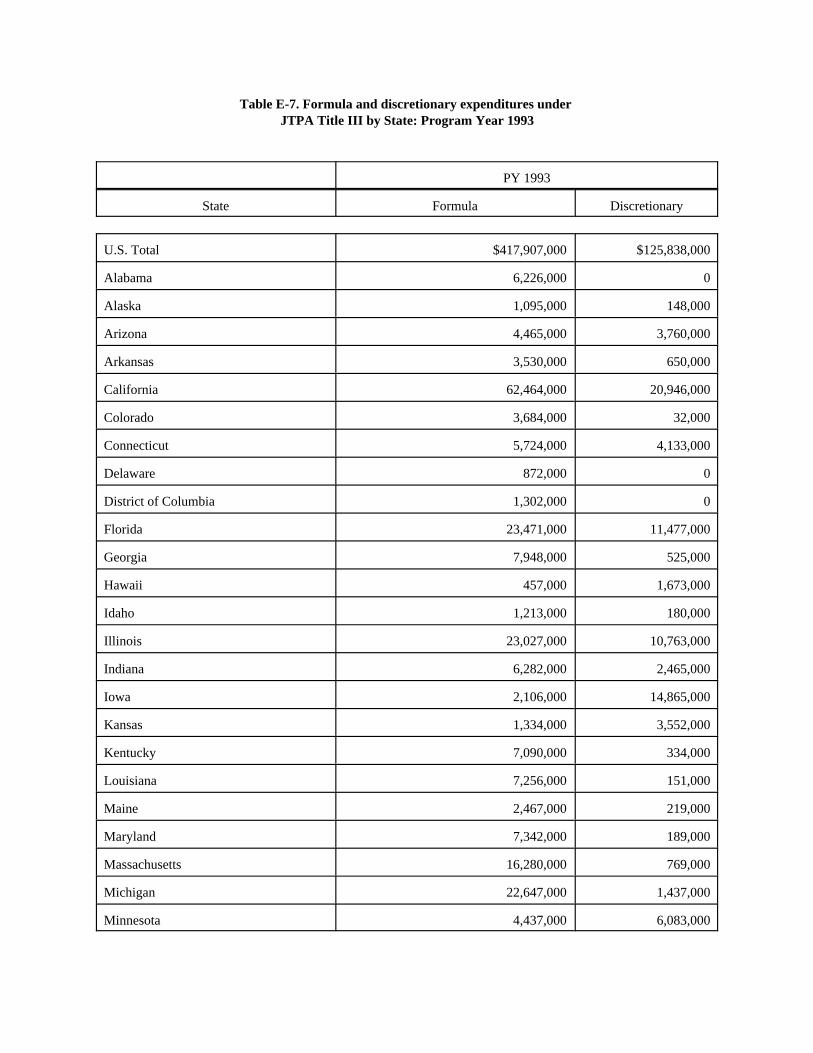
Table E-7. Formula and discretionary expenditures under JTPA Title III by State: Program Year 1993
PY 1993
State Formula Discretionary
U.S. Total $417,907,000 $125,838,000
Alabama 6,226,000 0
Alaska 1,095,000 148,000
Arizona 4,465,000 3,760,000
Arkansas 3,530,000 650,000
California 62,464,000 20,946,000
Colorado 3,684,000 32,000
Connecticut 5,724,000 4,133,000
Delaware 872,000 0
District of Columbia 1,302,000 0
Florida 23,471,000 11,477,000
Georgia 7,948,000 525,000
Hawaii 457,000 1,673,000
Idaho 1,213,000 180,000
Illinois 23,027,000 10,763,000
Indiana 6,282,000 2,465,000
Iowa 2,106,000 14,865,000
Kansas 1,334,000 3,552,000
Kentucky 7,090,000 334,000
Louisiana 7,256,000 151,000
Maine 2,467,000 219,000
Maryland 7,342,000 189,000
Massachusetts 16,280,000 769,000
Michigan 22,647,000 1,437,000
Minnesota 4,437,000 6,083,000
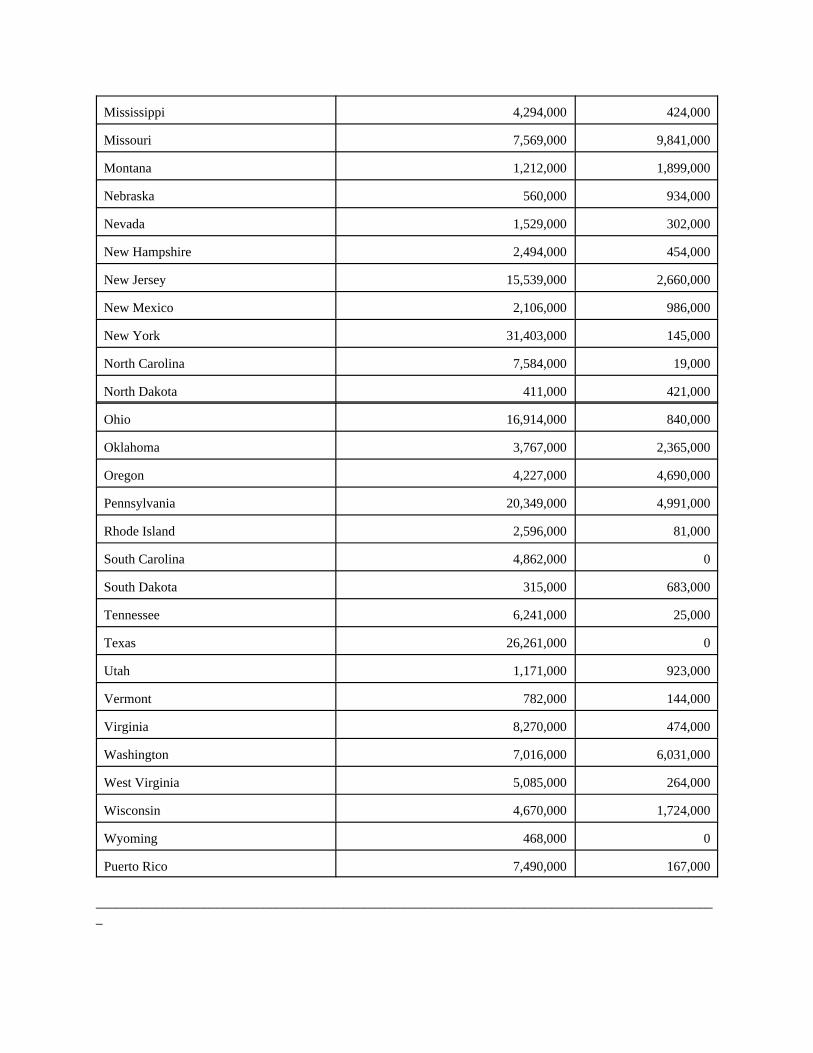
Mississippi 4,294,000 424,000
Missouri 7,569,000 9,841,000
Montana 1,212,000 1,899,000
Nebraska 560,000 934,000
Nevada 1,529,000 302,000
New Hampshire 2,494,000 454,000
New Jersey 15,539,000 2,660,000
New Mexico 2,106,000 986,000
New York 31,403,000 145,000
North Carolina 7,584,000 19,000
North Dakota 411,000 421,000
Ohio 16,914,000 840,000
Oklahoma 3,767,000 2,365,000
Oregon 4,227,000 4,690,000
Pennsylvania 20,349,000 4,991,000
Rhode Island 2,596,000 81,000
South Carolina 4,862,000 0
South Dakota 315,000 683,000
Tennessee 6,241,000 25,000
Texas 26,261,000 0
Utah 1,171,000 923,000
Vermont 782,000 144,000
Virginia 8,270,000 474,000
Washington 7,016,000 6,031,000
West Virginia 5,085,000 264,000
Wisconsin 4,670,000 1,724,000
Wyoming 468,000 0
Puerto Rico 7,490,000 167,000
_____________________________________________________________________________________________

Source: U.S. Department of Labor, Employment and Training Administration.
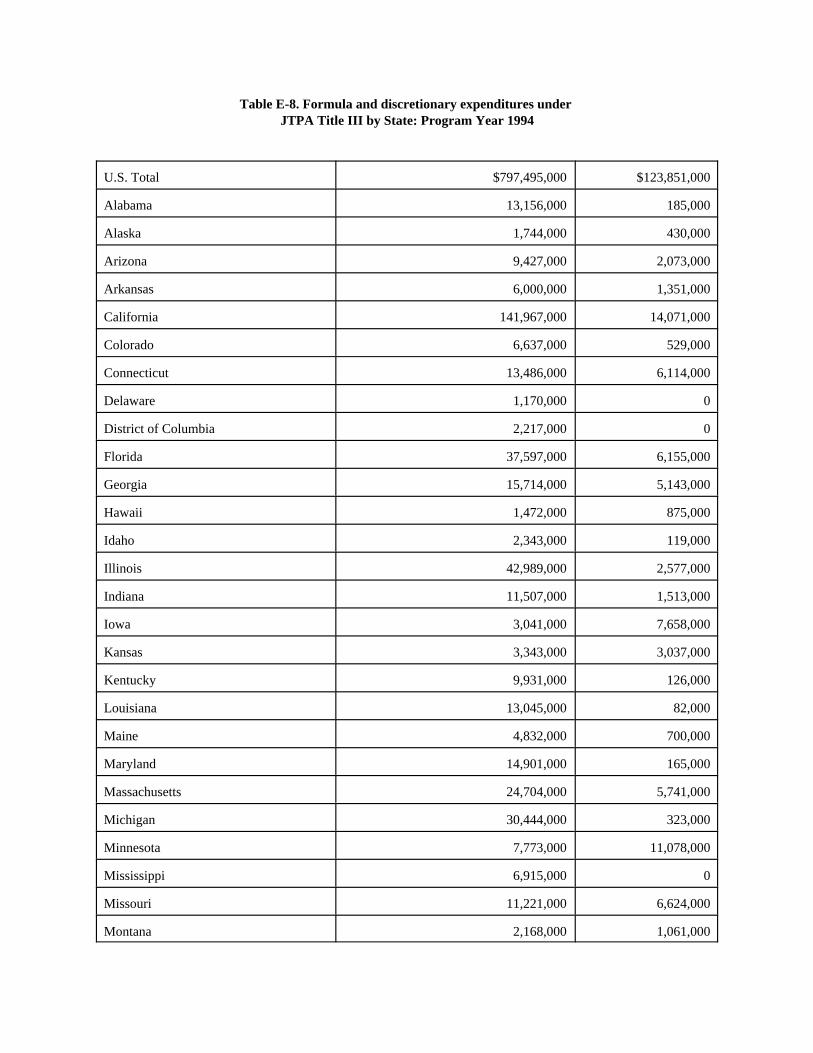
Table E-8. Formula and discretionary expenditures under JTPA Title III by State: Program Year 1994
U.S. Total $797,495,000 $123,851,000
Alabama 13,156,000 185,000
Alaska 1,744,000 430,000
Arizona 9,427,000 2,073,000
Arkansas 6,000,000 1,351,000
California 141,967,000 14,071,000
Colorado 6,637,000 529,000
Connecticut 13,486,000 6,114,000
Delaware 1,170,000 0
District of Columbia 2,217,000 0
Florida 37,597,000 6,155,000
Georgia 15,714,000 5,143,000
Hawaii 1,472,000 875,000
Idaho 2,343,000 119,000
Illinois 42,989,000 2,577,000
Indiana 11,507,000 1,513,000
Iowa 3,041,000 7,658,000
Kansas 3,343,000 3,037,000
Kentucky 9,931,000 126,000
Louisiana 13,045,000 82,000
Maine 4,832,000 700,000
Maryland 14,901,000 165,000
Massachusetts 24,704,000 5,741,000
Michigan 30,444,000 323,000
Minnesota 7,773,000 11,078,000
Mississippi 6,915,000 0
Missouri 11,221,000 6,624,000
Montana 2,168,000 1,061,000
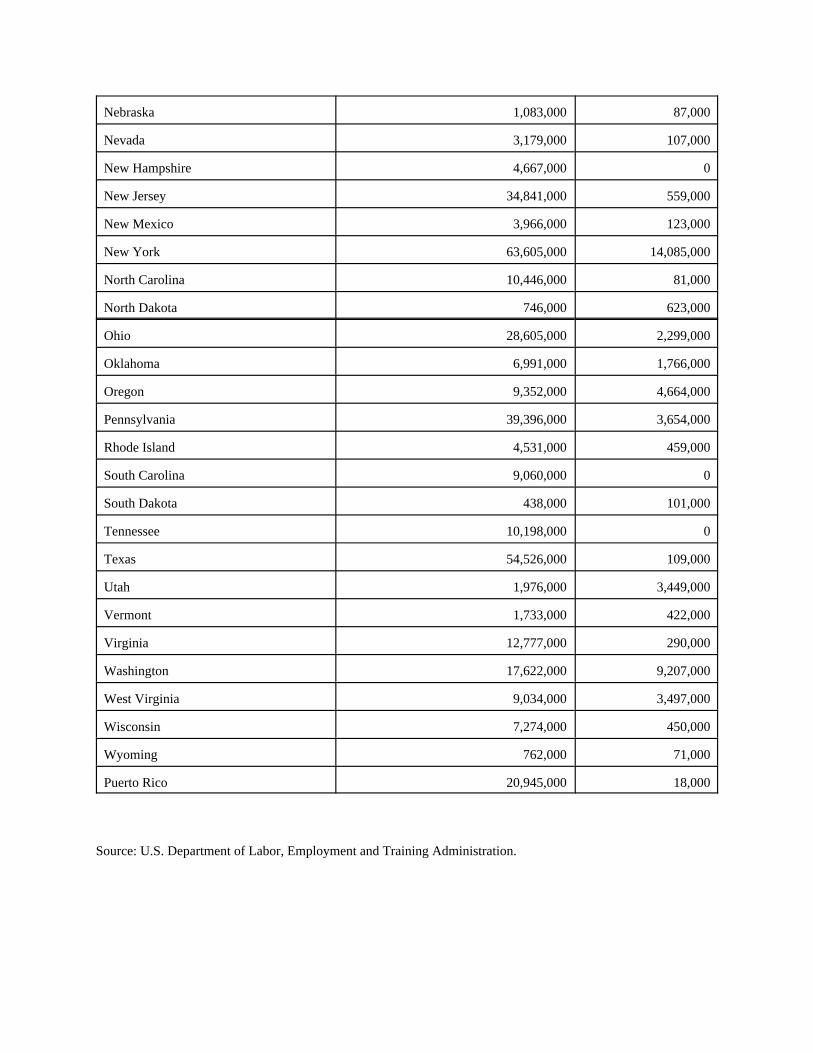
Nebraska 1,083,000 87,000
Nevada 3,179,000 107,000
New Hampshire 4,667,000 0
New Jersey 34,841,000 559,000
New Mexico 3,966,000 123,000
New York 63,605,000 14,085,000
North Carolina 10,446,000 81,000
North Dakota 746,000 623,000
Ohio 28,605,000 2,299,000
Oklahoma 6,991,000 1,766,000
Oregon 9,352,000 4,664,000
Pennsylvania 39,396,000 3,654,000
Rhode Island 4,531,000 459,000
South Carolina 9,060,000 0
South Dakota 438,000 101,000
Tennessee 10,198,000 0
Texas 54,526,000 109,000
Utah 1,976,000 3,449,000
Vermont 1,733,000 422,000
Virginia 12,777,000 290,000
Washington 17,622,000 9,207,000
West Virginia 9,034,000 3,497,000
Wisconsin 7,274,000 450,000
Wyoming 762,000 71,000
Puerto Rico 20,945,000 18,000
Source: U.S. Department of Labor, Employment and Training Administration.
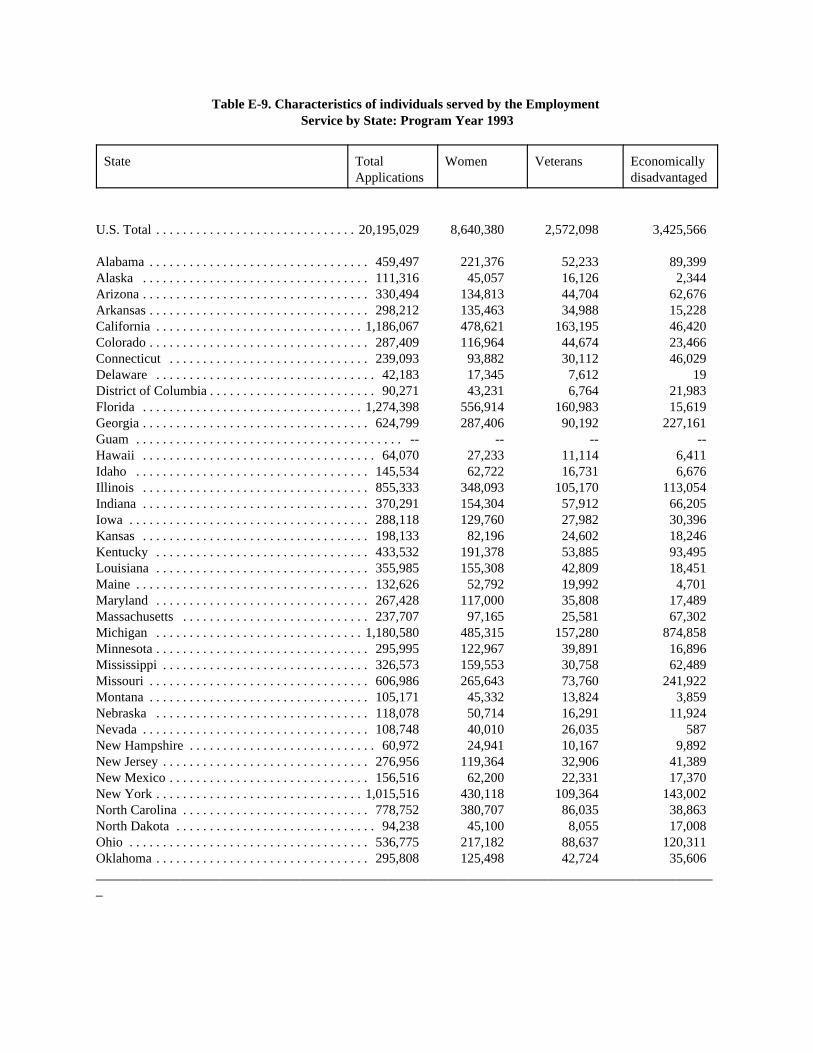
Table E-9. Characteristics of individuals served by the Employment Service by State: Program Year 1993
State TotalApplications
Women Veterans Economicallydisadvantaged
U.S. Total . . . . . . . . . . . . . . . . . . . . . . . . . . . . . . 20,195,029 8,640,380 2,572,098 3,425,566
Alabama . . . . . . . . . . . . . . . . . . . . . . . . . . . . . . . . . 459,497 221,376 52,233 89,399Alaska . . . . . . . . . . . . . . . . . . . . . . . . . . . . . . . . . . 111,316 45,057 16,126 2,344Arizona . . . . . . . . . . . . . . . . . . . . . . . . . . . . . . . . . . 330,494 134,813 44,704 62,676Arkansas . . . . . . . . . . . . . . . . . . . . . . . . . . . . . . . . . 298,212 135,463 34,988 15,228California . . . . . . . . . . . . . . . . . . . . . . . . . . . . . . . 1,186,067 478,621 163,195 46,420Colorado . . . . . . . . . . . . . . . . . . . . . . . . . . . . . . . . . 287,409 116,964 44,674 23,466Connecticut . . . . . . . . . . . . . . . . . . . . . . . . . . . . . . 239,093 93,882 30,112 46,029Delaware . . . . . . . . . . . . . . . . . . . . . . . . . . . . . . . . . 42,183 17,345 7,612 19District of Columbia . . . . . . . . . . . . . . . . . . . . . . . . . 90,271 43,231 6,764 21,983Florida . . . . . . . . . . . . . . . . . . . . . . . . . . . . . . . . . 1,274,398 556,914 160,983 15,619Georgia . . . . . . . . . . . . . . . . . . . . . . . . . . . . . . . . . . 624,799 287,406 90,192 227,161Guam . . . . . . . . . . . . . . . . . . . . . . . . . . . . . . . . . . . . . . . . -- -- -- --Hawaii . . . . . . . . . . . . . . . . . . . . . . . . . . . . . . . . . . . 64,070 27,233 11,114 6,411Idaho . . . . . . . . . . . . . . . . . . . . . . . . . . . . . . . . . . . 145,534 62,722 16,731 6,676Illinois . . . . . . . . . . . . . . . . . . . . . . . . . . . . . . . . . . 855,333 348,093 105,170 113,054Indiana . . . . . . . . . . . . . . . . . . . . . . . . . . . . . . . . . . 370,291 154,304 57,912 66,205Iowa . . . . . . . . . . . . . . . . . . . . . . . . . . . . . . . . . . . . 288,118 129,760 27,982 30,396Kansas . . . . . . . . . . . . . . . . . . . . . . . . . . . . . . . . . . 198,133 82,196 24,602 18,246Kentucky . . . . . . . . . . . . . . . . . . . . . . . . . . . . . . . . 433,532 191,378 53,885 93,495Louisiana . . . . . . . . . . . . . . . . . . . . . . . . . . . . . . . . 355,985 155,308 42,809 18,451Maine . . . . . . . . . . . . . . . . . . . . . . . . . . . . . . . . . . . 132,626 52,792 19,992 4,701Maryland . . . . . . . . . . . . . . . . . . . . . . . . . . . . . . . . 267,428 117,000 35,808 17,489Massachusetts . . . . . . . . . . . . . . . . . . . . . . . . . . . . 237,707 97,165 25,581 67,302Michigan . . . . . . . . . . . . . . . . . . . . . . . . . . . . . . . 1,180,580 485,315 157,280 874,858Minnesota . . . . . . . . . . . . . . . . . . . . . . . . . . . . . . . . 295,995 122,967 39,891 16,896Mississippi . . . . . . . . . . . . . . . . . . . . . . . . . . . . . . . 326,573 159,553 30,758 62,489Missouri . . . . . . . . . . . . . . . . . . . . . . . . . . . . . . . . . 606,986 265,643 73,760 241,922Montana . . . . . . . . . . . . . . . . . . . . . . . . . . . . . . . . . 105,171 45,332 13,824 3,859Nebraska . . . . . . . . . . . . . . . . . . . . . . . . . . . . . . . . 118,078 50,714 16,291 11,924Nevada . . . . . . . . . . . . . . . . . . . . . . . . . . . . . . . . . . 108,748 40,010 26,035 587New Hampshire . . . . . . . . . . . . . . . . . . . . . . . . . . . . 60,972 24,941 10,167 9,892New Jersey . . . . . . . . . . . . . . . . . . . . . . . . . . . . . . . 276,956 119,364 32,906 41,389New Mexico . . . . . . . . . . . . . . . . . . . . . . . . . . . . . . 156,516 62,200 22,331 17,370New York . . . . . . . . . . . . . . . . . . . . . . . . . . . . . . . 1,015,516 430,118 109,364 143,002North Carolina . . . . . . . . . . . . . . . . . . . . . . . . . . . . 778,752 380,707 86,035 38,863North Dakota . . . . . . . . . . . . . . . . . . . . . . . . . . . . . . 94,238 45,100 8,055 17,008Ohio . . . . . . . . . . . . . . . . . . . . . . . . . . . . . . . . . . . . 536,775 217,182 88,637 120,311Oklahoma . . . . . . . . . . . . . . . . . . . . . . . . . . . . . . . . 295,808 125,498 42,724 35,606_____________________________________________________________________________________________
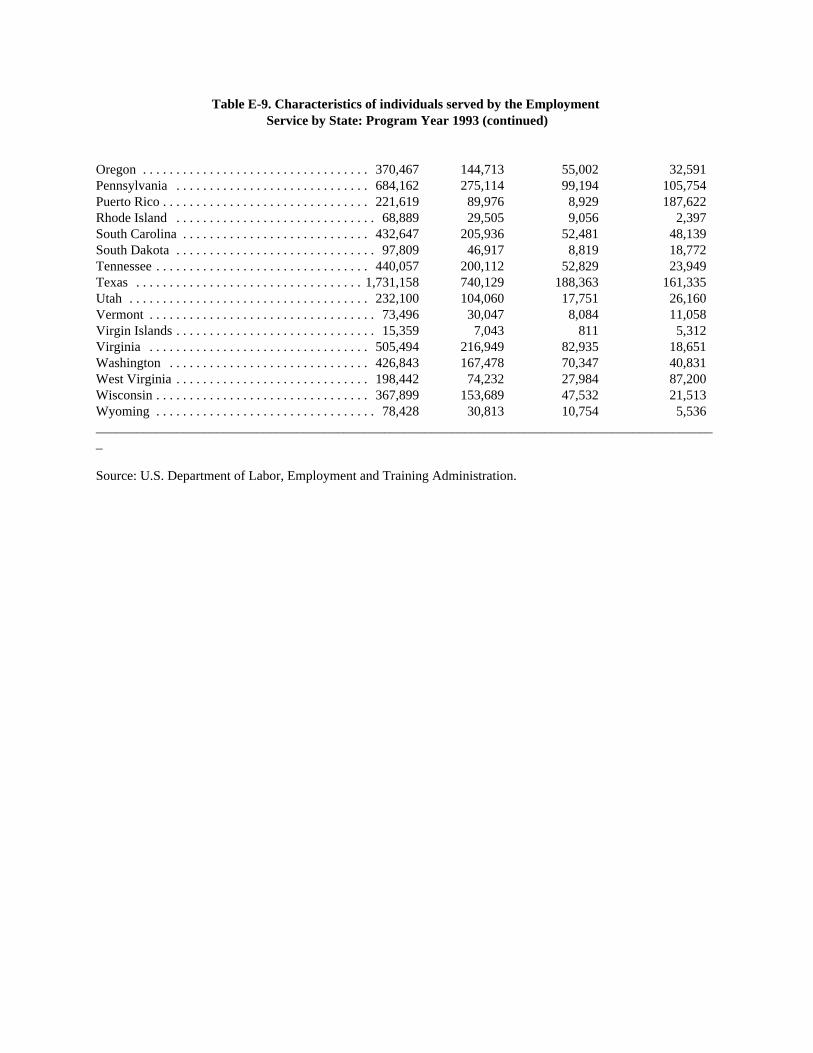
Table E-9. Characteristics of individuals served by the Employment Service by State: Program Year 1993 (continued)
Oregon . . . . . . . . . . . . . . . . . . . . . . . . . . . . . . . . . . 370,467 144,713 55,002 32,591Pennsylvania . . . . . . . . . . . . . . . . . . . . . . . . . . . . . 684,162 275,114 99,194 105,754Puerto Rico . . . . . . . . . . . . . . . . . . . . . . . . . . . . . . . 221,619 89,976 8,929 187,622Rhode Island . . . . . . . . . . . . . . . . . . . . . . . . . . . . . . 68,889 29,505 9,056 2,397South Carolina . . . . . . . . . . . . . . . . . . . . . . . . . . . . 432,647 205,936 52,481 48,139South Dakota . . . . . . . . . . . . . . . . . . . . . . . . . . . . . . 97,809 46,917 8,819 18,772Tennessee . . . . . . . . . . . . . . . . . . . . . . . . . . . . . . . . 440,057 200,112 52,829 23,949Texas . . . . . . . . . . . . . . . . . . . . . . . . . . . . . . . . . . 1,731,158 740,129 188,363 161,335Utah . . . . . . . . . . . . . . . . . . . . . . . . . . . . . . . . . . . . 232,100 104,060 17,751 26,160Vermont . . . . . . . . . . . . . . . . . . . . . . . . . . . . . . . . . . 73,496 30,047 8,084 11,058Virgin Islands . . . . . . . . . . . . . . . . . . . . . . . . . . . . . . 15,359 7,043 811 5,312Virginia . . . . . . . . . . . . . . . . . . . . . . . . . . . . . . . . . 505,494 216,949 82,935 18,651Washington . . . . . . . . . . . . . . . . . . . . . . . . . . . . . . 426,843 167,478 70,347 40,831West Virginia . . . . . . . . . . . . . . . . . . . . . . . . . . . . . 198,442 74,232 27,984 87,200Wisconsin . . . . . . . . . . . . . . . . . . . . . . . . . . . . . . . . 367,899 153,689 47,532 21,513Wyoming . . . . . . . . . . . . . . . . . . . . . . . . . . . . . . . . . 78,428 30,813 10,754 5,536_____________________________________________________________________________________________
Source: U.S. Department of Labor, Employment and Training Administration.

Table E-10. Characteristics of individuals served by the Employment Service by State: Program Year 1994
State TotalApplications
Women Veterans EconomicallyDisadvantaged
U.S. Total . . . . . . . . . . . . . . . . . . . . . . . . . . . . . . 18,809,907 8,234,914 2,299,155 2,943,696
Alabama . . . . . . . . . . . . . . . . . . . . . . . . . . . . . . . . . 453,380 222,254 49,322 76,405Alaska . . . . . . . . . . . . . . . . . . . . . . . . . . . . . . . . . . 102,013 41,161 14,182 1,324Arizona . . . . . . . . . . . . . . . . . . . . . . . . . . . . . . . . . . 293,244 123,949 37,737 47,983Arkansas . . . . . . . . . . . . . . . . . . . . . . . . . . . . . . . . . 275,574 127,211 31,362 10,963California . . . . . . . . . . . . . . . . . . . . . . . . . . . . . . . 1,041,640 435,464 137,842 169,718Colorado . . . . . . . . . . . . . . . . . . . . . . . . . . . . . . . . . 267,167 111,027 40,108 21,074Connecticut . . . . . . . . . . . . . . . . . . . . . . . . . . . . . . 206,388 84,571 23,754 40,400Delaware . . . . . . . . . . . . . . . . . . . . . . . . . . . . . . . . . 40,885 17,304 6,589 14District of Columbia . . . . . . . . . . . . . . . . . . . . . . . . . 80,733 39,587 6,014 19,715Florida . . . . . . . . . . . . . . . . . . . . . . . . . . . . . . . . . 1,247,309 551,023 155,055 10,983Georgia . . . . . . . . . . . . . . . . . . . . . . . . . . . . . . . . . . 601,469 282,747 86,317 219,588Guam . . . . . . . . . . . . . . . . . . . . . . . . . . . . . . . . . . . . . 4,571 1,709 232 3,035Hawaii . . . . . . . . . . . . . . . . . . . . . . . . . . . . . . . . . . . 69,443 29,895 11,295 6,970Idaho . . . . . . . . . . . . . . . . . . . . . . . . . . . . . . . . . . . 142,133 61,386 15,799 5,631Illinois . . . . . . . . . . . . . . . . . . . . . . . . . . . . . . . . . . 710,077 295,106 87,997 95,861Indiana . . . . . . . . . . . . . . . . . . . . . . . . . . . . . . . . . . 340,750 143,783 52,428 57,867Iowa . . . . . . . . . . . . . . . . . . . . . . . . . . . . . . . . . . . . 279,200 128,976 25,251 35,436Kansas . . . . . . . . . . . . . . . . . . . . . . . . . . . . . . . . . . 194,499 80,977 23,059 17,810Kentucky . . . . . . . . . . . . . . . . . . . . . . . . . . . . . . . . 428,314 189,447 50,387 70,229Louisiana . . . . . . . . . . . . . . . . . . . . . . . . . . . . . . . . 343,255 151,277 40,606 15,585Maine . . . . . . . . . . . . . . . . . . . . . . . . . . . . . . . . . . . 128,894 52,547 18,794 3,517Maryland . . . . . . . . . . . . . . . . . . . . . . . . . . . . . . . . 264,452 120,166 31,524 12,420Massachusetts . . . . . . . . . . . . . . . . . . . . . . . . . . . . 207,729 87,788 22,148 54,266Michigan . . . . . . . . . . . . . . . . . . . . . . . . . . . . . . . . 732,123 302,286 95,044 360,046Minnesota . . . . . . . . . . . . . . . . . . . . . . . . . . . . . . . . 265,448 113,015 35,357 13,815Mississippi . . . . . . . . . . . . . . . . . . . . . . . . . . . . . . . 310,318 154,292 26,739 57,948Missouri . . . . . . . . . . . . . . . . . . . . . . . . . . . . . . . . . 654,206 291,690 71,493 244,239Montana . . . . . . . . . . . . . . . . . . . . . . . . . . . . . . . . . 105,862 46,317 13,375 3,819Nebraska . . . . . . . . . . . . . . . . . . . . . . . . . . . . . . . . 114,423 48,946 15,393 9,270Nevada . . . . . . . . . . . . . . . . . . . . . . . . . . . . . . . . . . . 93,126 34,821 20,508 790New Hampshire . . . . . . . . . . . . . . . . . . . . . . . . . . . . 52,205 21,968 8,535 7,005New Jersey . . . . . . . . . . . . . . . . . . . . . . . . . . . . . . . 279,084 124,552 29,951 42,050New Mexico . . . . . . . . . . . . . . . . . . . . . . . . . . . . . . 150,002 60,416 20,420 13,024New York . . . . . . . . . . . . . . . . . . . . . . . . . . . . . . . . 874,234 380,513 95,848 113,781North Carolina . . . . . . . . . . . . . . . . . . . . . . . . . . . . 780,905 388,854 83,063 49,145North Dakota . . . . . . . . . . . . . . . . . . . . . . . . . . . . . . 86,870 42,092 7,303 13,252Ohio . . . . . . . . . . . . . . . . . . . . . . . . . . . . . . . . . . . . 570,429 235,857 88,963 230,794Oklahoma . . . . . . . . . . . . . . . . . . . . . . . . . . . . . . . . 278,031 121,137 39,226 30,527Oregon . . . . . . . . . . . . . . . . . . . . . . . . . . . . . . . . . . 361,467 145,197 48,656 40,846Pennsylvania . . . . . . . . . . . . . . . . . . . . . . . . . . . . . 640,876 266,010 88,475 96,336Puerto Rico . . . . . . . . . . . . . . . . . . . . . . . . . . . . . . . 232,687 99,254 8,281 197,048Rhode Island . . . . . . . . . . . . . . . . . . . . . . . . . . . . . . 60,965 26,718 8,188 1,798South Carolina . . . . . . . . . . . . . . . . . . . . . . . . . . . . 427,779 207,015 49,702 45,954
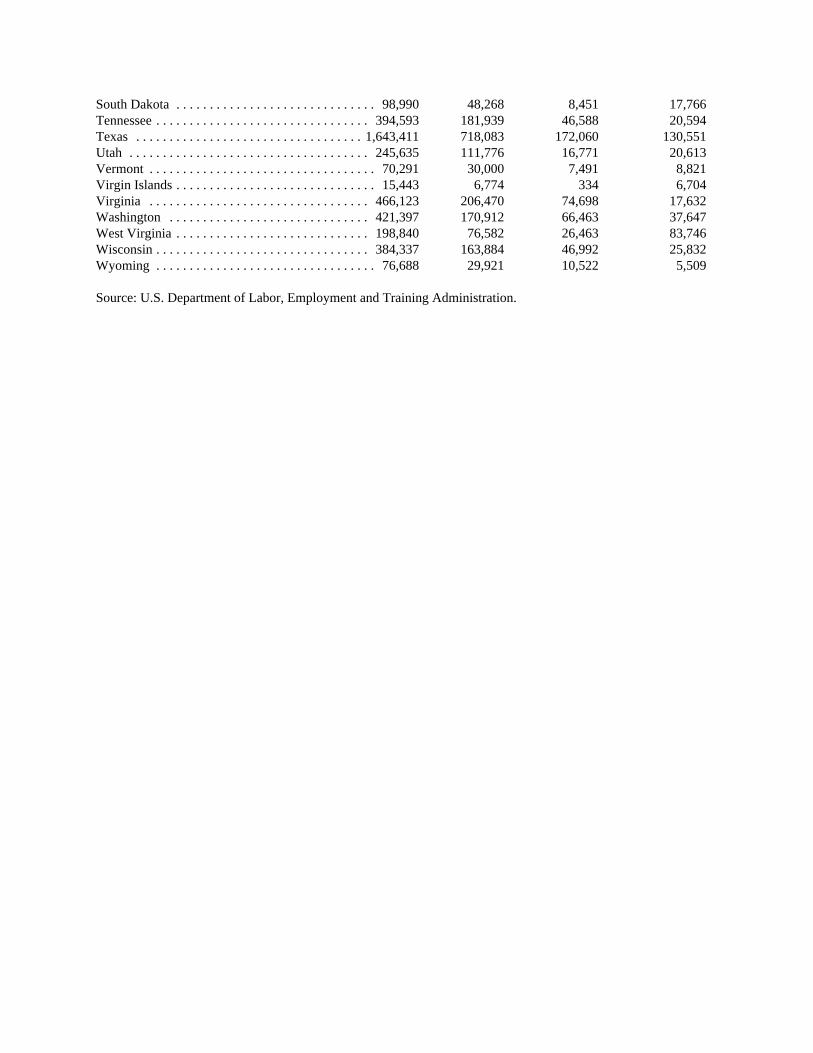
South Dakota . . . . . . . . . . . . . . . . . . . . . . . . . . . . . . 98,990 48,268 8,451 17,766Tennessee . . . . . . . . . . . . . . . . . . . . . . . . . . . . . . . . 394,593 181,939 46,588 20,594Texas . . . . . . . . . . . . . . . . . . . . . . . . . . . . . . . . . . 1,643,411 718,083 172,060 130,551Utah . . . . . . . . . . . . . . . . . . . . . . . . . . . . . . . . . . . . 245,635 111,776 16,771 20,613Vermont . . . . . . . . . . . . . . . . . . . . . . . . . . . . . . . . . . 70,291 30,000 7,491 8,821Virgin Islands . . . . . . . . . . . . . . . . . . . . . . . . . . . . . . 15,443 6,774 334 6,704Virginia . . . . . . . . . . . . . . . . . . . . . . . . . . . . . . . . . 466,123 206,470 74,698 17,632Washington . . . . . . . . . . . . . . . . . . . . . . . . . . . . . . 421,397 170,912 66,463 37,647West Virginia . . . . . . . . . . . . . . . . . . . . . . . . . . . . . 198,840 76,582 26,463 83,746Wisconsin . . . . . . . . . . . . . . . . . . . . . . . . . . . . . . . . 384,337 163,884 46,992 25,832Wyoming . . . . . . . . . . . . . . . . . . . . . . . . . . . . . . . . . 76,688 29,921 10,522 5,509
Source: U.S. Department of Labor, Employment and Training Administration.
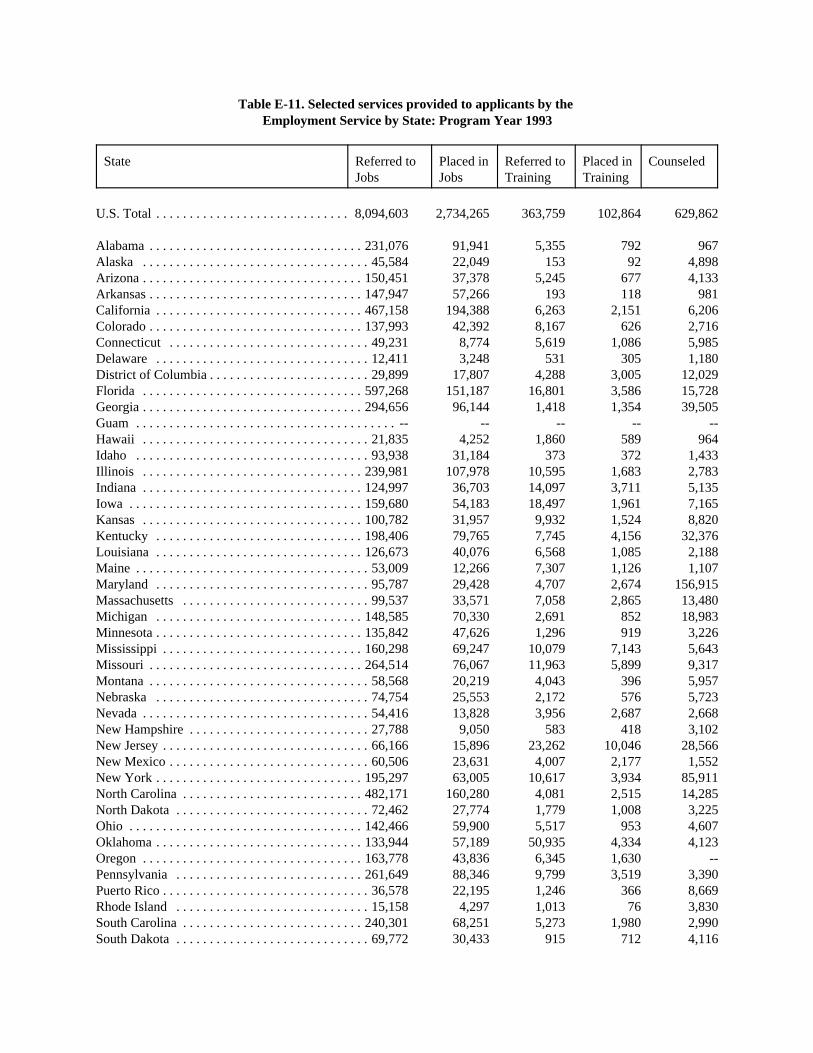
Table E-11. Selected services provided to applicants by the Employment Service by State: Program Year 1993
State Referred toJobs
Placed inJobs
Referred toTraining
Placed inTraining
Counseled
U.S. Total . . . . . . . . . . . . . . . . . . . . . . . . . . . . . 8,094,603 2,734,265 363,759 102,864 629,862
Alabama . . . . . . . . . . . . . . . . . . . . . . . . . . . . . . . . 231,076 91,941 5,355 792 967Alaska . . . . . . . . . . . . . . . . . . . . . . . . . . . . . . . . . . 45,584 22,049 153 92 4,898Arizona . . . . . . . . . . . . . . . . . . . . . . . . . . . . . . . . . 150,451 37,378 5,245 677 4,133Arkansas . . . . . . . . . . . . . . . . . . . . . . . . . . . . . . . . 147,947 57,266 193 118 981California . . . . . . . . . . . . . . . . . . . . . . . . . . . . . . . 467,158 194,388 6,263 2,151 6,206Colorado . . . . . . . . . . . . . . . . . . . . . . . . . . . . . . . . 137,993 42,392 8,167 626 2,716Connecticut . . . . . . . . . . . . . . . . . . . . . . . . . . . . . . 49,231 8,774 5,619 1,086 5,985Delaware . . . . . . . . . . . . . . . . . . . . . . . . . . . . . . . . 12,411 3,248 531 305 1,180District of Columbia . . . . . . . . . . . . . . . . . . . . . . . . 29,899 17,807 4,288 3,005 12,029Florida . . . . . . . . . . . . . . . . . . . . . . . . . . . . . . . . . 597,268 151,187 16,801 3,586 15,728Georgia . . . . . . . . . . . . . . . . . . . . . . . . . . . . . . . . . 294,656 96,144 1,418 1,354 39,505Guam . . . . . . . . . . . . . . . . . . . . . . . . . . . . . . . . . . . . . . . -- -- -- -- --Hawaii . . . . . . . . . . . . . . . . . . . . . . . . . . . . . . . . . . 21,835 4,252 1,860 589 964Idaho . . . . . . . . . . . . . . . . . . . . . . . . . . . . . . . . . . . 93,938 31,184 373 372 1,433Illinois . . . . . . . . . . . . . . . . . . . . . . . . . . . . . . . . . 239,981 107,978 10,595 1,683 2,783Indiana . . . . . . . . . . . . . . . . . . . . . . . . . . . . . . . . . 124,997 36,703 14,097 3,711 5,135Iowa . . . . . . . . . . . . . . . . . . . . . . . . . . . . . . . . . . . 159,680 54,183 18,497 1,961 7,165Kansas . . . . . . . . . . . . . . . . . . . . . . . . . . . . . . . . . 100,782 31,957 9,932 1,524 8,820Kentucky . . . . . . . . . . . . . . . . . . . . . . . . . . . . . . . 198,406 79,765 7,745 4,156 32,376Louisiana . . . . . . . . . . . . . . . . . . . . . . . . . . . . . . . 126,673 40,076 6,568 1,085 2,188Maine . . . . . . . . . . . . . . . . . . . . . . . . . . . . . . . . . . . 53,009 12,266 7,307 1,126 1,107Maryland . . . . . . . . . . . . . . . . . . . . . . . . . . . . . . . . 95,787 29,428 4,707 2,674 156,915Massachusetts . . . . . . . . . . . . . . . . . . . . . . . . . . . . 99,537 33,571 7,058 2,865 13,480Michigan . . . . . . . . . . . . . . . . . . . . . . . . . . . . . . . 148,585 70,330 2,691 852 18,983Minnesota . . . . . . . . . . . . . . . . . . . . . . . . . . . . . . . 135,842 47,626 1,296 919 3,226Mississippi . . . . . . . . . . . . . . . . . . . . . . . . . . . . . . 160,298 69,247 10,079 7,143 5,643Missouri . . . . . . . . . . . . . . . . . . . . . . . . . . . . . . . . 264,514 76,067 11,963 5,899 9,317Montana . . . . . . . . . . . . . . . . . . . . . . . . . . . . . . . . . 58,568 20,219 4,043 396 5,957Nebraska . . . . . . . . . . . . . . . . . . . . . . . . . . . . . . . . 74,754 25,553 2,172 576 5,723Nevada . . . . . . . . . . . . . . . . . . . . . . . . . . . . . . . . . . 54,416 13,828 3,956 2,687 2,668New Hampshire . . . . . . . . . . . . . . . . . . . . . . . . . . . 27,788 9,050 583 418 3,102New Jersey . . . . . . . . . . . . . . . . . . . . . . . . . . . . . . . 66,166 15,896 23,262 10,046 28,566New Mexico . . . . . . . . . . . . . . . . . . . . . . . . . . . . . . 60,506 23,631 4,007 2,177 1,552New York . . . . . . . . . . . . . . . . . . . . . . . . . . . . . . . 195,297 63,005 10,617 3,934 85,911North Carolina . . . . . . . . . . . . . . . . . . . . . . . . . . . 482,171 160,280 4,081 2,515 14,285North Dakota . . . . . . . . . . . . . . . . . . . . . . . . . . . . . 72,462 27,774 1,779 1,008 3,225Ohio . . . . . . . . . . . . . . . . . . . . . . . . . . . . . . . . . . . 142,466 59,900 5,517 953 4,607Oklahoma . . . . . . . . . . . . . . . . . . . . . . . . . . . . . . . 133,944 57,189 50,935 4,334 4,123Oregon . . . . . . . . . . . . . . . . . . . . . . . . . . . . . . . . . 163,778 43,836 6,345 1,630 --Pennsylvania . . . . . . . . . . . . . . . . . . . . . . . . . . . . 261,649 88,346 9,799 3,519 3,390Puerto Rico . . . . . . . . . . . . . . . . . . . . . . . . . . . . . . . 36,578 22,195 1,246 366 8,669Rhode Island . . . . . . . . . . . . . . . . . . . . . . . . . . . . . 15,158 4,297 1,013 76 3,830South Carolina . . . . . . . . . . . . . . . . . . . . . . . . . . . 240,301 68,251 5,273 1,980 2,990South Dakota . . . . . . . . . . . . . . . . . . . . . . . . . . . . . 69,772 30,433 915 712 4,116

Tennessee . . . . . . . . . . . . . . . . . . . . . . . . . . . . . . . 189,289 60,647 3,504 1,250 737Texas . . . . . . . . . . . . . . . . . . . . . . . . . . . . . . . . . . 734,000 261,226 17,121 5,327 43,549Utah . . . . . . . . . . . . . . . . . . . . . . . . . . . . . . . . . . . 154,095 55,638 302 284 11,336Vermont . . . . . . . . . . . . . . . . . . . . . . . . . . . . . . . . . 28,009 8,260 287 19 1,606Virgin Islands . . . . . . . . . . . . . . . . . . . . . . . . . . . . . . 3,502 1,562 1,125 211 743Virginia . . . . . . . . . . . . . . . . . . . . . . . . . . . . . . . . 189,338 46,520 1,078 636 1,981Washington . . . . . . . . . . . . . . . . . . . . . . . . . . . . . 175,344 51,014 26,186 2,456 12,350West Virginia . . . . . . . . . . . . . . . . . . . . . . . . . . . . . 77,032 21,700 5,902 3,656 4,186Wisconsin . . . . . . . . . . . . . . . . . . . . . . . . . . . . . . . 152,099 30,717 2,334 410 5,177Wyoming . . . . . . . . . . . . . . . . . . . . . . . . . . . . . . . . 48,583 16,091 1,576 937 1,620
Source: U.S. Department of Labor, Employment and Training Administration.
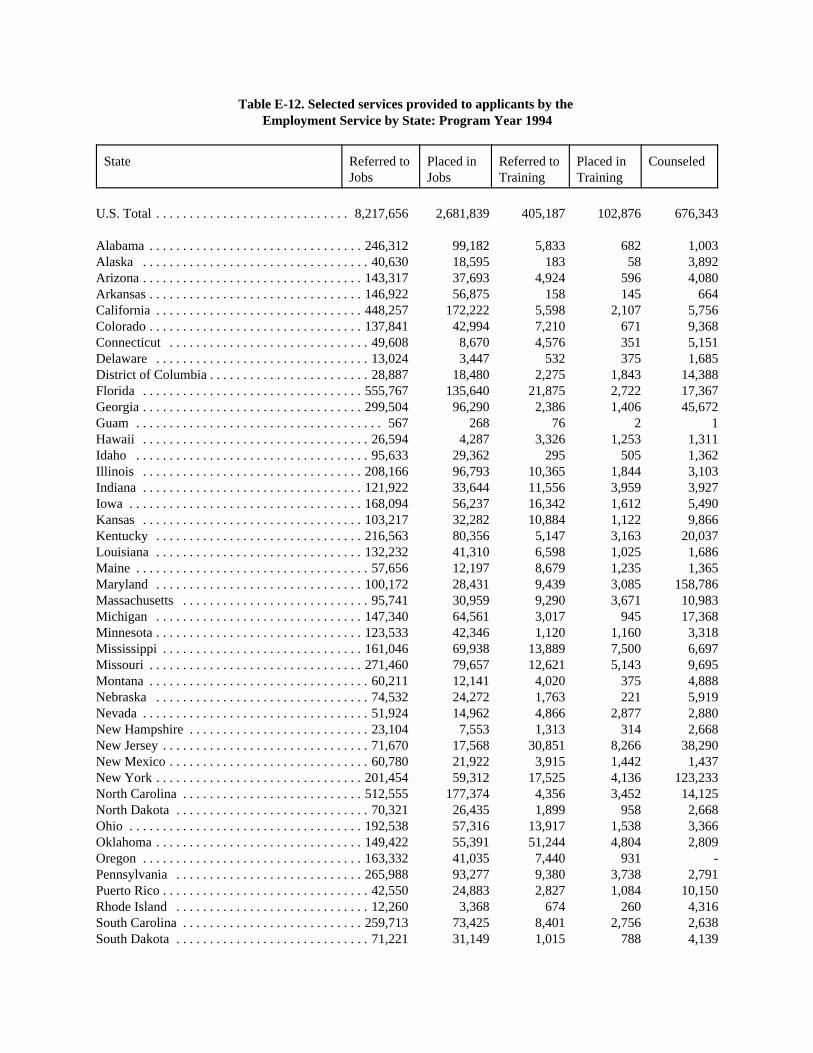
Table E-12. Selected services provided to applicants by the Employment Service by State: Program Year 1994
State Referred toJobs
Placed inJobs
Referred toTraining
Placed inTraining
Counseled
U.S. Total . . . . . . . . . . . . . . . . . . . . . . . . . . . . . 8,217,656 2,681,839 405,187 102,876 676,343
Alabama . . . . . . . . . . . . . . . . . . . . . . . . . . . . . . . . 246,312 99,182 5,833 682 1,003Alaska . . . . . . . . . . . . . . . . . . . . . . . . . . . . . . . . . . 40,630 18,595 183 58 3,892Arizona . . . . . . . . . . . . . . . . . . . . . . . . . . . . . . . . . 143,317 37,693 4,924 596 4,080Arkansas . . . . . . . . . . . . . . . . . . . . . . . . . . . . . . . . 146,922 56,875 158 145 664California . . . . . . . . . . . . . . . . . . . . . . . . . . . . . . . 448,257 172,222 5,598 2,107 5,756Colorado . . . . . . . . . . . . . . . . . . . . . . . . . . . . . . . . 137,841 42,994 7,210 671 9,368Connecticut . . . . . . . . . . . . . . . . . . . . . . . . . . . . . . 49,608 8,670 4,576 351 5,151Delaware . . . . . . . . . . . . . . . . . . . . . . . . . . . . . . . . 13,024 3,447 532 375 1,685District of Columbia . . . . . . . . . . . . . . . . . . . . . . . . 28,887 18,480 2,275 1,843 14,388Florida . . . . . . . . . . . . . . . . . . . . . . . . . . . . . . . . . 555,767 135,640 21,875 2,722 17,367Georgia . . . . . . . . . . . . . . . . . . . . . . . . . . . . . . . . . 299,504 96,290 2,386 1,406 45,672Guam . . . . . . . . . . . . . . . . . . . . . . . . . . . . . . . . . . . . . 567 268 76 2 1Hawaii . . . . . . . . . . . . . . . . . . . . . . . . . . . . . . . . . . 26,594 4,287 3,326 1,253 1,311Idaho . . . . . . . . . . . . . . . . . . . . . . . . . . . . . . . . . . . 95,633 29,362 295 505 1,362Illinois . . . . . . . . . . . . . . . . . . . . . . . . . . . . . . . . . 208,166 96,793 10,365 1,844 3,103Indiana . . . . . . . . . . . . . . . . . . . . . . . . . . . . . . . . . 121,922 33,644 11,556 3,959 3,927Iowa . . . . . . . . . . . . . . . . . . . . . . . . . . . . . . . . . . . 168,094 56,237 16,342 1,612 5,490Kansas . . . . . . . . . . . . . . . . . . . . . . . . . . . . . . . . . 103,217 32,282 10,884 1,122 9,866Kentucky . . . . . . . . . . . . . . . . . . . . . . . . . . . . . . . 216,563 80,356 5,147 3,163 20,037Louisiana . . . . . . . . . . . . . . . . . . . . . . . . . . . . . . . 132,232 41,310 6,598 1,025 1,686Maine . . . . . . . . . . . . . . . . . . . . . . . . . . . . . . . . . . . 57,656 12,197 8,679 1,235 1,365Maryland . . . . . . . . . . . . . . . . . . . . . . . . . . . . . . . 100,172 28,431 9,439 3,085 158,786Massachusetts . . . . . . . . . . . . . . . . . . . . . . . . . . . . 95,741 30,959 9,290 3,671 10,983Michigan . . . . . . . . . . . . . . . . . . . . . . . . . . . . . . . 147,340 64,561 3,017 945 17,368Minnesota . . . . . . . . . . . . . . . . . . . . . . . . . . . . . . . 123,533 42,346 1,120 1,160 3,318Mississippi . . . . . . . . . . . . . . . . . . . . . . . . . . . . . . 161,046 69,938 13,889 7,500 6,697Missouri . . . . . . . . . . . . . . . . . . . . . . . . . . . . . . . . 271,460 79,657 12,621 5,143 9,695Montana . . . . . . . . . . . . . . . . . . . . . . . . . . . . . . . . . 60,211 12,141 4,020 375 4,888Nebraska . . . . . . . . . . . . . . . . . . . . . . . . . . . . . . . . 74,532 24,272 1,763 221 5,919Nevada . . . . . . . . . . . . . . . . . . . . . . . . . . . . . . . . . . 51,924 14,962 4,866 2,877 2,880New Hampshire . . . . . . . . . . . . . . . . . . . . . . . . . . . 23,104 7,553 1,313 314 2,668New Jersey . . . . . . . . . . . . . . . . . . . . . . . . . . . . . . . 71,670 17,568 30,851 8,266 38,290New Mexico . . . . . . . . . . . . . . . . . . . . . . . . . . . . . . 60,780 21,922 3,915 1,442 1,437New York . . . . . . . . . . . . . . . . . . . . . . . . . . . . . . . 201,454 59,312 17,525 4,136 123,233North Carolina . . . . . . . . . . . . . . . . . . . . . . . . . . . 512,555 177,374 4,356 3,452 14,125North Dakota . . . . . . . . . . . . . . . . . . . . . . . . . . . . . 70,321 26,435 1,899 958 2,668Ohio . . . . . . . . . . . . . . . . . . . . . . . . . . . . . . . . . . . 192,538 57,316 13,917 1,538 3,366Oklahoma . . . . . . . . . . . . . . . . . . . . . . . . . . . . . . . 149,422 55,391 51,244 4,804 2,809Oregon . . . . . . . . . . . . . . . . . . . . . . . . . . . . . . . . . 163,332 41,035 7,440 931 -Pennsylvania . . . . . . . . . . . . . . . . . . . . . . . . . . . . 265,988 93,277 9,380 3,738 2,791Puerto Rico . . . . . . . . . . . . . . . . . . . . . . . . . . . . . . . 42,550 24,883 2,827 1,084 10,150Rhode Island . . . . . . . . . . . . . . . . . . . . . . . . . . . . . 12,260 3,368 674 260 4,316South Carolina . . . . . . . . . . . . . . . . . . . . . . . . . . . 259,713 73,425 8,401 2,756 2,638South Dakota . . . . . . . . . . . . . . . . . . . . . . . . . . . . . 71,221 31,149 1,015 788 4,139
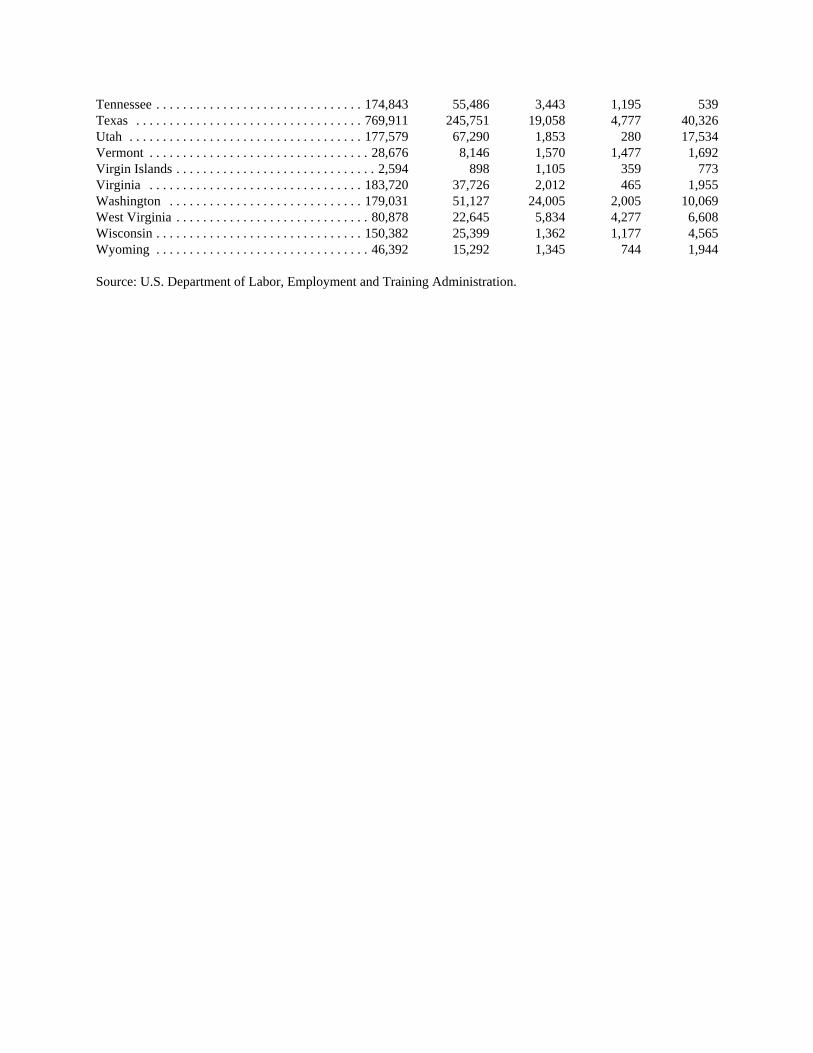
Tennessee . . . . . . . . . . . . . . . . . . . . . . . . . . . . . . . 174,843 55,486 3,443 1,195 539Texas . . . . . . . . . . . . . . . . . . . . . . . . . . . . . . . . . . 769,911 245,751 19,058 4,777 40,326Utah . . . . . . . . . . . . . . . . . . . . . . . . . . . . . . . . . . . 177,579 67,290 1,853 280 17,534Vermont . . . . . . . . . . . . . . . . . . . . . . . . . . . . . . . . . 28,676 8,146 1,570 1,477 1,692Virgin Islands . . . . . . . . . . . . . . . . . . . . . . . . . . . . . . 2,594 898 1,105 359 773Virginia . . . . . . . . . . . . . . . . . . . . . . . . . . . . . . . . 183,720 37,726 2,012 465 1,955Washington . . . . . . . . . . . . . . . . . . . . . . . . . . . . . 179,031 51,127 24,005 2,005 10,069West Virginia . . . . . . . . . . . . . . . . . . . . . . . . . . . . . 80,878 22,645 5,834 4,277 6,608Wisconsin . . . . . . . . . . . . . . . . . . . . . . . . . . . . . . . 150,382 25,399 1,362 1,177 4,565Wyoming . . . . . . . . . . . . . . . . . . . . . . . . . . . . . . . . 46,392 15,292 1,345 744 1,944
Source: U.S. Department of Labor, Employment and Training Administration.
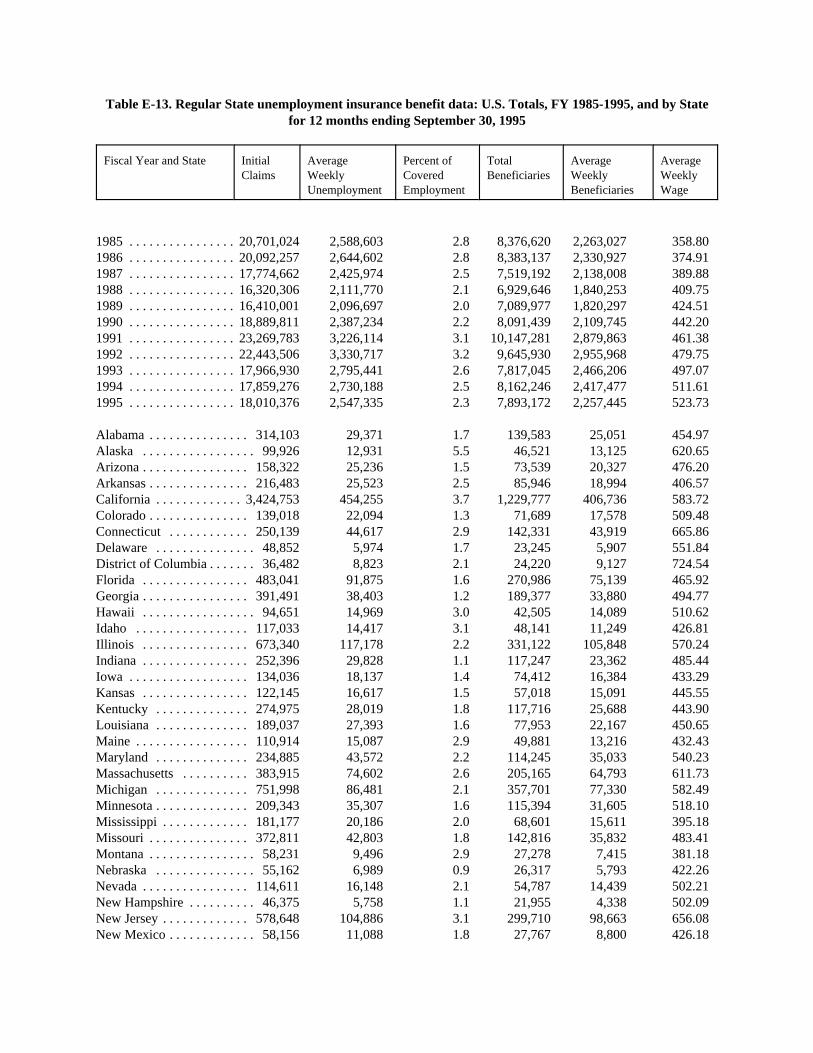
Table E-13. Regular State unemployment insurance benefit data: U.S. Totals, FY 1985-1995, and by Statefor 12 months ending September 30, 1995
Fiscal Year and State InitialClaims
AverageWeeklyUnemployment
Percent ofCoveredEmployment
TotalBeneficiaries
AverageWeeklyBeneficiaries
AverageWeeklyWage
1985 . . . . . . . . . . . . . . . . 20,701,024 2,588,603 2.8 8,376,620 2,263,027 358.801986 . . . . . . . . . . . . . . . . 20,092,257 2,644,602 2.8 8,383,137 2,330,927 374.911987 . . . . . . . . . . . . . . . . 17,774,662 2,425,974 2.5 7,519,192 2,138,008 389.881988 . . . . . . . . . . . . . . . . 16,320,306 2,111,770 2.1 6,929,646 1,840,253 409.751989 . . . . . . . . . . . . . . . . 16,410,001 2,096,697 2.0 7,089,977 1,820,297 424.511990 . . . . . . . . . . . . . . . . 18,889,811 2,387,234 2.2 8,091,439 2,109,745 442.201991 . . . . . . . . . . . . . . . . 23,269,783 3,226,114 3.1 10,147,281 2,879,863 461.381992 . . . . . . . . . . . . . . . . 22,443,506 3,330,717 3.2 9,645,930 2,955,968 479.751993 . . . . . . . . . . . . . . . . 17,966,930 2,795,441 2.6 7,817,045 2,466,206 497.071994 . . . . . . . . . . . . . . . . 17,859,276 2,730,188 2.5 8,162,246 2,417,477 511.611995 . . . . . . . . . . . . . . . . 18,010,376 2,547,335 2.3 7,893,172 2,257,445 523.73
Alabama . . . . . . . . . . . . . . . 314,103 29,371 1.7 139,583 25,051 454.97Alaska . . . . . . . . . . . . . . . . . 99,926 12,931 5.5 46,521 13,125 620.65Arizona . . . . . . . . . . . . . . . . 158,322 25,236 1.5 73,539 20,327 476.20Arkansas . . . . . . . . . . . . . . . 216,483 25,523 2.5 85,946 18,994 406.57California . . . . . . . . . . . . . 3,424,753 454,255 3.7 1,229,777 406,736 583.72Colorado . . . . . . . . . . . . . . . 139,018 22,094 1.3 71,689 17,578 509.48Connecticut . . . . . . . . . . . . 250,139 44,617 2.9 142,331 43,919 665.86Delaware . . . . . . . . . . . . . . . 48,852 5,974 1.7 23,245 5,907 551.84District of Columbia . . . . . . . 36,482 8,823 2.1 24,220 9,127 724.54Florida . . . . . . . . . . . . . . . . 483,041 91,875 1.6 270,986 75,139 465.92Georgia . . . . . . . . . . . . . . . . 391,491 38,403 1.2 189,377 33,880 494.77Hawaii . . . . . . . . . . . . . . . . . 94,651 14,969 3.0 42,505 14,089 510.62Idaho . . . . . . . . . . . . . . . . . 117,033 14,417 3.1 48,141 11,249 426.81Illinois . . . . . . . . . . . . . . . . 673,340 117,178 2.2 331,122 105,848 570.24Indiana . . . . . . . . . . . . . . . . 252,396 29,828 1.1 117,247 23,362 485.44Iowa . . . . . . . . . . . . . . . . . . 134,036 18,137 1.4 74,412 16,384 433.29Kansas . . . . . . . . . . . . . . . . 122,145 16,617 1.5 57,018 15,091 445.55Kentucky . . . . . . . . . . . . . . 274,975 28,019 1.8 117,716 25,688 443.90Louisiana . . . . . . . . . . . . . . 189,037 27,393 1.6 77,953 22,167 450.65Maine . . . . . . . . . . . . . . . . . 110,914 15,087 2.9 49,881 13,216 432.43Maryland . . . . . . . . . . . . . . 234,885 43,572 2.2 114,245 35,033 540.23Massachusetts . . . . . . . . . . 383,915 74,602 2.6 205,165 64,793 611.73Michigan . . . . . . . . . . . . . . 751,998 86,481 2.1 357,701 77,330 582.49Minnesota . . . . . . . . . . . . . . 209,343 35,307 1.6 115,394 31,605 518.10Mississippi . . . . . . . . . . . . . 181,177 20,186 2.0 68,601 15,611 395.18Missouri . . . . . . . . . . . . . . . 372,811 42,803 1.8 142,816 35,832 483.41Montana . . . . . . . . . . . . . . . . 58,231 9,496 2.9 27,278 7,415 381.18Nebraska . . . . . . . . . . . . . . . 55,162 6,989 0.9 26,317 5,793 422.26Nevada . . . . . . . . . . . . . . . . 114,611 16,148 2.1 54,787 14,439 502.21New Hampshire . . . . . . . . . . 46,375 5,758 1.1 21,955 4,338 502.09New Jersey . . . . . . . . . . . . . 578,648 104,886 3.1 299,710 98,663 656.08New Mexico . . . . . . . . . . . . . 58,156 11,088 1.8 27,767 8,800 426.18
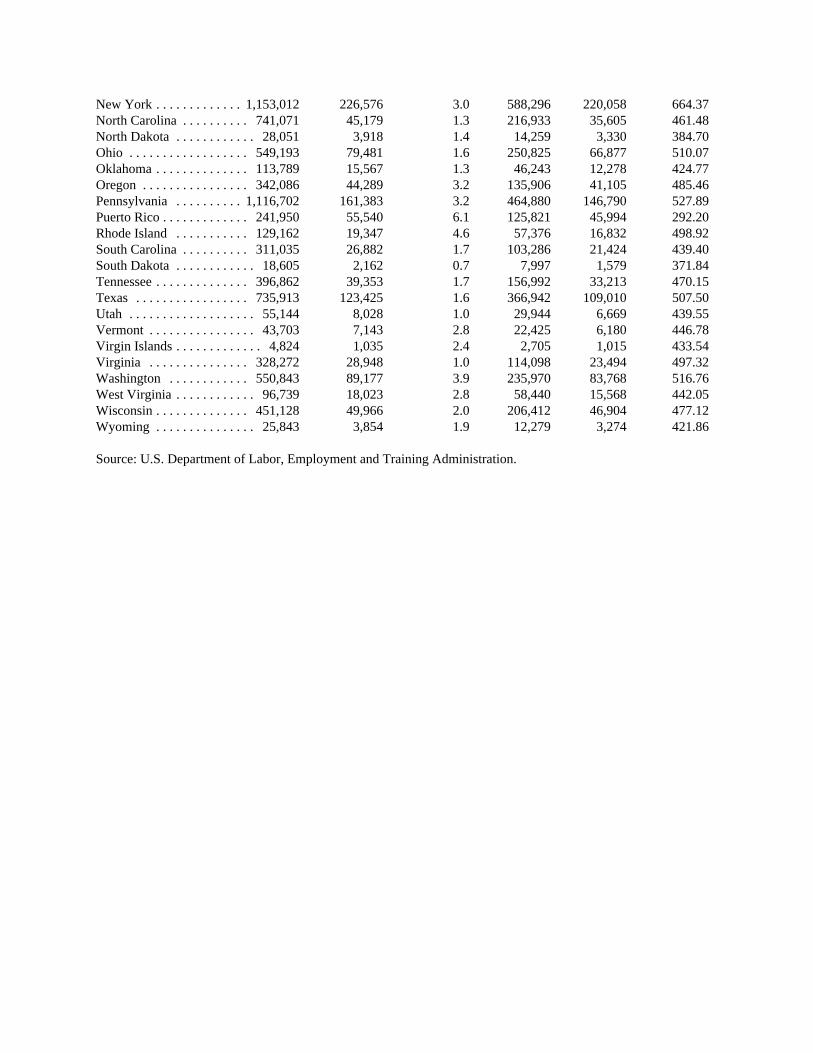
New York . . . . . . . . . . . . . 1,153,012 226,576 3.0 588,296 220,058 664.37North Carolina . . . . . . . . . . 741,071 45,179 1.3 216,933 35,605 461.48North Dakota . . . . . . . . . . . . 28,051 3,918 1.4 14,259 3,330 384.70Ohio . . . . . . . . . . . . . . . . . . 549,193 79,481 1.6 250,825 66,877 510.07Oklahoma . . . . . . . . . . . . . . 113,789 15,567 1.3 46,243 12,278 424.77Oregon . . . . . . . . . . . . . . . . 342,086 44,289 3.2 135,906 41,105 485.46Pennsylvania . . . . . . . . . . 1,116,702 161,383 3.2 464,880 146,790 527.89Puerto Rico . . . . . . . . . . . . . 241,950 55,540 6.1 125,821 45,994 292.20Rhode Island . . . . . . . . . . . 129,162 19,347 4.6 57,376 16,832 498.92South Carolina . . . . . . . . . . 311,035 26,882 1.7 103,286 21,424 439.40South Dakota . . . . . . . . . . . . 18,605 2,162 0.7 7,997 1,579 371.84Tennessee . . . . . . . . . . . . . . 396,862 39,353 1.7 156,992 33,213 470.15Texas . . . . . . . . . . . . . . . . . 735,913 123,425 1.6 366,942 109,010 507.50Utah . . . . . . . . . . . . . . . . . . . 55,144 8,028 1.0 29,944 6,669 439.55Vermont . . . . . . . . . . . . . . . . 43,703 7,143 2.8 22,425 6,180 446.78Virgin Islands . . . . . . . . . . . . . 4,824 1,035 2.4 2,705 1,015 433.54Virginia . . . . . . . . . . . . . . . 328,272 28,948 1.0 114,098 23,494 497.32Washington . . . . . . . . . . . . 550,843 89,177 3.9 235,970 83,768 516.76West Virginia . . . . . . . . . . . . 96,739 18,023 2.8 58,440 15,568 442.05Wisconsin . . . . . . . . . . . . . . 451,128 49,966 2.0 206,412 46,904 477.12Wyoming . . . . . . . . . . . . . . . 25,843 3,854 1.9 12,279 3,274 421.86
Source: U.S. Department of Labor, Employment and Training Administration.
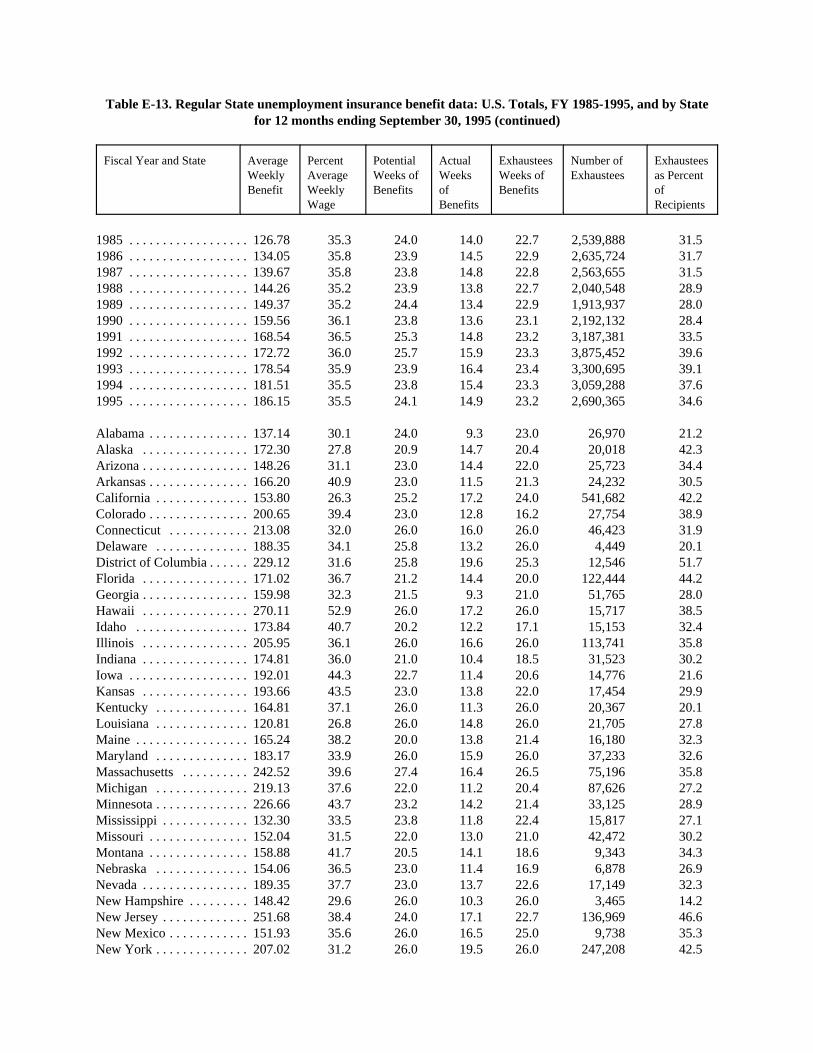
Table E-13. Regular State unemployment insurance benefit data: U.S. Totals, FY 1985-1995, and by Statefor 12 months ending September 30, 1995 (continued)
Fiscal Year and State AverageWeeklyBenefit
PercentAverageWeeklyWage
PotentialWeeks ofBenefits
ActualWeeksofBenefits
ExhausteesWeeks ofBenefits
Number ofExhaustees
Exhausteesas PercentofRecipients
1985 . . . . . . . . . . . . . . . . . . 126.78 35.3 24.0 14.0 22.7 2,539,888 31.51986 . . . . . . . . . . . . . . . . . . 134.05 35.8 23.9 14.5 22.9 2,635,724 31.71987 . . . . . . . . . . . . . . . . . . 139.67 35.8 23.8 14.8 22.8 2,563,655 31.51988 . . . . . . . . . . . . . . . . . . 144.26 35.2 23.9 13.8 22.7 2,040,548 28.91989 . . . . . . . . . . . . . . . . . . 149.37 35.2 24.4 13.4 22.9 1,913,937 28.01990 . . . . . . . . . . . . . . . . . . 159.56 36.1 23.8 13.6 23.1 2,192,132 28.41991 . . . . . . . . . . . . . . . . . . 168.54 36.5 25.3 14.8 23.2 3,187,381 33.51992 . . . . . . . . . . . . . . . . . . 172.72 36.0 25.7 15.9 23.3 3,875,452 39.61993 . . . . . . . . . . . . . . . . . . 178.54 35.9 23.9 16.4 23.4 3,300,695 39.11994 . . . . . . . . . . . . . . . . . . 181.51 35.5 23.8 15.4 23.3 3,059,288 37.61995 . . . . . . . . . . . . . . . . . . 186.15 35.5 24.1 14.9 23.2 2,690,365 34.6
Alabama . . . . . . . . . . . . . . . 137.14 30.1 24.0 9.3 23.0 26,970 21.2Alaska . . . . . . . . . . . . . . . . 172.30 27.8 20.9 14.7 20.4 20,018 42.3Arizona . . . . . . . . . . . . . . . . 148.26 31.1 23.0 14.4 22.0 25,723 34.4Arkansas . . . . . . . . . . . . . . . 166.20 40.9 23.0 11.5 21.3 24,232 30.5California . . . . . . . . . . . . . . 153.80 26.3 25.2 17.2 24.0 541,682 42.2Colorado . . . . . . . . . . . . . . . 200.65 39.4 23.0 12.8 16.2 27,754 38.9Connecticut . . . . . . . . . . . . 213.08 32.0 26.0 16.0 26.0 46,423 31.9Delaware . . . . . . . . . . . . . . 188.35 34.1 25.8 13.2 26.0 4,449 20.1District of Columbia . . . . . . 229.12 31.6 25.8 19.6 25.3 12,546 51.7Florida . . . . . . . . . . . . . . . . 171.02 36.7 21.2 14.4 20.0 122,444 44.2Georgia . . . . . . . . . . . . . . . . 159.98 32.3 21.5 9.3 21.0 51,765 28.0Hawaii . . . . . . . . . . . . . . . . 270.11 52.9 26.0 17.2 26.0 15,717 38.5Idaho . . . . . . . . . . . . . . . . . 173.84 40.7 20.2 12.2 17.1 15,153 32.4Illinois . . . . . . . . . . . . . . . . 205.95 36.1 26.0 16.6 26.0 113,741 35.8Indiana . . . . . . . . . . . . . . . . 174.81 36.0 21.0 10.4 18.5 31,523 30.2Iowa . . . . . . . . . . . . . . . . . . 192.01 44.3 22.7 11.4 20.6 14,776 21.6Kansas . . . . . . . . . . . . . . . . 193.66 43.5 23.0 13.8 22.0 17,454 29.9Kentucky . . . . . . . . . . . . . . 164.81 37.1 26.0 11.3 26.0 20,367 20.1Louisiana . . . . . . . . . . . . . . 120.81 26.8 26.0 14.8 26.0 21,705 27.8Maine . . . . . . . . . . . . . . . . . 165.24 38.2 20.0 13.8 21.4 16,180 32.3Maryland . . . . . . . . . . . . . . 183.17 33.9 26.0 15.9 26.0 37,233 32.6Massachusetts . . . . . . . . . . 242.52 39.6 27.4 16.4 26.5 75,196 35.8Michigan . . . . . . . . . . . . . . 219.13 37.6 22.0 11.2 20.4 87,626 27.2Minnesota . . . . . . . . . . . . . . 226.66 43.7 23.2 14.2 21.4 33,125 28.9Mississippi . . . . . . . . . . . . . 132.30 33.5 23.8 11.8 22.4 15,817 27.1Missouri . . . . . . . . . . . . . . . 152.04 31.5 22.0 13.0 21.0 42,472 30.2Montana . . . . . . . . . . . . . . . 158.88 41.7 20.5 14.1 18.6 9,343 34.3Nebraska . . . . . . . . . . . . . . 154.06 36.5 23.0 11.4 16.9 6,878 26.9Nevada . . . . . . . . . . . . . . . . 189.35 37.7 23.0 13.7 22.6 17,149 32.3New Hampshire . . . . . . . . . 148.42 29.6 26.0 10.3 26.0 3,465 14.2New Jersey . . . . . . . . . . . . . 251.68 38.4 24.0 17.1 22.7 136,969 46.6New Mexico . . . . . . . . . . . . 151.93 35.6 26.0 16.5 25.0 9,738 35.3New York . . . . . . . . . . . . . . 207.02 31.2 26.0 19.5 26.0 247,208 42.5

North Carolina . . . . . . . . . . 187.78 40.7 24.0 8.5 21.7 31,468 16.2North Dakota . . . . . . . . . . . 165.23 42.9 19.5 12.1 16.2 4,889 35.6Ohio . . . . . . . . . . . . . . . . . . 195.13 38.3 26.0 13.9 25.0 62,392 25.1Oklahoma . . . . . . . . . . . . . . 172.18 40.5 21.7 13.8 21.0 17,225 36.9Oregon . . . . . . . . . . . . . . . . 182.63 37.6 25.0 15.7 25.0 45,584 33.2Pennsylvania . . . . . . . . . . . 217.60 41.2 26.0 16.4 26.0 133,881 29.5Puerto Rico . . . . . . . . . . . . . . 91.03 31.2 20.0 19.0 20.0 66,798 50.9Rhode Island . . . . . . . . . . . 224.49 45.0 21.2 15.3 19.7 24,481 42.7South Carolina . . . . . . . . . . 159.61 36.3 23.3 10.8 21.3 23,953 24.6South Dakota . . . . . . . . . . . 143.79 38.7 24.7 10.3 22.6 808 10.7Tennessee . . . . . . . . . . . . . . 149.30 31.8 22.0 11.0 22.5 43,115 29.2Texas . . . . . . . . . . . . . . . . . 186.81 36.8 21.0 15.4 20.2 164,562 44.8Utah . . . . . . . . . . . . . . . . . . 191.24 43.5 21.0 11.6 18.9 8,145 27.4Vermont . . . . . . . . . . . . . . . 164.74 36.9 26.0 14.3 26.0 4,208 19.1Virgin Islands . . . . . . . . . . . 176.79 40.8 24.0 19.5 24.0 1,647 54.3Virginia . . . . . . . . . . . . . . . 169.69 34.1 21.2 10.7 20.5 29,618 26.4Washington . . . . . . . . . . . . 203.52 39.4 26.0 18.5 24.5 82,307 34.7West Virginia . . . . . . . . . . . 170.23 38.5 26.0 13.9 26.0 12,813 23.1Wisconsin . . . . . . . . . . . . . . 197.50 41.4 24.5 11.8 21.7 36,060 18.8Wyoming . . . . . . . . . . . . . . 178.48 42.3 22.2 13.8 20.1 3,570 29.5
Source: U.S. Department of Labor, Employment and Training Administration.