Embed Size (px)
Citation preview

CFO: Murod
CEO: Erica Stepanian
Co-Founders:
Aren
Hal
Pui
David
Misato
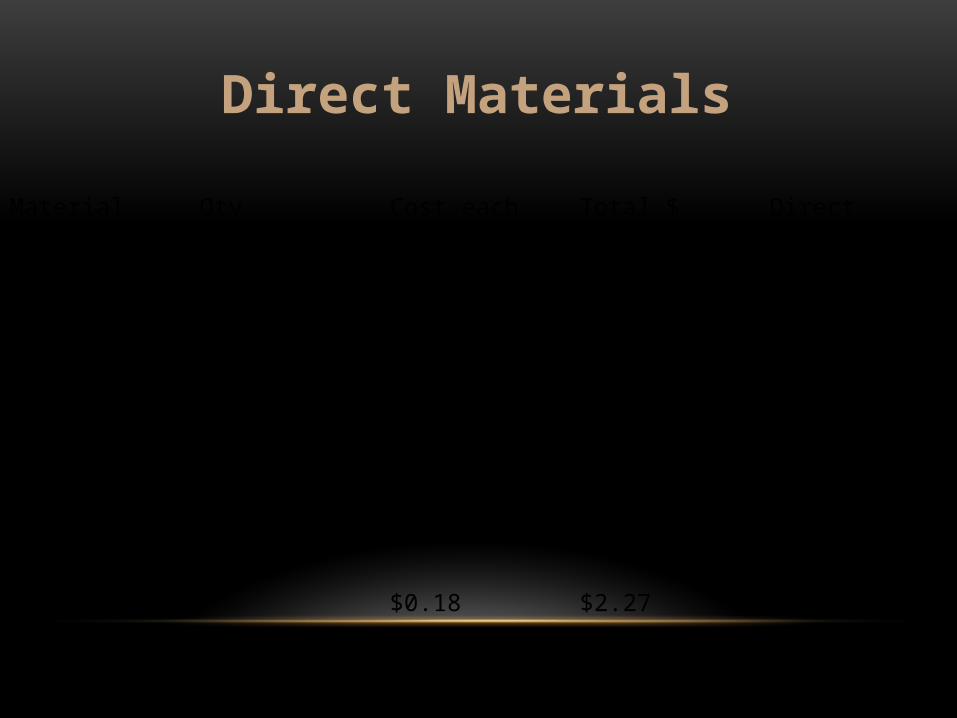
Direct Materials
Material Qty Cost each Total $ DirectOatmeal 12*0.08lb $0.025 0.3 XPeanut butter 12*0.06lb $0.046 0.56 XMilk 12*0.02lb $0.02 0.25 XHoney 12*0.0083lb $0.03 0.36 XPlastic wrapper 12 $0.05 0.60 XBox 1 $0.20 0.20 X
Total $0.18 $2.27
Direct Labor
Job Description Hours Rate Total CostPacker (7) 14,000 $15 $210,000Kitchen worker (2) 4,003 $15 $60,045
Total 18,003 $270,045
Indirect/Other Cost Qty Cost each Quarterly Annually
Manager 1 $10,000 $40000
Rent of Warehouse 1 $20,000 $80,000
Insurance of the Warehouse 1 $5,000 $20,000
Insurance of Machinery 1 $2,500 $10,000
Utilities Cost 1 $10,500 $42,000
Janitors 2 $4,500 $18,000
Depreciation of Machinery 1 $3,750 $15,000
Total $225,000
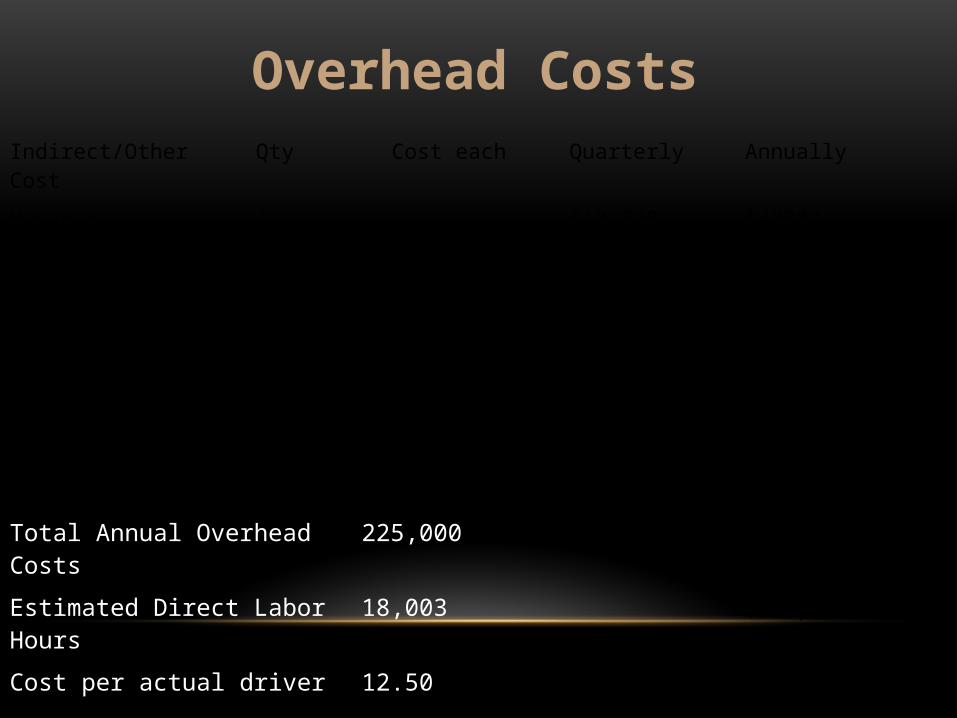
Overhead Costs
Total Annual Overhead Costs 225,000
Estimated Direct Labor Hours 18,003
Cost per actual driver 12.50
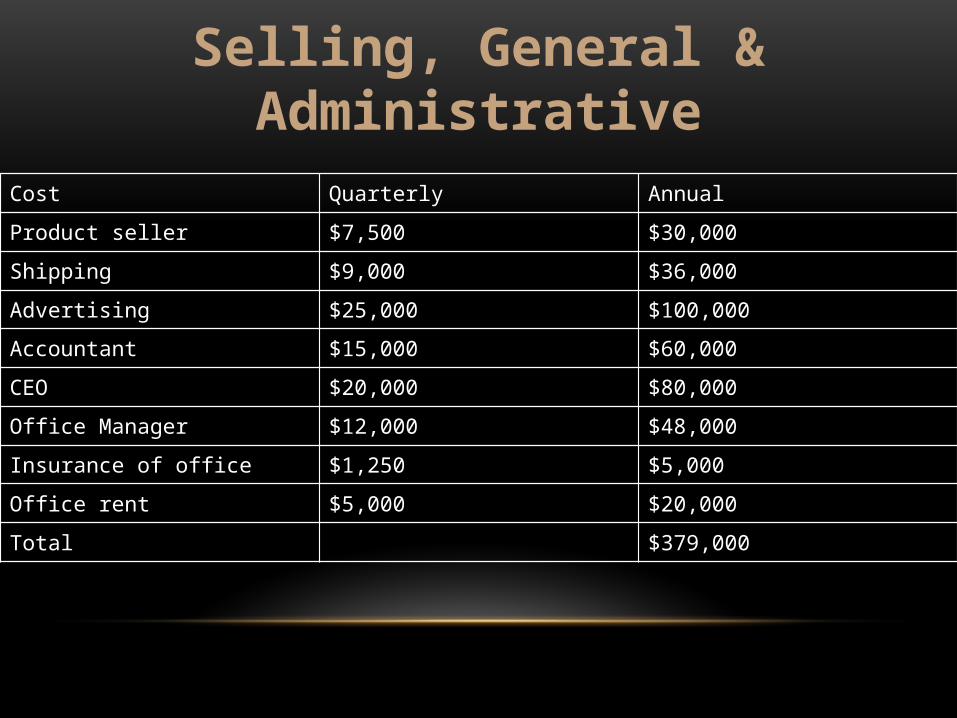
Cost Quarterly Annual
Product seller $7,500 $30,000
Shipping $9,000 $36,000
Advertising $25,000 $100,000
Accountant $15,000 $60,000
CEO $20,000 $80,000
Office Manager $12,000 $48,000
Insurance of office $1,250 $5,000
Office rent $5,000 $20,000
Total $379,000
Selling, General & Administrative

• Mixing Station
• Enrobing Station
• Wrapping Station
• Packaging Station
Production Cycle

Customers & Vendors
Customers: Vendors:
24 Hour Fitness Raduga LTD
Big 5 Sport Brushy Mountain Bee Farm
Vitamin shop Rizhao Golden Nut Group
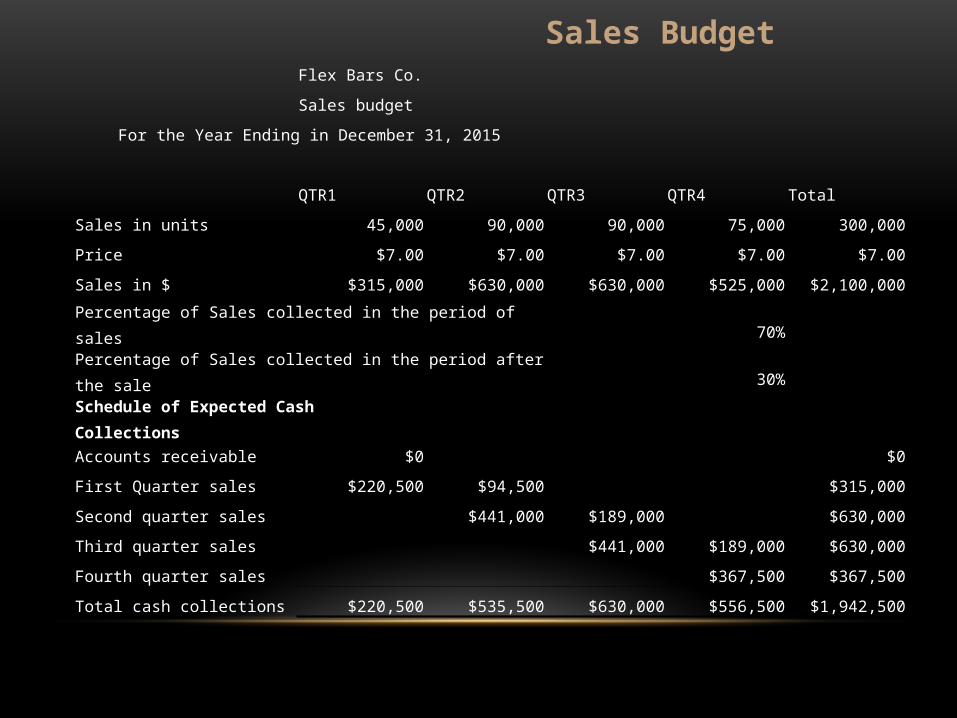
Sales BudgetFlex Bars Co.
Sales budget
For the Year Ending in December 31, 2015
QTR1 QTR2 QTR3 QTR4 Total
Sales in units 45,000 90,000 90,000 75,000 300,000
Price $7.00 $7.00 $7.00 $7.00 $7.00
Sales in $ $315,000 $630,000 $630,000 $525,000 $2,100,000
Percentage of Sales collected in the period of sales 70%
Percentage of Sales collected in the period after the sale 30%
Schedule of Expected Cash Collections
Accounts receivable $0 $0
First Quarter sales $220,500 $94,500 $315,000
Second quarter sales $441,000 $189,000 $630,000
Third quarter sales $441,000 $189,000 $630,000
Fourth quarter sales $367,500 $367,500
Total cash collections $220,500 $535,500 $630,000 $556,500 $1,942,500
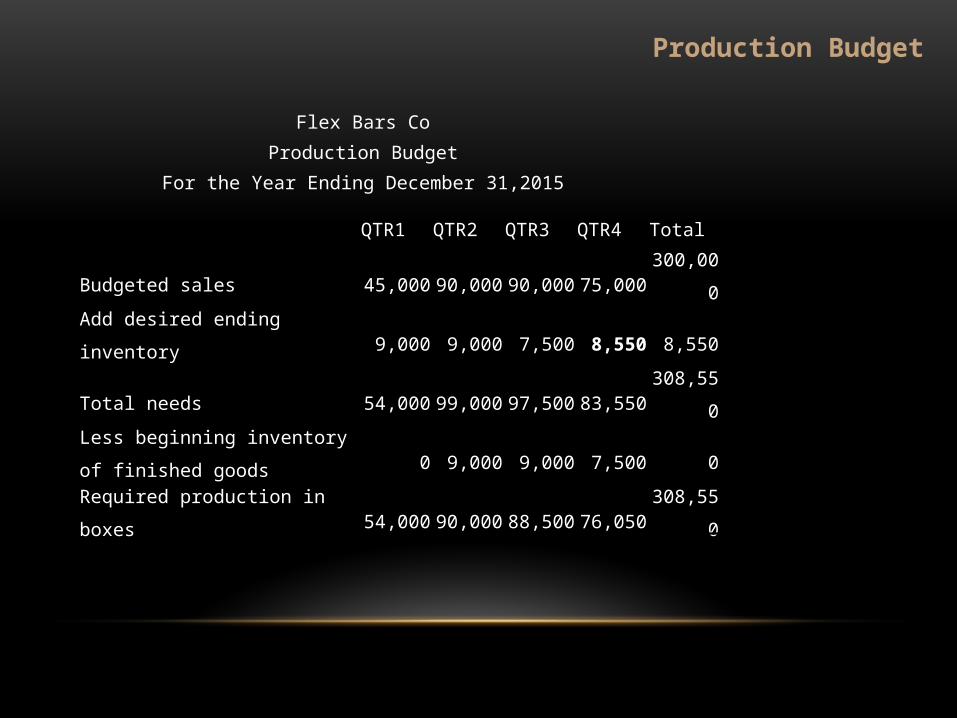
Production Budget
Flex Bars Co
Production Budget
For the Year Ending December 31,2015
QTR1 QTR2 QTR3 QTR4 Total
Budgeted sales 45,000 90,000 90,000 75,000 300,000
Add desired ending inventory 9,000 9,000 7,500 8,550 8,550
Total needs 54,000 99,000 97,500 83,550 308,550
Less beginning inventory of finished goods 0 9,000 9,000 7,500 0
Required production in boxes 54,000 90,000 88,500 76,050 308,550
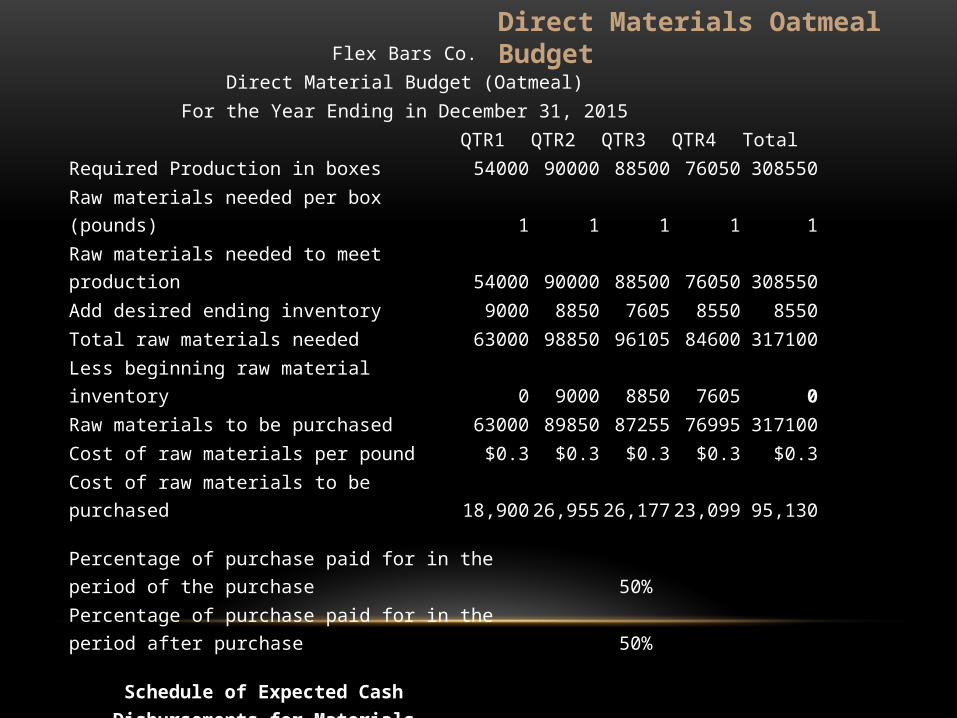
Flex Bars Co.Direct Material Budget (Oatmeal)
For the Year Ending in December 31, 2015QTR1 QTR2 QTR3 QTR4 Total
Required Production in boxes 54000 90000 88500 76050 308550Raw materials needed per box (pounds) 1 1 1 1 1Raw materials needed to meet production 54000 90000 88500 76050 308550Add desired ending inventory 9000 8850 7605 8550 8550Total raw materials needed 63000 98850 96105 84600 317100Less beginning raw material inventory 0 9000 8850 7605 0Raw materials to be purchased 63000 89850 87255 76995 317100Cost of raw materials per pound $0.3 $0.3 $0.3 $0.3 $0.3Cost of raw materials to be purchased 18,900 26,955 26,177 23,099 95,130
Percentage of purchase paid for in the period of the purchase 50%Percentage of purchase paid for in the period after purchase 50%
Schedule of Expected Cash Disbursements for Materials
Accounts payable, beginning balance 0 0First quarter purchases 9,450 9,450 18,900Second quarter purchases 13,478 13,478 26,955Third quarter purchases 13,088 13,088 26,177Fourth quarter purchases 11,549 11,549Total cash disbursements for Materials 9,450 22,928 26,566 24,638 83,581
Direct Materials Oatmeal Budget
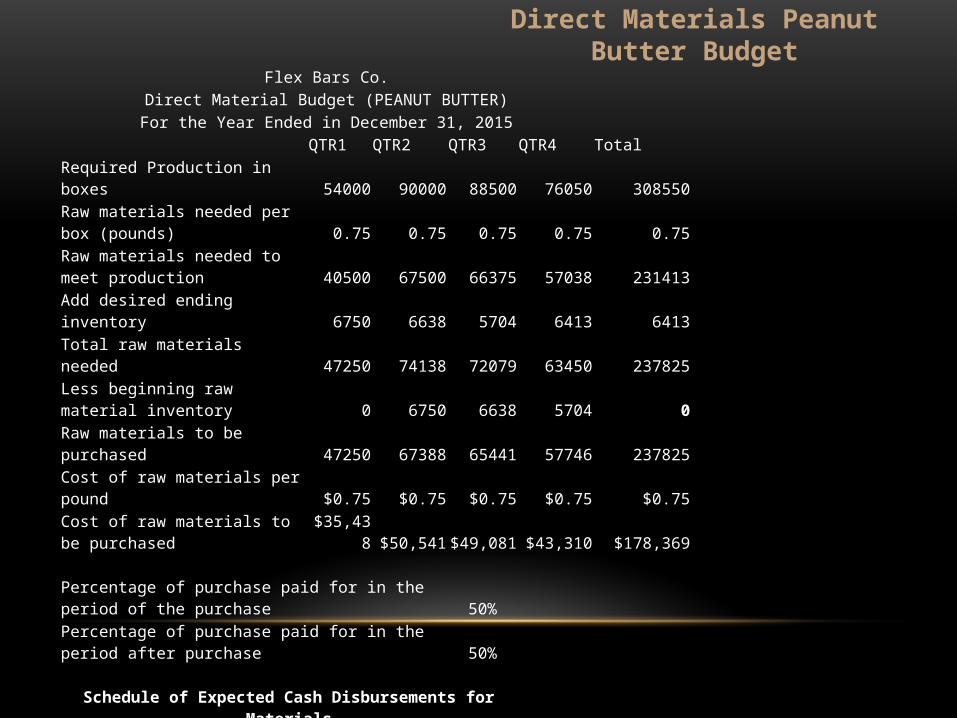
Flex Bars Co.Direct Material Budget (PEANUT BUTTER)For the Year Ended in December 31, 2015
QTR1 QTR2 QTR3 QTR4 TotalRequired Production in boxes 54000 90000 88500 76050 308550
Raw materials needed per box (pounds) 0.75 0.75 0.75 0.75 0.75
Raw materials needed to meet production 40500 67500 66375 57038 231413Add desired ending inventory 6750 6638 5704 6413 6413Total raw materials needed 47250 74138 72079 63450 237825Less beginning raw material inventory 0 6750 6638 5704 0Raw materials to be purchased 47250 67388 65441 57746 237825Cost of raw materials per pound $0.75 $0.75 $0.75 $0.75 $0.75Cost of raw materials to be purchased $35,438 $50,541 $49,081 $43,310 $178,369
Percentage of purchase paid for in the period of the purchase 50%Percentage of purchase paid for in the period after purchase 50%
Schedule of Expected Cash Disbursements for MaterialsAccounts payable, beginning balance $0 $0First quarter purchases $17,719 $17,719 $35,438Second quarter purchases $25,270 $25,270 $50,541Third quarter purchases $24,540 $24,540 $49,081Fourth quarter purchases $21,655 $21,655Total cash disbursements for Materials $17,719 $42,989 $49,811 $46,195 $156,714
Direct Materials Peanut Butter Budget

Flex Bars Co.Direct Material Budget (Milk)
For the Year Ended in December 31, 2015QTR1 QTR2 QTR3 QTR4 Total
Required Production in boxes 54,000 90,000 88,500 76,050 308,550Raw materials needed per box (ltr) 0.25 0.25 0.25 0.25 0.25Raw materials needed to meet production 13,500 22,500 22,125 19,013 77,138Add desired ending inventory 2,250 2,213 1,901 2,138 2,138Total raw materials needed 15,750 24,713 24,026 21,150 79,275Less beginning raw material inventory 0 2,250 2,213 1,901 0Raw materials to be purchased 15,750 22,463 21,814 19,249 79,275Cost of raw materials (per ltr) $1.0 $1.0 $1.0 $1.0 $1.0Cost of raw materials to be purchased 15,750 22,463 21,814 19,249 79,275
Percentage of purchase paid for in the period of the purchase 50%Percentage of purchase paid for in the period after purchase 50%
Schedule of Expected Cash Disbursements for MaterialsAccounts payable, beginning balance $0 $0First quarter purchases $7,875 $7,875 $15,750Second quarter purchases $11,231 $11,231 $22,463Third quarter purchases $10,907 $10,907 $21,814Fourth quarter purchases $9,624 $9,624Total cash disbursements for Materials $7,875 $19,106 $22,138 $20,531 $69,651
Direct Materials Milk Budget

Flex Bars Co.Direct Material Budget (Honey)
For the Year Ended in December 31, 2015QTR1 QTR2 QTR3 QTR4 Total
Required Production in boxes 54,000 90,000 88,500 76,050 308,550Raw materials needed per box (pounds) 0.10 0.10 0.10 0.10 0.10Raw materials needed to meet production 5,400 9,000 8,850 7,605 30,855Add desired ending inventory 900 885 761 855 855Total raw materials needed 6,300 9,885 9,611 8,460 31,710Less beginning raw material inventory 0 900 885 761 0Raw materials to be purchased 6,300 8,985 8,726 7,700 31,710Cost of raw materials per pound $3.6 $3.6 $3.6 $3.6 $3.6Cost of raw materials to be purchased $22,680 $32,346 $31,412 $27,718 $114,156
Percentage of purchase paid for in the period of the purchase 50%Percentage of purchase paid for in the period after purchase 50%
Schedule of Expected Cash Disbursements for MaterialsAccounts payable, beginning balance $0 $0First quarter purchases $11,340 $11,340 $22,680Second quarter purchases $16,173 $16,173 $32,346Third quarter purchases $15,706 $15,706 $31,412Fourth quarter purchases $13,859 $13,859Total cash disbursements for Materials $11,340 $27,513 $31,879 $29,565 $100,297
Direct Materials Honey Budget
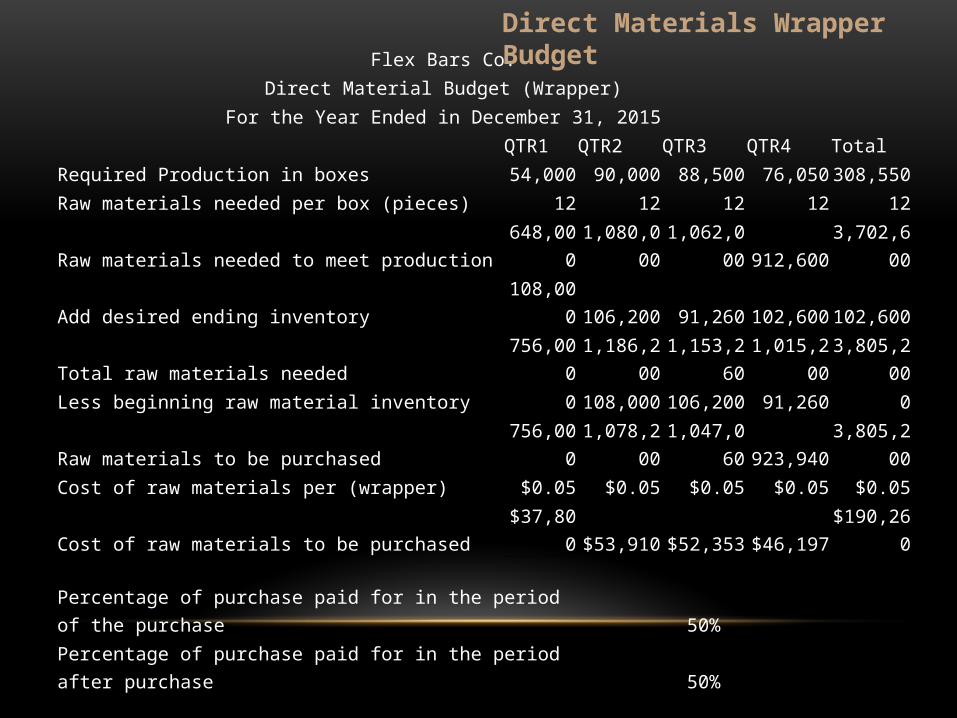
Flex Bars Co.Direct Material Budget (Wrapper)
For the Year Ended in December 31, 2015QTR1 QTR2 QTR3 QTR4 Total
Required Production in boxes 54,000 90,000 88,500 76,050 308,550Raw materials needed per box (pieces) 12 12 12 12 12Raw materials needed to meet production 648,000 1,080,000 1,062,000 912,600 3,702,600Add desired ending inventory 108,000 106,200 91,260 102,600 102,600Total raw materials needed 756,000 1,186,200 1,153,260 1,015,200 3,805,200Less beginning raw material inventory 0 108,000 106,200 91,260 0Raw materials to be purchased 756,000 1,078,200 1,047,060 923,940 3,805,200Cost of raw materials per (wrapper) $0.05 $0.05 $0.05 $0.05 $0.05Cost of raw materials to be purchased $37,800 $53,910 $52,353 $46,197 $190,260
Percentage of purchase paid for in the period of the purchase 50%Percentage of purchase paid for in the period after purchase 50%
Schedule of Expected Cash Disbursements for MaterialsAccounts payable, beginning balance $0 $0First quarter purchases $18,900 $18,900 $37,800Second quarter purchases $26,955 $26,955 $53,910Third quarter purchases $26,177 $26,177 $52,353Fourth quarter purchases $23,099 $23,099Total cash disbursements for Materials $18,900 $45,855 $53,132 $49,275 $167,162
Direct Materials Wrapper Budget

Flex Bars Co.Direct Material Budget (Boxes)
For the Year Ended in December 31, 2015QTR1 QTR2 QTR3 QTR4 Total
Required Production in boxes 54,000 90,000 88,500 76,050 308,550Raw materials needed per box 1 1 1 1 1Raw materials needed to meet production 54,000 90,000 88,500 76,050 308,550Add desired ending inventory 9,000 8,850 7,605 8,550 8,550Total raw materials needed 63,000 98,850 96,105 84,600 317,100Less beginning raw material inventory 0 9,000 8,850 7,605 0Raw materials to be purchased 63,000 89,850 87,255 76,995 317,100Cost of raw materials per pound $0.2 $0.2 $0.2 $0.2 $0.2Cost of raw materials to be purchased $12,600 $17,970 $17,451 $15,399 $63,420
Percentage of purchase paid for in the period of the purchase 50%Percentage of purchase paid for in the period after purchase 50%
Schedule of Expected Cash Disbursements for MaterialsAccounts payable, beginning balance $0 $0First quarter purchases $6,300 $6,300 $12,600Second quarter purchases $8,985 $8,985 $17,970Third quarter purchases $8,726 $8,726 $17,451Fourth quarter purchases $7,700 $7,700Total cash disbursements for Materials $6,300 $15,285 $17,711 $16,425 $55,721
Direct Materials Boxes Budget

Direct Materials Sum Budget
Protein Bar Co
Direct material Budger (sum)
For the period
1 2 3 4 Total
Oatmeal $9,450 $22,928 $26,566 $24,638 $83,581
Peanut Butter $17,719 $42,989 $49,811 $46,195 $156,714
Milk $7,875 $19,106 $22,138 $20,531 $69,651
Honey $11,340 $27,513 $31,879 $29,565 $100,297
Wrapper $18,900 $45,855 $53,132 $49,275 $167,162
Box $6,300 $15,285 $17,711 $16,425 $55,721
Total $71,584 $173,676 $201,236 $186,629 $633,124
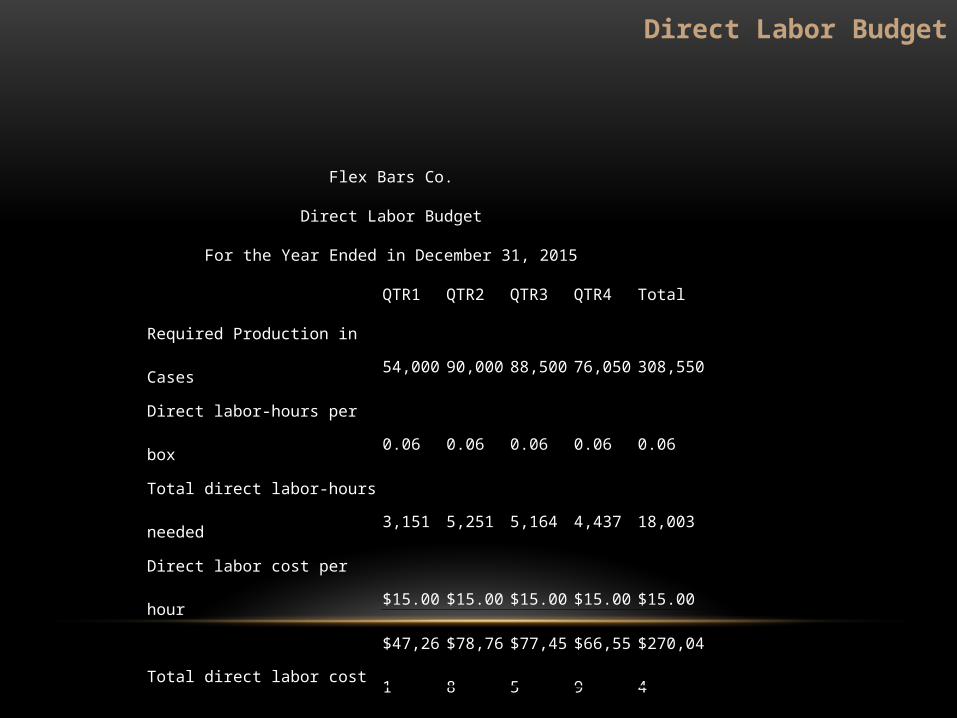
Direct Labor Budget
Flex Bars Co.
Direct Labor Budget
For the Year Ended in December 31, 2015
QTR1 QTR2 QTR3 QTR4 Total
Required Production in Cases 54,000 90,000 88,500 76,050 308,550
Direct labor-hours per box 0.06 0.06 0.06 0.06 0.06
Total direct labor-hours needed 3,151 5,251 5,164 4,437 18,003
Direct labor cost per hour $15.00 $15.00 $15.00 $15.00 $15.00
Total direct labor cost $47,261 $78,768 $77,455 $66,559 $270,044
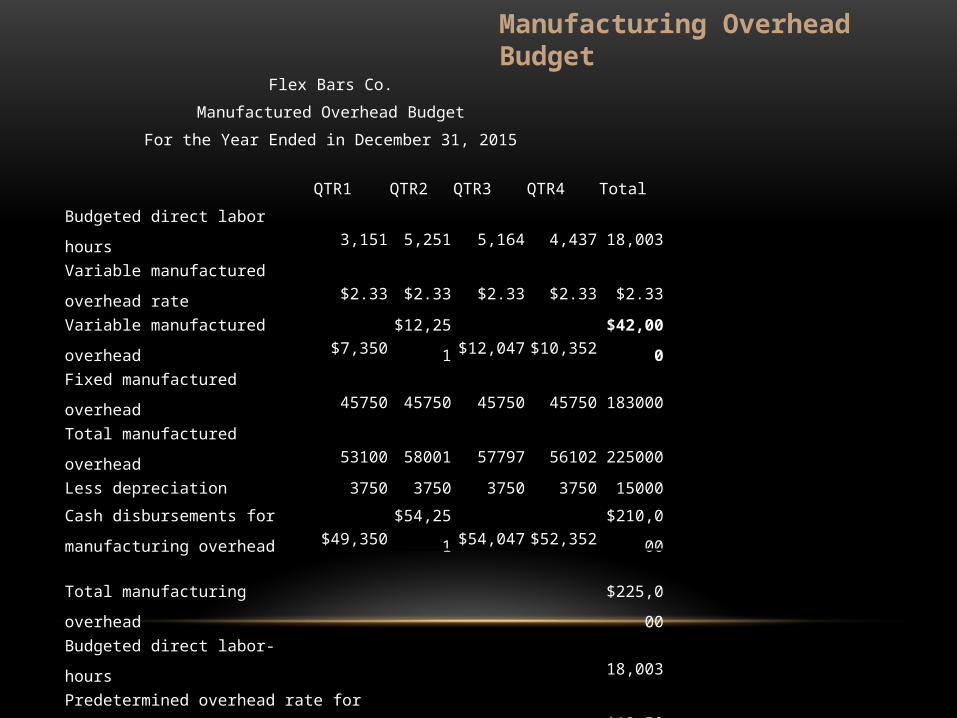
Manufacturing Overhead Budget
Flex Bars Co.
Manufactured Overhead Budget
For the Year Ended in December 31, 2015
QTR1 QTR2 QTR3 QTR4 Total
Budgeted direct labor hours 3,151 5,251 5,164 4,437 18,003
Variable manufactured overhead rate $2.33 $2.33 $2.33 $2.33 $2.33
Variable manufactured overhead $7,350 $12,251 $12,047 $10,352 $42,000
Fixed manufactured overhead 45750 45750 45750 45750 183000
Total manufactured overhead 53100 58001 57797 56102 225000
Less depreciation 3750 3750 3750 3750 15000
Cash disbursements for manufacturing overhead $49,350 $54,251 $54,047 $52,352 $210,000
Total manufacturing overhead $225,000
Budgeted direct labor-hours 18,003
Predetermined overhead rate for the year (a)/(b) $12.50
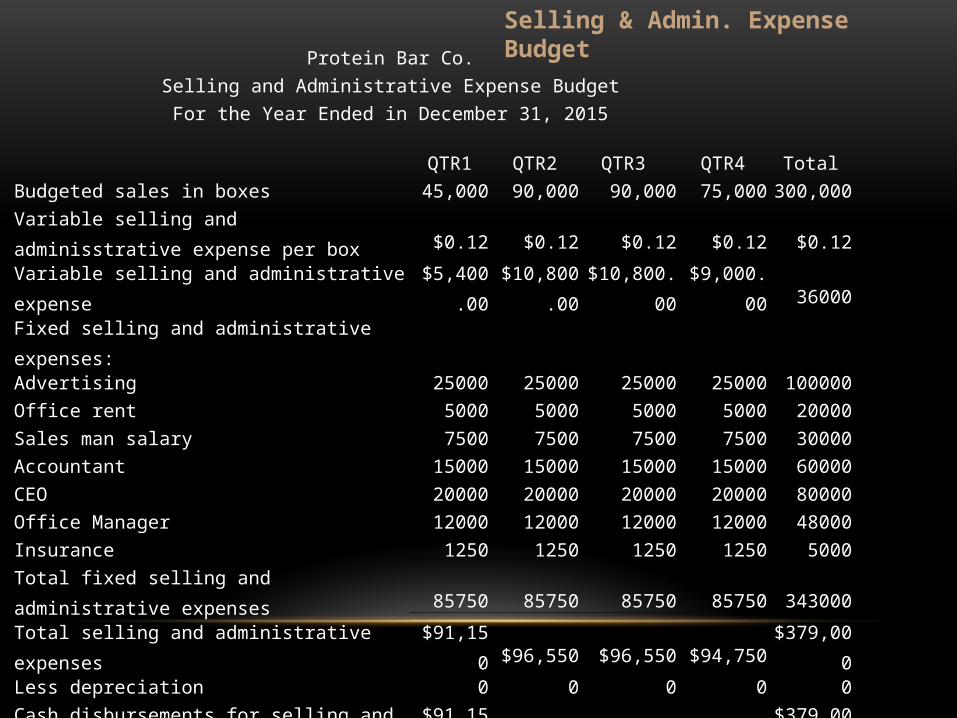
Selling & Admin. Expense BudgetProtein Bar Co.
Selling and Administrative Expense BudgetFor the Year Ended in December 31, 2015
QTR1 QTR2 QTR3 QTR4 TotalBudgeted sales in boxes 45,000 90,000 90,000 75,000 300,000Variable selling and adminisstrative expense per box $0.12 $0.12 $0.12 $0.12 $0.12
Variable selling and administrative expense $5,400.00 $10,800.00 $10,800.00 $9,000.00 36000Fixed selling and administrative expenses:Advertising 25000 25000 25000 25000 100000Office rent 5000 5000 5000 5000 20000Sales man salary 7500 7500 7500 7500 30000Accountant 15000 15000 15000 15000 60000CEO 20000 20000 20000 20000 80000Office Manager 12000 12000 12000 12000 48000Insurance 1250 1250 1250 1250 5000Total fixed selling and administrative expenses 85750 85750 85750 85750 343000Total selling and administrative expenses $91,150 $96,550 $96,550 $94,750 $379,000Less depreciation 0 0 0 0 0
Cash disbursements for selling and administrative expenses $91,150 $96,550 $96,550 $94,750 $379,000
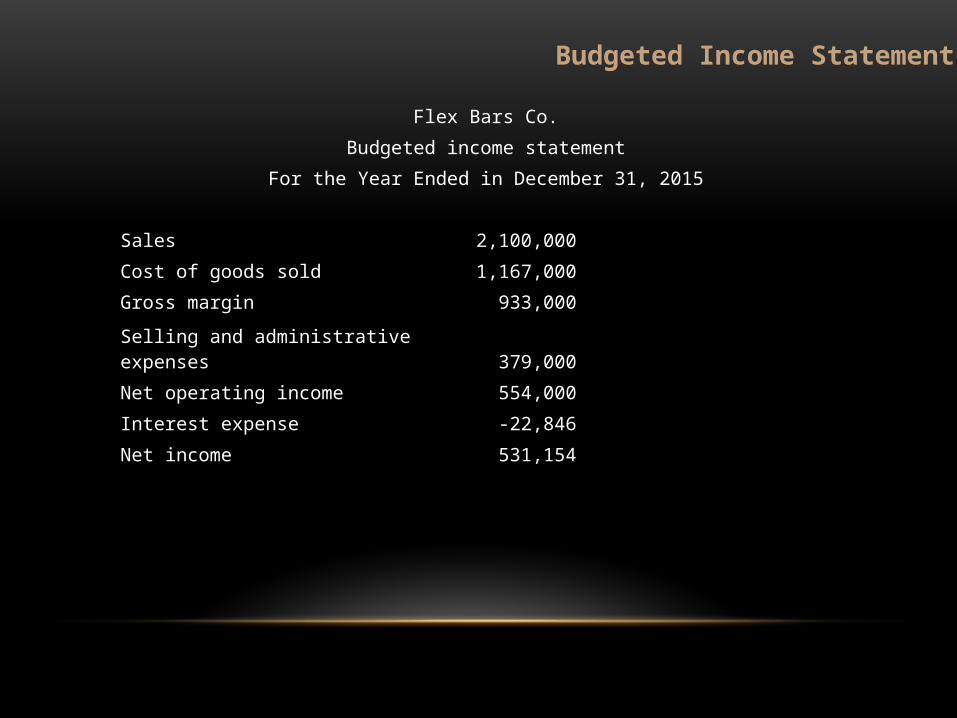
Budgeted Income Statement
Flex Bars Co.
Budgeted income statement
For the Year Ended in December 31, 2015
Sales 2,100,000
Cost of goods sold 1,167,000
Gross margin 933,000
Selling and administrative expenses 379,000
Net operating income 554,000
Interest expense -22,846
Net income 531,154
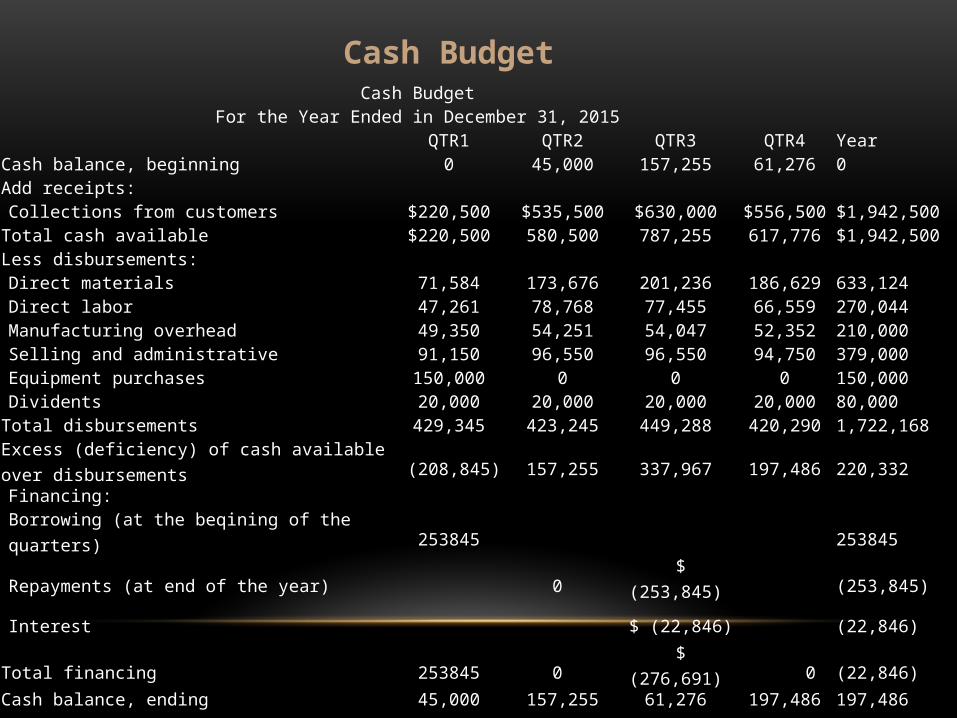
Cash BudgetCash Budget
For the Year Ended in December 31, 2015QTR1 QTR2 QTR3 QTR4 Year
Cash balance, beginning 0 45,000 157,255 61,276 0Add receipts:Collections from customers $220,500 $535,500 $630,000 $556,500 $1,942,500
Total cash available $220,500 580,500 787,255 617,776 $1,942,500Less disbursements:Direct materials 71,584 173,676 201,236 186,629 633,124Direct labor 47,261 78,768 77,455 66,559 270,044Manufacturing overhead 49,350 54,251 54,047 52,352 210,000Selling and administrative 91,150 96,550 96,550 94,750 379,000Equipment purchases 150,000 0 0 0 150,000Dividents 20,000 20,000 20,000 20,000 80,000
Total disbursements 429,345 423,245 449,288 420,290 1,722,168
Excess (deficiency) of cash available over disbursements (208,845) 157,255 337,967 197,486 220,332Financing:Borrowing (at the beqining of the quarters) 253845 253845
Repayments (at end of the year) 0 $ (253,845) (253,845)
Interest $ (22,846) (22,846)
Total financing 253845 0 $ (276,691) 0 (22,846)Cash balance, ending 45,000 157,255 61,276 197,486 197,486
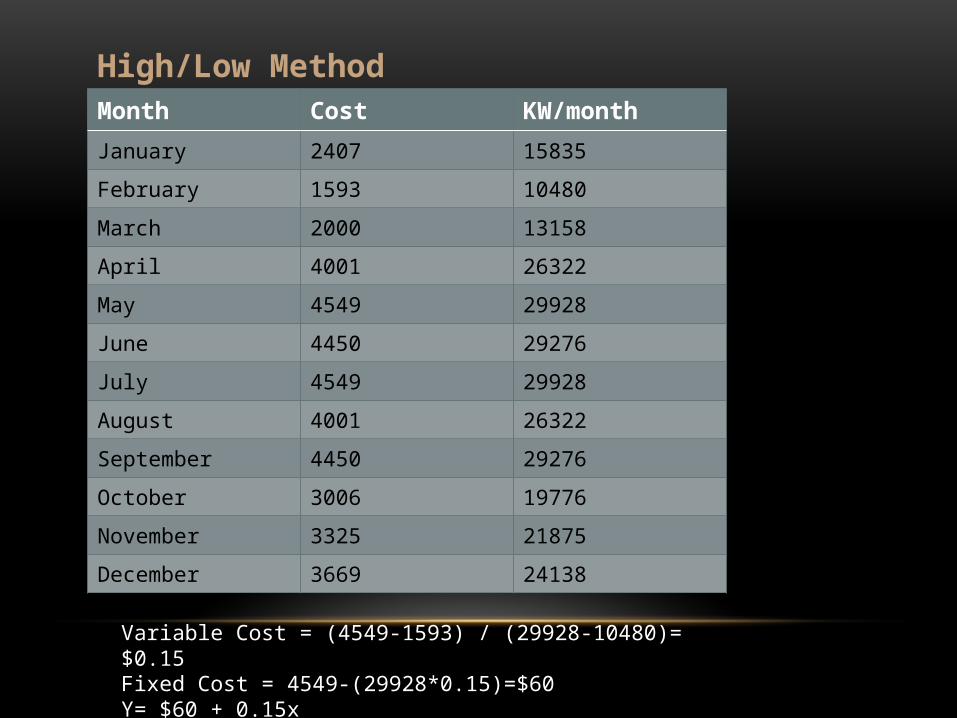
Month Cost KW/month
January 2407 15835
February 1593 10480
March 2000 13158
April 4001 26322
May 4549 29928
June 4450 29276
July 4549 29928
August 4001 26322
September 4450 29276
October 3006 19776
November 3325 21875
December 3669 24138
High/Low Method
Variable Cost = (4549-1593) / (29928-10480)= $0.15Fixed Cost = 4549-(29928*0.15)=$60Y= $60 + 0.15x
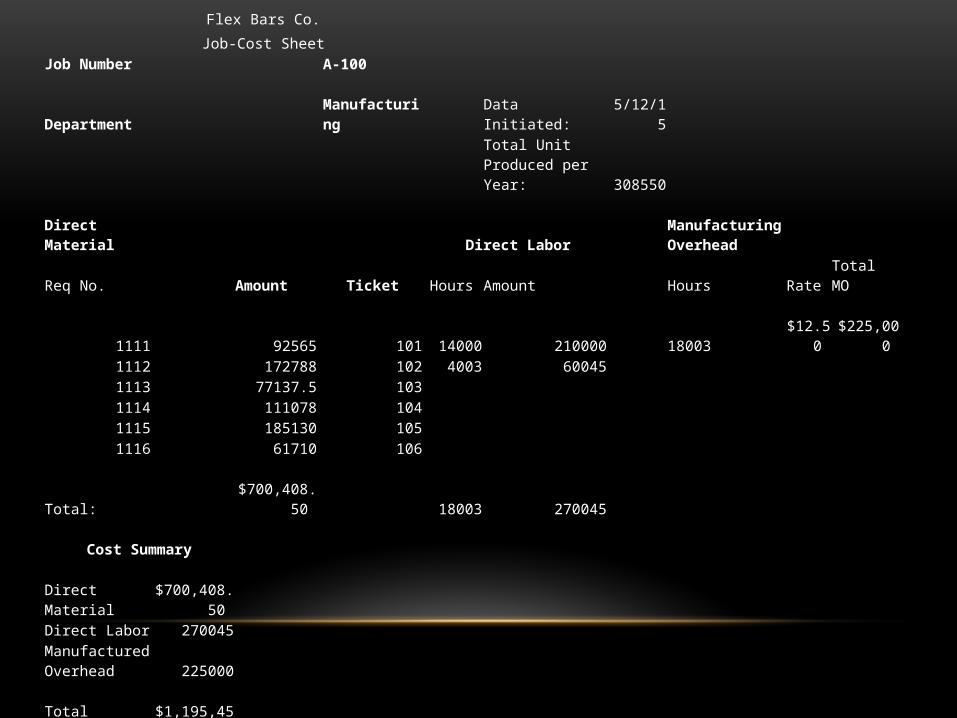
Flex Bars Co.
Job-Cost SheetJob Number A-100
Department Manufacturing Data Initiated: 5/12/15Total Unit Produced per Year: 308550
Direct Material Direct LaborManufacturing Overhead
Req No. Amount Ticket Hours Amount Hours Rate Total MO
1111 92565 101 14000 210000 18003
$12.50 $225,000 1112 172788 102 4003 600451113 77137.5 1031114 111078 1041115 185130 1051116 61710 106
Total: $700,408.50 18003 270045
Cost SummaryDirect Material $700,408.50 Direct Labor 270045Manufactured Overhead 225000
Total Product cost
$1,195,453.5
0 Unit Product Cost $3.9
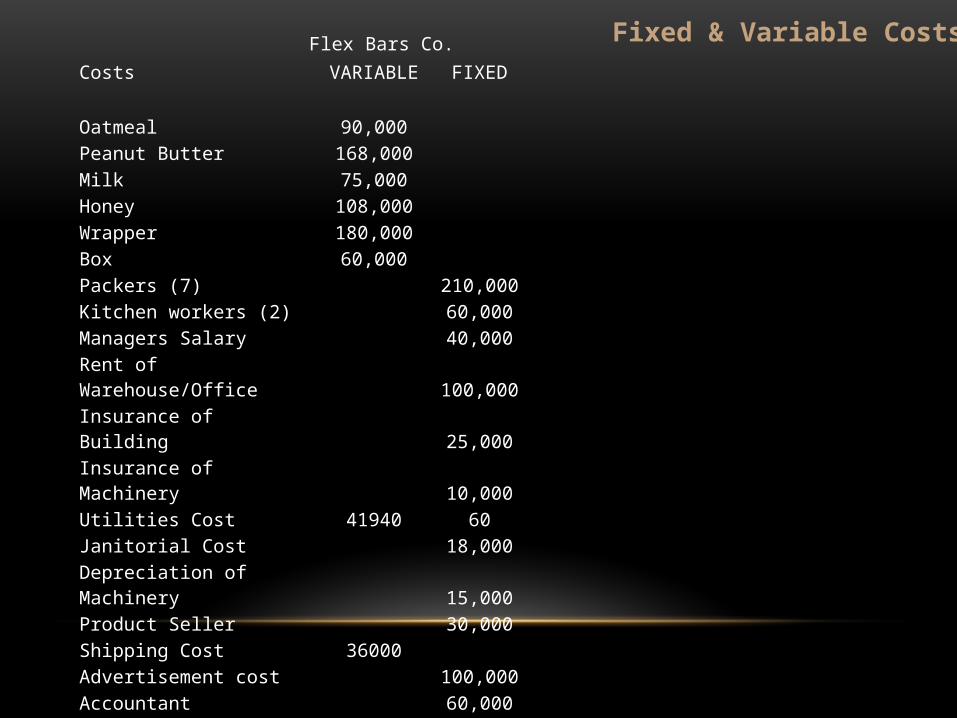
Flex Bars Co.
Costs VARIABLE FIXED
Oatmeal 90,000Peanut Butter 168,000Milk 75,000Honey 108,000Wrapper 180,000Box 60,000Packers (7) 210,000Kitchen workers (2) 60,000Managers Salary 40,000Rent of Warehouse/Office 100,000Insurance of Building 25,000Insurance of Machinery 10,000Utilities Cost 41940 60Janitorial Cost 18,000Depreciation of Machinery 15,000Product Seller 30,000Shipping Cost 36000Advertisement cost 100,000Accountant 60,000CEO 80,000Office Manager 48,000
TOTAL 758,940 796,060
Fixed & Variable Costs

Cost-Volume Profit
Cost Volume Profit Relationship
Sales price per unit= $7 Sales (300,000*7)= $2,100,000.00 Variable cost= $758,940.00 Contribution margin= $1,341,060.00 Fixed cost= $796,060.00 Net operating income= $554,000.00
CM Ratio (CM/Sales) 0.6BEP Dollars (FC/CM Ratio) $1,246,570.62 BEP Units (FC/ Unit CM)= (796060/3.11)= 255,968Degree of operating leverage (CM/ Net Oper. income) 2.42Margin of Safety (Sales-BEP dollars) $853,429.38 Margin of Safety Percentage 41%

Thank You!