Embed Size (px)
Citation preview

Materials Performance andCharacterization
M. R. Rahul1 and G. Phanikumar2
DOI: 10.1520/MPC20140065
Correlation ofMicrostructure With HAZWelding CyclesSimulated in Ti-15-3 AlloyUsing Gleeble 3800 andSYSWELD
VOL. 4 NO. 3 / 2015
Copyright by ASTM Int'l (all rights reserved); Fri Aug 14 09:36:56 EDT 2015Downloaded/printed byIndian Inst of Tech Chennai (Indian Inst of Tech Chennai) pursuant to License Agreement. No further reproductions authorized.

M. R. Rahul1 and G. Phanikumar2
Correlation of MicrostructureWith HAZ Welding Cycles Simulatedin Ti-15-3 Alloy Using Gleeble 3800and SYSWELD
Reference
Rahul, M. R. and Phanikumar, G., “Correlation of Microstructure With HAZ Welding Cycles
Simulated in Ti-15-3 Alloy Using Gleeble 3800 and SYSWELD,” Materials Performance and
Characterization, Vol. 4, No. 3, 2015, pp. 1–18, doi:10.1520/MPC20140065. ISSN 2165-3992
ABSTRACT
Metastable b-titanium alloys are finding increasingly wider applications in
structural components in aerospace, energy, and chemical industries because
of their formability and heat-treatment possibilites. Components from these
alloys are usually welded by processes, such as gas tungsten arc welding
(GTAW), electron beam welding (EBW), and laser beam welding (LBW). Post-
weld heat treatment improves the strength of the weld because of the
precipitation of a phase and TiCr2 particles. In b-titanium alloys, the location,
distribution and morphology of a precipitates in b matrix plays an important
role in the performance of the welded components. In this work, we simulate
different welding processes using Sysweld software and obtain realistic
thermal cycles after calibrating the fusion zone dimensions with known
experimental data. These cycles are then used to program the heat-affected
zone (HAZ) cycles in Gleeble 3800 to study their effect on the microstructure
of the b-titanium alloy. Both continuous and pulsed welding conditions are
used for the welding process. Microstructure characterization was performed
using scanning electron microscopy (SEM), electron back-scattered diffraction
(EBSD), and transmission electron microscopy (TEM). Precipitates of a phase
below 0.2 lm are seen to be uniform across the b grain but the number
density is not uniform across different grains of b. We discuss the
characterization results in light of existing models in the literature. The a
Manuscript received December 31,
2014; accepted for publication
July 9, 2015; published online
August 3, 2015.
1
Research Scholar, Dept. of
Metallurgical and Materials
Engineering, Indian Institute of
Technology Madras,
Chennai 600036, India.
2
Associate Professor, Dept. of
Metallurgical and Materials
Engineering, Indian Institute of
Technology Madras, Chennai
600036, India (Corresponding
author), e-mail: [email protected]
Copyright VC 2015 by ASTM International, 100 Barr Harbor Drive, P.O. Box C700, West Conshohocken, PA 19428-2959 1
Materials Performance and Characterization
doi:10.1520/MPC20140065 Vol. 4 No. 3 / 0000 / available online at www.astm.org
Copyright by ASTM Int'l (all rights reserved); Fri Aug 14 09:36:56 EDT 2015Downloaded/printed byIndian Inst of Tech Chennai (Indian Inst of Tech Chennai) pursuant to License Agreement. No further reproductions authorized.

precipitation and hardness variation are correlated with welding cycles. A
combination of computational and physical simulation tools is proposed to
reduce the cycle to find optimal choice in the fabrication process design space.
Keywords
FEM simulation, physical simulation, precipitation
Introduction
Weldability is an important aspect in the design of alloys. Fabrication of complex ge-
ometrical parts from individual parts involves welding as a process step that could
significantly alter the part characteristics [1]. Thermal cycles resulting from the
welding processes could alter the final microstructure and also lead to residual
stresses and distortions. Repair and refurbishment of investment/directionally cast
parts also involves variants of welding processes, such as weld overlay. Thus, for
both wrought and cast components of a newly designed alloy, weldability is an
aspect that needs to be evaluated as part of the design process. In this study, we take
up the case of welding of metastable b-titanium alloys [2] and illustrate the role
played by thermal profiles in the final microstructure of the weld. Based on
this study, a modification of the workflow of design process is suggested toward
accelerated design of alloys.
Titanium alloys are widely used in aerospace, energy, chemical and biomedical
industries. Because of their excellent mechanical properties, b Ti alloys have become
a choice of alloys that combine good formability with the possibility of improvement
of strength through heat treatment. Ti-15-3 alloy has excellent cold deformability in
a solution-treated condition and its properties could be improved by aging [3]. Weld
thermal cycles are known to lead to significant changes in the microstructure and
mechanical properties of these alloys [4].
The transformation temperature in pure Ti from body-centered-cubic (b) to
hexagonal-closed-packed (a) phase transformation during cooling below 882�C can
be controlled by the addition of b and a stabilizing agents [5]. Elements such as Mo,
V, Nb, and Cr act as b stabilizing agents, and Al will act as an a stabilizing agent and
change the transformation temperature. To stabilize b phase on quenching, a Mo
equivalency of more than 10 at. % is required [6]. The alloy used in the present study
is Ti-15-3, having a Mo equivalency of 11.85 at. % and has a b phase at room
temperature.
Ti and its alloys are commonly welded by gas tungsten arc welding (GTAW),
gas metal arc welding (GMAW), laser beam welding (LBW), electron beam welding
(EBW), and plasma arc welding (PAW) [7,8]. It is reported that metastable b Ti
alloys are readily weldable; the fusion zone consists of columnar grains and the
heat-affected zone (HAZ) consists of retained b grains [6]. GTAW is an established
welding technique for b Ti alloys [9]. The as-welded condition for most of b Ti
alloys leads to good ductility and relatively less strength, usually lower than that of
base metal [10]. To improve the strength, heat treatment can be carried out but that
would also lower the ductility [6]. Pulsed GTAW and effects of pulsing frequency on
RAHUL AND PHANIKUMAR ON MICROSTRUCTURE WITH HAZ WELDING 2
Materials Performance and Characterization
Copyright by ASTM Int'l (all rights reserved); Fri Aug 14 09:36:56 EDT 2015Downloaded/printed byIndian Inst of Tech Chennai (Indian Inst of Tech Chennai) pursuant to License Agreement. No further reproductions authorized.
welding of Ti-15-3 alloy were studied by Balachandar et al. [4], wherein they
reported the precipitation of a phase in the as-welded condition for both continuous
current and pulsed current conditions.
Numerical techniques can be used to simulate the welding process and to find
the approximate residual stresses in the weldment. A finite element package,
Sysweld, can be used to simulate the bead on plate weld [11] as well as for complex
geometries. A double ellipsoidal model is often used to define the heat source. The
parameter fitting can be done considering the actual weld dimensions and thermal
cycles.
Physical simulation of material processing involves the exact reproduction of
the thermal and mechanical conditions in the laboratory that the material is sub-
jected to in the actual fabrication process or end use. HAZ simulation in Gleeble
3800 is widely used in steels, Ni-based alloys [12], and in Ti alloys to correlate the
welding parameters with microstructure. The narrow HAZ microstructure is repli-
cated in a wide area in the simulated sample.
Various thermomechanical cycles are reported for processing b-titanium alloy
for better strength. Precipitation time temperature diagram are also established [3].
Formation of x phase is reported to act as a possible precursor for a precipitation.
The rate of heating to the aging temperature also has a profound effect on the pre-
cipitation of a phase. Precipitate-free zones and grain boundary a are also reported
[13]. The mechanism of a nucleation and growth are established in b Ti alloys shows
that a precipitates in the interior of grain boundaries latter impingement will occur
to form a continuous layer. Salib et al. [14] also reported a mechanism for precipita-
tion in b Ti-17 alloy.
In this study, we report our work using both the finite element software
package Sysweld and physical simulation system Gleeble 3800 to simulate HAZ for
realistic welding cycles. Verifying the formation of precipitates was done using
detailed characterization techniques. The pulsed current welding cycle is simulated,
and the distance at which the pulsing effect is negligible was determined for different
welding conditions. The a precipitation was correlated with the current open
literature.
Numerical Simulation
Sysweld is an industry standard of the FEM package, which is known to provide
realistic welding simulation of thermal profiles, residual stresses, and distortion cal-
culations for complex geometries. Using eight node cube elements, a 3D model of Ti
plate was created in the visual weld pre-processor (Fig. 1(a)). To give a pulsing effect,
the model is scaled down from the actual plate dimension. Adaptive meshing is used
to create the fine element mesh. To reduce the computational time and capture the
thermal profile accurately in the fusion zone and heat-affected zone, a finer meshing
was used. In the regions away from the weld zone, a coarser mesh was used. Quadri-
lateral elements are used for the transition region from fine to coarse mesh
(Fig. 1(b)). Input parameters for 3D models, such as specific heat and thermal
conductivity, both varying with temperature and density, are given based on the lit-
erature [8]. The 3D model of the Ti plate was created for modeling, and the resulting
thermal profile generated was used for physical simulation of HAZ.
RAHUL AND PHANIKUMAR ON MICROSTRUCTURE WITH HAZ WELDING 3
Materials Performance and Characterization
Copyright by ASTM Int'l (all rights reserved); Fri Aug 14 09:36:56 EDT 2015Downloaded/printed byIndian Inst of Tech Chennai (Indian Inst of Tech Chennai) pursuant to License Agreement. No further reproductions authorized.

HEAT SOURCE FITTING (HSF) TOOL
Different heat source models available for the welding simulation are listed in
Table 1 [15]. More accurate results will require using more complex heat source
models. A heat source–fitting tool was used to determine the heat source parame-
ters. The double ellipsoidal model defined by Goldak and co-workers [16] was
used for simulating both continuous current and pulsed current tungsten inert
gas (TIG) welding (Fig. 2). The actual weld macrograph and thermal cycle col-
lected by using thermocouples at different locations are used for calibrating the
heat source parameters. The pulsing effect was given to the heat source by vary-
ing the heat intensity with time along the weld line. The cooling of the plate is
done by using convection with air and the convective heat-transfer coefficient
used are shown in Table 2.
As shown in the literature, the front half of the Goldak double ellipsoidal model
is the quadrant of one ellipsoidal heat source and the rear half is another quadrant
of the heat source. Equations 1–3 are used by Sysweld to define the power density
on the inside, the front, and the rear end, respectively [16].
FIG. 1
(a) 3D mesh of Ti plate
(120 mm�40 mm�5 mm) and
(b) mesh in the transition
region along with a magnified
version of the inset.
RAHUL AND PHANIKUMAR ON MICROSTRUCTURE WITH HAZ WELDING 4
Materials Performance and Characterization
Copyright by ASTM Int'l (all rights reserved); Fri Aug 14 09:36:56 EDT 2015Downloaded/printed byIndian Inst of Tech Chennai (Indian Inst of Tech Chennai) pursuant to License Agreement. No further reproductions authorized.

qf x; n; z; tð Þ ¼6ffiffiffi
32p
Qf
af bcpffiffiffi
pp � e
�3x2a2f � e
�3n2b2 � e�3z
2
c2(1)
qr x; n; z; tð Þ ¼ 6ffiffiffi
32p
Qr
arbcpffiffiffi
pp � e
�3x2a2r � e
�3n2b2 � e�3z
2
c2(2)
n ¼ y � v s� tð Þ(3)
where:
af, ar, b, c¼ the radial dimensions in front length, rear length, width of molten
zone, and depth of molten zone, respectively, and
Qf and Qr¼ the front and rear source intensity parameters, respectively. For
defining the position of the heat source at t¼ 0, we used t (the lag factor).
To achieve the best fit, the heat source parameters are varied in an iterative
manner.
TABLE 1
Classification of current welding heat source model [15].
Mode One Dimension Two Dimension Three Dimension
Uniform distribution mode Point heat source Plane heat source Columnar heat source
Line heat source Circular mode
Tripped heat source
Square heat source
Circular mode Circular disk heat source
Oval-shaped heat source Columnar heat source
Double oval-shaped heat source Cuboid heat source
Tripped heat source Rotary body heat source
Gaussian mode Conic heat source
Hemispherical heat source
Semi ellipsoidal heat source
Ellipsoidal heat source
Double ellipsoidal heat source
Exponential decay mode Exponential decay heat source
Dynamic heat source mode Composed of parabolic and Gaussian mode
FIG. 2
Goldak double ellipsoidal heat
source model [14].
RAHUL AND PHANIKUMAR ON MICROSTRUCTURE WITH HAZ WELDING 5
Materials Performance and Characterization
Copyright by ASTM Int'l (all rights reserved); Fri Aug 14 09:36:56 EDT 2015Downloaded/printed byIndian Inst of Tech Chennai (Indian Inst of Tech Chennai) pursuant to License Agreement. No further reproductions authorized.

The actual welding speed, 2.5mm/s, which will give the optimum weld quality,
is selected as the torch velocity and the welding variables taken from actual welding
condition [voltage 13.6V and current (for continuous current 150A and pulsed cur-
rent TIG peak current 190A and base current 110A)]. For giving the pulsing effect,
the intensity is varied according to the actual square wave that represents the varia-
tion of current. The pulsing effect is simulated for different frequencies (4 Hz and 6
Hz). The thermal cycles at different locations are plotted to determine the distance
beyond which the effect of pulsing in thermal cycle can be neglected. The thermal
cycle at different locations plotted for use as input to the physical simulation using
Gleeble are shown in Fig. 3(a)–3(c).
Experiments
Samples were made from rectangular plates of dimension 120mm by 25mm by
2mm with holes drilled at the ends according to the standard dimensions prescribed
in the Gleeble manual. The sample composition was verified using inductively
coupled plasma–optical emission spectrometry (ICP-OES) and energy dispersive
spectrometer (EDS) attachment to SEM. The composition measured in wt. % is
77.4 % Tiþ 13.7 % Vþ 3.5 % Alþ 1.9 % Crþ 3.5 % Sn.
In actual welding processes, the HAZ is narrow and difficult to study in detail.
By using Gleeble, one can simulate the HAZ to a large-scale sample. The high heat-
ing rate of welding can be easily achieved as the sample is heated by resistance. The
standard plate sample was taken and held using stainless steel or Cu grips based on
the required cooling rate as shown in Fig. 4. The temperature control is done by
TABLE 2
Convective heat-transfer coefficients used for simulation.
Temperature (�C) Convective Heat-Transfer Coefficient (W/m2/K)
20 60
100 60
200 65
300 205
400 290
500 370
600 450
700 490
800 505
900 530
1000 640
1200 900
1400 950
1600 975
2000 1000
2500 1100
3000 1150
4000 1175
RAHUL AND PHANIKUMAR ON MICROSTRUCTURE WITH HAZ WELDING 6
Materials Performance and Characterization
Copyright by ASTM Int'l (all rights reserved); Fri Aug 14 09:36:56 EDT 2015Downloaded/printed byIndian Inst of Tech Chennai (Indian Inst of Tech Chennai) pursuant to License Agreement. No further reproductions authorized.

using a B type thermocouple welded on the center of the sample using a thermocou-
ple spot-welding machine. To find the temperature variation from the center to the
ends of the sample, three thermocouples are welded at a distance of 10mm and
3mm from the center, respectively. The temperature variation between 63 mm is
less than 10�C.
FIG. 3
(a) Thermal cycle for 4-Hz
pulsed TIG at 8 and 10 mm from
center, (b) thermal cycle for 6-
Hz pulsed TIG at 8 and 10 mm
from center, and (c) thermal
cycle for continuous current
TIG at 8 and 10 mm from center.
RAHUL AND PHANIKUMAR ON MICROSTRUCTURE WITH HAZ WELDING 7
Materials Performance and Characterization
Copyright by ASTM Int'l (all rights reserved); Fri Aug 14 09:36:56 EDT 2015Downloaded/printed byIndian Inst of Tech Chennai (Indian Inst of Tech Chennai) pursuant to License Agreement. No further reproductions authorized.

To simulate realistic cycles, the table program in the Quick-Sim software
in-built in the Gleeble 3800 was used. The input data for these thermal cycles were
obtained from the Sysweld software. The sample is mounted on the standard jaw
with an argon atmosphere in the pocket jaw module. First sample is solutionized at
800�C for 15min. To avoid the thermocouple detachment at high temperatures, we
used bonding cement at the thermocouple junction. The programmed HAZ cycle
was simulated at the zero force condition.
The simulated samples are characterized using optical and electron microscopy.
Backscattered electron (BSE) imaging and secondary electron (SE) imaging are car-
ried out in FEI quanta 400 and Inspect F interfaced with a TSL–OIM EBSD analysis
system and a high-speed Hikari camera. The sample is mechanically and electrolyti-
cally polished for EBSD analysis. The EBSD maps are obtained with a step size of
1 or 0.1 lm and indexing both a and b phases. In the orientation maps, different col-
ors represent the different crystallographic orientations of respective phases in the
sample. The samples were mechanically polished and etched with Kroll’s reagent for
5 to 10 s for SEM-BSE imaging. Transmission electron microscopy (TEM) was con-
ducted for selected samples to verify the precipitate phase.
Microhardness testing was carried in the simulated sample with a load of 500 g
and a dwell time of 15 s. The TIG-welded Ti-15-3 plates are taken and the transverse
cross section is polished and macro-etched. The macrograph is used for calibrating
the HSF and comparing the simulated profiles.
Results
Figure 5(a) and 5(b) show the isometric view of maximum temperature contour and
torch moving in the simulated sample. To find the weld pool geometry, the liquidus
temperature of the alloy is taken as 1659�C. Figure 6 shows the comparison of weld
pool geometry and actual weld geometry (section taken at the center along the weld
line and the red line in the macrograph indicating the fusion zone boundary). The
peak temperature for the actual thermal cycle and simulated thermal cycle at a dis-
tance of 9mm from the center of weldment is compared and found to be satisfac-
tory. The pulsing effect on the thermal cycle is nullified between 9 to 9.25mm and
8.5 to 9mm in the 4Hz and 6Hz pulsed condition, respectively.
FIG. 4
Mounting of the sample in
standard jaws on the
thermomechanical simulator.
RAHUL AND PHANIKUMAR ON MICROSTRUCTURE WITH HAZ WELDING 8
Materials Performance and Characterization
Copyright by ASTM Int'l (all rights reserved); Fri Aug 14 09:36:56 EDT 2015Downloaded/printed byIndian Inst of Tech Chennai (Indian Inst of Tech Chennai) pursuant to License Agreement. No further reproductions authorized.

The thermal profile of the HAZ shown in Fig. 3 is then used as input for HAZ
simulation in the plate sample using Gleeble 3800. Figure 7 shows the thermal profile
of the simulated sample and the programmed thermal cycle. Both are comparable,
and the pulsing effect in the thermal cycle is followed by the actual thermal cycle on
the simulated sample (reading from thermocouple TC1).
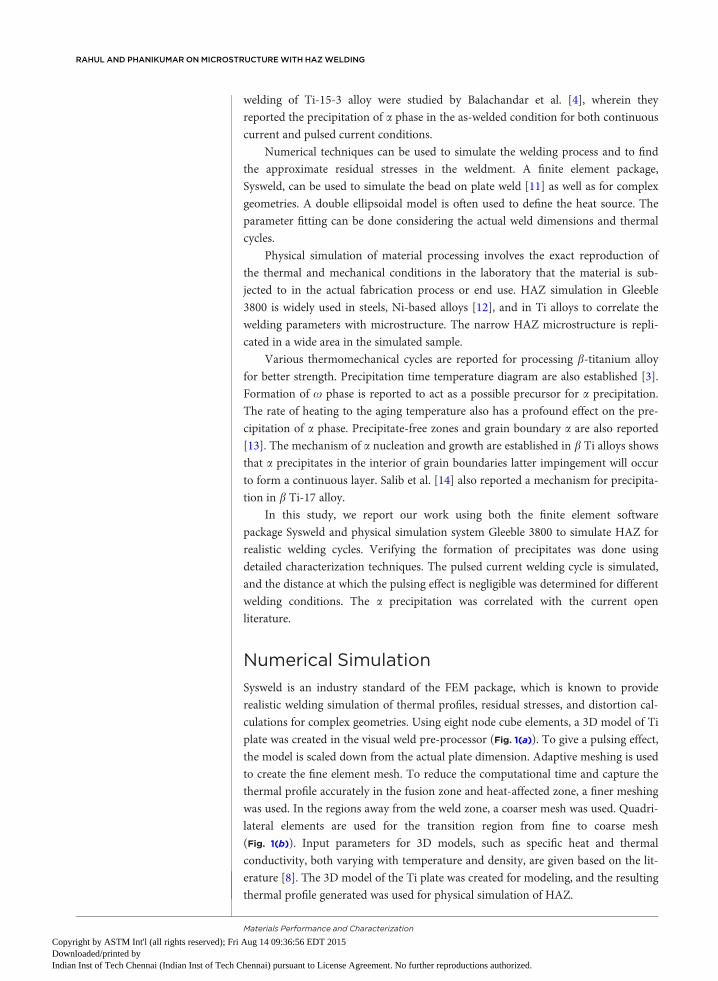
Figure 8 shows the SEM-BSE image for the HAZ-simulated sample at various
conditions. BSE images show that most of the grain-boundary precipitates are
originating at the triple junction rather than the middle of the grain boundary. The
SEM-EDS point analysis shows that there is an enrichment of tin and depletion of
vanadium in the grain boundaries where the precipitates are formed (Fig. 9). To con-
firm the precipitates, TEM was used. As can be seen in Fig. 10, some of the precipi-
tates are of nanoscale. These are beyond the resolution limit of the SEM-EBSD used
in this study. The EBSD analysis shows (Figs. 11 and 12) that the proportion of a pre-
cipitates seems to vary across different b grains and not uniformly distributed
throughout the sample. However, in the grains where the precipitation was observed,
it was uniformly distributed within the grain. It is observed that the grain size for
the HAZ-simulated sample is large and of the order of 80 to 200lm. The EBSD ori-
entation image shows the variation of microstructure in pulsed thermal cycles and
continuous thermal cycles. It is clear from EBSD orientation image that the grain
FIG. 5
(a) Isometric view max
temperature contour of 4-Hz
pulsed weld and (b) torch
moving in continuous current
TIG welding.
RAHUL AND PHANIKUMAR ON MICROSTRUCTURE WITH HAZ WELDING 9
Materials Performance and Characterization
Copyright by ASTM Int'l (all rights reserved); Fri Aug 14 09:36:56 EDT 2015Downloaded/printed byIndian Inst of Tech Chennai (Indian Inst of Tech Chennai) pursuant to License Agreement. No further reproductions authorized.

boundaries in most of the conditions are decorated by the a precipitates. The precip-
itates are not uniformly distributed along grains (Figs. 11 and 12).
The measured microhardness data is shown in Table 3. It can be noted that sam-
ples with coarser b grain size have lesser hardness. The increased hardness in 8mm,
and the 4-Hz pulsed thermal cycle is attributed to the formation of precipitates.
Samples showing significant a precipitation exhibited higher hardness. The large
scatter in the hardness data is attributed to the inhomogeneous distribution of a pre-
cipitation across different b grains in the sample. In case of a 4-Hz pulsed current
condition, the microhardness values are more at 8mm compared to 10mm away
from the weld centerline—likely because of a combination of pulsing and a longer
stay at higher temperatures similar to the continuous current 8-mm thermal cycle.
Discussion
Because of low thermal diffusivity of b Ti alloys, the diffusion distance for the melt-
ing portion in welding need to be calculated. In pulsed welding, it is reported that
there exists a combination of diffusion distance, and the distance traversed by the
torch in one cycle of the pulse will cause accumulation of heat in HAZ and lead to a
high thermal gradient [4]. Such a coupling phenomenon will affect the microstruc-
ture and plays a role in the post-weld heat treatment. In Sysweld simulation, we
observed that the distance up to which the pulsing effect is pronounced decreases
with increase in pulsing frequency.
FIG. 6
Comparison of actual weld
geometry and simulated weld
geometry for (a) continuous
current and (b) pulsed current
4-Hz TIG welding.
RAHUL AND PHANIKUMAR ON MICROSTRUCTURE WITH HAZ WELDING 10
Materials Performance and Characterization
Copyright by ASTM Int'l (all rights reserved); Fri Aug 14 09:36:56 EDT 2015Downloaded/printed byIndian Inst of Tech Chennai (Indian Inst of Tech Chennai) pursuant to License Agreement. No further reproductions authorized.

The literature reports various studies on b Ti alloys that agree that a precipita-
tion occurs at the grain boundaries and then in the interior of the grains. On isother-
mal aging, the precipitates formed along the grain boundaries will grow to a critical
width, and beyond that they will change over to Widmanstatten morphology. From
the SEM-BSE imaging, it is clear that the precipitation starts at the triple junction of
grain boundaries rather than the center of grain boundaries.
In the Fig. 13, a schematic superposition of a weld cooling cycle and a continu-
ous cooling transformation (CCT) diagram of metastable b-titanium alloy is shown.
As can be noted, the cooling curve crosses the curves for the initiation of grain
boundary a phase before the grain interior a phase for almost any cooling rate
that could be chosen. This possibility is corroborated by the experimental characteri-
zation results described above. Whereas isothermal heat treatment comprised of var-
ious steps and holding times could perhaps rid the grain boundary a phase
formation, it is clear here that such a possibility is not offered by the weld-cooling
cycles. Choice of the welding process conditions based on the final microstructure
and mechanical properties should take this aspect into account.
FIG. 7
Graph showing the
thermocouple reading from
simulated sample (TC1) and
program temperature at (a)
8 mm from center in 4-Hz
pulsed and (b) 10 mm from
center in continuous current
TIG welding.
RAHUL AND PHANIKUMAR ON MICROSTRUCTURE WITH HAZ WELDING 11
Materials Performance and Characterization
Copyright by ASTM Int'l (all rights reserved); Fri Aug 14 09:36:56 EDT 2015Downloaded/printed byIndian Inst of Tech Chennai (Indian Inst of Tech Chennai) pursuant to License Agreement. No further reproductions authorized.
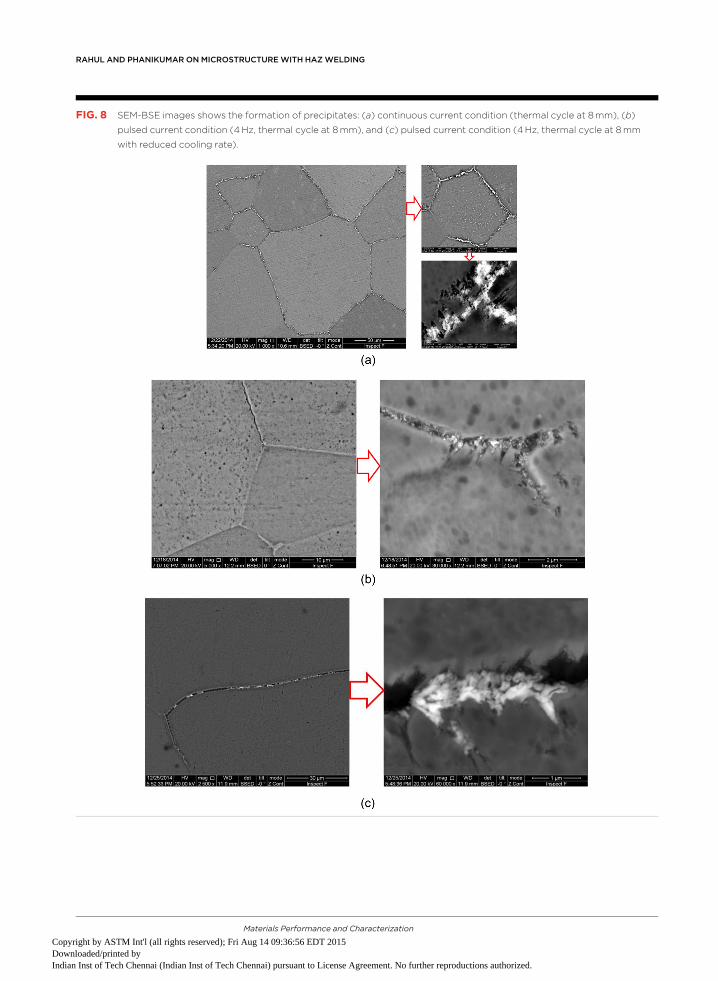
FIG. 8 SEM-BSE images shows the formation of precipitates: (a) continuous current condition (thermal cycle at 8 mm), (b)
pulsed current condition (4 Hz, thermal cycle at 8 mm), and (c) pulsed current condition (4 Hz, thermal cycle at 8 mm
with reduced cooling rate).
RAHUL AND PHANIKUMAR ON MICROSTRUCTURE WITH HAZ WELDING 12
Materials Performance and Characterization
Copyright by ASTM Int'l (all rights reserved); Fri Aug 14 09:36:56 EDT 2015Downloaded/printed byIndian Inst of Tech Chennai (Indian Inst of Tech Chennai) pursuant to License Agreement. No further reproductions authorized.

FIG. 9
SEM-EDS point analysis.
FIG. 10
TEM image showing the
precipitates.
RAHUL AND PHANIKUMAR ON MICROSTRUCTURE WITH HAZ WELDING 13
Materials Performance and Characterization
Copyright by ASTM Int'l (all rights reserved); Fri Aug 14 09:36:56 EDT 2015Downloaded/printed byIndian Inst of Tech Chennai (Indian Inst of Tech Chennai) pursuant to License Agreement. No further reproductions authorized.

FIG. 11 EBSD image showing the formation of precipitates.
FIG. 12 EBSD image showing the formation of precipitates on triple point (8-mm continuous current condition).
RAHUL AND PHANIKUMAR ON MICROSTRUCTURE WITH HAZ WELDING 14
Materials Performance and Characterization
Copyright by ASTM Int'l (all rights reserved); Fri Aug 14 09:36:56 EDT 2015Downloaded/printed byIndian Inst of Tech Chennai (Indian Inst of Tech Chennai) pursuant to License Agreement. No further reproductions authorized.

Workflow in the Accelerated Design
of New Alloys
Workflows [17] are important tools to visualize the larger picture in the integrated
design of new materials. Figure 14 shows a typical legacy workflow in the choice of
the welding process and its parameters and a suggested modification. The forward
direction illustrates the parametric experimental studies that start off with a choice
of the welding technique and process parameters. Thermocouples or infrared pyro-
meters are used to estimate actual thermal profiles that prevail in the vicinity of the
weld. Experimental logistics often limit how close to the weld line and at how many
different locations one could capture the thermal profiles. These are then used as
input parameters for HAZ simulations in Gleeble to obtain larger samples that could
be characterized in detail for microstructure and mechanical properties. The reverse
direction illustrates the choice of the welding technique and process parameters
from the performance characteristics that come from the design of the product. The
large number of experiments that form part of the forward problem renders
TABLE 3
Microhardness and average grain size at various thermal cycles.
Thermal Cycle Microhardness (HV0.5) Average Grain Size (mm)
Continuous current TIG, 8mm 292.326 56 139
Continuous current TIG, 10mm 237.736 23.7 110
4Hz pulsed current TIG, 8mm 268.176 41.4 159
4Hz pulsed current TIG, 10mm 243.866 16.12 108
6Hz pulsed current TIG, 8mm 248.196 25.16 140
6Hz pulsed current TIG, 10mm 246.16 18.7 80
Low cooling rate cycle (4Hz), 8mm 258.816 15.1 176
Solution-treated condition 2596 18.7 96
FIG. 13
Schematic representation of
weld cooling cycle and
continuous cooling
transformation (CCT) curve
plotted in JMAT pro with
composition 75.95 wt. %
Tiþ2.91 wt. % Alþ3.06 wt. %
Crþ 14.79wt. % Vþ3.03wt. % Sn.
RAHUL AND PHANIKUMAR ON MICROSTRUCTURE WITH HAZ WELDING 15
Materials Performance and Characterization
Copyright by ASTM Int'l (all rights reserved); Fri Aug 14 09:36:56 EDT 2015Downloaded/printed byIndian Inst of Tech Chennai (Indian Inst of Tech Chennai) pursuant to License Agreement. No further reproductions authorized.

the parametric space for the design choice large enough that soft computing tools
are being resorted to [18].
In view of the strong link between the thermal profiles and the phase evolution
that could be determined using CCT curves obtained from materials thermodynam-
ics and kinetics software such as JMatPro, we suggest that the workflow could be in
two segments. This is illustrated as a modified workflow in Fig. 14. The parametric
experimental studies using different welding techniques and process parameters
could be coupled with weld-simulation software to determine the model parameters
that are calibrated for accurate reproduction of experimentally observed thermal
profiles. Considering the maturity of the weld-simulation software commercially
available, one can then assume that the thermal profiles given as output from these
tools are reasonable and accurate. Once the model parameters are available, welds of
any complex geometry could be taken up in the computer simulation and thermal
profiles at any location could be obtained. These can then be parameterized based
on the premise that such thermal profiles are not of arbitrary steps and durations as
possible in post-weld heat treatment but are of (nearly) exponentially decaying in
FIG. 14
Schematic workflow for
integrated approach toward
the design of new alloys for
weldability. Legacy and
suggested workflows are given.
RAHUL AND PHANIKUMAR ON MICROSTRUCTURE WITH HAZ WELDING 16
Materials Performance and Characterization
Copyright by ASTM Int'l (all rights reserved); Fri Aug 14 09:36:56 EDT 2015Downloaded/printed byIndian Inst of Tech Chennai (Indian Inst of Tech Chennai) pursuant to License Agreement. No further reproductions authorized.

nature optionally superposed with thermal oscillations that arise from the nature of
the heat source (arc/beam, continuous/pulsed) used. These profiles can be used
along with thermodynamic and kinetic software to determine the likely microstruc-
ture in the weldment. In the absence of thermodynamic or kinetic data or for verifi-
cation of microstructure evolution in known alloys, a controlled set of physical
simulations could be performed using a thermomechanical simulator such as Glee-
ble. Though this scheme leads to the reverse problem into two stages, it is expected
that the parametric space is considerably reduced to make the design choices signifi-
cantly easier. It is believed that such a workflow with the strong coupling between
the thermal profiles and thermo-kinetic simulations playing a pivotal role would
help design new alloys for weldability in an accelerated manner.
Conclusions
An integrated study of the welding process can be performed using a combination of
Sysweld software simulation and physical simulations using Gleeble. In the Ti-15-3
alloy, the grain boundary precipitates formed in all the welding cycles simulated.
The amount of a precipitates formed depends on the thermal cycle, which is sensi-
tive to the pulse frequency and the distance away from the weld centerline. Inhomo-
geneous precipitation of a phase across different b grains led to large scatter in the
hardness profile. These aspects lead to an increase in the uncertainty of mechanical
response predictions and should be taken into account in the design process. A
modified workflow is suggested where the thermal profile and thermo-kinetic simu-
lations play a pivotal role, and the process parameter space to be explored for the
reverse problem of design could be reduced significantly.
ACKNOWLEDGMENTS
The writers thank the Department of Science and Technology, Government of India
and Centre for Industrial Consultancy & Sponsored Research Indian Institute of
Technology (ISRO-IITM) Cell for financial support through two projects
that enabled acquisition of the resources used in this project. M.R.R. thanks
Mr. Abhishek Kumar for assistance in experimentation.
References
[1] Schubert, E., Klassen, M., Zerner, I., Walz, C., and Sepold, G., “Light Weight
Structures Produced by Laser Beam Joining for Future Applications in Auto-
mobile and Aerospace Industry,” J. Mater. Proc. Technol., Vol. 115, No. 1,
2001, pp. 2–8.
[2] Williams, J. C., Hickman, B. S., and Leslie, D. S., “The Effect of Ternary Addi-
tions on the Decomposition of Metastable Beta-Phase Titanium Alloys,”Metall.
Trans., Vol. 2, No. 2, 1971, pp. 477–484.
[3] Furuhara, T., Maki, T., and Makino, T., “Microstructure Control by Thermo-
mechanical Processing in b-Ti-15-3 Alloy,” J. Mater. Proc. Technol., Vol. 117,
No. 3, 2001, pp. 318–323.
[4] Balachandar, K., Sarma,V. S., Pant, B., and Phanikumar, G., “Microstructure
and Mechanical Properties of Gas–Tungsten–Arc-Welded Ti-15-3 Beta Tita-
nium Alloy,” Metall. Trans. A, Vol. 40, No. 11, 2009, pp. 2685–2693.
RAHUL AND PHANIKUMAR ON MICROSTRUCTURE WITH HAZ WELDING 17
Materials Performance and Characterization
Copyright by ASTM Int'l (all rights reserved); Fri Aug 14 09:36:56 EDT 2015Downloaded/printed byIndian Inst of Tech Chennai (Indian Inst of Tech Chennai) pursuant to License Agreement. No further reproductions authorized.

[5] Eylon, D., Boyer, R. R., Koss, D. A., and Bania, P. J., “Beta Titanium Alloys in
the 1990’s,” The Minerals, Metals & Materials Society (TMS), Warrendale, PA,
1993.
[6] Becker, D. W. and Baeslack, W. A., III, “Property-Microstructure Relationships
in Metastable-Beta Titanium Alloy Weldments,” Welding Res. Suppl., Vol. 59,
March, 1980, pp. 85s–92s.
[7] Donachie, M. J., Jr., “Ti-15V-3Cr-3Al-3Sn,” Titanium—A Technical Guide, 2nd
ed., ASM International, Materials Park, OH, 2000, p. 70.
[8] Boyer, R., Welsch, G., and Collings, E. W., “Ti-15V-3Cr-3Al-3Sn,” Materials
Properties Handbook: Titanium Alloys, ASM International, Materials Park, OH,
2007, pp. 899–920.
[9] Baeslack, W. A., III, Liu, P. S., and Paskell, T., “Weld Solidification and HAZ
Liquation in a Metastable-Beta Titanium Alloy-Beta-21S,” Mater. Character.,
Vol. 30, No. 2, 1993, pp. 147–154.
[10] Pasang, T., Sanchez Amaya, J. M., Tao, Y., Amaya-Vazquez, M. R., Botana,
F. J., Sabol, J. C., Misiolek, W. Z., and Kamiya, O., “Comparison of Ti-5Al-5V-
5Mo-3Cr Welds Performed by Laser Beam, Electron Beam and Gas Tungsten
Arc Welding,” Proc. Eng., Vol. 63, 2013, pp. 397–404.
[11] Bate, S. K., Charles, R., and Warren, A., “Finite Element Analysis of a Single
Bead-on-Plate Specimen Using SYSWELD,” Int. J. Pres. Ves. Pip., Vol. 86, No.
1, 2009, pp. 73–78.
[12] Ojo, O. A. and Chaturvedi, M. C., “On the Role of Liquated c0 Precipitates in
Weld Heat Affected Zone Microfissuring of a Nickel-Based Superalloy,” Mater.
Sci. Eng. A, Vol. 403, Nos. 1–2, 2005, pp. 77–86.
[13] Santhosh, R., Geetha, M., Saxena, V. K., and Nageswararao, M., “Studies on
Single and Duplex Aging of Metastable Beta Titanium Alloy Ti–15V–3Cr–3-
Al–3Sn,” J. Alloy Compd., Vol. 605, August 25, 2014, pp. 222–229.
[14] Salib, M., Teixeira, J., Germain, L., Lamielle, E., Gey, N., and Aeby-Gautier, E.,
“Influence of Transformation Temperature on Microtexture Formation Associ-
ated With a Precipitation at b Grain Boundaries in a b Metastable Titanium
Alloy,” Acta Mater., Vol. 61, No. 10, 2013, pp. 3758–3768.
[15] Zhang, T., Zheng, Z., and Zhao, R., “A Dynamic Welding Heat Source Model
in Pulsed Current Gas Tungsten Arc Welding,” J. Mater. Proc. Technol.,
Vol. 213, No. 12, 2013, pp. 2329–2338.
[16] Goldak, J., Chakravarti, A., and Bibby, M., “A New Finite Element Model for
Welding Heat Sources,”Metall. Trans. B, Vol. 15, No. 2, 1984, pp. 299–305.
[17] Panchal, J. H., Kalidindi, S. R., and McDowell, D. L., “Key Computational Mod-
eling Issues in Integrated Computational Materials Engineering,” Comput.
Aided Design, Vol. 45, No. 1, 2013, pp. 4–25.
[18] Tancret, F., “Computational Thermodynamics, Gaussian Processes and Genetic
Algorithms: Combined Tools to Design New Alloys,” Model. Simul. Mater. Sci.
Eng., Vol. 21, No. 4, 2013.
RAHUL AND PHANIKUMAR ON MICROSTRUCTURE WITH HAZ WELDING 18
Materials Performance and Characterization
Copyright by ASTM Int'l (all rights reserved); Fri Aug 14 09:36:56 EDT 2015Downloaded/printed byIndian Inst of Tech Chennai (Indian Inst of Tech Chennai) pursuant to License Agreement. No further reproductions authorized.