Embed Size (px)
Citation preview
Contents lists available at ScienceDirect
Materials Science & Engineering A
journal homepage: www.elsevier.com/locate/msea
Enhanced resistance of nanocellular silica to dynamic indentation
Cang Zhaoa,b, Yu Qiaoa,c,⁎
a Department of Structural Engineering, University of California - San Diego, La Jolla, CA 92093-0085, USAb X-ray Science Division, Argonne National Laboratory, Argonne, IL 60439, USAc Program of Materials Science and Engineering, University of California - San Diego, La Jolla, CA 92093, USA
A R T I C L E I N F O
Keywords:Cellular solidsPorositySize effectImpact behaviorIndentation
A B S T R A C T
Compared with solids, cellular materials are more lightweight yet usually weaker due to their large porosities. Inthe current study, it is discovered that the dynamic penetration resistance of nanocellular silica could beeffectively higher than that of solid silica when the cell size is smaller than ~100 nm. This phenomenon isattributed to the local hardening that happens when the cell size is sufficiently small and the cell collapse issufficiently fast. The finding paves a road to the development of strong and lightweight cellular materials.
1. Introduction
Cellular materials are solids containing large volume fractions ofempty cells [1,2]. They are widely applied for acoustic insulation,thermal management, catalytic reaction, drug delivery, energy storage,vibration damping, and impact and shock protection [3–7]. A fewexamples of cellular materials include woods [8,9], bones [10,11],carbon nanotube bundles [12], silica aerogels [13], expanded polymers[14,15], and cellular metals and ceramics [16–19]. They are morelightweight but typically softer and less penetration/indentation resis-tant than their solid counterparts.
According to the classical theory, the strength, Y, the hardness, H,the stiffness, E, and the toughness, Kc, of a cellular material are relatedto its porosity, c [1,2,20,21]:
Y H E K c( , , , )∝(1− )cα (1)
where α is a system constant ranging from 1 to 3; all of them areindependent of the cell size, d. In many applications, a low massdensity, ρ, is desirable and therefore, the porosity must be maximized[22,23], which however tends to weaken the material. While in somecases using weak cellular materials is acceptable, in general thematerial must exhibit a sufficiently high strength/hardness; otherwisethey cannot meet the increasingly high requirements on structuralintegrity [24]. In fact, because ρ∝(1-c) and H∝(1-c)α, very often theporosity has to be sacrificed to reach the required strength/hardness;these cellular materials are bulky, heavy, and of low performance[25,26].
Over the years, people were searching for solutions of lightweightand hard/strong cellular materials. Particularly, under the most critical
loading conditions, i.e. when the material is impacted, the classicalrelationship of H∝(1-c)α should be broken down. A number ofbeneficial size effects on the nanometer (nm) scale were investigatedfor carbon nanotubes [27], nanopillars [28], and nanowires [29]. Theyhave excellent strengths compared with bulk materials, thanks to thelow defect density and the beneficial surface phenomena. However,they are small-sized. When they collectively form large cellularstructures, e.g. carbon nanotube forests [30], the dominant deforma-tion mechanisms would change and the nm-scale strength may not beproportionally amplified. Nanoporous gold has demonstrated a higherstrength than solid gold [31,32], due to the hardening effect associatedwith the small ligament length; yet, this mechanism is most efficientwhen the network material is inherently soft and ductile. No conclusiveresults have been obtained for monolithic cellular materials havingintrinsically hard ligaments.
2. Experimental
2.1. Sample processing
Cellular silica samples were fabricated via two sol-gel approaches[33–35]: One for average cell sizes smaller than 500 nm [33]; the otherfor average cell sizes on the microscopic scale. The cellular morphologywas conditioned by a subcritical calcination (SCC) technique [36]. Thedetails of sample processing have been documented elsewhere [36].
For the first sol-gel method, Sigma-Aldrich Ludox HS-40 colloidalsilica and PQ Kasil-1 potassium silicate solution, with the total mass of800 g and the mass ratio in the range from 5:95 to 40:60, were mixedtogether through magnetic stirring for 30 min. The larger the amount
http://dx.doi.org/10.1016/j.msea.2017.03.091Received 16 March 2017; Accepted 23 March 2017
⁎ Corresponding author at: Department of Structural Engineering, University of California - San Diego, La Jolla, CA 92093-0085, USA.E-mail address: [email protected] (Y. Qiao).
Materials Science & Engineering A 693 (2017) 121–128
Available online 24 March 20170921-5093/ © 2017 Elsevier B.V. All rights reserved.
MARK
of the colloidal silica, the smaller the cell size would be. Next, aqueoussolution of formamide (200 g, 40 wt%) was slowly added, and thestirring continued for another 30 min. After that, the solution waspoured into a set of polypropylene plastic vials having the innerdiameter of 36 mm and the height of 16 mm. After aging for 24 h atroom temperature, the wet gels were thoroughly rinsed by a sequentialsolutions at ~90 °C: ammonium nitrate (1 M), nitric acid (1 M), anddeionized water. Finally, they were washed by pure methanol at roomtemperature.
For the second method, Sigma-Aldrich polyethylene glycol (PEG,32 g) with the average molecular weight of 10,000 was dissolved inaqueous solution of acetic acid (300 ml, 0.01 M). Then, tetramethylorthosilicate (TMOS, 99%, 150 ml) ordered from Sigma-Aldrich wasadded under magnetic stirring. After mixing for 30 min, the solutionwas transported into a set of polypropylene plastic vials having theinner diameter of 46 mm and the height of 22 mm. After aging at 40 °Cfor 3 days, the wet gels were sequentially rinsed by aqueous ammoniasolution (0.1 M) at ~120 °C, then by nitric acid (0.1 M) and deionizedwater at ~90 °C, and eventually by pure methanol at room tempera-ture.
In both approaches, every step of the washing process was repeatedfor at least five times. After that, the solid gels were vacuum dried in anoven (VWR 1330GM) at 80 °C for 3 days. The obtained silica monolithswere fired in a horizontal tube furnace (MTI GSL-1700X) at selectedSCC temperatures (1200 °C≤Ts ≤1260 °C) for 1 h. The initial ramp ratewas set to be 3 °C min−1; when the temperature was raised to 100 °Cbelow Ts, the ramp rate was reduced to 1 °C min−1. After SCC, thecooling rate was set as 3 °C min−1. Solid silica disks were employed asreference samples. They were processed through a similar procedure,but were fired at 1250 °C for 12 h.
The SCC-treated silica samples were polished to remove the surfacelayers by a set of silicon carbide sandpapers [37,38]: 320-grit first, then600-grit, 1200-grit, and eventually 2500-grit. Before the SCC treat-ment, the sample thickness was 10–14 mm; after the calcination, thethickness shrank to 7–9 mm. The sample thickness after each step ofpolishing was 5–6 mm, 5.0 mm, 4.75 mm, and 4.50 mm, respectively.The fabrication conditions of cellular and solid silica samples aresummarized in Table 1.
2.2. Sample characterization
The porosity of cellular silica sample was defined as the percentageof volume of empty cells over the total sample volume [1]. It wascalculated from the mass density: c=1-ρ/ρn, where ρ is the samplemass density and ρn=2.2 g cm−3 is the density of solid amorphoussilica. Through mercury porosimetry [36], the cell size was estimatedfrom the well-established Washburn equation [36]: d=4σ·cosθ/PHg,where σ=0.484 N m−1 is the surface tension of mercury, θ~140° is thecontact angle, and PHg is the measured mercury infiltration pressure.The measurement results of porosity and cell size are listed in Table 1.
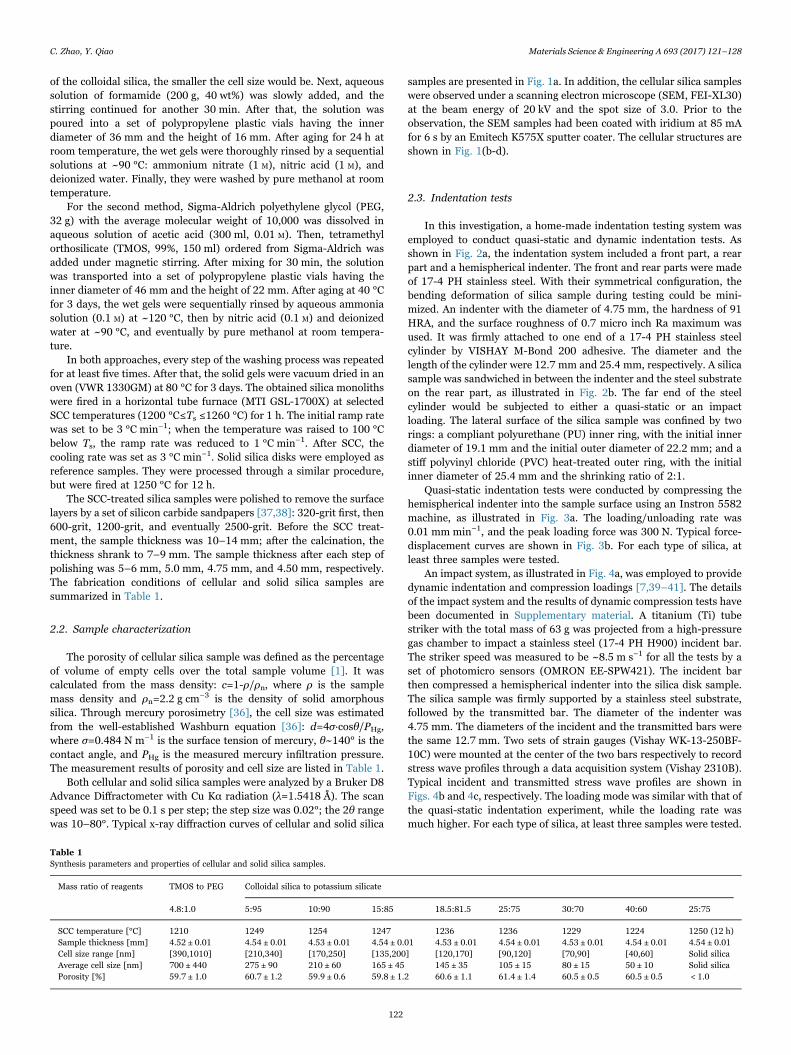
Both cellular and solid silica samples were analyzed by a Bruker D8Advance Diffractometer with Cu Kα radiation (λ=1.5418 Å). The scanspeed was set to be 0.1 s per step; the step size was 0.02°; the 2θ rangewas 10–80°. Typical x-ray diffraction curves of cellular and solid silica
samples are presented in Fig. 1a. In addition, the cellular silica sampleswere observed under a scanning electron microscope (SEM, FEI-XL30)at the beam energy of 20 kV and the spot size of 3.0. Prior to theobservation, the SEM samples had been coated with iridium at 85 mAfor 6 s by an Emitech K575X sputter coater. The cellular structures areshown in Fig. 1(b-d).
2.3. Indentation tests
In this investigation, a home-made indentation testing system wasemployed to conduct quasi-static and dynamic indentation tests. Asshown in Fig. 2a, the indentation system included a front part, a rearpart and a hemispherical indenter. The front and rear parts were madeof 17-4 PH stainless steel. With their symmetrical configuration, thebending deformation of silica sample during testing could be mini-mized. An indenter with the diameter of 4.75 mm, the hardness of 91HRA, and the surface roughness of 0.7 micro inch Ra maximum wasused. It was firmly attached to one end of a 17-4 PH stainless steelcylinder by VISHAY M-Bond 200 adhesive. The diameter and thelength of the cylinder were 12.7 mm and 25.4 mm, respectively. A silicasample was sandwiched in between the indenter and the steel substrateon the rear part, as illustrated in Fig. 2b. The far end of the steelcylinder would be subjected to either a quasi-static or an impactloading. The lateral surface of the silica sample was confined by tworings: a compliant polyurethane (PU) inner ring, with the initial innerdiameter of 19.1 mm and the initial outer diameter of 22.2 mm; and astiff polyvinyl chloride (PVC) heat-treated outer ring, with the initialinner diameter of 25.4 mm and the shrinking ratio of 2:1.
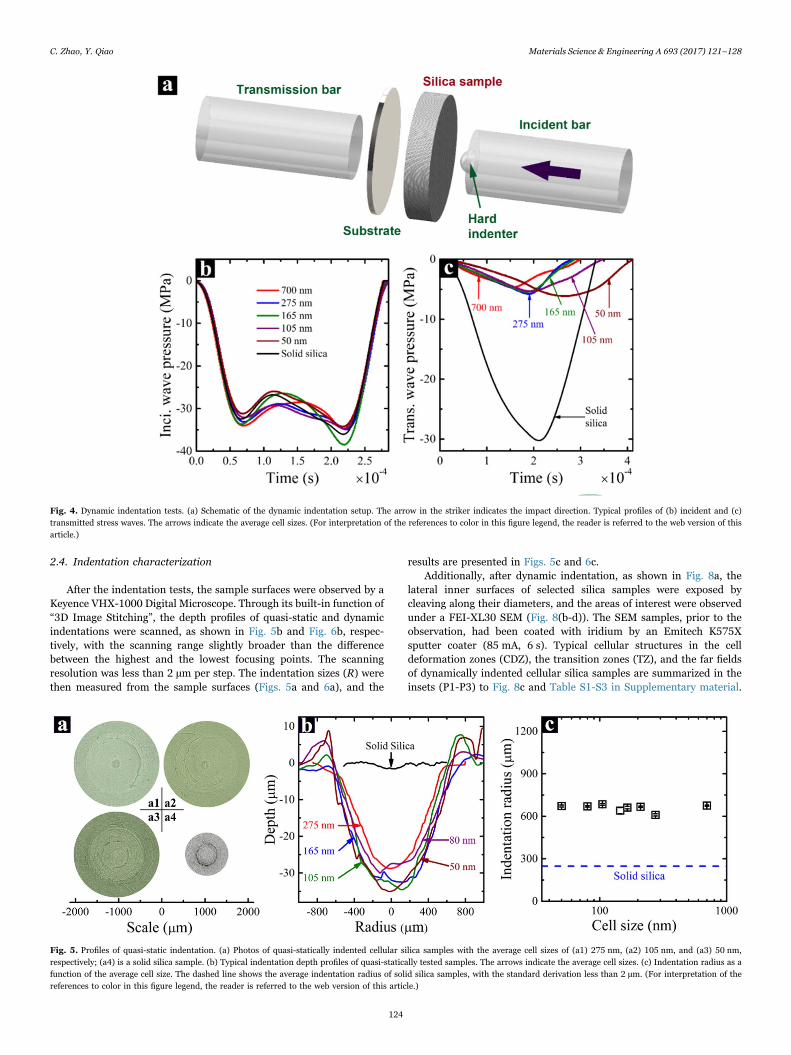
Quasi-static indentation tests were conducted by compressing thehemispherical indenter into the sample surface using an Instron 5582machine, as illustrated in Fig. 3a. The loading/unloading rate was0.01 mm min−1, and the peak loading force was 300 N. Typical force-displacement curves are shown in Fig. 3b. For each type of silica, atleast three samples were tested.
An impact system, as illustrated in Fig. 4a, was employed to providedynamic indentation and compression loadings [7,39–41]. The detailsof the impact system and the results of dynamic compression tests havebeen documented in Supplementary material. A titanium (Ti) tubestriker with the total mass of 63 g was projected from a high-pressuregas chamber to impact a stainless steel (17-4 PH H900) incident bar.The striker speed was measured to be ~8.5 m s−1 for all the tests by aset of photomicro sensors (OMRON EE-SPW421). The incident barthen compressed a hemispherical indenter into the silica disk sample.The silica sample was firmly supported by a stainless steel substrate,followed by the transmitted bar. The diameter of the indenter was4.75 mm. The diameters of the incident and the transmitted bars werethe same 12.7 mm. Two sets of strain gauges (Vishay WK-13-250BF-10C) were mounted at the center of the two bars respectively to recordstress wave profiles through a data acquisition system (Vishay 2310B).Typical incident and transmitted stress wave profiles are shown inFigs. 4b and 4c, respectively. The loading mode was similar with that ofthe quasi-static indentation experiment, while the loading rate wasmuch higher. For each type of silica, at least three samples were tested.
Table 1Synthesis parameters and properties of cellular and solid silica samples.
Mass ratio of reagents TMOS to PEG Colloidal silica to potassium silicate
4.8:1.0 5:95 10:90 15:85 18.5:81.5 25:75 30:70 40:60 25:75
SCC temperature [°C] 1210 1249 1254 1247 1236 1236 1229 1224 1250 (12 h)Sample thickness [mm] 4.52 ± 0.01 4.54 ± 0.01 4.53 ± 0.01 4.54 ± 0.01 4.53 ± 0.01 4.54 ± 0.01 4.53 ± 0.01 4.54 ± 0.01 4.54 ± 0.01Cell size range [nm] [390,1010] [210,340] [170,250] [135,200] [120,170] [90,120] [70,90] [40,60] Solid silicaAverage cell size [nm] 700 ± 440 275 ± 90 210 ± 60 165 ± 45 145 ± 35 105 ± 15 80 ± 15 50 ± 10 Solid silicaPorosity [%] 59.7 ± 1.0 60.7 ± 1.2 59.9 ± 0.6 59.8 ± 1.2 60.6 ± 1.1 61.4 ± 1.4 60.5 ± 0.5 60.5 ± 0.5 < 1.0
C. Zhao, Y. Qiao Materials Science & Engineering A 693 (2017) 121–128
122
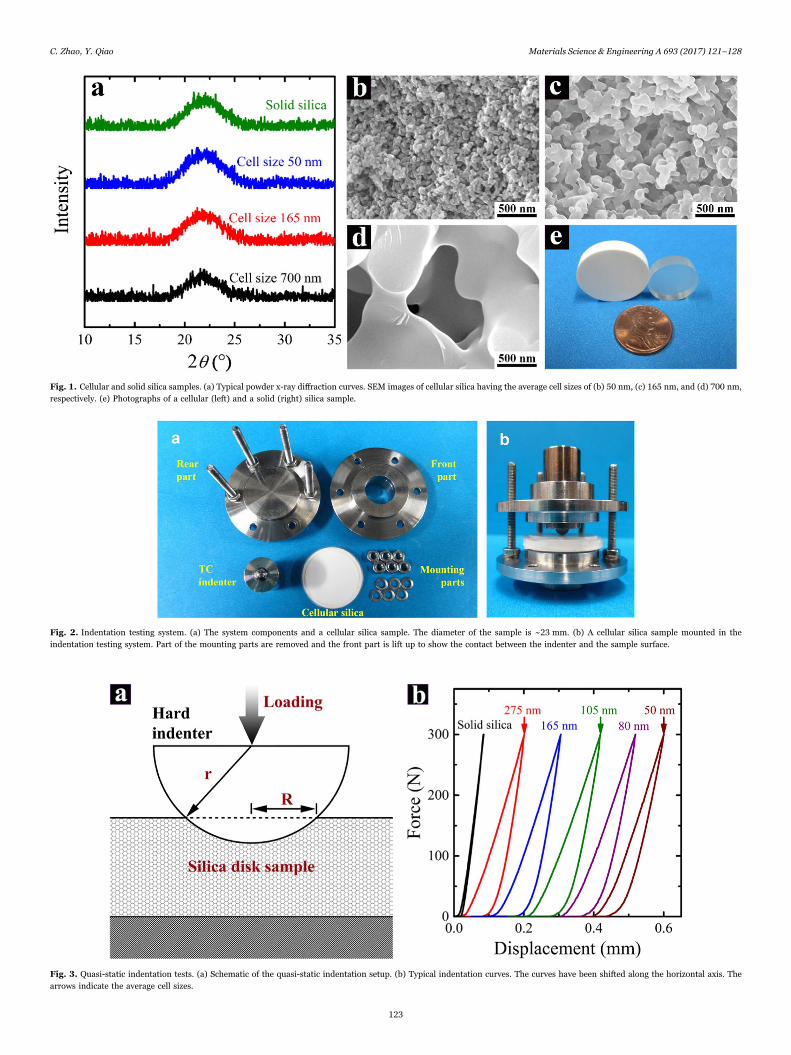
Fig. 1. Cellular and solid silica samples. (a) Typical powder x-ray diffraction curves. SEM images of cellular silica having the average cell sizes of (b) 50 nm, (c) 165 nm, and (d) 700 nm,respectively. (e) Photographs of a cellular (left) and a solid (right) silica sample.
Fig. 2. Indentation testing system. (a) The system components and a cellular silica sample. The diameter of the sample is ~23 mm. (b) A cellular silica sample mounted in theindentation testing system. Part of the mounting parts are removed and the front part is lift up to show the contact between the indenter and the sample surface.
Fig. 3. Quasi-static indentation tests. (a) Schematic of the quasi-static indentation setup. (b) Typical indentation curves. The curves have been shifted along the horizontal axis. Thearrows indicate the average cell sizes.
C. Zhao, Y. Qiao Materials Science & Engineering A 693 (2017) 121–128
123
2.4. Indentation characterization
After the indentation tests, the sample surfaces were observed by aKeyence VHX-1000 Digital Microscope. Through its built-in function of“3D Image Stitching”, the depth profiles of quasi-static and dynamicindentations were scanned, as shown in Fig. 5b and Fig. 6b, respec-tively, with the scanning range slightly broader than the differencebetween the highest and the lowest focusing points. The scanningresolution was less than 2 µm per step. The indentation sizes (R) werethen measured from the sample surfaces (Figs. 5a and 6a), and the
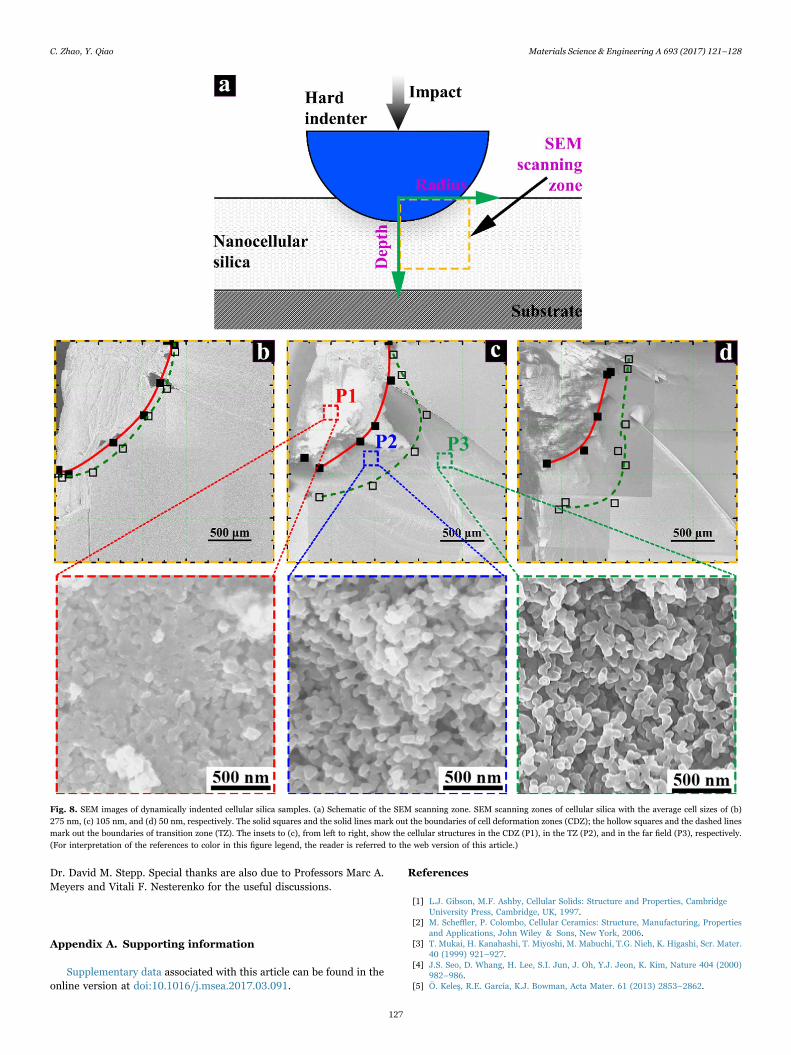
results are presented in Figs. 5c and 6c.Additionally, after dynamic indentation, as shown in Fig. 8a, the
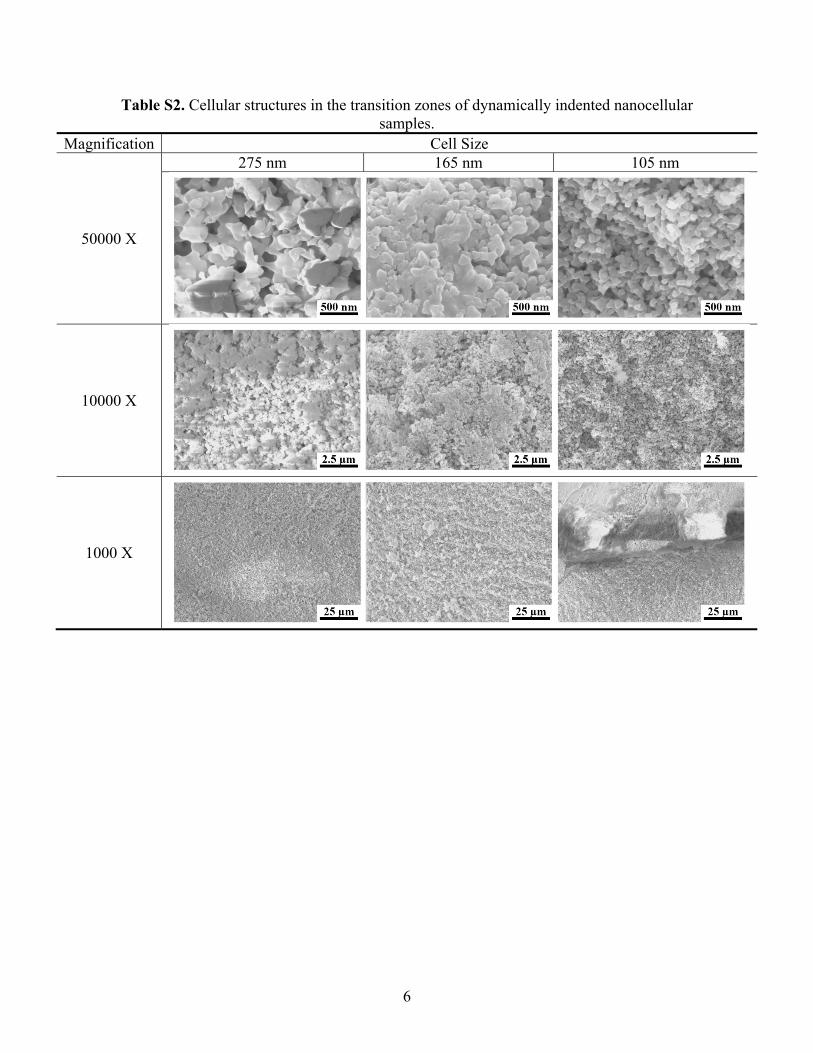
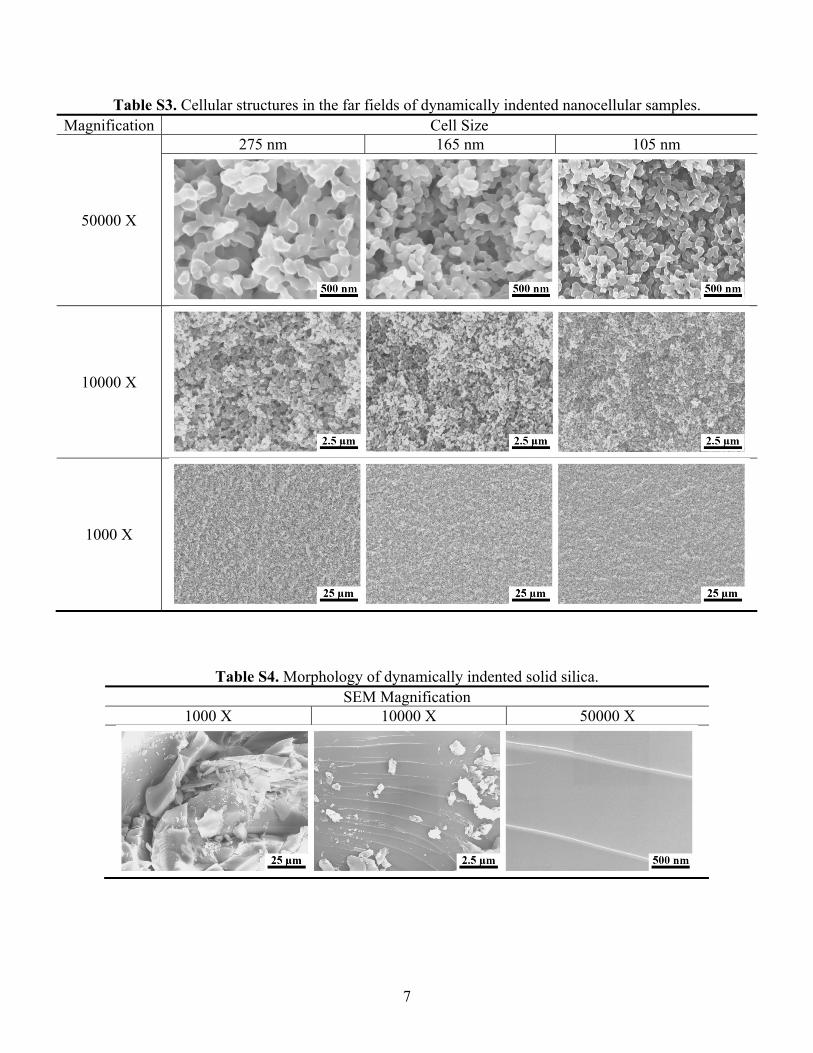
lateral inner surfaces of selected silica samples were exposed bycleaving along their diameters, and the areas of interest were observedunder a FEI-XL30 SEM (Fig. 8(b-d)). The SEM samples, prior to theobservation, had been coated with iridium by an Emitech K575Xsputter coater (85 mA, 6 s). Typical cellular structures in the celldeformation zones (CDZ), the transition zones (TZ), and the far fieldsof dynamically indented cellular silica samples are summarized in theinsets (P1-P3) to Fig. 8c and Table S1-S3 in Supplementary material.
Fig. 4. Dynamic indentation tests. (a) Schematic of the dynamic indentation setup. The arrow in the striker indicates the impact direction. Typical profiles of (b) incident and (c)transmitted stress waves. The arrows indicate the average cell sizes. (For interpretation of the references to color in this figure legend, the reader is referred to the web version of thisarticle.)
Fig. 5. Profiles of quasi-static indentation. (a) Photos of quasi-statically indented cellular silica samples with the average cell sizes of (a1) 275 nm, (a2) 105 nm, and (a3) 50 nm,respectively; (a4) is a solid silica sample. (b) Typical indentation depth profiles of quasi-statically tested samples. The arrows indicate the average cell sizes. (c) Indentation radius as afunction of the average cell size. The dashed line shows the average indentation radius of solid silica samples, with the standard derivation less than 2 µm. (For interpretation of thereferences to color in this figure legend, the reader is referred to the web version of this article.)
C. Zhao, Y. Qiao Materials Science & Engineering A 693 (2017) 121–128
124
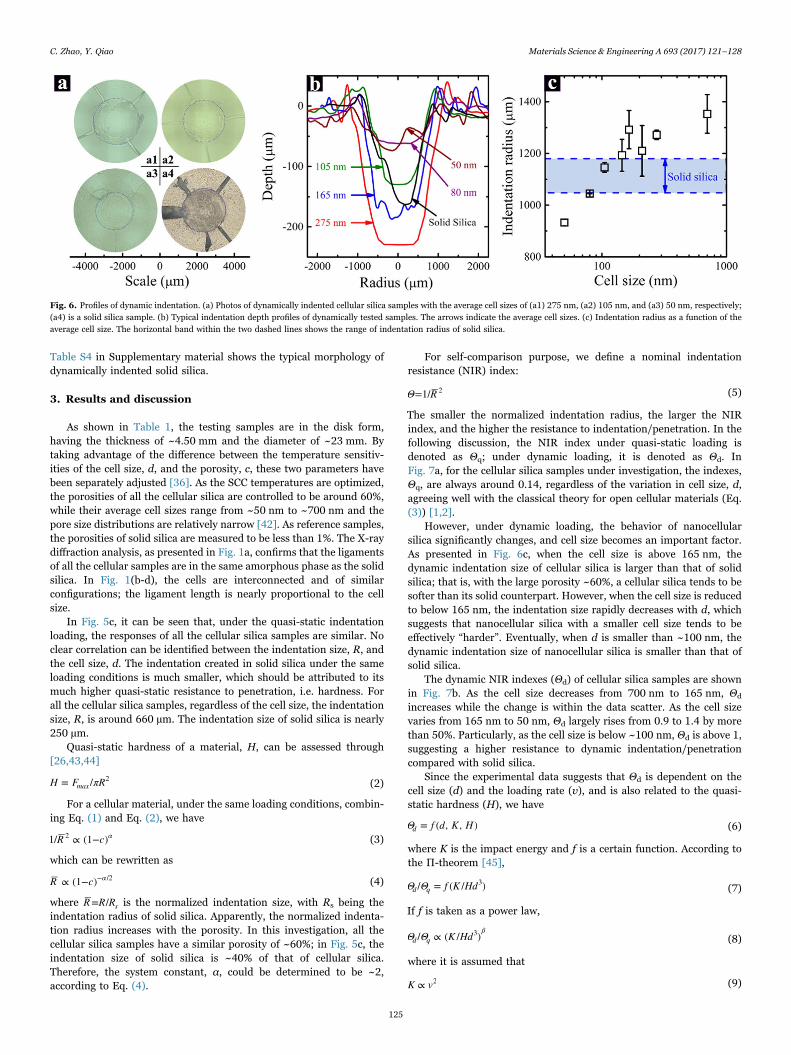
Table S4 in Supplementary material shows the typical morphology ofdynamically indented solid silica.
3. Results and discussion
As shown in Table 1, the testing samples are in the disk form,having the thickness of ~4.50 mm and the diameter of ~23 mm. Bytaking advantage of the difference between the temperature sensitiv-ities of the cell size, d, and the porosity, c, these two parameters havebeen separately adjusted [36]. As the SCC temperatures are optimized,the porosities of all the cellular silica are controlled to be around 60%,while their average cell sizes range from ~50 nm to ~700 nm and thepore size distributions are relatively narrow [42]. As reference samples,the porosities of solid silica are measured to be less than 1%. The X-raydiffraction analysis, as presented in Fig. 1a, confirms that the ligamentsof all the cellular samples are in the same amorphous phase as the solidsilica. In Fig. 1(b-d), the cells are interconnected and of similarconfigurations; the ligament length is nearly proportional to the cellsize.
In Fig. 5c, it can be seen that, under the quasi-static indentationloading, the responses of all the cellular silica samples are similar. Noclear correlation can be identified between the indentation size, R, andthe cell size, d. The indentation created in solid silica under the sameloading conditions is much smaller, which should be attributed to itsmuch higher quasi-static resistance to penetration, i.e. hardness. Forall the cellular silica samples, regardless of the cell size, the indentationsize, R, is around 660 µm. The indentation size of solid silica is nearly250 µm.
Quasi-static hardness of a material, H, can be assessed through[26,43,44]
H F πR= /max2 (2)
For a cellular material, under the same loading conditions, combin-ing Eq. (1) and Eq. (2), we have
R c1/ ∝ (1− )α2 (3)
which can be rewritten as
R c∝ (1− ) α− /2 (4)
where R R R= / s is the normalized indentation size, with Rs being theindentation radius of solid silica. Apparently, the normalized indenta-tion radius increases with the porosity. In this investigation, all thecellular silica samples have a similar porosity of ~60%; in Fig. 5c, theindentation size of solid silica is ~40% of that of cellular silica.Therefore, the system constant, α, could be determined to be ~2,according to Eq. (4).
For self-comparison purpose, we define a nominal indentationresistance (NIR) index:
Θ R=1/ 2 (5)
The smaller the normalized indentation radius, the larger the NIRindex, and the higher the resistance to indentation/penetration. In thefollowing discussion, the NIR index under quasi-static loading isdenoted as Θq; under dynamic loading, it is denoted as Θd. InFig. 7a, for the cellular silica samples under investigation, the indexes,Θq, are always around 0.14, regardless of the variation in cell size, d,agreeing well with the classical theory for open cellular materials (Eq.(3)) [1,2].
However, under dynamic loading, the behavior of nanocellularsilica significantly changes, and cell size becomes an important factor.As presented in Fig. 6c, when the cell size is above 165 nm, thedynamic indentation size of cellular silica is larger than that of solidsilica; that is, with the large porosity ~60%, a cellular silica tends to besofter than its solid counterpart. However, when the cell size is reducedto below 165 nm, the indentation size rapidly decreases with d, whichsuggests that nanocellular silica with a smaller cell size tends to beeffectively “harder”. Eventually, when d is smaller than ~100 nm, thedynamic indentation size of nanocellular silica is smaller than that ofsolid silica.
The dynamic NIR indexes (Θd) of cellular silica samples are shownin Fig. 7b. As the cell size decreases from 700 nm to 165 nm, Θd
increases while the change is within the data scatter. As the cell sizevaries from 165 nm to 50 nm, Θd largely rises from 0.9 to 1.4 by morethan 50%. Particularly, as the cell size is below ~100 nm, Θd is above 1,suggesting a higher resistance to dynamic indentation/penetrationcompared with solid silica.
Since the experimental data suggests that Θd is dependent on thecell size (d) and the loading rate (v), and is also related to the quasi-static hardness (H), we have
Θ f d K H= ( , , )d (6)
where K is the impact energy and f is a certain function. According tothe Π-theorem [45],
Θ Θ f K Hd/ = ( / )d q3
(7)
If f is taken as a power law,
Θ Θ K Hd/ ∝ ( / )d qβ3
(8)
where it is assumed that
K v∝ 2 (9)
Fig. 6. Profiles of dynamic indentation. (a) Photos of dynamically indented cellular silica samples with the average cell sizes of (a1) 275 nm, (a2) 105 nm, and (a3) 50 nm, respectively;(a4) is a solid silica sample. (b) Typical indentation depth profiles of dynamically tested samples. The arrows indicate the average cell sizes. (c) Indentation radius as a function of theaverage cell size. The horizontal band within the two dashed lines shows the range of indentation radius of solid silica.
C. Zhao, Y. Qiao Materials Science & Engineering A 693 (2017) 121–128
125
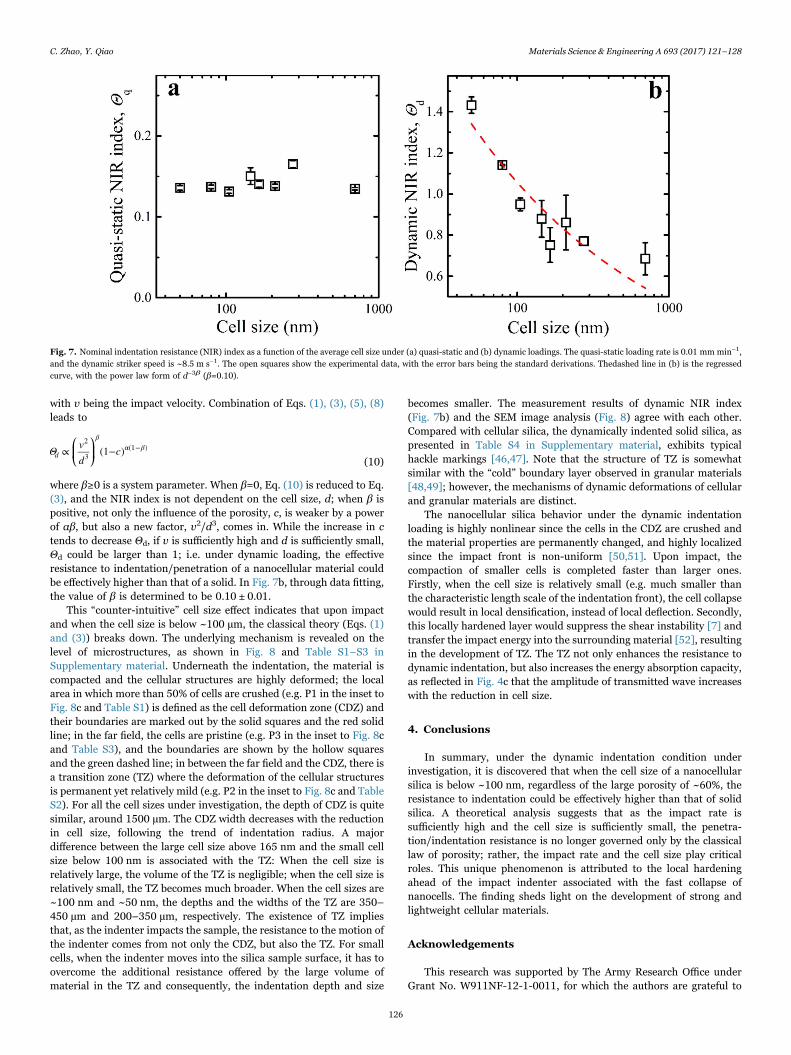
with v being the impact velocity. Combination of Eqs. (1), (3), (5), (8)leads to
⎛⎝⎜
⎞⎠⎟Θ v
dc∝ (1− )d
ββ
2
3α(1− )
(10)
where β≥0 is a system parameter. When β=0, Eq. (10) is reduced to Eq.(3), and the NIR index is not dependent on the cell size, d; when β ispositive, not only the influence of the porosity, c, is weaker by a powerof αβ, but also a new factor, v2/d3, comes in. While the increase in ctends to decrease Θd, if v is sufficiently high and d is sufficiently small,Θd could be larger than 1; i.e. under dynamic loading, the effectiveresistance to indentation/penetration of a nanocellular material couldbe effectively higher than that of a solid. In Fig. 7b, through data fitting,the value of β is determined to be 0.10 ± 0.01.
This “counter-intuitive” cell size effect indicates that upon impactand when the cell size is below ~100 µm, the classical theory (Eqs. (1)and (3)) breaks down. The underlying mechanism is revealed on thelevel of microstructures, as shown in Fig. 8 and Table S1–S3 inSupplementary material. Underneath the indentation, the material iscompacted and the cellular structures are highly deformed; the localarea in which more than 50% of cells are crushed (e.g. P1 in the inset toFig. 8c and Table S1) is defined as the cell deformation zone (CDZ) andtheir boundaries are marked out by the solid squares and the red solidline; in the far field, the cells are pristine (e.g. P3 in the inset to Fig. 8cand Table S3), and the boundaries are shown by the hollow squaresand the green dashed line; in between the far field and the CDZ, there isa transition zone (TZ) where the deformation of the cellular structuresis permanent yet relatively mild (e.g. P2 in the inset to Fig. 8c and TableS2). For all the cell sizes under investigation, the depth of CDZ is quitesimilar, around 1500 µm. The CDZ width decreases with the reductionin cell size, following the trend of indentation radius. A majordifference between the large cell size above 165 nm and the small cellsize below 100 nm is associated with the TZ: When the cell size isrelatively large, the volume of the TZ is negligible; when the cell size isrelatively small, the TZ becomes much broader. When the cell sizes are~100 nm and ~50 nm, the depths and the widths of the TZ are 350–450 µm and 200–350 µm, respectively. The existence of TZ impliesthat, as the indenter impacts the sample, the resistance to the motion ofthe indenter comes from not only the CDZ, but also the TZ. For smallcells, when the indenter moves into the silica sample surface, it has toovercome the additional resistance offered by the large volume ofmaterial in the TZ and consequently, the indentation depth and size
becomes smaller. The measurement results of dynamic NIR index(Fig. 7b) and the SEM image analysis (Fig. 8) agree with each other.Compared with cellular silica, the dynamically indented solid silica, aspresented in Table S4 in Supplementary material, exhibits typicalhackle markings [46,47]. Note that the structure of TZ is somewhatsimilar with the “cold” boundary layer observed in granular materials[48,49]; however, the mechanisms of dynamic deformations of cellularand granular materials are distinct.
The nanocellular silica behavior under the dynamic indentationloading is highly nonlinear since the cells in the CDZ are crushed andthe material properties are permanently changed, and highly localizedsince the impact front is non-uniform [50,51]. Upon impact, thecompaction of smaller cells is completed faster than larger ones.Firstly, when the cell size is relatively small (e.g. much smaller thanthe characteristic length scale of the indentation front), the cell collapsewould result in local densification, instead of local deflection. Secondly,this locally hardened layer would suppress the shear instability [7] andtransfer the impact energy into the surrounding material [52], resultingin the development of TZ. The TZ not only enhances the resistance todynamic indentation, but also increases the energy absorption capacity,as reflected in Fig. 4c that the amplitude of transmitted wave increaseswith the reduction in cell size.
4. Conclusions
In summary, under the dynamic indentation condition underinvestigation, it is discovered that when the cell size of a nanocellularsilica is below ~100 nm, regardless of the large porosity of ~60%, theresistance to indentation could be effectively higher than that of solidsilica. A theoretical analysis suggests that as the impact rate issufficiently high and the cell size is sufficiently small, the penetra-tion/indentation resistance is no longer governed only by the classicallaw of porosity; rather, the impact rate and the cell size play criticalroles. This unique phenomenon is attributed to the local hardeningahead of the impact indenter associated with the fast collapse ofnanocells. The finding sheds light on the development of strong andlightweight cellular materials.
Acknowledgements
This research was supported by The Army Research Office underGrant No. W911NF-12-1-0011, for which the authors are grateful to
Fig. 7. Nominal indentation resistance (NIR) index as a function of the average cell size under (a) quasi-static and (b) dynamic loadings. The quasi-static loading rate is 0.01 mm min−1,and the dynamic striker speed is ~8.5 m s−1. The open squares show the experimental data, with the error bars being the standard derivations. Thedashed line in (b) is the regressedcurve, with the power law form of d−3β (β=0.10).
C. Zhao, Y. Qiao Materials Science & Engineering A 693 (2017) 121–128
126
Dr. David M. Stepp. Special thanks are also due to Professors Marc A.Meyers and Vitali F. Nesterenko for the useful discussions.
Appendix A. Supporting information
Supplementary data associated with this article can be found in theonline version at doi:10.1016/j.msea.2017.03.091.
References
[1] L.J. Gibson, M.F. Ashby, Cellular Solids: Structure and Properties, CambridgeUniversity Press, Cambridge, UK, 1997.
[2] M. Scheffler, P. Colombo, Cellular Ceramics: Structure, Manufacturing, Propertiesand Applications, John Wiley & Sons, New York, 2006.
[3] T. Mukai, H. Kanahashi, T. Miyoshi, M. Mabuchi, T.G. Nieh, K. Higashi, Scr. Mater.40 (1999) 921–927.
[4] J.S. Seo, D. Whang, H. Lee, S.I. Jun, J. Oh, Y.J. Jeon, K. Kim, Nature 404 (2000)982–986.
[5] Ö. Keleş, R.E. García, K.J. Bowman, Acta Mater. 61 (2013) 2853–2862.
Fig. 8. SEM images of dynamically indented cellular silica samples. (a) Schematic of the SEM scanning zone. SEM scanning zones of cellular silica with the average cell sizes of (b)275 nm, (c) 105 nm, and (d) 50 nm, respectively. The solid squares and the solid lines mark out the boundaries of cell deformation zones (CDZ); the hollow squares and the dashed linesmark out the boundaries of transition zone (TZ). The insets to (c), from left to right, show the cellular structures in the CDZ (P1), in the TZ (P2), and in the far field (P3), respectively.(For interpretation of the references to color in this figure legend, the reader is referred to the web version of this article.)
C. Zhao, Y. Qiao Materials Science & Engineering A 693 (2017) 121–128
127
[6] W.-G. Bae, H.N. Kim, D. Kim, S.-H. Park, H.E. Jeong, K.-Y. Suh, Adv. Mater. 26(2014) 675–700.
[7] C. Zhao, Y. Qiao, Mater. Sci. Eng.: A 676 (2016) 450–462.[8] I. Vlahinić, J.J. Thomas, H.M. Jennings, J.E. Andrade, J. Mech. Phys. Solids 60
(2012) 1350–1362.[9] M. Borrega, L.J. Gibson, Mech. Mater. 84 (2015) 75–90.
[10] L.J. Gibson, J. Biomech. 38 (2005) 377–399.[11] P. Fratzl, R. Weinkamer, Prog. Mater. Sci. 52 (2007) 1263–1334.[12] R.H. Baughman, A.A. Zakhidov, W.A. de Heer, Science 297 (2002) 787–792.[13] A.C. Pierre, G.M. Pajonk, Chem. Rev. 102 (2002) 4243–4266.[14] C.B. Park, A.H. Behravesh, R.D. Venter, Polym. Eng. Sci. 38 (1998) 1812–1823.[15] D. Yuan, W. Lu, D. Zhao, H.-C. Zhou, Adv. Mater. 23 (2011) 3723–3725.[16] K. Nakanishi, Synthesis Concepts and Preparation of Silica Monoliths, Monolithic
Silicas in Separation Science: Concepts, Syntheses, Characterization, Modeling andApplications, John Wiley & Sons, New York, 2010, p. 11.
[17] B.C. Tappan, S.A. Steiner, E.P. Luther, Angew. Chem. Int. Ed. 49 (2010)4544–4565.
[18] L.R. Meza, A.J. Zelhofer, N. Clarke, A.J. Mateos, D.M. Kochmann, J.R. Greer, Proc.Natl. Acad. Sci. USA 112 (2015) 11502–11507.
[19] S.J. Nam, J.Y. Hwang, H.-K. Kim, H.J. Choi, Acta Mater. 113 (2016) 170–179.[20] A.M. Hodge, J. Biener, J.R. Hayes, P.M. Bythrow, C.A. Volkert, A.V. Hamza, Acta
Mater. 55 (2007) 1343–1349.[21] Z. Chen, X. Wang, F. Giuliani, A. Atkinson, J. Am. Ceram. Soc. 98 (2015)
2183–2190.[22] F. Svec, J.M. Fréchet, Anal. Chem. 64 (1992) 820–822.[23] A. Bhattacharya, V.V. Calmidi, R.L. Mahajan, Int. J. Heat Mass Transf. 45 (2002)
1017–1031.[24] N. Leventis, C. Sotiriou-Leventis, G. Zhang, A.-M.M. Rawashdeh, Nano Lett. 2
(2002) 957–960.[25] L.J. Gibson, M.F. Ashby, The Mechanics of Three-Dimensional Cellular Materials,
1982.[26] J. Luo, R. Stevens, Ceram. Int. 25 (1999) 281–286.[27] M.M.J. Treacy, T.W. Ebbesen, J.M. Gibson, Nature 381 (1996) 678–680.[28] A.T. Jennings, M.J. Burek, J.R. Greer, Phys. Rev. Lett. 104 (2010) 135503.[29] B. Wu, A. Heidelberg, J.J. Boland, Nat. Mater. 4 (2005) 525–529.
[30] Z.F. Ren, Z.P. Huang, J.W. Xu, J.H. Wang, P. Bush, M.P. Siegal, P.N. Provencio,Science 282 (1998) 1105–1107.
[31] A.M. Hodge, J.R. Hayes, J.A. Caro, J. Biener, A.V. Hamza, Adv. Eng. Mater. 8(2006) 853–857.
[32] M. Hakamada, M. Mabuchi, Scr. Mater. 56 (2007) 1003–1006.[33] R.D. Shoup, Controlled pore silica bodies gelled from silica sol-alkali silicate
mixtures, in: M. Kerker (Ed.)Colloid and Interface Science, Academic Press, NewYork, 1976, pp. 63–69.
[34] K. Nakanishi, J. Porous Mater. 4 (1997) 67–112.[35] R. Miyamoto, Y. Ando, C. Kurusu, Hz Bai, K. Nakanishi, M. Ippommatsu, J. Sep.
Sci. 36 (2013) 1890–1896.[36] C. Zhao, M. Wang, Y. Shi, J. Cao, Y. Qiao, Mater. Des. 90 (2016) 815–819.[37] Y. Diao, T. Harada, A.S. Myerson, T. Alan Hatton, B.L. Trout, Nat. Mater. 10 (2011)
867–871.[38] T. Kawaguchi, J. Iura, N. Taneda, H. Hishikura, Y. Kokubu, J. Non-Cryst. Solids 82
(1986) 50–56.[39] H. Kolsky, Stress waves in solids, Courier Corporation, 1963.[40] S. Nemat-Nasser, J.B. Isaacs, J.E. Starrett, Proc. R. Soc. Lond. Ser. A: Math. Phys.
Sci. 435 (1991) 371–391.[41] B. Song, W. Chen, Exp. Mech. 44 (2004) 622–627.[42] C. Zhao, Y. Qiao, Nanoscale 8 (2016) 17658–17664.[43] W.C. Oliver, G.M. Pharr, J. Mater. Res. 19 (2004) 3–20.[44] P. Clément, S. Meille, J. Chevalier, C. Olagnon, Acta Mater. 61 (2013) 6649–6660.[45] P.W. Bridgman, Dimensional Analysis, Yale University Press, New Haven,
Connecticut, 1922.[46] P.J.S. Gash, Tectonophysics 12 (1971) 349–391.[47] R.C. Bradt, R.E. Tressler, Fractography of Glass, Springer, Berlin, Germany, 1994.[48] N. Kostyukov, J. Appl. Mech. Tech. Phys. 32 (1991) 967–973.[49] V. Nesterenko, Y.L. Luk'yanov, M. Bondar', Combust. Explos. Shock Waves 30
(1994) 693–695.[50] M.A. Meyers, Dynamic Behavior of Materials, John Wiley & Sons, New York, 1994.[51] V.F. Nesterenko, Dynamics of Heterogeneous Materials, Springer Science &
Business Media, Heidelberg, Germany, 2001.[52] A. Leonard, C. Daraio, Phys. Rev. Lett. 108 (2012) 214301.
C. Zhao, Y. Qiao Materials Science & Engineering A 693 (2017) 121–128
128
1
SUPPLEMENTARY MATERIAL
for
Enhanced Resistance of Nanocellular Silica to Dynamic Indentation
Cang Zhao a,b, Yu Qiao a,c,*
a Department of Structural Engineering, University of California - San Diego, La Jolla, CA 92093-0085, U.S.A.
b X-ray Science Division, Argonne National Laboratory, Argonne, IL 60439, USA c Program of Materials Science and Engineering, University of California - San Diego, La Jolla,
CA 92093, U.S.A. * Corresponding author. Phone: 858-534-3388; Email: [email protected]
1. Mechanical Testing and Materials Characterization 1.1. Impact Testing System
Dynamic indentation tests of cellular and solid silica samples were conducted on an impact
system [1, 2]. A Grade 9 Titanium (Ti) tube with the inner diameter, the outer diameter, and the length of 11.4 mm, 12.7 mm, and 462 mm, respectively, was used as the striker. Two 17-4 PH H900 stainless steel end-caps with the thickness of 5 mm were pressed into the two ends of the Ti tube, and were fixed by two stainless steel pins. The pins had a diameter of 3.2 mm and a length of 12.7 mm. The striker, together with the pins, had a total mass of 63 g. An AeroMarine polyurethane foam sleeve was employed to hold the striker inside the gas chamber. In this investigation, the pressure in the gas chamber was maintained at 15 psi, which results in a striker speed of ~8.5 m s-1. The striker speed was measured by two pairs of photomicro sensors (OMRON EE-SPW421).
Both the incident and the transmitted bars were made of 17-4 PH H900 stainless steel. The elastic modulus was 196.5 GPa, and the mass density was 7750 kg m-3. The two bar diameters were the same 12.7 mm; their lengths were 178 cm and 152 cm, respectively. At the center of the two bars, two sets of strain gauges (Vishay WK-13-250BF-10C) were mounted to collect the stress wave signals through a data acquisition (DAQ) system (Vishay 2310B).
To ensure that the sample was only subjected to the first pulse loading, a momentum trapper system was developed [3, 4]. It included a rigid block, a flange attached to the impact end of the incident bar, and a two-piece thread-clamping locknut. Initially there was a gap between the rigid block and the flange. The gap width was accurately and precisely adjusted so that the motions of the flange, together with the incident bar, would be stopped immediately once the stress wave produced by the Ti tube striker had completely entered into the incident bar. Therefore, only a single pulse loading was applied to the silica sample. 1.2 Dynamic compression tests In all the tests, the striker speed was maintained at ~8.5 m/s. On the far end of the incident bar, a silica sample was attached, without the indenter, and the sample was supported from the back by the transmission bar. The one-dimensional stress wave subsequently entered the sample,
2
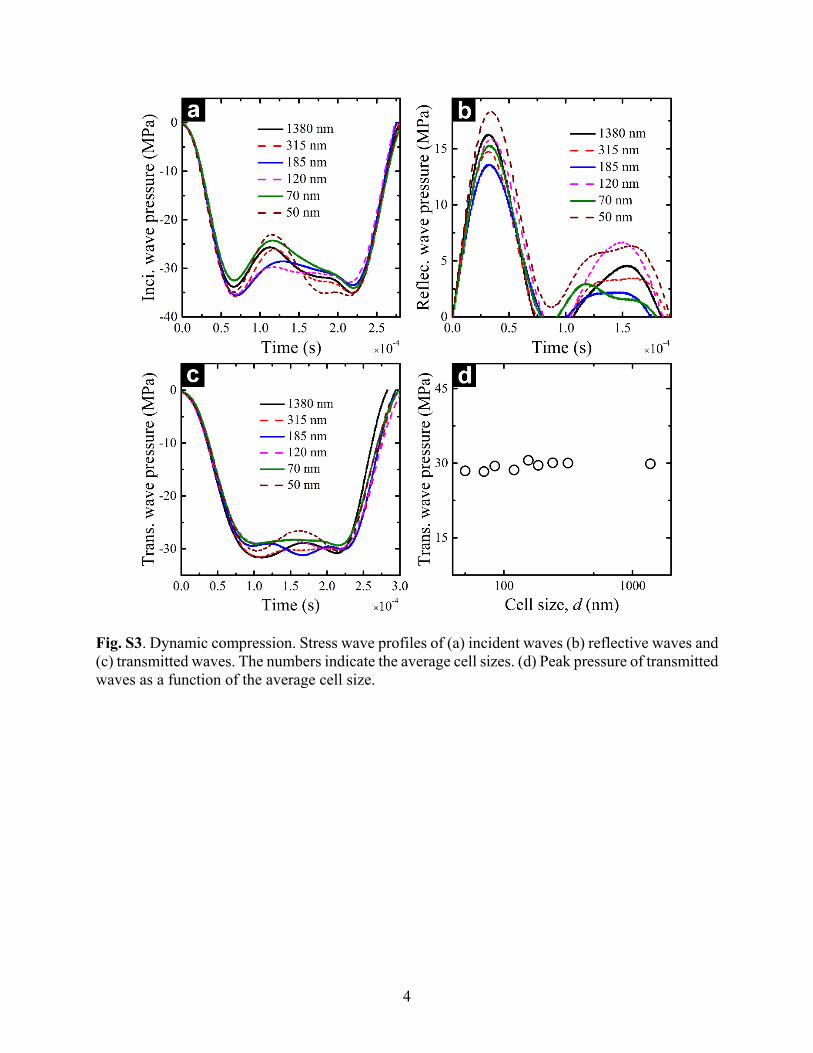
and the transmission bar. Typical incident, reflected, and transmitted waves are presented in Fig. S3 (a-c). The transmitted wave pressure is nearly constant, independent of the cell size (Fig. S3d).
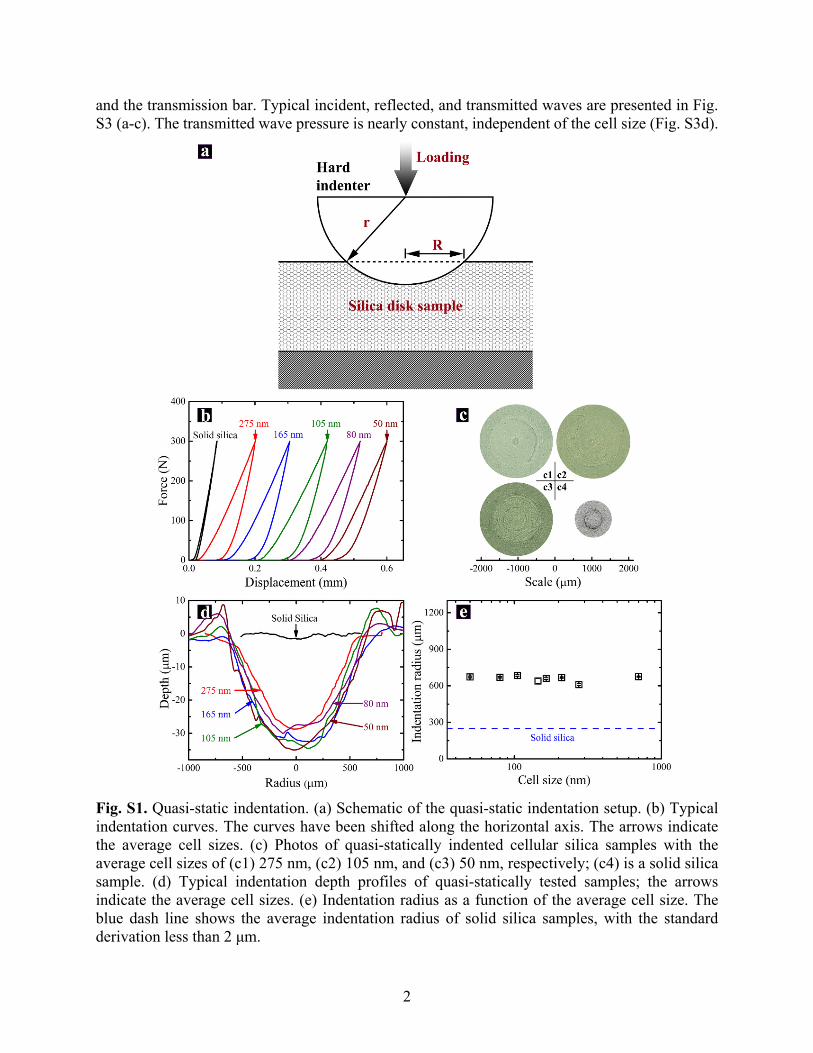
Fig. S1. Quasi-static indentation. (a) Schematic of the quasi-static indentation setup. (b) Typical indentation curves. The curves have been shifted along the horizontal axis. The arrows indicate the average cell sizes. (c) Photos of quasi-statically indented cellular silica samples with the average cell sizes of (c1) 275 nm, (c2) 105 nm, and (c3) 50 nm, respectively; (c4) is a solid silica sample. (d) Typical indentation depth profiles of quasi-statically tested samples; the arrows indicate the average cell sizes. (e) Indentation radius as a function of the average cell size. The blue dash line shows the average indentation radius of solid silica samples, with the standard derivation less than 2 μm.
3
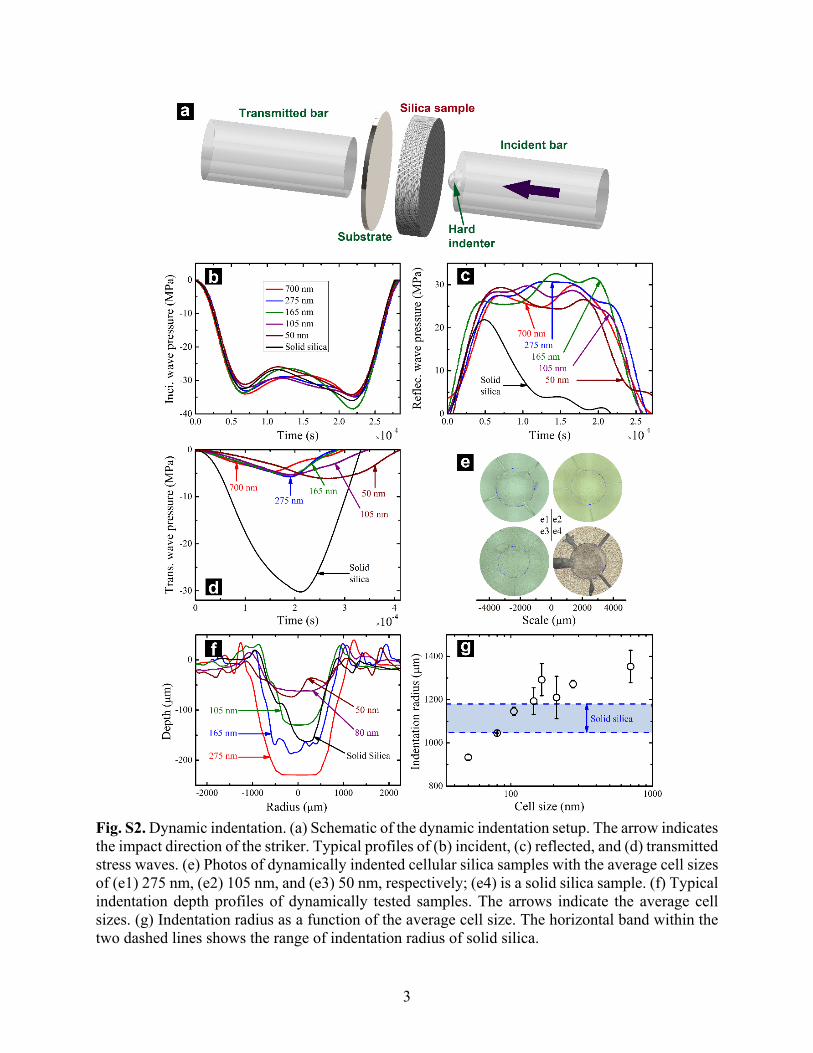
Fig. S2. Dynamic indentation. (a) Schematic of the dynamic indentation setup. The arrow indicates the impact direction of the striker. Typical profiles of (b) incident, (c) reflected, and (d) transmitted stress waves. (e) Photos of dynamically indented cellular silica samples with the average cell sizes of (e1) 275 nm, (e2) 105 nm, and (e3) 50 nm, respectively; (e4) is a solid silica sample. (f) Typical indentation depth profiles of dynamically tested samples. The arrows indicate the average cell sizes. (g) Indentation radius as a function of the average cell size. The horizontal band within the two dashed lines shows the range of indentation radius of solid silica.
4
Fig. S3. Dynamic compression. Stress wave profiles of (a) incident waves (b) reflective waves and (c) transmitted waves. The numbers indicate the average cell sizes. (d) Peak pressure of transmitted waves as a function of the average cell size.
5
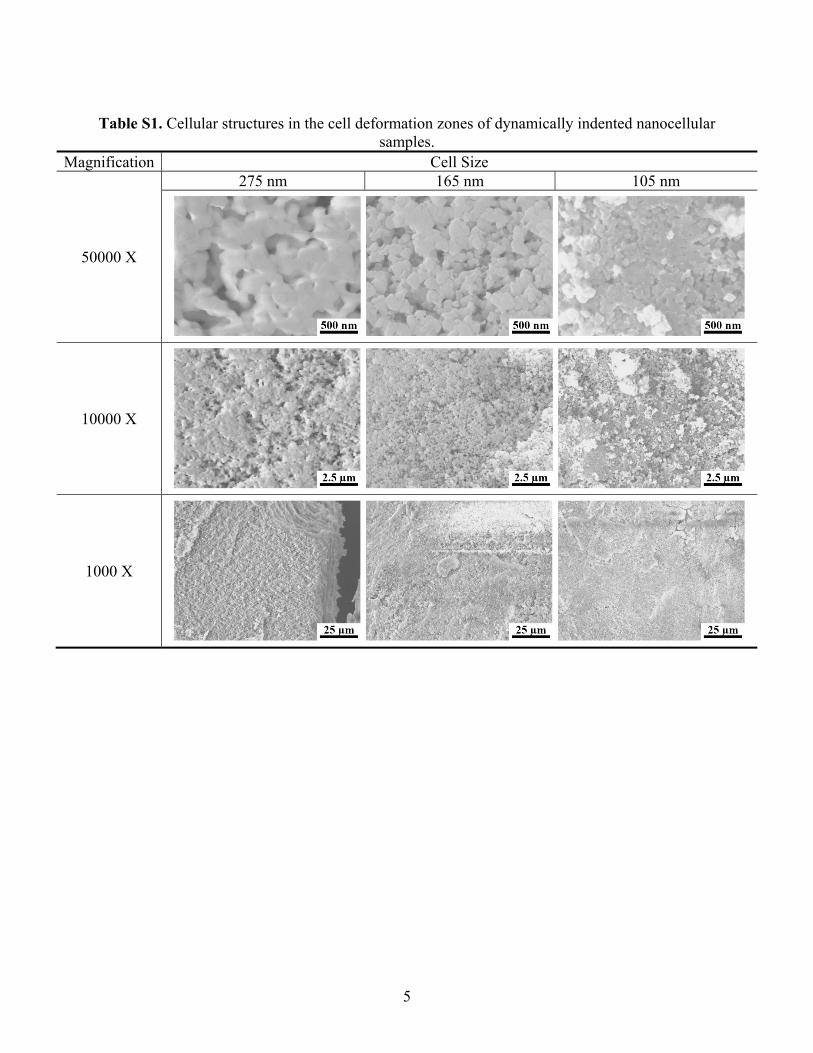
Table S1. Cellular structures in the cell deformation zones of dynamically indented nanocellular
samples. Magnification Cell Size
50000 X
275 nm 165 nm 105 nm
10000 X
1000 X
6
Table S2. Cellular structures in the transition zones of dynamically indented nanocellular samples.
Magnification Cell Size
50000 X
275 nm 165 nm 105 nm
10000 X
1000 X
7
Table S3. Cellular structures in the far fields of dynamically indented nanocellular samples. Magnification Cell Size
50000 X
275 nm 165 nm 105 nm
10000 X
1000 X
Table S4. Morphology of dynamically indented solid silica. SEM Magnification
1000 X 10000 X 50000 X
8
References [1] H. Kolsky. Stress waves in solids, Courier Corporation, 1963. [2] C. Zhao, Y. Qiao. Fast-condensing nanofoams: Suppressing localization of intense stress
waves, Materials Science and Engineering: A 676 (2016) 450-462. [3] S. Nemat-Nasser, J.B. Isaacs, J.E. Starrett. Hopkinson techniques for dynamic recovery
experiments, Proceedings of the Royal Society of London. Series A: Mathematical and Physical Sciences 435 (1991) 371-391.
[4] B. Song, W. Chen. Loading and unloading split Hopkinson pressure bar pulse-shaping techniques for dynamic hysteretic loops, Experimental Mechanics 44 (2004) 622-627.