Embed Size (px)
Citation preview

ON
ECOMPANY
BRUSH ENGINEERED MATERIALS INC.
ACADEMY CORPORATION
BARR ASSOCIATES, INC.
BRUSH CERAMIC PRODUCTS INC.
BRUSH WELLMAN ALLOY PRODUCTS
BRUSH WELLMAN BERYLLIUM PRODUCTS
CERAC, INCORPORATED
TECHNI-MET, LLC
TECHNICAL MATERIALS, INC.
THIN FILM TECHNOLOGY, INC.
WILLIAMS ADVANCED MATERIALS INC.
2010 ANNUAL REPORT
ON
ECONTENTSAbout the Company, Financial Highlights . . . . . . . . . . . . . . . . . . . . . . . . . . . . . . . . . . . . . . . . . . . . . . . . . . . . . Inside front Introduction to Materion . . . . . . . . . . . . . . . . . . . . . . . . . . . . . . . . . . . . . . . . . . . . . . . . . . . . . . . . . . . . . . . . . . . . . . . . . . 1Letter to Shareholders . . . . . . . . . . . . . . . . . . . . . . . . . . . . . . . . . . . . . . . . . . . . . . . . . . . . . . . . . . . . . . . . . . . . . . . . . . . . 6One Company: Financial Data and Markets . . . . . . . . . . . . . . . . . . . . . . . . . . . . . . . . . . . . . . . . . . . . . . . . . . . . . . . . . . 10One Name: Our New Name and Unified Brand . . . . . . . . . . . . . . . . . . . . . . . . . . . . . . . . . . . . . . . . . . . . . . . . . . . . . . 12One Goal: New Collaboration and Synergies . . . . . . . . . . . . . . . . . . . . . . . . . . . . . . . . . . . . . . . . . . . . . . . . . . . . . . . . 14One Focus: Fast-growing Market Niches . . . . . . . . . . . . . . . . . . . . . . . . . . . . . . . . . . . . . . . . . . . . . . . . . . . . . . . . . . . . 16Operating Summary and Shareholder Returns . . . . . . . . . . . . . . . . . . . . . . . . . . . . . . . . . . . . . . . . . . . . . . . . . . . . . . . 182010 Form 10-K . . . . . . . . . . . . . . . . . . . . . . . . . . . . . . . . . . . . . . . . . . . . . . . . . . . . . . . . . . . . . . . . . . . . . . . . . . . . . . . . 19Directors, Officers and Facilities . . . . . . . . . . . . . . . . . . . . . . . . . . . . . . . . . . . . . . . . . . . . . . . . . . . . . . . . . . . . . . . . . . 122Corporate Data . . . . . . . . . . . . . . . . . . . . . . . . . . . . . . . . . . . . . . . . . . . . . . . . . . . . . . . . . . . . . . . . . . . . . . . . . . . . . . . 123
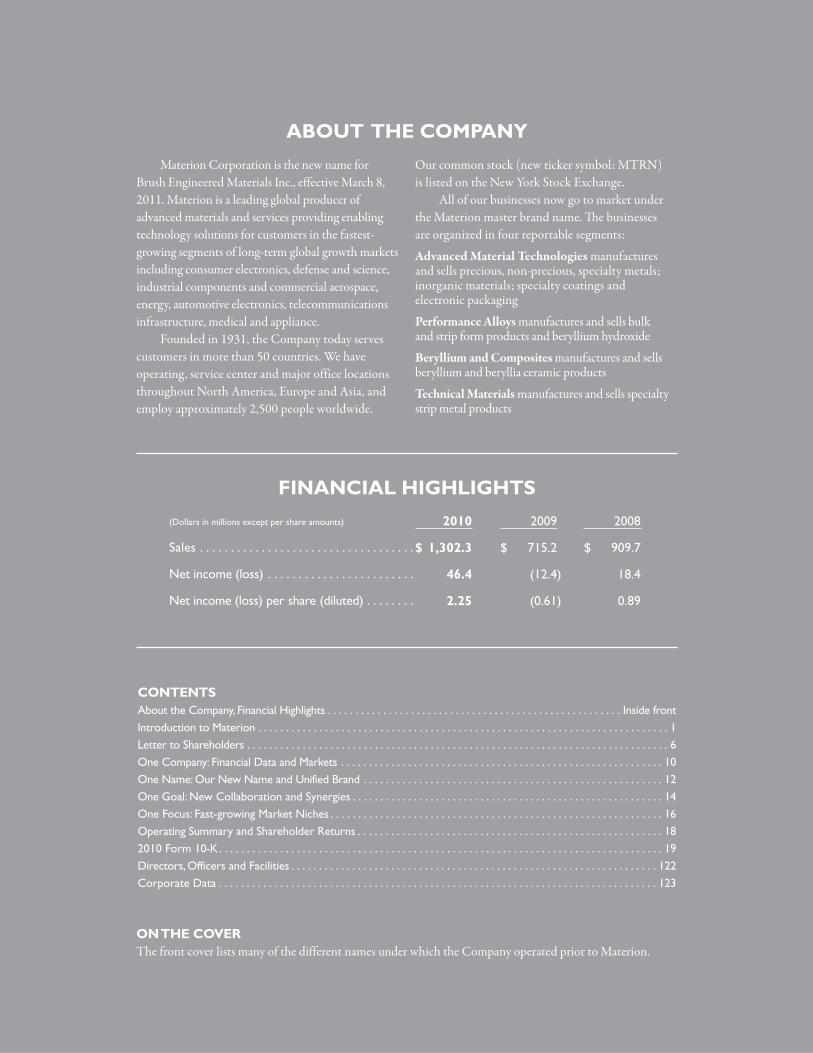
Materion Corporation is the new name forBrush Engineered Materials Inc., effective March 8,2011. Materion is a leading global producer of advanced materials and services providing enablingtechnology solutions for customers in the fastest-growing segments of long-term global growth marketsincluding consumer electronics, defense and science,industrial components and commercial aerospace, energy, automotive electronics, telecommunicationsinfrastructure, medical and appliance.
Founded in 1931, the Company today servescustomers in more than 50 countries. We haveoperating, service center and major office locationsthroughout North America, Europe and Asia, andemploy approximately 2,500 people worldwide.
Our common stock (new ticker symbol: MTRN) is listed on the New York Stock Exchange.
All of our businesses now go to market underthe Materion master brand name. The businesses are organized in four reportable segments:
Advanced Material Technologies manufactures and sells precious, non-precious, specialty metals; inorganic materials; specialty coatings and electronic packaging
Performance Alloys manufactures and sells bulk and strip form products and beryllium hydroxide
Beryllium and Composites manufactures and sellsberyllium and beryllia ceramic products
Technical Materials manufactures and sells specialtystrip metal products
ABOUT THE COMPANY
FINANCIAL HIGHLIGHTS
2009
$ 715.2
(12.4)
(0.61)
2008
$ 909.7
18.4
0.89
2010
$ 1,302.3
46.4
2.25
(Dollars in millions except per share amounts)
Sales . . . . . . . . . . . . . . . . . . . . . . . . . . . . . . . . . . .
Net income (loss) . . . . . . . . . . . . . . . . . . . . . . . .
Net income (loss) per share (diluted) . . . . . . . .
ON THE COVER The front cover lists many of the different names under which the Company operated prior to Materion.

ON
ENAME
One Company. One Name. Transformative initiatives, organic growth and
strategic acquisitions dramatically broadened our productportfolio and worldwide footprint. Yet with many
loosely connected brands we lacked the strong brandrecognition appropriate for our size and scale. Many
customers were served by more than one of ourbusinesses without realizing it. Others didn’t fullyperceive all the ways we might help them. Today,
rebranded and unified, we bring those issues to a close.One company. One name. Materion.

ON
EGOAL
One Goal…To be our customers’ first choice. And why not?
We form deep bonds with our customers by helping them conceive and design technical and performanceadvantages. Our advanced materials solutions make
products higher performing: Lighter. Stronger. Smaller.Thinner. Exceptionally precise. Optically superior.
Remarkably resistant to vibration, corrosion ortemperature extremes. It’s no wonder customers chooseMaterion, we help achieve goals. And our goal – to be
their first choice – is now more broadly achievable sinceexpected synergies from unifying our businesses will
facilitate additionally comprehensive solutions.

One Focus…Just imagine; a company founded eight decades agoremains a leader today in fast-growing segments of fast-growing global markets. In fact, that’s the case.
Materion’s relentless focus – on long-term growth marketswith compelling demand drivers, strong margins and
differentiated technologies – largely explains our success.That focus also explains our optimism for the future.
As the world demands ever-more advanced technologiesin markets like consumer electronics, defense and science,commercial aerospace, telecommunications infrastructure,
medical and energy, Materion stands ready – on ourcustomers’ behalf – to continue innovating for the future. ON
EFOCUS

To Our Shareholders:
Today, it is our great pleasure to introduce you toMaterion. We hope you come to know the name well.
Investors have known us for many years as Brush
Engineered Materials. Customers, on the other hand, have
known us by one or more of many different names and
brands built and acquired over eight decades in business.
Those who have followed the Company’s transformation
from a specialty metals business to an advanced materials
company will certainly recognize why a unified name and
brand structure is the next logical step in our evolution. To
increase global awareness and leverage worldwide capabilities,
facilitate synergies, efficiencies and cross-selling opportunities,
our businesses are now unified under one name and one
brand – Materion.
What a Difference a Year MakesWhile our new name and structure provide a solid
platform for future growth, you likely are more interested in
hearing about our financial performance in 2010. As is often
said, what a difference a year makes! Like so many companies
at this time last year, Materion was responding to the
profoundly adverse effects from tough economic conditions
around the world. In 2010, however, we more than over-
came those challenges. Coming out of recessionary
challenges, we posted record sales, strong margins
and important gains in market penetration.
Driving Sales to a Record $1.3 BillionFor the first time in Company history,
revenues in 2010 exceeded $1 billion. Sales
climbed 82% from 2009 to $1.3 billion.
Revenue gains were driven first and fore-
most by healthy, broad-based increases in
demand across most of our key markets, ON
ECOMPANY

7
beginning with robust restored demand in consumer
electronics early in the year. Following this, we saw demand
return in the telecommunications infrastructure market.
As the year progressed, we experienced stronger demand
from customers in industrial and commercial aerospace,
energy (especially oil and gas) and in high performance
optical applications. Demand was also strong in defense
and automotive electronics.
In addition to strong organic growth, our two most
recent acquisitions – Barr Associates (October 2009) and
Academy Corporation (January 2010) – added approxi-
mately $233 million to sales and were accretive to earnings
by approximately $0.30 per share. Metal price increases
passed along to customers accounted for approximately
$103 million of sales growth. The precious metal content of
our sales has increased significantly due to growth, acquisi-
tions and metal price increases. Sales growth net of metal
price inflation was approximately 68% in 2010, and excluding
acquisitions, our organic growth was 35% for the year.
Higher Value Mix Yields Profitability Gains Profitability improved notably throughout the year.
We posted near-record earnings of $46.4 million, or $2.25
per share, an extraordinary turnaround from a 2009 loss
of $12.4 million, or $0.61 per share. Reported operating
margins showed substantial improvement, particularly in
view of the dilutive effect of higher pass-through metal
pricing and higher precious metal volumes in our sales mix.
In addition to viewing our margins on a GAAP basis, we
also measure margins internally on a “value-added” basis;
that is, with metal costs excluded from revenues, because
we believe that provides a better measure of our operating
performance. On this basis, our 2010 gross profit margin
is above 40%, compared to the reported 17%. Similarly,
operating margin is in the mid-teens as opposed to the
reported 6%. These value-added-basis margins improved
substantially in 2010.
Improved profitability benefited from ongoing strategic
initiatives to both broaden and diversify our market base
and to shift our mix toward faster-growing, higher-value
materials and less cyclical market sectors. Expanded well
beyond integrated and specialty metals, our product portfolio
and distinctive competencies encompass precision optical
filters, specialty inorganic chemical powders and evaporative
materials, precious metals refining and management, large
“Coming out of recessionary challenges, we postedrecord sales, strong margins and important gainsin market penetration.”
$1,302$763 $956 $910 $715
Total Sales(in millions)
$0
$400
$200
$800
$600
$1,200
$1,000
$1,400
Gross Margin(in millions)
$162 $197 $152 $91 $223
Average Sales per Employee(in thousands)
$524$349 $434 $407 $326
06 07 08 09 10 06 07 08 09 1006 07 08 09 10
$150
$100
$50
$200
$250
$0
$200
$400
$600
$0

and small area thin film deposition, electronic packaging
materials, and engineered clad and plated metal systems.
With this unmatched offering of related materials and
capabilities, we focus on the fastest-growing, technology-
driven segments of sustainable global growth markets.
Today, we primarily produce high-value, innovative
and technologically advanced materials that customers
$70 million at year end. Our ratio of debt-to-debt-plus-
equity was approximately 18% at year end. A healthy
balance sheet, coupled with ongoing positive cash flows
from operations, gives us the financial flexibility to make
important investments in the business and to continue to
evaluate complementary acquisitions or other strategic
growth initiatives.
8
“We look ahead with confidence and optimism. OurCompany’s sales have been growing at a compoundannual rate of 17% since 2002.”
Debt-to-Debt-Plus-EquityNet Cash Provided from
Operating Activities(in millions)
Earnings Before Interest, Taxes, Depreciation and
Amortization (EBITDA)*(in millions)
$20
$40
$60
$80
5%
15%
10%
20%$68 $108 $62 $12 $109 15% 9% 11% 16% 18% $39 $51 $77 $42 $31
06 07 08 09 10 06 07 08 09 10 06 07 08 09 10
$40
$80
$120
$0 0% $0
need to achieve differentiating designs and engineering
characteristics essential to stay at the forefront of rapidly
changing markets. As a result, we rarely compete in
commoditized spaces.
Profitability gains were also aided by significant
improvements in our cost structure, principally due to
a lowered breakeven point for our Performance Alloys
business and through the ongoing success of our lean sigma
programs throughout the Company, as well as by enhanced
pricing models.
At the same time, we continue enjoying organic and
acquisition growth in our businesses which generally have
lower infrastructure and capital costs. The Company
entered and exited 2010 with a very strong balance sheet.
Even with more than $76 million invested in the Barr
Associates and Academy acquisitions, debt net of cash was
Rapid Recovery Affirms Transformative Strategy We’d likely be proud to report results like these most
any year. We’d be remiss, however, if we didn’t underscore
how rewarding it is to report them for 2010.
The challenging economic conditions putting most
businesses and industries to the test during this time are
well known. Simply put, our Company, our team, recovered
quickly and convincingly. And, we recovered quicker and
stronger than in the last recession, while in an indisputably
tougher environment. During the last recession, we posted
losses for three years. Following this recession, we turned
the corner after just two quarters and drove record sales
coming out.
Diversifying our portfolio. Focusing on high-growth
market niches and high-value products. Reducing risk
and cyclicality. These transformative measures have been
*A non-GAAP measure used as an indicator of cash generation,EBITDA is operating profit plus depreciation and amortization.

implemented consistently. Our evolved business model is
primed for capitalizing on market growth opportunities
while also providing resiliency against market turbulence.
Investing to Capitalize on Future OpportunitiesWhile our multi-year transformation strategy is
credibly paying off, we remain focused on investing in
our business to be our customers’ first choice, driving
their and our future success. In early 2011, we completed
construction of a new state-of-the-art primary beryllium
manufacturing facility in Elmore, Ohio, and are now
ramping up production. This flagship plant resulted from
a $94 million public-private partnership between our
Company and the U.S. Department of Defense, built to
secure a sustainable domestic supply of beryllium and
beryllium products for our country’s national defense.
Demand for beryllium products continues to expand for
optics, satellite structures, medical imaging, and for critical
components in aircraft and missile defense.
Unifying and branding our businesses as Materion
is another long-term investment in our future. While
reaping many benefits from our transformation, we have
not achieved our full business potential. Positioning
Materion as a single, unified organization will broaden
our customers’ awareness of the total scope of our offerings
and enable us to better compete for business, acquisitions
and talent globally.
Global Market Trends Point to Favorable OutlookToday, we look ahead with confidence and optimism.
Our Company’s sales have been growing at a compound
annual rate of 17% since 2002 – 10% organic growth.
Our goal is to continue delivering double digit organic
growth, on average over time, and augment that with
strategic and manageable acquisitions.
We believe we are entering an exciting period of
accelerated and sustainable growth driven by strong secular
trends and by our market and product positioning. Overall
market conditions are continuing to improve. Our position
in faster-growing overseas markets is also strengthening.
Our transformation strategy is yielding good results.
Customers count on us to deliver innovative, technologically
advanced material solutions for their critical applications.
We have demonstrated our ability to identify and succeed
in high-growth niche markets with promising futures.
Demand for high-end, more sophisticated electronics in
both consumer products and automotive applications is
expected to continue to expand, as will requirements for
new materials-based technology solutions in high-growth
segments of energy, medical and defense.
As a result of focused product development, organic
growth and good acquisitions, our portfolio today is signifi-
cantly more diverse, less cyclical and more robust than in years
past. We have become leaner and faster-growing, with a
higher-value business model in terms of growth potential,
margins, cash flow, balance sheet and capital structure.
Our new and unified name reflects the new and
unified Company we have become, and provides a common
platform for future growth.
In closing, we thank our employees for their hard work
and dedication in making 2010 so successful, and for their
outstanding execution of our strategies. We also thank you,
our shareholders, for your past investment and continued
confidence in our Company, our team and our future as a
brand new Materion.
Richard J. HippleChairman, President and Chief Executive Officer
9

ON
ECOMPANY
‘‘Our portfolio today is significantly more diverse,less cyclical and more robust than in years past.’’
One Company... that has become leaner, faster-growing, more diversified and less cyclical.
The success of our transformation strategy is reflected in record revenues, better margins andstronger market penetration achieved in 2010.Today, we have a higher-value business model in terms of capital intensity, growth potential,
margins, cash flow, balance sheet and capital structure. And our businesses are now
structured to collaborate in new andmeaningful ways across fast-growing
segments of fast-growing markets.
BERYLLIUM AND COMPOSITES
Beryllium products;beryllia ceramic products
11
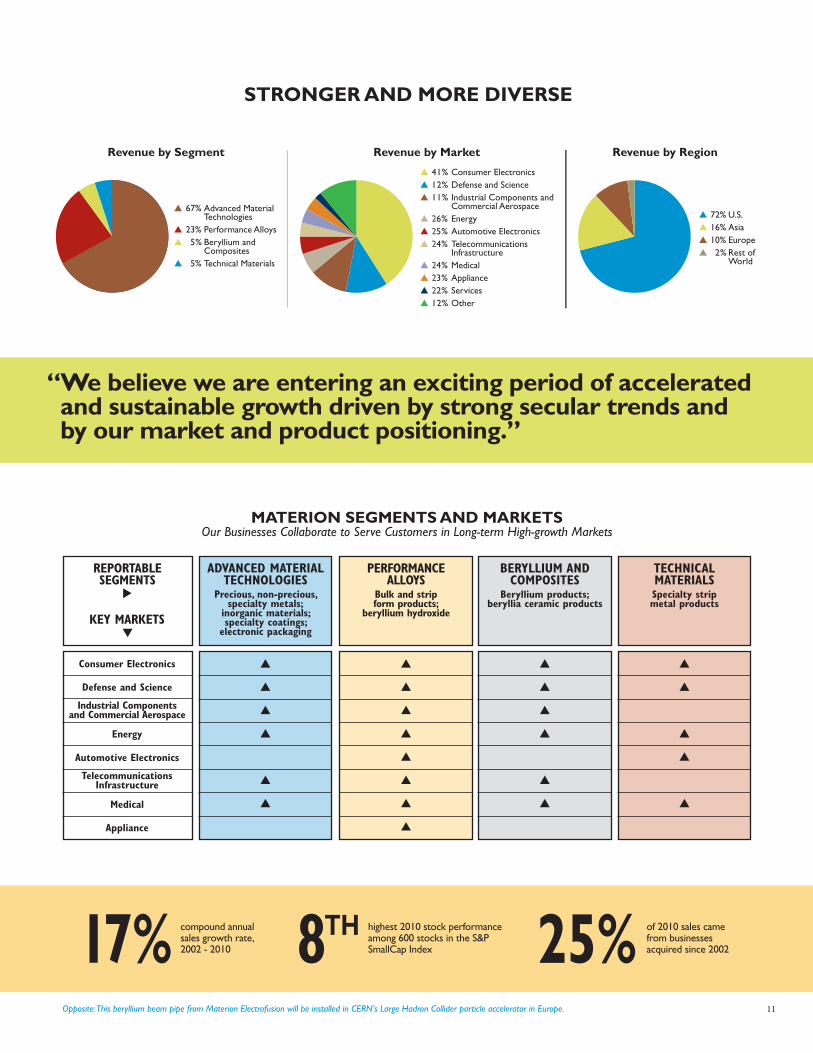
17% compound annualsales growth rate,2002 - 2010 8TH highest 2010 stock performance
among 600 stocks in the S&PSmallCap Index 25% of 2010 sales came
from businesses acquired since 2002
STRONGER AND MORE DIVERSE
▲ 72% U.S.
▲ 16% Asia
▲ 10% Europe
▲ 222% Rest of World
▲ 41% Consumer Electronics
▲ 12% Defense and Science
▲ 11% Industrial Components and Commercial Aerospace
▲ 26% Energy
▲ 25% Automotive Electronics
▲ 24% Telecommunications Infrastructure
▲ 24% Medical
▲ 23% Appliance
▲ 22% Services
▲ 12% Other
▲ 67% Advanced Material Technologies
▲ 23% Performance Alloys
▲ 225% Beryllium and Composites
▲ 225% Technical Materials
Revenue by Segment Revenue by Market Revenue by Region
MATERION SEGMENTS AND MARKETSOur Businesses Collaborate to Serve Customers in Long-term High-growth Markets
KEY MARKETS
REPORTABLE SEGMENTS▲
▲
ADVANCED MATERIALTECHNOLOGIES
Precious, non-precious, specialty metals;
inorganic materials; specialty coatings;
electronic packaging
▲
▲
▲
▲
▲
▲
PERFORMANCEALLOYS
Bulk and strip form products;
beryllium hydroxide
TECHNICALMATERIALSSpecialty stripmetal products
Consumer Electronics
Defense and Science
Industrial Components and Commercial Aerospace
Energy
Automotive Electronics
TelecommunicationsInfrastructure
Medical
Appliance
▲
▲
▲
▲
▲
▲
▲
▲
▲
▲
▲
▲
▲
▲
▲
▲
▲
▲
▲
“We believe we are entering an exciting period of acceleratedand sustainable growth driven by strong secular trends and by our market and product positioning.”
Opposite:This beryllium beam pipe from Materion Electrofusion will be installed in CERN’s Large Hadron Collider particle accelerator in Europe.

ON
ENAME
“Those who have followed the Company’s transformation…will certainly recognize why a unified name brand… is the next logical step in our evolution.”
One Name... One brand new name for an 80-year-old company. What’s behind the name? With Materion, it was a deliberate, logical and evolutionary step following significant growth,
a series of successful acquisitions, and numerous internal and external initiatives that fundamentally
changed our organization. We completed the transformation into a global advanced materials company with expertise in metallurgy, chemistry,
thin film deposition, specialty coatings and optical filter technology from our origins
as a North American metals business.

Investing in One Name for the FutureThe enterprise we are today, with sales beyond
$1 billion, a dramatically broadened geographic footprintand a product portfolio serving fast-growing sectors of expanding global markets, is what we proudly call Materion.
We believe this investment in strategic rebranding –unifying us as one company with one name – is in the bestinterests of customers, shareholders and employees. It unitesa complicated assortment of brands, each with its own nameand visual identity. Most investors knew our former corporatename: Brush Engineered Materials. Yet customers knew usby up to a dozen different names. In fact, we serve a numberof customers from two or more of our businesses.
In addition to being less confusing, a single masterbrand accelerates greater appreciation for our full scope of product and service solutions. We have the resources to compete effectively. Greater global awareness enhancesour competitive edge going forward.
One Name for One CompanyWith technology the lifeblood of our customers, it
was appropriate to adopt a name with updated appeal andwider relevance, one that accurately reflects our business.
To enhance collaboration and cross-selling, we recastall of our businesses as Materion. One name is simpler for customers. One name builds internal teamwork. Onename brings consistency and focus. One name maximizesmarketing resources and provides a range of possibilities fornew synergies benefitting customers. One name acceleratesglobal awareness. Most of all, one name is a long-term invest-ment in Materion, a company with a proud heritage and afuture filled with promising opportunities.
13
2,500 Materion employees work at our 30 facilities in 11 countries 50 countries are home to more than
9,000 Materion customers, using oursolutions in their products worldwide 1company with one name; all our
businesses are now unified underMaterion as a single master brand
Clockwise: Loading electronic package componentsfor brazing in Newburyport, Massachusetts; rollingspecialty metals in Lincoln, Rhode Island; metaland ceramic brazing operations in Newburyport,and monitoring our new primary beryllium facility in Elmore, Ohio.
Opposite: Visi-Lid™ optical window assemblies prepared in a cleanroom in Buffalo, New York.

ON
EGOAL
One Goal… Rebranding and unifying Materion is fundamentally about further achieving
our number one goal: to become and remain our customers’ first choice as a trusted partner
for whatever comes next in their world. In our world, it is about capturing synergies, enhancing collaboration, reducing costs and
building a more powerful marketplace position.
‘‘We focus on the fastest-growing, technology-drivensegments of sustainable global growth markets.’’

Emphasizing Our One GoalWe are proud of our deep customer bonds. Materion
has helped innovate and improve everything from medicaldevices to smart phones; solar photovoltaic cells to deepwater drilling; commercial airliners to unmanned militaryaircraft. Customers depend on us to solve problems, providedifferentiating ideas and help them meet ever-advancingtechnology demands.
Years of innovation go a long way toward making us afirst choice, but we challenge ourselves to continuously offermore. In the past, a solution inside our organization to a customer’s engineering challenge may have never been consid-ered because of how we were structured. As one companywith one name, we increasingly collaborate on innovation to leverage combined capabilities across our businesses.
The Power of CollaborationCollaborative opportunities capitalizing on the breadth
of our portfolio are energizing because many of our businessessupply related materials and services to complementaryindustries and sectors. For example, Materion Electrofusionand Materion Barr Precision Optics & Thin Film Coatings arecollaborating to apply specialty vapor deposition coating ontoberyllium metal x-ray windows, helping customers producecompact x-ray tubes that verify purity and safety of food,toys and metals. Elsewhere, Materion Advanced Chemicalsand Materion Ceramics are helping customers produce thelatest-generation of thin film solar cells by teaming up to useceramic and powder metallurgical engineering for highlycompact vapor deposition targets.
For the rapidly growing energy management market,Materion Technical Materials and Materion Brush Performance Alloys have partnered to produce electron beamwelded composite alloys in rod, wire and strip form for largehigh-power shunt resistors. Shunt resistors are used in smartmeters for monitoring real-time power grid energy usage andfor hybrid and electric vehicle battery management. Andnearly all our businesses have capabilities serving the growingLED (light-emitting diode) market to help manufacturersand material suppliers produce energy-saving LED wafers,lenses, reflectors, dies, phosphors, connectors, substrates,thin film deposition and packaging.
Customers know we will help develop solutions for tomorrow’s still-undiscovered challenges. Now, we offermore resources and share in the benefits of deeper, moremeaningful partnerships.
Internal SynergiesOur new structure and unified brand is expected to
yield other synergies that deepen customer relationships and drive earnings. We expect increased buying leverage and a more efficient customer supply chain. Concentratedmarketing resources present another promising area. Seventeen websites have been consolidated as one. Greaterawareness of our size and scope helps us attract and retaintop talent, and will strengthen future negotiations withbanks, landlords or even acquisition targets. Further, onebrand provides a platform that will simplify integration of future acquisitions.
15
6 different Materion businesses areactive in the alternative energymarkets 17 websites formerly represented our
many businesses; today customers canfind all our solutions in one unified place at www.materion.com
#1our goal is to be the first choice amongour customers; a trusted partner they recommend to others for a wide rangeof solutions
Clockwise: Refining silver for vapordeposition targets in Albuquerque,New Mexico; electron beam weldedresistor materials in Lincoln, RhodeIsland; processing precision microslitfilms in Bloomfield, Connecticut, and inspecting window lid components inBuffalo, New York destined for our Singapore assembly facility.
Opposite: Loading x-ray tube windows from Fremont, California into tooling for magnetron sputter coating in Buellton, California.

ON
EFOCUS
One Focus… Our company has a long history ofbeing on the leading edge of technology and today
remains at the forefront of fast-growing segments within high-growth markets,
precisely where our customers need us most. We succeed where premium performance is
demanded and margins can be protected. This strategy enabled our strong 2010 performance and gives us confidence
in our future. We believe we are entering a period of sustainable growth driven
by secular trends and strong positioning in important market segments.
“Customers count on us to deliver innovative, technologically advanced material solutions for critical applications.”
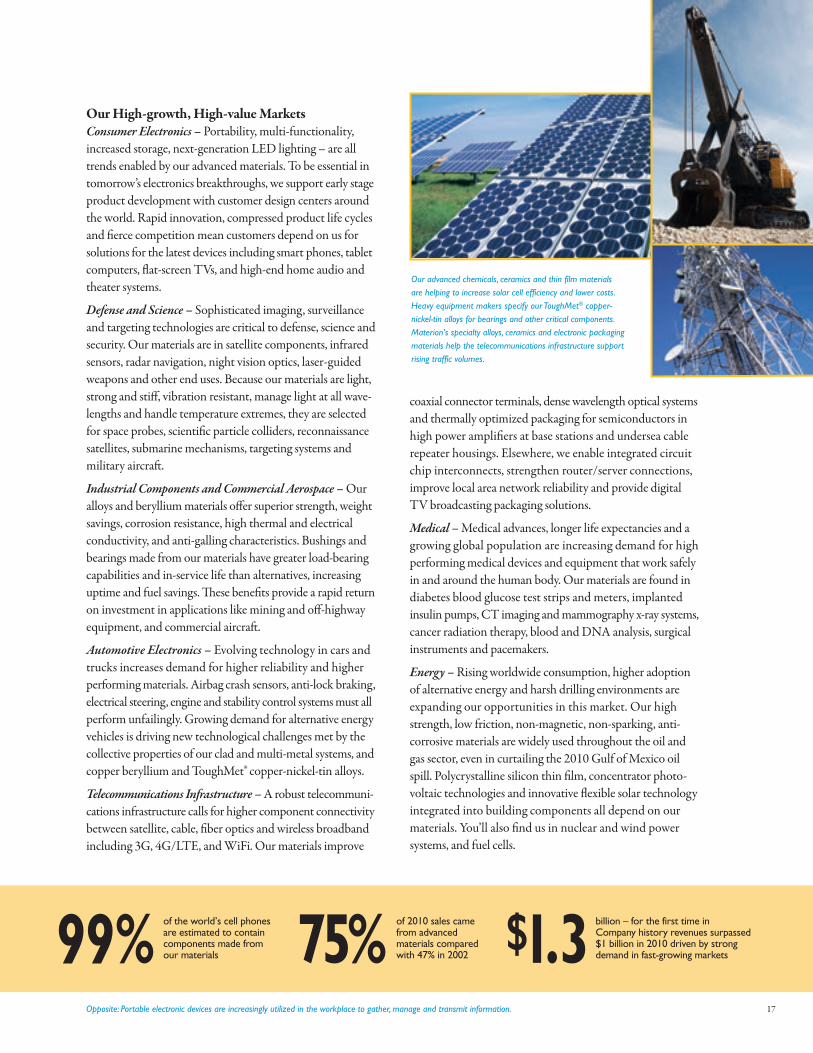
Our High-growth, High-value MarketsConsumer Electronics – Portability, multi-functionality, increased storage, next-generation LED lighting – are alltrends enabled by our advanced materials. To be essential in tomorrow’s electronics breakthroughs, we support early stageproduct development with customer design centers aroundthe world. Rapid innovation, compressed product life cyclesand fierce competition mean customers depend on us for solutions for the latest devices including smart phones, tabletcomputers, flat-screen TVs, and high-end home audio andtheater systems.
Defense and Science – Sophisticated imaging, surveillanceand targeting technologies are critical to defense, science andsecurity. Our materials are in satellite components, infraredsensors, radar navigation, night vision optics, laser-guidedweapons and other end uses. Because our materials are light,strong and stiff, vibration resistant, manage light at all wave-lengths and handle temperature extremes, they are selectedfor space probes, scientific particle colliders, reconnaissancesatellites, submarine mechanisms, targeting systems and military aircraft.
Industrial Components and Commercial Aerospace – Ouralloys and beryllium materials offer superior strength, weightsavings, corrosion resistance, high thermal and electricalconductivity, and anti-galling characteristics. Bushings andbearings made from our materials have greater load-bearingcapabilities and in-service life than alternatives, increasinguptime and fuel savings. These benefits provide a rapid returnon investment in applications like mining and off-highwayequipment, and commercial aircraft.
Automotive Electronics – Evolving technology in cars andtrucks increases demand for higher reliability and higherperforming materials. Airbag crash sensors, anti-lock braking,electrical steering, engine and stability control systems must allperform unfailingly. Growing demand for alternative energyvehicles is driving new technological challenges met by thecollective properties of our clad and multi-metal systems, andcopper beryllium and ToughMet® copper-nickel-tin alloys.
Telecommunications Infrastructure – A robust telecommuni-cations infrastructure calls for higher component connectivitybetween satellite, cable, fiber optics and wireless broadbandincluding 3G, 4G/LTE, and WiFi. Our materials improve
coaxial connector terminals, dense wavelength optical systemsand thermally optimized packaging for semiconductors inhigh power amplifiers at base stations and undersea cable repeater housings. Elsewhere, we enable integrated circuitchip interconnects, strengthen router/server connections,improve local area network reliability and provide digitalTV broadcasting packaging solutions.
Medical – Medical advances, longer life expectancies and agrowing global population are increasing demand for highperforming medical devices and equipment that work safelyin and around the human body. Our materials are found indiabetes blood glucose test strips and meters, implanted insulin pumps, CT imaging and mammography x-ray systems,cancer radiation therapy, blood and DNA analysis, surgicalinstruments and pacemakers.
Energy – Rising worldwide consumption, higher adoption of alternative energy and harsh drilling environments are expanding our opportunities in this market. Our highstrength, low friction, non-magnetic, non-sparking, anti-corrosive materials are widely used throughout the oil andgas sector, even in curtailing the 2010 Gulf of Mexico oilspill. Polycrystalline silicon thin film, concentrator photo-voltaic technologies and innovative flexible solar technologyintegrated into building components all depend on our materials. You’ll also find us in nuclear and wind power systems, and fuel cells.
Our advanced chemicals, ceramics and thin film materialsare helping to increase solar cell efficiency and lower costs. Heavy equipment makers specify our ToughMet® copper-nickel-tin alloys for bearings and other critical components. Materion’s specialty alloys, ceramics and electronic packagingmaterials help the telecommunications infrastructure supportrising traffic volumes.
17
99% of the world’s cell phonesare estimated to containcomponents made fromour materials 75% of 2010 sales came
from advancedmaterials comparedwith 47% in 2002
$1.3 billion – for the first time inCompany history revenues surpassed$1 billion in 2010 driven by strongdemand in fast-growing markets
Opposite: Portable electronic devices are increasingly utilized in the workplace to gather, manage and transmit information.

18
OPERATING SUMMARY
The following graph sets forth the cumulative shareholder return on our common shares as compared to the cumulative total return of the S&P SmallCap 600 Index and the Russell 2000Index. Materion Corporation is a component company of theS&P SmallCap 600 Index and the Russell 2000 Index.
Performance Comparison
2005 2006 2007 2008 2009 2010
Materion Corporation $100 $212 $233 $80 $117 $243
S&P SmallCap 600 $100 $115 $115 $79 $99 $125
Russell 2000 $100 $118 $117 $77 $98 $124
Assumes that the value of our common shares and each index was $100 on December 31, 2005 and that all applicable dividends were reinvested.
$50
$100
$150
$200
$250
2006 2007 2008 2009 2010$0
S&P SmallCap 600 Russell 2000 Materion Corporation
For the Years Ended December 31,
* Return on invested capital = operating profit/(average debt + average equity – average cash)
** Non-GAAP operating run rate is computed by excluding or adjusting from operating profit derivative ineffectiveness expense of $4.9 million on a copper derivative embedded in a debt obligationsecured during 2009, lower of cost or market inventory charges of $0.7 million in 2009 and $15.2 million in 2008, a 2007 accounts receivable correction of $2.6 million recorded in 2008 andother non-operating expenses of $2.9 million in 2009 and $0.6 million in 2008, and excluding from net income discrete tax items of $1.0 million in both 2009 and 2008. Managementbelieves that the non-GAAP run rate is more reflective of the earnings or loss directly attributable to the investments in our operating businesses.
2010
$ 1,302,314 73,633 70,968 46,427 31,041 (14,938) (31,581) 19,820
$ 2.25 20,590$ 38.64 18.67
5.7% 17.4% 18%
$ 73,633 2.25 17.4%
2,484$ 524
2009
$ 715,186 (19,485) (20,784) (12,355) 41,643 (54,107) (16,703) 23,117
$ (0.61) 20,191$ 18.54 16.83
(2.7%) (5.1%) 16%
$ (10,985) (0.38) (2.9%)
2,196$ 326
2008
$ 909,711 28,071 26,076 18,357 76,877 (63,137) (27,853) 752
$ 0.89 20,543$ 12.72 16.90
3.1% 7.7% 11%
$ 46,471 1.44 12.8%
2,235$ 407
(Dollars in thousands except per share amounts)
Operating DataNet sales . . . . . . . . . . . . . . . . . . . . . . . . . . . . . . . . . . . . . . . . . . . . . . . . . . . . Operating profit (loss) . . . . . . . . . . . . . . . . . . . . . . . . . . . . . . . . . . . . . . . . . Income (loss) before income taxes . . . . . . . . . . . . . . . . . . . . . . . . . . . . . . . Net income (loss) . . . . . . . . . . . . . . . . . . . . . . . . . . . . . . . . . . . . . . . . . . . . . Net cash provided from operating activities . . . . . . . . . . . . . . . . . . . . . . . Net cash used for the purchase of businesses . . . . . . . . . . . . . . . . . . . . . . Net cash used in other investing activities . . . . . . . . . . . . . . . . . . . . . . . . . Net cash provided from financing activities . . . . . . . . . . . . . . . . . . . . . . . .
Per Share Data (Diluted)Earnings per share . . . . . . . . . . . . . . . . . . . . . . . . . . . . . . . . . . . . . . . . . . . . Shares outstanding (weighted-average, in thousands) . . . . . . . . . . . . . . . . Closing price of common shares . . . . . . . . . . . . . . . . . . . . . . . . . . . . . . . . . Book value per share . . . . . . . . . . . . . . . . . . . . . . . . . . . . . . . . . . . . . . . . . .
RatiosReturn on sales . . . . . . . . . . . . . . . . . . . . . . . . . . . . . . . . . . . . . . . . . . . . . . . Return on invested capital*. . . . . . . . . . . . . . . . . . . . . . . . . . . . . . . . . . . . . Debt-to-debt-plus-equity . . . . . . . . . . . . . . . . . . . . . . . . . . . . . . . . . . . . . .
Non-GAAP Operating Run Rate Data**Run rate operating profit (loss) . . . . . . . . . . . . . . . . . . . . . . . . . . . . . . . . . . Run rate earnings per share (diluted) . . . . . . . . . . . . . . . . . . . . . . . . . . . . . Run rate return on invested capital . . . . . . . . . . . . . . . . . . . . . . . . . . . . . .
OtherNumber of employees . . . . . . . . . . . . . . . . . . . . . . . . . . . . . . . . . . . . . . . . . Average sales per employee . . . . . . . . . . . . . . . . . . . . . . . . . . . . . . . . . . . .
SHAREHOLDER RETURNS
UNITED STATES SECURITIES AND EXCHANGE COMMISSIONWashington, D.C. 20549
Form 10-K(Mark One)
¥ ANNUAL REPORT PURSUANT TO SECTION 13 OR 15(d)OF THE SECURITIES EXCHANGE ACT OF 1934For the Fiscal Year Ended December 31, 2010
OR
n TRANSITION REPORT PURSUANT TO SECTION 13 OR 15(d)OF THE SECURITIES EXCHANGE ACT OF 1934For the Transition Period from to
Commission File Number 1-15885
MATERION CORPORATION(Exact name of Registrant as specified in its charter)
Ohio 34-1919973(State or other jurisdiction ofincorporation or organization)
(I.R.S. EmployerIdentification No.)
6070 Parkland Blvd., Mayfield Heights, Ohio 44124(Address of principal executive offices) (Zip Code)
Registrant’s telephone number, including area code216-486-4200
Securities registered pursuant to Section 12(b) of the Act:Title of Each Class Name of Each Exchange on Which Registered
Common Stock, no par value New York Stock Exchange
Securities registered pursuant to Section 12(g) of the Act:None
Indicate by check mark if the registrant is a well-known seasoned issuer, as defined in Rule 405 of the SecuritiesAct. Yes ¥ No n
Indicate by check mark if the registrant is not required to file reports pursuant to Section 13 or Section 15(d) of the Act. Yes n No ¥
Indicate by check mark whether the registrant (1) has filed all reports required to be filed by Section 13 or 15(d) of the SecuritiesExchange Act of 1934 during the preceding 12 months (or for such shorter period that the registrant was required to file such reports), and(2) has been subject to such filing requirements for the past 90 days. Yes ¥ No n
Indicate by check mark whether the registrant has submitted electronically and posted on its corporate Web site, if any, everyInteractive Data File required to be submitted and posted pursuant to Rule 405 of Regulation S-T (§ 232.405 of this chapter) during thepreceding 12 months (or for such shorter period that the registrant was required to submit and post such files). Yes n No n
Indicate by check mark if disclosure of delinquent filers pursuant to Item 405 of Regulation S-K (§ 229.405 of this chapter) is notcontained herein, and will not be contained, to the best of registrant’s knowledge, in definitive proxy or information statementsincorporated by reference in Part III of this Form 10-K or any amendment to this Form 10-K. n
Indicate by check mark whether the registrant is a large accelerated filer, an accelerated filer, a non-accelerated filer, or a smallerreporting company. See the definitions of “large accelerated filer,” “accelerated filer” and “smaller reporting company” in Rule 12b-2 ofthe Exchange Act. (Check one):Large accelerated filer n Accelerated filer ¥ Non-accelerated filer n
(Do not check if a smaller reporting company)Smaller reporting company n
Indicate by check mark whether the registrant is a shell company (as defined in Rule 12b-2 of the Act). Yes n No ¥
The aggregate market value of Common Stock, no par value, held by non-affiliates of the registrant (based upon the closing saleprice on the New York Stock Exchange) on July 2, 2010 was $387,244,077.
As of February 21, 2011, there were 20,357,787 common shares, no par value, outstanding.
DOCUMENTS INCORPORATED BY REFERENCE
Portions of the proxy statement for the annual meeting of shareholders to be held on or about May 4, 2011 are incorporated byreference into Part III.
MATERION CORPORATION
Index to Annual ReportOn Form 10-K for
Year Ended December 31, 2010
PART IItem 1. Business . . . . . . . . . . . . . . . . . . . . . . . . . . . . . . . . . . . . . . . . . . . . . . . . . . . . . . . . . . . . . . . 2
Item 1A. Risk Factors . . . . . . . . . . . . . . . . . . . . . . . . . . . . . . . . . . . . . . . . . . . . . . . . . . . . . . . . . . . . . 6
Item 1B. Unresolved Staff Comments . . . . . . . . . . . . . . . . . . . . . . . . . . . . . . . . . . . . . . . . . . . . . . . . . 15
Item 2. Properties. . . . . . . . . . . . . . . . . . . . . . . . . . . . . . . . . . . . . . . . . . . . . . . . . . . . . . . . . . . . . . . 16
Item 3. Legal Proceedings . . . . . . . . . . . . . . . . . . . . . . . . . . . . . . . . . . . . . . . . . . . . . . . . . . . . . . . . 17
Item 4. (Removed and Reserved) . . . . . . . . . . . . . . . . . . . . . . . . . . . . . . . . . . . . . . . . . . . . . . . . . . . 19
PART IIItem 5. Market for Registrant’s Common Equity, Related Stockholder Matters and Issuer Purchases
of Equity Securities . . . . . . . . . . . . . . . . . . . . . . . . . . . . . . . . . . . . . . . . . . . . . . . . . . . . . . . 20
Item 6. Selected Financial Data . . . . . . . . . . . . . . . . . . . . . . . . . . . . . . . . . . . . . . . . . . . . . . . . . . . . 21
Item 7. Management’s Discussion and Analysis of Financial Condition and Results of Operations . . . 22
Item 7A. Quantitative and Qualitative Disclosures About Market Risk . . . . . . . . . . . . . . . . . . . . . . . . . 47
Item 8. Financial Statements and Supplementary Data . . . . . . . . . . . . . . . . . . . . . . . . . . . . . . . . . . . . 49
Item 9. Changes in and Disagreements with Accountants on Accounting and Financial Disclosure . . 90
Item 9A. Controls and Procedures . . . . . . . . . . . . . . . . . . . . . . . . . . . . . . . . . . . . . . . . . . . . . . . . . . . . 90
Item 9B. Other Information . . . . . . . . . . . . . . . . . . . . . . . . . . . . . . . . . . . . . . . . . . . . . . . . . . . . . . . . 90
PART IIIItem 10. Directors, Executive Officers and Corporate Governance . . . . . . . . . . . . . . . . . . . . . . . . . . . . 92
Item 11. Executive Compensation. . . . . . . . . . . . . . . . . . . . . . . . . . . . . . . . . . . . . . . . . . . . . . . . . . . . 92
Item 12. Security Ownership of Certain Beneficial Owners and Management and Related StockholderMatters . . . . . . . . . . . . . . . . . . . . . . . . . . . . . . . . . . . . . . . . . . . . . . . . . . . . . . . . . . . . . . . . 93
Item 13. Certain Relationships and Related Transactions, and Director Independence . . . . . . . . . . . . . . 93
Item 14. Principal Accountant Fees and Services . . . . . . . . . . . . . . . . . . . . . . . . . . . . . . . . . . . . . . . . 93
PART IVItem 15. Exhibits and Financial Statement Schedules . . . . . . . . . . . . . . . . . . . . . . . . . . . . . . . . . . . . . 94
Signatures . . . . . . . . . . . . . . . . . . . . . . . . . . . . . . . . . . . . . . . . . . . . . . . . . . . . . . . . . . . . . . 100
Forward-looking Statements
Portions of the narrative set forth in this document that are not statements of historical or current facts areforward-looking statements. Our actual future performance may materially differ from that contemplated by theforward-looking statements as a result of a variety of factors. These factors include, in addition to those mentionedelsewhere herein:
• The global economy;
• The condition of the markets which we serve, whether defined geographically or by segment, with the majormarket segments being: consumer electronics, defense and science, industrial components and commercialaerospace, energy, automotive electronics, telecommunications infrastructure, medical and appliance;
• Changes in product mix and the financial condition of customers;
• Actual sales, operating rates and margins for 2011;
• Our success in developing and introducing new products and new product ramp-up rates;
• Our success in passing through the costs of raw materials to customers or otherwise mitigating fluctuatingprices for those materials, including the impact of fluctuating prices on inventory values;
• Our success in integrating newly acquired businesses, including the acquisitions of Materion PrecisionOptics and Thin Film Coatings Inc. (formerly known as Barr Associates, Inc.) and Materion AdvancedMaterials Technologies and Services Corp. (formerly known as Academy Corporation);
• The impact of the results of Materion Precision Optics and Thin Film Coatings Inc. and Materion AdvancedMaterials Technologies and Services Corp. on our ability to achieve fully the strategic and financialobjectives related to these acquisitions;
• Our success in implementing our strategic plans and the timely and successful completion and start-up ofany capital projects, including the new primary beryllium facility in Elmore, Ohio;
• The availability of adequate lines of credit and the associated interest rates;
• Other financial factors, including the cost and availability of raw materials (both base and precious metals),metal financing fees, tax rates, exchange rates, pension costs and required cash contributions and otheremployee benefit costs, energy costs, regulatory compliance costs, the cost and availability of insurance, andthe impact of our stock price on the cost of incentive compensation plans;
• The uncertainties related to the impact of war and terrorist activities;
• Changes in government regulatory requirements and the enactment of new legislation that impacts ourobligations and operations;
• The conclusion of pending litigation matters in accordance with our expectation that there will be nomaterial adverse effects;
• The amount and timing of repurchases of our Common Stock, if any;
• The timing and ability to achieve further efficiencies and synergies resulting from our name change, fromBrush Engineered Materials Inc. to Materion Corporation, and product line alignment under the Materionname and Materion brand; and
• The risk factors set forth elsewhere in Part I, Item 1A of this Form 10-K.
1

Item 1. BUSINESS
Materion Corporation (formerly known as Brush Engineered Materials Inc.), through its wholly ownedsubsidiaries, is an integrated producer of high performance advanced engineered materials used in a variety ofelectrical, electronic, thermal and structural applications. Our products are sold into numerous markets, includingconsumer electronics, defense and science, industrial components and commercial aerospace, energy, automotiveelectronics, telecommunications infrastructure, medical and appliance. As of December 31, 2010, we had2,484 employees.
In the first quarter 2011, we announced the change of our name from Brush Engineered Materials Inc. toMaterion Corporation. The names of all of our active subsidiaries are changing as well and each subsidiary will haveMaterion as part of their name. The legal and ownership structure of our subsidiaries will remain unchanged.
This name change did not alter our senior management structure or how the chief decision maker evaluates theperformance of our businesses. We continue to have the same four reportable segments as we had previously with nochange in their make up, although the names of those segments have changed. Advanced Material Technologies andServices has been renamed as Advanced Material Technologies; Specialty Engineered Alloys is now known asPerformance Alloys; Beryllium and Beryllium Composites has been shortened to Beryllium and Composites; andEngineered Material Systems has been changed to Technical Materials.
All Other includes our parent company expenses, other corporate charges and the operating results of MaterionServices Inc., a wholly owned subsidiary that provides administrative and financial oversight services to our otherbusinesses on a cost-plus basis. Corporate employees not included in a reportable segment totaled 92 as ofDecember 31, 2010.
We use our web site, www.materion.com, as a channel for routine distribution of important information,including news releases, analyst presentations, and financial information. We post filings as soon as reasonablypracticable after they are electronically filed with, or furnished to, the SEC, including our annual, quarterly, andcurrent reports on Forms 10-K, 10-Q, and 8-K; our proxy statements; and any amendments to those reports orstatements. All such postings and filings are available on our web site free of charge. In addition, this web site allowsinvestors and other interested persons to sign up to automatically receive e-mail alerts when we post news releasesand financial information on our web site. The SEC also maintains a web site, www.sec.gov, that contains reports,proxy and information statements, and other information regarding issuers who file electronically with the SEC.The content on any web site referred to in this Annual Report on Form 10-K is not incorporated by reference intothis annual report unless expressly noted.
ADVANCED MATERIAL TECHNOLOGIES
Sales for this segment were $879.0 million, or 67% of total sales, in 2010; $460.8 million, or 64% of total sales,in 2009; and $480.3 million, or 53% of total sales, in 2008. As of December 31, 2010, Advanced MaterialTechnologies had 1,089 employees.
Advanced Material Technologies manufactures precious, non-precious and specialty metal products,including vapor deposition targets, frame lid assemblies, clad and precious metal preforms, high temperaturebraze materials, ultra-fine wire, advanced chemicals, optics, performance coatings and microelectronic packages.These products are used in wireless, semiconductor, photonic, hybrid and other microelectronic applications withinthe consumer electronics and telecommunications infrastructure markets. Other key markets for these productsinclude medical, defense and science, energy and industrial components. Advanced Material Technologies also hasmetal cleaning operations and in-house refineries that allow for the reclaim of precious metals from internallygenerated or customers’ scrap.
Advanced Material Technologies’ products are sold directly from its facilities throughout the U.S., Asia andEurope, as well as through direct sales offices and independent sales representatives throughout the world. Principalcompetition includes companies such as Sumitomo Metals, Heraeus Inc., Praxair, Inc., Honeywell InternationalInc., Solar Applied Materials Technology Corp. and a number of smaller regional and national suppliers.
2

Advanced Material Technologies — Sales and Backlog
The backlog of unshipped orders for Advanced Material Technologies as of December 31, 2010, 2009 and2008 was $55.4 million, $51.3 million and $34.6 million, respectively. Backlog is generally represented bypurchase orders that may be terminated under certain conditions. We expect that substantially all of our backlog oforders for this segment at December 31, 2010 will be filled during 2011.
Sales are made to over 7,100 customers. Government sales accounted for less than 1% of the sales volume in2010, 2009 and 2008. Sales outside the United States, principally to Europe and Asia, accounted for approximately19% of sales in 2010, 29% of sales in 2009 and 28% of sales in 2008. Other segment reporting and geographicinformation is contained in Note M of Notes to Consolidated Financial Statements, which can be found in Part II,Item 8 of this Form 10-K and which is incorporated herein by reference.
Advanced Material Technologies — Research and Development
Active research and development programs seek new product compositions and designs as well as processinnovations. Expenditures for research and development for Advanced Material Technologies amounted to$4.0 million in 2010, $3.2 million in 2009 and $2.9 million in 2008. A staff of 22 scientists, engineers andtechnicians was employed in this effort as of year-end 2010.
PERFORMANCE ALLOYS
Sales for this segment were $293.8 million, or 23% of total sales, in 2010; $172.5 million, or 24% of total sales,in 2009; and $299.9 million, or 33% of total sales, in 2008. As of December 31, 2010, Performance Alloys had893 employees.
Performance Alloys manufactures and sells three main product families: strip products, bulk products andberyllium hydroxide. Strip products, the larger of the product families, include thin gauge precision strip and thindiameter rod and wire. These copper and nickel alloys provide a combination of high conductivity, high reliabilityand formability for use as connectors, contacts, switches, relays and shielding. Major markets for strip productsinclude consumer electronics, telecommunications infrastructure, automotive electronics, appliance and medical.Performance Alloys’ primary direct competitor in strip form beryllium alloys is NGK Insulators, Ltd. of Nagoya,Japan, with subsidiaries in the United States and Europe. Performance Alloys also competes with alloy systemsmanufactured by Global Brass and Copper, Inc., Wieland Electric, Inc., Stolberger Metallwerke GmbH, NipponMining, PMX Industries, Inc. and also with other generally less expensive materials, including phosphor bronze,stainless steel and other specialty copper and nickel alloys which are produced by a variety of companies around theworld.
Bulk products are copper and nickel-based alloys manufactured in plate, rod, bar, tube and other customizedforms that, depending upon the application, may provide superior strength, corrosion or wear resistance, thermalconductivity or lubricity. While the majority of bulk products contain beryllium, a growing portion of bulkproducts’ sales is from non-beryllium-containing alloys as a result of product diversification efforts. Applicationsfor bulk products include oil and gas drilling components, bearings, bushings, welding rods, plastic mold tooling,and undersea telecommunications housing equipment. In the area of bulk products, in addition to NGK Insulators,Ltd., Performance Alloys competes with several smaller regional producers such as International Beryllium Corp.,Ningxia Orient Tantalum in China and LeBronze Industriel in Europe.
Beryllium hydroxide is produced at our milling operations in Utah from our bertrandite mine and purchasedberyl ore. The hydroxide is used primarily as a raw material input for strip and bulk products and, to a lesser extent,by the Beryllium and Composites segment. External sales of hydroxide from the Utah operations were less than 4%of Performance Alloys’ total sales in each of the three most recent years. We also sell beryllium hydroxideexternally to NGK Insulators, Ltd.
Strip and bulk products are manufactured at facilities in Ohio and Pennsylvania and are distributedinternationally through a network of company-owned service centers and outside distributors and agents.
3
Performance Alloys — Sales and Backlog
The backlog of unshipped orders for Performance Alloys as of December 31, 2010, 2009 and 2008 was$98.9 million, $68.6 million and $55.5 million, respectively. Backlog is generally represented by purchase ordersthat may be terminated under certain conditions. We expect that substantially all the backlog of orders for thissegment as of December 31, 2010 will be filled during 2011.
Sales are made to over 1,700 customers. Performance Alloys had government sales accounting for less than1% of segment sales in 2010 and 2009 and none in 2008. Sales outside the United States, principally to Europe andAsia, accounted for approximately 58% of sales in 2010 and 57% of sales in 2009 and 2008. Other segmentreporting and geographic information is contained in Note M of Notes to Consolidated Financial Statements, whichcan be found in Part II, Item 8 of this Form 10-K and which is incorporated herein by reference.
Performance Alloys — Research and Development
Active research and development programs seek new product compositions and designs as well as processinnovations. Expenditures for research and development amounted to $1.8 million in 2010, $2.2 million in 2009 and$2.3 million in 2008. A staff of seven scientists, engineers and technicians was employed in this effort as of year-end2010.
BERYLLIUM AND COMPOSITES
Sales for this segment were $61.9 million, or 5% of total sales, in 2010; $47.0 million, or 7% of total sales, in2009; and $63.6 million, or 7% of total sales, in 2008. As of December 31, 2010, Beryllium and Composites had226 employees.
Beryllium and Composites manufactures beryllium-based metals and metal matrix composites in rod, sheet, foiland a variety of customized forms at our Elmore, Ohio and Fremont, California facilities. These materials are used inapplications that require high stiffness and/or low density and they tend to be premium-priced due to their uniquecombination of properties. This segment also manufactures beryllia ceramics produced at our Tucson, Arizonafacility. Defense and science is the largest market for Beryllium and Composites, while other markets served includeindustrial components and commercial aerospace, medical, energy and telecommunications infrastructure. Productsare also sold for acoustics and optical scanning applications. A majority of defense sales are made to contractors andsubcontractors instead of directly to government entities. In June 2008, we announced that Materion Brush Inc.(formerly known as Brush Wellman Inc.), a wholly owned subsidiary, had entered into an agreement with theDepartment of Defense to construct a $93.6 million primary beryllium facility. This facility will produce primaryberyllium, the feedstock material used to produce beryllium metal products. Construction of this facility wascompleted in 2011, and the start-up is underway. Beryllium-containing products are sold throughout the world througha direct sales organization and through company-owned and independent distribution centers. While Beryllium andComposites is the only domestic producer of metallic beryllium, it competes primarily with designs utilizing othermaterials including metals, metal matrix and organic composites. Electronic components utilizing beryllia are used inthe telecommunications infrastructure, medical, industrial components and commercial aerospace, and defense andscience markets. These products are distributed through direct sales and independent sales agents. Direct competitorsinclude American Beryllia Inc. and CBL Ceramics Limited.
Beryllium and Composites — Sales and Backlog
The backlog of unshipped orders for Beryllium and Composites as of December 31, 2010, 2009 and 2008 was$26.1 million, $38.1 million and $28.7 million, respectively. Backlog is generally represented by purchase ordersthat may be terminated under certain conditions. We expect that substantially all of our backlog of orders for thissegment at December 31, 2010 will be filled during 2011.
Sales are made to over 300 customers. Government sales accounted for less than 2% of Beryllium andComposites’ sales in 2010 and 2009, and less than 1% of segment sales in 2008. Sales outside the United States,principally to Europe and Asia, accounted for approximately 22% of sales in each of 2010 and 2009, and 23% of salesin 2008. Other segment reporting and geographic information is contained in Note M of Notes to ConsolidatedFinancial Statements, which can be found in Part II, Item 8 of this Form 10-K and which is incorporated herein byreference.
4
Beryllium and Composites — Research and Development
Active research and development programs seek new product compositions and designs as well as processinnovations. Expenditures for research and development amounted to $1.3 million in 2010, $1.4 million in 2009 and$1.3 million in 2008. A staff of seven scientists, engineers and technicians was employed in this effort as of year-end 2010.Some research and development projects, expenditures for which are not material, were externally sponsored and funded.
TECHNICAL MATERIALS
Sales for this segment were $67.5 million, or 5% of total sales, in 2010; $34.7 million, or 5% of total sales, in2009; and $65.9 million, or 7% of total sales, in 2008. As of December 31, 2010, Technical Materials had184 employees.
Technical Materials manufactures clad inlay and overlay metals, precious and base metal electroplatedsystems, electron beam welded systems, contour profiled systems and solder-coated metal systems. These specialtystrip metal products provide a variety of thermal, electrical or mechanical properties from a surface area orparticular section of the material. Our cladding and plating capabilities allow for a precious metal or brazing alloy tobe applied to a base metal only where it is needed, reducing the material cost to the customer as well as providingdesign flexibility. Major applications for these products include connectors, contacts and semiconductors while thelargest markets are automotive electronics and consumer electronics. The defense and science, energy and medicalmarkets are smaller, but offer further growth opportunities. Technical Materials’ products are manufactured at ourLincoln, Rhode Island facility and sold directly and through its sales representatives. Technical Materials’ majorcompetitors include Umicore S.A., Heraeus Inc. and Doduco, Inc.
Technical Materials — Sales and Backlog
The backlog of unshipped orders for Technical Materials as of December 31, 2010, 2009 and 2008 was$16.3 million, $7.6 million and $7.6 million, respectively. Backlog is generally represented by purchase orders thatmay be terminated under certain conditions. We expect that substantially all of our backlog of orders for thissegment at December 31, 2010 will be filled during 2011.
Sales are made to over 200 customers. Technical Materials did not have any sales to the government for 2010,2009 or 2008. Sales outside the United States, principally to Europe and Asia, accounted for approximately 26% ofTechnical Materials’ sales in 2010, 21% of sales in 2009 and 17% of sales in 2008. Other segment reporting andgeographic information is contained in Note M of Notes to Consolidated Financial Statements, which can be foundin Part II, Item 8 of this Form 10-K and which is incorporated herein by reference.
Technical Materials — Research and Development
Active research and development programs seek new product compositions and designs as well as processinnovations. Expenditures for research and development for Technical Materials were nominal in 2010, 2009 and 2008.
GENERAL
Availability of Raw Materials
The principal raw materials we use are aluminum, beryllium, cobalt, copper, gold, nickel, palladium, platinum,ruthenium, silver and tin. Ore reserve data can be found in Part II, Item 7 of this Form 10-K. The availability of theseraw materials, as well as other materials used by us, is adequate and generally not dependent on any one supplier.
Patents and Licenses
We own patents, patent applications and licenses relating to certain of our products and processes. While ourrights under the patents and licenses are of some importance to our operations, our business is not materiallydependent on any one patent or license or on all of our patents and licenses as a group.
Regulatory Matters
We are subject to a variety of laws which regulate the manufacture, processing, use, handling, storage,transport, treatment, emission, release and disposal of substances and wastes used or generated in manufacturing.For decades we have operated our facilities under applicable standards of inplant and outplant emissions andreleases. The inhalation of airborne beryllium particulate may present a health hazard to certain individuals.
5

Standards for exposure to beryllium are under review by the U.S. Occupational Safety and HealthAdministration (OSHA) and by other governmental and private standard-setting organizations. One result ofthese reviews will likely be more stringent worker safety standards. Some organizations, such as the CaliforniaOccupational Health and Safety Administration and the American Conference of Governmental IndustrialHygienists, have adopted standards that are more stringent than the current standards of OSHA. Thedevelopment, proposal or adoption of more stringent standards may affect buying decisions by the users ofberyllium-containing products. If the standards are made more stringent and/or our customers or other downstreamusers decide to reduce their use of beryllium-containing products, our results of operations, liquidity and financialcondition could be materially adversely affected. The impact of this potential adverse effect would depend on thenature and extent of the changes to the standards, the cost and ability to meet the new standards, the extent of anyreduction in customer use and other factors. The magnitude of this potential adverse effect cannot be estimated.
Executive Officers of the Registrant
Name Age Positions and Offices
Richard J. Hipple 58 Chairman of the Board, President and Chief Executive Officer. InMay 2006, Mr. Hipple was named Chairman of the Board and ChiefExecutive Officer of Materion Corporation. He had served asPresident since May 2005. He was Chief Operating Officer fromMay 2005 until May 2006. Mr. Hipple served as President ofPerformance Alloys from May 2002 until May 2005. He joinedthe Company in July 2001 as Vice President of Strip Products andserved in that position until May 2002. Prior to joining Materion,Mr. Hipple was President of LTV Steel Company, a business unit ofthe LTV Corporation (integrated steel producer and metal fabricator).Prior to running LTV’s steel business, Mr. Hipple held numerousleadership positions in engineering, operations, strategic planning,sales and marketing and procurement since 1975 at LTV. Mr. Hipplehas served on the Board of Directors of Ferro Corporation since 2007and as its Lead Director since April 2010.
John D. Grampa 63 Senior Vice President Finance and Chief Financial Officer.Mr. Grampa was named Senior Vice President Finance and ChiefFinancial Officer in December 2006. Prior to that, he had served asVice President Finance and Chief Financial Officer since November1999 and as Vice President Finance since October 1998. Prior tothat, he had served as Vice President, Finance for the WorldwideMaterials Business of Avery Dennison Corporation since March1994 and held other various positions at Avery DennisonCorporation (producer of pressure sensitive materials, officeproducts, labels and other converted products) from 1984.
Daniel A. Skoch 61 Senior Vice President Administration. Mr. Skoch was namedSenior Vice President Administration in July 2000. Prior to thattime, he had served as Vice President Administration and HumanResources since March 1996. He had served as Vice PresidentHuman Resources since July 1991 and prior to that time, he wasCorporate Director – Personnel.
Item 1A. RISK FACTORS
Our business, financial condition, results of operations and cash flows can be affected by a number of factors,including, but not limited to, those set forth below and elsewhere in this Annual Report on Form 10-K, any one ofwhich could cause our actual results to vary materially from recent results or from our anticipated future results.Therefore, an investment in us involves some risks, including the risks described below. The risks discussed beloware not the only risks that we may experience. If any of the following risks occur, our business, results of operationsor financial condition could be negatively impacted.
6

The businesses of many of our customers are subject to significant fluctuations as a result of the cyclical natureof their industries and their sensitivity to general economic conditions, which could adversely affect the demandfor our products and reduce our sales and profitability.
A substantial number of our customers are in the consumer electronics, telecommunications infrastructure,defense and science, industrial components and commercial aerospace, automotive electronics and applianceindustries. Each of these industries is cyclical in nature, influenced by a combination of factors that could have anegative impact on our business, including, among other things, periods of economic growth or recession, strengthor weakness of the U.S. dollar, the strength of the consumer electronics, automotive electronics and computerindustries and the rate of construction of telecommunications infrastructure equipment and government spendingon defense.
Also, in times when growth rates in our markets slow down, there may be temporary inventory adjustments byour customers that may negatively affect our business.
The recent global economic crisis had, and any additional negative or uncertain worldwide economic conditionsmay have, a negative impact on our financial performance.
The recent global economic crisis adversely affected the global economy. Some customers experienceddifficulty in obtaining adequate financing due to the disruption in the credit markets, which has impacted our sales.Our exposure to bad debt losses may also increase if customers are unable to pay for products previously ordered.The severe recession has also caused higher unemployment rates globally which could have an adverse effect ondemand for consumer electronics, which comprised 41% of our sales in 2010. Any additional negative or uncertainfinancial and macroeconomic conditions may have a significant adverse effect on our sales, profitability and resultsof operations.
We may not be able to execute our acquisition strategy or successfully integrate acquired businesses.
We have been active over the last several years in pursuing niche acquisitions. For example, during 2010 wecompleted the acquisition of Materion Advanced Materials Technologies and Services Corp. (formerly known asAcademy Corporation). We intend to continue to consider further growth opportunities through the acquisition ofassets or companies and routinely review acquisition opportunities. We cannot predict whether we will besuccessful in pursuing any acquisition opportunities or what the consequences of any acquisition would be.Future acquisitions may involve the expenditure of significant funds and management time. Depending upon thenature, size and timing of future acquisitions, we may be required to raise additional financing, which may not beavailable to us on acceptable terms. Further, we may not be able to successfully integrate any acquired business withour existing businesses or recognize any expected advantages from any completed acquisition.
In addition, there may be liabilities that we fail, or are unable, to discover in the course of performing duediligence investigations on the assets or companies we have already acquired or may acquire in the future. Wecannot assure that rights to indemnification by the sellers of these assets or companies to us, even if obtained, will beenforceable, collectible or sufficient in amount, scope or duration to fully offset the possible liabilities associatedwith the business or property acquired. Any such liabilities, individually or in the aggregate, could have a materiallyadverse effect on our business, financial condition and results of operations.
The markets for our products are experiencing rapid changes in technology.
We operate in markets characterized by rapidly changing technology and evolving customer specifications andindustry standards. New products may quickly render an existing product obsolete and unmarketable. For example,copper beryllium has long been used for high reliability contacts in mobile handheld devices. Mobile devicedesigners may justify using lower-performance materials in some of the less-critical components of mobile phones.Our growth and future results of operations depend in part upon our ability to enhance existing products andintroduce newly developed products on a timely basis that conform to prevailing and evolving industry standards,meet or exceed technological advances in the marketplace, meet changing customer specifications, achieve marketacceptance and respond to our competitors’ products.
7

The process of developing new products can be technologically challenging and requires the accurateanticipation of technological and market trends. We may not be able to introduce new products successfully ordo so on a timely basis. If we fail to develop new products that are appealing to our customers or fail to developproducts on time and within budgeted amounts, we may be unable to recover our research and development costs,which could adversely affect our margins and profitability.
A portion of our revenue is derived from the sale of defense-related products through various contracts andsubcontracts. These contracts may be suspended or canceled, which could have an adverse impact on ourrevenue.
In 2010, 12% of our revenue was derived from sales to customers in the defense and science market. A portionof these customers operate under contracts with the U.S. government, which are vulnerable to termination at anytime, for convenience or default. Some of the reasons for cancellation include, but are not limited to, budgetaryconstraints or re-appropriation of government funds, timing of contract awards, violations of legal or regulatoryrequirements, and changes in political agenda. If these cancellations were to occur, it would result in a reduction onour revenue. For example, various projects, including the F-22 fighter aircraft, have been canceled, which had, andwill have, a negative impact on our revenue.
Our products are deployed in complex applications and may have errors or defects that we find only afterdeployment.
Our products are highly complex, designed to be deployed in complicated applications and may containundetected defects, errors or failures. Although our products are generally tested during manufacturing, prior todeployment, they can only be fully tested when deployed in specific applications. For example, we sell beryllium-copper alloy strip products in a coil form to some customers, who then stamp the alloy for its specific purpose. Onoccasion, it is not until such customer stamps the alloy that a defect in the alloy is detected. Consequently, ourcustomers may discover errors after the products have been deployed. The occurrence of any defects, errors, orfailures could result in installation delays, product returns, termination of contracts with our customers, diversion ofour resources, increased service and warranty costs and other losses to our customers, end users or to us. Any ofthese occurrences could also result in the loss of or delay in market acceptance of our products and could damageour reputation, which could reduce our sales.
The terms of our indebtedness may restrict our operations, including our ability to pursue our growth andacquisition strategies.
The terms of our credit facilities contain a number of restrictive covenants, including restrictions in our abilityto, among other things, borrow and make investments, acquire other businesses and consign additional preciousmetals. These covenants could adversely affect us by limiting our ability to plan for or react to market conditions orto meet our capital needs, as well as adversely affect our ability to pursue our growth, acquisition strategies andother strategic initiatives.
Our failure to comply with the covenants contained in the terms of our indebtedness could result in an event ofdefault, which could materially and adversely affect our operating results and our financial condition.
The terms of our credit facilities require us to comply with various covenants, including financial covenants. Ifthe recent global economic downturn returns, it could have a material adverse impact on our earnings and cash flow,which could adversely affect our ability to comply with our financial covenants and could limit our borrowingcapacity. Our ability to comply with these covenants depends, in part, on factors over which we may have nocontrol. A breach of any of these covenants could result in an event of default under one or more of the agreementsgoverning our indebtedness that, if not cured or waived, could give the holders of the defaulted indebtedness theright to terminate commitments to lend and cause all amounts outstanding with respect to the indebtedness to be dueand payable immediately. Acceleration of any of our indebtedness could result in cross defaults under our other debtinstruments. Our assets and cash flow may be insufficient to fully repay borrowings under all of our outstandingdebt instruments if some or all of these instruments are accelerated upon an event of default, in which case we maybe required to seek legal protection from our creditors.
8

We conduct our sales and distribution operations on a worldwide basis and are subject to the risks associated withdoing business outside the United States.
We sell to customers outside of the United States from our United States and international operations. We havebeen and are continuing to expand our geographic reach in Europe and Asia. Shipments to customers outside of theUnited States accounted for approximately 28% of our sales in 2010, 35% in 2009 and 37% in 2008. We anticipatethat international shipments will account for a significant portion of our sales for the foreseeable future. Revenuefrom international operations (principally Europe and Asia) amounted to approximately 17% of our sales in 2010and 24% in each of 2009 and 2008. There are a number of risks associated with international business activities,including:
• burdens to comply with multiple and potentially conflicting foreign laws and regulations, including exportrequirements, tariffs and other barriers, environmental health and safety requirements and unexpectedchanges in any of these factors;
• difficulty in obtaining export licenses from the United States government;
• political and economic instability and disruptions, including terrorist attacks;
• disadvantages of competing against companies from countries that are not subject to U.S. laws andregulations, including the Foreign Corrupt Practices Act (FCPA);
• potentially adverse tax consequences due to overlapping or differing tax structures; and
• fluctuations in currency exchange rates.
Any of these risks could have an adverse effect on our international operations by reducing the demand for ourproducts or reducing the prices at which we can sell our products, which could result in an adverse effect on ourbusiness, financial position, results of operations or cash flows.
In addition, we could be adversely affected by violations of the FCPA and similar worldwide anti-bribery laws.The FCPA and similar anti-bribery laws in other jurisdictions generally prohibit companies and their intermediariesfrom making improper payments to non-U.S. officials for the purpose of obtaining or retaining business. Ourpolicies mandate compliance with these anti-bribery laws. We operate in many parts of the world that haveexperienced governmental corruption to some degree and, in certain circumstances, strict compliance with anti-bribery laws may conflict with local customs and practices. We cannot assure you that our internal controls andprocedures always will protect us from the reckless or criminal acts committed by our employees or agents. If weare found to be liable for FCPA violations, we could suffer from criminal or civil penalties or other sanctions, whichcould have a material adverse effect on our business.
A major portion of our bank debt consists of variable-rate obligations, which subjects us to interest ratefluctuations.
Our credit facilities are secured by substantially all of our assets (other than non-mining real property andcertain other assets). Our working capital line of credit includes variable-rate obligations, which expose us tointerest rate risks. If interest rates increase, our debt service obligations on our variable-rate indebtedness wouldincrease even if the amount borrowed remained the same, resulting in a decrease in our net income. We havedeveloped a hedging program to manage the risks associated with interest rate fluctuations, but our program maynot effectively eliminate all of the financial exposure associated with interest rate fluctuations. Additionalinformation regarding our market risks is contained in Part II, Item 7A of this Form 10-K.
The availability and prices of some raw materials we use in our manufacturing operations fluctuate, andincreases in raw material costs can adversely affect our operating results and our financial condition.
We manufacture advanced engineered materials using various precious and non-precious metals, includingaluminum, beryllium, cobalt, copper, gold, nickel, palladium, platinum, ruthenium, silver and tin. The availabilityof and prices for these raw materials are subject to volatility and are influenced by worldwide economic conditions,speculative action, world supply and demand balances, inventory levels, availability of substitute metals, the
9

U.S. dollar exchange rate, production costs of United States and foreign competitors, anticipated or perceivedshortages and other factors. Precious metal prices, including prices for gold and silver, have increased significantlyin recent years. These higher prices can cause adjustments to our inventory carrying values, whether a result ofquantity discrepancies, normal manufacturing losses, differences in scrap rates, theft or other factors, to have agreater impact on our profitability and cash flows. Also, the price of our products has increased in tandem with therising metal prices, as a result of pass-through, which could deter customers from purchasing our products andadversely affect our sales.
Further, we maintain some precious metals on a consigned inventory basis. The owners of the precious metalscharge a fee that fluctuates based on the market price of those metals and other factors. A significant increase in themarket price of precious metals or the consignment fee could increase our financing costs, which could increase ouroperating costs.
We are dependent on the successful scheduled completion of a new primary beryllium facility for our futuresupply of pure beryllium.
We have partnered with the Department of Defense to share in the cost of a new beryllium plant for primaryberyllium feedstock. We may experience quality and/or production issues in start-up of this new facility. Anyprolonged delays of pure beryllium production from the new plant could negatively impact our business.
Because we experience seasonal fluctuations in our sales, our quarterly results will fluctuate, and our annualperformance will be affected by the fluctuations.
We expect seasonal patterns to continue, which causes our quarterly results to fluctuate. For example, theChristmas season generates increased demand from our customers that manufacture consumer products. If ourrevenue during any quarter were to fall below the expectations of investors or securities analysts, our share pricecould decline, perhaps significantly. Unfavorable economic conditions, lower than normal levels of demand andother occurrences in any of the other quarters could also harm our results of operations.
Natural disasters, equipment failures, work stoppages, bankruptcies and other unexpected events may lead ourcustomers to curtail production or shut down their operations.
Our customers’ manufacturing operations are subject to conditions beyond their control, including rawmaterial shortages, natural disasters, interruptions in electrical power or other energy services, equipment failures,bankruptcies, work stoppages due to strikes or lockouts, including those affecting the automotive industry, one ofour major markets, and other unexpected events. For example, Delphi Corporation, a customer of three of ourbusiness units and the largest United States supplier of automotive parts, filed for bankruptcy protection in 2005.Delphi Corporation emerged from bankruptcy reorganization in 2009. Similar events could also affect othersuppliers to our customers. Such events could cause our customers to curtail production or to shut down a portion orall of their operations, which could reduce their demand for our products and reduce our sales.
Unexpected events and natural disasters at our mine could increase the cost of operating our business.
A portion of our production costs at our mine are fixed regardless of current operating levels. Our operatinglevels are subject to conditions beyond our control that may increase the cost of mining for varying lengths of time.These conditions include, among other things, fire, natural disasters, pit wall failures and ore processing changes.Our mining operations also involve the handling and production of potentially explosive materials. It is possible thatan explosion could result in death and injuries to employees and others and material property damage to third partiesand us. Any explosion could expose us to adverse publicity or liability for damages and materially adversely affectour operations. Any of these events could increase our cost of operations.
Equipment failures and other unexpected events at our facilities may lead to manufacturing curtailments orshutdowns.
The manufacturing processes that take place in our mining operation, as well as in our manufacturing facilities,depend on critical pieces of equipment. This equipment may, on occasion, be out of service because of
10

unanticipated failure, and some equipment is not readily available or replaceable. In addition to equipment failures,our facilities are also subject to the risk of loss due to unanticipated events such as fires, explosions or otherdisasters. Material plant shutdowns or reductions in operations could harm our ability to fulfill our customers’demands, which could harm our sales and cause our customers to find other suppliers. Further, remediation of anyinterruption in production capability may require us to make large capital expenditures, which may have a negativeeffect on our profitability and cash flows. Our business interruption insurance may not cover all of the lost revenuesassociated with interruptions in our manufacturing capabilities.
Many of our manufacturing facilities are dependent on single source energy suppliers, and interruption inenergy services may cause manufacturing curtailments or shutdowns.
Many of our manufacturing facilities depend on one source for electric power and for natural gas. For example,Utah Power is the sole supplier of electric power to the processing facility for our mining operations in Utah. Asignificant interruption in service from our energy suppliers due to equipment failures, terrorism or any other causemay result in substantial losses that are not fully covered by our business interruption insurance. Any substantialunmitigated interruption of our operations due to these conditions could harm our ability to meet our customers’demands and reduce our sales.
If the price of electrical power, fuel or other energy sources increases, our operating expenses could increasesignificantly.
We have numerous milling and manufacturing facilities and a mining operation, which depend on electricalpower, fuel or other energy sources. See “Item 2. — Properties,” of this Form 10-K. Our operating expenses aresensitive to changes in electricity prices and fuel prices, including natural gas prices. Prices for electricity andnatural gas have continued to increase and can fluctuate widely with availability and demand levels from otherusers. During periods of peak usage, supplies of energy may be curtailed, and we may not be able to purchase energyat historical market rates. While we have some long-term contracts with energy suppliers, we are exposed tofluctuations in energy costs that can affect our production costs. Although we enter into forward-fixed price supplycontracts for natural gas and electricity for use in our operations, those contracts are of limited duration and do notcover all of our fuel or electricity needs. Price increases in fuel and electricity costs, such as those increases whichmay occur from climate change legislation or other environmental mandates, will continue to increase our cost ofoperations.
We have a limited number of manufacturing facilities, and damage to those facilities could interrupt ouroperations, increase our costs of doing business and impair our ability to deliver our products on a timely basis.
Some of our facilities are interdependent. For instance, our manufacturing facility, in Elmore, Ohio relies onour mining operation for its supply of beryllium hydroxide used in production of most of its beryllium-containingmaterials. Additionally, our Reading, Pennsylvania; Fremont, California and Tucson, Arizona manufacturingfacilities are dependent on materials produced by our Elmore, Ohio manufacturing facility and our Wheatfield, NewYork manufacturing facility is dependent on our Buffalo, New York manufacturing facility. See “Item 2 —Properties”, of this Form 10-K. The destruction or closure of any of our manufacturing facilities or our mine for asignificant period of time as a result of fire, explosion, act of war or terrorism or other natural disaster or unexpectedevent may interrupt our manufacturing capabilities, increase our capital expenditures and our costs of doingbusiness and impair our ability to deliver our products on a timely basis. In such an event, we may need to resort toan alternative source of manufacturing or to delay production, which could increase our costs of doing business. Ourproperty damage and business interruption insurance may not cover all of our potential losses and may not continueto be available to us on acceptable terms, if at all.
Our lengthy and variable sales and development cycle makes it difficult for us to predict if and when a newproduct will be sold to customers.
Our sales and development cycle, which is the period from the generation of a sales lead or new product ideathrough the development of the product and the recording of sales, may typically take up to two or three years,making it very difficult to forecast sales and results of operations. Our inability to accurately predict the timing and
11

magnitude of sales of our products, especially newly introduced products, could affect our ability to meet ourcustomers’ product delivery requirements or cause our results of operations to suffer if we incur expenses in aparticular period that do not translate into sales during that period, or at all. In addition, these failures would make itdifficult to plan future capital expenditure needs and could cause us to fail to meet our cash flow requirements.
Future terrorist attacks and other acts of violence or war may directly harm our operations.
Future terrorist attacks or other acts of violence or war may directly impact our facilities. For example, ourElmore, Ohio facility is located near, and derives power from, a nuclear power plant, which could be a target for aterrorist attack. In addition, future terrorist attacks, related armed conflicts or prolonged or increased tensions in theMiddle East or other regions of the world could cause consumer confidence and spending to decrease, decreasingdemand for consumer goods that contain our products. Further, when the United States armed forces are involved inactive hostilities or large-scale deployments, defense spending tends to focus more on meeting the physical needs ofthe troops, and planned expenditures on weapons and other systems incorporating our products may be reduced ordeferred. Any of these occurrences could also increase volatility in the United States and worldwide financialmarkets, which could negatively impact our sales.
We may be unable to access the financial markets on favorable terms.
The inability to raise capital on favorable terms, particularly during times of uncertainty in the financialmarkets, could impact our ability to sustain and grow our business and would increase our capital costs. Inparticular, the substantial volatility in world capital markets due to the recent global economic crisis has had asignificant negative impact on the global financial markets.
We rely on access to financial markets as a significant source of liquidity for capital requirements not satisfiedby cash on hand or operating cash flow. Our access to the financial markets could be adversely impacted by variousfactors, including:
• changes in credit markets that reduce available credit or the ability to renew existing liquidity facilities onacceptable terms;
• a deterioration of our credit;
• a deterioration in the financial condition of the banks with which we do business;
• extreme volatility in our markets that increases margin or credit requirements; and
• the collateral pledge of substantially all of our assets in connection with our existing indebtedness, whichlimits our flexibility in raising additional capital.
These factors have adversely impacted our access to the financial markets from time to time. Negative oruncertain global economic conditions may make it difficult for us to access the credit market and to obtain financingor refinancing, as the case may be, to the extent necessary, on satisfactory terms or at all.
Low investment performance by our domestic pension plan assets may require us to increase our pension liabilityand expense, which may require us to fund a portion of our pension obligations and divert funds from otherpotential uses.
We provide defined benefit pension plans to eligible employees. Our pension expense and our requiredcontributions to our pension plans are directly affected by the value of plan assets, the projected rate of return onplan assets, the actual rate of return on plan assets and the actuarial assumptions we use to measure our definedbenefit pension plan obligations, including the rate at which future obligations are discounted to a present value, orthe discount rate. As of December 31, 2010, for pension accounting purposes, we assumed an 8.00% rate of returnon pension assets.
Lower investment performance of our pension plan assets resulting from a decline in the stock market couldsignificantly increase the deficit position of our plans. Should the pension asset return fall below our expectations, it
12

is likely that future pension expenses would increase. The actual return on our plan assets for the year endedDecember 31, 2010 was a gain of approximately 13.4%.
We establish the discount rate used to determine the present value of the projected and accumulated benefitobligation at the end of each year based upon the available market rates for high quality, fixed income investments.An increase in the discount rate would reduce the future pension expense and, conversely, a lower discount ratewould raise the future pension expense.
Based on current guidelines, assumptions and estimates, including stock market prices and interest rates, weanticipate that we will be required to make a cash contribution of approximately $8.8 million to our pension plan in2011. If our current assumptions and estimates are not correct, a contribution in years beyond 2011 may be greaterthan the projected 2011 contribution required.
We cannot predict whether changing market or economic conditions, regulatory changes or other factors willfurther increase our pension expenses or funding obligations, diverting funds we would otherwise apply to otheruses.
Our expenditures for post-retirement health benefits could be materially higher than we have predicted if ourunderlying assumptions prove to be incorrect.
We provide post-retirement health benefits to eligible employees. Our retiree health expense is directlyaffected by the assumptions we use to measure our retiree health plan obligations, including the assumed rate atwhich health care costs will increase and the discount rate used to calculate future obligations. For retiree healthaccounting purposes, we maintained the assumed rate at which health care costs will increase for the next year at 8%for both December 31, 2010 and December 31, 2009. In addition, we have assumed that this health care costincrease trend rate will decline to 5% by 2019.
Assumed health care cost trend rates have a significant effect on the amounts reported for the health care plans.A one percentage point increase in assumed health care cost trend rates would have increased the post-employmentbenefit obligation by $0.7 million at December 31, 2010.
We cannot predict whether changing market or economic conditions, regulatory changes or other factors willfurther increase our retiree health care expenses or obligations, diverting funds we would otherwise apply to otheruses.
We are subject to fluctuations in currency exchange rates, which may negatively affect our financialperformance.
A significant portion of our sales is conducted in international markets and priced in currencies other than theU.S. dollar. Revenues from customers outside of the United States (principally Europe and Asia) amounted to 28%of sales in 2010, 35% in 2009 and 37% in 2008. A significant part of these international sales are priced incurrencies other than the U.S. dollar. Significant fluctuations in currency values relative to the U.S. dollar maynegatively affect our financial performance. In the past, fluctuations in currency exchange rates, particularly for theeuro and the yen, have impacted our sales, margins and profitability. The fair value of our net liability relating tooutstanding foreign currency contracts was $1.5 million at December 31, 2010, indicating that the average hedgerates were unfavorable compared to the actual year end market exchange rates. While we may hedge our currencytransactions to mitigate the impact of currency price volatility on our earnings, any hedging activities may not besuccessful.
Our holding company structure causes us to rely on funds from our subsidiaries.
We are a holding company and conduct substantially all our operations through our subsidiaries. As a holdingcompany, we are dependent upon dividends or other intercompany transfers of funds from our subsidiaries. Thepayment of dividends and other payments to us by our subsidiaries may be restricted by, among other things,applicable corporate and other laws and regulations, agreements of the subsidiaries and the terms of our current andfuture indebtedness.
13

Our financial results are likely to be negatively impacted by an impairment of goodwill should our shareholderequity exceed our market capitalization for a number of quarters.
A goodwill impairment charge may be triggered by a reduction in actual and projected cash flows, which couldbe negatively impacted by the market price of our common shares. Our goodwill balance at December 31, 2010 was$72.9 million. Any required non-cash impairment charge could significantly reduce this balance and have a materialimpact on our reported financial position and results of operations.
Changes in laws or regulations or the manner of their interpretation or enforcement could adversely impact ourfinancial performance and restrict our ability to operate our business or execute our strategies.
New laws or regulations, or changes in existing laws or regulations or the manner of their interpretation orenforcement, could increase our cost of doing business and restrict our ability to operate our business or execute ourstrategies. This includes, among other things, the possible taxation under U.S. law of certain income from foreignoperations, compliance costs and enforcement under the Dodd-Frank Wall Street Reform and Consumer ProtectionAct, and costs associated with complying with the Patient Protection and Affordable Care Act of 2010 and theregulations promulgated thereunder.
We are exposed to lawsuits in the normal course of business, which could harm our business.
During the ordinary conduct of our business, we may become involved in certain legal proceedings, includingthose involving product liability claims, third-party lawsuits relating to exposure to beryllium and claims against usof infringement of intellectual property rights of third parties. Due to the uncertainties of litigation, we can give noassurance that we will prevail at the conclusion of future claims. Certain of these matters involve types of claimsthat, if they result in an adverse ruling to us, could give rise to substantial liability which could have a materialadverse effect on our business, operating results or financial condition.
We are presently uninsured for beryllium-related claims where the claimants’ first exposure to berylliumoccurred on or after January 1, 2008, and we have not undertaken to estimate the impact of such claims, which haveyet to be asserted. In addition, some jurisdictions preclude insurance coverage for punitive damage awards.Accordingly, our profitability could be adversely affected if any current or future claimants obtain judgments forany uninsured compensatory or punitive damages. Further, an unfavorable outcome or settlement of a pendingberyllium case or additional adverse media coverage could encourage the commencement of additional similarlitigation.
Health issues, litigation and government regulation relating to our beryllium operations could significantlyreduce demand for our products, limit our ability to operate and adversely affect our profitability.
If exposed to respirable beryllium fumes, dusts or powder, some individuals may demonstrate an allergicreaction to beryllium and may later develop a chronic lung disease known as chronic beryllium disease, or CBD.Some people who are diagnosed with CBD do not develop clinical symptoms at all. In others, the disease can lead toscarring and damage of lung tissue, causing clinical symptoms that include shortness of breath, wheezing andcoughing. Severe cases of CBD can cause disability or death.
Further, some scientists claim there is evidence of an association between beryllium exposure and lung cancer,and certain standard-setting organizations have classified beryllium and beryllium compounds as humancarcinogens.
The health risks relating to exposure to beryllium have been, and will continue to be, a significant issueconfronting the beryllium-containing products industry. The health risks associated with beryllium have resulted inproduct liability claims, employee and third-party lawsuits and increased levels of scrutiny by federal, state, foreignand international regulatory authorities. This scrutiny includes regulatory decisions relating to the approval orprohibition of the use of beryllium-containing materials for various uses. Concerns over CBD and other potentialadverse health effects relating to beryllium, as well as concerns regarding potential liability from the use ofberyllium, may discourage our customers’ use of our beryllium-containing products and significantly reducedemand for our products. In addition, continued or increased adverse media coverage relating to our beryllium-
14

containing products could damage our reputation or cause a decrease in demand for beryllium-containing products,which could adversely affect our profitability.
Our bertrandite ore mining and beryllium-related manufacturing operations and some of our customers’businesses are subject to extensive health and safety regulations that impose, and will continue to impose,significant costs and liabilities, and future regulation could increase those costs and liabilities or effectivelyprohibit production or use of beryllium-containing products.
Our customers and we are subject to laws regulating worker exposure to beryllium. Standards for exposure toberyllium are under review by OSHA, the Department of Energy and by other governmental and private standard-setting organizations. One result of these reviews will likely be more stringent worker safety standards. Someorganizations, such as the California Occupational Health and Safety Administration and the American Conferenceof Governmental Industrial Hygienists, have adopted standards that are more stringent than the current standards ofOSHA. The development, proposal or adoption of more stringent standards may affect buying decisions by the usersof beryllium-containing products. If the standards are made more stringent and/or our customers or otherdownstream users decide to reduce their use of beryllium-containing products, our results of operations,liquidity and financial condition could be materially adversely affected. The impact of this potential adverseeffect would depend on the nature and extent of the changes to the standards, the cost and ability to meet the newstandards, the extent of any reduction in customer use and other factors. The magnitude of this potential adverseeffect cannot be estimated.
Our bertrandite ore mining and manufacturing operations are subject to extensive environmental regulationsthat impose, and will continue to impose, significant costs and liabilities on us, and future regulation couldincrease these costs and liabilities or prevent production of beryllium-containing products.
We are subject to a variety of governmental regulations relating to the environment, including those relating toour handling of hazardous materials and air and wastewater emissions. Some environmental laws imposesubstantial penalties for non-compliance. Others, such as the federal Comprehensive Environmental Response,Compensation, and Liability Act, or CERCLA, impose strict, retroactive and joint and several liability upon entitiesresponsible for releases of hazardous substances. Bertrandite ore mining is also subject to extensive governmentalregulation on matters such as permitting and licensing requirements, plant and wildlife protection, reclamation andrestoration of mining properties, the discharge of materials into the environment and the effects that mining has ongroundwater quality and availability. The Environmental Protection Agency is developing financial responsibilityrequirements under CERCLA for hardrock mining facilities. These future requirements could impose on ussignificant additional costs or obligations with respect to our extraction, milling and processing of ore. If we fail tocomply with present and future environmental laws and regulations, we could be subject to liabilities or ouroperations could be interrupted. In addition, future environmental laws and regulations could restrict our ability toexpand our facilities or extract our bertrandite ore deposits. These environmental laws and regulations could alsorequire us to acquire costly equipment, obtain additional financial assurance, or incur other significant expenses inconnection with our business, which would increase our costs of production.
The availability of competitive substitute materials for beryllium-containing products may reduce ourcustomers’ demand for these products and reduce our sales.
In certain product applications, we compete with manufacturers of non-beryllium-containing products,including organic composites, metal alloys or composites, titanium and aluminum. Our customers may chooseto use substitutes for beryllium-containing products in their products for a variety of reasons, including, amongother things, the lower costs of those substitutes, the health and safety concerns relating to these products and therisk of litigation relating to beryllium-containing products. If our customers use substitutes for beryllium-containing products in their products, the demand for our beryllium-containing products may decrease, whichcould reduce our sales.
Item 1B. UNRESOLVED STAFF COMMENTS
None.
15

Item 2. PROPERTIES
We operate manufacturing plants, service and distribution centers and other facilities throughout the world.During 2010, we made effective use of our productive capacities at our principal facilities. We believe that thequality and production capacity of our facilities is sufficient to maintain our competitive position for the foreseeablefuture. Information as of December 31, 2010, with respect to our significant facilities that are owned or leased, andthe respective segments in which they are included, is set forth below.
Location Owned or Leased
ApproximateNumber ofSquare Feet
Corporate and Administrative OfficesMayfield Heights, Ohio(2)(3)(5). . . . . . . . . . . . . . . . . . . . . . . . . . . . . . . . . Leased 53,800Manufacturing FacilitiesAlbuquerque, New Mexico(1) . . . . . . . . . . . . . . . . . . . . . . . . . . . . . . . . . Owned/Leased 13,000/80,200Bloomfield, Connecticut(1) . . . . . . . . . . . . . . . . . . . . . . . . . . . . . . . . . . . Leased 23,400Brewster, New York(1) . . . . . . . . . . . . . . . . . . . . . . . . . . . . . . . . . . . . . . Leased 75,000Buellton, California(1). . . . . . . . . . . . . . . . . . . . . . . . . . . . . . . . . . . . . . . Leased 35,000Buffalo, New York(1) . . . . . . . . . . . . . . . . . . . . . . . . . . . . . . . . . . . . . . . Owned 97,000Delta, Utah(2) . . . . . . . . . . . . . . . . . . . . . . . . . . . . . . . . . . . . . . . . . . . . . Owned 86,000Elmore, Ohio(2)(3) . . . . . . . . . . . . . . . . . . . . . . . . . . . . . . . . . . . . . . . . . . Owned/Leased 556,000/316,000Fremont, California(3) . . . . . . . . . . . . . . . . . . . . . . . . . . . . . . . . . . . . . . . Leased 16,800Limerick, Ireland(1) . . . . . . . . . . . . . . . . . . . . . . . . . . . . . . . . . . . . . . . . Leased 18,000Lincoln, Rhode Island(4) . . . . . . . . . . . . . . . . . . . . . . . . . . . . . . . . . . . . . Owned/Leased 130,000/11,000Lorain, Ohio(2) . . . . . . . . . . . . . . . . . . . . . . . . . . . . . . . . . . . . . . . . . . . . Owned 55,000Louny, Czech Republic(1) . . . . . . . . . . . . . . . . . . . . . . . . . . . . . . . . . . . . Leased 19,800Milwaukee, Wisconsin(1) . . . . . . . . . . . . . . . . . . . . . . . . . . . . . . . . . . . . Owned/Leased 99,000/7,300Newburyport, Massachusetts(1) . . . . . . . . . . . . . . . . . . . . . . . . . . . . . . . . Owned 30,000Reading, Pennsylvania(2) . . . . . . . . . . . . . . . . . . . . . . . . . . . . . . . . . . . . Owned 123,000Santa Clara, California(1) . . . . . . . . . . . . . . . . . . . . . . . . . . . . . . . . . . . . Leased 5,800Singapore(1) . . . . . . . . . . . . . . . . . . . . . . . . . . . . . . . . . . . . . . . . . . . . . . Leased 24,500Subic Bay, Philippines(1) . . . . . . . . . . . . . . . . . . . . . . . . . . . . . . . . . . . . Leased 5,000Suzhou, China(1) . . . . . . . . . . . . . . . . . . . . . . . . . . . . . . . . . . . . . . . . . . Leased 22,400Taipei, Taiwan(1) . . . . . . . . . . . . . . . . . . . . . . . . . . . . . . . . . . . . . . . . . . Leased 11,500Tucson, Arizona(3) . . . . . . . . . . . . . . . . . . . . . . . . . . . . . . . . . . . . . . . . . Owned 53,000Tyngsboro, Massachusetts(1) . . . . . . . . . . . . . . . . . . . . . . . . . . . . . . . . . . Leased 38,000Westford, Massachusetts(1) . . . . . . . . . . . . . . . . . . . . . . . . . . . . . . . . . . . Leased 75,000Wheatfield, New York(1) . . . . . . . . . . . . . . . . . . . . . . . . . . . . . . . . . . . . . Owned 35,000Windsor, Connecticut(1) . . . . . . . . . . . . . . . . . . . . . . . . . . . . . . . . . . . . . Leased 34,700Service and Distribution CentersElmhurst, Illinois(2) . . . . . . . . . . . . . . . . . . . . . . . . . . . . . . . . . . . . . . . . Leased 28,500Fukaya, Japan(2)(3)(4) . . . . . . . . . . . . . . . . . . . . . . . . . . . . . . . . . . . . . . . . Owned 35,500Gallup, New Mexico(1) . . . . . . . . . . . . . . . . . . . . . . . . . . . . . . . . . . . . . . Leased 5,000Reading, England(1)(2)(3)(4) . . . . . . . . . . . . . . . . . . . . . . . . . . . . . . . . . . . Leased 9,700Singapore(2)(3)(4) . . . . . . . . . . . . . . . . . . . . . . . . . . . . . . . . . . . . . . . . . . . Leased 2,500Stuttgart, Germany(2)(4) . . . . . . . . . . . . . . . . . . . . . . . . . . . . . . . . . . . . . . Leased 24,800Tokyo, Japan(1)(2)(3)(4) . . . . . . . . . . . . . . . . . . . . . . . . . . . . . . . . . . . . . . . Leased 6,900Warren, Michigan(2) . . . . . . . . . . . . . . . . . . . . . . . . . . . . . . . . . . . . . . . . Leased 34,500
(1) Advanced Material Technologies(2) Performance Alloys(3) Beryllium and Composites(4) Technical Materials(5) All Other
16

In addition to the above, the Company holds certain mineral rights on 7,500 acres in Juab County, Utah fromwhich the beryllium-bearing ore, bertrandite, is mined by the open pit method. A portion of these mineral rights areheld under lease. Ore reserve data can be found in Part II, Item 7 of this Form 10-K.
Item 3. LEGAL PROCEEDINGS
Our subsidiaries and our holding company are subject, from time to time, to a variety of civil andadministrative proceedings arising out of our normal operations, including, without limitation, product liabilityclaims, health, safety and environmental claims and employment-related actions. Among such proceedings are thecases described below.
Beryllium Claims
As of December 31, 2010, our subsidiary, Materion Brush Inc. (formerly known as Brush Wellman Inc.), was adefendant in two proceedings in state and federal courts brought by plaintiffs alleging that they have contracted, orhave been placed at risk of contracting, beryllium sensitization or chronic beryllium disease or other lung conditionsas a result of exposure to beryllium. Plaintiffs in beryllium cases seek recovery under negligence and various otherlegal theories and seek compensatory and punitive damages, in many cases of an unspecified sum. Spouses of someplaintiffs claim loss of consortium.
As of December 31, 2009, there were four beryllium cases (involving eight plaintiffs) and as of December 31,2010, there were two beryllium cases (involving six plaintiffs). During 2010:
• one case (involving one plaintiff) was filed;
• the earlier dismissal of one purported class action (involving one named plaintiff) was affirmed by the courtof appeals, as discussed more fully below; and
• two cases (involving two plaintiffs) were settled and dismissed.
The two pending beryllium cases as of December 31, 2010 involve four plaintiffs, plus two spouses withconsortium claims. The Company has some insurance coverage, subject to an annual deductible.
The purported class action was Gary Anthony v. Small Tube Manufacturing Corporation d/b/a Small TubeProducts Corporation, Inc., et al., filed in the Court of Common Pleas of Philadelphia County, Pennsylvania, casenumber 000525, on September 7, 2006. The case was removed to the U.S. District Court for the Eastern District ofPennsylvania, case number 06-CV-4419, on October 4, 2006. The only named plaintiff was Gary Anthony. Thedefendants were Small Tube Manufacturing Corporation, d/b/a Small Tube Products Corporation, Inc.; AdmiralMetals Inc.; Tube Methods, Inc.; and Cabot Corporation. The plaintiff purported to sue on behalf of a class ofcurrent and former employees of the U.S. Gauge facility in Sellersville, Pennsylvania who had been exposed toberyllium for a period of at least one month while employed at U.S. Gauge. The plaintiff brought claims fornegligence. Plaintiff sought the establishment of a medical monitoring trust fund, cost of publication of approvedguidelines and procedures for medical monitoring of the class, attorneys’ fees and expenses. Defendant TubeMethods, Inc. filed a third-party complaint against Brush Wellman Inc. in that action on November 15, 2006. TubeMethods alleged that Brush supplied beryllium-containing products to U.S. Gauge, and that Tube Methods workedon those products, but that Brush was liable to Tube Methods for indemnification and contribution. Brush filed itsanswer to the amended third-party complaint on October 19, 2007. On February 29, 2008, Brush filed a motion forsummary judgment based on plaintiff’s lack of any substantially increased risk of CBD. On September 30, 2008, thecourt granted the motion for summary judgment in favor of all of the defendants and dismissed plaintiff’s classaction complaint. On October 29, 2008, plaintiff filed a notice of appeal. The Court of Appeals granted a motion tostay the appeal due to the bankruptcy of one of the appellees, Millennium Petrochemicals. On July 29, 2009, afterrelief from a bankruptcy stay, the Company and the other appellees filed their brief in the Court of Appeals. TheCourt heard oral argument on January 11, 2010. On June 7, 2010, the Court affirmed the trial court’s ruling.
17

Subsequent Events
From January 1, 2011 to March 8, 2011, the following subsequent events took place. On January 26, 2011, aStipulation for Dismissal without Prejudice was filed in one case (involving one plaintiff), and the case is nowdismissed. On February 7, 2011, in the sole remaining case (involving five plaintiffs), two spouses filed a Requestfor Dismissal of their consortium claims.
Other Claims
One of our subsidiaries, Materion Advanced Materials Technologies and Services Inc. (formerly known asWilliams Advanced Materials Inc.) (WAM herein), was a party to patent litigation in the United States involvingTarget Technology Company, LLC of Irvine, California (Target). The litigation involved patents directed totechnology used in the production of DVD-9s, which are high storage capacity DVDs, and other optical recordingmedia. The patents at issue primarily concerned certain silver alloys used to make the semi-reflective layer in DVD-9s, a thin metal film that is applied to a DVD-9 through a process known as sputtering. The raw material used in thesputtering process is called a target. Target alleged that WAM manufactured and sold infringing sputtering targets toDVD manufacturers.
In the first action, filed in April 2003 by WAM against Target in the U.S. District Court, Western District ofNew York (case no. 03-CV-0276A (SR)) (the NY Action), WAM had asked the Court for a judgment declaringcertain Target patents invalid and/or unenforceable and awarding WAM damages. Target counterclaimed alleginginfringement of those patents and seeking a judgment for infringement, an injunction against further infringementand damages for past infringement. Following certain proceedings in which WAM was denied an injunction toprevent Target from suing and threatening to sue WAM’s customers, Target filed an amended counterclaim and athird-party complaint naming certain of WAM’s customers and other entities as parties to the case and addingrelated other patents to the NYAction. The action temporarily was stayed pending resolution of the ownership issuein the CA Action (defined below), as discussed more fully below. On January 26, 2009, the Court in the CA Actionordered that the case and remaining issues be transferred to the Court in the NYAction. As a result, the stay in theNY Action was lifted, and the Court in the NY Action consolidated the CA Action with the NY Action. With theparties having resumed pre-trial proceedings, Target had moved the Court to further amend its counts forinfringement to include only certain claims of six of the patents claimed to be owned by Target. If granted,Target’s counts for infringement of other claims in those patents and six other patents claimed to be owned by Targetwould have been removed from the NYAction. WAM had opposed the motion to the extent Target sought dismissalwithout prejudice of the counts for infringement of the other claims and other patents. Following a Court hearing onTarget’s motion to amend its pleadings and upon agreement of the parties, Target further amended its counts forinfringement to include a total of nine U.S. patents and withdrawing four other patents. In response to Target’samendment of its pleadings, WAM moved for (a) dismissal of Target’s counts for lack of jurisdiction on the basisthat Target did not own the patents, (b) terminating sanctions on the basis of litigation misconduct by Target, and(c) a stay of discovery pending a decision by the Court on the first two WAM motions, all of which motions werepending. WAM continued to dispute Target’s claims of ownership of all of the patents and denied both validity andinfringement of the patent claims. Following a September 11, 2009 oral argument on WAM’s motions, theMagistrate Judge reserved decision and pending the Court’s action on the motions effectively stayed furtherdiscovery. On October 28, 2009, the Magistrate Judge recommended to the District Court Judge that the Court denyWAM’s motion for dismissal of Target’s counts for lack of jurisdiction on the basis of WAM’s claim that Target didnot own the patents. The Magistrate Judge reasoned that, in view of the earlier reported November 2008 settlementagreement between the Sony companies and Target, any lack of jurisdiction was cured when in July 2009, Targetfiled an amended answer. The Magistrate Judge further deferred until trial WAM’s motion for terminating sanctionsbecause of Target’s litigation misconduct, but reopened discovery. Both WAM and Target objected to the MagistrateJudge’s report, and their objections were to be heard by the District Court Judge before ruling on therecommendation. Notwithstanding the Magistrate Judge’s recommendation, WAM continued to disputeTarget’s claims of ownership of the patents remaining in the Action, and to deny both validity andinfringement of the patents. The Magistrate Judge by separate order and with the consent of the partiesreferred the case to a mediator for consideration under the Court’s alternate dispute resolution plan.
18

Target in September 2004 filed in the U.S. District Court, Central District of California (case no. SAC04-1083DOC (MLGx)), a separate action for infringement of one of the same patents named in the NY Action (the CAAction), naming as defendants WAM and certain of WAM’s customers who purchased certain WAM sputteringtargets. Target sought a judgment that the patent was valid and infringed by the defendants, a permanent injunction,a judgment on ownership of certain Target patents, damages adequate to compensate Target for the infringement,treble damages and attorneys’ fees and costs. In April 2007, Sony DADC U.S., Inc. among other Sony companies(Sony) had intervened in the CA Action claiming ownership of that patent and others of the patents that Targetsought to enforce in the NY Action. Sony’s claim was based on its prior employment of the patentee and Target’sfounder, Han H. Nee (Nee), and had included a demand for damages against both Target and Nee. WAM on behalfof itself and its customers has a paid-up license from Sony under any rights that Sony has in those patents. Althoughtrial of the CA Action had been scheduled for March 2009, in December 2008, a confidential settlement agreementwas reached between Target and Sony, as well as a partial settlement agreement between Target and WAM releasingWAM and its customers from infringement of the one named patent. As a result, the issues not subject to anysettlement were (1) a remaining count in which the Target parties had requested a judgment declaring that Targetwas the owner of certain of the Target patents and (2) WAM’s request for sanctions against Target. Pursuant tovarious stipulations filed by the parties, the Court on January 6, 2009 ordered a dismissal with prejudice of all of therespective intervention claims and counterclaims between the Target parties and the Sony companies, and adismissal without prejudice of the counterclaims by WAM and its defendant customers, the exception being theremaining declaratory judgment count on patent ownership. Following motions filed by the parties, the Court onJanuary 26, 2009 ordered that the case and remaining issues be transferred to the Court in the NY Action.
On April 1, 2010, WAM and Target entered into a confidential settlement agreement, terminating the actions asbetween them, which includes a release of all claims that each may have had against the other. On April 12, 2010,the District Court approved the consent motion to dismiss the actions between WAM and Target, and declared theconsolidated cases (the CA Action and the NY Action) closed.
Item 4. (REMOVED AND RESERVED)
19
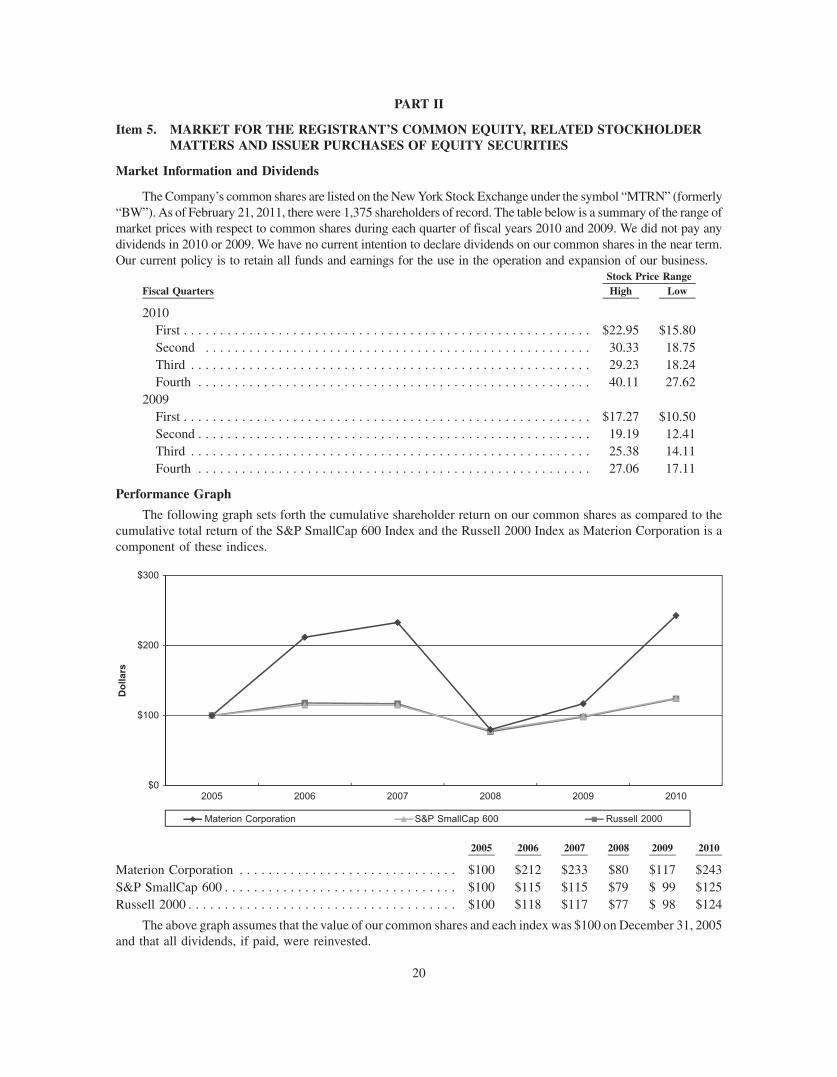
PART II
Item 5. MARKET FOR THE REGISTRANT’S COMMON EQUITY, RELATED STOCKHOLDERMATTERS AND ISSUER PURCHASES OF EQUITY SECURITIES
Market Information and Dividends
The Company’s common shares are listed on the New York Stock Exchange under the symbol “MTRN” (formerly“BW”). As of February 21, 2011, there were 1,375 shareholders of record. The table below is a summary of the range ofmarket prices with respect to common shares during each quarter of fiscal years 2010 and 2009. We did not pay anydividends in 2010 or 2009. We have no current intention to declare dividends on our common shares in the near term.Our current policy is to retain all funds and earnings for the use in the operation and expansion of our business.
Fiscal Quarters High LowStock Price Range
2010First . . . . . . . . . . . . . . . . . . . . . . . . . . . . . . . . . . . . . . . . . . . . . . . . . . . . . . . . $22.95 $15.80Second . . . . . . . . . . . . . . . . . . . . . . . . . . . . . . . . . . . . . . . . . . . . . . . . . . . . . 30.33 18.75Third . . . . . . . . . . . . . . . . . . . . . . . . . . . . . . . . . . . . . . . . . . . . . . . . . . . . . . . 29.23 18.24Fourth . . . . . . . . . . . . . . . . . . . . . . . . . . . . . . . . . . . . . . . . . . . . . . . . . . . . . . 40.11 27.62
2009First . . . . . . . . . . . . . . . . . . . . . . . . . . . . . . . . . . . . . . . . . . . . . . . . . . . . . . . . $17.27 $10.50Second . . . . . . . . . . . . . . . . . . . . . . . . . . . . . . . . . . . . . . . . . . . . . . . . . . . . . . 19.19 12.41Third . . . . . . . . . . . . . . . . . . . . . . . . . . . . . . . . . . . . . . . . . . . . . . . . . . . . . . . 25.38 14.11Fourth . . . . . . . . . . . . . . . . . . . . . . . . . . . . . . . . . . . . . . . . . . . . . . . . . . . . . . 27.06 17.11
Performance Graph
The following graph sets forth the cumulative shareholder return on our common shares as compared to thecumulative total return of the S&P SmallCap 600 Index and the Russell 2000 Index as Materion Corporation is acomponent of these indices.
201020092008200720062005$0
$100
Dollars
$200
$300
Materion Corporation S&P SmallCap 600 Russell 2000
2005 2006 2007 2008 2009 2010
Materion Corporation . . . . . . . . . . . . . . . . . . . . . . . . . . . . . . $100 $212 $233 $80 $117 $243S&P SmallCap 600 . . . . . . . . . . . . . . . . . . . . . . . . . . . . . . . . $100 $115 $115 $79 $ 99 $125Russell 2000 . . . . . . . . . . . . . . . . . . . . . . . . . . . . . . . . . . . . . $100 $118 $117 $77 $ 98 $124
The above graph assumes that the value of our common shares and each index was $100 on December 31, 2005and that all dividends, if paid, were reinvested.
20

Item 6. SELECTED FINANCIAL DATA
Materion Corporation and Subsidiaries
(Thousands except per share amounts) 2010 2009 2008 2007 2006
For the yearNet sales . . . . . . . . . . . . . . . . . . . . . . . . . . . . $1,302,314 $715,186 $909,711 $955,709 $763,054
Cost of sales . . . . . . . . . . . . . . . . . . . . . . . . . 1,079,666 623,764 757,836 759,037 600,882
Gross margin . . . . . . . . . . . . . . . . . . . . . . . . . 222,648 91,422 151,875 196,672 162,172
Operating profit (loss) . . . . . . . . . . . . . . . . . . 73,633 (19,485) 28,071 84,465 43,840
Interest expense — net . . . . . . . . . . . . . . . . . . 2,665 1,299 1,995 1,760 4,135
Income (loss) before income taxes . . . . . . . . . 70,968 (20,784) 26,076 82,705 39,705
Income taxes (benefit) . . . . . . . . . . . . . . . . . . 24,541 (8,429) 7,719 29,420 (9,898)
Net income (loss) . . . . . . . . . . . . . . . . . . . . . 46,427 (12,355) 18,357 53,285 49,603
Earnings per share of common stock:
Basic . . . . . . . . . . . . . . . . . . . . . . . . . . . . . 2.29 (0.61) 0.90 2.62 2.52Diluted . . . . . . . . . . . . . . . . . . . . . . . . . . . 2.25 (0.61) 0.89 2.59 2.45
Depreciation and amortization . . . . . . . . . . . . 35,932 32,369 34,204 24,296 25,141
Capital expenditures. . . . . . . . . . . . . . . . . . . . 42,314 44,173 35,515 26,429 15,522
Mine development expenditures . . . . . . . . . . . 11,348 808 421 7,121 —
Year-end positionWorking capital . . . . . . . . . . . . . . . . . . . . . . . 208,365 140,482 189,899 216,253 158,061
Ratio of current assets to current liabilities . . . 2.4 to 1 2.0 to 1 2.8 to 1 2.9 to 1 2.4 to 1
Property and equipment:
At cost. . . . . . . . . . . . . . . . . . . . . . . . . . . . 719,953 665,361 635,266 583,961 557,861
Cost less depreciation and impairment . . . . 265,868 227,766 207,254 186,175 175,929
Total assets . . . . . . . . . . . . . . . . . . . . . . . . . . 735,410 621,953 581,897 550,551 498,606
Long-term liabilities . . . . . . . . . . . . . . . . . . . 157,571 131,630 116,524 69,140 70,731
Long-term debt . . . . . . . . . . . . . . . . . . . . . . . 38,305 8,305 10,605 10,005 20,282
Shareholders’ equity . . . . . . . . . . . . . . . . . . . 384,356 339,859 347,097 353,714 291,000
Weighted-average number of shares of stockoutstanding:
Basic . . . . . . . . . . . . . . . . . . . . . . . . . . . . . 20,282 20,191 20,335 20,320 19,665
Diluted . . . . . . . . . . . . . . . . . . . . . . . . . . . 20,590 20,191 20,543 20,612 20,234
Capital expenditures shown above include amounts spent under government contracts for whichreimbursements were received from the government in the amounts of $21.9 million in 2010, $28.2 million in2009, $8.0 million in 2008 and $3.5 million in 2007.
Changes in deferred tax valuation allowances decreased income tax expense by $21.8 million in 2006.
21

Item 7. MANAGEMENT’S DISCUSSION AND ANALYSIS OF FINANCIAL CONDITION ANDRESULTS OF OPERATIONS
OVERVIEW
We are an integrated producer of high performance advanced engineered materials used in a variety ofelectrical, electronic, thermal and structural applications. Our products are sold into numerous markets, includingconsumer electronics, defense and science, industrial components and commercial aerospace, energy, automotiveelectronics, telecommunications infrastructure, medical and appliance.
Sales of $1.3 billion in 2010 were 82% higher than sales in 2009 and established a record high. The demandfrom various key markets, after a steep fall-off in 2009 largely due to the global economic crisis, improvedsignificantly in 2010. Sales also improved in 2010 as a result of two acquisitions, higher metal prices and productand market development efforts. Sales from each of our four reportable segments grew at double digit rates in 2010over 2009.
Gross margin of $222.6 million in 2010 was $131.2 million higher than the gross margin generated in 2009.The margin also improved to 17% of sales in 2010 from 13% of sales last year. The margin improvement was largelydue to a combination of the higher sales volume (from existing operations and the acquisitions), operatingefficiencies (partially due to higher production volumes), product mix effects and other factors.
After reducing our manufacturing, selling and administrative costs in 2009 due to the fall-off in sales, portionsof these costs increased in 2010 in order to support the higher level of business. The spending level did not increaseproportionately with sales, however, which allowed us to leverage the sales growth to generate additional profits.The increase in selling, general and administrative expenses in 2010 was mainly a result of the expenses incurred bythe acquisitions and higher incentive compensation due to our improved profitability.
Operating profit was $73.6 million in 2010, a significant turn around from the $19.5 million operating loss in2009. Diluted earnings per share grew to $2.25 in 2010 from a per share loss of $0.61 in 2009.
In the first quarter 2010, we acquired all of the outstanding capital stock of Academy Corporation (Academy)for an adjusted purchase price of $21.0 million in cash. Academy’s precious and non-precious metal products andmetal refining capabilities augment our existing product offerings as well as expand our reach into various newmarkets. The Academy acquisition closely followed our purchase of all of the outstanding capital stock of BarrAssociates, Inc. (Barr) in October 2009 for $55.2 million in cash.
Our working capital levels, after declining in 2009, increased in 2010 as a result of and in support of theimproved business levels. Cash flow from operations totaled $31.0 million in 2010. This cash flow plus an increaseof $21.6 million in debt during 2010 was used to finance capital expenditures and the acquisition of Academy. As aresult of the higher debt levels, our debt-to-debt-plus-equity ratio increased to 18% as of year-end 2010 from 16% asof year-end 2009.
RESULTS OF OPERATIONS
(Millions except per share amounts) 2010 2009 2008
Net sales . . . . . . . . . . . . . . . . . . . . . . . . . . . . . . . . . . . . . . . . . . . . . $1,302.3 $715.2 $909.7
Operating profit (loss) . . . . . . . . . . . . . . . . . . . . . . . . . . . . . . . . . . . 73.6 (19.5) 28.1Income (loss) before income taxes . . . . . . . . . . . . . . . . . . . . . . . . . . 71.0 (20.8) 26.1
Net income (loss) . . . . . . . . . . . . . . . . . . . . . . . . . . . . . . . . . . . . . . . 46.4 (12.4) 18.4
Diluted earnings per share . . . . . . . . . . . . . . . . . . . . . . . . . . . . . . . . 2.25 (0.61) 0.89
Sales of $1.3 billion were $587.1 million, or 82%, higher than sales of $715.2 million in 2009, while sales in2009 declined $194.5 million, or 21%, from the 2008 sales level of $909.7 million.
Demand from the majority of our key markets improved in 2010 over 2009. Demand had fallen significantly in2009 from the 2008 level largely as a result of the global economic crisis and the related impact on consumerspending. Demand levels hit the near-term low point in the first quarter 2009 and then began improving over the
22

balance of 2009. The overall demand remained strong throughout 2010 as order entry levels exceeded sales in eachquarter of 2010 and also established a record high for the year.
Consumer electronics is our largest market, accounting for 41% of sales in 2010. Sales to this market wereaffected the most by the global economic crisis in 2009 and showed the most improvement in 2010. Consumerelectronics sales grew in 2010 as a result of an increase in consumer spending as well as the development of newapplications as our materials are used in the latest generation of smart phones and in a number of other wireless andhand-held devices. Sales of our materials for new and growing LED applications also contributed to the higher salesto the consumer electronics market in 2010.
Sales to the defense and science market, which accounted for 12% of total sales in 2010, grew in 2010 over2009 as a result of improvements in our existing defense business and the inclusion of a full year of Barr’s defensebusiness. Defense sales, after being solid in the first half of 2009, softened in the second half of that year due toprogram delays and push outs and finished 2009 below the 2008 level.
Sales to the industrial components and commercial aerospace market, which were 11% of our total sales in2010, also contributed to the growth in sales in 2010 over 2009. Commercial aerospace sales, which were soft in2009, improved in 2010 due to an increase in the build rate for aircraft utilizing our materials. Shipments ofmaterials for heavy equipment and other industrial applications grew in 2010 as well.
Automotive electronics sales in 2010 were approximately double the sales level in 2009 as sales improved inboth the domestic and European markets in 2010. Automotive electronics sales were approximately 5% of our totalsales in 2010. Sales to this market had declined at a double-digit rate in 2009 from 2008. Shipments into Europe,partially spurred by the lower value of the U.S. dollar, helped offset a portion of the weakness in the U.S. market in2009.
Sales to the energy market were over 6% of our total sales in 2010. We sell a variety of products into thisexpanding market and we have a number of growth platforms. Our traditional oil and gas materials contributed tothe growth in energy market sales in 2010 as did sales for architectural glass applications through Academy. We alsosell materials for new and developing solar energy, fuel cell and other energy-related applications.
Medical market sales were relatively unchanged in 2010 from 2009 after declining in 2009 from 2008. In 2010,we temporarily lost sales to a key medical application customer as a result of lower manufacturing yields. Processimprovements have been implemented and shipments to the customer have resumed in early 2011. Other portions ofour medical business improved in 2010, including x-ray window assemblies and related materials. Sales to themedical market were 4% of total sales in 2010.
We believe that the demand level in certain markets fell further in the first half of 2009 than the actual declinein consumer spending levels as a result of excess inventory levels in the downstream supply chain. We also believethat a portion of the sales improvement in the first half of 2010 may have been due to a replenishment of thesedownstream inventory levels.
The acquisitions of Barr and Academy accounted for 40% of the sales growth in 2010 over 2009. A largeportion of Academy’s sales is a precious metal pass-through.
Sales are affected by metal prices as changes in precious metal and a portion of the changes in base metalprices, primarily copper, are passed on to our customers. Metal prices have been quite volatile over the last threeyears, with various metals reaching near-term or all-time record highs in 2010. The average copper price for 2010was higher than 2009 while the average 2009 price was lower than the 2008 average price. Gold and other preciousmetal prices were higher on average in 2010 and 2009 than the immediate prior year. The change in metal pricesresulted in an estimated $103.0 million net increase in sales in 2010 over 2009 and an estimated $9.1 milliondecrease in sales in 2009 from 2008.
Domestic sales in 2010 were slightly more than double the 2009 level. Domestic sales had declined 19% in2009 from the 2008 level. Domestic sales include the majority of the sales from the two acquisitions as well as themajority of the impact of the higher metal price pass-through between periods. International sales, which areincluded in each of our reportable segments, improved 48% in 2010 over 2009 after declining 25% in 2009 from2008.
23

We implemented various cost-saving initiatives beginning in the fourth quarter 2008 and throughout the firstnine months of 2009 in response to the weakening order entry rate at that time. These initiatives included a reductionin work force, reduced wage and compensation levels, elimination of overtime (and a reduction in regular workhours in some cases), reduced discretionary spending and the cancellation or deferral of various projects andinitiatives. These efforts helped to offset the negative impact of the lower sales volume in 2009.
With the improved volumes in 2010, wage levels have been restored and various resources, includingmanpower and services, have been added back as needed to support the current and projected sales volumes.However, total manpower, excluding the two acquisitions, as of year-end 2010 was still 9% lower than the thirdquarter 2008 manpower level (which was just prior to when the global economic crisis began to significantly impactour business). The cost control programs remain in place as changes have been made to help improve our total coststructure.
We estimate that spending on certain operating costs (excluding materials) and other manufacturing overheadand selling, general and administrative costs in 2010, while higher than 2009, was still 7% lower than the 2008 level,excluding the impact of the acquisitions, despite the increase in sales volume.
Gross margin of $222.6 million in 2010 was $131.2 million higher than the gross margin of $91.4 million in2009. Gross margin also improved from 13% of sales in 2009 to 17% of sales in 2010. In 2008, the gross margin was$151.9 million, or 17% of sales.
We estimate that the incremental margin generated by the higher sales volumes, including the sales from thetwo acquisitions, accounted for approximately 76% of the gross margin improvement in 2010 over 2009.Manufacturing efficiencies, in part due to the increased production levels, and cost control efforts alsocontributed to the margin growth in 2010. Factory labor, other direct manufacturing costs and manufacturingoverhead costs did not increase proportionately with the increase in sales in 2010. The overall change in product mixwas favorable between 2010 and 2009 while pricing improvements were made in portions of our business. Yieldlosses and other inventory valuation adjustments at certain operations had a minor negative impact on overallmargins in 2010.
The lower sales volume in 2009 reduced margins by an estimated $69.5 million from 2008 and was the primarycause for the overall decline in margins in 2009 from 2008. Production levels were reduced in 2009 (due to the lowersales and a reduction in inventory), which resulted in operating inefficiencies at various facilities that negativelyaffected margins. The change in product mix was unfavorable in 2009 as compared to 2008 partially due to lowersales of higher margin generating beryllium-containing products in 2009. The 2009 gross margin was also reducedby the cost of a manufacturing quality return, unplanned downtime on a key piece of equipment and inventoryvaluation adjustments.
The cost-reduction efforts offset a portion of the negative impact of the above items on gross margin in 2009 asoperating and overhead manufacturing costs were lower in 2009 than in 2008.
The margin comparison between years was also affected by lower of cost or market charges of differingamounts each year as accounting regulations require inventory to be written down to its market value if it is below itscost. As a result of the falling prices for certain items, primarily ruthenium-containing materials, we recordedcharges of $0.4 million in 2010, $0.7 million in 2009, and $15.2 million in 2008.
In the first quarter 2009, we determined that the domestic defined benefit pension plan was curtailed due to thesignificant reduction in the workforce. As a result of the curtailment and the associated plan remeasurement, werecorded a $1.1 million one-time benefit during the first quarter 2009, $0.8 million of which was recorded againstcost of sales and $0.3 million recorded against selling, general and administrative expenses on the ConsolidatedStatement of Income and Loss. The all-in expense on this plan, including the one-time benefit in 2009, was$5.8 million in 2010, $3.2 million in 2009 and $4.8 million in 2008. See “Critical Accounting Policies” below.
Selling, general and administrative (SG&A) expenses were $126.5 million (10% of sales) in 2010,$89.8 million (13% of sales) in 2009 and $104.5 million (11% of sales) in 2008. The majority of the$36.7 million increase in SG&A expenses in 2010 over 2009 was due to a combination of the expensesincurred by the acquisitions and higher incentive compensation expenses. Sales-related expenses and other
24

costs had a minor impact on the increase. The lower expense in 2009 as compared to 2008 was mainly due to thecost-reduction efforts in light of the sales decline as manpower levels and costs and discretionary spending were cutin 2009. Sales and distribution-related expenses were lower in 2009 than in 2008 as well. With the significantlyimproved sales volumes in 2010, a portion, but not all, of the previously reduced resources were added back tosupport the current and projected growth in the business.
Approximately 35% of the increase in SG&A expenses in 2010 over 2009 was due to the expenses incurred byBarr and Academy subsequent to their acquisition.
The incentive compensation expense on plans designed to pay in cash was $15.2 million higher in 2010 than in2009 and $1.2 million lower in 2009 than in 2008. The changes in the annual expense between years were caused bythe performance of the individual businesses relative to their plans’ objectives. In 2010, the majority of ouroperations exceeded their plans’ targets. Stock-based compensation expense, including the expense for stockappreciation rights, restricted stock and performance restricted shares, was $4.1 million in 2010, $3.5 million in2009 and $2.6 million in 2008. The comparison of stock-based compensation expense between years may beaffected by changes in plan design, the number of grants in a given year, actual performance relative to the plans’objectives, movement in our stock price and other factors.
International SG&A expenses, excluding incentive compensation (which is included in the above paragraph),were approximately 5% higher in 2010 than in 2009. A portion of this increase is due to translation rate differences.International expenses were 19% lower in 2009 than in 2008 largely due to the cost-reduction efforts and a declinein sales-related expenses.
Severance and related costs associated with headcount reductions totaled $1.1 million in 2010 and $2.1 millionin 2009.
Acquisition-related expenses for legal, accounting and due diligence services associated with the Barr andAcademy transactions totaled $0.7 million in 2009. Additional fees totaling $0.1 million were incurred in 2010. Asa result of a change in accounting regulations effective January 1, 2009, acquisition-related expenses must becharged against income as incurred. Previously, these expenses would have been capitalized as part of the cost of theacquisitions.
Other corporate administrative expenses were higher in 2010 than in 2009 partially as a result of the cost ofvarious initiatives that were designed to provide long-term benefits. Costs associated with changing our corporatename, along with our subsidiaries’ names, totaled approximately $0.9 million in 2010. Corporate expenses weredown $5.6 million in 2009 from 2008 in part due to the cost-reduction efforts and the related impact oncompensation and benefits. Information technology costs were also lower in 2009 than 2008 as were costs forvarious outside services.
Research and development (R&D) expenses were $7.1 million in 2010, $6.8 million in 2009 and $6.5 millionin 2008. R&D expenses were less than 1% of sales in each of the last three years. Despite the corporate-wide cost-reduction efforts in light of the lower sales volume in 2009, we increased our R&D spending slightly in that year.R&D efforts are focused on developing new products and applications as well as continuing improvements in ourexisting products.
The litigation settlement gain of $1.1 million in 2008 represents the favorable settlement of a lawsuit, net oflegal fees, in which we sought recovery of our rights under a previously signed indemnity agreement.
There were no litigation settlement gains in 2010 or 2009.
Derivative ineffectiveness expense was $0.6 million in 2010, $4.9 million in 2009 and $0.2 million in 2008.We secured a copper derivative embedded in a debt obligation in 2009 that served as an economic hedge to changesin the value of our copper inventories. However, the derivative did not qualify as a hedge for accounting purposesand changes in its fair value were recorded against income as ineffectiveness expense. The derivative was in a lossposition of $4.9 million as of year-end 2009 as a result of an increase in the market price of copper since thederivative’s inception. Forward contracts were secured in 2010 to hedge against further unfavorable changes in theembedded derivative’s fair value. The $0.6 million of expense in 2010 was the net unfavorable change in the fairvalue of these instruments in 2010. The embedded derivative and forward contracts matured during 2010.
25

Derivative ineffectiveness expense of $0.2 million in 2008 resulted from changes in the fair value of an interestrate swap that did not qualify as a hedge for accounting purposes. This swap was terminated in the fourth quarter2008.
Other-net expense was $14.8 million in 2010, $9.5 million in 2009 and $13.6 million in 2008. See Note O tothe Consolidated Financial Statements for the details of the major components of other-net expense for each of thethree years. The major differences in other-net expense between the years include the following:
Amortization expense increased $2.4 million in 2010 over 2009 and $0.5 million in 2009 over 2008 primarilydue to the amortization of the intangible assets acquired with Barr and Academy. See Note E to the ConsolidatedFinancial Statements.
The metal consignment fee, after declining $1.2 million in 2009 from 2008, increased $3.2 million in 2010over 2009 as a result of higher metal prices, increased quantities of metal on hand and the inclusion of Academy’srequirements under the consignment lines in 2010. The expense was lower in 2009 than in 2008 as we reduced thequantity of metal on hand in response to the lower sales and production requirements in that year.
The Barr purchase agreement included an earn-out feature that would require us to make additional paymentsto the prior owners of Barr based upon Barr’s performance against identified benchmarks over the 2010 to 2013period. The present value of the earn-out was estimated to be $1.9 million at the time of the acquisition and wasrecorded in other long-term liabilities on the Consolidated Balance Sheet as of December 31, 2009. No paymentwas required to be made for 2010 based upon Barr’s actual performance relative to the benchmark for the year. Wedetermined that the fair value of this liability, based upon the current facts and circumstances and updatedprojections, should be reduced to $1.1 million as of December 31, 2010. The $0.8 million benefit from the reductionin the liability was recorded as income in the fourth quarter 2010 in accordance with accounting guidelines.
We donated our former headquarters building and the associated land to a non-profit organization, whichresulted in a write-off of the carrying value of $0.5 million to other-net expense in 2010. The majority of thisunfavorable impact on income before income taxes was offset by a favorable income tax adjustment.
Foreign currency exchange and translation losses totaled $0.8 million in 2010, $0.7 million in 2009 and$3.7 million in 2008. These losses result from movements in the value of the U.S. dollar versus other currencies,primarily the euro, yen and sterling, and the related impact on certain foreign currency denominated assets,liabilities and transactions and the maturity of foreign currency hedge contracts.
The operating profit in 2010 was $73.6 million, a $93.1 million improvement over the $19.5 million operatingloss in 2009. This improvement was due to the higher margin generated by the increased sales volumes, the impactof the acquisitions and other factors offset in part by an increase in incentive compensation, metal consignment fees,amortization and other expenses. The operating loss in 2009 was $47.6 million lower than the operating profit of$28.1 million generated in 2008. This reduction was primarily a result of the lower gross margin due to the declinein sales and other factors along with the derivative ineffectiveness loss offset in part by the operating and overheadspending savings from the cost-reduction efforts, lower foreign currency exchange and translation losses and otheritems.
Interest expense totaled $2.7 million in 2010, $1.3 million in 2009 and $2.0 million in 2008. The averageoutstanding debt levels were higher throughout 2010 than 2009 primarily as a result of the two acquisitions and theincrease in working capital. Capital lease balances were higher in 2010 than 2009 as well. The impact of the higherdebt and capital lease levels on interest expense was partially offset by a lower effective borrowing rate in 2010 thanin 2009. Average debt levels for the full year 2009 were lower than in 2008 and the average borrowing rate wasslightly lower as well.
The income (loss) before income taxes and the income tax expense (benefit) for each of the past three yearswere as follows:
(Dollars in millions) 2010 2009 2008
Income (loss) before income taxes . . . . . . . . . . . . . . . . . . . . . . . . . . . . . . $71.0 $(20.8) $26.1
Income tax expense (benefit) . . . . . . . . . . . . . . . . . . . . . . . . . . . . . . . . . . 24.5 (8.4) 7.7Effective tax (benefit) rate . . . . . . . . . . . . . . . . . . . . . . . . . . . . . . . . . . . . 34.6% (40.6)% 29.6%
26

The effects of percentage depletion (a tax benefit resulting from our mining operations), foreign source incomeand deductions, the production deduction and other items were major causes of the differences between the effectiveand statutory rates in each of the three years. The effect of executive compensation was also a cause for thedifference between the effective and statutory rates in 2010 and 2008.
The tax expense in 2010 included $1.5 million for the reduction of a deferred tax asset as a result of the PatientProtection and Affordable Care Act, as amended by the Health Care and Education Reconciliation Act. Beginningin 2013, we will no longer be able to claim an income tax deduction for prescription drug benefits provided to ourretirees and reimbursed under the Medicare Part D retiree drug subsidy program. While this tax increase does nottake effect until 2013, accounting standards require that the carrying value of a deferred tax asset be adjusted in theperiod in which legislation changing the applicable tax law is enacted.
The 2010 tax expense included the unfavorable impact of a net $0.6 million increase in the tax reserves thatwas recorded in accordance with accounting guidelines. In 2009, the tax benefit was increased by a net $0.7 millionreduction in the tax reserves while in 2008 the tax expense was affected by a net $1.3 million reduction in taxreserves.
See Note Q to the Consolidated Financial Statements for a reconciliation of the statutory and effective taxrates.
Net income was $46.4 million, or $2.25 per share diluted, in 2010 compared to a net loss of $12.4 million, or$0.61 per share diluted, in 2009. In 2008, net income was $18.4 million, or $0.89 per share diluted.
Segment Disclosures
In the first quarter 2011, we announced the change of our name from Brush Engineered Materials Inc. toMaterion Corporation effective March 8, 2011. The names of all of our active subsidiaries are changing as well andeach subsidiary will have Materion as part of its name. The legal and ownership structure of our subsidiariesremained unchanged.
This name change did not alter our senior management structure or how the chief operating decision makerevaluates the performance of our businesses. We continue to have the same four reportable segments as we hadpreviously with no change in their make up or reporting structure, although the names of those segments havechanged. Advanced Material Technologies and Services has been renamed as Advanced Material Technologies,Specialty Engineered Alloys is now known as Performance Alloys, Beryllium and Beryllium Composites has beenshortened to Beryllium and Composites, and Engineered Material Systems has been changed to TechnicalMaterials.
Results by segment are shown in Note M to the Consolidated Financial Statements. The All Other column inNote M includes our parent company expenses, other corporate charges and the operating results of MaterionServices Inc. (formerly BEM Services, Inc.), a wholly owned subsidiary that provides administrative and financialoversight services to our other businesses on a cost-plus basis.
The All Other column shows an operating loss of $8.3 million in 2010, $9.4 million in 2009 and $2.9 million in2008. The loss was lower in 2010 than in 2009 as an increase in corporate spending and higher incentivecompensation expense were more than offset by an increase in charges out to the business units and the difference inderivative ineffectiveness between periods.
The increased loss in the All Other column in 2009 as compared to 2008 was due primarily to the $4.9 millionderivative ineffectiveness expense recorded in 2009, the $1.1 million litigation settlement gain recorded in 2008 anddifferences in the level of costs charged to the other units offset in part by lower corporate spending and otherfactors.
Advanced Material Technologies
(Millions) 2010 2009 2008
Net sales. . . . . . . . . . . . . . . . . . . . . . . . . . . . . . . . . . . . . . . . . . . . . . . $879.0 $460.8 $480.3
Operating profit . . . . . . . . . . . . . . . . . . . . . . . . . . . . . . . . . . . . . . . . . 39.5 22.6 10.8
27

Advanced Material Technologies manufactures precious, non-precious and specialty metal products,including vapor deposition targets, frame lid assemblies, clad and precious metal preforms, high temperaturebraze materials, ultra-fine wire, advanced chemicals, optics, performance coatings and microelectronic packages.These products are used in wireless, semiconductor, photonic, hybrid and other microelectronic applications withinthe consumer electronics and telecommunications infrastructure markets. Other key markets for these productsinclude medical, defense and science, energy and industrial components. Advanced Material Technologies also hasmetal cleaning operations and in-house refineries that allow for the reclaim of precious metals from internallygenerated or customers’ scrap. This segment has domestic facilities in New York, Connecticut, Wisconsin, NewMexico, Massachusetts and California and international facilities in Asia and Europe.
Sales from Advanced Material Technologies of $879.0 million in 2010 grew $418.2 million, or 91%, over salesof $460.8 million in 2009. Sales in 2009 were 4% lower than sales of $480.3 million in 2008. The growth in 2010was due to a combination of improved market conditions, product development efforts, higher metal prices and thetwo acquisitions. The decline in sales in 2009 from 2008 was largely due to the impact of the global economicconditions, particularly for consumer electronics applications in the first half of 2009, and lower sales for defense,medical and media applications offset in part by higher metal prices and other factors.
Revenues for fabrication and other related charges from the Buffalo, New York facility, this segment’s largestoperation, grew 30% in 2010 over 2009. The Buffalo facility manufactures vapor deposition targets, lids, wire andother precious metal products for various semiconductor and other microelectronic applications. The key driver forthis growth was improved demand from the consumer electronics market for materials for LED and wireless andother hand-held device applications. Demand from other markets served, including defense and science, grew aswell. Refining revenue, after declining in 2009 from 2008, also contributed to the growth in 2010. Refining revenueis partially a function of the volume of precious metal products sold and the available quantity of metal in the marketto be reclaimed.
Sales of advanced chemicals, after declining in 2009 from 2008 due to the global economic crisis, improvedapproximately 34% in 2010 from 2009. A large portion of this growth was due to sales of materials for LEDapplications within the consumer electronics market as a result of the expanded use of LED technologies and thedevelopment of new applications. Advanced chemicals are also used in the growing solar energy market as well asfor optics and security applications.
Sales of electronic packages, one of this segment’s smaller product lines, grew 42% in 2010 over 2009 due toimproved demand for telecommunications infrastructure applications in Asia. Sales of these products grew 8% in2009 over 2008. Due to a change in technology in the market, we anticipate that sales of electronic packages maysoften in 2011. Sales for data storage applications, primarily magnetic head materials, showed modest growth in thefirst three quarters of 2010 over a sluggish 2009, but softened in the fourth quarter 2010, partially due to aninventory correction in the market place.
The acquisitions of Academy and Barr accounted for approximately 56% of the increase in the segment’s salesin 2010 over 2009, while Barr’s sales subsequent to its acquisition in the fourth quarter 2009 helped offset a portionof the decline in total segment sales between 2009 and 2008. The addition of Academy provided access to newmarkets and applications for us, including architectural glass and jewelry, as well as additional precious metalrefining capabilities and capacity. Academy’s operations in Albuquerque, New Mexico dovetail with our existingBuffalo, New York operations and provide opportunities for enhanced operational efficiencies.
Barr produces precision thin film optical filters used in defense, medical, telecommunications and othermarkets. The acquisition of Barr, coupled with our existing operations, expands our precision optics product line,allowing us to provide a broad array of optical filters across a wide band of wavelengths. The Barr facility facedvarious operational challenges that hampered sales in the first half of 2010, including unsatisfactory on-timedelivery performance and other inefficiencies. However, process changes were made throughout the year andperformance and operating results improved in the second half of the year. The backlog for precision optics wassolid entering 2011. New applications within the defense and science market helped to drive improvements in salesand the order backlog.
28
Offsetting a portion of the growth in the above products and markets was a decline in sales of large area specialcoatings to the medical market. Sales of these products, mainly precision precious metal coated polymer films, were17% lower in 2010 than in 2009. Lower manufacturing yields and the inability to hold tolerances resulted in missedsales to a key customer and the loss of a portion of the business to our competitor in 2010. New processes have beendeveloped and qualified with the customer and shipment levels began to ramp back up in the first quarter 2011.Sales of polymer films to the medical market were softer in 2009 than a solid 2008 due to weaker demand and otherfactors.
Sales of other materials to the medical market, primarily lids, were relatively unchanged throughout the 2008to 2010 time frame.
We adjust our selling prices daily to reflect the current cost of the precious and various non-precious metalssold. While a change in the cost of the metal is generally a pass-through to the customer, we generate a margin onour fabrication efforts irrespective of the type of metal used in a given application. On average, the applicable metalprices were higher in 2010 and 2009 than the respective prior years. We estimate that the higher metal pricesincreased sales by $90.9 million in 2010 as compared to 2009 and $5.0 million in 2009 as compared to 2008.
Total order entry for the segment exceeded sales by approximately 4% in 2010.
Gross margins generated by Advanced Material Technologies totaled $113.3 million (13% of sales) in 2010,$68.1 million (15% of sales) in 2009 and $59.6 million (12% of sales) in 2008.
The main cause for the $45.2 million increase in gross margin in 2010 over 2009 was the margin benefit fromthe higher sales volume from the existing operations as well as from the two acquisitions. This margin benefit waspartially offset by the incremental manufacturing overhead costs incurred by the two acquisitions totaling$11.4 million and the increased manufacturing overhead costs incurred by the existing operations of $0.6 million.
The 2010 margin was adversely affected by the lower medical market sales, which typically generate highermargins. Approximately 18% of Academy’s sales in 2010 were silver investment bars that generate very lowmargins. These negative mix effects were generally offset by efficiencies and improvements in other areas. Grossmargin as a percent of sales declined in 2010 from 2009 largely due to the higher precious metal price pass-throughin sales in 2010 and the addition of Academy’s sales, which have a very high metal content.
Margins grew in 2009 on the reduced sales volume largely due to lower of cost or market charges of$0.7 million in 2009 compared to $15.2 million in 2008. This $14.5 million benefit between years was partiallyoffset by an estimated $8.0 million margin impact from the lower sales volume. Lower yields on polymer stripproducts and various inventory valuation adjustments reduced margins by an estimated $1.1 million in 2009. Thechange in product mix was slightly unfavorable in 2009 largely due to lower medical and defense sales.Manufacturing overhead costs at the existing facilities were reduced in 2009, but these savings were partiallyoffset by the inclusion of Barr beginning in the fourth quarter.
SG&A, R&D and other-net expenses from Advanced Material Technologies were $73.8 million (8% of sales)in 2010, $45.5 million (10% of sales) in 2009 and $48.7 million (10% of sales) in 2008.
Expenses incurred by Academy and Barr accounted for approximately 56% of the increase in expenses in 2010over 2009. The decline in expenses in 2009 was net of the $1.9 million of SG&A expenses incurred by Barr since itsacquisition in the fourth quarter 2009.
Incentive compensation expense was $3.9 million higher in 2010 than 2009, due to the improved performancein 2010, and $0.1 million higher in 2009 than 2008. Various sales-related expenses increased in 2010 to support thehigher volumes. R&D costs increased in each of the last two years in order to support the current business and futuregrowth. Corporate charges increased $4.7 million in 2010 over 2009 after declining in 2009 from the 2008 level.
Expenses were reduced in 2009 mainly in response to the lower sales volumes. Manpower levels and costs anddiscretionary spending items were reduced at various facilities during the year.
Amortization of intangible assets increased $2.3 million in 2010 over 2009 and $0.5 million in 2009 over 2008largely due to the acquisitions of Academy and Barr.
29

Metal financing fees were $2.1 million higher in 2010 than in 2009 due to the additional quantity of metal onhand (due to the higher production requirements and from the inclusion of Academy’s requirements under theconsignment lines) and higher metal prices. Financing fees were $1.2 million lower in 2009 than in 2008 primarilydue to a reduction in the average quantity of metal on hand.
Operating profit from Advanced Material Technologies of $39.5 million in 2010 was a $16.9 millionimprovement over the operating profit of $22.6 million in 2009. This improvement was due to the marginbenefit from the higher sales volumes and other factors offset in part by higher expenses. The acquisitionscontributed to the improved profit in this segment in 2010. The operating profit in 2009 was more than double theprofit of $10.8 million earned in 2008 as a result of the margin improvement and lower expenses. Operating profitwas 4% of sales in 2010, 5% of sales in 2009 and 2% of sales in 2008.
Performance Alloys
(Millions) 2010 2009 2008
Net sales. . . . . . . . . . . . . . . . . . . . . . . . . . . . . . . . . . . . . . . . . . . . . . . $293.8 $172.5 $299.9
Operating profit (loss) . . . . . . . . . . . . . . . . . . . . . . . . . . . . . . . . . . . . . 27.2 (32.3) 5.8
Performance Alloys manufactures and sells three main product families:
Strip products, the larger of the product families, include thin gauge precision strip and thin diameter rod andwire. These copper and nickel alloys provide a combination of high conductivity, high reliability and formability foruse as connectors, contacts, switches, relays and shielding. Major markets for strip products include consumerelectronics, telecommunications infrastructure, automotive electronics, appliance and medical;
Bulk products are copper and nickel-based alloys manufactured in plate, rod, bar, tube and other customizedforms that, depending upon the application, may provide superior strength, corrosion or wear resistance, thermalconductivity or lubricity. While the majority of bulk products contain beryllium, a growing portion of bulkproducts’ sales is from non-beryllium-containing alloys as a result of product diversification efforts. Applicationsfor bulk products include oil and gas drilling components, bearings, bushings, welding rods, plastic mold tooling,and undersea telecommunications housing equipment; and
Beryllium hydroxide is produced at our milling operations in Utah from our bertrandite mine and purchasedberyl ore. The hydroxide is used primarily as a raw material input for strip and bulk products and, to a lesser extent,by the Beryllium and Composites segment. External sales of hydroxide from the Utah operations were less than 4%of Performance Alloys’ total sales in each of the three most recent years.
Strip and bulk products are manufactured at facilities in Ohio and Pennsylvania and are distributedinternationally through a network of company-owned service centers and outside distributors and agents.
Sales from Performance Alloys were $293.8 million in 2010, an improvement of $121.3 million, or 70%, oversales of $172.5 million in 2009. This growth was due to improved demand from key markets, higher metal pass-through prices and other price increases. Sales in 2009 were $127.4 million, or 42%, lower than sales of$299.9 million in 2008 primarily due to the impact of the global economic crisis on shipments of both stripand bulk products. Sales to all major markets declined at double digit rates in 2009 from the 2008 levels.
The order entry rate, after an extremely weak first half of 2009, improved in the second half of 2009 and thenwas quite strong during the majority of 2010. The improved demand for strip products fueled the growth in the orderentry rate in the first half of 2010 while the demand for bulk products was stronger in the second half of 2010. Totalorder entry exceeded the sales level in 2010 by 11%.
Sales of strip and bulk products grew in 2010 over 2009 after declining in 2009 from 2008. The growth in stripsales in 2010 was largely due to improved demand from the consumer electronics, appliance and automotiveelectronics markets. The growth in sales to the consumer electronics market, Performance Alloys’ largest market,was fueled by the use of our materials in PDAs, the latest generations of smart phones and other hand-held devices.Automotive electronic sales were higher in 2010 as sales in 2009 were quite low, particularly in the first half of thatyear. Appliance sales grew approximately 50% in 2010 over 2009, primarily in Europe. The demand for strip
30
products was stronger in the first half of 2010 than the second half of the year due to seasonality issues, modelchangeovers and the replenishment of downstream inventory positions.
The decline in strip sales in 2009 as compared to 2008 was mainly caused by the global economic crisis and theimpact on consumer spending. Demand levels from the consumer electronics and automotive electronics marketsdeclined severely, particularly in the first quarter 2009. Market conditions improved somewhat in the second half ofthat year due to consumer electronic applications in Asia and automotive and appliance applications in Europe.
The growth in bulk product sales in 2010 over 2009 was across multiple markets. Demand from the oil and gassector of the energy market improved throughout 2010, partially as an aftermath of the gulf oil disaster in 2010 ascustomers turned to our products due to their high performance characteristics. Sales for oil and gas applicationsweakened in 2009 from 2008 due to excess inventory positions and because the price of oil was generally below thelevel that would spur significant exploration and production increases. Commercial aerospace sales grew in 2010over 2009 as a result of an increase in the build rate of aircraft that utilize our materials. Aerospace sales in 2009 haddeclined from the 2008 level due to ongoing deferrals of new aircraft builds and decreased repair and maintenanceactivities. Sales of materials for heavy equipment and other applications within the industrial components market,including sales of non-beryllium containing alloys, also contributed to the growth in bulk product sales in 2010 over2009.
Strip product volumes (i.e., pounds shipped) grew 56% in 2010 over 2009 after declining 32% in 2009 from2008. Bulk product volumes were 70% higher in 2010 than in 2009 while volumes in 2009 were 45% lower than2008. Total volumes rebounded in 2010 from the softness in 2009 and were essentially on par with the volumesshipped in 2008.
Copper prices were higher on average in 2010 than in 2009 and the increased copper price pass-throughaccounted for an estimated $12.1 million of the sales growth in 2010. Lower copper prices reduced sales in 2009 byan estimated $14.1 million from 2008.
As demand declined beginning in the fourth quarter 2008, Performance Alloys initiated various cost-reductionefforts that continued throughout 2009. By the end of 2009, the employment levels within manufacturing, sales andadministration had been reduced by approximately 200 people from the September 2008 level. With theimprovement in demand in 2010 and the increased production requirements and other business support needs,the employment level increased during 2010. However, the year-end 2010 employment level was still lower than itwas as of the end of the third quarter 2008.
Performance Alloys generated a gross margin of $74.2 million in 2010, an improvement of $65.2 million overthe gross margin of $9.0 million in 2009. The gross margin was $59.3 million in 2008. Gross margin was 25% ofsales in 2010 compared to 5% of sales in 2009 and 20% of sales in 2008.
The higher sales volume was the largest cause of the improved gross margin in 2010, accounting for anestimated $31.2 million of the increase. Production volumes were also higher in 2010 than in 2009, which,combined with other factors, led to improved manufacturing efficiencies and higher machine utilization rates.Factory labor and other direct manufacturing costs, while higher in 2010 than in 2009, did not increaseproportionately with the volume increase, allowing us to leverage our production efforts. Higher selling pricesfor bulk and strip products also contributed to the margin increase in 2010 over 2009 as did a favorable change in theproduct mix. Manufacturing overhead costs increased $2.7 million in 2010 over 2009 largely due to increases inmaintenance and supply expenses offsetting a decline in utility expenses.
The depletion of a last-in, first-out (LIFO) layer from inventory resulted in a net benefit to gross margin of$4.4 million in 2010. This benefit may not recur to this extent or at all in 2011.
The $50.3 million margin decline in 2009 was primarily due to the $127.4 million reduction in sales.Production volumes were even lower than sales in 2009 as inventories were worked down throughout the year. Thelower production volumes negatively affected margins as a result of increased manufacturing inefficiencies andlower machine utilization rates. In addition, unplanned downtime on a key piece of equipment in the fourth quarter2009 reduced margins by an estimated $1.3 million. The change in product mix was unfavorable in 2009 as well.Manufacturing overhead spending, including manpower and utilities, was lower in 2009 than 2008 and helped to
31

mitigate a portion of the negative impact the above items had on margins. Pricing improvements implementedduring 2009 also provided a small benefit to margins in the year.
Total SG&A, R&D and other-net expenses were $47.0 million in 2010, an increase of $5.7 million overexpenses of $41.3 million in 2009. The 2009 expenses were $12.2 million lower than expenses of $53.5 million in2008. Expenses were 16% of sales in 2010, 24% of sales in 2009 and 18% of sales in 2008.
The increased expense in 2010 on a dollar basis was due to higher incentive compensation (which resultedfrom the significantly improved operating results), higher commissions (due to the increased sales) and highercorporate costs. These increases were offset in part by a net decline in all of the other expenses incurred byPerformance Alloys as many of the cost-reduction efforts implemented during 2009 remained in place throughout2010. Cost savings were also obtained in 2010 as a result of the closing of the distribution center operation in theUnited Kingdom in the fourth quarter 2009. Sales to the United Kingdom are now shipped from our Germanoperations or through an independent distributor.
The lower expenses in 2009 as compared to 2008 were largely due to the aforementioned cost-reduction effortsoffset in part by severance costs. Sales-related expenses, including commissions and advertising, were also lower in2009 than in 2008. Lower incentive compensation and foreign currency exchanges losses contributed to the declinein expenses in 2009 as well.
Performance Alloys earned an operating profit of $27.2 million in 2010, an improvement of $59.5 million overthe operating loss of $32.3 million in 2009. The increase in profit was due to the margin generated by the highersales, manufacturing improvements and improved pricing partially offset by changes in expenses. The operatingloss in 2009 was down $38.1 million from the operating profit of $5.8 million earned in 2008 due to the impact of thelower sales volumes and other factors partially offset by the cost saving efforts and other expense reductions.
Beryllium and Composites
(Millions) 2010 2009 2008
Net sales . . . . . . . . . . . . . . . . . . . . . . . . . . . . . . . . . . . . . . . . . . . . . . . . . $61.9 $47.0 $63.6
Operating profit . . . . . . . . . . . . . . . . . . . . . . . . . . . . . . . . . . . . . . . . . . . . 10.0 2.1 8.4
Beryllium and Composites manufactures beryllium-based metals and metal matrix composites in rod, sheet,foil and a variety of customized forms at the Elmore, Ohio and Fremont, California facilities. These materials areused in applications that require high stiffness and/or low density and they tend to be premium-priced due to theirunique combination of properties. This segment also manufactures beryllia ceramics produced at the Tucson,Arizona facility. Defense and science is the largest market for Beryllium and Composites, while other marketsserved include industrial components and commercial aerospace, medical, energy and telecommunicationsinfrastructure. Products are also sold for acoustics and optical scanning applications.
Sales from Beryllium and Composites were $61.9 million in 2010, an improvement of $14.9 million, or 32%,over sales of $47.0 million in 2009. Sales in 2009 were 26% lower than sales of $63.6 million in 2008.
The majority of the sales improvement in 2010 over 2009 was due to growth in sales to the defense and sciencemarket. Sales to this market, which accounted for over half of Beryllium and Composites sales in 2010, had declinedin the second half of 2009 as a result of project funding delays and push outs at that time. The primary defenseplatforms for these products are aerospace and missile system applications. Due to changes in government spendingpatterns, we anticipate that defense sales will be flat to softer in 2011 than in 2010.
Sales to the industrial components and commercial aerospace market, the segment’s second largest market,also grew in 2010 over 2009. A portion of this growth was due to the development of new applications forAlBeMet», a metal matrix composite, in semiconductor manufacturing equipment.
Sales to the medical market improved in 2010 over 2009 after declining significantly in 2009 from 2008.Shipments of x-ray window assemblies nearly doubled in 2010 over 2009. A key driver for this growth is theconversion to digital x-ray equipment, particularly in radiology and fluoroscopy systems. Shipments of berylliumfoil for x-ray applications also increased in 2010 over 2009. Our x-ray window assemblies and related materials areused in medical, scientific and industrial applications.
32

Sales of ceramic products increased over 50% in 2010 over 2009 after declining 42% in 2009 from 2008. Thegrowth in 2010 was largely due to increased shipments for applications within the telecommunicationsinfrastructure market. The decline in sales in 2009 was largely due to the global economic crisis and itsimpact in particular on a key ceramic products customer’s business.
Sales of beryllium speaker domes for acoustic diaphragm assemblies grew slightly in 2010 over 2009 butremained relatively minor. This niche application presents potential growth opportunities for our materials.
The gross margin on Beryllium and Composites’ sales was $21.5 million (35% of sales) in 2010, $11.1 million(24% of sales) in 2009 and $19.6 million (31% of sales) in 2008.
The gross margin improved by an estimated $7.9 million in 2010 over 2009 as a result of the higher salesvolume. The change in product mix was favorable in 2010 as compared to 2009 while manufacturing overhead costswere also lower in 2010 than in 2009 as we were able to leverage the existing cost base. The difference in inputmaterials, use of vendor scrap and reclamation efforts provided an estimated $0.3 million net benefit in 2010. Thesemargin benefits were partially offset by lower manufacturing yields on welded products that reduced margins by anestimated $1.2 million in 2010. Process improvements were implemented and yields on these products improved inthe second half of 2010.
The main cause of the decline in the gross margin dollars and rate in 2009 was the significant fall-off in sales inthat year. The margin impact of the lower volumes was partially mitigated by a reduction in direct and overheadmanufacturing costs, including manpower, supplies and utility costs. Material input costs increased in 2009 over2008 and had a negative impact on margins. The change in product mix was slightly unfavorable in 2009.
SG&A, R&D and other-net expenses were $11.5 million (19% of sales) in 2010, $9.0 million (19% of sales) in2009 and $11.2 million (18% of sales) in 2008. The main driver for the increased expense level in 2010 was higherincentive compensation, due to the improved profitability, and higher corporate charges. Various sales andmarketing support expenses, including commissions and travel, also increased in 2010 over 2009. The lowerexpense in 2009 was due to the cost-reduction initiatives and reduced incentive compensation. These benefits werepartially offset by an increase in R&D expenses.
Beryllium and Composites generated an operating profit of $10.0 million in 2010, an improvement of$7.9 million over the operating profit of $2.1 million generated in 2009. This improvement was due to the marginbenefit from the higher sales and other factors offset in part by an increase in expenses. Operating profit in 2009declined $6.3 million from the $8.4 million earned in 2008, primarily as a result of the lower sales volume.Operating profit was 16% of sales in 2010, 5% of sales in 2009 and 13% of sales in 2008.
Technical Materials
(Millions) 2010 2009 2008
Net sales . . . . . . . . . . . . . . . . . . . . . . . . . . . . . . . . . . . . . . . . . . . . . . . . . $67.5 $34.7 $65.9
Operating profit (loss). . . . . . . . . . . . . . . . . . . . . . . . . . . . . . . . . . . . . . . . 5.3 (2.5) 5.9
Technical Materials manufactures clad inlay and overlay metals, precious and base metal electroplatedsystems, electron beam welded systems, contour profiled systems and solder-coated metal systems. These specialtystrip metal products provide a variety of thermal, electrical or mechanical properties from a surface area orparticular section of the material. Our cladding and plating capabilities allow for a precious metal or brazing alloy tobe applied to a base metal only where it is needed, reducing the material cost to the customer as well as providingdesign flexibility. Major applications for these products include connectors, contacts and semiconductors while thelargest markets are automotive electronics and consumer electronics. The defense and science, energy and medicalmarkets are smaller but offer further growth opportunities. Technical Materials’ products are manufactured at theLincoln, Rhode Island facility.
Sales from Technical Materials of $67.5 million in 2010 were nearly double the sales of $34.7 million in 2009while sales in 2009 were 47% lower than sales of $65.9 million in 2008. Sales of all major product lines were higherin 2010 than in 2009 and total volumes shipped increased approximately 74% in 2010 over 2009.
33

The sales growth in 2010 over 2009 was due to improved demand from each of the key markets served as wellas the continued product development efforts. The significant decline in sales in 2009 was due to the impact of theglobal economic crisis on demand beginning in the fourth quarter 2008 and continuing into 2009. Sales, afterreaching their near-term low point in the first quarter 2009, improved sequentially in each quarter of 2009. Sales inthe first half of 2010 were higher than sales in the second half of 2010 partially due to the replenishment ofdownstream inventories in the first half of the year. Total order entry exceeded sales by approximately 10% in 2010.
Automotive electronic sales in 2010 were more than twice the sales level from 2009 as both domestic andforeign shipments improved. Sales to this market declined significantly in 2009, particularly in the U.S.
Sales to the consumer electronics market grew approximately 80% in 2010 over 2009. A portion of the growthin 2010 was attributable to a 64% improvement in sales of disk drive arm materials. After growing into a sizableportion of this segment’s sales in 2008, sales of disk drive arm materials declined sharply in the first quarter 2009and, while shipment levels recovered somewhat over the balance of the year, sales in 2009 were still 46% lower in2009 than in 2008.
Sales to the medical and energy markets, while relatively minor, also contributed to the sales growth in 2010over 2009.
Technical Materials generated a gross margin of $14.5 million in 2010, $3.5 million in 2009 and $13.5 millionin 2008. Gross margin improved to 22% of sales in 2010 after falling to 10% of sales in 2009 from 21% of sales in2008.
The $11.0 million increase in gross margin in 2010 over 2009 was largely due to the $32.8 million growth insales while the associated higher production volumes helped generate improved manufacturing efficiencies as well.Factory labor and other direct manufacturing costs were added back in 2010 only as needed to meet the productionschedule. Manufacturing overhead costs were $0.8 million higher in 2010 than in 2009.
The lower margin dollars and rate in 2009 were due to the severe decline in sales during the year. The change inproduct mix was also unfavorable in 2009. In response to the lower sales, labor and other direct manufacturing costswere reduced approximately 26% in 2009 from the 2008 level. Production schedules were revised to allow formanufacturing to be campaigned on various equipment lines in order to offset a portion of the inefficiencies createdby the low production volumes. Manufacturing overhead costs, including manpower, maintenance and utilities,were also reduced by $1.6 million in 2009 from the 2008 level.
While employment levels increased during 2010, the total employment within Technical Materials was 10%lower at year-end 2010 than it was as of the third quarter 2008.
SG&A, R&D and other-net expenses were $9.2 million in 2010 compared to $6.0 million in 2009 and$7.6 million in 2008. Higher selling and marketing costs, including manpower, commissions and travel expenses,were the main cause of the increase in 2010 over 2009. Incentive compensation costs and corporate charges were$1.0 million higher in 2010 than in 2009. Other net-expenses, including the metal consignment fee and othermiscellaneous items, contributed to the higher expense level in 2010 as well. The lower expense level in 2009 ascompared to 2008 was due to the spending reductions, implemented in reaction to the decline in sales, and lowerincentive compensation and corporate charges.
Technical Materials generated an operating profit of $5.3 million (8% of sales) in 2010 versus an operating lossof $2.5 million in 2009. In 2008, this segment earned an operating profit of $5.9 million.
International Sales and Operations
We operate in worldwide markets and our international customer base continues to expand geographically dueto the development of various foreign nations’ economies and the relocation of U.S. businesses overseas. Ourinternational operations are designed to provide a cost-effective method of capturing the growing overseas demandfor our products.
In Asia, we have strategically located our facilities in Japan, Singapore, China, Korea, Taiwan and thePhilippines. Our European facilities are in Germany, the United Kingdom, Ireland and the Czech Republic. These
34

operations provide a combination of light manufacturing, finishing operations, local sales support and distributionservices. We also augment our sales and distribution efforts with an established network of independent distributorsand agents throughout the world. Approximately 10% of our workforce is based overseas.
The following chart summarizes total international sales by region for the last three years:
(Dollars in millions) 2010 2009 2008
Asia . . . . . . . . . . . . . . . . . . . . . . . . . . . . . . . . . . . . . . . . . . . . . . . . . . $216.3 $163.9 $197.5
Europe . . . . . . . . . . . . . . . . . . . . . . . . . . . . . . . . . . . . . . . . . . . . . . . . 127.5 73.5 115.3
Rest of world . . . . . . . . . . . . . . . . . . . . . . . . . . . . . . . . . . . . . . . . . . . 25.3 11.8 20.8
Total . . . . . . . . . . . . . . . . . . . . . . . . . . . . . . . . . . . . . . . . . . . . . . . . . . $369.1 $249.2 $333.6
Percent of total sales . . . . . . . . . . . . . . . . . . . . . . . . . . . . . . . . . . . . . . 28% 35% 37%
International sales include sales from international operations and direct exports from our U.S. operations. Theinternational sales in the above chart are included in the individual segment sales previously discussed.
Total international sales grew $119.9 million in 2010 over 2009 as demand improved from the majority of ourkey markets and from all regions. Sales to Asia increased 32% while European sales improved 73%.
The lower international sales in 2009 were primarily due to the global economic crisis and the resulting fall-offin demand, particularly from the consumer electronics market. Sales to Asia declined 17% in 2009 from the 2008levels while sales to Europe fell 36%.
Consumer electronics, automotive electronics, appliance (primarily in Europe) and telecommunicationsinfrastructure are the larger international markets for our products. Our market share is smaller in the overseasmarkets than it is domestically and, given the macro-economic growth potential for the international economies,including the continued transfer of U.S. business to overseas locations, the international markets, and Asia inparticular, may present greater long-term growth opportunities.
Sales from the European and certain Asian operations are denominated in the local currency. Exports from theU.S. and the balance of the sales from the Asian operations are typically denominated in U.S. dollars. Localcompetition generally limits our ability to adjust selling prices upwards to compensate for short-term unfavorableexchange rate movements.
We have a hedge program with the objective of minimizing the impact of fluctuating currency values on ourconsolidated operating profit. See “Critical Accounting Policies” below.
Legal Proceedings
One of our subsidiaries, Materion Brush Inc. (formerly Brush Wellman Inc.), is a defendant in proceedings invarious state and federal courts brought by plaintiffs alleging that they have contracted chronic beryllium disease orother lung conditions as a result of exposure to beryllium. Plaintiffs in beryllium cases seek recovery undernegligence and various other legal theories and seek compensatory and punitive damages, in many cases of anunspecified sum. Spouses, if any, claim loss of consortium.
The following table summarizes the associated activity with beryllium cases.
2010 2009 2008December 31,
Total cases pending . . . . . . . . . . . . . . . . . . . . . . . . . . . . . . . . . . . . . . . . . . 2 4 9
Total plaintiffs (including spouses) . . . . . . . . . . . . . . . . . . . . . . . . . . . . . . . 6 8 36
Number of claims (plaintiffs) filed during period ended . . . . . . . . . . . . . . . 1(1) 0(2) 1(6)
Number of claims (plaintiffs) settled during period ended . . . . . . . . . . . . . . 2(2) 3(16) 0(0)
Aggregate cost of settlements during period ended (dollars in thousands) . . $ 20 $ 850 $ —
Number of claims (plaintiffs) otherwise dismissed . . . . . . . . . . . . . . . . . . . 1(1) 2(14) 1(1)
Settlement payment and dismissal for a single case may not occur in the same period.
35

Additional beryllium claims may arise. Management believes that we have substantial defenses in these casesand intends to contest the suits vigorously. Employee cases, in which plaintiffs have a high burden of proof, havehistorically involved relatively small losses to us. Third-party plaintiffs (typically employees of customers orcontractors) face a lower burden of proof than do employees or former employees, but these cases are generallycovered by varying levels of insurance.
Although it is not possible to predict the outcome of the litigation pending against our subsidiaries and us, weprovide for costs related to these matters when a loss is probable and the amount is reasonably estimable. Litigationis subject to many uncertainties, and it is possible that some of these actions could be decided unfavorably inamounts exceeding our reserves. An unfavorable outcome or settlement of a pending beryllium case or additionaladverse media coverage could encourage the commencement of additional similar litigation. We are unable toestimate our potential exposure to unasserted claims.
Based upon currently known facts and assuming collectibility of insurance, we do not believe that resolution of thecurrent and future beryllium proceedings will have a material adverse effect on our financial condition or cash flow.However, our results of operations could be materially affected by unfavorable results in one or more of these cases.
The balances recorded on the Consolidated Balance Sheets associated with beryllium litigation were asfollows:
(Millions) 2010 2009December 31,
Asset (liability)
Reserve for litigation . . . . . . . . . . . . . . . . . . . . . . . . . . . . . . . . . . . . . . . . . . . . . . . . $(0.4) $(0.6)
Insurance recoverable . . . . . . . . . . . . . . . . . . . . . . . . . . . . . . . . . . . . . . . . . . . . . . . 0.1 0.3
The settlement payments of $20,000 made in 2010 were not reimbursed by insurance since our total applicablecosts were less than the annual deductible. The $0.9 million payment to settle three cases in 2009 was fully insured.
Regulatory Matters. Standards for exposure to beryllium are under review by the United StatesOccupational Safety and Health Administration (OSHA) and by other governmental and private standard-setting organizations. One result of these reviews will likely be more stringent worker safety standards. Someorganizations, such as the California Occupational Health and Safety Administration and the American Conferenceof Governmental Industrial Hygienists, have adopted standards that are more stringent than the current standards ofOSHA. The development, proposal or adoption of more stringent standards may affect the buying decisions by theusers of beryllium-containing products. If the standards are made more stringent and/or our customers or otherdownstream users decide to reduce their use of beryllium-containing products, our results of operations, liquidityand financial condition could be materially adversely affected. The impact of this potential adverse effect woulddepend on the nature and extent of the changes to the standards, the cost and ability to meet the new standards, theextent of any reduction in customer use and other factors. The magnitude of this potential adverse effect cannot beestimated.
FINANCIAL POSITION
Net cash provided from operations was $31.0 million in 2010 as net income and the effects of depreciation,deferred taxes and other items more than offset increases in working capital, primarily accounts receivable andinventory. The majority of the working capital build in 2010 occurred in the first half of the year as sales levelsramped up from the low levels in 2009 and resulted in cash being used in operations of $20.7 million. The growth inworking capital levels began to level off in the second half of 2010, which, coupled with a further increase inprofitability, resulted in net cash provided from operations of $51.7 million in the second half of the year.
In 2009, we generated cash flow from operations of $41.6 million as reductions in accounts receivable andinventory, the effects of depreciation and other items more than offset the net loss for the year. Cash provided fromoperations was a strong $76.9 million in 2008 due to the net income, effects of depreciation and a reduction inworking capital.
36

As previously noted, changes in the cost of precious and base metals are essentially passed on to customers.Therefore, while sudden movements in the price of metals can cause a temporary imbalance in our cash receipts andpayments in either direction, once prices stabilize our cash flow tends to stabilize as well.
Working Capital
Cash totaled $16.1 million as of year-end 2010 compared to $12.3 million at year-end 2009 as the cash flowfrom operations, the increase in debt and proceeds from the exercise of stock options exceeded the cost to acquireAcademy and the capital expenditure funding requirements in 2010. The cash balance declined $6.2 million during2009 as a portion of the cash on hand, increased debt and the cash flow from operations were used to fund theacquisition of Barr and capital expenditures during 2009.
Accounts receivable totaled $139.4 million as of December 31, 2010, an increase of $55.4 million, or 66%,over the accounts receivable balance of $84.0 million at December 31, 2009. The main driver for the increasedreceivable balance was the higher level of sales. Sales in the fourth quarter 2010 were $140.8 million, or 65%,higher than sales in the fourth quarter 2009. The days sales outstanding, a measure of how quickly receivables arecollected, slowed by less than one day and had a minor impact on the increase in receivables in 2010.
The expense for accounts written off to bad debts and changes in the allowance for doubtful accounts, whileslightly higher in 2010 than 2009, remained minor at $0.3 million for the year. We have procedures in place toclosely monitor our accounts receivable aging and to follow-up on past due accounts. We evaluate the creditposition of new customers in advance of the initial sale and we evaluate our existing customers’ credit positions onan ongoing basis. We will revise credit terms offered to our customers as conditions warrant in order to minimizeour exposures. Credit terms may vary by country based upon local customary practice and competition. Billings forprecious metals tend to have tighter payment terms than billings for other products. Advance billings are used fromtime to time to help reduce credit exposures and speed up the collection of cash.
The accounts receivable balance as of December 31, 2009 was $3.9 million, or 4%, lower than the receivablebalance of $87.9 million at December 31, 2008. The receivable balance declined despite sales in the fourth quarter2009 being higher than sales in the fourth quarter 2008 due to an improvement in the collection period.
Other receivables were a balance of $4.0 million as of December 31, 2010 compared to $11.1 million as ofDecember 31, 2009. The majority of the amounts due at both year ends were for reimbursement for equipmentpurchased under a government contract. These billings are typically paid by the government on a current basis. Theother receivable balance at year-end 2009 also included a $0.9 million advance of a legal settlement for which wewere reimbursed in full by our insurance provider in the first quarter 2010.
Inventories totaled $154.5 million as of year-end 2010 compared to $130.1 million as of year-end 2009. Whileinventories increased $24.4 million, or 19%, during 2010, largely due to the significantly higher level of business,inventory turns, a measure of how efficiently inventory is utilized, improved as of year-end 2010 as compared toyear-end 2009.
Inventories within Performance Alloys accounted for the majority of the increase in total inventories.Inventory pounds on hand were 33% higher at year-end 2010 than at year-end 2009 while pounds shippedincreased 61% year-over-year with feedstocks and work in process growing more than finished goods.
Despite the high level of sales growth in Advanced Material Technologies in 2010 over 2009, inventories onlyincreased approximately 8% as a large portion of this segment’s metal requirements are maintained on a consignedbasis. The acquisition of Academy added only $0.8 million to the year-end 2010 inventory balance.
Technical Materials’ inventory increased approximately 32% in order to support the increased business levelsin 2010. Inventories within Beryllium and Composites also increased to support the higher sales volumes with themajority of this increase occurring in the second half of 2010 due to the timing of purchases of input materials.
Inventories declined $26.6 million, or 17%, in 2009. Inventory turns improved as of year-end 2009 ascompared to year-end 2008. This improvement occurred primarily in the second half of the year as inventorypositions were held fairly constant while sales increased. The majority of the inventory reduction in 2009 waswithin the Performance Alloys segment as inventory was adjusted to the lower business levels. Their total pounds ininventory were down 24% from 2008 year end, with the finished goods inventories being reduced further than rawmaterials and work-in-process due in part to mild changes in distribution channels. Inventories within Technical
37

Materials declined over the course of 2009, but started to climb in the fourth quarter in response to the improvedorder entry at that time and their 2009 year end inventory was down approximately 10% from year-end 2008.
Inventories as of year-end 2009 within Advanced Material Technologies were essentially unchanged from theprior year end as various reductions from the existing facilities were offset by the inventory acquired with Barr.Beryllium and Composites’ inventory was also relatively unchanged in 2009.
Raw material prices increased dramatically in 2010. The impact of changing prices on our inventory value isminimized by the use of the last-in, first-out costing method, which results in the current cost being charged to theincome statement and the older costs being used to value the inventory on hand. See “Critical Accounting Policies”below. In addition, a portion of our metal requirements are maintained under off-balance sheet consignmentarrangements. The metal is not purchased out of consignment until it is being shipped to the customer.
Intangible assets of $36.8 million as of year-end 2010 were $2.2 million lower than the $39.0 million balanceas of year-end 2009. Intangible assets increased $8.0 million during 2009. We acquired intangible assets totaling$4.7 million during 2010, including $3.2 million acquired with Academy, and $12.5 million in 2009, largely due tothe purchase of Barr. Amortization expense was $6.9 million in 2010 and $4.5 million in 2009. See Note E to theConsolidated Financial Statements.
Accrued salaries and wages were $34.0 million at the end of 2010 compared to $16.3 million at the end of2009. The 2009 balance was $6.3 million lower than the balance as of year-end 2008. The differences in thebalances between years were due to changes in the incentive compensation accruals, manpower levels, including theimpact of the two acquisitions, and other related factors.
Other Long-term Liabilities
Other long-term liabilities were $17.9 million as of year-end 2010 versus $9.6 million as of year-end 2009. Thepredominate cause for this increase was the recording of the long-term portion of a 160-month, $10.2 million capitallease for the building associated with the new beryllium facility being constructed at the Elmore plant site. Thisincrease was partially offset by a $0.8 million reduction in the estimated fair value of the earn-out liability for thepotential payments to be made to the sellers of Barr.
Other long-term liabilities increased $1.7 million in 2009, largely due to liabilities totaling $2.8 millionassumed with the purchase of Barr, including the earn-out, and other minor changes net of a $1.3 million decline inthe legal reserve that resulted from a settlement and other changes to the outstanding cases.
Retirement and Post-employment Benefits
The long-term retirement and post-employment benefit obligation of $82.5 million at December 31, 2010 wasrelatively unchanged from the balance of $82.4 million at December 31, 2009.
Included within these balances is the recorded liability for the domestic defined benefit pension plan of$44.1 million as of year-end 2010 and $44.2 million as of year-end 2009. This plan, which covers the majority of ourdomestic employees, had a projected benefit obligation of $171.2 million at year-end 2010 and $149.9 million as ofyear-end 2009. The main causes for the increase in the obligation were the current year expense and actuarial lossesoffset in other comprehensive income (OCI), a component of shareholders’ equity. These actuarial losses wereprimarily due to a reduction in the discount rate as of December 31, 2010. The market value of the plan assets was$127.1 million at year-end 2010, an increase of $21.4 million for the year as a result of investment earnings of$14.9 million and contributions of $13.5 million less benefit payments and expenses of $7.0 million.
A portion of our domestic retirees and current employees are eligible to participate in a retiree medical benefitplan. The liability for this unfunded plan was $32.4 million as of December 31, 2010 and $30.9 million as ofDecember 31, 2009. The plan expense was $2.0 million in 2010 and $2.2 million in 2009.
Our subsidiary in Germany has an unfunded retirement plan for its employees while our subsidiary in Englandhas a funded retirement plan.
See Note I to the Consolidated Financial Statements for additional details on our retirement obligations.
38

Depreciation and Amortization
Depreciation, amortization and depletion was $35.4 million in 2010, $31.9 million in 2009 and $33.8 millionin 2008. The majority of the increase in 2010 over 2009 was due to the acquisitions of Barr and Academy and theadditional depreciation and amortization on the assets acquired. The decline in 2009 from 2008 was due to reducedmine amortization at our Utah operations.
Capital Expenditures
A summary of capital expenditures over the 2008 to 2010 timeframe is as follows:
(Millions) 2010 2009 2008
Capital expenditures . . . . . . . . . . . . . . . . . . . . . . . . . . . . . . . . . . . . . . . . . $42.4 $44.2 $35.5
Mine development . . . . . . . . . . . . . . . . . . . . . . . . . . . . . . . . . . . . . . . . . . 11.3 0.8 0.4
Subtotal . . . . . . . . . . . . . . . . . . . . . . . . . . . . . . . . . . . . . . . . . . . . . . . . . . 53.7 45.0 35.9
Reimbursement for spending under government contract . . . . . . . . . . . . . . 21.9 28.2 8.0
Net spending . . . . . . . . . . . . . . . . . . . . . . . . . . . . . . . . . . . . . . . . . . . . . . $31.8 $16.8 $27.9
We have a contract with the U.S. Department of Defense (DoD) for the design and development of a newfacility for the production of primary beryllium. The total cost of the project is estimated to be approximately$93.6 million; we will contribute land, buildings, research and development, technology and ongoing operationsvalued at approximately $23.2 million to the project. The DoD will reimburse us for the balance of the project cost.Reimbursements from the DoD are recorded as unearned income on the Consolidated Balance Sheets. The newfacility is being constructed on our Elmore plant site. Construction of the building was completed in 2010 while theequipment was nearing completion by year end. We anticipate that the equipment will be placed in service in thefirst half of 2011. The $42.4 million of capital expenditures in 2010 included $28.0 million of spending on thisproject. Since 2000, all of our metallic beryllium requirements have been supplied from materials purchased fromthe National Defense Stockpile and international vendors. Successful completion of this project will allow for thecreation of the only domestic facility capable of producing primary beryllium.
Advanced Material Technologies’ capital spending totaled $5.2 million in 2010, a slight increase overspending of $4.5 million in 2009. Spending by this unit totaled $7.9 million in 2008. Spending in 2010 included aclean room and other equipment upgrades in Buffalo, new equipment at both Barr and Academy and other smallprojects throughout the organization.
Capital spending by Performance Alloys was $17.1 million in 2010 versus $3.8 million in 2009 and$9.1 million in 2008. These totals include mine development costs of $11.3 million in 2010, $0.8 million in2009 and $0.4 million in 2008. The new pit was completed in 2010 and we began extracting ore from this pit in thefourth quarter 2010. The majority of the segment’s remaining capital spending in 2010 was on discrete pieces ofequipment used in the manufacture of strip and bulk products as well as other infra-structure projects at Elmore.Spending in 2009 was reduced from the 2008 level due to the large operating loss in 2009.
In addition to the new beryllium plant, capital spending within the Beryllium and Composites segmentincluded spending for a new milling center and inspection unit in 2010.
Capital projects within Technical Materials in 2010 included a new clad brushing machine, a cleaning line andupgrades to various furnaces and other equipment. Spending within this segment was limited to high-priority itemsin 2009 due to the decline in profitability.
We also continued work on software upgrades and implementations at various facilities throughout 2010.
Capacity expansion projects, primarily the new beryllium facility, accounted for approximately 55% of thecapital spending in 2010. Approximately 22% of the 2010 spending was for maintenance capital projects whilemine development costs were 21% of the total spending. New technology projects accounted for the balance of thecapital spending in 2010.
39

Acquisitions
In addition to the above capital expenditures, we acquired the following businesses in the 2008 to 2010 timeframe:
(Millions) Year CostAcquiredGoodwill
Academy Corporation . . . . . . . . . . . . . . . . . . . . . . . . . . . . . . . . . . . . . . 2010 $21.0 $ 5.4
Barr Associates, Inc. . . . . . . . . . . . . . . . . . . . . . . . . . . . . . . . . . . . . . . . 2009 55.2 31.7
Techni-Met, Inc. . . . . . . . . . . . . . . . . . . . . . . . . . . . . . . . . . . . . . . . . . . 2008 86.5 13.9
The Academy acquisition cost is shown net of $1.7 million we received back from the sellers in 2010subsequent to the purchase as a result of the resolution of valuation adjustments in accordance with the purchaseagreement. The Techni-Met acquisition cost is shown net of $1.4 million we received back from escrow in the firstquarter 2009 as the final purchase price adjustment under the terms of that agreement. Each of these threeacquisitions was financed with a combination of cash on hand and borrowings under the revolving credit agreement.The value of the assigned goodwill from each transaction was determined with the assistance of independentvaluation experts. See Note B to the Consolidated Financial Statements.
Debt
Total outstanding debt of $86.1 million at December 31, 2010 was an increase of $21.6 million over the$64.5 million outstanding as of December 31, 2009. The majority of this increase occurred in the first quarter 2010as a result of funding a portion of the acquisition of Academy and an increase in working capital. Short-term debt,which included U.S. dollar, metal and foreign currency denominated borrowings, totaled $47.8 million while long-term debt totaled $38.3 million as of year-end 2010.
Total debt increased $22.7 million during 2009. After declining $2.8 million over the first three quarters of2009 as a result of the cash flow from operations, debt increased $25.5 million in the fourth quarter 2009 in order topartially fund the acquisition of Barr.
We have a $240.0 million revolving credit agreement that matures in the fourth quarter 2012. It is a committedfacility and is comprised of sub-facilities for revolving loans, swing line loans, letters of credit and foreign currencydenominated borrowings. The agreement is subject to a maximum availability calculation. We were in compliancewith all of our debt covenants as of December 31, 2010.
Shareholders’ Equity
Shareholders’ equity of $384.4 million as of year-end 2010 was $44.5 million higher than the balance of$339.9 million as of year-end 2009. Equity declined $7.2 million in 2009. Comprehensive income, which includesnet income (loss), changes in derivative fair values and the adjustment to the pension and other post-employmentbenefit liability that are charged directly to equity and the change in the cumulative translation adjustment, was$41.5 million in 2010. In 2009, we recorded a comprehensive loss of $11.2 million.
We received $2.6 million from the exercise of approximately 154,000 options in 2010 and $0.5 million fromthe exercise of approximately 32,000 options in 2009.
We repurchased approximately 150,000 shares at a cost of $3.5 million in 2010 under a share buyback programinitially authorized by our Board of Directors in 2008. We did not repurchase any shares under this plan in 2009.
Equity was also affected by stock-based compensation expense, the tax benefits on stock compensationrealization and other factors in both 2010 and 2009.
Off-balance Sheet Obligations
We maintain the majority of the precious metals we use in production on a consignment basis in order to reduceour exposure to metal price movements and to reduce our working capital investment. In 2010, we began consigninga portion of our copper requirements as well. See “Quantitative and Qualitative Disclosures about Market Risk”.The notional value of the off-balance sheet inventory was $211.8 million as of year-end 2010 compared to$98.7 million as of year-end 2009. This increase was caused by a combination of significantly higher metal pricesand higher quantities of metal on hand. The increased quantity was due to improved business conditions, the
40

acquisition of Academy and inclusion of their requirements under the consignment lines and the addition of copperunder the lines in 2010.
We were in compliance with all of the covenants contained in the consignment agreements as of December 31,2010.
Contractual Obligations
A summary of payments to be made under long-term debt agreements, operating leases and significant capitalleases, pension plan contributions and material purchase commitments by year is as follows:
(Millions) 2011 2012 2013 2014 2015 Thereafter Total
Long-term debt . . . . . . . . . . . . . . . $ — $ 30.0 $ — $ — $ — $ 8.3 $ 38.3Non-cancelable lease payments . . . 8.6 5.7 5.1 3.6 3.4 18.2 44.6Capital lease payments . . . . . . . . . 1.3 1.2 1.1 1.1 1.1 7.9 13.7Pension plan contribution . . . . . . . 8.8 — — — — — 8.8Purchase commitments . . . . . . . . . 2.5 — — — — — 2.5
Total . . . . . . . . . . . . . . . . . . . . . . $ 21.2 $ 36.9 $ 6.2 $ 4.7 $ 4.5 $ 34.4 $ 107.9
The long-term debt repayment in 2012 represents the amounts borrowed under the revolving credit agreementas of year-end 2010. This agreement matures in 2012. We anticipate that we will renegotiate a new agreement priorto the maturation date as we have done with previous agreements; however, we cannot guarantee that we will be ableto enter into a replacement facility with similar terms as the existing facility. Outstanding borrowings under therevolving credit agreement classified as short-term debt totaled $11.1 million as of December 31, 2010. See Note Fto the Consolidated Financial Statements for additional debt information.
The non-cancelable lease payments represent payments under operating leases with initial lease terms inexcess of one year as of December 31, 2010. The capital lease payments include the building for the new berylliumfacility at the Elmore site and other material capital leases. See Note G to the Consolidated Financial Statements forfurther leasing details.
The pension plan contribution of $8.8 million in the above table represents our best estimate of the required2011 contribution to the domestic defined benefit plan as of early in 2011. Contributions to the plan are designed tocomply with ERISA guidelines, which change from time to time, and are based upon the plan’s funded ratio, whichis affected by actuarial assumptions, investment performance, benefit payouts, plan expenses, amendments andother factors. Therefore, it is not practical to estimate contributions to the plan beyond one year.
The purchase commitments of $2.5 million are for capital equipment to be acquired in 2011 based on ordersplaced as of December 31, 2010.
Liquidity
We believe that cash flow from operations plus the available borrowing capacity and the current cash balanceare adequate to support operating requirements, capital expenditures, projected pension plan contributions,environmental remediation projects and strategic acquisitions.
The cumulative cash flow provided from operations totaled $149.5 million in 2008 through 2010, while capitalexpenditures, net of amounts reimbursed by the government, totaled $76.5 million.
A summary of key data relative to our liquidity, including the outstanding debt, cash balances and availableborrowing capacity, as of the end of each of the last three years is as follows:
(Millions) 2010 2009 2008December 31,
Total outstanding debt . . . . . . . . . . . . . . . . . . . . . . . . . . . . . . . . . . . . . . $ 86.1 $64.5 $ 41.8
Cash. . . . . . . . . . . . . . . . . . . . . . . . . . . . . . . . . . . . . . . . . . . . . . . . . . . 16.1 12.3 18.5
Debt net of cash . . . . . . . . . . . . . . . . . . . . . . . . . . . . . . . . . . . . . . . . . . 70.0 52.2 23.3Available borrowing capacity . . . . . . . . . . . . . . . . . . . . . . . . . . . . . . . . 173.0 46.3 218.2
41

Debt net of cash is a non-GAAP measure. We are providing this information because we believe it is moreindicative of our overall financial position. It is also a measure our management uses to assess financing and otherdecisions.
As the chart indicates, debt net of cash increased $46.7 million from the end of 2008 to the end of 2010. Duringthese two years, we acquired Barr for $55.2 million and Academy for $21.0 million. We also made contributions tothe domestic defined benefit pension plan totaling $31.8 million in these two years. The increase in debt was lessthan these net outlays as a result of the cash flow from operations being in excess of capital spending.
The available borrowing capacity in the chart represents the amounts that could be borrowed under therevolving credit agreement and other secured lines existing as of December 31 of each year depicted. The applicabledebt covenants have been taken into account when determining the available borrowing capacity. One of thesecovenants restricts the borrowing capacity to a multiple of the twelve-month trailing earnings before interest,income taxes, depreciation and amortization and other adjustments. The improvement in our earnings in 2010 over2009 has allowed for the available borrowing capacity to increase, despite the additional debt outstanding.Conversely, the operating loss in 2009 reduced the available borrowing capacity as of year-end 2009 from the year-end 2008 level.
As of early in the first quarter 2011, we do not know of any future or pending changes that will cause us to be innon-compliance with any of our debt covenants in the near term.
The debt-to-total-debt-plus-equity ratio, a measure of balance sheet leverage, was 18% as of December 31,2010, 16% as of December 31, 2009 and 11% as of December 31, 2008. The increases in 2010 and 2009 werelargely due to the additional borrowings to finance portions of the Academy and Barr acquisitions. Managementbelieves that this level of leverage is within the long-term average for the Company.
There are no mandatory long-term debt repayments due in 2011.
The unused and available capacity under the consignment lines totaled approximately $24.8 million as of year-end 2010.
The working capital ratio, which compares current assets excluding cash to current liabilities excluding debt,was 3.4 to 1.0 as of year-end 2010 versus 3.2 to 1.0 as of year-end 2009.
Cash on hand does not affect the covenants or the borrowing capacity under our debt agreements. Portions ofthe cash balances may be invested in high quality, highly liquid investments with maturities of three months or less.
In July 2010, our Board of Directors re-authorized the Company to purchase up to 700,000 shares of ourcommon stock, which represents approximately 3% of our outstanding shares. The primary purpose of this programis to offset the dilution created through shares issued under stock-based compensation plans. Any stock repurchaseswill be made from time to time for cash in the open market or otherwise, including without limitation, in privatelynegotiated transactions and round lot or block transactions on the New York Stock Exchange, and may be madepursuant to accelerated share repurchases or Rule 10b5-1 plans. The repurchase program may be suspended ordiscontinued at any time.
ENVIRONMENTAL
We have an active environmental compliance program. We estimate the probable cost of identifiedenvironmental remediation projects and establish reserves accordingly. The environmental remediation reservebalance was $5.2 million at December 31, 2010 and $5.6 million at December 31, 2009. Payments against thereserve totaled $0.7 million in 2010 and $1.0 million in 2009. Spending in both years included clean-up costs for theCompany’s former headquarters building that previously was also used to house light manufacturing operations andR&D laboratories as well as other small remediation projects. See Note J to the Consolidated Financial Statements.
ORE RESERVES
We have proven and probable reserves of beryllium-bearing bertrandite ore in Juab County, Utah. Provenreserves are the measured quantities of ore commercially recoverable through the open-pit method. Probablereserves are the estimated quantities of ore known to exist but have been computed from inspection sites that arefarther apart than those used to measure proven reserves. Although the inspection sites are fewer, assurance levelsare sufficient to assume ore continuity. Ore dilution of approximately seven percent occurs during the mining
42

process. The ore is processed at our extraction facility in Utah. Approximately 87% of the beryllium in ore isrecovered in the extraction process. We own approximately 95% of the proven reserves, with the remaining reservesleased. We augment our proven reserves of bertrandite ore through the purchase of imported beryl ore. This ore,which is approximately 4% beryllium, is also processed at the Utah facility.
We use computer models to estimate ore reserves, which are subject to economic and physical evaluation. Therequirement that reserves pass an economic test causes open-pit mineable ore to be found in both proven andprobable geologic settings. Proven reserves have decreased slightly in each of the last four years while probablereserves have remained unchanged over the same time period. Based upon average production levels in recent years,proven reserves would last over one hundred years. Ore reserves classified as possible are excluded from thefollowing table.
2010 2009 2008 2007 2006
Proven bertrandite ore reserves at year end (thousandsof dry tons) . . . . . . . . . . . . . . . . . . . . . . . . . . . . . . . . 6,404 6,425 6,454 6,531 6,550
Grade % beryllium . . . . . . . . . . . . . . . . . . . . . . . . . . . . 0.266% 0.266% 0.266% 0.266% 0.267%
Probable bertrandite ore reserves at year end (thousandsof dry tons) . . . . . . . . . . . . . . . . . . . . . . . . . . . . . . . . 3,519 3,519 3,519 3,519 3,519
Grade % beryllium . . . . . . . . . . . . . . . . . . . . . . . . . . . . 0.232% 0.232% 0.232% 0.232% 0.232%
Bertrandite ore processed (thousands of dry tons,diluted) . . . . . . . . . . . . . . . . . . . . . . . . . . . . . . . . . . . 56 39 64 52 48
Grade % beryllium, diluted . . . . . . . . . . . . . . . . . . . . . . 0.336% 0.330% 0.321% 0.321% 0.352%
CRITICAL ACCOUNTING POLICIES
The preparation of financial statements requires the inherent use of estimates and management’s judgment inestablishing those estimates. The following are the most significant accounting policies we use that rely uponmanagement’s judgment.
Accrued Liabilities. We have various accruals on our balance sheet that are based in part upon management’sjudgment, including accruals for litigation, environmental remediation and workers’ compensation costs. Weestablish accrual balances at the best estimate determined by a review of the available facts and trends bymanagement and independent advisors and specialists as appropriate. Absent a best estimate, the accrual isestablished at the low end of the estimated reasonable range in accordance with accounting guidelines. Litigationand environmental accruals are established only for identified and/or asserted claims; future claims, therefore, couldgive rise to increases to the accruals. The accruals are adjusted as facts and circumstances change. The accruals mayalso be adjusted for changes in our strategies or regulatory requirements. Since these accruals are estimates, theultimate resolution may be greater or less than the established accrual balance for a variety of reasons, includingcourt decisions, additional discovery, inflation levels, cost control efforts and resolution of similar cases. Changes tothe accruals would then result in an additional charge or credit to income in the period when the change was made.See Note J to the Consolidated Financial Statements.
Legal claims may be subject to partial or complete insurance recovery. The accrued liability is recorded at thegross amount of the estimated cost and the insurance recoverable, if any, is recorded as an asset and is not nettedagainst the liability. The accrued legal liability includes the estimated indemnity cost only, if any, to resolve theclaim through a settlement or court verdict. The legal defense costs are not included in the accrual and are expensedin the period incurred, with the level of expense in a given year affected by the number and types of claims we areactively defending.
Non-employee claims for beryllium disease made prior to 2022 where any of the alleged exposure period isprior to year-end 2007 are covered by insurance. The insurance covers defense costs and indemnity payments(resulting from settlements or court verdicts), subject to a $1.0 million annual deductible. In 2010, defense andindemnity costs were less than the deductible.
Pensions. We have a defined benefit pension plan that covers a large portion of our current and formerdomestic employees. Carrying values of the associated pension assets and liabilities are determined on an actuarialbasis using numerous actuarial and financial assumptions. Differences between the assumptions and current period
43

actual results are typically deferred into the net pension asset or liability value and amortized against future incomeunder established guidelines. The deferral process generally reduces the volatility of the recognized net pensionasset or liability and current period income or expense. Unrealized gains or losses are recorded in OCI. The planliability for accounting purposes was $44.1 million as of December 31, 2010.
Management annually reviews key pension plan assumptions, including the expected return on plan assets, thediscount rate and the average wage rate increase, against actual results, trends, Company strategies, the current andprojected investment environment and industry standards and makes adjustments accordingly. The actuaries adjustcertain assumptions to reflect changes in demographics and other factors, including mortality rates and employeeturnover, annually as warranted. These adjustments may then lead to a higher or lower expense in future periods.
We establish the discount rate used to determine the present value of the projected and accumulated benefitobligation at the end of each year based upon the available market rates for high quality, fixed income investments.An increase to the discount rate would reduce the present value of the projected benefit obligation and futurepension expense and, conversely, a lower discount rate would raise the benefit obligation and future pensionexpense. We elected to use a discount rate of 5.50% as of December 31, 2010 and 5.875% as of December 31, 2009.
Our pension plan investment strategies are governed by a policy adopted by the Board of Directors.Management uses a group of outside investment analysts and brokerage firms to implement these strategies.The future return on pension assets is dependent upon the plan’s asset allocation, which changes from time to time,and the performance of the underlying investments. As a result of our review of various factors, we reduced theexpected rate of return on plan assets assumption to 8.00% as of December 31, 2010 from an assumption of 8.25%as of December 31, 2009. The plan investments generated a return in excess of the 8.25% in both 2010 and 2009after incurring a significant loss in 2008. However, the expected rate of return assumption relates to the long termand given changes in risk assumptions, projections of future returns by type of investment and other factors, webelieve that an 8.00% return over the long term is a reasonable assumption. Should the assets earn an average returnless than 8.00% over time, in all likelihood the future pension expense would increase. Investment earnings inexcess of 8.00% would tend to reduce the future expense.
The impact on the pension expense of a change in discount rate or expected rate of return assumption can varyfrom year to year depending upon the undiscounted liability level, the current discount rate, the asset balance, otherchanges to the plan and other factors. If the December 31, 2010 discount rate were reduced by 25 basis points(0.25%) and all other pension assumptions remained constant, then the 2011 projected pension expense wouldincrease by approximately $0.6 million. If the expected rate of return assumption was reduced by 25 basis pointsand all other pension assumptions remained constant, the 2011 projected pension expense would increase byapproximately $0.3 million.
Based upon current assumptions, guidelines and estimates, we project the required cash contribution to bemade to the plan will be $8.8 million in 2011. Additional contributions may be made during 2011 based upon anumber of factors, including the performance of the plan investments, the discount rate environment, theCompany’s operating performance, the availability of excess cash and borrowing rates under available credit lines.
The pension liability is recalculated at the measurement date (December 31 of each year) and any adjustmentsto this account and OCI will be recorded at that time accordingly. See Note I to the Consolidated FinancialStatements for additional details on our pension and other retirement plans.
LIFO Inventory. The prices of certain major raw materials that we use, including copper, nickel, gold, silverand other precious metals, fluctuate during a given year. Overall prices on average were higher in 2010 than in 2009.
Where possible, such changes in material costs are generally reflected in selling price adjustments, particularlywith precious metals and copper. The prices of labor and other factors of production, including supplies and utilities,generally increase with inflation. Portions of these cost increases may be offset by manufacturing improvementsand other efficiencies. From time to time, we will revise our billing practices to include an energy surcharge inattempts to recover a portion of our higher energy costs from our customers. However, market factors, alternativematerials and competitive pricing may limit our ability to offset all cost increases with higher prices.
We use the LIFO method for costing the majority of our domestic inventories. Under the LIFO method,inflationary cost increases are charged against the current cost of goods sold in order to more closely match the costwith the associated revenue. The carrying value of the inventory is based upon older costs and, as a result, the LIFO
44

cost of the inventory on the balance sheet is typically, but not always, lower than it would be under most alternativecosting methods. The LIFO cost may also be lower than the current replacement cost of the inventory. The LIFOinventory value tends to be less volatile during years of fluctuating costs than the inventory value would be usingother costing methods.
The LIFO impact on the income statement in a given year is dependent upon the inflation rate effect on rawmaterial purchases and manufacturing conversion costs, the level of purchases in a given year and changes in theinventory mix and quantities. Assuming no change in the quantity or mix of inventory from the December 31, 2010level, a 100 basis point change in the annual inflation rate would cause a $0.6 million change in the LIFO inventoryvalue.
Deferred Tax Assets. We record deferred tax assets and liabilities based upon the temporary differencebetween the financial reporting and tax bases of assets and liabilities. We review the expiration dates of the deferralsagainst projected income levels to determine if the deferral will or can be realized. If it is determined that it is morelikely than not that a deferral will not be realized, a valuation allowance would be established for that item. Certaindeferrals do not have an expiration date. We will also evaluate deferred tax assets for impairment due to cumulativeoperating losses and record a valuation allowance as warranted. A valuation allowance may increase tax expenseand reduce net income in the period it is recorded. If a valuation allowance is no longer required, it will reduce taxexpense and increase net income in the period that it is reversed.
We had valuation allowances of $2.5 million associated with state and foreign deferred tax assets as of year-end 2010 primarily for net operating loss carryforwards.
See Note Q to the Consolidated Financial Statements for additional deferred tax details.
Unearned revenue. Billings to customers in advance of the shipment of the goods are initially recorded asunearned revenue, which is a liability on the balance sheet. This liability is subsequently reversed when the revenueis recognized. Revenue and the related cost of sales and gross margin are only recognized for these transactionswhen the goods are shipped, title passes to the customer and all other revenue recognition criteria are satisfied. Therelated inventory also remains on our balance sheet until these revenue recognition criteria are met. Advancedbillings are typically made in association with products with long manufacturing times and/or products paid withfunds from a customer’s contract with the government. Billings in advance of the shipments allow us to collect cashearlier than billing at the time of the shipment and, therefore, the collected cash can be used to help finance theunderlying inventory. The unearned revenue balance was $2.4 million as of year-end 2010.
Long-term unearned income. Expenditures for capital equipment to be reimbursed under governmentcontracts are recorded in construction in process. Reimbursements for those expenditures are recorded in unearnedincome, a liability on the balance sheet. The total cost of the assets to be constructed includes costs reimbursed bythe government as well as costs borne by us. When the assets are placed in service and capitalized, this total cost willbe depreciated over the useful life of the assets. The unearned income liability will be reduced and credited toincome ratably with the annual depreciation expense. This benefit in effect will reduce the net expense charged tothe income statement to an amount equal to the depreciation on the portion of the cost of the assets borne by us.
Capital expenditures subject to reimbursement from the government under the life of the current DoD projectand the related unearned income balance totaled $57.2 million as of December 31, 2010. The project was close tocompletion as of year-end 2010 and we anticipate that the equipment will be placed in service in the first half of2011.
Derivatives. We may use derivative financial instruments to hedge our foreign currency, commodity andprecious metal price and interest rate exposures. We apply hedge accounting when an effective hedge relationshipcan be documented and maintained. If a cash flow hedge is deemed effective, changes in its fair value are recordedin OCI until the underlying hedged item matures. If a hedge does not qualify as effective, changes in its fair value arerecorded against income in the current period. If a derivative is deemed to be a hedge of the fair value of a balancesheet item, the change in the derivative’s value will be recorded in income and will offset the change in the fair valueof the hedged item to the extent that the hedge is effective.
We secure derivatives with the intention of hedging existing or forecasted transactions only and do not engagein speculative trading or holding derivatives for investment purposes. Our annual budget, quarterly forecasts andother analyses serve as the basis for determining forecasted transactions. The use of derivatives is governed by
45

policies established by the Board of Directors. These policies provide guidance on the allowable types of hedgecontracts, the allowable duration of the contracts and other related matters. Hedge contracts are secured andapproved by senior financial managers at our corporate office. The level of derivatives outstanding may be limitedby the availability of credit from financial institutions.
Our practice has been to secure hedge contracts denominated in the same manner as the underlying exposure;for example, a yen exposure will only be hedged with a yen contract and not with a surrogate currency. We alsosecure contracts through financial institutions that are already part of our bank group.
See Note H to the Consolidated Financial Statements and “Quantitative and Qualitative Disclosures AboutMarket Risk”.
OUTLOOK
After a record sales year in 2010, we entered 2011 with a very healthy backlog and a positive outlook for anumber of our markets. The performance characteristics of our materials make us the supplier of choice for a widerange of applications within the consumer electronics market. Our materials are used in an increasing number ofLED applications and we anticipate solid growth for these materials in 2011. Within the medical market, weanticipate that sales will increase to our existing customer base in 2011 while we continue to develop products andrelationships with other potential customers for long-term growth. We are positioned for growth in the industrialcomponents and commercial aerospace market. We believe that we can leverage the investments in Barr andAcademy to improve our sales to the key markets they serve. The solar energy market also remains a long-termgrowth opportunity for a number of our materials.
On the downside, portions of our traditional defense business may be softer in 2011 as compared to 2010 due tochanges in government spending patterns. A portion of our sales growth in 2010 was due to a downstream inventoryreplenishment, particularly in the consumer electronics market, that may not repeat in 2011. The market price forour key raw materials, including gold, silver and copper, was quite high entering 2011 and this higher cost may forcesome customers to turn to alternative lower cost (and lower performing) materials from other suppliers or defer theirpurchases from us for a period of time. We also remain cautious about the economy in general and the impact thatthe current high unemployment rate and government deficits may have on consumer spending levels and the abilityfor companies to expand.
As of early in the first quarter 2011, taking into account the above and assuming no change in metal prices, weare expecting that our sales will be higher in 2011 than in 2010.
The profitability from the projected sales growth, however, will be offset to a certain extent by higher costs in2011. These costs include:
• Our employee fringe benefit costs will be higher due to medical cost inflation and an increased expense forthe domestic defined benefit pension plan as a result of a lower discount rate and other factors;
• The start-up of the new beryllium facility will probably result in various one-time inefficiencies as theequipment is tested and brought on stream. Once fully operational, the facility will provide a stable source ofhigh-quality metallic beryllium as the current sources are not sufficient to satisfy our needs in the long term.However, the ongoing unit cost of the material produced by the facility will be higher than our purchase priceof beryllium in 2010; and
• We are undertaking various initiatives, including the corporate rebranding program, designed to improve ourefficiencies and profitability in the long term, but the related up-front costs may have a negative impact onour earnings in 2011. We will have additional legal, administrative and marketing costs associated withchanging the name of the Company and all of our subsidiaries and to effectively communicate the impact ofthe rebranding effort to our customers, vendors and shareholders in 2011.
We will continue our cost control efforts and implement strategies to improve operating efficiencies. The highraw material costs will keep us focused on improving inventory turns and utilization in order to minimize theinventory on hand, whether owned or consigned. Capital investments will continue to be closely managed and we donot anticipate a significant change in the spending level in 2011 from the 2010 level excluding spending on the newberyllium plant.
46

Item 7A. QUANTITATIVE AND QUALITATIVE DISCLOSURES ABOUT MARKET RISK
While economic conditions have improved in 2010 after the global economic crisis in late 2008 and 2009, weremain exposed to changes in economic conditions and the potential impact those changes may have on variousfacets of our business. We have a program in place to closely monitor the credit worthiness and financial conditionof our key providers of financial services, including our bank group and insurance carriers, as well as the creditworthiness of customers and vendors and have various contingency plans in place.
Our credit lines are with banks that remained solvent throughout the crisis. Our total borrowing capacity undersecured lines that cannot be terminated prior to maturity as long as we continue to meet our debt covenants was inexcess of current needs as of year-end 2010. We also have metal consignment lines with several institutions. Thecapacity under these lines has been expanded over the last two years due to our increased needs and the impact ofhigher metal prices. Our credit lines for foreign currency hedging purposes have remained in excess of our needs aswell.
The financial statement impact from the risk of one or more of the banks in our bank group becoming insolventcannot be estimated at the present time.
We are exposed to precious metal and commodity price, interest rate, foreign exchange rate and utility costdifferences. While the degree of exposure varies from year to year, our methods and policies designed to managethese exposures have remained fairly consistent. Generally, we attempt to minimize the effects of these exposuresthrough the use of natural hedges, which include pricing strategies, borrowings denominated in the same terms asthe exposed asset, off-balance sheet arrangements and other methods. Where we cannot use a natural hedge, we mayuse derivative financial instruments to minimize the effects of these exposures when practical and cost efficient. Theuse of derivatives is subject to policies approved by the Board of Directors with oversight provided by a group ofsenior financial managers at our corporate office.
We use gold and other precious metals in manufacturing various products. To reduce the exposure to marketprice changes, the majority of our precious metal requirements are maintained on a consigned inventory basis. Wepurchase the metal out of consignment from our suppliers when it is ready to ship to a customer as a finishedproduct. Our purchase price forms the basis for the price charged to the customer for the precious metal content and,therefore, the current cost is matched to the selling price and the price exposure is minimized. The use of preciousmetal consignment arrangements is governed by a policy approved by the Board of Directors.
We are charged a consignment fee by the financial institutions that own the precious metals. This fee ispartially a function of the market price of the metal. Because of market forces and competition, the fee can only becharged to customers on a case-by-case basis. To further limit price and financing rate exposures, under somecircumstances we will require customers to furnish their own metal for processing. Customers may also elect toprovide their own material for us to process as opposed to purchasing our material. Should the market price ofprecious metals that we have on consignment increase by 20% from the prices on December 31, 2010, the additionalpre-tax cost to us as a result of an increase in the consignment fee would be approximately $1.3 million on an annualbasis. This calculation assumes no changes in the quantity of inventory or the underlying fee and that none of theadditional fees are charged to customers.
The available capacity of our existing credit lines to consign precious metals is a function of the quantity andprice of the metals on hand. As prices increase, as they did in 2010, a given quantity of metal will use a largerproportion of the credit line. A significant prolonged increase in metal prices could result in our credit lines beingfully utilized, and, absent securing additional credit line capacity from a financial institution, could require us topurchase precious metals rather than consign them, require customers to supply their own metal and/or force us toturn down additional business opportunities. If we were in a significant precious metal ownership position, wemight elect to use derivative financial instruments to hedge the potential price exposure. The cost to finance thepurchased inventory may also be higher than the consignment fee. The financial statement impact of the risk fromrising metal prices impacting our credit availability cannot be estimated at the present time.
We also use copper in our production processes. When possible, fluctuations in the purchase price of copperare passed on to customers in the form of price adders or reductions. While over time our price exposure to copper isgenerally in balance, there can be a lag between the change in our cost and the pass-through to our customers,resulting in higher or lower margins in a given period.
47

Beginning in 2010, we consigned a portion of our copper inventory requirements. As with precious metals, theavailable capacity under the existing lines is a function of the quantity and price of metal on hand. Should the marketprice of copper increase by 20% from the price as of December 31, 2010, the additional pre-tax cost to us as a resultof an increase in the consignment fee would be approximately $0.2 million on an annual basis. This calculationassumes no changes in the quantity of inventory or the underlying fee and that none of the additional fees arecharged to customers.
In our manufacturing processes, we use ruthenium and other base and precious metals that are not widely usedby others or actively traded and, therefore, there is no established efficient market for derivative financialinstruments that could be used to effectively hedge the related price exposures. For certain applications, ourpricing practice with respect to these metals is to establish the selling price based upon our cost to purchase thematerial, limiting our price exposure. However, the inventory carrying value may be exposed to market fluctuations.The inventory value is maintained at the lower of cost or market and if the market value were to drop below thecarrying value, the inventory would have to be reduced accordingly and a charge taken against cost of sales. Thisrisk is mainly associated with long manufacturing lead time items and with sludges and scrap materials, whichgenerally have longer processing times to be refined into a usable form for further manufacturing and are typicallynot covered by specific sales orders from customers. As a result of market price fluctuations, we recorded lower ofcost or market charges totaling $0.4 million in 2010, $0.7 million in 2009 and $15.2 million in 2008 on portions ofour inventory. The charges were lower in 2010 and 2009 than in 2008 due to the market prices and a reduction in thelevel of ruthenium-containing inventories.
We are exposed to changes in interest rates on portions of our debt and cash balances. This interest rateexposure is managed by maintaining a combination of short-term and long-term debt and variable and fixed rateinstruments. We may also use interest rate swaps to fix the interest rate on variable rate obligations, as we deemappropriate. There were no interest rate derivatives outstanding as of December 31, 2010. Excess cash is typicallyinvested in high quality instruments that mature in ninety days or less. Investments are made in compliance withpolicies approved by the Board of Directors. Assuming no change in the amount or make-up of the outstanding debtas of December 31, 2010, a 200 basis point movement upwards in the interest rates would increase our annualinterest expense by $1.1 million.
Portions of our international operations sell products priced in foreign currencies, mainly the euro and yen,while the majority of these products’ costs are incurred in U.S. dollars. We are exposed to currency movements inthat if the U.S. dollar strengthens, the translated value of the foreign currency sale and the resulting margin on thatsale will be reduced. We typically cannot increase the price of our products for short-term exchange rate movementsbecause of local competition. To minimize this exposure, we may purchase foreign currency forward contracts,options and collars in compliance with Board approved policies. If the dollar strengthened, the decline in thetranslated value of our margins would be at least partially offset by a gain on the hedge contract. A decrease in thevalue of the dollar would result in larger margins but potentially a loss on the contract, depending upon the methodused to hedge the exposure.
The notional value of the outstanding currency contracts was $45.9 million as of December 31, 2010. If thedollar weakened 10% against the currencies we have hedged from the December 31, 2010 exchange rates, thereduced gain and/or increased loss on the outstanding contracts as of December 31, 2010 would reduce pre-taxprofits by approximately $4.5 million in 2011. This calculation does not take into account the increase in margins asa result of translating foreign currency sales at the more favorable exchange rates, any changes in margins frompotential volume fluctuations caused by currency movements or the translation effects on any other foreigncurrency denominated income statement or balance sheet item.
The fair value of the outstanding foreign currency contracts was a net liability of $1.5 million at December 31,2010, indicating that the average hedge rates were unfavorable compared to the actual year end market exchangerates.
The cost of natural gas and electricity can vary from year to year and from season to season. We attempt tominimize these fluctuations and the exposure to higher costs by utilizing fixed price agreements of set durations,when deemed appropriate, obtaining competitive bidding between regional energy suppliers and other methods.
48

Item 8. FINANCIAL STATEMENTS AND SUPPLEMENTARY DATA
Financial Statements Page
Management’s Report on Internal Control over Financial Reporting . . . . . . . . . . . . . . . . . . . . . . . . . . . . 50
Reports of Independent Registered Public Accounting Firm . . . . . . . . . . . . . . . . . . . . . . . . . . . . . . . . . . 51
Consolidated Statements of Income and Loss for the Years Ended December 31, 2010, 2009 and 2008 . . 53
Consolidated Statements of Cash Flows for the Years Ended December 31, 2010, 2009 and 2008 . . . . . . 54
Consolidated Balance Sheets as of December 31, 2010 and 2009 . . . . . . . . . . . . . . . . . . . . . . . . . . . . . . 55
Consolidated Statements of Shareholders’ Equity for the Years Ended December 31, 2010, 2009 and2008. . . . . . . . . . . . . . . . . . . . . . . . . . . . . . . . . . . . . . . . . . . . . . . . . . . . . . . . . . . . . . . . . . . . . . . . . 56
Notes to Consolidated Financial Statements . . . . . . . . . . . . . . . . . . . . . . . . . . . . . . . . . . . . . . . . . . . . . . 57
49

Management’s Report on Internal Control over Financial Reporting
The management of Materion Corporation and subsidiaries are responsible for establishing and maintainingadequate internal controls over financial reporting, as such term is defined in Rules 13a-15(f) and 15d-15(f) underthe Securities Exchange Act of 1934, as amended. Materion Corporation and subsidiaries’ internal control systemwas designed to provide reasonable assurance to the Company’s management and Board of Directors regarding thepreparation and fair presentation of published financial statements. All internal control systems, no matter how welldesigned, have inherent limitations. Therefore, even those systems determined to be effective can provide onlyreasonable assurance with respect to financial statement preparation and presentation.
Materion Corporation and subsidiaries’ management assessed the effectiveness of the Company’s internalcontrol over financial reporting as of December 31, 2010. In making this assessment, it used the framework set forthby the Committee of Sponsoring Organizations of the Treadway Commission (the COSO criteria) in InternalControl — Integrated Framework. Based on our assessment we believe that, as of December 31, 2010, theCompany’s internal control over financial reporting is effective.
The effectiveness of our internal control over financial reporting as of December 31, 2010 has been audited byErnst & Young LLP, an independent registered public accounting firm, as stated in their report.
/s/ RICHARD J. HIPPLE
Richard J. HippleChairman, President and Chief Executive Officer
/s/ JOHN D. GRAMPA
John D. GrampaSenior Vice President Finance andChief Financial Officer
50

Report of Independent Registered Public Accounting Firm
The Board of Directors and Shareholders of Materion Corporation
We have audited Materion Corporation (formerly known as Brush Engineered Materials Inc.) and subsidiaries’internal control over financial reporting as of December 31, 2010, based on criteria established in InternalControl — Integrated Framework issued by the Committee of Sponsoring Organizations of the TreadwayCommission (the COSO criteria). Materion Corporation (formerly known as Brush Engineered Materials Inc.)and subsidiaries’ management is responsible for maintaining effective internal control over financial reporting, andfor its assessment of the effectiveness of internal control over financial reporting included in the Management’sReport on Internal Control over Financial Reporting. Our responsibility is to express an opinion on the company’sinternal control over financial reporting based on our audit.
We conducted our audit in accordance with the standards of the Public Company Accounting Oversight Board(United States). Those standards require that we plan and perform the audit to obtain reasonable assurance aboutwhether effective internal control over financial reporting was maintained in all material respects. Our auditincluded obtaining an understanding of internal control over financial reporting, assessing the risk that a materialweakness exists, testing and evaluating the design and operating effectiveness of internal control based on theassessed risk, and performing such other procedures as we considered necessary in the circumstances. We believethat our audit provides a reasonable basis for our opinion.
A company’s internal control over financial reporting is a process designed to provide reasonable assuranceregarding the reliability of financial reporting and the preparation of financial statements for external purposes inaccordance with generally accepted accounting principles. A company’s internal control over financial reportingincludes those policies and procedures that (1) pertain to the maintenance of records that, in reasonable detail,accurately and fairly reflect the transactions and dispositions of the assets of the company; (2) provide reasonableassurance that transactions are recorded as necessary to permit preparation of financial statements in accordancewith generally accepted accounting principles, and that receipts and expenditures of the company are being madeonly in accordance with authorizations of management and directors of the company; and (3) provide reasonableassurance regarding prevention or timely detection of unauthorized acquisition, use or disposition of the company’sassets that could have a material effect on the financial statements.
Because of its inherent limitations, internal control over financial reporting may not prevent or detectmisstatements. Also, projections of any evaluation of effectiveness to future periods are subject to the risk thatcontrols may become inadequate because of changes in conditions, or that the degree of compliance with thepolicies or procedures may deteriorate.
In our opinion, Materion Corporation (formerly known as Brush Engineered Materials Inc.) and subsidiariesmaintained, in all material respects, effective internal control over financial reporting as of December 31, 2010,based on the COSO criteria.
We also have audited, in accordance with the standards of the Public Company Accounting Oversight Board(United States), the consolidated balance sheets as of December 31, 2010 and 2009, and the related consolidatedstatements of income and loss, shareholders’ equity, and cash flows for each of the three years in the period endedDecember 31, 2010 of Materion Corporation (formerly known as Brush Engineered Materials Inc.) and subsidiariesand our report dated March 9, 2011 expressed an unqualified opinion thereon.
/s/ ERNST & YOUNG LLP
Cleveland, OhioMarch 9, 2011
51

Report of Independent Registered Public Accounting Firm
The Board of Directors and Shareholders of Materion Corporation
We have audited the accompanying consolidated balance sheets of Materion Corporation (formerly known asBrush Engineered Materials Inc.) and subsidiaries as of December 31, 2010 and 2009, and the related consolidatedstatements of income and loss, shareholders’ equity, and cash flows for each of the three years in the period endedDecember 31, 2010. Our audits also included the financial statement schedule listed in the Index at Item 15(a).These financial statements and schedule are the responsibility of the Company’s management. Our responsibility isto express an opinion on these financial statements and schedule based on our audits.
We conducted our audits in accordance with the standards of the Public Company Accounting Oversight Board(United States). Those standards require that we plan and perform the audit to obtain reasonable assurance aboutwhether the financial statements are free of material misstatement. An audit includes examining, on a test basis,evidence supporting the amounts and disclosures in the financial statements. An audit also includes assessing theaccounting principles used and significant estimates made by management, as well as evaluating the overallfinancial statement presentation. We believe that our audits provide a reasonable basis for our opinion.
In our opinion, the financial statements referred to above present fairly, in all material respects, theconsolidated financial position of Materion Corporation (formerly known as Brush Engineered Materials Inc.)and subsidiaries at December 31, 2010 and 2009, and the consolidated results of their operations and their cashflows for each of the three years in the period ended December 31, 2010, in conformity with U.S. generally acceptedaccounting principles. Also, in our opinion, the related financial statement schedule, when considered in relation tothe basic financial statements taken as a whole, presents fairly in all material respects the information set forththerein.
We also have audited, in accordance with the standards of the Public Company Accounting Oversight Board(United States), Materion Corporation (formerly known as Brush Engineered Materials Inc.) and subsidiaries’internal control over financial reporting as of December 31, 2010, based on criteria established in InternalControl — Integrated Framework issued by the Committee of Sponsoring Organizations of the TreadwayCommission and our report dated March 9, 2011 expressed an unqualified opinion thereon.
/s/ ERNST & YOUNG LLP
Cleveland, OhioMarch 9, 2011
52

Materion Corporation and SubsidiariesYears Ended December 31, 2010, 2009 and 2008
Consolidated Statements of Income and Loss
(Thousands except per share amounts) 2010 2009 2008
Net sales . . . . . . . . . . . . . . . . . . . . . . . . . . . . . . . . . . . . . . . . . . . . . . . $1,302,314 $715,186 $909,711
Cost of sales . . . . . . . . . . . . . . . . . . . . . . . . . . . . . . . . . . . . . . . . . . 1,079,666 623,764 757,836
Gross margin . . . . . . . . . . . . . . . . . . . . . . . . . . . . . . . . . . . . . . . . . . . . 222,648 91,422 151,875
Selling, general and administrative expense . . . . . . . . . . . . . . . . . . . . 126,477 89,762 104,523
Research and development expense . . . . . . . . . . . . . . . . . . . . . . . . . . 7,113 6,771 6,522
Litigation settlement gain . . . . . . . . . . . . . . . . . . . . . . . . . . . . . . . . . — — (1,059)
Derivative ineffectiveness . . . . . . . . . . . . . . . . . . . . . . . . . . . . . . . . . 598 4,892 171
Other — net . . . . . . . . . . . . . . . . . . . . . . . . . . . . . . . . . . . . . . . . . . . 14,827 9,482 13,647
Operating profit (loss) . . . . . . . . . . . . . . . . . . . . . . . . . . . . . . . . . . . . . 73,633 (19,485) 28,071
Interest expense — net . . . . . . . . . . . . . . . . . . . . . . . . . . . . . . . . . . . 2,665 1,299 1,995
Income (loss) before income taxes . . . . . . . . . . . . . . . . . . . . . . . . 70,968 (20,784) 26,076
Income tax expense (benefit) . . . . . . . . . . . . . . . . . . . . . . . . . . . . . . . . 24,541 (8,429) 7,719
Net income (loss) . . . . . . . . . . . . . . . . . . . . . . . . . . . . . . . . . . . . . $ 46,427 $ (12,355) $ 18,357
Basic earnings per share:Net income (loss) per share of common stock . . . . . . . . . . . . . . . . . . . . $ 2.29 $ (0.61) $ 0.90
Diluted earnings per share:Net income (loss) per share of common stock . . . . . . . . . . . . . . . . . . . . $ 2.25 $ (0.61) $ 0.89
Weighted–average number of shares of common stock outstanding
Basic . . . . . . . . . . . . . . . . . . . . . . . . . . . . . . . . . . . . . . . . . . . . . . . . 20,282 20,191 20,335
Diluted . . . . . . . . . . . . . . . . . . . . . . . . . . . . . . . . . . . . . . . . . . . . . . 20,590 20,191 20,543
See Notes to Consolidated Financial Statements.
53

Materion Corporation and SubsidiariesYears Ended December 31, 2010, 2009 and 2008
Consolidated Statements of Cash Flows
(Thousands) 2010 2009 2008
Cash flows from operating activities:Net income (loss) . . . . . . . . . . . . . . . . . . . . . . . . . . . . . . . . . . . . . . . . . $ 46,427 $(12,355) $ 18,357Adjustments to reconcile net income (loss) to net cash provided from
operating activities:Depreciation, depletion and amortization . . . . . . . . . . . . . . . . . . . . . . 35,394 31,939 33,826Amortization of deferred financing costs in interest expense . . . . . . . . 538 430 378Stock-based compensation expense . . . . . . . . . . . . . . . . . . . . . . . . . . 4,100 3,484 2,552Derivative financial instruments ineffectiveness . . . . . . . . . . . . . . . . . 598 4,892 171Deferred tax expense (benefit) . . . . . . . . . . . . . . . . . . . . . . . . . . . . . . 13,623 (10,065) 6,156
Changes in assets and liabilities net of acquired assets and liabilities:Decrease (increase) in accounts receivable . . . . . . . . . . . . . . . . . . . . . (50,386) 10,045 16,513Decrease (increase) in other receivables . . . . . . . . . . . . . . . . . . . . . . . 7,084 (7,678) 7,885Decrease (increase) in inventory . . . . . . . . . . . . . . . . . . . . . . . . . . . . (23,112) 34,162 12,897Decrease (increase) in prepaid and other current assets . . . . . . . . . . . . (3,566) (4,606) 4,713Increase (decrease) in accounts payable and accrued expenses . . . . . . 7,002 (754) (11,825)Increase (decrease) in unearned revenue . . . . . . . . . . . . . . . . . . . . . . . 1,938 319 (2,456)Increase (decrease) in interest and taxes payable . . . . . . . . . . . . . . . . 2,048 5,456 (14,074)Increase (decrease) in long-term liabilities . . . . . . . . . . . . . . . . . . . . . (8,736) (16,422) 1,960Other — net . . . . . . . . . . . . . . . . . . . . . . . . . . . . . . . . . . . . . . . . . . . (1,911) 2,796 (176)
Net cash provided from operating activities . . . . . . . . . . . . . . . . 31,041 41,643 76,877Cash flows from investing activities:
Payments for purchase of property, plant and equipment . . . . . . . . . . . . (42,314) (44,173) (35,515)Payments for mine development . . . . . . . . . . . . . . . . . . . . . . . . . . . . . . (11,348) (808) (421)Reimbursement for capital spending under government contract . . . . . . . 21,944 28,200 8,017Payments for purchase of business less cash received . . . . . . . . . . . . . . . (20,605) (54,107) (86,052)Proceeds from transfer of acquired inventory to consignment line . . . . . . 5,667 — 22,915Proceeds from sale of property, plant and equipment . . . . . . . . . . . . . . . 77 3 —Other investments — net . . . . . . . . . . . . . . . . . . . . . . . . . . . . . . . . . . . . 60 75 66
Net cash used in investing activities . . . . . . . . . . . . . . . . . . . . . . . (46,519) (70,810) (90,990)Cash flows from financing activities:
Proceeds from issuance (repayment) of short-term debt . . . . . . . . . . . . . (8,406) 25,778 4,870Proceeds from issuance of long-term debt . . . . . . . . . . . . . . . . . . . . . . . 80,000 25,700 46,200Repayment of long-term debt . . . . . . . . . . . . . . . . . . . . . . . . . . . . . . . . (50,000) (28,600) (45,600)Principal payments under capital lease obligations . . . . . . . . . . . . . . . . . (779) (185) (65)Deferred financing costs . . . . . . . . . . . . . . . . . . . . . . . . . . . . . . . . . . . . (220) (126) (352)Repurchase of common stock . . . . . . . . . . . . . . . . . . . . . . . . . . . . . . . . (3,527) — (4,999)Issuance of common stock under stock option plans . . . . . . . . . . . . . . . . 2,631 497 243Tax benefit from stock compensation realization . . . . . . . . . . . . . . . . . . 121 53 455
Net cash provided from financing activities . . . . . . . . . . . . . . . . . 19,820 23,117 752Effects of exchange rate changes on cash and cash equivalents . . . . . . . . . (491) (243) 177
Net change in cash and cash equivalents . . . . . . . . . . . . . . . . . . . 3,851 (6,293) (13,184)Cash and cash equivalents at beginning of year . . . . . . . . . . . . . 12,253 18,546 31,730
Cash and cash equivalents at end of year . . . . . . . . . . . . . . . . . . $ 16,104 $ 12,253 $ 18,546
See Notes to Consolidated Financial Statements.
54

Materion Corporation and SubsidiariesDecember 31, 2010 and 2009
Consolidated Balance Sheets
(Thousands) 2010 2009
AssetsCurrent assets
Cash and cash equivalents . . . . . . . . . . . . . . . . . . . . . . . . . . . . . . . . . . . . . . . $ 16,104 $ 12,253Accounts receivable (net of allowance of $1,452 for 2010 and $1,397 for
2009) . . . . . . . . . . . . . . . . . . . . . . . . . . . . . . . . . . . . . . . . . . . . . . . . . . . . . 139,374 83,997Other receivables . . . . . . . . . . . . . . . . . . . . . . . . . . . . . . . . . . . . . . . . . . . . . . 3,972 11,056Inventories . . . . . . . . . . . . . . . . . . . . . . . . . . . . . . . . . . . . . . . . . . . . . . . . . . . 154,467 130,098Prepaid expenses . . . . . . . . . . . . . . . . . . . . . . . . . . . . . . . . . . . . . . . . . . . . . . 31,743 28,020Deferred income taxes . . . . . . . . . . . . . . . . . . . . . . . . . . . . . . . . . . . . . . . . . . 10,065 14,752
Total current assets . . . . . . . . . . . . . . . . . . . . . . . . . . . . . . . . . . . . . . . . . . . 355,725 280,176Related-party notes receivable . . . . . . . . . . . . . . . . . . . . . . . . . . . . . . . . . . . . . . 90 90Long-term deferred income taxes . . . . . . . . . . . . . . . . . . . . . . . . . . . . . . . . . . . . 2,042 4,873Property, plant and equipment . . . . . . . . . . . . . . . . . . . . . . . . . . . . . . . . . . . . . . 719,953 665,361Less allowances for depreciation, amortization and depletion . . . . . . . . . . . . . . . (454,085) (437,595)
Property, plant and equipment – net . . . . . . . . . . . . . . . . . . . . . . . . . . . . . . . . 265,868 227,766Intangible assets . . . . . . . . . . . . . . . . . . . . . . . . . . . . . . . . . . . . . . . . . . . . . . . . 36,849 39,007Other assets . . . . . . . . . . . . . . . . . . . . . . . . . . . . . . . . . . . . . . . . . . . . . . . . . . . . 1,900 3,007Goodwill . . . . . . . . . . . . . . . . . . . . . . . . . . . . . . . . . . . . . . . . . . . . . . . . . . . . . . 72,936 67,034
Total Assets . . . . . . . . . . . . . . . . . . . . . . . . . . . . . . . . . . . . . . . . . . . . . . $ 735,410 $ 621,953
Liabilities and Shareholders’ EquityCurrent liabilities
Short-term debt . . . . . . . . . . . . . . . . . . . . . . . . . . . . . . . . . . . . . . . . . . . . . . . $ 47,835 $ 56,148Accounts payable . . . . . . . . . . . . . . . . . . . . . . . . . . . . . . . . . . . . . . . . . . . . . . 33,375 36,573Salaries and wages . . . . . . . . . . . . . . . . . . . . . . . . . . . . . . . . . . . . . . . . . . . . . 34,035 16,292Taxes other than income taxes . . . . . . . . . . . . . . . . . . . . . . . . . . . . . . . . . . . . 905 763Other liabilities and accrued items . . . . . . . . . . . . . . . . . . . . . . . . . . . . . . . . . 24,911 27,027Unearned revenue . . . . . . . . . . . . . . . . . . . . . . . . . . . . . . . . . . . . . . . . . . . . . 2,378 432Income taxes . . . . . . . . . . . . . . . . . . . . . . . . . . . . . . . . . . . . . . . . . . . . . . . . . 3,921 2,459
Total current liabilities . . . . . . . . . . . . . . . . . . . . . . . . . . . . . . . . . . . . . . . . 147,360 139,694Other long-term liabilities . . . . . . . . . . . . . . . . . . . . . . . . . . . . . . . . . . . . . . . . . 17,915 9,579Retirement and post-employment benefits. . . . . . . . . . . . . . . . . . . . . . . . . . . . . . 82,502 82,354Unearned income. . . . . . . . . . . . . . . . . . . . . . . . . . . . . . . . . . . . . . . . . . . . . . . . 57,154 39,697Long-term income taxes . . . . . . . . . . . . . . . . . . . . . . . . . . . . . . . . . . . . . . . . . . 2,906 2,329Deferred income taxes . . . . . . . . . . . . . . . . . . . . . . . . . . . . . . . . . . . . . . . . . . . . 4,912 136Long-term debt . . . . . . . . . . . . . . . . . . . . . . . . . . . . . . . . . . . . . . . . . . . . . . . . . 38,305 8,305Shareholders’ equity
Serial preferred stock, no par value; 5,000 authorized shares; none issued . . . . — —Common stock, no par value; 60,000 authorized shares; issued shares of
26,968 in 2010 and 26,800 in 2009 . . . . . . . . . . . . . . . . . . . . . . . . . . . . . . . 180,161 173,776Retained earnings . . . . . . . . . . . . . . . . . . . . . . . . . . . . . . . . . . . . . . . . . . . . . 368,401 321,974Common stock in treasury; 6,648 shares in 2010 and 6,566 shares in 2009 . . . (115,090) (111,370)Other comprehensive income (loss) . . . . . . . . . . . . . . . . . . . . . . . . . . . . . . . . (51,616) (46,684)Other equity transactions . . . . . . . . . . . . . . . . . . . . . . . . . . . . . . . . . . . . . . . . 2,500 2,163
Total shareholders’ equity . . . . . . . . . . . . . . . . . . . . . . . . . . . . . . . . . . . . . . 384,356 339,859
Total Liabilities and Shareholders’ Equity . . . . . . . . . . . . . . . . . . . . . . $ 735,410 $ 621,953
See Notes to Consolidated Financial Statements.
55

Materion Corporation and SubsidiariesYears Ended December 31, 2010, 2009 and 2008
Consolidated Statements of Shareholders’ Equity
(Thousands)Common
StockRetainedEarnings
CommonStock InTreasury
OtherComprehensiveIncome (Loss)
OtherEquity
Transactions Total
Balances at January 1, 2008 . . . . . . . . . . . . . . . $167,347 $315,972 $(105,578) $(24,576) $ 549 $353,714Net income . . . . . . . . . . . . . . . . . . . . . . . . . . . . — 18,357 — — — 18,357Foreign currency translation adjustment . . . . . . . . — — — 2,305 — 2,305Derivative and hedging activity, net of taxes of
$51 . . . . . . . . . . . . . . . . . . . . . . . . . . . . . . . . — — — 97 — 97Pension and post-employment benefit adjustment,
net of tax benefit of $13,126 . . . . . . . . . . . . . . — — — (25,627) — (25,627)
Comprehensive loss . . . . . . . . . . . . . . . . . . . . . . (4,868)Proceeds from exercise of 12 shares under option
plans . . . . . . . . . . . . . . . . . . . . . . . . . . . . . . . 243 — — — — 243Income tax benefit from stock compensation
realization . . . . . . . . . . . . . . . . . . . . . . . . . . . 455 — — — — 455Repurchase of 300 shares . . . . . . . . . . . . . . . . . . — — (4,999) — — (4,999)Stock-based compensation expense . . . . . . . . . . . . 2,552 — — — — 2,552Directors’ deferred compensation . . . . . . . . . . . . . — — (288) — 288 —
Balances at December 31, 2008 . . . . . . . . . . . . . 170,597 334,329 (110,865) (47,801) 837 347,097Net loss. . . . . . . . . . . . . . . . . . . . . . . . . . . . . . . — (12,355) — — — (12,355)Foreign currency translation adjustment . . . . . . . . — — — (22) — (22)Derivative and hedging activity, net of taxes of
$446 . . . . . . . . . . . . . . . . . . . . . . . . . . . . . . . — — — 825 — 825Pension and post-employment benefit adjustment,
net of tax benefit of $92 . . . . . . . . . . . . . . . . . — — — 314 — 314
Comprehensive loss . . . . . . . . . . . . . . . . . . . . . . (11,238)Proceeds from exercise of 32 shares under option
plans . . . . . . . . . . . . . . . . . . . . . . . . . . . . . . . 497 — — — — 497Income tax benefit from stock compensation
realization . . . . . . . . . . . . . . . . . . . . . . . . . . . 53 — — — — 53Stock-based compensation expense . . . . . . . . . . . . 3,484 — — — — 3,484Shares withheld for employee taxes on equity
awards . . . . . . . . . . . . . . . . . . . . . . . . . . . . . . (482) — — — — (482)Directors’ deferred compensation . . . . . . . . . . . . . (13) (505) — 1,326 808Other equity transactions . . . . . . . . . . . . . . . . . . . (360) — — — — (360)
Balances at December 31, 2009 . . . . . . . . . . . . . 173,776 321,974 (111,370) (46,684) 2,163 339,859Net income . . . . . . . . . . . . . . . . . . . . . . . . . . . . — 46,427 — — — 46,427Foreign currency translation adjustment . . . . . . . . — — — 1,665 — 1,665Derivative and hedging activity, net of tax benefit
of $581 . . . . . . . . . . . . . . . . . . . . . . . . . . . . . — — — (1,078) — (1,078)Pension and post-employment benefit adjustment,
net of tax benefit of $3,120 . . . . . . . . . . . . . . . — — — (5,519) — (5,519)
Comprehensive income . . . . . . . . . . . . . . . . . . . . 41,495Proceeds from exercise of 154 shares under option
plans . . . . . . . . . . . . . . . . . . . . . . . . . . . . . . . 2,631 — — — — 2,631Income tax benefit from stock compensation
realization . . . . . . . . . . . . . . . . . . . . . . . . . . . 120 — — — — 120Repurchase of 150 shares . . . . . . . . . . . . . . . . . . — — (3,527) — — (3,527)Stock-based compensation expense . . . . . . . . . . . . 4,100 — — — — 4,100Shares withheld for employee taxes on equity
awards . . . . . . . . . . . . . . . . . . . . . . . . . . . . . . (481) — — — — (481)Directors’ deferred compensation . . . . . . . . . . . . . — — (192) — 337 145Other equity transactions . . . . . . . . . . . . . . . . . . . 15 — (1) — — 14
Balances at December 31, 2010 . . . . . . . . . . . . . $180,161 $368,401 $(115,090) $(51,616) $2,500 $384,356
See Notes to Consolidated Financial Statements.
56

Materion Corporation and Subsidiaries
Notes to Consolidated Financial Statements
Note A — Significant Accounting Policies
Organization: The Company amended its articles of incorporation to change its name from BrushEngineered Materials Inc. to Materion Corporation effective March 8, 2011. Concurrent with the name change,the Company’s New York Stock Exchange ticker symbol was changed from BW to MTRN.
The Company is a holding company with subsidiaries that have operations in the United States, Europe andAsia. These operations manufacture advanced engineered materials used in a variety of markets, includingconsumer electronics, defense and science, industrial components and commercial aerospace, energy,automotive electronics, telecommunications infrastructure, medical and appliance. The Company has fourreportable segments, the names of which were changed effective in the fourth quarter 2010:
Advanced Material Technologies manufactures precious and non-precious vapor deposition targets, frame lidassemblies, advanced chemicals, performance coatings, optics, microelectronic packages, other precious and non-precious metal products and specialty inorganic materials;
Performance Alloys manufactures high precision strip and bulk products from copper and nickel-based alloys;
Beryllium and Composites produces beryllium metal, beryllium composites and beryllia ceramics in a varietyof forms; and
Technical Materials manufactures clad inlay and overlay metals, precious and base metal electroplatedsystems and other related products.
See Note M to the Consolidated Financial Statements for additional segment details. The Company isvertically integrated and distributes its products through a combination of company-owned facilities andindependent distributors and agents.
Use of Estimates: The preparation of financial statements in conformity with accounting principlesgenerally accepted in the United States requires management to make estimates and assumptions that affectthe amounts reported in the financial statements and accompanying notes. Actual results may differ from thoseestimates.
Consolidation: The Consolidated Financial Statements include the accounts of Materion Corporation and itssubsidiaries. All of the Company’s subsidiaries are wholly owned as of December 31, 2010. Intercompany accountsand transactions are eliminated in consolidation.
Cash Equivalents: All highly liquid investments with a maturity of three months or less when purchased areconsidered to be cash equivalents.
Accounts Receivable: An allowance for doubtful accounts is maintained for the estimated losses resultingfrom the inability of customers to pay the amounts due. The allowance is based upon identified delinquent accounts,customer payment patterns and other analyses of historical data and trends. The Company extends credit tocustomers based upon their financial condition and generally collateral is not required.
Inventories: Inventories are stated at the lower of cost or market. The cost of the majority of domesticinventories is determined using the last-in, first-out (LIFO) method. The remaining inventories are statedprincipally at average cost.
Property, Plant and Equipment: Property, plant and equipment is stated on the basis of cost. Depreciation iscomputed principally by the straight-line method, except certain assets for which depreciation is computed by the
57

units-of-production or the sum-of-the-years-digit method. The depreciable lives that are used in computing theannual provision for depreciation by class of asset are as follows:
Years
Land improvements . . . . . . . . . . . . . . . . . . . . . . . . . . . . . . . . . . . . . . . . . . . . . . . . . . 5 to 25Buildings . . . . . . . . . . . . . . . . . . . . . . . . . . . . . . . . . . . . . . . . . . . . . . . . . . . . . . . . . 10 to 40Leasehold improvements . . . . . . . . . . . . . . . . . . . . . . . . . . . . . . . . . . . . . . . . . . . . . . Life of leaseMachinery and equipment . . . . . . . . . . . . . . . . . . . . . . . . . . . . . . . . . . . . . . . . . . . . . 3 to 15Furniture and fixtures . . . . . . . . . . . . . . . . . . . . . . . . . . . . . . . . . . . . . . . . . . . . . . . . 4 to 15Automobiles and trucks . . . . . . . . . . . . . . . . . . . . . . . . . . . . . . . . . . . . . . . . . . . . . . . 2 to 8Research equipment . . . . . . . . . . . . . . . . . . . . . . . . . . . . . . . . . . . . . . . . . . . . . . . . . 6 to 12Computer hardware . . . . . . . . . . . . . . . . . . . . . . . . . . . . . . . . . . . . . . . . . . . . . . . . . . 3 to 10Computer software . . . . . . . . . . . . . . . . . . . . . . . . . . . . . . . . . . . . . . . . . . . . . . . . . . 3 to 10
An asset acquired under a capital lease will be recorded at the lesser of the present value of the projected leasepayments or the fair value of the asset and will be depreciated in accordance with the above schedule. Leaseholdimprovements will be depreciated over the life of the improvement if it is shorter than the life of the lease. Repairand maintenance costs are expensed as incurred.
Mineral Resources and Mine Development: Property acquisition costs are capitalized as mineral resourceson the balance sheet and are depleted using the units-of-production method based upon recoverable proven reserves.Overburden, or waste rock, is removed prior to the extraction of the ore from a particular open pit. The removal costis capitalized and amortized as the ore is extracted using the units-of-production method based upon the provenreserves in that particular pit. Exploration and development expenses, including development drilling, are chargedto expense in the period in which they are incurred.
Goodwill and Other Intangible Assets: Goodwill is not amortized, but instead reviewed annually as ofDecember 31 of each year, or more frequently under certain circumstances, for impairment. Goodwill is assigned tothe reporting unit, which is the operating segment level or one level below the operating segment. Intangible assetswith finite lives are amortized using the straight-line method or effective interest method, as applicable, over theperiods estimated to be benefited, which is generally twenty years or less. Finite-lived intangible assets are alsoreviewed for impairment if facts and circumstances warrant.
Asset Impairment: In the event that facts and circumstances indicate that the carrying value of long-livedand finite-lived intangible assets may be impaired, an evaluation of recoverability is performed by comparing thecarrying value of the assets to the associated estimated future undiscounted cash flow. If the carrying value exceedsthat cash flow, then the assets are written down to their fair values.
Derivatives: The Company recognizes all derivatives on the balance sheet at their fair values. If thederivative is designated and effective as a hedge, depending upon the nature of the hedge, changes in the fair valueof the derivative are either offset against the change in fair value of the hedged asset, liability or firm commitmentthrough earnings or recognized in other comprehensive income (loss), a component of shareholders’ equity, untilthe hedged item is recognized in earnings. The ineffective portion of a derivative’s change in fair value, if any, isrecognized in earnings immediately. If a derivative is not a hedge, changes in its fair value are adjusted throughincome.
Asset Retirement Obligation: The Company records a liability to recognize the legal obligation to removean asset at the time the asset is acquired or when the legal liability arises. The liability is recorded for the presentvalue of the ultimate obligation by discounting the estimated future cash flows using a credit-adjusted risk-freeinterest rate. The liability is accreted over time, with the accretion charged to expense. An asset equal to the fairvalue of the liability is recorded concurrent with the liability and depreciated over the life of the underlying asset.
Unearned Income: Expenditures for capital equipment to be reimbursed under government contracts arerecorded in construction in process while the reimbursements for those expenditures are recorded in unearnedincome, a liability on the balance sheet. When the assets are placed in service, their total cost will be depreciatedover their useful lives and the unearned income liability will be reduced and credited to income ratably with theannual depreciation expense.
58

Revenue Recognition: The Company generally recognizes revenue when the goods are shipped and titlepasses to the customer. The Company requires persuasive evidence that a revenue arrangement exists, delivery ofthe product has occurred, the selling price is fixed or determinable and collectibility is reasonably assured beforerevenue is realized and earned. Billings in advance of the shipment of the goods are recorded as unearned revenue,which is a liability on the balance sheet. Revenue is recognized for these transactions when the goods are shippedand all other revenue recognition criteria are met.
Shipping and Handling Costs: The Company records shipping and handling costs for products sold tocustomers in cost of sales on the Consolidated Statements of Income and Loss.
Advertising Costs: The Company expenses all advertising costs as incurred. Advertising costs were$0.8 million in 2010, $0.4 million in 2009 and $1.0 million in 2008.
Stock-based Compensation: All stock-based compensation instruments, including options, stockappreciation rights, restricted stock and performance restricted stock, are viewed collectively when determiningthe accounting treatment of the tax considerations upon the realization of the benefit by the recipient.
Income Taxes: The Company uses the liability method in measuring the provision for income taxes andrecognizing deferred tax assets and liabilities on the balance sheet. The Company will record a valuation allowanceto reduce the deferred tax assets to the amount that is more likely than not to be realized, as warranted by the factsand circumstances. The Company applies a more-likely-than-not recognition threshold for all tax uncertainties andwill record a liability for those tax benefits that have a less than 50% likelihood of being sustained upon examinationby the taxing authorities.
Net Income Per Share: Basic earnings per share (EPS) is computed by dividing income available tocommon stockholders by the weighted-average number of common shares outstanding for the period. Diluted EPSreflects the assumed conversion of all dilutive common stock equivalents as appropriate under the treasury stockmethod.
Reclassification: Certain amounts in prior years have been reclassified to conform to the 2010 consolidatedfinancial statement presentation. These reclassifications include depicting intangible assets as a separate line itemfrom other assets and unearned income as a separate line item from other long-term liabilities on the ConsolidatedBalance Sheets.
New Pronouncements: The FASB issued Statement No. 160, “Non-controlling Interests in ConsolidatedFinancial Statements, an amendment of ARB No. 51”, in December 2007, codified within ASC 810 —Consolidation. The statement establishes accounting and reporting standards for a non-controlling interest in asubsidiary and for the deconsolidation of a subsidiary. It clarifies that a non-controlling interest should be classifiedas a separate component of equity. Among other items, it also changes how income attributable to the parent and thenon-controlling interest are presented on the consolidated statement of income. The statement was effective forfiscal years beginning on or after December 15, 2008. The Company adopted this statement as required in 2009 andits adoption did not impact the Consolidated Financial Statements.
The FASB issued Statement No. 141 (Revised 2007), “Business Combinations” in December 2007, codifiedwithin ASC 805 — Business Combinations. The statement requires that purchase accounting be used for allbusiness combinations and that an acquirer be identified for every combination. It requires the acquirer to recognizeacquired assets, liabilities and non-controlling interests at their fair values. It also requires that costs incurred toaffect the transaction as well as any expected, but not obligated, restructuring costs be expensed and not accountedfor as a component of goodwill or part of the business combination. The statement revises the accounting fordeferred taxes, research and development costs and other items associated with business combinations. Thestatement was effective for fiscal years beginning on or after December 15, 2008. The Company adopted thisstatement as required in 2009 and used the provisions of this statement to account for the assets and liabilities of theacquisitions completed in 2009 and 2010 and the transaction-related costs.
The FASB issued Statement No. 161, “Disclosures about Derivative Instruments and Hedging Activities — anamendment of FASB Statement No. 133”, in March 2008, codified within ASC 815 — Derivatives and Hedging.The statement expands the disclosures of Statement No. 133 in order to enhance the users’ understanding of how
59

and why an entity uses derivatives, how derivative instruments and the related hedged items are accounted for andhow derivative instruments and related hedged items affect the entity’s financial position, financial performance andcash flows. The statement requires qualitative disclosures about hedging objectives and strategies, quantitativedisclosures of the fair value of and the gains and losses from derivatives and disclosures about credit-risk relatedfeatures in derivatives. The statement was effective for fiscal years beginning after November 15, 2008. TheCompany adopted this statement as required in 2009. The adoption did not impact the Consolidated FinancialStatements other than the required additional disclosures.
The FASB issued ASU No. 2009-13, “Multiple-Deliverable Revenue Arrangements — a consensus of theFASB Emerging Issues Task Force”, in October 2009 that provides amendments to the criteria for separatingconsideration in multiple-deliverable arrangements. This update will allow companies to allocate considerationreceived for qualified separate deliverables using estimated selling price for both delivered and undelivered itemswhen vendor-specific objective evidence or third-party evidence is unavailable. Additional disclosures discussingthe nature of multiple element arrangements, the types of deliverables under the arrangements, the general timing oftheir delivery, and significant factors and estimates used to determine estimated selling prices are required. TheCompany adopted this update effective January 1, 2011 for new revenue arrangements entered into or materiallymodified on or after January 1, 2011. The adoption of the provisions of this update is not expected to have a materialimpact on the Consolidated Financial Statements.
The FASB issued ASU No. 2010-6, “Improving Disclosures About Fair Value Measurements”, in January2010 that amends existing disclosure requirements under ASC 820 by adding required disclosures about itemstransferring into and out of levels 1 and 2 in the fair value hierarchy; adding separate disclosures about purchases,sales, issuances, and settlements relative to level 3 measurements; and clarifying, among other things, the existingfair value disclosures about the level of disaggregation. The statement was effective for the first quarter of 2010,except for the requirement to provide level 3 activity of purchases, sales, issuances, and settlements on a gross basis,which is effective beginning the first quarter of 2011. Since this standard impacts disclosure requirements only, itsadoption did not have a material impact on the Consolidated Financial Statements.
The FASB issued ASU No. 2010-29, “Business Combinations (Topic 805) — Disclosure of SupplementaryPro Forma Information for Business Combinations”, in December 2010 which requires public entities that presentcomparative financial statements to disclose revenue and earnings of the combined entity as though the businesscombinations that occurred during the current year had occurred at the beginning of the comparable prior annualreporting period only. The amendments also expand the supplemental pro forma disclosures to include a descriptionof the nature and amount of material, nonrecurring pro forma adjustments directly attributable to the businesscombination included in the reported pro forma revenue and earnings. These amendments are effective for businesscombinations for which the acquisition date is on or after January 1, 2011. The adoption of this statement is notexpected to have a significant impact on the Consolidated Financial Statements.
Note B — Acquisitions
In January 2010, the Company acquired the outstanding stock of Academy Corporation of Albuquerque, NewMexico for $21.0 million in cash. Academy provides precious and non-precious metals and refining services for avariety of applications, including architectural glass, solar energy, medical and electronics. Major product formsinclude sputtering targets, sheet, fine wire, rod and powder. Academy employs approximately 150 people at its fourleased facilities.
60

A condensed balance sheet depicting the amounts assigned to the acquired assets and liabilities as of theacquisition date is as follows:
(Thousands)Asset
(Liability)
Cash . . . . . . . . . . . . . . . . . . . . . . . . . . . . . . . . . . . . . . . . . . . . . . . . . . . . . . . . . . . . . . . . $ 380
Other current assets . . . . . . . . . . . . . . . . . . . . . . . . . . . . . . . . . . . . . . . . . . . . . . . . . . . . . 4,564
Precious metal inventory . . . . . . . . . . . . . . . . . . . . . . . . . . . . . . . . . . . . . . . . . . . . . . . . . 5,667
Finite-lived intangible assets . . . . . . . . . . . . . . . . . . . . . . . . . . . . . . . . . . . . . . . . . . . . . . 3,253
Property, plant and equipment . . . . . . . . . . . . . . . . . . . . . . . . . . . . . . . . . . . . . . . . . . . . . 8,533
Other assets . . . . . . . . . . . . . . . . . . . . . . . . . . . . . . . . . . . . . . . . . . . . . . . . . . . . . . . . . . 10
Goodwill . . . . . . . . . . . . . . . . . . . . . . . . . . . . . . . . . . . . . . . . . . . . . . . . . . . . . . . . . . . . . 5,431
Current liabilities . . . . . . . . . . . . . . . . . . . . . . . . . . . . . . . . . . . . . . . . . . . . . . . . . . . . . . (4,575)
Deferred income taxes . . . . . . . . . . . . . . . . . . . . . . . . . . . . . . . . . . . . . . . . . . . . . . . . . . . (2,278)
Total purchase . . . . . . . . . . . . . . . . . . . . . . . . . . . . . . . . . . . . . . . . . . . . . . . . . . . . . . . . . $20,985
The Company financed the acquisition with a combination of cash on hand and borrowings under the$240.0 million revolving credit agreement. The $21.0 million purchase price is net of $1.7 million the Companyreceived back from the sellers in the second quarter 2010 as a result of the resolution of working capital valuationadjustments in accordance with the purchase agreement. Additional funds remain in escrow pending finalization ofvarious other matters as detailed in the purchase agreement. Immediately after the purchase, the Companytransferred Academy’s precious metal inventory to a financial institution for its fair value of $5.7 million andconsigned it back under the existing consignment lines.
Academy had sales of $195.3 million and generated income before income taxes of $3.5 million in 2010.Assuming the Academy acquisition occurred on January 1, 2009, the pro forma effect on selected line items fromthe Company’s Consolidated Statement of Income and Loss would be as follows:
(Thousands except per share amounts) 2010 2009
Pro Forma Results(Unaudited)
Sales . . . . . . . . . . . . . . . . . . . . . . . . . . . . . . . . . . . . . . . . . . . . . . . . . . . . $1,302,314 $884,502
Income (loss) before income taxes . . . . . . . . . . . . . . . . . . . . . . . . . . . . . . 70,968 (20,385)
Net income (loss) . . . . . . . . . . . . . . . . . . . . . . . . . . . . . . . . . . . . . . . . . . . 46,427 (12,096)
Diluted earnings per share . . . . . . . . . . . . . . . . . . . . . . . . . . . . . . . . . . . . 2.25 (0.60)
In October 2009, the Company acquired all of the capital stock of Barr Associates, Inc. for $55.2 million incash. Barr, based in Westford, Massachusetts, manufactures thin film optical filters used in a variety of applications,including defense, aerospace, medical, telecommunications, lighting and astronomy.
61

A condensed balance sheet depicting the amounts assigned to the acquired assets and liabilities as of theacquisition date is as follows:
(Thousands)Asset
(Liability)
Cash . . . . . . . . . . . . . . . . . . . . . . . . . . . . . . . . . . . . . . . . . . . . . . . . . . . . . . . . . . . . . . . . $ 1,058
Other current assets . . . . . . . . . . . . . . . . . . . . . . . . . . . . . . . . . . . . . . . . . . . . . . . . . . . . . 13,206
Finite-lived intangible assets . . . . . . . . . . . . . . . . . . . . . . . . . . . . . . . . . . . . . . . . . . . . . . 12,200
Property, plant and equipment . . . . . . . . . . . . . . . . . . . . . . . . . . . . . . . . . . . . . . . . . . . . . 7,269
Other assets . . . . . . . . . . . . . . . . . . . . . . . . . . . . . . . . . . . . . . . . . . . . . . . . . . . . . . . . . . 54
Goodwill . . . . . . . . . . . . . . . . . . . . . . . . . . . . . . . . . . . . . . . . . . . . . . . . . . . . . . . . . . . . . 31,727
Current liabilities . . . . . . . . . . . . . . . . . . . . . . . . . . . . . . . . . . . . . . . . . . . . . . . . . . . . . . (3,360)
Other long-term liabilities . . . . . . . . . . . . . . . . . . . . . . . . . . . . . . . . . . . . . . . . . . . . . . . . (2,974)
Deferred income taxes . . . . . . . . . . . . . . . . . . . . . . . . . . . . . . . . . . . . . . . . . . . . . . . . . . . (4,015)
Total purchase . . . . . . . . . . . . . . . . . . . . . . . . . . . . . . . . . . . . . . . . . . . . . . . . . . . . . . . . . $55,165
The purchase price was financed with a combination of cash on hand and borrowings under the revolvingcredit agreement. The purchase price included amounts to be held in escrow pending the resolution of variousmatters as detailed in the purchase agreement. In addition to the initial cash considerations, the purchase agreementallows for a potential earn-out to be paid to the sellers based upon the future performance of the operation. The earn-out was initially recorded in other long-term liabilities at its fair value of $1.9 million as of December 31, 2009.Based upon actual and revised projected performance and the use of a discounted cash flow analysis, the fair valueof the earn out liability was reduced to $1.1 million as of December 31, 2010.
In February 2008, the Company acquired the operating assets of Techni-Met, Inc. of Windsor, Connecticut for$86.5 million in cash, including acquisition fees. Techni-Met produces precision precious metal coated flexiblepolymeric films used in a variety of high end applications, including diabetes diagnostic test strips. Techni-Metsources the majority of its precious metal requirements from other operations within the Company’s AdvancedMaterial Technologies segment. The $86.5 million purchase price was net of $1.4 million received back fromescrow in February 2009 based upon the final agreed-upon balances under the terms of the purchase agreement.
A condensed balance sheet depicting the final amounts assigned to the acquired assets and liabilities as of theacquisition date is as follows:
(Thousands)Asset
(Liability)
Precious metal inventory . . . . . . . . . . . . . . . . . . . . . . . . . . . . . . . . . . . . . . . . . . . . . . . . . $22,915
Other current assets . . . . . . . . . . . . . . . . . . . . . . . . . . . . . . . . . . . . . . . . . . . . . . . . . . . . . 8,739
Finite-lived intangible assets . . . . . . . . . . . . . . . . . . . . . . . . . . . . . . . . . . . . . . . . . . . . . . 26,200
Property, plant and equipment . . . . . . . . . . . . . . . . . . . . . . . . . . . . . . . . . . . . . . . . . . . . . 15,000
Goodwill . . . . . . . . . . . . . . . . . . . . . . . . . . . . . . . . . . . . . . . . . . . . . . . . . . . . . . . . . . . . . 13,879
Current liabilities . . . . . . . . . . . . . . . . . . . . . . . . . . . . . . . . . . . . . . . . . . . . . . . . . . . . . . (222)
Total purchase . . . . . . . . . . . . . . . . . . . . . . . . . . . . . . . . . . . . . . . . . . . . . . . . . . . . . . . . . $86,511
The Company financed the acquisition with a combination of cash on hand and borrowings under the revolvingcredit agreement. Immediately subsequent to the purchase, the Company transferred Techni-Met’s precious metalinventory to the existing consignment lines and received its market value of approximately $22.9 million back fromthe financial institution.
The results of the above acquired businesses were included in the Company’s financial statements since theirrespective acquisition dates. The acquisitions are included in the Advanced Material Technologies segment. SeeNote E to the Consolidated Financial Statements for additional information on the intangible assets associated withthese acquisitions.
62

Note C — Inventories
Inventories on the Consolidated Balance Sheets are summarized as follows:
(Thousands) 2010 2009December 31,
Principally average cost:
Raw materials and supplies . . . . . . . . . . . . . . . . . . . . . . . . . . . . . . . . . . . $ 43,295 $ 38,740
Work in process. . . . . . . . . . . . . . . . . . . . . . . . . . . . . . . . . . . . . . . . . . . . 159,081 119,698
Finished goods . . . . . . . . . . . . . . . . . . . . . . . . . . . . . . . . . . . . . . . . . . . . 32,991 38,950
Gross inventories . . . . . . . . . . . . . . . . . . . . . . . . . . . . . . . . . . . . . . . . . 235,367 197,388
Excess of average cost over LIFO inventory value . . . . . . . . . . . . . . . . . . 80,900 67,290
Net inventories. . . . . . . . . . . . . . . . . . . . . . . . . . . . . . . . . . . . . . . . . . . $154,467 $130,098
Average cost approximates current cost. Gross inventories accounted for using the LIFO method totaled$153.6 million at December 31, 2010 and $123.4 million at December 31, 2009. The liquidation of LIFO inventorylayers reduced cost of sales by $4.4 million in 2010 and $1.9 million in 2009.
Lower of cost or market charges reduced net inventories by $0.4 million in 2010 and $0.7 million in 2009.
Note D — Property, Plant and Equipment
Property, plant and equipment on the Consolidated Balance Sheets is summarized as follows:
(Thousands) 2010 2009December 31,
Land . . . . . . . . . . . . . . . . . . . . . . . . . . . . . . . . . . . . . . . . . . . . . . . . . . . . $ 8,991 $ 8,690
Buildings . . . . . . . . . . . . . . . . . . . . . . . . . . . . . . . . . . . . . . . . . . . . . . . . . 110,344 114,114
Machinery and equipment . . . . . . . . . . . . . . . . . . . . . . . . . . . . . . . . . . . . . 469,307 458,946
Software . . . . . . . . . . . . . . . . . . . . . . . . . . . . . . . . . . . . . . . . . . . . . . . . . . 28,261 25,884
Construction in progress . . . . . . . . . . . . . . . . . . . . . . . . . . . . . . . . . . . . . . 75,282 50,918
Allowances for depreciation . . . . . . . . . . . . . . . . . . . . . . . . . . . . . . . . . . . (450,853) (434,962)
Subtotal . . . . . . . . . . . . . . . . . . . . . . . . . . . . . . . . . . . . . . . . . . . . . . . . 241,332 223,590
Capital leases . . . . . . . . . . . . . . . . . . . . . . . . . . . . . . . . . . . . . . . . . . . . . . 10,732 1,122
Allowances for amortization . . . . . . . . . . . . . . . . . . . . . . . . . . . . . . . . . . . (260) (454)
Subtotal . . . . . . . . . . . . . . . . . . . . . . . . . . . . . . . . . . . . . . . . . . . . . . . . 10,472 668
Mineral resources . . . . . . . . . . . . . . . . . . . . . . . . . . . . . . . . . . . . . . . . . . . 5,029 5,029
Mine development . . . . . . . . . . . . . . . . . . . . . . . . . . . . . . . . . . . . . . . . . . 12,007 658
Allowances for amortization and depletion. . . . . . . . . . . . . . . . . . . . . . . . . (2,972) (2,179)
Subtotal . . . . . . . . . . . . . . . . . . . . . . . . . . . . . . . . . . . . . . . . . . . . . . . . 14,064 3,508
Property, plant and equipment — net . . . . . . . . . . . . . . . . . . . . . . . . . . . . . $ 265,868 $ 227,766
Depreciation expense, including amortization for assets recorded under capital lease, was $29.0 million in2010, $27.9 million in 2009, and $30.3 million in 2008.
63

Note E — Intangible Assets
Assets Acquired
The Company acquired the following intangible assets in 2010:
(Dollars in thousands) AmountWeighted-average
Amortization Period
Customer relationships . . . . . . . . . . . . . . . . . . . . . . . . . . . . . . . . . . . . $2,880 6.8 Years
Trade name . . . . . . . . . . . . . . . . . . . . . . . . . . . . . . . . . . . . . . . . . . . . 373 2.0 Years
License . . . . . . . . . . . . . . . . . . . . . . . . . . . . . . . . . . . . . . . . . . . . . . . 1,300 4.0 Years
Deferred financing costs . . . . . . . . . . . . . . . . . . . . . . . . . . . . . . . . . . . 220 3.0 Years
Total assets subject to amortization . . . . . . . . . . . . . . . . . . . . . . . . . $4,773 5.5 Years
Goodwill . . . . . . . . . . . . . . . . . . . . . . . . . . . . . . . . . . . . . . . . . . . . . . $5,902 Not Applicable
The customer relationships and trade name intangible assets and $5.4 million of the goodwill were acquired as partof the first quarter 2010 purchase of the capital stock of Academy Corporation. The remainder of the goodwill resultedfrom adjustments to the preliminary goodwill from revisions to the assigned values to various assets and liabilities fromthe purchase of the capital stock of Barr Associates, Inc.
The license was acquired by Advanced Material Technologies to make products using technology under patent.
64

Assets Subject to Amortization
The cost, accumulated amortization and net book value of intangible assets subject to amortization as ofDecember 31, 2010 and 2009 and the amortization expense for each year then ended is as follows:
(Thousands) 2010 2009
Deferred financing costsCost . . . . . . . . . . . . . . . . . . . . . . . . . . . . . . . . . . . . . . . . . . . . . . . . . . . . . . $ 3,789 $ 3,569Accumulated amortization . . . . . . . . . . . . . . . . . . . . . . . . . . . . . . . . . . . . . . (2,840) (2,302)
Net book value . . . . . . . . . . . . . . . . . . . . . . . . . . . . . . . . . . . . . . . . . . . . . . 949 1,267Customer relationships
Cost . . . . . . . . . . . . . . . . . . . . . . . . . . . . . . . . . . . . . . . . . . . . . . . . . . . . . . 37,430 34,550Accumulated amortization . . . . . . . . . . . . . . . . . . . . . . . . . . . . . . . . . . . . . . (10,691) (6,721)
Net book value . . . . . . . . . . . . . . . . . . . . . . . . . . . . . . . . . . . . . . . . . . . . . . 26,739 27,829Technology
Cost . . . . . . . . . . . . . . . . . . . . . . . . . . . . . . . . . . . . . . . . . . . . . . . . . . . . . . 11,120 11,120Accumulated amortization . . . . . . . . . . . . . . . . . . . . . . . . . . . . . . . . . . . . . . (3,454) (2,025)
Net book value . . . . . . . . . . . . . . . . . . . . . . . . . . . . . . . . . . . . . . . . . . . . . . 7,666 9,095License
Cost . . . . . . . . . . . . . . . . . . . . . . . . . . . . . . . . . . . . . . . . . . . . . . . . . . . . . . 1,720 420Accumulated amortization . . . . . . . . . . . . . . . . . . . . . . . . . . . . . . . . . . . . . . (467) (167)
Net book value . . . . . . . . . . . . . . . . . . . . . . . . . . . . . . . . . . . . . . . . . . . . . . 1,253 253Non-compete contracts
Cost . . . . . . . . . . . . . . . . . . . . . . . . . . . . . . . . . . . . . . . . . . . . . . . . . . . . . . 500 500Accumulated amortization . . . . . . . . . . . . . . . . . . . . . . . . . . . . . . . . . . . . . . (500) (479)
Net book value . . . . . . . . . . . . . . . . . . . . . . . . . . . . . . . . . . . . . . . . . . . . . . — 21Trade name
Cost . . . . . . . . . . . . . . . . . . . . . . . . . . . . . . . . . . . . . . . . . . . . . . . . . . . . . . 973 600Accumulated amortization . . . . . . . . . . . . . . . . . . . . . . . . . . . . . . . . . . . . . . (731) (58)
Net book value . . . . . . . . . . . . . . . . . . . . . . . . . . . . . . . . . . . . . . . . . . . . . . 242 542Total
Cost . . . . . . . . . . . . . . . . . . . . . . . . . . . . . . . . . . . . . . . . . . . . . . . . . . . . . . $55,532 $50,759Accumulated amortization . . . . . . . . . . . . . . . . . . . . . . . . . . . . . . . . . . . . . . (18,683) (11,752)
Net book value . . . . . . . . . . . . . . . . . . . . . . . . . . . . . . . . . . . . . . . . . . . . . . $36,849 $39,007
Aggregate amortization expense . . . . . . . . . . . . . . . . . . . . . . . . . . . . . . . . . . . $ 6,931 $ 4,466
The aggregate amortization expense is estimated to be $6.5 million in 2011, $5.9 million in 2012, $5.0 millionin 2013, $4.7 million in 2014 and $4.6 million in 2015.
Assets Not Subject to Amortization
The Company’s only intangible asset not subject to amortization is goodwill. A reconciliation of the goodwillactivity for 2010 and 2009 is as follows:
(Thousands) 2010 2009
Balance at the beginning of the year . . . . . . . . . . . . . . . . . . . . . . . . . . . . . . . . $67,034 $35,778
Current year additions . . . . . . . . . . . . . . . . . . . . . . . . . . . . . . . . . . . . . . . . . . . 5,705 31,256
Adjustment to deferred taxes on prior year acquisition . . . . . . . . . . . . . . . . . . . 197 —
Balance at the end of the year . . . . . . . . . . . . . . . . . . . . . . . . . . . . . . . . . . . . . $72,936 $67,034
65

All of the goodwill has been assigned to the Advanced Material Technologies segment.
The goodwill acquired in 2010 and 2009 was not deductible for tax purposes.
Note F — Debt
Long-term debt on the Consolidated Balance Sheets is summarized as follows:
(Thousands) 2010 2009December 31,
Revolving credit agreement . . . . . . . . . . . . . . . . . . . . . . . . . . . . . . . . . . . . . . . . $30,000 $ —
Variable rate industrial development revenue bonds payable in 2016. . . . . . . . . . 8,305 8,305
Total outstanding . . . . . . . . . . . . . . . . . . . . . . . . . . . . . . . . . . . . . . . . . . . . . . . 38,305 8,305
Current portion of long-term debt . . . . . . . . . . . . . . . . . . . . . . . . . . . . . . . . . . . — —
Total . . . . . . . . . . . . . . . . . . . . . . . . . . . . . . . . . . . . . . . . . . . . . . . . . . . . . . . . $38,305 $8,305
Maturities on long-term debt instruments as of December 31, 2010 are as follows:
2011 . . . . . . . . . . . . . . . . . . . . . . . . . . . . . . . . . . . . . . . . . . . . . . . . . . . . . . . . . . . . . . . . $ —
2012 . . . . . . . . . . . . . . . . . . . . . . . . . . . . . . . . . . . . . . . . . . . . . . . . . . . . . . . . . . . . . . . . 30,000
2013 . . . . . . . . . . . . . . . . . . . . . . . . . . . . . . . . . . . . . . . . . . . . . . . . . . . . . . . . . . . . . . . . —
2014 . . . . . . . . . . . . . . . . . . . . . . . . . . . . . . . . . . . . . . . . . . . . . . . . . . . . . . . . . . . . . . . . —
2015 . . . . . . . . . . . . . . . . . . . . . . . . . . . . . . . . . . . . . . . . . . . . . . . . . . . . . . . . . . . . . . . . —
Thereafter . . . . . . . . . . . . . . . . . . . . . . . . . . . . . . . . . . . . . . . . . . . . . . . . . . . . . . . . . . . . 8,305
Total . . . . . . . . . . . . . . . . . . . . . . . . . . . . . . . . . . . . . . . . . . . . . . . . . . . . . . . . . . . . . . . . $38,305
The Company has a $240.0 million revolving credit facility with six financial institutions that is comprised ofsub-facilities for short and long-term loans, letters of credit and foreign borrowings. The agreement, which expiresin November 2012, is subject to a calculation of maximum availability. The credit agreement also provides for anuncommitted incremental facility whereby under certain circumstances, the Company may be able to borrowadditional term loans in an amount not to exceed $50.0 million. At December 31, 2010, the maximum available andunused credit under this facility was $162.0 million. The credit agreement is secured by substantially all of theassets of the Company and its direct subsidiaries, with the exception of non-mining real property and certain otherassets. The credit agreement allows the Company to borrow money at a premium over LIBOR or prime rate and atvarying maturities. The premium resets quarterly according to the terms and conditions available under theagreement. At December 31, 2010, there was $36.9 million outstanding against the letters of credit sub-facility. TheCompany pays a variable commitment fee that may reset quarterly (0.125% as of December 31, 2010) on theavailable and unborrowed amounts under the revolving credit line.
The credit agreement is subject to restrictive covenants including incurring additional indebtedness,acquisition limits, dividend declarations and stock repurchases. In addition, the agreement requires theCompany to maintain a maximum leverage ratio and a minimum fixed charge coverage ratio. The Companywas in compliance with all of its debt covenants as of December 31, 2010.
The following table summarizes the Company’s short-term lines of credit. Amounts shown as outstanding areincluded in short-term debt on the Consolidated Balance Sheets.
(Thousands) Total Outstanding Available Total Outstanding AvailableDecember 31, 2010 December 31, 2009
Domestic . . . . . . . . . . . . . . . . . . . $173,068 $11,080 $161,988 $ 51,101 $11,418 $39,683
Foreign . . . . . . . . . . . . . . . . . . . . 14,327 3,313 11,014 11,303 435 10,868
Precious metal . . . . . . . . . . . . . . . 33,442 33,442 — 50,862 44,295 6,567
Total . . . . . . . . . . . . . . . . . . . . $220,837 $47,835 $173,002 $113,266 $56,148 $57,118
66

The domestic line is committed and includes all sub-facilities in the $240.0 million maximum borrowing underthe revolving credit agreement. The Company has various foreign lines of credit, one of which for 3.5 million eurosis committed and secured. The remaining foreign lines are uncommitted, unsecured and renewed annually. In 2009,the precious metal facility, which is secured and renewed annually, was amended to include copper. The averageinterest rate on short-term debt was 3.06% and 2.48% as of December 31, 2010 and 2009, respectively.
In November 1996, the Company entered into an agreement with the Lorain Port Authority, Ohio to issue$8.3 million in variable rate industrial revenue bonds, maturing in 2016. The variable rate ranged from 0.33% to0.50% in 2010 and from 0.36% to 1.05% in 2009.
Note G — Leasing Arrangements
The Company leases warehouse and manufacturing space, and manufacturing, computer and other officeequipment under operating leases with terms ranging up to 25 years. Operating lease expense amounted to$9.9 million, $8.4 million, and $7.6 million, during 2010, 2009, and 2008, respectively. The Company also leasesmanufacturing space and computer equipment under capital lease agreements of varying terms.
The future estimated minimum payments under capital leases and non-cancelable operating leases with initiallease terms in excess of one year at December 31, 2010, are as follows:
(Thousands)CapitalLeases
OperatingLeases
2011 . . . . . . . . . . . . . . . . . . . . . . . . . . . . . . . . . . . . . . . . . . . . . . . . . . . . . . . $ 1,317 $ 8,563
2012 . . . . . . . . . . . . . . . . . . . . . . . . . . . . . . . . . . . . . . . . . . . . . . . . . . . . . . . 1,228 5,670
2013 . . . . . . . . . . . . . . . . . . . . . . . . . . . . . . . . . . . . . . . . . . . . . . . . . . . . . . . 1,095 5,064
2014 . . . . . . . . . . . . . . . . . . . . . . . . . . . . . . . . . . . . . . . . . . . . . . . . . . . . . . . 1,066 3,643
2015 . . . . . . . . . . . . . . . . . . . . . . . . . . . . . . . . . . . . . . . . . . . . . . . . . . . . . . . 1,064 3,430
2016 and thereafter . . . . . . . . . . . . . . . . . . . . . . . . . . . . . . . . . . . . . . . . . . . . 7,895 18,223
Total minimum lease payments. . . . . . . . . . . . . . . . . . . . . . . . . . . . . . . . . . . . 13,665 $44,593
Amounts representing interest. . . . . . . . . . . . . . . . . . . . . . . . . . . . . . . . . . . . . 3,614
Present value of net minimum lease payments . . . . . . . . . . . . . . . . . . . . . . . . $10,051
Certain lease agreements may be subject to restrictive covenants, including leverage, fixed charges and annualcapital expenditures.
Note H — Fair Value Information and Derivative Financial Instruments
The Company measures and records financial instruments at their fair value. A hierarchy is used for thoseinstruments measured at fair value that distinguishes between assumptions based upon market data (observableinputs) and the Company’s assumptions (unobservable inputs). The hierarchy consists of three levels:
Level 1 — Quoted market prices in active markets for identical assets and liabilities;
Level 2 — Inputs other than Level 1 inputs that are either directly or indirectly observable; and
Level 3 — Other significant unobservable inputs developed using estimates and assumptions developed by theCompany, which reflect those that a market participant would use.
67

The following table summarizes the financial instruments measured at fair value in the Consolidated BalanceSheet as of December 31, 2010:
(Thousands) Total
Quoted Pricesin Active
Markets forIdentical
Assets(Level 1)
SignificantObservable
Inputs(Level 2)
OtherSignificant
UnobservableInputs
(Level 3)
Fair Value Measurements
Financial AssetsDirectors’ deferred compensation investments . . . . . . . . $ 660 $ 660 $ — $ —
Total . . . . . . . . . . . . . . . . . . . . . . . . . . . . . . . . . . . . . . $ 660 $ 660 $ — $ —
Financial LiabilitiesDirectors’ deferred compensation liability . . . . . . . . . . $ 660 $ 660 $ — $ —
Foreign currency forward contracts . . . . . . . . . . . . . . . 1,543 — 1,543 —
Total . . . . . . . . . . . . . . . . . . . . . . . . . . . . . . . . . . . . . . $2,203 $ 660 $1,543 $ —
The Company uses a market approach to value the assets and liabilities for outstanding derivative contracts inthe table above. Foreign currency forward contracts are valued through models that utilize market observable inputsincluding both spot and forward prices for the same underlying currencies. The carrying values of the other workingcapital items and debt on the Consolidated Balance Sheet approximate their fair values as of December 31, 2010.
The Company uses derivative contracts to hedge portions of its foreign currency exposures and may also usederivatives to hedge a portion of its precious metal exposures. The objectives and strategies for using derivatives inthese areas are as follows:
Foreign Currency. The Company sells products to overseas customers in their local currencies,primarily the euro and yen. The Company secures foreign currency derivatives, mainly forwardcontracts and options, to hedge these anticipated sales transactions. The purpose of the hedge programis to protect against the reduction in the dollar value of foreign currency sales from adverse exchangerate movements. Should the dollar strengthen significantly, the decrease in the translated value of theforeign currency sales should be partially offset by gains on the hedge contracts. Depending upon themethods used, the hedge contract may limit the benefits from a weakening U.S. dollar.
The use of forward contracts locks in a firm rate and eliminates any downside from an adverse ratemovement as well as any benefit from a favorable rate movement. The Company may, from time totime, choose to hedge with options or a tandem of options known as a collar. These hedging techniquescan limit or eliminate the downside risk but can allow for some or all of the benefit from a favorable ratemovement to be realized. Unlike a forward contract, a premium is paid for an option; collars, which area combination of a put and call option, may have a net premium but they can be structured to be cashneutral. The Company will primarily hedge with forward contracts due to the relationship between thecash outlay and the level of risk.
A team consisting of senior financial managers reviews the estimated exposure levels, as definedby budgets, forecasts and other internal data, and determines the timing, amounts and instruments to useto hedge that exposure. Management analyzes the effective hedged rates and the actual and projectedgains and losses on the hedging transactions against the program objectives, targeted rates and levels ofrisk assumed. Hedge contracts are typically layered in at different times for a specified exposure periodin order to minimize the impact of market rate movements.
Precious Metals. The Company maintains the majority of its precious metal inventory onconsignment in order to reduce its working capital investment and the exposure to metal pricemovements. When a precious metal product is fabricated and ready for shipment to the customer,the metal is purchased out of consignment at the current market price. The price paid by the Companyforms the basis for the price charged to the customer. This methodology allows for changes in either
68

direction in the market prices of the precious metals used by the Company to be passed through to thecustomer and reduces the impact changes in prices could have on the Company’s margins and operatingprofit. The consigned metal is owned by financial institutions who charge the Company a financing feebased upon the current value of the metal on hand.
In certain instances, a customer may want to establish the price for the precious metal at the timethe sales order is placed rather than at the time of shipment. Setting the sales price at a different datethan when the material would be purchased potentially creates an exposure to movements in the marketprice of the metal. Therefore, in these limited situations, the Company may elect to enter into a forwardcontract to purchase precious metal. The forward contract allows the Company to purchase metal at afixed price on a specific future date. The price in the forward contract serves as the basis for the price tobe charged to the customer. By so doing, the selling price and purchase price are matched and theCompany’s price exposure is reduced.
The use of derivatives is governed by policies adopted by the Board of Directors. The Company will only enterinto a derivative contract if there is an underlying identified exposure. Contracts are typically held to maturity. TheCompany does not engage in derivative trading activities and does not use derivatives for speculative purposes. TheCompany only uses hedge contracts that are denominated in the same currency or metal as the underlying exposure.
All derivatives are recorded on the balance sheet at their fair values. If the derivative is designated and effectiveas a hedge, depending upon the nature of the hedge, changes in the fair value of the derivative are either offsetagainst the change in the fair value of the hedged asset, liability or firm commitment through earnings or recognizedin other comprehensive income (OCI), a component of shareholders’ equity, until the hedged item is recognized inearnings. The ineffective portion of a derivative’s change in fair value, if any, is recognized in earnings immediately.If a derivative is not a hedge, changes in the fair value are adjusted through income immediately.
The following table summarizes the notional amount and the fair value of the Company’s outstandingderivatives as of December 31, 2010 and 2009:
(Thousands)NotionalAmount
FairValue
NotionalAmount
FairValue
December 31, 2010 December 31, 2009
Asset (liability)Foreign currency forward contracts
Yen . . . . . . . . . . . . . . . . . . . . . . . . . . . . . . . . . . . $19,319 $ (880) $ 6,562 $ 220Euro . . . . . . . . . . . . . . . . . . . . . . . . . . . . . . . . . . . 26,578 (663) 6,209 (93)Sterling. . . . . . . . . . . . . . . . . . . . . . . . . . . . . . . . . — — 375 (12)
Total . . . . . . . . . . . . . . . . . . . . . . . . . . . . . . . . . $45,897 $(1,543) $13,146 $ 115
Embedded copper derivative . . . . . . . . . . . . . . . . . . . . . $ — $ — $18,433 $(4,892)
The fair values of the outstanding derivatives are recorded as assets (if the derivatives are in a gain position) orliabilities (if the derivatives are in a loss position). The fair values will also be classified as short-term or long-termdepending upon their maturity dates. The balance sheet classification of the outstanding derivatives atDecember 31, 2010 and 2009 was as follows:
(Thousands) 2010 2009December 31,
Asset (liability)
Prepaid expenses . . . . . . . . . . . . . . . . . . . . . . . . . . . . . . . . . . . . . . . . . . . . . . . $ — $ 220
Other liabilities and accrued items . . . . . . . . . . . . . . . . . . . . . . . . . . . . . . . . . . (1,536) (4,997)
Other long-term liabilities. . . . . . . . . . . . . . . . . . . . . . . . . . . . . . . . . . . . . . . . . (7) —
Total . . . . . . . . . . . . . . . . . . . . . . . . . . . . . . . . . . . . . . . . . . . . . . . . . . . . . . $(1,543) $(4,777)
All of the foreign currency derivatives secured in 2010 and 2009 were designated as cash flow hedges. Changesin the fair values of these derivatives are recorded in OCI and charged or credited to income when the contracts
69

mature and the underlying hedged transactions occur. There were no precious metal hedge contracts outstanding asof December 31, 2010 or 2009.
A summary of the hedging relationships of the outstanding derivative financial instruments designated as cashflow hedges as of December 31, 2010 and 2009 and the pre-tax amounts transferred into income for the twelvemonths then ended follows.
(Thousands)
RecognizedIn OCI at
End of Period Location Amount Location Amount
Reclassified From OCIInto Income During Period
Recognized in Income onDerivative During Period
Effective Portion of Hedge Ineffective Portion of Hedge
Gain (loss)
2010Foreign currency contracts
Forward contracts . . . . . . . . . . . . . . . . $(1,543) Other-net $ 502 Other-net $ —
Total . . . . . . . . . . . . . . . . . . . . . . . . . . $(1,543) $ 502 $ —
2009Foreign currency contracts
Forward contracts . . . . . . . . . . . . . . . . $ 115 Other-net $ (810) Other-net $ —
Options (collars) . . . . . . . . . . . . . . . . . — Other-net 212 Other-net —
Total . . . . . . . . . . . . . . . . . . . . . . . . . . 115 (598) —
Precious metal forward contracts . . . . . . . — Cost of sales 478 Cost of sales —
Total . . . . . . . . . . . . . . . . . . . . . . . . . . . . $ 115 $ (120) $ —
The Company secured a debt obligation with an embedded copper derivative in 2009. This derivative providedan economic hedge for the Company’s copper inventory against movements in the market price of copper. However,the derivative did not qualify as a hedge for accounting purposes and changes in its fair value were charged againstincome in the current period. In 2010, the Company secured copper forward contracts that were designed to offsetchanges in the fair value of the embedded derivative and therefore limit the potential charges against income. TheCompany recorded losses of $0.6 million in 2010 and $4.9 million in 2009 due to changes in the fair values of thesederivative financial instruments as derivative ineffectiveness on the Consolidated Statements of Income and Loss.The debt obligation and the embedded derivative as well as the copper forward contracts matured in 2010.
The Company had an interest rate swap that was initially designated as a cash flow hedge. However, in 2003,the underlying hedged item was terminated early and the swap no longer qualified as a hedge. Ineffectiveness of$0.2 million was recorded in 2008 due to changes in the swap’s fair value as a result of movements in interest rates.The swap was terminated in the fourth quarter 2008.
Total derivative ineffectiveness expense was $0.6 million in 2010, $4.9 million in 2009 and $0.2 million in2008.
During the third quarter 2010, the Company secured a forward contract to sell a specified quantity of gold. Thecontract served as an economic hedge of gold purchased and held in inventory for use in manufacturing products forsale in the normal course of business. No hedge designation was assigned to the contract. The contract matured inthe third quarter 2010 and resulted in an immaterial realized gain of less than $0.1 million that was recorded in costof sales on the Consolidated Statement of Income and Loss.
The Company expects to relieve $1.5 million from OCI and charge other-net on the Consolidated Statement ofIncome and Loss in 2011.
70

Note I — Pensions and Other Post-retirement Benefits
The obligation and funded status of the Company’s pension and other post-retirement benefit plans are shownbelow. The Pension Benefits column aggregates defined benefit pension plans in the U.S., Germany and Englandand the U.S. supplemental retirement plan. The Other Benefits column includes the U.S. retiree medical and lifeinsurance plan.
(Thousands) 2010 2009 2010 2009Pension Benefits Other Benefits
Change in benefit obligationBenefit obligation at beginning of year. . . . . . . . . . . . . . . . . . $160,029 $145,524 $ 30,886 $ 32,786Service cost . . . . . . . . . . . . . . . . . . . . . . . . . . . . . . . . . . . . 5,135 4,463 273 289Interest cost . . . . . . . . . . . . . . . . . . . . . . . . . . . . . . . . . . . . 9,156 8,994 1,738 1,929Plan amendments. . . . . . . . . . . . . . . . . . . . . . . . . . . . . . . . . 738 — — —Actuarial (gain) loss. . . . . . . . . . . . . . . . . . . . . . . . . . . . . . . 13,317 8,171 1,774 (1,765)Benefit payments from fund . . . . . . . . . . . . . . . . . . . . . . . . . (6,478) (6,393) — —Benefit payments directly by Company . . . . . . . . . . . . . . . . . (96) (104) (2,661) (2,710)Expenses paid from assets . . . . . . . . . . . . . . . . . . . . . . . . . . (497) (392) — —Curtailment gain . . . . . . . . . . . . . . . . . . . . . . . . . . . . . . . . . — (547) — —Medicare Part D subsidy . . . . . . . . . . . . . . . . . . . . . . . . . . . — — 364 357Foreign currency exchange rate changes . . . . . . . . . . . . . . . . . (631) 313 — —
Benefit obligation at end of year . . . . . . . . . . . . . . . . . . . . . . 180,673 160,029 32,374 30,886
Change in plan assetsFair value of plan assets at beginning of year . . . . . . . . . . . . . 109,729 81,810 — —Actual return on plan assets . . . . . . . . . . . . . . . . . . . . . . . . . 15,367 15,944 — —Employer contributions . . . . . . . . . . . . . . . . . . . . . . . . . . . . 13,774 18,494 — —Benefit payments from fund . . . . . . . . . . . . . . . . . . . . . . . . . (6,478) (6,393) — —Expenses paid from assets . . . . . . . . . . . . . . . . . . . . . . . . . . (497) (392) — —Foreign currency exchange rate changes . . . . . . . . . . . . . . . . . (134) 266 — —
Fair value of plan assets at end of year . . . . . . . . . . . . . . . . . 131,761 109,729 — —
Funded status at end of year . . . . . . . . . . . . . . . . . . . . . . . . . $ (48,912) $ (50,300) $(32,374) $(30,886)
Amounts recognized in the Consolidated Balance Sheetsconsist of:
Other liabilities and accrued items . . . . . . . . . . . . . . . . . . . . . $ — $ — $ (2,863) $ (2,609)Retirement and post-employment benefits . . . . . . . . . . . . . . . . (48,912) (50,300) (29,511) (28,277)
$ (48,912) $ (50,300) $(32,374) $(30,886)
Amounts recognized in other comprehensive income (beforetax) consist of:
Net actuarial (gain) loss . . . . . . . . . . . . . . . . . . . . . . . . . . . . $ 73,008 $ 67,446 $ (441) $ (2,214)Net prior service (credit) cost . . . . . . . . . . . . . . . . . . . . . . . . (3,292) (4,560) 166 129
$ 69,716 $ 62,886 $ (275) $ (2,085)
Amortizations expected to be recognized during next fiscalyear (before tax):
Amortization of net loss . . . . . . . . . . . . . . . . . . . . . . . . . . . . $ 3,919 $ 2,834 $ — $ —Amortization of prior service credit . . . . . . . . . . . . . . . . . . . . (472) (530) (36) (36)
$ 3,447 $ 2,304 $ (36) $ (36)
Additional informationAccumulated benefit obligation for all defined benefit pension
plans . . . . . . . . . . . . . . . . . . . . . . . . . . . . . . . . . . . . . . . $175,927 $156,942 N/A N/AFor defined benefit pension plans with benefit obligations in
excess of plan assets:Aggregate benefit obligation . . . . . . . . . . . . . . . . . . . . . . . 176,654 160,029 N/A N/AAggregate fair value of plan assets . . . . . . . . . . . . . . . . . . . 127,133 109,729 N/A N/A
For defined benefit pension plans with accumulated benefitobligations in excess of plan assets:Aggregate accumulated benefit obligation . . . . . . . . . . . . . . 171,908 156,942 N/A N/AAggregate fair value of plan assets . . . . . . . . . . . . . . . . . . . 127,133 109,729 N/A N/A
71

Components of net periodic benefit cost and other amounts recognized in other comprehensive income
(Thousands) 2010 2009 2008 2010 2009 2008Pension Benefits Other Benefits
Net periodic benefit costService cost . . . . . . . . . . . . . . . . . . . . . . . . . . $ 5,135 $ 4,463 $ 5,297 $ 273 $ 289 $ 303
Interest cost . . . . . . . . . . . . . . . . . . . . . . . . . . 9,156 8,994 8,490 1,738 1,929 2,127
Expected return on plan assets . . . . . . . . . . . . (10,441) (9,746) (9,061) — — —
Amortization of prior service (benefit) . . . . . . (530) (549) (644) (36) (36) (36)
Recognized net actuarial loss . . . . . . . . . . . . . 2,834 1,557 1,186 — — —
Curtailment gain . . . . . . . . . . . . . . . . . . . . . . — (1,069) — — — —
Net periodic benefit cost . . . . . . . . . . . . . . . . $ 6,154 $ 3,650 $ 5,268 $1,975 $2,182 $2,394
(Thousands) 2010 2009 2008 2010 2009 2008Pension Benefits Other Benefits
Change in other comprehensive incomeOCI at beginning of year . . . . . . . . . . . . . . $62,886 $61,379 $21,337 $(2,085) $ (356) $ 933
Increase (decrease) in OCI:
Recognized during year — prior servicecost (credit) . . . . . . . . . . . . . . . . . . . . 530 549 644 36 36 36
Recognized during year — net actuarial(losses) gains . . . . . . . . . . . . . . . . . . . (2,834) (1,557) (1,225) — — —
Occurring during year — prior servicecost . . . . . . . . . . . . . . . . . . . . . . . . . . 739 — 39 — — —
Occurring during year — net actuariallosses (gains) . . . . . . . . . . . . . . . . . . . 8,390 1,974 40,677 1,774 (1,765) (1,325)
Other adjustments . . . . . . . . . . . . . . . . . . — 522 — — — —
Foreign currency exchange ratechanges . . . . . . . . . . . . . . . . . . . . . . . 5 19 (93) — — —
OCI at end of year . . . . . . . . . . . . . . . . . . . $69,716 $62,886 $61,379 $ (275) $(2,085) $ (356)
Summary of key valuation assumptions
2010 2009 2008 2010 2009 2008Pension Benefits Other Benefits
Weighted-average assumptions used to determine benefitobligations at fiscal year end
Discount rate . . . . . . . . . . . . . . . . . . . . . . . . . . . . . . . . . . . . . . 5.49% 5.86% N/A 5.13% 5.88% N/A
Rate of compensation increase . . . . . . . . . . . . . . . . . . . . . . . . . . 3.97% 3.00% N/A 4.00% 3.00% N/A
Weighted-average assumptions used to determine net cost forthe fiscal year
Discount rate . . . . . . . . . . . . . . . . . . . . . . . . . . . . . . . . . . . . . . 5.86% 6.65% 6.41% 5.88% 6.15% 6.50%
Expected long-term return on plan assets . . . . . . . . . . . . . . . . . . 8.18% 8.22% 8.21% N/A N/A N/A
Rate of compensation increase . . . . . . . . . . . . . . . . . . . . . . . . . . 2.99% 2.09% 4.34% 3.00% 2.00% 4.50%
The Company uses a December 31 measurement date for the above plans.
Effective January 1, 2011, the Company revised the expected long-term rate of return assumption used incalculating the annual expense for its domestic pension plan. This assumed expected long-term rate of return wasdecreased to 8.0% from 8.25%, with the impact being accounted for as a change in estimate.
72

Effective January 1, 2008, the Company revised the expected long-term rate of return assumption used incalculating the annual expense for its domestic pension plan. This assumed expected long-term rate of return wasdecreased to 8.25% from 8.5%, with the impact being accounted for as a change in estimate.
Management establishes the domestic expected long-term rate of return assumption by reviewing its historicaltrends and analyzing the current and projected market conditions in relation to the plan’s asset allocation and riskmanagement objectives. Consideration is given to both recent plan asset performance as well as plan assetperformance over various long-term periods of time, with an emphasis on the assumption being a prospective, long-term rate of return. Management consults with and considers the opinions of its outside investment advisors andactuaries when establishing the rate and reviews its assumptions with the Board of Directors. Management believesthat the 8.0% domestic expected long-term rate of return assumption is achievable and reasonable given currentmarket conditions and forecasts, asset allocations, investment policies and investment risk objectives.
The domestic rate of compensation increase assumption was changed from a flat 4.5% to a graded assumptionas of January 1, 2009. The graded assumption for the domestic rate of compensation increase is 2.0% for the 2009fiscal year, 3.0% for the 2010 fiscal year, 4.0% for the 2011 fiscal year and 4.5% for the 2012 fiscal year and later.
Assumptions for the defined benefit pension plans in Germany and England are determined separately fromthe U.S. plan assumptions, based on historical trends and current and projected market conditions in Germany andEngland. The plan in Germany is unfunded and the plan in England has assets that are approximately 4% of theCompany’s aggregated total fair value of plan assets as of year-end 2010.
Assumed health care trend rates at fiscal year end 2010 2009
Health care trend rate assumed for next year . . . . . . . . . . . . . . . . . . . . . . . . . . . . . . . 8.00% 8.00%
Rate that the trend rate gradually declines to (ultimate trend rate) . . . . . . . . . . . . . . . 5.00% 5.00%Year that the rate reaches the ultimate trend rate . . . . . . . . . . . . . . . . . . . . . . . . . . . . 2019 2016
Assumed health care cost trend rates have a significant effect on the amounts reported for the health care plans.A one-percentage-point change in assumed health care cost trend rates would have the following effects:
(Thousands) 2010 2009 2010 2009
1-Percentage-Point Increase
1-Percentage-Point Decrease
Effect on total of service and interest cost components . . . . . . . . . $ 35 $ 46 $ (32) $ (41)
Effect on post-retirement benefit obligation . . . . . . . . . . . . . . . . . . 682 629 (619) (573)
73

Plan Assets
The following tables present the fair values of the Company’s defined benefit pension plan assets as ofDecember 31, 2010 and 2009 by asset category. See Note H to the Consolidated Financial Statements for definitionsof fair value hierarchy.
(Thousands) Total Level 1 Level 2 Level 3December 31, 2010
Cash. . . . . . . . . . . . . . . . . . . . . . . . . . . . . . . . $ 5,617 $ 5,617 $ — $ —Equity securities:
U.S. (a). . . . . . . . . . . . . . . . . . . . . . . . . . . . 44,745 35,917 8,828 —
International (b) . . . . . . . . . . . . . . . . . . . . . 20,565 8,943 11,622 —
Emerging markets (c) . . . . . . . . . . . . . . . . . 12,300 12,084 216 —
Fixed income securities:
Intermediate-term bonds (d) . . . . . . . . . . . . . 16,387 16,387 — —
Short-term bonds (e) . . . . . . . . . . . . . . . . . . 10,642 10,642 — —
Global bonds (f) . . . . . . . . . . . . . . . . . . . . . 10,602 9,976 626 —
Other types of investments:
Real estate fund (g). . . . . . . . . . . . . . . . . . . . . 6,506 6,506 — —
Multi-strategy hedge funds (h). . . . . . . . . . . . . 3,851 — — $3,851
Private equity funds . . . . . . . . . . . . . . . . . . . . 546 — — 546
Total . . . . . . . . . . . . . . . . . . . . . . . . . . . . . . . $131,761 $106,072 $21,292 $4,397
(Thousands) Total Level 1 Level 2 Level 3December 31, 2009
Cash. . . . . . . . . . . . . . . . . . . . . . . . . . . . . . . . $ 16,331 $16,331 $ — $ —
Equity securities:
U.S. (a). . . . . . . . . . . . . . . . . . . . . . . . . . . . 26,590 19,179 7,411 —
International (b) . . . . . . . . . . . . . . . . . . . . . 11,773 4,741 7,032 —
Emerging markets (c) . . . . . . . . . . . . . . . . . 9,156 8,951 205 —
Fixed income securities:
Intermediate-term bonds (d) . . . . . . . . . . . . . 17,962 17,962 — —
Global bonds (f) . . . . . . . . . . . . . . . . . . . . . 18,101 17,583 518 —
Other types of investments:
Real estate fund (g). . . . . . . . . . . . . . . . . . . . . 5,523 5,523 — —
Multi-strategy hedge funds (h). . . . . . . . . . . . . 3,507 — — $3,507
Private equity funds . . . . . . . . . . . . . . . . . . . . 786 — — 786
Total . . . . . . . . . . . . . . . . . . . . . . . . . . . . . . . $109,729 $90,270 $15,166 $4,293
(a) Mutual funds that invest in various sectors of the U.S. market.
(b) Mutual funds that invest in non-U.S. companies primarily in developed countries that are generally consideredto be value stocks.
(c) Mutual funds that invest in non-U.S. companies in emerging market countries.
(d) Includes a mutual fund that employs a value-oriented approach to fixed income investment management.
(e) Includes a mutual fund that seeks a market rate of return for a fixed-income portfolio with low relativevolatility of returns, investing generally in U.S. and foreign debt securities maturing in five years or less.
(f) Mutual funds that invest in domestic and foreign sovereign securities, fixed income securities, mortgage-backed and asset-backed bonds, convertible bonds, high yield bonds and emerging market bonds.
74

(g) Includes a mutual fund that typically invests at least 80% of its assets in equity and debt securities of companiesin the real estate industry or related industries or in companies which own significant real estate assets at thetime of investment.
(h) Includes hedge funds that employ multiple strategies to multiple asset classes with low correlations.
The following table summarizes changes in the fair value of the Company’s defined benefit pension planLevel 3 assets measured using significant unobservable inputs during 2010 and 2009.
(Thousands)
Multi-strategy
Hedge Funds
PrivateEquityFunds Total
Balance as of January 1, 2009 . . . . . . . . . . . . . . . . . . . . . . . . . . $ 5,965 $ 781 $ 6,746
Actual return:
On assets still held at reporting date . . . . . . . . . . . . . . . . . . . . 787 (24) 763
On assets sold during the period . . . . . . . . . . . . . . . . . . . . . . (16) — (16)
Purchases, sales and settlements . . . . . . . . . . . . . . . . . . . . . . . . (3,229) 29 (3,200)
Balance as of December 31, 2009 . . . . . . . . . . . . . . . . . . . . . . . $ 3,507 $ 786 $ 4,293
Actual return:On assets still held at reporting date . . . . . . . . . . . . . . . . . . . . 686 66 752
On assets sold during the period . . . . . . . . . . . . . . . . . . . . . . 11 — 11
Purchases, sales and settlements . . . . . . . . . . . . . . . . . . . . . . . . (353) (306) (659)
Balance as of December 31, 2010 . . . . . . . . . . . . . . . . . . . . . . . $ 3,851 $ 546 $ 4,397
Plan withdrawals from the multi-strategy hedge fund partnerships may be made up to 25% of the value of thecapital account as of June 30 and December 31 of each calendar year upon written notice of at least thirty days. Anywithdrawals in excess of 25% must have at least three months written notice. The plan may withdraw up to 100% ofthe capital account of all other partnerships upon at least thirty day written notice.
The Company’s domestic defined benefit pension plan investment strategy, as approved by the Governanceand Organization Committee of the Board of Directors, is to employ an allocation of investments that will generatereturns equal to or better than the projected long-term growth of pension liabilities so that the plan will be self-funding. The return objective is to maximize investment return to achieve and maintain a 100% funded status overtime, taking into consideration required cash contributions. The allocation of investments is designed to maximizethe advantages of diversification while mitigating the risk and overall portfolio volatility to achieve the returnobjective. Risk is defined as the annual variability in value and is measured in terms of the standard deviation ofinvestment return. Under the Company’s investment policies, allowable investments include domestic equities,international equities, fixed income securities, cash equivalents and alternative securities (which include real estate,private venture capital investments and hedge funds). Ranges, in terms of a percentage of the total assets, areestablished for each allowable class of security. Derivatives may be used to hedge an existing security or as a riskreduction strategy. Current asset allocation guidelines are to invest 30% to 70% in equity securities, 20% to 50% infixed income securities and cash and up to 20% in alternative securities. Management reviews the asset allocationon a quarterly or more frequent basis and makes revisions as deemed necessary.
None of the plan assets noted above are invested in the Company’s common stock.
Cash Flows
Employer Contributions
The Company expects to contribute $8.8 million to its domestic defined benefit pension plan and $2.5 millionto its other benefit plans in 2011.
75

Estimated Future Benefit Payments
The following benefit payments, which reflect expected future service, as appropriate, are expected to be paid:
(Thousands) Pension BenefitsGross Benefit
Payment
Net ofMedicare
Part DSubsidy
Other Benefits
2011 . . . . . . . . . . . . . . . . . . . . . . . . . . . . . . . . . . . . . . . . $ 6,766 $ 2,863 $ 2,471
2012 . . . . . . . . . . . . . . . . . . . . . . . . . . . . . . . . . . . . . . . . 7,335 2,970 2,553
2013 . . . . . . . . . . . . . . . . . . . . . . . . . . . . . . . . . . . . . . . . 7,869 3,059 2,618
2014 . . . . . . . . . . . . . . . . . . . . . . . . . . . . . . . . . . . . . . . . 8,312 3,047 2,580
2015 . . . . . . . . . . . . . . . . . . . . . . . . . . . . . . . . . . . . . . . . 8,900 3,039 2,540
2016 through 2020. . . . . . . . . . . . . . . . . . . . . . . . . . . . . . 56,624 15,215 12,289
Other Benefit Plans
In addition to the plans shown above, the Company also has certain foreign subsidiaries with accrued unfundedpension and other post-employment arrangements. The liability for these arrangements was $3.2 million atDecember 31, 2010 and $2.9 million at December 31, 2009 and was included in retirement and post-employmentbenefits on the Consolidated Balance Sheets.
The Company also sponsors defined contribution plans available to substantially all U.S. employees. Companycontributions to the plans are based on matching a percentage of employee savings up to a specified savings level.The Company’s annual contributions were $1.3 million in 2010, $0.6 million in 2009 and $3.0 million in 2008. TheCompany reduced its matching percentage in half effective at the beginning of 2009, reduced its matchingpercentage to zero for the majority of its U.S. employees in the second quarter of 2009 and restored its matchingpercentage to half of its historical level in the second quarter of 2010.
Note J — Contingencies and Commitments
CBD Claims
The Company is a defendant in proceedings in various state and federal courts by plaintiffs alleging that theyhave contracted chronic beryllium disease (CBD) or related ailments as a result of exposure to beryllium. Plaintiffsin CBD cases seek recovery under theories of negligence and various other legal theories and seek compensatoryand punitive damages, in many cases of an unspecified sum. Spouses, if any, claim loss of consortium. AdditionalCBD claims may arise.
Management believes the Company has substantial defenses in these cases and intends to contest the suitsvigorously. Employee cases, in which plaintiffs have a high burden of proof, have historically involved relativelysmall losses to the Company. Third-party plaintiffs (typically employees of customers) face a lower burden of proofthan do the Company’s employees, but these cases have generally been covered by varying levels of insurance.
Claims filed by third-party plaintiffs alleging chronic beryllium disease filed prior to the end of 2022 arecovered by insurance if any portion of the alleged exposure period occurred prior to year end 2007. Both defenseand indemnity costs are covered subject to an annual $1.0 million deductible and other terms and provisions.
Although it is not possible to predict the outcome of the litigation pending against the Company and itssubsidiaries, the Company provides for costs related to these matters when a loss is probable and the amount isreasonably estimable. Litigation is subject to many uncertainties, and it is possible that some of the actions could bedecided unfavorably in amounts exceeding the Company’s reserves. An unfavorable outcome or settlement of apending CBD case or additional adverse media coverage could encourage the commencement of additional similarlitigation. The Company is unable to estimate its potential exposure to unasserted claims.
The Company recorded a reserve for CBD litigation of $0.4 million as of December 31, 2010 and $0.6 millionat December 31, 2009. The reserve is included in other long-term liabilities on the Consolidated Balance Sheets.
76

The Company also recorded an asset of $0.1 million as of December 31, 2010 and $0.3 million as of December 31,2009 for recoveries from insurance carriers on the outstanding insured claims. The asset is included in other assetson the Consolidated Balance Sheets. The Company made settlement payments for beryllium litigation of less than$0.1 million in 2010. In 2009, beryllium litigation settlement payments totaled $0.9 million and were fully insured.
While the Company is unable to predict the outcome of the current or future CBD proceedings, based uponcurrently known facts and assuming collectibility of insurance, the Company does not believe that resolution of thecurrent or future beryllium proceedings will have a material adverse effect on the financial condition or cash flow ofthe Company. However, the Company’s results of operations could be materially affected by unfavorable results inone or more of these cases.
Environmental Proceedings
The Company has an active program for environmental compliance that includes the identification ofenvironmental projects and estimating their impact on the Company’s financial performance and availableresources. Environmental expenditures that relate to current operations, such as wastewater treatment andcontrol of airborne emissions, are either expensed or capitalized as appropriate. The Company records reservesfor the probable costs for environmental remediation projects. The Company’s environmental engineers performroutine ongoing analyses of the remediation sites and will use outside consultants to assist in their analyses fromtime to time. Accruals are based upon their analyses and are established at either the best estimate or, absent a bestestimate, at the low end of the estimated range of costs. The accruals are revised for the results of ongoing studiesand for differences between actual and projected costs. The accruals may also be affected by rulings andnegotiations with regulatory agencies. The timing of payments often lags the accrual, as environmentalprojects typically require a number of years to complete.
The undiscounted reserve balance at the beginning of the year, the amounts expensed and paid and the balanceat the end of the year for 2010 and 2009 are as follows:
(Thousands) 2010 2009
Reserve balance at beginning of year . . . . . . . . . . . . . . . . . . . . . . . . . . . . . . . . $(5,592) $(6,272)
Expensed . . . . . . . . . . . . . . . . . . . . . . . . . . . . . . . . . . . . . . . . . . . . . . . . . . . . . (262) (353)
Paid . . . . . . . . . . . . . . . . . . . . . . . . . . . . . . . . . . . . . . . . . . . . . . . . . . . . . . . . . 653 1,033
Reserve balance at end of year . . . . . . . . . . . . . . . . . . . . . . . . . . . . . . . . . . . . . $(5,201) $(5,592)
Ending balance recorded in:
Other liabilities and accrued items . . . . . . . . . . . . . . . . . . . . . . . . . . . . . . . . . . $ (707) $ (953)
Other long-term liabilities. . . . . . . . . . . . . . . . . . . . . . . . . . . . . . . . . . . . . . . . . (4,494) (4,639)
The majority of the spending in both 2010 and 2009 was for clean-up costs associated with the Company’sformer headquarters building; this facility had previously been used for light manufacturing and research anddevelopment work. Upon completion of the project, the facility was donated to a non-profit organization in thefourth quarter 2010. Funds were also spent on remediation efforts and related analysis work on smaller projects in2010 and 2009.
The environmental reserves cover existing or currently foreseen projects. It is possible that additionalenvironmental losses may occur beyond the current reserve balances, the extent of which cannot be estimated.
Long-term Obligation
The Company has a long-term supply agreement with Ulba/Kazatomprom of the Republic of Kazakhstan andits marketing representative, Nukem, Inc. of Connecticut, for the purchase of approximately 1.6 million pounds ofberyllium copper master alloy that expires on December 31, 2011. The pricing for the beryllium content of thematerial is fixed while the price for the copper content fluctuates based upon the monthly average LME marketprice. Purchase commitments in 2011 total approximately $9.3 million. Purchases under this contract totaled$2.7 million in 2010. The material purchased from Nukem is used in the manufacture of beryllium-containing alloyproducts by the Performance Alloys segment.
77

The Company had a long-term supply arrangement with Nukem that terminated on December 31, 2008.Purchases of beryllium-containing materials from Nukem under this arrangement were $8.9 million in 2008.Beginning in 2009, purchases from Nukem were made from time to time through the Company’s normal purchasingpractices.
Other
The Company is subject to various other legal or other proceedings that relate to the ordinary course of itsbusiness. The Company believes that the resolution of these proceedings, individually or in the aggregate, will nothave a material adverse impact upon the Company’s consolidated financial statements.
The Company has outstanding letters of credit totaling $26.0 million related to workers’ compensation,consigned precious metal guarantees, environmental remediation issues and other matters that expire in 2011.
Note K — Common Stock and Stock-based Compensation
The Company has five million shares of Serial Preferred Stock authorized (no par value), none of which havebeen issued. Certain terms of the Serial Preferred Stock, including dividends, redemption and conversion, will bedetermined by the Board of Directors prior to issuance.
A reconciliation of the changes in the number of shares of common stock issued is as follows (in thousands):
Issued as of January 1, 2008. . . . . . . . . . . . . . . . . . . . . . . . . . . . . . . . . . . . . . . . . . . . . . . . 26,687
Exercise of stock options . . . . . . . . . . . . . . . . . . . . . . . . . . . . . . . . . . . . . . . . . . . . . . . . . . 12
Vesting of restricted shares . . . . . . . . . . . . . . . . . . . . . . . . . . . . . . . . . . . . . . . . . . . . . . . . . 8
Issued as of December 31, 2008 . . . . . . . . . . . . . . . . . . . . . . . . . . . . . . . . . . . . . . . . . . . . . 26,707
Exercise of stock options . . . . . . . . . . . . . . . . . . . . . . . . . . . . . . . . . . . . . . . . . . . . . . . . . . 32
Vesting of performance-restricted shares . . . . . . . . . . . . . . . . . . . . . . . . . . . . . . . . . . . . . . . 61
Issued as of December 31, 2009 . . . . . . . . . . . . . . . . . . . . . . . . . . . . . . . . . . . . . . . . . . . . . 26,800
Exercise of stock options and SARs . . . . . . . . . . . . . . . . . . . . . . . . . . . . . . . . . . . . . . . . . . 162
Vesting of performance-restricted shares . . . . . . . . . . . . . . . . . . . . . . . . . . . . . . . . . . . . . . . 6
Issued as of December 31, 2010 . . . . . . . . . . . . . . . . . . . . . . . . . . . . . . . . . . . . . . . . . . . . . 26,968
Stock incentive plans (the 2006 Stock Incentive Plan and the 2006 Non-employee Director Equity Plan) wereapproved at the May 2, 2006 annual meeting of shareholders. These plans authorize the granting of option rights,stock appreciation rights, performance restricted shares, performance shares, performance units and restrictedshares and replaced the 1995 Stock Incentive Plan and the 1997 Stock Incentive Plan for Non-employee Directors,although there are still options outstanding under these plans.
Stock Options
Stock options may be granted to employees or non-employee directors of the Company. Option rights entitlethe optionee to purchase common shares at a price equal to or greater than the market value on the date of grant.Option rights granted to employees generally become exercisable (i.e., vest) over a four-year period and expire tenyears from the date of the grant. Options granted to employees may also be issued with shorter vesting periods.Options granted to non-employee directors vest in six months and expire ten years from the date of the grant. Thenumber of options available to be issued is established in plans approved by shareholders. The exercise of options isgenerally satisfied by the issuance of new shares.
Compensation cost for options is determined at the date of the award through the use of a pricing model andcharged against income over the vesting period for each award. There was no compensation cost in 2010, 2009 or2008, as all options were fully vested prior to 2008.
78

The following table summarizes the Company’s stock option activity during 2010:
(Shares in thousands)Number of
Options
Weighted-averageExercisePrice Per
Share
AggregateIntrinsic
Value
Weighted-average
RemainingTerm
Outstanding at December 31, 2009 . . . . . . . . . . . 320 $15.83
Exercised . . . . . . . . . . . . . . . . . . . . . . . . . . . . . (154) 17.05
Outstanding at December 31, 2010 . . . . . . . . . . . 166 14.69 $3,969,000 2.90 years
Vested and expected to vest as of December 31,2010 . . . . . . . . . . . . . . . . . . . . . . . . . . . . . . . 166 14.69 3,969,000 2.90 years
Exercisable at December 31, 2010 . . . . . . . . . . . 166 14.69 3,969,000 2.90 years
Summarized information on options outstanding as of December 31, 2010 is as follows:
NumberOutstanding
and Exercisable(Thousands)
Weighted-average
RemainingLife (Years)
Weighted-averageExercise
Price
Range of Option Prices$5.55-$8.10 . . . . . . . . . . . . . . . . . . . . . . . . . . . . . . . . . . . . 30 2.27 $ 6.20
$12.15-$14.80 . . . . . . . . . . . . . . . . . . . . . . . . . . . . . . . . . . 27 2.10 12.97
$15.97-$17.68 . . . . . . . . . . . . . . . . . . . . . . . . . . . . . . . . . . 103 3.46 17.22
$20.64-$22.43 . . . . . . . . . . . . . . . . . . . . . . . . . . . . . . . . . . 6 0.18 21.83
166 2.90 $14.69
Cash received from the exercise of stock options totaled $2.6 million in 2010, $0.5 million in 2009 and$0.2 million in 2008. The tax benefit realized from tax deductions from exercises was $0.8 million in 2010,$0.1 million in 2009 and $0.5 million in 2008. The total intrinsic value of options exercised during the years endedDecember 31, 2010, 2009 and 2008 was $2.3 million, $0.2 million and $0.1 million, respectively.
Restricted Stock
The Company may grant restricted stock to employees and non-employee directors of the Company. Theseshares must be held and not disposed of for a designated period of time as defined at the date of the grant and areforfeited should the holder’s employment terminate during the restriction period. The fair market value of therestricted shares is determined on the date of the grant and is amortized over the restriction period, which is typicallythree years.
The fair value of the restricted stock is based on the stock price on the date of grant. The weighted-averagegrant date fair value for 2010, 2009 and 2008 was $22.65, $15.67 and $28.67, respectively.
Compensation cost was $2.3 million in 2010, $2.4 million in 2009 and $1.7 million in 2008. The unamortizedcompensation cost on the outstanding restricted stock was $2.2 million as of December 31, 2010 and is expected tobe amortized over a weighted-average period of 18 months.
79

The following table summarizes the restricted stock activity during 2010:
(Shares in thousands)Number of
Shares
Weighted-average
Grant DateFair Value
Outstanding at December 31, 2009 . . . . . . . . . . . . . . . . . . . . . . . . . . . . . . . 283 $23.11
Granted . . . . . . . . . . . . . . . . . . . . . . . . . . . . . . . . . . . . . . . . . . . . . . . . . . . 88 22.65
Vested . . . . . . . . . . . . . . . . . . . . . . . . . . . . . . . . . . . . . . . . . . . . . . . . . . . . (62) 21.43
Forfeited . . . . . . . . . . . . . . . . . . . . . . . . . . . . . . . . . . . . . . . . . . . . . . . . . . (17) 19.47
Outstanding at December 31, 2010 . . . . . . . . . . . . . . . . . . . . . . . . . . . . . . . 292 $19.50
Long-term Incentive Plans
Under long-term incentive plans, executive officers and selected other employees receive cash or stock awardsbased upon the Company’s performance over the defined period, typically three years. Awards may vary based uponthe degree to which actual performance exceeds the pre-determined threshold, target and maximum performancelevels at the end of the performance periods. Payouts may be subjected to attainment of threshold performanceobjectives.
Compensation expense is based upon the performance projections for the three-year plan period, thepercentage of requisite service rendered and the fair market value of the Company’s common stock on thedate of the grant. The offset to the compensation expense for the portion of the award to be settled in shares isrecorded within shareholders’ equity and was less than $0.1 million for 2010, ($0.3) million for 2009 and$0.1 million for 2008. The related balance in shareholders’ equity was less than $0.1 million as of December 31,2010.
In the first quarter 2010, approximately 8,000 shares of common stock were issued to participants for theirachievement under the 2007-2009 long-term incentive plan.
In the first quarter 2011, approximately 1,300 shares of common stock will be issued to participants for theirachievement under the just completed 2008-2010 long-term incentive plan. With the completion of this plan, thereare no other outstanding long-term incentive plans.
Directors Deferred Compensation
Non-employee directors may defer all or part of their fees into shares of the Company’s common stock. Thefair value of the deferred shares is determined at the share acquisition date and is recorded within shareholders’equity. Subsequent changes in the fair value of the Company’s common stock do not impact the recorded values ofthe shares.
Prior to December 31, 2004, the non-employee directors had the election to defer their fees into shares of theCompany’s common stock or other specific investments. The directors could also transfer their deferred amountsamong election choices. The fair value of the deferred shares is determined at the acquisition date and recordedwithin shareholders’ equity with the offset recorded as a liability. Subsequent changes in the fair market value of theCompany’s common stock were reflected as a change in the liability and an increase or decrease to expense.Effective April 1, 2009, an amendment was adopted for this plan that no longer allows the participants to exchangeinto or out of the Company’s common stock, resulting in the elimination of the market value adjustment and thereclassification of the liability to equity.
80

The following table summarizes the stock activity for the directors’ deferred compensation plan during 2010:
(Shares in thousands)Number of
Shares
Weighted-average
Grant DateFair Value
Outstanding at December 31, 2009 . . . . . . . . . . . . . . . . . . . . . . . . . . . . . . . 107 $27.29
Granted . . . . . . . . . . . . . . . . . . . . . . . . . . . . . . . . . . . . . . . . . . . . . . . . . . . 13 25.13
Outstanding at December 31, 2010 . . . . . . . . . . . . . . . . . . . . . . . . . . . . . . . 120 $27.05
The Company recorded an expense for the directors’ deferred compensation plan of $0.1 million in 2009 andincome of $1.2 million in 2008. There was no income or expense associated with this plan recorded in 2010 as aresult of the 2009 amendment. During the years ended December 31, 2010, 2009 and 2008, the weighted-averagegrant date fair value of shares granted was $25.13, $14.74 and $24.18, respectively.
Stock Appreciation Rights
The Company may grant stock appreciation rights (SARs) to certain employees and non-employee directors.Upon exercise of vested SARs, the participant will receive a number of shares of common stock equal to the spread(the difference between the market price of the Company’s common stock at the time of the exercise and the strikeprice established in the SARs agreement) divided by the common stock price. The strike price of the SARs is equalto or greater than the market value of the Company’s common stock on the day of the grant. The number of SARsavailable to be issued is established by plans approved by the shareholders. The vesting period and the life of theSARs are established in the SARs agreement at the time of the grant. The exercise of the SARs is satisfied by theissuance of treasury shares. The SARs typically vest three years from the date of grant and expire in ten years.
The following table summarizes the Company’s SARs activity during 2010:
(Shares in thousands)Number of
SARs
Weighted-averageExercisePrice per
Share
AggregateIntrinsic
Value
Weighted-average
RemainingTerm
Outstanding at December 31, 2009 . . . . . . . . . . 530 $19.80
Granted . . . . . . . . . . . . . . . . . . . . . . . . . . . . . . 212 21.24
Exercised . . . . . . . . . . . . . . . . . . . . . . . . . . . . (45) 24.03
Outstanding at December 31, 2010 . . . . . . . . . . 697 19.96 $13,244,000 8.01 years
Vested and expected to vest as ofDecember 31, 2010 . . . . . . . . . . . . . . . . . . . 697 19.96 13,244,000 8.01 years
Exercisable at December 31, 2010 . . . . . . . . . . 105 31.65 967,000 5.63 years
The fair value of the SARs granted in 2010 was $11.51. The fair value will be amortized to compensation coston a straight-line basis over the three-year vesting period. Compensation cost was $1.8 million, $1.4 million and$0.8 million in 2010, 2009 and 2008, respectively and was included in selling, general and administrative expense.The unamortized compensation cost balance was $2.8 million as of December 31, 2010.
81

Summarized information on SARs outstanding as of December 31, 2010 follows:
SARs Prices
NumberOutstanding(Thousands)
Weighted-average
RemainingLife (Years)
Weighted-averageExercise
Price
$15.01 . . . . . . . . . . . . . . . . . . . . . . . . . . . . . . . . . . . . . . . . . . 350 8.12 $15.01
$21.24 . . . . . . . . . . . . . . . . . . . . . . . . . . . . . . . . . . . . . . . . . . 212 9.15 21.24
$24.03 . . . . . . . . . . . . . . . . . . . . . . . . . . . . . . . . . . . . . . . . . . 66 5.34 24.03
$27.78 . . . . . . . . . . . . . . . . . . . . . . . . . . . . . . . . . . . . . . . . . . 30 7.13 27.78
$44.72 . . . . . . . . . . . . . . . . . . . . . . . . . . . . . . . . . . . . . . . . . . 39 6.13 44.72
697 8.01 $19.96
The SARs granted at $24.03 and $44.72 are exercisable.
The fair value of the SARs was estimated on the grant date using the Black-Scholes pricing model with thefollowing assumptions:
2010 2009 2008
Risk-free interest rate . . . . . . . . . . . . . . . . . . . . . . . . . . . . . . . . . . . . . . . . . . . 0.11% 0.31% 2.14%Dividend yield . . . . . . . . . . . . . . . . . . . . . . . . . . . . . . . . . . . . . . . . . . . . . . . . 0% 0% 0%
Volatility . . . . . . . . . . . . . . . . . . . . . . . . . . . . . . . . . . . . . . . . . . . . . . . . . . . . 58.0% 55.0% 49.2%
Expected lives (in years) . . . . . . . . . . . . . . . . . . . . . . . . . . . . . . . . . . . . . . . . 6.5 6.5 6.5
The risk-free rate of return was based upon the three-month Treasury bill rate at the time the SARs weregranted. The Company has not paid a dividend since 2001. The share price volatility was calculated based upon theactual closing prices of the Company’s shares at month end over a period of approximately ten years prior to thegranting of the SARs. This approach to measuring volatility is consistent with the approach used to calculate thevolatility assumption in the valuation of stock options. Prior analyses indicated that the Company’s employee stockoptions have an average life of approximately six years. Prior to 2006, the Company had not granted SARs in asignificant number of years. Management believes that the SARs have similar features and should function in amanner similar to employee stock options.
Note L — Other Comprehensive Income
The following table summarizes the cumulative net gain (loss) by component, net of tax, within othercomprehensive income as of December 31, 2010, 2009 and 2008:
(Thousands) 2010 2009 2008December 31,
Foreign currency translation adjustment . . . . . . . . . . . . . . . . . . . $ 3,989 $ 2,324 $ 2,346
Derivative financial instruments (net of taxes of ($1,943) in2010, ($1,362) in 2009 and ($1,808) in 2008) . . . . . . . . . . . . . 399 1,477 652
Pension and other retirement plan adjustment (net of taxes of($13,436) in 2010, ($10,316) in 2009 and ($10,224) in2008) . . . . . . . . . . . . . . . . . . . . . . . . . . . . . . . . . . . . . . . . . . . (56,004) (50,485) (50,799)
Total . . . . . . . . . . . . . . . . . . . . . . . . . . . . . . . . . . . . . . . . . . . . . $(51,616) $(46,684) $(47,801)
82

Note M — Segment Reporting and Geographic Information
In the fourth quarter 2010, the names of the Company’s four reportable segments were changed. AdvancedMaterial Technologies and Services has become Advanced Material Technologies, Specialty Engineered Alloyswas revised to Performance Alloys, Beryllium and Beryllium Composites was shortened to Beryllium andComposites and Engineered Material Systems was changed to Technical Materials. These changes onlyaffected the segment names as the segments’ make up, reporting structures and how they are evaluatedremained unchanged from previous periods.
Beginning in 2009, the operating results for Zentrix Technologies Inc., a small, wholly owned subsidiary, areincluded in the Advanced Material Technologies segment. Previously, this operation was included in the All Othercolumn. This change was made because the management of Advanced Material Technologies assumedresponsibility for the operation and this structure is consistent with the internal reporting used by theChairman of the Board in evaluating operations. Prior year results have been recast to reflect this change.
(Thousands)
AdvancedMaterial
TechnologiesPerformance
Alloys
Berylliumand
CompositesTechnicalMaterials Subtotal
AllOther Total
2010Sales to external customers . . . . . . . . $878,994 $293,757 $ 61,894 $67,450 $1,302,095 $ 219 $1,302,314
Intersegment sales . . . . . . . . . . . . . . 1,718 6,086 397 2,597 10,798 — 10,798
Operating profit (loss) . . . . . . . . . . . 39,454 27,150 10,046 5,331 81,981 (8,348) 73,633
Depreciation, depletion andamortization . . . . . . . . . . . . . . . . . 16,443 14,186 1,070 2,449 34,148 1,246 35,394
Expenditures for long-lived assets . . . 5,170 17,060 29,123 950 52,303 1,359 53,662
Assets. . . . . . . . . . . . . . . . . . . . . . . 339,490 219,094 119,117 22,751 700,452 34,958 735,410
2009Sales to external customers . . . . . . . . $460,837 $172,507 $ 47,030 $34,749 $ 715,123 $ 63 $ 715,186
Intersegment sales . . . . . . . . . . . . . . 639 2,555 176 1,493 4,863 — 4,863
Operating profit (loss) . . . . . . . . . . . 22,622 (32,273) 2,121 (2,526) (10,056) (9,429) (19,485)
Depreciation, depletion andamortization . . . . . . . . . . . . . . . . . 11,642 15,937 850 2,361 30,790 1,149 31,939
Expenditures for long-lived assets . . . 4,496 3,802 34,542 430 43,270 1,711 44,981Assets. . . . . . . . . . . . . . . . . . . . . . . 274,949 191,806 81,073 21,252 569,080 52,873 621,953
2008Sales to external customers . . . . . . . . $480,327 $299,867 $ 63,604 $65,913 $ 909,711 $ — $ 909,711
Intersegment sales . . . . . . . . . . . . . . 2,332 776 452 1,405 4,965 — 4,965
Operating profit (loss) . . . . . . . . . . . 10,847 5,846 8,372 5,931 30,996 (2,925) 28,071
Depreciation, depletion andamortization . . . . . . . . . . . . . . . . . 10,152 18,246 740 2,273 31,411 2,415 33,826
Expenditures for long-lived assets . . . 7,901 9,145 13,165 1,145 31,356 4,580 35,936
Assets. . . . . . . . . . . . . . . . . . . . . . . 215,700 239,810 54,224 23,087 532,821 49,076 581,897
Intersegment sales are eliminated in consolidation. The sales to external customers are presented net ofintersegment sales. Segments are evaluated at the operating profit level.
The All Other column includes the parent company expenses, the operating results for Materion Services Inc.(formerly BEM Services, Inc.), a wholly owned subsidiary, and other corporate charges. Materion Services Inc.provides administrative and financial services to the other businesses in the Company on a cost-plus basis.
The assets shown in the All Other column include the assets used by Materion Services Inc. and the parentcompany as well as cash and long-term deferred income taxes.
83

Sales from U.S. operations to external domestic and foreign customers were $1,079.7 million in 2010,$540.4 million in 2009 and $692.6 million in 2008. Sales attributed to countries based upon the location ofcustomers and long-lived assets, which include property, plant and equipment, intangible assets and goodwill,deployed by country are as follows:
(Thousands) 2010 2009 2008
Sales
United States . . . . . . . . . . . . . . . . . . . . . . . . . . . . . . . . . . . $ 933,264 $466,031 $576,141
All other . . . . . . . . . . . . . . . . . . . . . . . . . . . . . . . . . . . . . . 369,050 249,155 333,570
Total . . . . . . . . . . . . . . . . . . . . . . . . . . . . . . . . . . . . . . . . . $1,302,314 $715,186 $909,711
Long-lived assets
United States . . . . . . . . . . . . . . . . . . . . . . . . . . . . . . . . . . . $ 363,738 $321,141 $260,353
All other . . . . . . . . . . . . . . . . . . . . . . . . . . . . . . . . . . . . . . 11,914 12,553 13,626
Total . . . . . . . . . . . . . . . . . . . . . . . . . . . . . . . . . . . . . . . . . $ 375,652 $333,694 $273,979
No individual country, other than the United States, or customer accounted for 10% or more of the Company’ssales for the years presented. Sales outside the United States are primarily to Asia and Europe.
Note N — Litigation Settlement Gain
In the fourth quarter 2008, the Company reached an agreement to settle a lawsuit in which the Company soughtto recover its rights under a previously signed indemnity agreement with a customer. The settlement of $1.1 million,net of legal fees, was recorded as a litigation settlement gain on the Consolidated Statement of Income and Loss in2008. The cash was received in 2008.
There were no material litigation settlement gains in either 2010 or 2009.
Note O — Other-net
Other-net expense is summarized for 2010, 2009 and 2008 as follows:
(Thousands) 2010 2009 2008Income (Expense)
Foreign currency exchange/translation gain (loss) . . . . . . . . . . . . . $ (759) $ (657) $ (3,731)
Amortization of intangible assets . . . . . . . . . . . . . . . . . . . . . . . . . (6,393) (4,036) (3,522)
Metal consignment fees . . . . . . . . . . . . . . . . . . . . . . . . . . . . . . . . (6,539) (3,324) (4,530)
Changes to earn out valuation . . . . . . . . . . . . . . . . . . . . . . . . . . . 848 — —
Other items . . . . . . . . . . . . . . . . . . . . . . . . . . . . . . . . . . . . . . . . . (1,984) (1,465) (1,864)
Total . . . . . . . . . . . . . . . . . . . . . . . . . . . . . . . . . . . . . . . . . . . . . . $(14,827) $(9,482) $(13,647)
Other items include bad debt expense, cash discounts, gains and losses from the sale of fixed assets and othernon-operating items.
84

Note P — Interest
Interest expense associated with active construction and mine development projects is capitalized andamortized over the future useful lives of the related assets. The following chart summarizes the interestincurred, capitalized and paid, as well as the amortization of capitalized interest for 2010, 2009 and 2008.
(Thousands) 2010 2009 2008
Interest incurred . . . . . . . . . . . . . . . . . . . . . . . . . . . . . . . . . . . . . . . . . $2,696 $1,411 $2,365Less capitalized interest. . . . . . . . . . . . . . . . . . . . . . . . . . . . . . . . . . . . 31 112 370
Total net expense . . . . . . . . . . . . . . . . . . . . . . . . . . . . . . . . . . . . . . . . $2,665 $1,299 $1,995
Interest paid . . . . . . . . . . . . . . . . . . . . . . . . . . . . . . . . . . . . . . . . . . . . $2,225 $ 898 $2,193
Amortization of capitalized interest included in cost of sales . . . . . . . . $ 499 $ 517 $ 595
The difference in expense among 2010, 2009 and 2008 was primarily due to changes in the level of outstandingdebt, capital leases and the average borrowing rate. Amortization of deferred financing costs within interest expensewas $0.5 million in 2010 and $0.4 million in each of 2009 and 2008.
Note Q — Income Taxes
Income (loss) before income taxes and income taxes (benefit) are comprised of the following:
(Thousands) 2010 2009 2008
Income (loss) before income taxes:Domestic . . . . . . . . . . . . . . . . . . . . . . . . . . . . . . . . . . . . . . . . . $65,489 $(21,288) $24,646Foreign. . . . . . . . . . . . . . . . . . . . . . . . . . . . . . . . . . . . . . . . . . . 5,479 504 1,430
Total income (loss) before income taxes . . . . . . . . . . . . . . . . . . $70,968 $(20,784) $26,076
Income taxes (benefit):Current income taxes:
Domestic . . . . . . . . . . . . . . . . . . . . . . . . . . . . . . . . . . . . . . . $10,130 $ 1,018 $ 659Foreign . . . . . . . . . . . . . . . . . . . . . . . . . . . . . . . . . . . . . . . . . 788 618 904
Total current . . . . . . . . . . . . . . . . . . . . . . . . . . . . . . . . . . . . . 10,918 1,636 1,563Deferred income taxes:
Domestic . . . . . . . . . . . . . . . . . . . . . . . . . . . . . . . . . . . . . . . $14,075 $(10,241) $ 6,267Foreign . . . . . . . . . . . . . . . . . . . . . . . . . . . . . . . . . . . . . . . . . 719 (107) (268)Valuation allowance . . . . . . . . . . . . . . . . . . . . . . . . . . . . . . . (1,171) 283 157
Total deferred . . . . . . . . . . . . . . . . . . . . . . . . . . . . . . . . . . 13,623 (10,065) 6,156
Total income taxes (benefit) . . . . . . . . . . . . . . . . . . . . . . . . $24,541 $ (8,429) $ 7,719
The reconciliation of the federal statutory and effective income tax rates follows:
2010 2009 2008
Federal statutory rate . . . . . . . . . . . . . . . . . . . . . . . . . . . . . . . . . . . . . . . . . . 35.0% (35.0)% 35.0%State and local income taxes, net of federal tax effect . . . . . . . . . . . . . . . . . . 0.9 (1.9) 2.1Effect of excess of percentage depletion over cost depletion . . . . . . . . . . . . . . (2.5) (2.3) (5.4)Medicare Part D . . . . . . . . . . . . . . . . . . . . . . . . . . . . . . . . . . . . . . . . . . . . . . 2.2 — —Manufacturing production deduction . . . . . . . . . . . . . . . . . . . . . . . . . . . . . . . (1.9) (1.3) (1.5)Officers’ compensation . . . . . . . . . . . . . . . . . . . . . . . . . . . . . . . . . . . . . . . . . 1.5 0.1 0.7Adjustment to unrecognized tax benefits . . . . . . . . . . . . . . . . . . . . . . . . . . . . 0.8 (3.4) (5.0)Taxes on foreign source income . . . . . . . . . . . . . . . . . . . . . . . . . . . . . . . . . . (1.0) 0.9 0.6Other items . . . . . . . . . . . . . . . . . . . . . . . . . . . . . . . . . . . . . . . . . . . . . . . . . (0.4) 2.3 3.1
Effective tax rate (benefit) . . . . . . . . . . . . . . . . . . . . . . . . . . . . . . . . . . . . . 34.6% (40.6)% 29.6%
85

Included in domestic income taxes, as shown in the Consolidated Statements of Income and Loss, are$1.0 million, $(0.6) million, and $0.8 million of state and local income taxes in 2010, 2009 and 2008, respectively.
The Company had domestic and foreign income tax payments (refunds) of $8.8 million, $(4.1) million and$8.6 million in 2010, 2009 and 2008, respectively.
Deferred tax assets and liabilities are determined based on temporary differences between the financialreporting bases and the tax bases of assets and liabilities. Deferred taxes recorded in the Consolidated BalanceSheets consist of the following:
(Thousands) 2010 2009December 31,
Asset (liability)
Post-retirement benefits other than pensions . . . . . . . . . . . . . . . . . . . . . . . . . $ 10,995 $ 12,141
Alternative minimum tax credit . . . . . . . . . . . . . . . . . . . . . . . . . . . . . . . . . . . — 4,211
Other reserves . . . . . . . . . . . . . . . . . . . . . . . . . . . . . . . . . . . . . . . . . . . . . . . 9,848 8,088
Environmental reserves . . . . . . . . . . . . . . . . . . . . . . . . . . . . . . . . . . . . . . . . . 1,886 1,975
Inventory . . . . . . . . . . . . . . . . . . . . . . . . . . . . . . . . . . . . . . . . . . . . . . . . . . . 3,242 7,771
Pensions. . . . . . . . . . . . . . . . . . . . . . . . . . . . . . . . . . . . . . . . . . . . . . . . . . . . 15,741 15,527
Derivative instruments and hedging activities. . . . . . . . . . . . . . . . . . . . . . . . . 789 1,920
Net operating loss and credit carryforwards . . . . . . . . . . . . . . . . . . . . . . . . . . 3,044 5,095
Miscellaneous . . . . . . . . . . . . . . . . . . . . . . . . . . . . . . . . . . . . . . . . . . . . . . . 381 380
Subtotal . . . . . . . . . . . . . . . . . . . . . . . . . . . . . . . . . . . . . . . . . . . . . . . . . . . . 45,926 57,108
Valuation allowance . . . . . . . . . . . . . . . . . . . . . . . . . . . . . . . . . . . . . . . . . . . (2,525) (3,696)
Total deferred tax assets . . . . . . . . . . . . . . . . . . . . . . . . . . . . . . . . . . . . 43,401 53,412
Depreciation . . . . . . . . . . . . . . . . . . . . . . . . . . . . . . . . . . . . . . . . . . . . . . . . . (23,970) (24,674)
Amortization . . . . . . . . . . . . . . . . . . . . . . . . . . . . . . . . . . . . . . . . . . . . . . . . (8,601) (8,248)
Capitalized interest expense . . . . . . . . . . . . . . . . . . . . . . . . . . . . . . . . . . . . . (277) (348)
Mine development . . . . . . . . . . . . . . . . . . . . . . . . . . . . . . . . . . . . . . . . . . . . (3,358) (653)
Total deferred tax liabilities . . . . . . . . . . . . . . . . . . . . . . . . . . . . . . . . . . (36,206) (33,923)
Net deferred tax asset . . . . . . . . . . . . . . . . . . . . . . . . . . . . . . . . . . . . . . $ 7,195 $ 19,489
The Company had deferred income tax assets offset with a valuation allowance for state and foreign netoperating losses and state investment tax credit carryforwards. The Company intends to maintain a valuationallowance on these deferred tax assets until a realization event occurs to support reversal of all or a portion of theallowance.
At December 31, 2010, for income tax purposes, the Company had foreign net operating loss carryforwards of$1.8 million that do not expire and $7.8 million that expire in calendar years 2011 through 2019. The Company hadstate net operating loss carryforwards of $0.5 million that expire in calendar years 2011 through 2029. TheCompany had state tax credits of $2.1 million that expire in calendar years 2011 through 2025.
The Company files income tax returns in the U.S. federal jurisdiction and in various state, local and foreignjurisdictions. With limited exceptions, the Company is no longer subject to U.S. federal examinations for yearsbefore 2002, state and local examinations for years before 2007 and foreign examinations for tax years before 2004.The Company is presently under examination for the income tax filings in a state jurisdiction.
86

A reconciliation of the Company’s unrecognized tax benefits for the years ending December 31, 2010 and2009 is as follows:
(Thousands) 2010 2009
Balance as of January 1 . . . . . . . . . . . . . . . . . . . . . . . . . . . . . . . . . . . . . . . . . . . $2,444 $3,476
Additions to tax positions related to prior years . . . . . . . . . . . . . . . . . . . . . . . . . 651 —
Reduction to tax positions related to prior years . . . . . . . . . . . . . . . . . . . . . . . . . (151) (1,029)
Lapses on statutes of limitations . . . . . . . . . . . . . . . . . . . . . . . . . . . . . . . . . . . . — (3)
Balance as of December 31 . . . . . . . . . . . . . . . . . . . . . . . . . . . . . . . . . . . . . . . . $2,944 $2,444
At December 31, 2010, the Company had $3.3 million of unrecognized tax benefits, of which $2.9 millionwould affect the Company’s effective tax rate if recognized.
The Company classifies all interest and penalties as income tax expense. The amount of interest and penalties,net of related federal tax benefit, recognized in earnings was immaterial during 2010 and 2009. As of December 31,2010, accrued interest and penalties, net of related federal tax benefit, was $0.2 million, unchanged fromDecember 31, 2009.
A provision has not been made with respect to $26.4 million of unremitted earnings at December 31, 2010because such earnings may be considered to be reinvested indefinitely. It is not practical to estimate the amount ofunrecognized deferred tax liability for undistributed foreign earnings.
Note R — Earnings Per Share
The following table sets forth the computation of basic and diluted net earnings per share (EPS):
(Thousands except per share amounts) 2010 2009 2008
Numerator for basic and diluted EPS:
Net income (loss) . . . . . . . . . . . . . . . . . . . . . . . . . . . . . . . . . . . $46,427 $(12,355) $18,357
Denominator:
Denominator for basic EPS:
Weighted-average shares outstanding . . . . . . . . . . . . . . . . . . . 20,282 20,191 20,335Effect of dilutive securities:
Stock options and stock appreciation rights . . . . . . . . . . . . . . 156 — 85
Restricted stock. . . . . . . . . . . . . . . . . . . . . . . . . . . . . . . . . . . 151 — 29
Performance restricted shares. . . . . . . . . . . . . . . . . . . . . . . . . 1 — 94
Diluted potential common shares . . . . . . . . . . . . . . . . . . . . . . 308 — 208
Denominator for diluted EPS:
Adjusted weighted-average shares outstanding . . . . . . . . . . . . 20,590 20,191 20,543
Basic EPS . . . . . . . . . . . . . . . . . . . . . . . . . . . . . . . . . . . . . . . . . . $ 2.29 $ (0.61) $ 0.90
Diluted EPS . . . . . . . . . . . . . . . . . . . . . . . . . . . . . . . . . . . . . . . . . $ 2.25 $ (0.61) $ 0.89
In accordance with accounting guidelines, no potential common shares shall be included in the computation ofany diluted per share amount when a loss from continuing operations exists. Accordingly, dilutive securities totaling163,000 have been excluded from the diluted EPS calculation for 2009.
87

The following are the stock options to purchase common stock with exercise prices in excess of the averageannual share price and the stock appreciation rights with grants in excess of the average annual share price that wereexcluded from the diluted EPS calculations as their effect would have been anti-dilutive:
(Thousands) 2010 2009 2008
Stock options . . . . . . . . . . . . . . . . . . . . . . . . . . . . . . . . . . . . . . . . . . . . . . . . . — 50 —
Stock appreciation rights . . . . . . . . . . . . . . . . . . . . . . . . . . . . . . . . . . . . . . . . . 69 180 69
Total . . . . . . . . . . . . . . . . . . . . . . . . . . . . . . . . . . . . . . . . . . . . . . . . . . . . . . . . 69 230 69
Note S — Related Party Transactions
The Company had outstanding loans of $0.1 million with four employees, including one executive officer, atDecember 31, 2010 and at December 31, 2009. The loans were made in the first quarter 2002 pursuant to lifeinsurance agreements between the Company and the employees. The portion of the premiums paid by the Companyis treated as a loan from the Company to the employees and the loans are secured by the insurance policies, whichare owned by the employees. The agreements require each employee to maintain the insurance policy’s cashsurrender value in an amount at least equal to the outstanding loan balance. The loans are payable from theinsurance proceeds upon the employee’s death or at an earlier date due to the occurrence of specified events. Theloans bear an interest rate equal to the applicable federal rate. There have been no modifications to the loan termssince the inception of the agreements.
Note T — Quarterly Data (Unaudited)
The following tables summarize selected quarterly financial data for the years ended December 31, 2010 and2009:
(Dollars in thousands except per share amounts)First
QuarterSecondQuarter
ThirdQuarter
FourthQuarter Total
2010
Net sales . . . . . . . . . . . . . . . . . . . . . . . . . . . . $295,082 $325,946 $325,309 $355,977 $1,302,314
Gross margin . . . . . . . . . . . . . . . . . . . . . . . . . 49,314 55,853 58,214 59,267 222,648
Percent of sales . . . . . . . . . . . . . . . . . . . . . 16.7% 17.1% 17.9% 16.6% 17.1%
Net income . . . . . . . . . . . . . . . . . . . . . . . . . . $ 6,721 $ 13,719 $ 13,358 $ 12,629 $ 46,427
Net income per share of common stock:
Basic . . . . . . . . . . . . . . . . . . . . . . . . . . . . . 0.33 0.68 0.66 0.62 2.29
Diluted . . . . . . . . . . . . . . . . . . . . . . . . . . . 0.33 0.67 0.65 0.61 2.25
Stock price range:
High . . . . . . . . . . . . . . . . . . . . . . . . . . . . . 22.95 30.33 29.23 40.11
Low. . . . . . . . . . . . . . . . . . . . . . . . . . . . . . 15.80 18.75 18.24 27.62
88

FirstQuarter
SecondQuarter
ThirdQuarter
FourthQuarter Total
2009
Net sales . . . . . . . . . . . . . . . . . . . . . . . . . . . . . $135,359 $174,134 $190,538 $215,155 $715,186
Gross margin . . . . . . . . . . . . . . . . . . . . . . . . . . 14,602 22,134 25,191 29,495 91,422
Percent of sales. . . . . . . . . . . . . . . . . . . . . . . 10.8% 12.7% 13.2% 13.7% 12.8%
Net income (loss) . . . . . . . . . . . . . . . . . . . . . . . $ (8,144) $ (785) $ 126 $ (3,552) $ (12,355)
Net income (loss) per share of common stock:
Basic . . . . . . . . . . . . . . . . . . . . . . . . . . . . . . (0.40) (0.04) 0.01 (0.18) (0.61)
Diluted . . . . . . . . . . . . . . . . . . . . . . . . . . . . . (0.40) (0.04) 0.01 (0.18) (0.61)
Stock price range:
High. . . . . . . . . . . . . . . . . . . . . . . . . . . . . . . 17.27 19.19 25.38 27.06
Low . . . . . . . . . . . . . . . . . . . . . . . . . . . . . . . 10.50 12.41 14.11 17.11
The results for the fourth quarter 2009 include derivative ineffectiveness expense of $4.9 million.
89

Item 9. CHANGES IN AND DISAGREEMENTS WITH ACCOUNTANTS ON ACCOUNTING ANDFINANCIAL DISCLOSURE
None.
Item 9A. CONTROLS AND PROCEDURES
We carried out an evaluation under the supervision and with participation of our management, including thechief executive officer and chief financial officer, of the effectiveness of the design and operation of our disclosurecontrols and procedures as of December 31, 2010 pursuant to Rule 13a-15(e) and 15d-15(e) under the SecuritiesExchange Act of 1934, as amended (the Exchange Act). Based upon that evaluation, our management, including thechief executive officer and chief financial officer, concluded that our disclosure controls and procedures wereeffective as of the evaluation date.
There have been no changes in our internal controls over financial reporting that occurred during the quarterended December 31, 2010 that have materially affected, or are reasonably likely to materially affect, our internalcontrol over financial reporting.
The Report of Management on Internal Control over Financial Reporting and the Report of IndependentRegistered Public Accounting Firm thereon are set forth in Part II, Item 8 of this Annual Report on Form 10-K andare incorporated herein by reference.
Item 9B. OTHER INFORMATION
Amendment to Senior Secured Credit Facility
Effective March 4, 2011, the Company and certain of its subsidiaries entered into an amendment (Amendment)of the Credit Agreement, dated as of November 7, 2007, among the Company, the Company’s subsidiary, WilliamsAdvanced Materials (Netherlands) B.V., JPMorgan Chase Bank, National Association, as administrative agent foritself and the other lenders party thereto (Agent), and the several banks and other financial institutions or entitiesfrom time to time party thereto (Credit Agreement). The Amendment allows the Company and its subsidiaries toenter into agreements for the procurement of gold, silver, platinum, palladium, ruthenium and other precious metalsand copper (whether styled as borrowed, leased, consigned or otherwise) and incur outstanding obligations underthose agreements of up to $370 million in the aggregate. This is an increase from $270 million.
The foregoing description of the Amendment is qualified in its entirety by reference to the full text of theAmendment, a copy of which has been filed as Exhibit 4h to this Form 10-K and is incorporated herein by reference.
Mine Safety and Health Administration Data
Materion Natural Resources Inc. (formerly known as Brush Resources Inc.), a wholly owned subsidiary,operates a beryllium mining complex in the State of Utah which is regulated by both the U.S. Mine Safety andHealth Administration (MSHA) and state regulatory agencies. We endeavor to conduct our mining and otheroperations in compliance with all applicable federal, state and local laws and regulations. We present informationbelow regarding certain mining safety and health citations which MSHA has levied with respect to our miningoperations.
Materion Natural Resources Inc. did not receive any written notice of a pattern of violations underSection 104(e) of the Mine Act, nor the potential to have such a pattern, and they experienced no mining-related fatalities during the current quarter or year ended December 31, 2010.
For reporting purposes of The Dodd-Frank Wall Street Reform and Consumer Protection Act of 2010, weinclude the following table that sets forth the total number of specific citations and orders and the total dollar value
90

of the proposed civil penalty assessments that were issued by MSHA during the current quarter ended December 31,2010, as well as the year ended December 31, 2010, pursuant to the Mine Act, for Materion Natural Resources Inc.:
Quarter ended December 31, 2010:
Mine ID#
Mine ActSection 104(a)Significant &SubstantialCitations
Mine ActSection 104(b)
Orders
Mine ActSection 104(d)
Citations &Orders
Mine ActSection 110(b)(2)
Violations
Mine ActSection 107(a)
Orders
Dollar Value(In thousands)
ProposedMSHA
Assessments
4200706 — — — — — $0.10
Year ended December 31, 2010:
Mine ID#
Mine ActSection 104(a)Significant &SubstantialCitations
Mine ActSection 104(b)
Orders
Mine ActSection 104(d)
Citations &Orders
Mine ActSection 110(b)(2)
Violations
Mine ActSection 107(a)
Orders
Dollar Value(In thousands)
ProposedMSHA
Assessments
4200706 — — — — — $0.60
Additional information follows about MSHA references used in the table.
• Section 104(a) Citations: The total number of violations received from MSHA under section 104(a) thatare significant and substantial citations which are for alleged violations of a mining safety standard orregulation where there exits a reasonable likelihood that the hazard could result in an injury or illness of areasonably serious nature.
• Section 104(b) Orders: The total number of orders issued by MSHA under section 104(b) of the Mine Act,which represents a failure to abate a citation under section 104(a) within the period of time prescribed byMSHA. This results in an order of immediate withdrawal from the area of the mine affected by the conditionuntil MSHA determines that the violation has been abated.
• Section 104(d) Citations and Orders: The total number of citations and orders issued by MSHA undersection 104(d) of the Mine Act for unwarrantable failure to comply with mandatory health or safetystandards.
• Section 110(b)(2) Violations: The total number of flagrant violations issued by MSHA undersection 110(b)(2) of the Mine Act.
• Section 107(a) Orders: The total number of orders issued by MSHA under section 107(a) of the Mine Actfor situations in which MSHA determined an imminent danger existed.
Pending Legal Actions. The Federal Mine Safety and Health Review Commission is an independentadjudicative agency that provides administrative trial and appellate review of legal disputes arising under theMine Act. These cases may involve, among other questions, challenges by operators to citations, orders andpenalties they have received from MSHA, or complaints of discrimination by miners under Section 105 of the MineAct. For the quarter and year ended December 31, 2010, no legal actions are pending.
91

PART III
Item 10. DIRECTORS, EXECUTIVE OFFICERS AND CORPORATE GOVERNANCE
The information under “Election of Directors” in the proxy statement for our 2011 annual meeting ofshareholders, to be filed with the Securities and Exchange Commission pursuant to Regulation 14A, is incorporatedherein by reference. The information required by Item 10 relating to our executive officers is included under thecaption “Executive Officers of the Registrant” in Part I of this Form 10-K and is incorporated by reference into thissection. The information required by Item 10 with respect to directors, the Audit Committee of the Board ofDirectors and Audit Committee financial experts is incorporated herein by reference from the section entitled“Corporate Governance; Committees of the Board of Directors — Audit Committee” and “— Audit CommitteeExpert, Financial Literacy and Independence” in the proxy statement for our 2011 annual meeting of shareholdersto be filed with the Securities and Exchange Commission pursuant to Regulation 14A. The information required byItem 10 regarding compliance with Section 16(a) of the Exchange Act is incorporated by reference from the sectionentitled “Section 16(a) Beneficial Ownership Reporting Compliance” in the proxy statement for our 2011 annualmeeting of shareholders to be filed with the Securities and Exchange Commission pursuant to Regulation 14A.
We have adopted a Policy Statement on Significant Corporate Governance Issues and a Code of ConductPolicy that applies to our chief executive officer and senior financial officers, including the principal financial andaccounting officer, controller and other persons performing similar functions, in compliance with applicable NewYork Stock Exchange and Securities and Exchange Commission requirements. These materials, along with thecharters of the Audit, Governance and Organization and Compensation Committees of our Board of Directors,which also comply with applicable requirements, are available on our web site at www.materion.com, and copiesare also available upon request by any shareholder to Secretary, Materion Corporation, 6070 Parkland Blvd.,Mayfield Heights, Ohio 44124. We make our reports on Forms 10-K, 10-Q and 8-K available on our web site, free ofcharge, as soon as reasonably practicable after these reports are filed with the Securities and Exchange Commission,and any amendments and/or waivers to our Code of Conduct Policy, Statement on Significant CorporateGovernance Issues and Committee Charters will also be made available on our web site. The information onour web site is not incorporated by reference into this Annual Report on Form 10-K.
Item 11. EXECUTIVE COMPENSATION
The information required under Item 11 is incorporated by reference from the sections entitled “ExecutiveCompensation” and “2010 Director Compensation” in the proxy statement for our 2011 annual meeting ofshareholders to be filed with the Securities and Exchange Commission pursuant to Regulation 14A.
92
Item 12. SECURITY OWNERSHIP OF CERTAIN BENEFICIAL OWNERS AND MANAGEMENTAND RELATED STOCKHOLDER MATTERS
The information required under Item 12 regarding security ownership is incorporated by reference from thesection entitled “Security Ownership of Certain Beneficial Owners and Management” in the proxy statement for our2011 annual meeting of shareholders to be filed with the Securities and Exchange Commission pursuant toRegulation 14A. The information required by Item 12 regarding securities authorized for issuance under equitycompensation plans is incorporated by reference from the section entitled “Equity Compensation Plan Information”in the proxy statement for our 2011 annual meeting of shareholders to be filed with the Securities and ExchangeCommission pursuant to Regulation 14A.
Item 13. CERTAIN RELATIONSHIPS AND RELATED TRANSACTIONS, AND DIRECTORINDEPENDENCE
The information required under Item 13 is incorporated by reference from the sections entitled “Related PartyTransactions” and “Corporate Governance; Committees of the Board of Directors — Director Independence” of theproxy statement for our 2011 annual meeting of shareholders to be filed with the Securities and ExchangeCommission pursuant to Regulation 14A.
Item 14. PRINCIPAL ACCOUNTANT FEES AND SERVICES
The information required under Item 14 is incorporated by reference from the section entitled “Ratification ofIndependent Registered Public Accounting Firm” of the proxy statement for our 2011 annual meeting ofshareholders to be filed with the Securities and Exchange Commission pursuant to Regulation 14A.
93

PART IV
Item 15. EXHIBITS AND FINANCIAL STATEMENT SCHEDULES
(a) 1. Financial Statements and Supplemental Information
The financial statements listed in the accompanying index to financial statements are included in Part II, Item 8of this Annual Report on Form 10-K.
(a) 2. Financial Statement Schedules
The following consolidated financial information for the years ended December 31, 2010, 2009 and 2008 issubmitted herewith:
Schedule II — Valuation and qualifying accounts.
All other schedules for which provision is made in the applicable accounting regulations of the Securities andExchange Commission are not required under the related instructions or are inapplicable, and therefore have beenomitted.
(a) 3. Exhibits
All documents referenced below were filed pursuant to the Exchange Act by Materion Corporation, filenumber 001-15885, unless otherwise noted.
(3a) Amended and Restated Articles of Incorporation of Brush Engineered Materials Inc. (filed as Annex B tothe Registration Statement on Form S-4 filed by the Company on February 1, 2000 (RegistrationNo. 333-95917), incorporated herein by reference.
(3b) Amendment to Amended and Restated Articles of Incorporation of Brush Engineered Materials Inc.(filed as Exhibit 3a to the Current Report on Form 8-K (File No. 1-15885) filed by the Company onMarch 8, 2011), incorporated herein by reference.
(3c) Amended and Restated Code of Regulations of Brush Engineered Materials Inc. (filed as Exhibit 3.1 tothe Current Report on Form 8-K (File No. 1-15885) filed by the Company on February 4, 2011),incorporated herein by reference.
(4a) Indenture Modification between Toledo-Lucas County Port Authority, dated as of May 30, 2003 (filed asExhibit 4 to the Company’s Quarterly Report on Form 10-Q (File No. 1-15885) for the period endingJune 27, 2003), incorporated herein by reference.
(4b) Pursuant to Regulation S-K, Item 601(b)(4), the Company agrees to furnish to the Securities andExchange Commission, upon its request, a copy of the instruments defining the rights of holders of long-term debt of the Company that are not being filed with this report.
(4c) Credit Agreement dated November 7, 2007 among Brush Engineered Materials Inc. and other borrowersand JPMorgan Chase, N.A., acting for itself and as agent for certain other banking institutions as lenders(filed as Exhibit 99.1 to the Current Report on Form 8-K (File No. 1-15885) filed by the Company onNovember 7, 2007), incorporated herein by reference.
(4d) First Amendment to Credit Agreement dated December 20, 2007 among Brush Engineered MaterialsInc. and other borrowers and JPMorgan Chase, N.A., acting for itself and as agent for certain otherbanking institutions as lenders (filed as Exhibit 99.1 to the Current Report on Form 8-K (FileNo. 1-15885) filed by the Company on December 26, 2007), incorporated herein by reference.
(4e) Second Amendment to Credit Agreement dated June 11, 2008 among Brush Engineered Materials Inc.and other borrowers and JPMorgan Chase, N.A., acting for itself and as agent for certain other bankinginstitutions as lenders (filed as Exhibit 99.1 to the Current Report on Form 8-K (File No. 1-15885) filedby the Company on June 16, 2008), incorporated herein by reference.
(4f) Third Amendment to the Credit Agreement dated May 7, 2010, among Brush Engineered Materials Inc.and other borrowers and JPMorgan Chase Bank N.A., acting for itself and as agent for certain otherbanking institutions as lenders (filed as Exhibit 99.1 to the Company’s Form 8-K (File No. 1-15885) filedon May 12, 2010), incorporated herein by reference.
94

(4g) Fourth Amendment to the Credit Agreement dated September 28, 2010, among Brush EngineeredMaterials Inc. and other borrowers and JPMorgan Chase Bank N.A., acting for itself and as agent forcertain other banking institutions as lenders (filed as Exhibit 4.1 to the Company’s Form 8-K (FileNo. 1-15885) on October 4, 2010), incorporated herein by reference.
(4h)# Fifth Amendment to the Credit Agreement dated March 4, 2011, among Brush Engineered MaterialsInc. and other borrowers and JPMorgan Chase Bank N.A., acting for itself and as agent for certain otherbanking institutions as lenders.
(4i) Second Amended and Restated Precious Metals Agreement dated December 28, 2007 between BrushEngineered Materials Inc. and The Bank of Nova Scotia (filed as Exhibit 99.1 to the Current Report onForm 8-K (File No. 1-15885) filed by the Company on December 28, 2007), incorporated herein byreference.
(4j) First Amendment to the Second Amended and Restated Precious Metals Agreement dated March 3,2008 between Brush Engineered Materials Inc. and the Bank of Nova Scotia (filed as Exhibit 99.1 to theCurrent Report on Form 8-K (File No. 1-15885) filed by the Company on March 3, 2008), incorporatedherein by reference.
(4k) Second Amendment to the Second Amended and Restated Precious Metals Agreement dated June 25,2008 between Brush Engineered Materials Inc. and the Bank of Nova Scotia (filed as Exhibit 4k to theCompany’s Annual Report on Form 10-K (File No. 1-15885) for the year ended December 31, 2009),incorporated herein by reference.
(4l) Third Amendment to the Second Amended and Restated Precious Metals Agreement dated October 2,2009 between Brush Engineered Materials Inc. and The Bank of Nova Scotia (filed as Exhibit 4.1 to theCompany’s Form 8-K (File No. 1-15885) on October 8, 2009), incorporated herein by reference.
(4m) Fourth Amendment to the Second Amended and Restated Precious Metals Agreement datedFebruary 11, 2010 between Brush Engineered Materials Inc. and The Bank of Nova Scotia (filed asExhibit 4m to the Company’s Annual Report on Form 10-K (File No. 1-15885) for the year endedDecember 31, 2009), incorporated herein by reference.
(4n) Fifth Amendment to the Second Amended and Restated Precious Metals Agreement dated April 30,2010, among Brush Engineered Materials Inc. and other borrowers and The Bank of Nova Scotia (filedas Exhibit 10.1 to the Company’s Quarterly Report on Form 10-Q (File No. 1-15885) for the periodending July 2, 2010), incorporated herein by reference.
(4o) Sixth Amendment to the Second Amended and Restated Precious Metals Agreement dated June 9, 2010,among Brush Engineered Materials Inc. and other borrowers and The Bank of Nova Scotia (filed asExhibit 99.1 to the Company’s Form 8-K (File No. 1-15885) filed on June 9, 2010), incorporated hereinby reference.
(4p) Third Amended and Restated Precious Meals Agreement dated October 1, 2010, between BrushEngineered Materials Inc. and other borrowers and The Bank of Nova Scotia (filed as Exhibit 4.2 tothe Company’s Form 8-K (File No. 1-15885) on October 4, 2010), incorporated herein by reference.
(10a) Form of Indemnification Agreement entered into by the Company and its executive officers (filed asExhibit 10a to the Company’s Annual Report on Form 10-K (File No. 1-15885) for the year endedDecember 31, 2008), incorporated herein by reference.
(10b) Form of Indemnification Agreement entered into by the Company and its directors (filed as Exhibit 10bto the Company’s Annual Report on Form 10-K (File No. 1-15885) for the year ended December 31,2008), incorporated herein by reference.
(10c)* Amended and Restated Form of Severance Agreement for Executive Officers (filed as Exhibit 10.2 to theCompany’s Quarterly Report on Form 10-Q (File No. 1-15885) for the period ending June 27, 2008),incorporated herein by reference.
(10d)* Amended and Restated Form of Severance Agreement for Key Employees (filed as Exhibit 10.1 to theCompany’s Quarterly Report on Form 10-Q (File No. 1-15885) for the period ending June 27, 2008),incorporated herein by reference.
(10e)* Form of Executive Insurance Agreement entered into by the Company and certain employees datedJanuary 2, 2002 (filed as Exhibit 10g to the Company’s Annual Report on Form 10-K (File No. 1-15885)for the year ended December 31, 1994), incorporated herein by reference.
95

(10f)* Form of Trust Agreement between the Company and Key Trust Company of Ohio, N.A. (formerlyAmeritrust Company National Association) on behalf of the Company’s executive officers (filed asExhibit 10e to the Company’s Annual Report on Form 10-K (File No. 1-15885) for the year endedDecember 31, 1994), incorporated herein by reference.
(10g)* 2010 Management Performance Compensation Plan (filed as Exhibit 10h to the Company’s AnnualReport on Form 10-K (File No. 1-15885) for the year ended December 31, 2009), incorporated herein byreference.
(10h)*# 2011 Management Performance Compensation Plan.(10i)* Long-term Incentive Plan for the performance period January 1, 2008 through December 31, 2010 (filed
as Exhibit 10o to the Company’s Annual Report on Form 10-K (File No. 1-15885) for the year endedDecember 31, 2007), incorporated herein by reference.
(10j)* 1979 Stock Option Plan, as amended pursuant to approval of shareholders on April 21, 1982 (filed byBrush Wellman Inc. as Exhibit 15A to Post-Effective Amendment No. 3 to Registration Statement (FileNo. 1-15885) No. 2-64080), incorporated herein by reference.
(10k)* Amendment, effective May 16, 2000, to the 1979 Stock Option Plan (filed as Exhibit 4b to Post-Effective Amendment No. 5 to Registration Statement on Form S-8 Registration No. 2-64080),incorporated herein by reference.
(10l)* 1984 Stock Option Plan as amended by the Board of Directors on April 18, 1984 and February 24, 1987(filed by Brush Wellman Inc. as Exhibit 4.4 to Registration Statement on Form S-8 RegistrationNo. 33-28605), incorporated herein by reference.
(10m)* Amendment, effective May 16, 2000, to the 1984 Stock Option Plan (filed as Exhibit 4b to Post-Effective Amendment No. 1 to Registration Statement on Form S-8 Registration No. 2-90724),incorporated herein by reference.
(10n)* 1989 Stock Option Plan (filed as Exhibit 4.5 to Registration Statement on Form S-8 RegistrationNo. 33-28605), incorporated herein by reference.
(10o)* Amendment, effective May 16, 2000, to the 1989 Stock Option Plan (filed as Exhibit 4b to Post-EffectiveAmendment No. 1 to Registration Statement on Form S-8 Registration No. 33-28605), incorporatedherein by reference.
(10p)* 1995 Stock Incentive Plan (as Amended March 3, 1998) (filed as Appendix A to the Company’s ProxyStatement (File No. 1-15885) dated March 16, 1998), incorporated herein by reference.
(10q)* Amendment, effective May 16, 2000, to the 1995 Stock Incentive Plan (filed as Exhibit 4b to Post-Effective Amendment No. 1 to Registration Statement Registration No. 333-63357), incorporated hereinby reference.
(10r)* Amendment No. 2, effective February 1, 2005, to the 1995 Stock Incentive Plan (filed as Exhibit 10.4 tothe Current Report on Form 8-K (File No. 1-15885) filed by the Company on February 7,2005), incorporated herein by reference.
(10s)* Amended and Restated 2006 Stock Incentive Plan (filed as Exhibit 10.3 to the Company’s QuarterlyReport on Form 10-Q (File No. 1-15885) for the period ended June 27, 2008), incorporated herein byreference.
(10t)* Form of Nonqualified Stock Option Agreement (filed as Exhibit 10t to the Company’s Form 10-K (FileNo. 1-15885) Annual Report for the year ended December 31, 2004), incorporated herein by reference.
(10u)* Form of Nonqualified Stock Option Agreement (filed as Exhibit 10.7 to the Current Report on Form 8-K(File No. 1-15885) filed by the Company on February 7, 2005), incorporated herein by reference.
(10v)* Form of 2009 Restricted Stock Agreement (filed as Exhibit 10z to the Company’s Annual Report onForm 10-K (File No. 1-15885) the year ended December 31, 2008), incorporated herein by reference.
(10w)* Form of 2010 Restricted Stock Agreement (filed as Exhibit 10z to the Company’s Annual Report onForm 10-K (File No. 1-15885) for the year ended December 31, 2009), incorporated herein by reference.
(10x)* Form of 2010 Restricted Stock Units Agreement (filed as Exhibit 10aa to the Company’s Annual Reporton Form 10-K (File No. 1-15885) for the year ended December 31, 2009), incorporated herein byreference.
(10y)* Form of 2011 Restricted Stock Unit Agreement (Stock-Settled) (filed as Exhibit 10.1 to the Company’sCurrent Form 8-K (File No. 1-15885) filed by the Company on March 3, 2011), incorporated herein byreference.
96
(10z)* Form of 2011 Restricted Stock Unit Agreement (Cash-Settled) (filed as Exhibit 10.2 to the Company’sCurrent Form 8-K (File No. 1-15885) filed by the Company on March 3, 2011), incorporated herein byreference.
(10aa)* Form of 2008 Performance Restricted Share and Performance Share Agreement (filed as Exhibit 10ak tothe Company’s Annual Report on Form 10-K (File No. 1-15885) for the year ended December 31, 2007),incorporated herein by reference.
(10ab)* Form of 2006 Stock Appreciation Rights Agreement (filed as Exhibit 10.3 to the Current Report onForm 8-K (File No. 1-15885) filed by the Company on May 8, 2006), incorporated herein by reference.
(10ac)* Form of 2007 Stock Appreciation Rights Agreement (filed as Exhibit 10.5 to Amendment No. 1 to theCurrent Report on Form 8-K (File No. 1-15885) filed by the Company on February 16, 2007),incorporated herein by reference.
(10ad)* Form of 2008 Stock Appreciation Rights Agreement (filed as Exhibit 10an to the Company’s AnnualReport on Form 10-K (File No. 1-15885) for the year ended December 31, 2007), incorporated herein byreference.
(10ae)* Form of 2009 Stock Appreciation Rights Agreement (filed as Exhibit 10ag to the Company’s AnnualReport on Form 10-K (File No. 1-15885) for the year ended December 31, 2008), incorporated herein byreference.
(10af)* Form of 2010 Stock Appreciation Rights Agreement (filed as Exhibit 10ah to the Company’s AnnualReport on Form 10-K (File No. 1-15885) for the year ended December 31, 2009), incorporated herein byreference.
(10ag)* Form of 2011 Stock Appreciation Rights Agreement (filed as Exhibit 10.3 to the Current Report onForm 8-K (File No. 1-15885) filed by the Company on March 3, 2011), incorporated herein by reference.
(10ah)* Supplemental Retirement Plan as amended and restated December 1, 1992 (filed as Exhibit 10n to theCompany’s Annual Report on Form 10-K (File No. 1-15885) for the year ended December 31, 1992),incorporated herein by reference.
(10ai)* Amendment No. 2, adopted January 1, 1996, to Supplemental Retirement Benefit Plan as amended andrestated December 1, 1992 (filed as Exhibit 10o to the Company’s Annual Report on Form 10-K (FileNo. 1-15885) for the year ended December 31, 1995), incorporated herein by reference.
(10aj)* Amendment No. 3, adopted May 5, 1998, to Supplemental Retirement Benefit Plan as amended andrestated December 1, 1992 (filed as Exhibit 10s to the Company’s Annual Report on Form 10-K (FileNo. 1-15885) for the year ended December 31, 1998), incorporated herein by reference.
(10ak)* Amendment No. 4, adopted December 1, 1998, to Supplemental Retirement Benefit Plan as amendedand restated December 1, 1992 (filed as Exhibit 10t to the Company’s Form 10-K (File No. 1-15885)Annual Report for the year ended December 31, 1998), incorporated herein by reference.
(10al)* Amendment No. 5, adopted December 31, 1998, to Supplemental Retirement Benefit Plan as amendedand restated December 1, 1992 (filed as Exhibit 10u to the Company’s Form 10-K (File No. 1-15885)Annual Report for the year ended December 31, 1998), incorporated herein by reference.
(10am)* Amendment No. 6, adopted September 1999, to Supplemental Retirement Benefit Plan as amended andrestated December 1, 1992 (filed as Exhibit 10u to the Company’s Form 10-K (File No. 1-15885) AnnualReport for the year ended December 31, 2000), incorporated herein by reference.
(10an)* Amendment No. 7, adopted May 2000, to Supplemental Retirement Benefit Plan as amended andrestated December 1, 1992 (filed as Exhibit 10v to the Company’s Annual Report on Form 10-K (FileNo. 1-15885) for the year ended December 31, 2000), incorporated herein by reference.
(10ao)* Amendment No. 8, adopted December 21, 2001, to Supplemental Retirement Benefit Plan as amendedand restated December 1, 1992 (filed as Exhibit 10u to the Company’s Form 10-K (File No. 1-15885)Annual Report for the year ended December 31, 2000), incorporated herein by reference.
(10ap)* Amendment No. 9, adopted December 22, 2003, to Supplemental Retirement Benefit Plan as amendedand restated December 1, 1992 (filed as Exhibit 10s to the Company’s Form 10-K (File No. 1-15885)Annual Report for the year ended December 31, 2000), incorporated herein by reference.
(10aq)* Key Employee Share Option Plan (filed as Exhibit 4.1 to the Registration Statement on Form S-8Registration No. 333-52141, filed by Brush Wellman Inc. on May 5, 1998), incorporated herein byreference.
97

(10ar)* Amendment No. 1 to the Key Employee Share Option Plan, (effective May 16, 2005) (filed as Exhibit 4b toPost-Effective Amendment No. 1 to Registration Statement on Form S-8 Registration No. 333-52141),incorporated herein by reference.
(10as)* Amendment No. 2 to the Key Employee Share Option Plan dated June 10, 2005 (filed as Exhibit 10aw tothe Company’s Annual Report on Form 10-K (File No. 1-15885) for the year ended December 31, 2006),incorporated herein by reference.
(10at)* 1997 Stock Incentive Plan for Non-employee Directors, (As Amended and Restated as of May 1, 2001)(filed as Appendix B to the Company’s Proxy Statement (File No. 1-15885) dated March 19, 2001),incorporated herein by reference.
(10au)* Amendment No. 1 to the 1997 Stock Incentive Plan for Non-employee Directors, (filed as Exhibit 10ggto the Company’s Annual Report on Form 10-K (File No. 1-15885) for the year ended December 31,2003), incorporated herein by reference.
(10av)* Form of Nonqualified Stock Option Agreement for Non-employee Directors (filed as Exhibit 10mm tothe Company’s Annual Report on Form 10-K (File No. 1-15885) for the year ended December 31, 2004),incorporated herein by reference.
(10aw)* 1992 Deferred Compensation Plan for Non-employee Directors (As Amended and Restated as ofDecember 2, 1997) (filed as Exhibit 4d to the Registration Statement on Form S-8 RegistrationNo. 333-63355, filed by Brush Wellman Inc.), incorporated herein by reference.
(10ax)* 2000 Reorganization Amendment, dated May 16, 2000, to the 1997 Deferred Compensation Plan forNon-employee Directors (filed as Exhibit 4b to Post-Effective Amendment No. 1 to RegistrationStatement Registration No. 333-63353), incorporated herein by reference.
(10ay)* Amendment No. 1 (effective September 11, 2001) to the 1992 Deferred Compensation Plan for Non-employee Directors (filed as Exhibit 4c to the Company’s Post-Effective Amendment No. 1 toRegistration Statement Registration No. 333-74296), incorporated herein by reference.
(10az)* Amendment No. 2 (effective September 13, 2004) to the 1992 Deferred Compensation Plan for Non-employee Directors (filed as Exhibit 10.1 to the Company’s Quarterly Report on Form 10-Q (FileNo. 1-15885) for the period ended October 1, 2004), incorporated herein by reference.
(10ba)* Amendment No. 3 (effective January 1, 2005) to the 1992 Deferred Compensation Plan for Non-employee Directors (filed as Exhibit 10rr to the Company’s Annual Report on Form 10-K (FileNo. 1-15885) for the year ended December 31, 2004), incorporated herein by reference.
(10bb)* Amendment No. 4 (effective April 1, 2009) to the 1992 Deferred Compensation Plan for Non- employeeDirectors (filed as Exhibit 10bb to the Company’s Annual Report on Form 10-K (File No. 1-15885) forthe year ended December 31, 2008), incorporated herein by reference.
(10bc)* Amended and Restated 2005 Deferred Compensation Plan for Non-employee Directors (filed asExhibit 10.2 to the Company’s Quarterly Report on Form 10-Q (File No. 1-15885) for the periodended September 26, 2008), incorporated herein by reference.
(10bd)* Amended and Restated 2006 Non-employee Director Equity Plan (filed as Exhibit 10.1 to theCompany’s Quarterly Report on Form 10-Q (File No. 1-15885) for the period ended September 26,2008), incorporated herein by reference.
(10be)* Amended and Restated Executive Deferred Compensation Plan II (filed as Exhibit 10.1 to theCompany’s Quarterly Report on Form 10-Q (File No. 1-15885) for the period ended March 28,2008), incorporated herein by reference.
(10bf)* Amendment No. 1 to the Amended and Restated Executive Deferred Compensation Plan II (filed asExhibit 10bf to the Company’s Annual Report on Form 10-K (File No. 1-15885) for the year endedDecember 31, 2008), incorporated herein by reference.
(10bg)* Amendment No. 2 to the Amended and Restated Executive Deferred Compensation Plan II (filed asExhibit 10.2 to the Company’s Quarterly Report on Form 10-Q (File No. 1-15885) for the period endedJuly 3, 2009), incorporated herein by reference.
(10bh)* Trust Agreement between the Company and Fidelity Investments dated September 26, 2006 for certaindeferred compensation plans for Non-employee Directors of the Company (filed as Exhibit 99.4 to theCurrent Report on Form 8-K (File No. 1-15885) filed by the Company on September 29, 2006),incorporated herein by reference.
98

(10bi)* Trust Agreement between the Company and Fidelity Management Trust Company, dated June 25, 2009relating to the Executive Deferred Compensation Plan II (filed as Exhibit 10.1 to the Company’sQuarterly Report on Form 10-Q (File No. 1-15885) for the period ended July 3, 2009), incorporatedherein by reference.
(10bj)* Trust Agreement between the Company and Fifth Third Bank dated September 25, 2006 relating to theKey Employee Share Option Plan (filed as Exhibit 99.3 to the Current Report on Form 8-K (FileNo. 1-15885) filed by the Company on September 29, 2006), incorporated herein by reference.
(10bk) Lease dated as of October 1, 1996, between Brush Wellman Inc. and Toledo-Lucas County PortAuthority (filed as Exhibit 10v to the Company’s Annual Report on Form 10-K (File No. 1-15885) forthe year ended December 31, 1996), incorporated herein by reference.
(10bl) Amended and Restated Inducement Agreement with the Prudential Insurance Company of Americadated May 30, 2003 (filed as Exhibit 10 to the Company’s Quarterly Report on Form 10-Q (FileNo. 1-15885) for the period ended June 27, 2003), incorporated herein by reference.
(10bm) Supply Agreement between the Defense Logistics Agency and Brush Wellman Inc. for the sale andpurchase of beryllium products (filed as Exhibit 10ab to the Company’s Annual Report on Form 10-K(File No. 1-15885) for the year ended December 31, 2004), incorporated herein by reference.
(10bn) Asset Purchase Agreement by and between Williams Advanced Materials Inc. and Techni-Met, Inc.dated December 20, 2007 (filed as Exhibit 10bw to the Company’s Annual Report on Form 10-K (FileNo. 1-15885) for the year ended December 31, 2007), incorporated herein by reference.
(10bo) Consignment Agreement dated October 2, 2009 between Brush Engineered Materials Inc. and CanadianImperial Bank of Commerce (filed as Exhibit 10.1 to the Company’s Form 8-K (File No. 1-15885) onOctober 8, 2009), incorporated herein by reference.
(10bp) Amendment No. 1 to the Consignment Agreement dated October 2, 2009 between Brush EngineeredMaterials Inc. and Canadian Imperial Bank of Commerce and CIBC World Markets Inc. (filed asExhibit 99.1 to the Company’s Form 8-K (File No. 1-15885) on March 12, 2010), incorporated herein byreference.
(10bq) Amendment No. 2 to the Consignment Agreement dated June 11, 2010 between Brush EngineeredMaterials Inc. and Canadian Imperial Bank of Commerce and CIBC World Markets Inc., (filed asExhibit 99.1 to the Company’s Form 8-K (File No. 1-15885) filed on June 14, 2010), incorporated hereinby reference.
(10br) Amendment No. 3 to the Consignment Agreement dated September 30, 2010 between Brush EngineeredMaterials Inc. and Canadian Imperial Bank of Commerce and CIBC World Markets Inc. (filed asExhibit 10.1 to the Company’s Form 8-K (File No. 1-15885), on October 4, 2010), incorporated hereinby reference.
(10bs) Amendment No. 4 to the Consignment Agreement dated November 10, 2010 between Brush EngineeredMaterials Inc. and Canadian Imperial Bank of Commerce and CIBC World Markets Inc. (filed asExhibit 99.1 to the Company’s Form 8-K (File No. 1-15885), on November 12, 2010), incorporatedherein by reference.
(21)# Subsidiaries of the Registrant.(23)# Consent of Ernst & Young LLP.(24)# Power of Attorney.(31.1)# Certification of Chief Executive Officer required by Rule 13a-14(a) or 15d-14(a).(31.2)# Certification of Chief Financial Officer required by Rule 13a-14(a) or 15d-14(a).(32.1)# Certification of Chief Executive Officer and Chief Financial Officer required by 18 U.S.C. Section 1350.
* Denotes a compensatory plan or arrangement.
# Filed herewith
99

SIGNATURES
Pursuant to the requirements of Section 13 or 15(d) of the Securities Exchange Act of 1934, the registrant hasduly caused this report to be signed on its behalf by the undersigned, thereunto duly authorized.
MATERION CORPORATION
By: /s/ RICHARD J. HIPPLE
Richard J. HippleChairman of the Board, Presidentand Chief Executive Officer
By: /s/ JOHN D. GRAMPA
John D. GrampaSenior Vice President Financeand Chief Financial Officer
March 9, 2011
Pursuant to the requirements of the Securities Exchange Act of 1934, this report has been signed below by thefollowing persons on behalf of the registrant and in the capacities and on the dates indicated.
/s/ RICHARD J. HIPPLE
Richard J. Hipple
Chairman of the Board, President, ChiefExecutive Officer and Director (PrincipalExecutive Officer)
March 9, 2011
/s/ JOHN D. GRAMPA
John D. Grampa
Senior Vice President Finance and ChiefFinancial Officer (Principal Financial andAccounting Officer)
March 9, 2011
/s/ ALBERT C. BERSTICKER*
Albert C. Bersticker*
Director March 9, 2011
/s/ JOSEPH P. KEITHLEY*
Joseph P. Keithley*
Director March 9, 2011
/s/ VINOD M. KHILNANI*
Vinod M. Khilnani*
Director March 9, 2011
/s/ WILLIAM B. LAWRENCE*
William B. Lawrence*
Director March 9, 2011
/s/ WILLIAM P. MADAR*
William P. Madar*
Director March 9, 2011
/s/ WILLIAM G. PRYOR*
William G. Pryor*
Director March 9, 2011
/s/ N. MOHAN REDDY*
N. Mohan Reddy*
Director March 9, 2011
/s/ WILLIAM R. ROBERTSON*
William R. Robertson*
Director March 9, 2011
/s/ JOHN SHERWIN, JR.*
John Sherwin, Jr.*
Director March 9, 2011
/s/ CRAIG S. SHULAR*
Craig S. Shular*
Director March 9, 2011
* The undersigned, by signing his name hereto, does sign and execute this report on behalf of each of the above-named officers and directors of Materion Corporation, pursuant to Powers of Attorney executed by each suchofficer and director filed with the Securities and Exchange Commission.
By: /s/ JOHN D. GRAMPA
John D. GrampaAttorney-in-Fact
March 9, 2011
100

SCHEDULE II — VALUATION AND QUALIFYING ACCOUNTS
MATERION CORPORATION AND SUBSIDIARIES
Years ended December 31, 2010, 2009 and 2008
(Thousands)Balance at Beginning
of Period
(1)Charged to Costs
and Expenses
(2)Charged to OtherAccounts-Describe
Deduction-Describe
Balance at Endof Period
ADDITIONSCOL. A COL. B COL. C COL. D COL. E
Year ended December 31, 2010
Deducted from asset accounts:
Allowance for doubtfulaccounts receivable . . . . . . $1,397 $ 423 $315(A) $ 683(B) $1,452
Inventory reserves andobsolescence . . . . . . . . . . . 4,228 3,309 46(A) 2,974(C) 4,609
Year ended December 31, 2009
Deducted from asset accounts:
Allowance for doubtfulaccounts receivable . . . . . . 1,051 (173) 486(A) (33)(B) 1,397
Inventory reserves andobsolescence . . . . . . . . . . . 3,629 2,221 235(A) 1,857(C) 4,228
Year ended December 31, 2008
Deducted from asset accounts:
Allowance for doubtfulaccounts receivable . . . . . . 1,120 142 — 211(B) 1,051
Inventory reserves andobsolescence . . . . . . . . . . . 3,348 3,551 — 3,270(C) 3,629
Note (A) — Beginning balance from acquisition in that year
Note (B) — Bad debts written-off, net of recoveries
Note (C) — Inventory write-off
101

122
Board of Directors and Committees of the Board
Albert C. Bersticker 1, 4Retired Chairman and Chief Executive OfficerFerro Corporation
Richard J. Hipple 3Chairman, President and Chief Executive Officer Materion Corporation
Joseph P. Keithley 1, 3, 4Former Chairman, President and Chief Executive OfficerKeithley Instruments, Inc.
Vinod M. Khilnani 2, 4Chairman, President and Chief Executive OfficerCTS Corporation
William B. Lawrence 1, 3, 4Former Executive Vice President,General Counsel and SecretaryTRW, Inc.
William P. Madar 2, 3, 4Retired Chairman and Former Chief Executive OfficerNordson Corporation
William G. Pryor 1, 4Retired PresidentVan Dorn Demag Corporation
Former President and Chief Executive OfficerVan Dorn Corporation
N. Mohan Reddy 2, 3, 4Dean and Albert J. Weatherhead III Professor of ManagementThe Weatherhead School of ManagementCase Western Reserve University
William R. Robertson 2, 4Retired PartnerKirtland Capital Partners
John Sherwin, Jr. 2, 3, 4Lead DirectorPresident Mid-Continent Ventures, Inc.
Craig S. Shular 1, 4Chairman, Chief Executive Officer and PresidentGrafTech International Ltd.
1 Audit Committee2 Compensation Committee3 Executive Committee4 Governance and Organization Committee
Corporate and ExecutiveOfficersRichard J. Hipple 1, 2Chairman, President and Chief Executive Officer
John D. Grampa 1, 2Senior Vice President Financeand Chief Financial Officer
Daniel A. Skoch 1, 2Senior Vice President Administration
Gregory R. Chemnitz 1Vice President, General Counsel
Michael C. Hasychak 1
Vice President, Treasurer and Secretary
James P. Marrotte 1
Vice President, Controller
Gary W. Schiavoni 1Assistant Treasurer and Assistant Secretary 1 Corporate Officers2 Executive Officers
Major Operating UnitsPerformance AlloysW. Glenn Maxwell, President
Beryllium and CompositesMichael D. Anderson, President
Technical MaterialsAlfonso T. Lubrano, President
Advanced Material Technologies Richard W. Sager, President
Donald G. Klimkowicz, Vice Presidentand Chief Operating Officer
Offices and Facilities
Corporate OfficeMayfield Heights, Ohio
Manufacturing FacilitiesAlbuquerque, New MexicoBloomfield, ConnecticutBrewster, New YorkBuellton, CaliforniaBuffalo, New YorkDelta, UtahElmore, OhioFremont, CaliforniaLimerick, IrelandLincoln, Rhode IslandLorain, OhioLouny, Czech RepublicMilwaukee, WisconsinNewburyport, MassachusettsReading, PennsylvaniaSanta Clara, CaliforniaSingaporeSubic Bay, PhilippinesSuzhou, ChinaTaipei, TaiwanTucson, ArizonaTyngsboro, MassachusettsWestford, MassachusettsWheatfield, New YorkWindsor, Connecticut
Domestic Service CentersElmhurst, IllinoisGallup, New MexicoWarren, Michigan
International Service Centersand Sales OfficesFukaya, JapanMaastricht, The NetherlandsReading, EnglandSeoul, KoreaSingaporeStuttgart, GermanyTokyo, Japan
International Representative OfficesHong KongIncheon, KoreaPune, IndiaShanghai, ChinaTaipei, Taiwan
DIRECTORS,OFFICERS AND FACILITIES

Annual MeetingThe Annual Meeting of Shareholders will be held on May 4, 2011 at 11:00 a.m.
at Executive Caterers at Landerhaven, 6111 Landerhaven Drive, Mayfield Heights,Ohio 44124.
Investor InformationMaterion Corporation maintains an active program of communication with
shareholders, securities analysts and other members of the investment community. Management makes regular presentations in major financial centersaround the world. Upon written request, Materion Corporation will provide, without charge:
• additional copies of the annual report• SEC Form 10-K/10-Q
For such documents, please contact:Michael C. HasychakVice President, Treasurer and Secretary(216) 486-4200
Web SiteMaterion Corporation’s web site on the Internet offers financial and
investor information, news and facts about the Company, its businesses, marketsand products. The Company has adopted Corporate Governance Guidelines and aCode of Conduct Policy, in compliance with applicable New York Stock Exchangeand Securities and Exchange Commission requirements. These materials, alongwith the charters of the Audit, Compensation and Governance and OrganizationCommittees of the Company’s Board of Directors, which also comply with applicablerequirements, are available on the Company’s web site.
Visit the site at: http://www.materion.com
AuditorsErnst & Young LLP925 Euclid Avenue, Suite 1300, Cleveland, Ohio 44115
Transfer Agent and RegistrarWells Fargo Bank, N.A.Shareholder Services, P.O. Box 64854, St. Paul, Minnesota 55164-0854For shareholder inquiries, call: (800) 468-9716www.wellsfargo.com/shareownerservices.com
Stock ListingNew York Stock Exchange/Symbol: MTRN
Corporate HeadquartersMaterion Corporation6070 Parkland Boulevard, Mayfield Heights, Ohio 44124(216) 486-4200 • Facsimile: (216) 383-4091
CORPORATE DATA

6070 Parkland Boulevard, Mayfield Heights, Ohio 44124 • 216.486.4200