Embed Size (px)
Citation preview

Maternal Morbidity Study
2007 - 2008

Study Team:
Dr. Ahmad QutaitatDr. Abdalmalik Abdalmalik
Dr. Isam Shraideh
Dr. Ahmad AlghweeryDr. Hiam Alnashash
Funded:UNFPA

- Jordan’s Total Population : 5.924.312
- Female in Reproductive Age(15 – 49) year 1,423,000
- Family Size : 5.4
- Total Fertility Rate: 3.6
- Maternal Morbidity Rate : 41/ 100.000


Any ill health resulting from or aggravated by pregnancy,
labor and post partum.
Any departure, subjective or objective from a state of
physiological or psychological well-being
(during pregnancy, child birth and the post partum period up to 42
days).
Assessment of the magnitude of the problem.
Monitor progress and assess the effectiveness of
interventions and programs.
Identify underlying causes and risk factors of
maternal morbidity.
1. To determine the overall incidence of maternal morbidity.
2. To identify the spectrum of maternal morbidity and the incidence of
the main diseases and complications.
3. To identify possible discrepancies among the three regions and
different health sectors.
4. To assess potential risk factors and predictors of maternal morbidity
such as parity age, educational level and employment status
5. To explore potential limitations in providing in health care delivery.
6. To report on the incidence and complications of miscarriage.

Design of the study
Sample of the study
Study Tool
Field work methodology
Design of the study:
1. The study is a prospective cohort study through the use of
detailed questionnaire follow-up on the study samples.
2. A number of health disorders related to pregnancy, delivery
and post partum were specified.

Sample of the study:
Target population is pregnant women, since the beginning of pregnancy, within the first 21 weeks of pregnancy.
◦ The estimated pregnant number of women in Jordan per year is (200000).
◦ The size of the sample statistically represented is between(5-10 %).
◦ 5500 study questionnaires were distributed and 4865 were collected back.
◦ 4501 of questionnaires fulfilled the conditions of the study and 364 (6.6%) did not comply with the conditions of the study.

MOH
48%
R.M.S
24%
Private and
UNRWA
27%
University of
Jordan
1%
Sample distribution by health sector

34.5
7.2
19.8
0.5
15.5
3.6
0.6
89.2
4.4
1.22.8
0
5
10
15
20
25
30
35
40
Amman Balqa Zarqa Madaba Irbid Mafraq Jarash Ajloon Karak Tafela Ma’an Aqaba
Middle North South
%

An integrated questionnaire to meet the objectives of the study was
classified as sections:
i. Health biography of respondent.
ii. Data on sickness suffered during previous pregnancies and last one.
iii. Follow-up sample on current pregnancy.
iv. Data on the current pregnancy complications.
v. Data on the current delivery.
vi. Data on complications during current delivery 1st 2nd and 3rd stage
vii. Data on post partum period which also includes data on breast feeding
and information on the new born.
Study Tool:

Field work teams were trained to the methodology of this study to
achieve a standardization:
MOH 35 obstetricians / gynecologist
8 family medicine and general
doctors.
R.M.S 18 obstetricians /gynecologists
Private 15 obstetricians /gynecologists
University of Jordan 2 obstetricians / gynecologists
UNRWA 2 obstetricians /gynecologists
Field work methodology:
Research team has set a date for the launch of random samples
starting at 15.1.2007 – lasting for 4 months.
Pregnancy cases registered should not be more than 21weeks.
Registrations of cases ended on 15.4.2007.
January 2008 has been set as the time for completion of the field
study.

Field work methodology:
A period of 40 days was needed for the collection of the
completed questionnaires.
A programming expert has been assigned to prepare a
computer program to respond to the nature of the study and
special codification, date entry (CSPro)
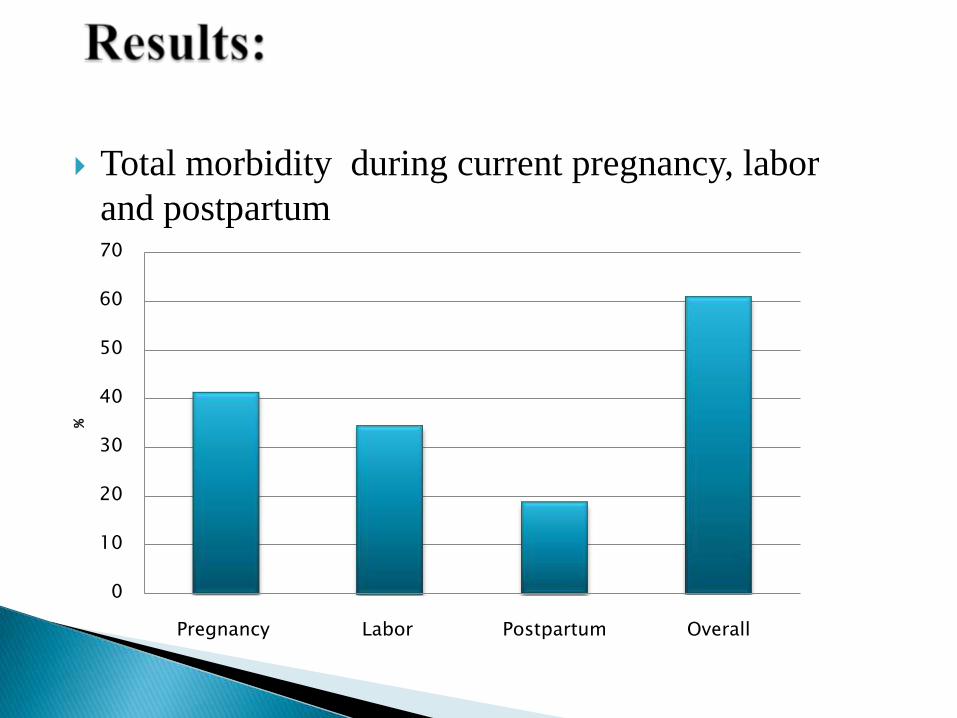
Total morbidity during current pregnancy, labor
and postpartum
0
10
20
30
40
50
60
70
Pregnancy Labor Postpartum Overall
%

Anemia during current pregnancy based on
hemoglobin measurement at the first visit:
20.1%
5.9%
Hb < 11 gm/dl Hb < 10 gm/dl

Morbidity N Percent
Urinary tract infections 908 20.2
Vaginal infections 872 19.4
Anemia 492 10.9
Early bleeding 268 6
Hypertension 264 5.9
Gestational diabetes 136 3
Pre-eclampsia 118 2.6
Late bleeding 78 1.7
Multiple pregnancy 72 1.6
Kidney diseases 57 1.3
Thyroid disorders 38 0.8
Disseminated intravascular coagulopathy 30 0.7
Heart disease 13 0.3
Others 93 2.1
Any morbidity 1861 41.3
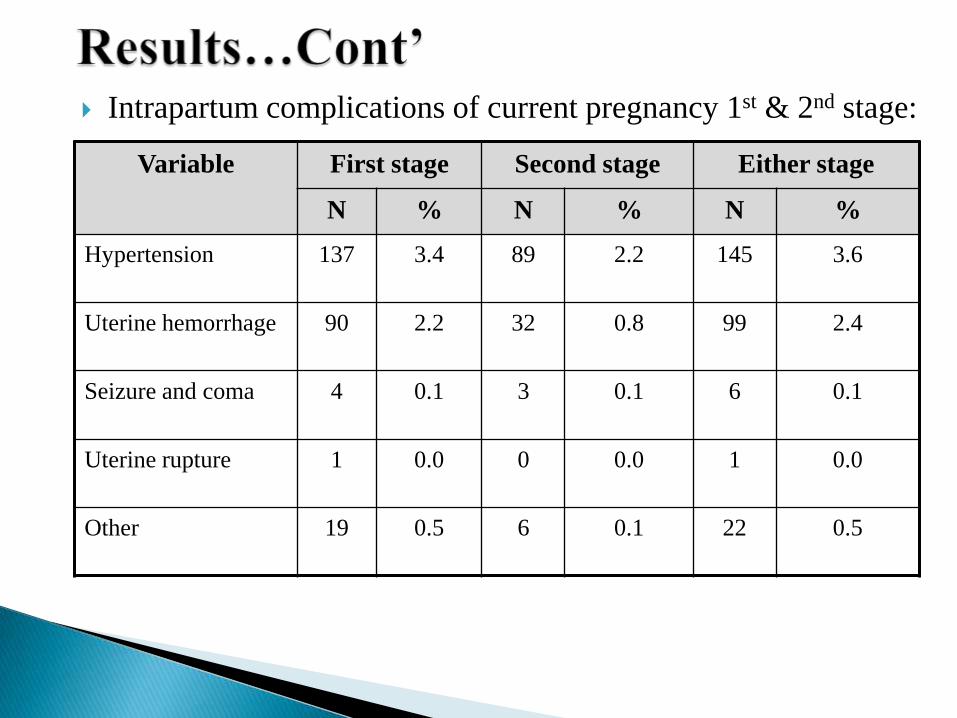
Variable First stage Second stage Either stage
N % N % N %
Hypertension 137 3.4 89 2.2 145 3.6
Uterine hemorrhage 90 2.2 32 0.8 99 2.4
Seizure and coma 4 0.1 3 0.1 6 0.1
Uterine rupture 1 0.0 0 0.0 1 0.0
Other 19 0.5 6 0.1 22 0.5
Intrapartum complications of current pregnancy 1st & 2nd stage:

Variable N Percent %
Uterine hemorrhage 191 4.7
Retained placenta 52 1.3
Serious vaginal lacerations 33 0.8
Urinary injury 9 0.2
Others 13 0.3
Intrapartum complications of current pregnancy 3rd stage:

Variable N Percent %
Pre-eclampsia 102 2.5
Severe anemia 94 2.3
Clotting disorder 9 0.2
Deep vein thrombosis 7 0.2
Pulmonary thrombosis 5 0.1
Renal failure 1 0.0
Liver failure 1 0.0
Others 23 0.6
General complications of current labor & delivery:

Morbidity N Percent %
Anemia 313 7.7
Gynecological inflammations 269 6.6
Breast engorgement 247 6.1
Hypertension 122 3
Bleeding 84 2.1
Psychological problems 54 1.3
Deep vein thrombosis 5 0.1
Others 47 1.2
Any morbidity 756 18.7
Complications during post partum:

Public
76%
Private
23%
Others
1%
Spontaneous
vaginal
69%
Vaccum
or forceps
3%
Caesarean
28%
Method of Delivery
Information on current delivery:
Place of Delivery

Information on current delivery… cont’.
26.30%
5.80%
Hb < 11 gm/dl Hb < 10 gm/dl
Anemia measured at delivery

Main reasons for cesarean section:
27.7
18
13.6
10.3
5.1
4.6
3.1
2.2
1.5
1.3
1.2
0.9
0.9
0.7
0.5
5.4
2.7
0 5 10 15 20 25 30
More than one previous Cesarean section
Malpresentation
Fetal distress
Failure of progress in labor
Multiple pregnancy
Pre-Eclampsia
Post-date pregnancy
Cephalopelvic disproportion
Antepartum hemorrhage
Prolapsed umbilical cord
Large baby
Placenta previa
Patient request
Early separation of the placenta
Previous Myomectomy
Others
Missing
•Percent

Reason for admission N Percent %
Spontaneous bleeding 245 70.2
Induction of missed abortion 83 23.8
Others 21 6
Total 349 100
Reasons and complication of miscarriage:

Complication N Percent %
Impaired clotting 18 5.2
Severe bleeding 5 1.4
Pelvic inflammatory disease 1 0.3
Cervical lacerations 1 0.3
Retained tissue that needed re-evacuation 1 0.3
None 323 92.6
Total 349 100
Complication of current miscarriage :

Variable MoH RMS Private sector P –
Value
Pregnancy morbidity % 41.5 73.2 39.4 0.167
Intrapartum morbidity % 38.7 33 29.3 0.000
Postpartum morbidity % 18.8 19 18.1 0.845
Overall morbidity 65.4 54.2 59.8 0.000
Comparison between different health sectors in any
morbidity during pregnancy labor and postpartum:

Variable Middle North South P-
Value
Pregnancy morbidity % 41.2 31.5 53.2 0.000
Intrapartum morbidity % 32.6 40.5 34.1 0.001
Postpartum morbidity % 16.8 15.1 29.3 0.000
Overall morbidity 61.7 55.1 64.2 0.000
Comparison between different regions in any morbidity
during current pregnancy, labor and postpartum

Variable Morbidity P – Value
Age
<20
20-29
30-39
40-49
61.5
58.4
63.3
69.7
0.004
Education of woman
Illiterate
< Secondary
Secondary +
68.3
64.7
58.6
0.000
Employment
Employed
Not employed
56.9
61.9
0.004
Gestational period at enrollment
<8 weeks
8 -15
16 +
61.6
63.1
57.7
0.006
Overall morbidity of current pregnancy labor
& postpartum by selected variables

Variable Morbidity P – Value
Education of husband
illiterate
< Secondary
Secondary +
70.6
64
58.3
0.000
Parity
0
1-3
4+
59.4
59.2
67
0.000
Mode of current delivery
spontaneous
vacuum or forceps
breech
cesarean section
56.4
69.8
87
63.1
0.000
Overall morbidity of current pregnancy labor &
postpartum by selected variables….Cont.

Variable Adjusted Odds Ratio P – Value
Number of births
O
1-3
4+
1
1.14
1.76
0.000
0.129
0.000
Region
middle
north
south
1
1.41
1.03
0.001
0.000
0.734
Mode of delivery
spontaneous
vacuum of forceps
breech
cesarean section
1
1.31
0.66
1.32
0.004
0.202
0.425
0.001
Education
illiterate
less than secondary education
secondary +
1
0.89
0.71
0.009
0.620
0.140
Factors independently related to intrapartum maternal morbidity
of current pregnancy using multivariate logistic regression:
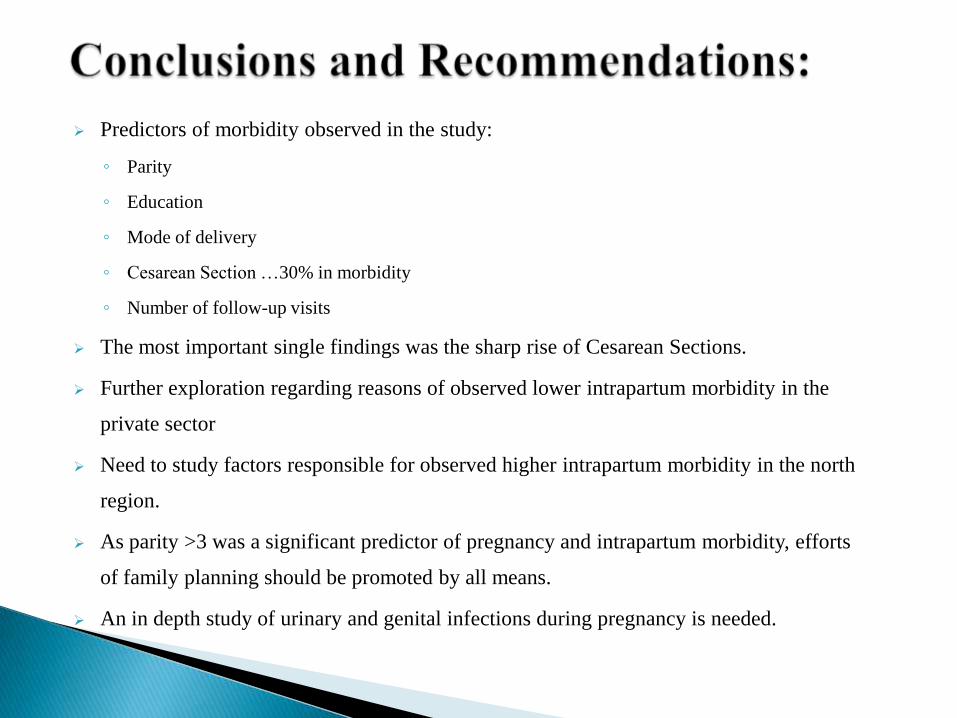
Predictors of morbidity observed in the study:
◦ Parity
◦ Education
◦ Mode of delivery
◦ Cesarean Section …30% in morbidity
◦ Number of follow-up visits
The most important single findings was the sharp rise of Cesarean Sections.
Further exploration regarding reasons of observed lower intrapartum morbidity in the
private sector
Need to study factors responsible for observed higher intrapartum morbidity in the north
region.
As parity >3 was a significant predictor of pregnancy and intrapartum morbidity, efforts
of family planning should be promoted by all means.
An in depth study of urinary and genital infections during pregnancy is needed.