Embed Size (px)
Citation preview
Continuing Education examination available at http://www.cdc.gov/mmwr/cme/conted_info.html#weekly.
U.S. Department of Health and Human ServicesCenters for Disease Control and Prevention
Morbidity and Mortality Weekly ReportWeekly / Vol. 65 / No. 2 January 22, 2016
INSIDE23 Increasing Prevalence of Gastroschisis — 14 States,
1995–201227 Inadequate Diagnosis and Treatment of Malaria
Among Travelers Returning from Africa During the Ebola Epidemic — United States, 2014–2015
30 Interim Guidelines for Pregnant Women During a Zika Virus Outbreak — United States, 2016
34 Notes from the Field: Outbreak of Locally Acquired Cases of Dengue Fever — Hawaii, 2015
36 Notes from the Field: Tetanus Cases After Voluntary Medical Male Circumcision for HIV Prevention — Eastern and Southern Africa, 2012–2015
38 QuickStats
The American Academy of Pediatrics recommends that infants be breastfed exclusively* for the first 6 months of life, and that mothers continue breastfeeding for at least 1 year (1). However, in 2011, only 19.3% of mothers aged ≤20 years in the United States exclusively breastfed their infants at 3 months, compared with 36.4% of women aged 20–29 years and 45.0% of women aged ≥30 years.† Hospitals play an essential role in providing care that helps mothers establish and continue breastfeeding. The U.S. Surgeon General and numerous health professional organiza-tions recommend providing care aligned with the Baby-Friendly Hospital Initiative (BFHI), including adherence to the Ten Steps to Successful Breastfeeding (Ten Steps), as well as not providing gift packs containing infant formula (2,3). Implementing BFHI-aligned maternity care improves duration of any and exclusive breastfeeding among mothers (4,5); however, studies have not examined associations between BFHI-aligned maternity care and breastfeeding outcomes solely among adolescent mothers (for this report, adolescents refers to persons aged 12–19 years). Therefore, CDC analyzed 2009–2011 Pregnancy Risk Assessment Monitoring System (PRAMS) data and determined that among adolescent mothers who initiated breastfeeding, self-reported prevalence of experiencing any of the nine selected BFHI-aligned maternity care practices included in the PRAMS survey ranged from 29.2% to 95.4%. Among the five practices identified to be significantly associated with breastfeeding outcomes in this study, the more practices a mother experienced, the more likely she was to be breastfeeding (any amount or exclusively) at 4 weeks and 8 weeks postpartum. Given the substantial health advantages conferred to mothers and children through breastfeeding, and the
particular vulnerability of adolescent mothers to lower breastfeed-ing rates, it is important for hospitals to provide evidence-based maternity practices related to breastfeeding as part of their routine care to all mothers, including adolescent mothers.
PRAMS is a surveillance project that collects state-specific, population-based data on maternal attitudes and experiences before, during, and after pregnancy among women with a recent live birth.§ Because PRAMS surveys are completed by mothers at approximately 2–9 months postpartum,§ CDC categorized the duration of any and exclusive breastfeeding as ≥4 weeks and ≥8 weeks to ensure that all respondents had an equal opportunity to be included in the analysis. CDC used 2009–2011 PRAMS data (the most current data available) from New York City and
* Exclusive breastfeeding means that the infant receives only breast milk. No other liquids or solids are given (not even water) with the exception of oral rehydration solution, or drops/syrups of vitamins, minerals, or medicines (http://www.who.int/elena/titles/exclusive_breastfeeding).
† http://www.cdc.gov/breastfeeding/data/nis_data/rates-any-exclusive-bf-socio-dem-2011.htm.
§ http://www.cdc.gov/prams/methodology.htm.
Maternity Care Practices and Breastfeeding Among Adolescent Mothers Aged 12–19 Years — United States, 2009–2011
Oluwatosin Olaiya, MBChB1,2; Deborah L. Dee, PhD2; Andrea J. Sharma, PhD2; Ruben A. Smith, PhD2
Morbidity and Mortality Weekly Report
18 MMWR / January 22, 2016 / Vol. 65 / No. 2 US Department of Health and Human Services/Centers for Disease Control and Prevention
The MMWR series of publications is published by the Center for Surveillance, Epidemiology, and Laboratory Services, Centers for Disease Control and Prevention (CDC), U.S. Department of Health and Human Services, Atlanta, GA 30329-4027.Suggested citation: [Author names; first three, then et al., if more than six.] [Report title]. MMWR Morb Mortal Wkly Rep 2016;65:[inclusive page numbers].
Centers for Disease Control and PreventionThomas R. Frieden, MD, MPH, Director
Harold W. Jaffe, MD, MA, Associate Director for Science Joanne Cono, MD, ScM, Director, Office of Science Quality
Chesley L. Richards, MD, MPH, Deputy Director for Public Health Scientific ServicesMichael F. Iademarco, MD, MPH, Director, Center for Surveillance, Epidemiology, and Laboratory Services
MMWR Editorial and Production Staff (Weekly)Sonja A. Rasmussen, MD, MS, Editor-in-Chief
Charlotte K. Kent, PhD, MPH, Executive Editor Jacqueline Gindler, MD, Editor
Teresa F. Rutledge, Managing Editor Douglas W. Weatherwax, Lead Technical Writer-Editor
Soumya Dunworth, PhD, Teresa M. Hood, MS, Technical Writer-Editors
Martha F. Boyd, Lead Visual Information SpecialistMaureen A. Leahy, Julia C. Martinroe,
Stephen R. Spriggs, Moua Yang, Tong Yang,Visual Information Specialists
Quang M. Doan, MBA, Phyllis H. King,Teresa C. Moreland, Terraye M. Starr,
Information Technology Specialists
MMWR Editorial BoardTimothy F. Jones, MD, ChairmanMatthew L. Boulton, MD, MPH
Virginia A. Caine, MD Katherine Lyon Daniel, PhD
Jonathan E. Fielding, MD, MPH, MBADavid W. Fleming, MD
William E. Halperin, MD, DrPH, MPHKing K. Holmes, MD, PhD
Robin Ikeda, MD, MPH Rima F. Khabbaz, MD
Phyllis Meadows, PhD, MSN, RNJewel Mullen, MD, MPH, MPA
Jeff Niederdeppe, PhDPatricia Quinlisk, MD, MPH
Patrick L. Remington, MD, MPH Carlos Roig, MS, MA
William L. Roper, MD, MPH William Schaffner, MD
10 states¶ that included the maternity practices module during at least 1 study year and met the 65% response rate threshold. The module assessed breastfeeding-related maternity care mothers experienced during the delivery hospitalization. Only mothers who had a hospital birth, initiated breastfeeding, and lived with their infant at the time of the survey completed the maternity practices module. CDC analyzed nine questions that assess breastfeeding-supportive (BFHI-aligned) maternity practices; eight correspond to the Ten Steps and one assesses distribution of hospital gift packs containing formula (Table 1). Adolescent moth-ers with infants who were full-term (≥37 weeks), weighed ≥2,500 g at birth, and were never admitted to the neonatal intensive care unit were included in the analysis. Mothers with missing data on maternity practice questions, breastfeeding variables, or covariates (age, race/ethnicity, and Special Supplemental Nutrition Program for Women, Infants and Children [WIC] participation) (n = 126) were excluded. The final sample size included 1,325 adolescent mothers, weighted to represent 104,030 adolescent mothers.
CDC estimated the prevalence of any and exclusive** breast-feeding for ≥4 weeks and ≥8 weeks. Of the nine BFHI-aligned
maternity practices adolescent mothers experienced, five were significantly associated with breastfeeding outcomes. For those five significantly associated practices (significant practices), CDC calculated adjusted prevalence ratios and 95% confidence intervals (CIs) by using predicted marginal proportions from logistic regression models (6) to assess the association between the number of maternity practices experienced and any or exclusive breastfeeding at 4 and 8 weeks postpartum. CDC also assessed the dose-response relationship between the total num-ber of these five significant practices that mothers experienced and breastfeeding prevalence. All regression models controlled for covariates. Statistical significance was defined as p<0.05.
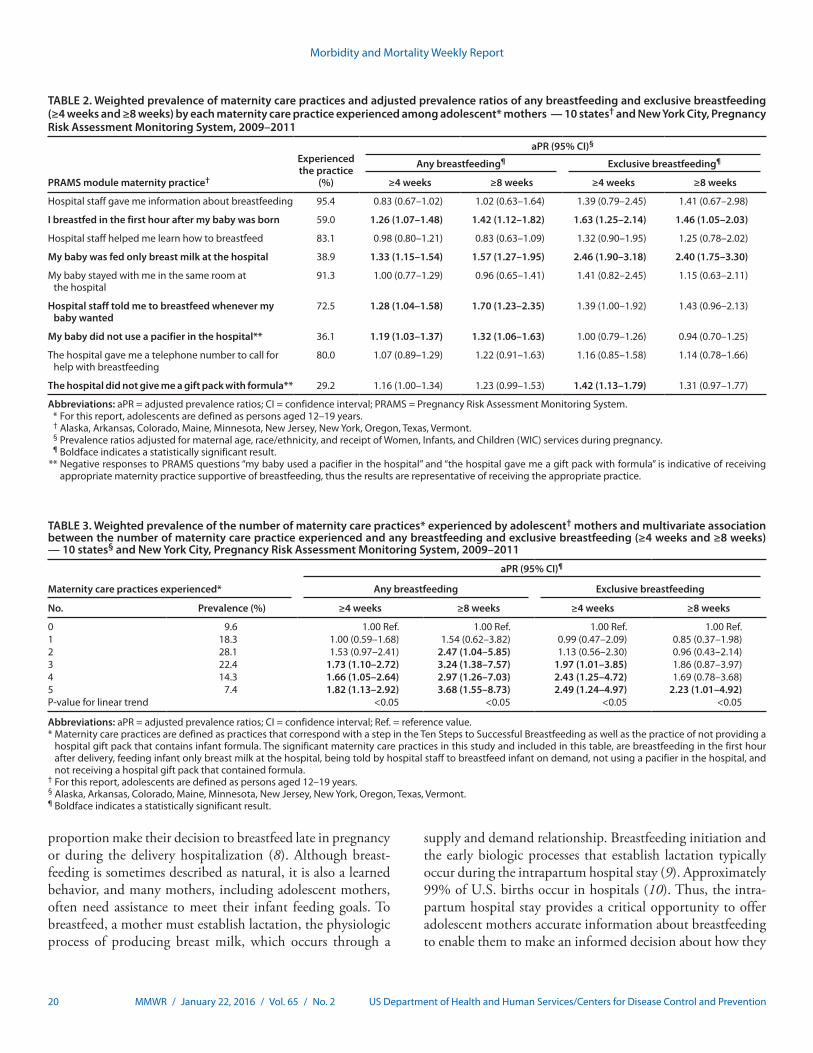
Among this sample of adolescent mothers who initiated breastfeeding, 64.4% (95% CI: 59.5–69.1) reported any breastfeeding for ≥4 weeks and 40.9% (95% CI: 36.2–45.7) reported exclusively breastfeeding ≥4 weeks. The prevalence of any and of exclusive breastfeeding for ≥8 weeks declined to 44.6% (95% CI: 39.7–49.5) and 30.9% (95% CI: 26.6–35.6), respectively. The prevalence of BFHI-aligned maternity prac-tices experienced during the delivery hospitalization varied across the nine selected practices: 95.4% of adolescent mothers received information about breastfeeding, whereas only 29.2% reported they did not receive a gift pack that contained infant formula (Table 2). Only four maternity practices (receiving information about breastfeeding, receiving assistance with breastfeeding, newborn staying in the same hospital room as the mother, and receiving a phone number to call for breastfeeding help after hospital discharge) were experienced by more than
¶ Alaska, Arkansas, Colorado, Maine, Minnesota, New Jersey, New York, Oregon, Texas, Vermont.
** Breastfeeding exclusivity was derived from the PRAMS question “How old was your new baby the first time he or she drank liquids other than breast milk (such as formula, water, juice, tea, or cow’s milk)?,” to which mothers could answer in weeks or months, e.g., “my baby was less than 1 week old” or “my baby has not had any liquids other breast milk.” Breastfeeding duration was derived from the PRAMS question, “How many weeks or months did you breastfeed or pump milk to feed your baby?” Mothers could answer in the number of weeks or months, or could respond that she breastfed or pumped milk for her infant for less than 1 week.
Morbidity and Mortality Weekly Report
MMWR / January 22, 2016 / Vol. 65 / No. 2 19US Department of Health and Human Services/Centers for Disease Control and Prevention
80% of adolescent mothers; however, none of these practices were associated with study outcomes. Feeding only breast milk at the hospital and breastfeeding in the first hour after the baby was born were the two maternity practices significantly associated with all breastfeeding outcomes (any and exclusive breastfeeding at both 4 and 8 weeks) (Table 2).
Only 7% of adolescent mothers reported experiencing all five of the practices significantly associated with any of the
breastfeeding outcomes (breastfeeding in the first hour after delivery, feeding the infant only breast milk at the hospital, hospital staff encouragement to breastfeed the infant on demand, not using a pacifier in the hospital, and not receiving a hospital gift pack that contained formula); 9.6% reported not experiencing any of the five practices (Table 3). There was a significant dose-response relationship between the number of practices experienced and any or exclusive breastfeeding for ≥4 weeks and ≥8 weeks. The association between the num-ber of maternity practices experienced and the prevalence of exclusive breastfeeding for ≥8 weeks was statistically significant only among adolescent mothers who reported experiencing all five practices.
Discussion
Breast milk is the recommended source of optimal nutri-tion for most†† infants. Although the maternal and child health advantages associated with longer duration of any and exclusive breastfeeding are well documented (1,3,7), this study determined that among adolescent mothers who initiated breastfeeding, prevalence of any and exclusive breastfeeding was low. Specifically, the prevalence of any breastfeeding for ≥8 weeks among adolescent mothers (44.6%) was 40% lower than among PRAMS respondents aged ≥20 years (74.8%). The prevalence of exclusive breastfeeding for ≥8 weeks among adolescent mothers (30.9%) was approximately 25% lower than among PRAMS mothers aged ≥20 years (40.7%).
Maternity care practices a mother experiences during her intrapartum hospital stay can influence whether she chooses to initiate breastfeeding and how long she continues breast-feeding. The Ten Steps and the elimination of gift packs containing formula are elements of evidence-based maternity care that are associated with longer durations of any and exclusive breastfeeding (3). This study determined that among the five BFHI-aligned maternity practices with a significant independent association with breastfeeding, a positive dose-response relationship exists between the number of practices experienced by adolescent mothers and their breastfeeding duration and exclusivity. However, many adolescent mothers who initiated breastfeeding were not provided this supportive care. Specifically, approximately half of adolescent mothers were exposed to fewer than three and 9.6% were not exposed to any of the five maternity practices associated with breast-feeding duration and exclusivity in this study.
Previous research indicates that the majority of adolescent mothers want to breastfeed their infants, and a substantial
†† Few medical contraindications to breastfeeding have been described, such as untreated brucellosis in a mother and metabolic disorder of galactosemia in an infant (http://pediatrics.aappublications.org/content/129/3/e827.full).
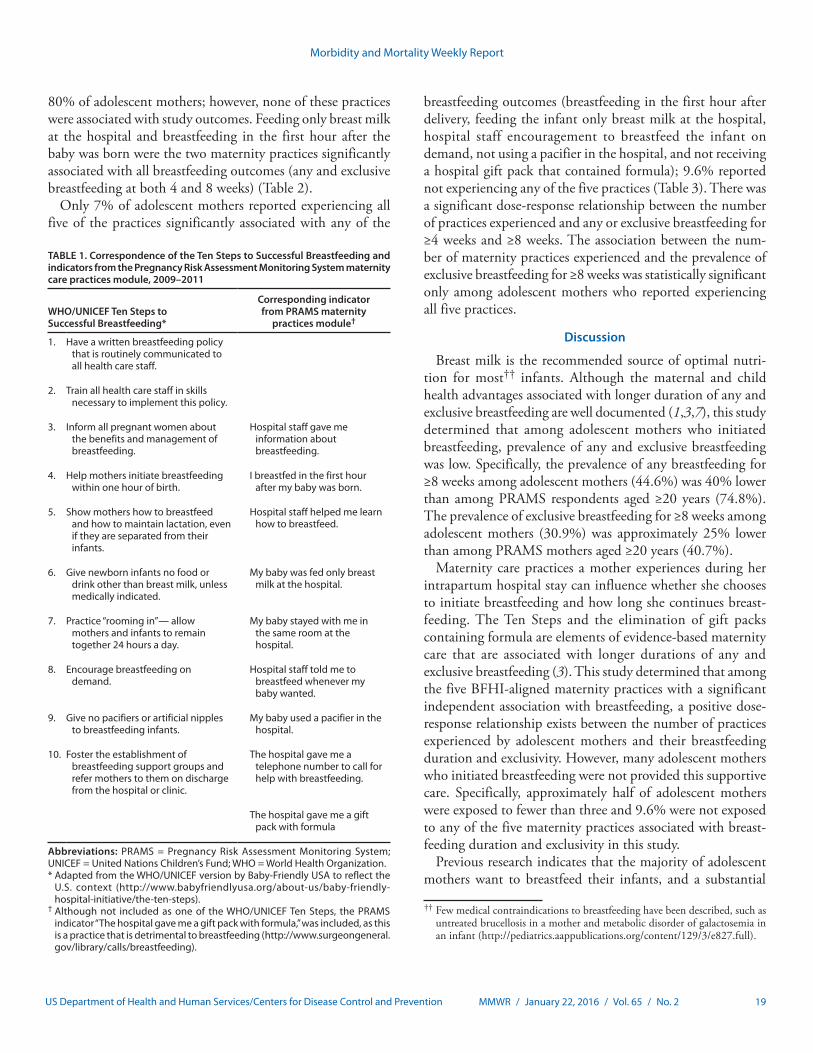
TABLE 1. Correspondence of the Ten Steps to Successful Breastfeeding and indicators from the Pregnancy Risk Assessment Monitoring System maternity care practices module, 2009–2011
WHO/UNICEF Ten Steps to Successful Breastfeeding*
Corresponding indicator from PRAMS maternity
practices module†
1. Have a written breastfeeding policy that is routinely communicated to all health care staff.
2. Train all health care staff in skills necessary to implement this policy.
3. Inform all pregnant women about the benefits and management of breastfeeding.
Hospital staff gave me information about breastfeeding.
4. Help mothers initiate breastfeeding within one hour of birth.
I breastfed in the first hour after my baby was born.
5. Show mothers how to breastfeed and how to maintain lactation, even if they are separated from their infants.
Hospital staff helped me learn how to breastfeed.
6. Give newborn infants no food or drink other than breast milk, unless medically indicated.
My baby was fed only breast milk at the hospital.
7. Practice “rooming in”— allow mothers and infants to remain together 24 hours a day.
My baby stayed with me in the same room at the hospital.
8. Encourage breastfeeding on demand.
Hospital staff told me to breastfeed whenever my baby wanted.
9. Give no pacifiers or artificial nipples to breastfeeding infants.
My baby used a pacifier in the hospital.
10. Foster the establishment of breastfeeding support groups and refer mothers to them on discharge from the hospital or clinic.
The hospital gave me a telephone number to call for help with breastfeeding.
The hospital gave me a gift pack with formula
Abbreviations: PRAMS = Pregnancy Risk Assessment Monitoring System; UNICEF = United Nations Children’s Fund; WHO = World Health Organization.* Adapted from the WHO/UNICEF version by Baby-Friendly USA to reflect the
U.S. context (http://www.babyfriendlyusa.org/about-us/baby-friendly-hospital-initiative/the-ten-steps).
† Although not included as one of the WHO/UNICEF Ten Steps, the PRAMS indicator “The hospital gave me a gift pack with formula,” was included, as this is a practice that is detrimental to breastfeeding (http://www.surgeongeneral.gov/library/calls/breastfeeding).
Morbidity and Mortality Weekly Report
20 MMWR / January 22, 2016 / Vol. 65 / No. 2 US Department of Health and Human Services/Centers for Disease Control and Prevention
proportion make their decision to breastfeed late in pregnancy or during the delivery hospitalization (8). Although breast-feeding is sometimes described as natural, it is also a learned behavior, and many mothers, including adolescent mothers, often need assistance to meet their infant feeding goals. To breastfeed, a mother must establish lactation, the physiologic process of producing breast milk, which occurs through a
supply and demand relationship. Breastfeeding initiation and the early biologic processes that establish lactation typically occur during the intrapartum hospital stay (9). Approximately 99% of U.S. births occur in hospitals (10). Thus, the intra-partum hospital stay provides a critical opportunity to offer adolescent mothers accurate information about breastfeeding to enable them to make an informed decision about how they
TABLE 2. Weighted prevalence of maternity care practices and adjusted prevalence ratios of any breastfeeding and exclusive breastfeeding (≥4 weeks and ≥8 weeks) by each maternity care practice experienced among adolescent* mothers — 10 states† and New York City, Pregnancy Risk Assessment Monitoring System, 2009–2011
PRAMS module maternity practice†
Experienced the practice
(%)
aPR (95% CI)§
Any breastfeeding¶ Exclusive breastfeeding¶
≥4 weeks ≥8 weeks ≥4 weeks ≥8 weeks
Hospital staff gave me information about breastfeeding 95.4 0.83 (0.67–1.02) 1.02 (0.63–1.64) 1.39 (0.79–2.45) 1.41 (0.67–2.98)
I breastfed in the first hour after my baby was born 59.0 1.26 (1.07–1.48) 1.42 (1.12–1.82) 1.63 (1.25–2.14) 1.46 (1.05–2.03)
Hospital staff helped me learn how to breastfeed 83.1 0.98 (0.80–1.21) 0.83 (0.63–1.09) 1.32 (0.90–1.95) 1.25 (0.78–2.02)
My baby was fed only breast milk at the hospital 38.9 1.33 (1.15–1.54) 1.57 (1.27–1.95) 2.46 (1.90–3.18) 2.40 (1.75–3.30)
My baby stayed with me in the same room at the hospital
91.3 1.00 (0.77–1.29) 0.96 (0.65–1.41) 1.41 (0.82–2.45) 1.15 (0.63–2.11)
Hospital staff told me to breastfeed whenever my baby wanted
72.5 1.28 (1.04–1.58) 1.70 (1.23–2.35) 1.39 (1.00–1.92) 1.43 (0.96–2.13)
My baby did not use a pacifier in the hospital** 36.1 1.19 (1.03–1.37) 1.32 (1.06–1.63) 1.00 (0.79–1.26) 0.94 (0.70–1.25)
The hospital gave me a telephone number to call for help with breastfeeding
80.0 1.07 (0.89–1.29) 1.22 (0.91–1.63) 1.16 (0.85–1.58) 1.14 (0.78–1.66)
The hospital did not give me a gift pack with formula** 29.2 1.16 (1.00–1.34) 1.23 (0.99–1.53) 1.42 (1.13–1.79) 1.31 (0.97–1.77)
Abbreviations: aPR = adjusted prevalence ratios; CI = confidence interval; PRAMS = Pregnancy Risk Assessment Monitoring System. * For this report, adolescents are defined as persons aged 12–19 years. † Alaska, Arkansas, Colorado, Maine, Minnesota, New Jersey, New York, Oregon, Texas, Vermont. § Prevalence ratios adjusted for maternal age, race/ethnicity, and receipt of Women, Infants, and Children (WIC) services during pregnancy. ¶ Boldface indicates a statistically significant result. ** Negative responses to PRAMS questions “my baby used a pacifier in the hospital” and “the hospital gave me a gift pack with formula” is indicative of receiving
appropriate maternity practice supportive of breastfeeding, thus the results are representative of receiving the appropriate practice.
TABLE 3. Weighted prevalence of the number of maternity care practices* experienced by adolescent† mothers and multivariate association between the number of maternity care practice experienced and any breastfeeding and exclusive breastfeeding (≥4 weeks and ≥8 weeks) — 10 states§ and New York City, Pregnancy Risk Assessment Monitoring System, 2009–2011
Maternity care practices experienced*
aPR (95% CI)¶
Any breastfeeding Exclusive breastfeeding
No. Prevalence (%) ≥4 weeks ≥8 weeks ≥4 weeks ≥8 weeks
0 9.6 1.00 Ref. 1.00 Ref. 1.00 Ref. 1.00 Ref.1 18.3 1.00 (0.59–1.68) 1.54 (0.62–3.82) 0.99 (0.47–2.09) 0.85 (0.37–1.98)2 28.1 1.53 (0.97–2.41) 2.47 (1.04–5.85) 1.13 (0.56–2.30) 0.96 (0.43–2.14)3 22.4 1.73 (1.10–2.72) 3.24 (1.38–7.57) 1.97 (1.01–3.85) 1.86 (0.87–3.97)4 14.3 1.66 (1.05–2.64) 2.97 (1.26–7.03) 2.43 (1.25–4.72) 1.69 (0.78–3.68)5 7.4 1.82 (1.13–2.92) 3.68 (1.55–8.73) 2.49 (1.24–4.97) 2.23 (1.01–4.92)P-value for linear trend <0.05 <0.05 <0.05 <0.05
Abbreviations: aPR = adjusted prevalence ratios; CI = confidence interval; Ref. = reference value.* Maternity care practices are defined as practices that correspond with a step in the Ten Steps to Successful Breastfeeding as well as the practice of not providing a
hospital gift pack that contains infant formula. The significant maternity care practices in this study and included in this table, are breastfeeding in the first hour after delivery, feeding infant only breast milk at the hospital, being told by hospital staff to breastfeed infant on demand, not using a pacifier in the hospital, and not receiving a hospital gift pack that contained formula.
† For this report, adolescents are defined as persons aged 12–19 years.§ Alaska, Arkansas, Colorado, Maine, Minnesota, New Jersey, New York, Oregon, Texas, Vermont.¶ Boldface indicates a statistically significant result.
Morbidity and Mortality Weekly Report
MMWR / January 22, 2016 / Vol. 65 / No. 2 21US Department of Health and Human Services/Centers for Disease Control and Prevention
will feed their infant, and to provide assistance with breast-feeding, all of which contribute to the knowledge, skills, and confidence adolescent mothers need to continue breastfeeding after hospital discharge.
The Surgeon General’s Call to Action to Support Breastfeeding includes a number of recommended actions that can be taken to improve support for breastfeeding mothers. One of the action steps calls on health care clinicians to ensure that maternity practices throughout the United States are fully supportive of breastfeeding (3). This study demonstrates that adolescent mothers are not receiving care that is consistent with evidence-based guidelines. The Ten Steps are evidence-based maternity practices that support breastfeeding and that are meant to be delivered to mothers as a comprehensive package (3,5). The findings of this study indicate that it is important for hospitals to ensure that all mothers, including adolescent mothers, experience practices that are aligned with the Ten Steps, and that they do not receive hospital gift packs that contain formula as part of routine maternity care, to help them meet their personal infant feeding goals.
This findings in this report are subject to at least three limitations. First, PRAMS data are self-reported and might be subject to recall bias. Second, the maternity practices module was asked only of mothers who initiated breastfeeding; thus, it was not possible to assess how the practices influenced
breastfeeding initiation. In addition, the inclusion of only mothers who initiated breastfeeding might explain why the steps that are typically associated with breastfeeding initiation were not significantly associated with duration or exclusivity of breastfeeding. Finally, this study included only those adolescent mothers with healthy newborns; hence, the results might not be generalizable to more vulnerable infants, such as those who are born preterm, and who might be most in need of the health protections breast milk provides.
Breastfeeding confers numerous health advantages that are particularly important for adolescent mothers and their children, who constitute a vulnerable group, both in terms of being at risk for suboptimal breastfeeding and related health effects (1). Ensuring that adolescent mothers (and all mothers) receive optimal, evidenced-based maternity care, can improve breastfeeding duration and exclusivity rates, ultimately leading to improved maternal and child health outcomes.
Acknowledgments
Brian Morrow, Denise D’Angelo, Division of Reproductive Health, National Center for Chronic Disease Prevention and Health Promotion, CDC; Qun Zheng, Kathy Perham-Hester, Mary McGehee, Alyson Shupe, Jennifer Morin, George Yocher, Kelsi E. Williams, Chinelo Ogbuanu, Jane Awakuni, Theresa Sandidge, Sarah Mauch, Amy Zapata, Tom Patenaude, Diana Cheng, Emily Lu, Patricia McKane, Judy Punyko, Brenda Hughes, Venkata Garikapaty, JoAnn Dotson, Brenda Coufall, David J. Laflamme, Ingrid M. Morton, Eirian Coronado, Anne Radigan-Garcia, Candace Mulready-Ward, Kathleen Jones-Vessey, Sandra Anseth, Connie Geidenberger, Alicia Lincoln, Kenneth Rosenberg, Tony Norwood, Sam Viner-Brown, Mike Smith, Tanya Guthrie, Ramona Lainhart, Laurie Baksh, Peggy Brozicevic, Christopher Hill, Linda Lohdefinck, Melissa Baker, Katherine Kvale, Amy Spieker, PRAMS Working Group, CDC; CDC PRAMS Team, Applied Sciences Branch, Division of Reproductive Health, CDC.
1Epidemic Intelligence Service, CDC; 2Division of Reproductive Health, National Center for Chronic Disease Prevention and Health Promotion, CDC.
Corresponding author: Oluwatosin Olaiya, [email protected], 404-639-2599.
References1. American Academy of Pediatrics Section on Breastfeeding. Breastfeeding
and the use of human milk. Pediatrics 2012;129:e827–41. http://dx.doi.org/10.1542/peds.2011-3552.
2. World Health Organization. Protecting, promoting and supporting breast-feeding: the special role of maternity services. Geneva, Switzerland: World Health Organization; 1989. http://apps.who.int/iris/handle/10665/39679.
3. Office of the Surgeon General; CDC; Office on Women’s Health. The Surgeon General’s Call to Action to Support Breastfeeding. Rockville, MD: Office of the Surgeon General; 2011. http://www.surgeongeneral.gov/library/calls/breastfeeding.
4. DiGirolamo AM, Grummer-Strawn LM, Fein SB. Effect of maternity-care practices on breastfeeding. Pediatrics 2008;122(Suppl 2):S43–9. http://dx.doi.org/10.1542/peds.2008-1315e.
SummaryWhat is already known on this topic?
Breast milk is the optimal source of nutrition for most infants and confers many health and economic benefits to both mother and child. Maternity care practices that occur during the intrapartum hospital stay influence the initiation and duration of any and exclusive breastfeeding.
What is added by this report?
Among adolescent mothers (for this report, adolescents are defined as persons aged 12–19 years) who initiated breastfeed-ing, the self-reported prevalence of experiencing breastfeeding-supportive maternity care practices ranged from 29.2% (not receiving a hospital gift pack that contained formula) to 95.4% (receiving information about breastfeeding from hospital staff ). Among the maternity care practices with a significant indepen-dent association with any and exclusive breastfeeding for ≥4 weeks and ≥8 weeks, there was a positive dose-response relationship between the number of practices experienced by adolescent mothers and their breastfeeding outcomes.
What are the implications for public health practice?
The intrapartum period is a critical time to reach adolescent mothers with evidence-based maternity practices. Receiving evidence-based breastfeeding-supportive maternity care can increase the prevalence of any and exclusive breastfeeding among adolescent mothers.
Morbidity and Mortality Weekly Report
22 MMWR / January 22, 2016 / Vol. 65 / No. 2 US Department of Health and Human Services/Centers for Disease Control and Prevention
5. Murray EK, Ricketts S, Dellaport J. Hospital practices that increase breastfeeding duration: results from a population-based study. Birth 2007;34:202–11. http://dx.doi.org/10.1111/j.1523-536X.2007.00172.x.
6. Bieler GS, Brown GG, Williams RL, Brogan DJ. Estimating model-adjusted risks, risk differences, and risk ratios from complex survey data. Am J Epidemiol 2010;171:618–23. http://dx.doi.org/10.1093/aje/kwp440.
7. Ip S, Chung M, Raman G, et al. Breastfeeding and maternal and infant health outcomes in developed countries. Evid Repr Technol Assess (Full Rep) 2007;153.
8. Sipsma HL, Divney AA, Magriples U, Hansen N, Gordon D, Kershaw T. Breastfeeding intentions among pregnant adolescents and young adults and their partners. Breastfeed Med 2013;8:374–80.
9. Shealy KR, Li R, Benton-Davis S, Grummer-Strawn LM. The CDC Guide to Breastfeeding Interventions Atlanta, GA: US Department of Health and Human Services, CDC; 2005. http://www.cdc.gov/breastfeeding/pdf/breastfeeding_interventions.pdf.
10. MacDorman MF, Matthews TJ, Declercq E. Trends in out-of-hospital births in the United States, 1990–2012. NCHS Data Brief 2014; 144:1–8.
Morbidity and Mortality Weekly Report
MMWR / January 22, 2016 / Vol. 65 / No. 2 23US Department of Health and Human Services/Centers for Disease Control and Prevention
with all other racial/ethnic groups included in the total). The gastroschisis case definition was based on the British Pediatric Association Classification of Diseases code (756.71) or the International Classification of Diseases, Ninth Revision, Clinical Modification (ICD-9-CM) code for gastroschisis (756.73, or before 10/1/2009, 756.79, with verification to confirm cases of gastroschisis, because the previous code was shared with omphalocele). Gastroschisis cases included live births, fetal deaths,† and elective terminations.§
Data were pooled at CDC, and gastroschisis prevalence was calculated for each year, maternal age group, and race/ethnic-ity. Prevalence was calculated as number of gastroschisis cases among all birth outcomes divided by the total number of live births. The denominators of total number of live births in the same catchment area as the birth defects surveillance program were reported by states or obtained from public use data files. Poisson exact methods were used to calculate 95% CIs for each prevalence estimate. Prevalence ratios were calculated by dividing the prevalence during 2006–2012 by the prevalence during 1995–2005, and CIs for the prevalence ratios were calculated using Poisson regression.
Because the comparison of prevalence between the two study periods involved an artificial breakpoint during the 18-year data span and only examined pooled prevalence within those periods, joinpoint regression analysis was used to identify sta-tistically significant changes in the annual prevalence of gastros-chisis over the course of the entire study period (1995–2012). Joinpoint regression initially models annual trend data by fitting a straight line (i.e., zero joinpoints). Then, joinpoints are added, one at a time, and a Monte Carlo permutation test is used to determine the optimal number of joinpoints. Each joinpoint in the final model corresponds to a significant change in the trend, and an AAPC and its 95% CI are calculated to describe how the rate changes within each time interval (3). The estimated overall percent change was calculated by first converting the AAPC to the projected single year change in prevalence and then exponentiating to the number of years studied minus one to estimate the total increase throughout the 18 years. This gives the magnitude of the increase, which
Increasing Prevalence of Gastroschisis — 14 States, 1995–2012Abbey M. Jones, MPH1; Jennifer Isenburg, MSPH1; Jason L. Salemi, PhD2; Kathryn E. Arnold, MD1; Cara T. Mai, DrPH1; Deepa Aggarwal, PhD3;
William Arias, MPH4; Gerard E. Carrino, PhD5; Emily Ferrell, MPH6; Olakunle Folorunso, MBBS7; Brendan Ibe, MD8; Russell S. Kirby, PhD9; Heidi R. Krapfl, MS10; Lisa K. Marengo, MS11; Bridget S. Mosley, MPH12; Amy E. Nance, MPH13; Paul A. Romitti, PhD14; Joseph Spadafino, MPH15;
Jennifer Stock16; Margaret A. Honein, PhD1
Gastroschisis is a serious congenital defect in which the intestines protrude through an opening in the abdominal wall. Gastroschisis requires surgical repair soon after birth and is associated with an increased risk for medical complications and mortality during infancy. Reports from multiple surveillance systems worldwide have documented increasing prevalence of gastroschisis since the 1980s, particularly among younger mothers (1,2); however, since publication of a multistate U.S. report that included data through 2005 (1), it is not known whether prevalence has continued to increase. Data on gastros-chisis from 14 population-based state surveillance programs were pooled and analyzed to assess the average annual percent change (AAPC) in prevalence and to compare the prevalence during 2006–2012 with that during 1995–2005, stratified by maternal age and race/ethnicity. The pooled data included approximately 29% of U.S. births for the period 1995–2012. During 1995–2012, gastroschisis prevalence increased in every category of maternal age and race/ethnicity, and the AAPC ranged from 3.1% in non-Hispanic white (white) mothers aged <20 years to 7.9% in non-Hispanic black (black) mothers aged <20 years. These corresponded to overall percentage increases during 1995–2012 that ranged from 68% in white mothers aged <20 years to 263% in black mothers aged <20 years. Gastroschisis prevalence increased 30% between the two peri-ods, from 3.6 per 10,000 births during 1995–2005 to 4.9 per 10,000 births during 2006–2012 (prevalence ratio = 1.3, 95% confidence interval [CI]: 1.3–1.4), with the largest increase among black mothers aged <20 years (prevalence ratio = 2.0, 95% CI: 1.6–2.5). Public health research is urgently needed to identify factors contributing to this increase.
To follow up on a study that included gastroschisis prevalence data from 15 states and reported a near doubling of gastroschi-sis prevalence during 1995–2005 (1), CDC requested updated data from each of these states for 1995–2012. Fourteen states* provided data on gastroschisis cases crosstabulated by maternal age groups (<20 years, 20–24 years, 25–29 years, 30–34 years, and ≥35 years) and race/ethnicity (white, black, and Hispanic,
* The 14 states that provided data on gastroschisis and the years for which data were provided were Arizona (1995–2012), Arkansas (1995–2012), California (1995–2012), Colorado (1997–2012), Georgia (1995–2012), Iowa (1995–2012), Kentucky (1998–2012), New Mexico (1998–2012), New York (1995–2012), North Carolina (1999–2012), Oklahoma (1995–2012), Rhode Island (2002–2012), Texas (1996–2012), and Utah (1997–2012).
† Fetal deaths were not reported from Rhode Island, Kentucky during 1998–2003, or New York during 2008–2012.
§ Elective terminations were not reported from Arizona, Colorado, Kentucky, New York, North Carolina, and Rhode Island.
Morbidity and Mortality Weekly Report
24 MMWR / January 22, 2016 / Vol. 65 / No. 2 US Department of Health and Human Services/Centers for Disease Control and Prevention
is then converted to a percent increase. For example, an AAPC of 5 represents a projected single year change of 1.05, which would correspond to a 2.29-fold increase over the entire study period (1.05^17 = 2.29). This corresponds to an overall change of 129% ([2.29–1] x 100). The Joinpoint Regression Program, version 4.2.0 (National Cancer Institute), was used to conduct joinpoint regression.
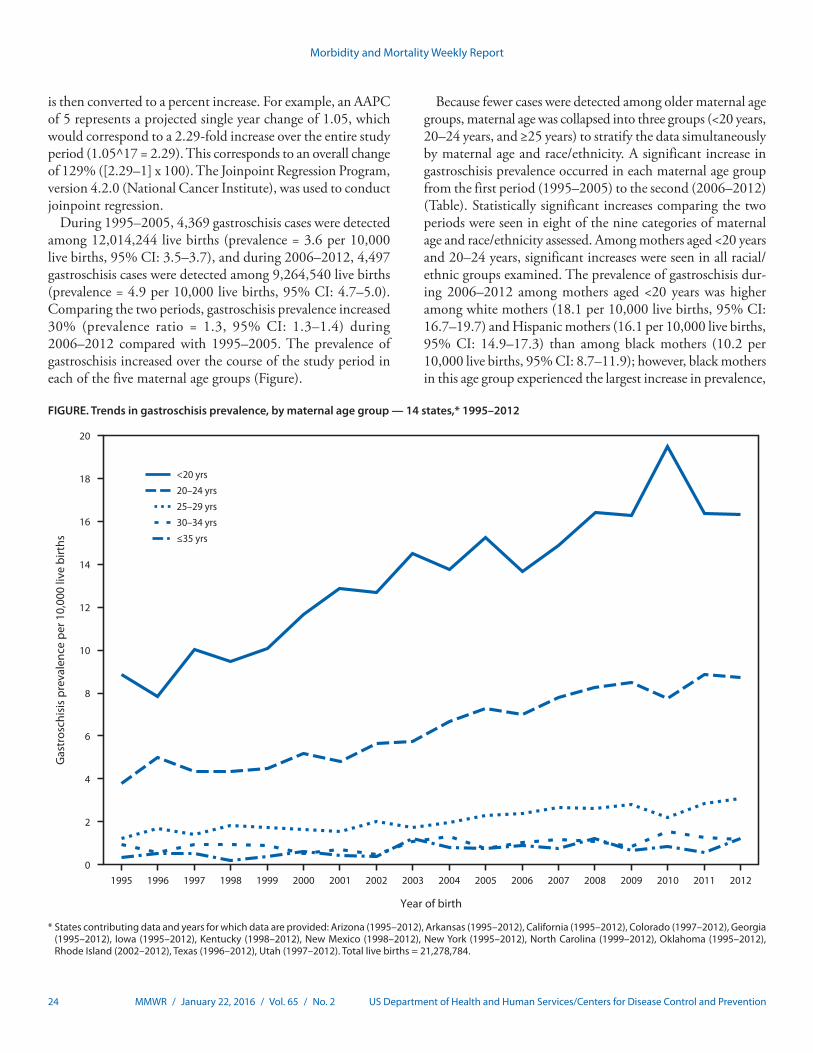
During 1995–2005, 4,369 gastroschisis cases were detected among 12,014,244 live births (prevalence = 3.6 per 10,000 live births, 95% CI: 3.5–3.7), and during 2006–2012, 4,497 gastroschisis cases were detected among 9,264,540 live births (prevalence = 4.9 per 10,000 live births, 95% CI: 4.7–5.0). Comparing the two periods, gastroschisis prevalence increased 30% (prevalence ratio = 1.3, 95% CI: 1.3–1.4) during 2006–2012 compared with 1995–2005. The prevalence of gastroschisis increased over the course of the study period in each of the five maternal age groups (Figure).
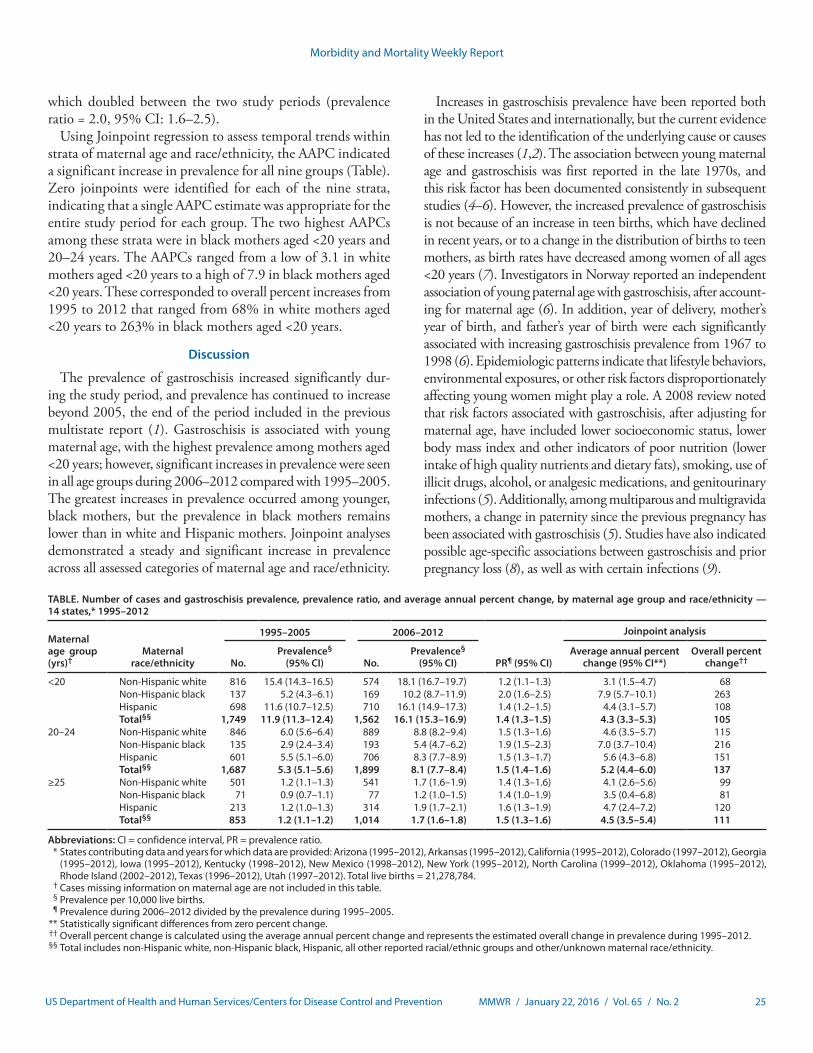
Because fewer cases were detected among older maternal age groups, maternal age was collapsed into three groups (<20 years, 20–24 years, and ≥25 years) to stratify the data simultaneously by maternal age and race/ethnicity. A significant increase in gastroschisis prevalence occurred in each maternal age group from the first period (1995–2005) to the second (2006–2012) (Table). Statistically significant increases comparing the two periods were seen in eight of the nine categories of maternal age and race/ethnicity assessed. Among mothers aged <20 years and 20–24 years, significant increases were seen in all racial/ethnic groups examined. The prevalence of gastroschisis dur-ing 2006–2012 among mothers aged <20 years was higher among white mothers (18.1 per 10,000 live births, 95% CI: 16.7–19.7) and Hispanic mothers (16.1 per 10,000 live births, 95% CI: 14.9–17.3) than among black mothers (10.2 per 10,000 live births, 95% CI: 8.7–11.9); however, black mothers in this age group experienced the largest increase in prevalence,
FIGURE. Trends in gastroschisis prevalence, by maternal age group — 14 states,* 1995–2012
0
2
4
6
8
10
12
14
16
18
20
Gas
tros
chis
is p
reva
lenc
e pe
r 10,
000
live
birt
hs
Year of birth
1995 1996 1997 1998 1999 2000 2001 2002 2003 2004 2005 2006 2007 2008 2009 2010 2011 2012
<20 yrs20–24 yrs25–29 yrs30–34 yrs≤35 yrs
* States contributing data and years for which data are provided: Arizona (1995–2012), Arkansas (1995–2012), California (1995–2012), Colorado (1997–2012), Georgia (1995–2012), Iowa (1995–2012), Kentucky (1998–2012), New Mexico (1998–2012), New York (1995–2012), North Carolina (1999–2012), Oklahoma (1995–2012), Rhode Island (2002–2012), Texas (1996–2012), Utah (1997–2012). Total live births = 21,278,784.
Morbidity and Mortality Weekly Report
MMWR / January 22, 2016 / Vol. 65 / No. 2 25US Department of Health and Human Services/Centers for Disease Control and Prevention
which doubled between the two study periods (prevalence ratio = 2.0, 95% CI: 1.6–2.5).
Using Joinpoint regression to assess temporal trends within strata of maternal age and race/ethnicity, the AAPC indicated a significant increase in prevalence for all nine groups (Table). Zero joinpoints were identified for each of the nine strata, indicating that a single AAPC estimate was appropriate for the entire study period for each group. The two highest AAPCs among these strata were in black mothers aged <20 years and 20–24 years. The AAPCs ranged from a low of 3.1 in white mothers aged <20 years to a high of 7.9 in black mothers aged <20 years. These corresponded to overall percent increases from 1995 to 2012 that ranged from 68% in white mothers aged <20 years to 263% in black mothers aged <20 years.
Discussion
The prevalence of gastroschisis increased significantly dur-ing the study period, and prevalence has continued to increase beyond 2005, the end of the period included in the previous multistate report (1). Gastroschisis is associated with young maternal age, with the highest prevalence among mothers aged <20 years; however, significant increases in prevalence were seen in all age groups during 2006–2012 compared with 1995–2005. The greatest increases in prevalence occurred among younger, black mothers, but the prevalence in black mothers remains lower than in white and Hispanic mothers. Joinpoint analyses demonstrated a steady and significant increase in prevalence across all assessed categories of maternal age and race/ethnicity.
Increases in gastroschisis prevalence have been reported both in the United States and internationally, but the current evidence has not led to the identification of the underlying cause or causes of these increases (1,2). The association between young maternal age and gastroschisis was first reported in the late 1970s, and this risk factor has been documented consistently in subsequent studies (4–6). However, the increased prevalence of gastroschisis is not because of an increase in teen births, which have declined in recent years, or to a change in the distribution of births to teen mothers, as birth rates have decreased among women of all ages <20 years (7). Investigators in Norway reported an independent association of young paternal age with gastroschisis, after account-ing for maternal age (6). In addition, year of delivery, mother’s year of birth, and father’s year of birth were each significantly associated with increasing gastroschisis prevalence from 1967 to 1998 (6). Epidemiologic patterns indicate that lifestyle behaviors, environmental exposures, or other risk factors disproportionately affecting young women might play a role. A 2008 review noted that risk factors associated with gastroschisis, after adjusting for maternal age, have included lower socioeconomic status, lower body mass index and other indicators of poor nutrition (lower intake of high quality nutrients and dietary fats), smoking, use of illicit drugs, alcohol, or analgesic medications, and genitourinary infections (5). Additionally, among multiparous and multigravida mothers, a change in paternity since the previous pregnancy has been associated with gastroschisis (5). Studies have also indicated possible age-specific associations between gastroschisis and prior pregnancy loss (8), as well as with certain infections (9).
TABLE. Number of cases and gastroschisis prevalence, prevalence ratio, and average annual percent change, by maternal age group and race/ethnicity — 14 states,* 1995–2012
Maternal age group (yrs)†
Maternal race/ethnicity
1995–2005 2006–2012
PR¶ (95% CI)
Joinpoint analysis
No.Prevalence§
(95% CI) No.Prevalence§
(95% CI)Average annual percent
change (95% CI**)Overall percent
change††
<20 Non-Hispanic white 816 15.4 (14.3–16.5) 574 18.1 (16.7–19.7) 1.2 (1.1–1.3) 3.1 (1.5–4.7) 68Non-Hispanic black 137 5.2 (4.3–6.1) 169 10.2 (8.7–11.9) 2.0 (1.6–2.5) 7.9 (5.7–10.1) 263Hispanic 698 11.6 (10.7–12.5) 710 16.1 (14.9–17.3) 1.4 (1.2–1.5) 4.4 (3.1–5.7) 108Total§§ 1,749 11.9 (11.3–12.4) 1,562 16.1 (15.3–16.9) 1.4 (1.3–1.5) 4.3 (3.3–5.3) 105
20–24 Non-Hispanic white 846 6.0 (5.6–6.4) 889 8.8 (8.2–9.4) 1.5 (1.3–1.6) 4.6 (3.5–5.7) 115Non-Hispanic black 135 2.9 (2.4–3.4) 193 5.4 (4.7–6.2) 1.9 (1.5–2.3) 7.0 (3.7–10.4) 216Hispanic 601 5.5 (5.1–6.0) 706 8.3 (7.7–8.9) 1.5 (1.3–1.7) 5.6 (4.3–6.8) 151Total§§ 1,687 5.3 (5.1–5.6) 1,899 8.1 (7.7–8.4) 1.5 (1.4–1.6) 5.2 (4.4–6.0) 137
≥25 Non-Hispanic white 501 1.2 (1.1–1.3) 541 1.7 (1.6–1.9) 1.4 (1.3–1.6) 4.1 (2.6–5.6) 99Non-Hispanic black 71 0.9 (0.7–1.1) 77 1.2 (1.0–1.5) 1.4 (1.0–1.9) 3.5 (0.4–6.8) 81Hispanic 213 1.2 (1.0–1.3) 314 1.9 (1.7–2.1) 1.6 (1.3–1.9) 4.7 (2.4–7.2) 120Total§§ 853 1.2 (1.1–1.2) 1,014 1.7 (1.6–1.8) 1.5 (1.3–1.6) 4.5 (3.5–5.4) 111
Abbreviations: CI = confidence interval, PR = prevalence ratio. * States contributing data and years for which data are provided: Arizona (1995–2012), Arkansas (1995–2012), California (1995–2012), Colorado (1997–2012), Georgia
(1995–2012), Iowa (1995–2012), Kentucky (1998–2012), New Mexico (1998–2012), New York (1995–2012), North Carolina (1999–2012), Oklahoma (1995–2012), Rhode Island (2002–2012), Texas (1996–2012), Utah (1997–2012). Total live births = 21,278,784.
† Cases missing information on maternal age are not included in this table. § Prevalence per 10,000 live births. ¶ Prevalence during 2006–2012 divided by the prevalence during 1995–2005. ** Statistically significant differences from zero percent change. †† Overall percent change is calculated using the average annual percent change and represents the estimated overall change in prevalence during 1995–2012. §§ Total includes non-Hispanic white, non-Hispanic black, Hispanic, all other reported racial/ethnic groups and other/unknown maternal race/ethnicity.
Morbidity and Mortality Weekly Report
26 MMWR / January 22, 2016 / Vol. 65 / No. 2 US Department of Health and Human Services/Centers for Disease Control and Prevention
The findings in this report are subject to at least three limita-tions. First, because no information on risk factors other than maternal age and race/ethnicity was requested from state surveil-lance programs, potential causes for the increase in prevalence could not be examined. Second, not all states were able to pro-vide data as far back as 1995. However, incomplete data for the earlier years of the study is unlikely to affect the results. Because data were pooled for 1995–2005, the prevalence estimates for that earlier study period are more heavily influenced by the later years of that time frame. Previous research has demonstrated an increase in prevalence from 1995 to 2005; therefore, the missing data from earlier years in this study is likely to result in prevalence ratios that are biased slightly and conservatively toward the null. Finally, it is possible that the increase in preva-lence could be due to improved ascertainment of gastroschisis cases over time. However, this is unlikely because gastroschisis is immediately apparent at birth. Additionally, omphalocele, a defect that has a similar presentation at birth and previously shared an ICD-9-CM code with gastroschisis, is not increasing in prevalence, making it implausible that the increase observed is due to any confusion between these defects (10).
These findings have implications for prioritizing public health research on gastroschisis to identify factors contributing to the high risk associated with young maternal age and factors associated with the increasing prevalence over the past 20 years. Gastroschisis is unusual among birth defects in that it disproportionately affects younger mothers, a vulnerable population. The continued increase in age-adjusted prevalence and the pace of the increase suggests that unidentified risk factors might be contributing. Identification of these risk factors is needed to inform public health interven-tions and reduce prevalence. Ongoing surveillance is essential to monitor any further increases in prevalence.
Acknowledgments
Arizona Birth Defects Monitoring Program; Arkansas Reproductive Health Monitoring System; California Birth Defects Monitoring Program; Colorado Responds to Children with Special Needs Section; Iowa Registry for Congenital and Inherited Disorders; Kentucky Birth Surveillance Registry; Metropolitan Atlanta Congenital Defects Program, Atlanta, Georgia; New Mexico Birth Defects Prevention and Surveillance System; New York State Congenital Malformations Registry; North Carolina Birth Defects Monitoring Program; Oklahoma Birth Defect Registry; Rhode Island Birth Defects Surveillance Program; Texas Birth Defects Epidemiology and Surveillance Branch; Utah Birth Defect Network.
1Birth Defects Branch, National Center on Birth Defects and Developmental Disabilities, CDC; 2Baylor College of Medicine, Houston, Texas; 3California Birth Defects Monitoring Program, Maternal, Child and Adolescent Health Program, California Department of Public Health; 4Rhode Island Department of Health; 5March of Dimes Foundation, White Plains, New York; 6Kentucky Department for Public Health; 7Oklahoma State Department of Health; 8Georgia Department of Public Health; 9College of Public Health, University of South Florida; 10New Mexico Department of Health; 11Birth Defects Epidemiology and Surveillance Branch, Texas Department of State Health Services; 12Arkansas Reproductive Health Monitoring System, Arkansas Children’s Hospital Research Institute; 13Utah Birth Defect Network, Division of Family Health and Preparedness, Children with Special Health Care Needs Bureau, Utah Department of Health; 14Iowa Registry for Congenital and Inherited Disorders; 15Arizona Department of Health Services; 16North Carolina Division of Public Health.
Corresponding author: Abbey M. Jones, [email protected], 404-498-3018.
References 1. Kirby RS, Marshall J, Tanner JP, et al.; National Birth Defects Prevention
Network. Prevalence and correlates of gastroschisis in 15 states, 1995 to 2005. Obstet Gynecol 2013;122:275–81. http://dx.doi.org/10.1097/AOG.0b013e31829cbbb4.
2. Castilla EE, Mastroiacovo P, Orioli IM. Gastroschisis: international epidemiology and public health perspectives. Am J Med Genet C Semin Med Genet 2008;148C:162–79. http://dx.doi.org/10.1002/ajmg.c.30181.
3. Kim HJ, Fay MP, Feuer EJ, Midthune DN. Permutation tests for joinpoint regression with applications to cancer rates. Stat Med 2000;19:335–51.
4. Colombani PM, Cunningham MD. Perinatal aspects of omphalocele and gastroschisis. Am J Dis Child 1977;131:1386–8.
5. Rasmussen SA, Frías JL. Non-genetic risk factors for gastroschisis. Am J Med Genet C Semin Med Genet 2008;148C:199–212. http://dx.doi.org/10.1002/ajmg.c.30175.
6. Kazaura MR, Lie RT, Irgens LM, et al. Increasing risk of gastroschisis in Norway: an age-period-cohort analysis. Am J Epidemiol 2004;159:358–63. http://dx.doi.org/10.1093/aje/kwh051.
7. Ventura SJ, Hamilton BE, Mathews TJ. National and state patterns of teen births in the United States, 1940–2013. Natl Vital Stat Rep 2014;63:1-34.
8. Rittler M, Campaña H, Ermini ML, et al. Gastroschisis and young mothers: what makes them different from other mothers of the same age? Birth Defects Res A Clin Mol Teratol 2015;103:536–43. http://dx.doi.org/10.1002/bdra.23374.
9. Feldkamp ML, Reefhuis J, Kucik J, et al. Case-control study of self reported genitourinary infections and risk of gastroschisis: findings from the national birth defects prevention study, 1997–2003. BMJ 2008;336:1420–3. http://dx.doi.org/10.1136/bmj.39567.509074.25.
10. Marshall J, Salemi JL, Tanner JP, et al.; National Birth Defects Prevention Network. Prevalence, correlates, and outcomes of omphalocele in the United States, 1995–2005. Obstet Gynecol 2015;126:284–93. http://dx.doi.org/10.1097/AOG.0000000000000920.
SummaryWhat is already known on this topic?
Gastroschisis is strongly associated with young maternal age, and a previous U.S. report indicated that the prevalence of gastroschisis nearly doubled from 1995 to 2005.
What is added by this report?
Gastroschisis prevalence has increased for all maternal age groups. Significant increases as measured by the average annual percent change were observed for all assessed catego-ries of maternal age and race/ethnicity. The largest estimated increase over the 18 year period (263% overall percent change) was observed for non-Hispanic black mothers aged <20 years.
What are the implications for public health practice?
The observed increases in gastroschisis prevalence are not explained by demographic changes in maternal age or race/ethnicity. Public health research is urgently needed to identify the causal factor(s) contributing to this increase.
Morbidity and Mortality Weekly Report
MMWR / January 22, 2016 / Vol. 65 / No. 2 27US Department of Health and Human Services/Centers for Disease Control and Prevention
Among 1,683 persons in the United States who developed malaria following international travel during 2012, more than half acquired disease in one of 16 countries* in West Africa (1). Since March 2014, West Africa has experienced the world’s larg-est epidemic of Ebola virus disease (Ebola), primarily affecting Guinea, Sierra Leone, and Liberia; in 2014, approximately 20,000 Ebola cases were reported (2). Both Ebola and malaria are often characterized by fever and malaise and can be clinically indistin-guishable, especially early in the course of disease. Immediate laboratory testing is critical for diagnosis of both Ebola and malaria, so that appropriate lifesaving treatment can be initiated. CDC recommends prompt malaria testing of patients with fever and history of travel to an area that is endemic for malaria, using blood smear microscopy, with results available within a few hours (3). Empiric treatment of malaria is not recommended by CDC (4). Reverse transcription–polymerase chain reaction (RT-PCR) testing is recommended to diagnose Ebola (5). During the Ebola outbreak in West Africa, CDC received reports of delayed labora-tory testing for malaria in travelers returning to the United States because of infection control concerns related to Ebola (6). CDC reviewed documented calls to its malaria consultation service and selected three patient cases to present as examples of deficiencies in the evaluation and treatment of malaria among travelers returning from Africa during the Ebola epidemic.
Malaria parasites can be detected by microscopic examination of a Giemsa-stained drop of the patient’s blood (a blood smear). CDC recommends that both thick and thin blood smears be obtained immediately for all febrile patients who have a com-patible travel history, regardless of other associated symptoms, and that results be available within hours (3). Malaria can be conclusively ruled out in 24 hours by three negative smears col-lected at 12-hour intervals. Blood smears also provide information about the infecting species and level of parasitemia (percentage of infected red blood cells), which, along with signs and symptoms, determine appropriate antimalarial treatment. Severe malaria, defined as the presence of ≥5% of infected red blood cells, or at least one of several complications,† should be treated with
intravenous antimalarials (4). Treatment of malaria without information from the blood smear can lead to poor outcomes because of incorrect antimalarial selection, inappropriate treat-ment of severe malaria with oral antimalarials, and misdiagnosis of other febrile illnesses that are not malaria. Empiric treatment of malaria is not recommended (4).
Since October 2014, travelers from countries with ongoing Ebola virus transmission have been screened upon arrival at U.S. airports to ascertain risk factors and signs and symptoms of Ebola, and are assigned to one of four risk categories.§ Healthy travelers who are classified as having “low but not zero” risk for Ebola are actively monitored by state or local public health authorities; travelers must check their temperature twice daily for 21 days after arrival, and must call the health department for evaluation if symptoms or temperature ≥100.4°F occur.¶ A person with fever or symptoms suggestive of Ebola who had an epidemiologic risk factor within 21 days before symptom onset is considered a person under investigation for Ebola.** Because malaria is endemic year-round and countrywide in the countries where Ebola transmission is occurring (3), persons who have fever and are under investigation for Ebola should always receive immediate malaria testing (7).
At CDC, the Malaria Branch of the Division of Parasitic Diseases and Malaria conducts malaria surveillance and pro-vides clinical consultation for the diagnosis and management of malaria. Through this consultation service, CDC became aware of delays in malaria diagnosis and treatment related to concerns about Ebola. Three case reports are presented to illus-trate inadequate diagnosis and treatment of malaria in persons who traveled to Africa during the Ebola epidemic.
Case 1In March 2015, a man aged 34 years entered the United
States after visiting Sierra Leone, Guinea, and Senegal. He was afebrile, classified as having low but not zero risk for Ebola, and was enrolled in the active monitoring process. Seven days after returning to the United States (day 1 of illness), he developed nausea, anorexia, and a 105.8°F fever; early that morning, he
Inadequate Diagnosis and Treatment of Malaria Among Travelers Returning from Africa During the Ebola Epidemic — United States, 2014–2015
Kathrine R. Tan, MD1; Karen A. Cullen, PhD1; Emilia H. Koumans, MD2; Paul M. Arguin, MD1
* Benin, Burkina Faso, Cape Verde, Côte d’Ivoire, Gambia, Ghana, Guinea, Guinea-Bissau, Liberia, Mali, Mauritania, Niger, Nigeria, Senegal, Sierra Leone, and Togo.
† Severe malaria is defined as the presence of at least one of the following in a patient with malaria: acidosis, acute respiratory distress syndrome, seizures, disseminated intravascular congestion, hyperparasitemia (≥5% parasitemia), hypoglycemia, impaired consciousness, jaundice, acute renal injury, severe anemia (hemoglobin <7g/dL), or shock.
§ http://www.cdc.gov/vhf/ebola/exposure/risk-factors-when-evaluating-person-for-exposure.html.
¶ http://www.cdc.gov/vhf/ebola/exposure/monitoring-and-movement-of-persons-with-exposure.html.
** http://www.cdc.gov/vhf/ebola/healthcare-us/evaluating-patients/case-definition.html.
Morbidity and Mortality Weekly Report
28 MMWR / January 22, 2016 / Vol. 65 / No. 2 US Department of Health and Human Services/Centers for Disease Control and Prevention
called emergency medical services (EMS) rather than the local health department. When he told EMS responders his travel history while en route to the hospital, the responders stopped the vehicle, donned personal protective equipment, and then proceeded to hospital A, where the patient was placed in isola-tion and was given oral medications for his fever. Blood was drawn for malaria testing, but the laboratory would not process the specimens, citing concern about possible Ebola exposure. The state laboratory agreed to test the specimens.
At 3:00 p.m. that afternoon, malaria PCR test results were determined to be positive, and Ebola RT-PCR results and influenza test results of a nasopharyngeal swab were both nega-tive. The state health department and CDC advised hospital A to begin antimalarial treatment immediately. Because blood smear microscopy was not done, it was not known whether the patient had hyperparasitemia (≥5% parasitemia), which is one sign of severe malaria, and for which parenteral antimalarials are indicated. However, because hospital staff members feared Ebola, they were not comfortable placing an intravenous cath-eter. The patient was given an oral antimalarial (artemether-lumefantrine) on the evening of day 1, and was transferred to hospital B on day 2, where a thin smear confirmed Plasmodium falciparum malaria with a 2.5% parasitemia. He completed oral therapy, had no complications, and was discharged 3 days later.
Case 2In March 2015, 1 day before traveling to the United States
from Kenya, a man aged 69 years developed subjective fever. No Ebola transmission has been reported in Kenya. On the third day of fever, he visited an urgent-care clinic and reported his recent travel to Kenya. No tests were performed, and the patient was given a prescription for the antimalarial mefloquine for empiric treatment of suspected malaria. He was unable to fill the prescription because local pharmacies did not have the medication in stock.
The man continued to have fever, myalgias, and weakness, and went to an emergency department (ED) at midday. Blood was drawn for malaria testing, but malaria microscopy services were not available on weekends. The patient was released from the ED and told that the laboratory results would be available in 2 days. He received no treatment. His fever persisted, and his weakness increased; at midnight he visited a different ED, again reporting his travel to Kenya. Because of his history of travel to Africa, he was placed in isolation and his medical assessment was suspended for the next 4 hours until the hos-pital staff members were assured that a traveler from Kenya was not at risk for Ebola. Blood smear microscopy was positive for P. falciparum, but the level of parasitemia was not reported. He was treated with oral atovaquone-proguanil and discharged
later that morning. He completed his antimalarial treatment and recovered with no complications.
Case 3In May 2015, a woman aged 31 years returned to the United
States from Sierra Leone and visited an ED with fever and abdominal pain. The hospital laboratory refused to perform any diagnostic testing, including malaria smears, until a diag-nosis of Ebola was ruled out. After discussions involving clini-cians, the state health department, and CDC, and hours after arrival, a malaria rapid diagnostic test that had been approved by the Food and Drug Administration for laboratory use only was performed at bedside and was negative. Following a nega-tive Ebola RT-PCR result 9 hours later, other laboratory tests were performed, leading to the diagnosis of a urinary tract infection. A malaria smear was not performed. The clinical outcome for this patient is not known.
Discussion
Malaria is a common cause of fever among travelers who have been to areas where the disease is endemic. Patients in whom a diagnosis of malaria is suspected should be urgently evaluated. One study evaluating the etiology of fever among returned travelers seeking care at a multicenter, multinational travel clinic network found malaria to be the most common single etiologic diagnosis, accounting for 21% of all diagnoses (8). Health care providers should ask patients with fever about places of recent travel. Febrile persons with history of travel to a malaria-endemic area should be tested for malaria with blood smear microscopy without delay, irrespective of whether travel occurred in an Ebola-affected country. Although current recommendations for preparing malaria smears remain the standard (9), CDC has developed a Giemsa staining procedure that inactivates viruses, including Ebola virus, during slide preparation to increase the safety of this testing procedure (7).
These three case reports illustrate inappropriate practices in evaluation and management of febrile travelers and inadequate diagnosis and treatment for malaria because of concerns about possible exposure to Ebola. In case 1, the hospital laboratory’s reluctance to process the patient’s blood specimen introduced delay in malaria testing, and PCR testing rather than blood smear testing for malaria was performed at the state laboratory. Furthermore, intravenous access is of paramount importance to deliver fluids and medications in dehydrated or very ill patients; therefore, unrestricted access to parenteral interventions was important should the patient’s condition have deteriorated. In case 2, a prescription for empiric malaria treatment was provided without laboratory diagnosis, contrary to CDC recommendations (4). Furthermore, delayed malaria testing occurred when clinical assessment was halted until hospital staff
Morbidity and Mortality Weekly Report
MMWR / January 22, 2016 / Vol. 65 / No. 2 29US Department of Health and Human Services/Centers for Disease Control and Prevention
members could be reassured that the patient was not at risk for Ebola. In case 3, Ebola infection control fears led to the use of a bedside rapid diagnostic test to rule out malaria, despite this test not being approved by the Food and Drug Administration for point-of-care testing. Using a rapid diagnostic test to rule out malaria instead of blood smear microscopy is also contrary to CDC recommendations (4).
An internal review of Ebola-related inquiries to CDC found that 1) recommended steps in the evaluation of febrile persons who traveled to an area with endemic malaria (3) were followed in the evaluation of fewer than one third of febrile travelers, regardless of whether they had come from an Ebola-affected country; 2) although intravenous antimalarials are recommended for all patients with severe malaria to rapidly reduce parasitemia, increase the probability of survival, and decrease the likelihood of complications (10), only one third of patients with severe malaria received intravenous antimalarials; and 3) more than one third of the antimalarials received by travelers were prescribed empirically (Division of Parasitic Diseases and Malaria, Center for Global Health, CDC, unpublished data, 2014–2015).
The findings in this report are subject to at least two limi-tations. First, the case reports were selected intentionally to illustrate the occurrence of suboptimal practices; however, the prevalence of these practices is not known. Second, the cases described were reconstructed from consultation notes, and clinical details were missing for some of these cases, such as the outcome of case 3.
These selected case reports indicate inadequate implemen-tation of current malaria diagnostic and treatment guidelines
among febrile travelers who had been to malaria-endemic countries, related, in part, to health care provider and labo-ratory concerns about risks for possible exposure to Ebola during diagnostic evaluations and clinical procedures. It is important that all febrile patients with history of travel to a malaria-endemic country be tested for malaria as soon as pos-sible using blood smear microscopy, regardless of their other risk factors, with results available within hours (3). Further information on safe diagnosis of malaria can be found in CDC’s Guidance for Malaria Diagnosis in Patients Suspected of Ebola Infection in the United States (7). It is also critical that after receipt of a positive malaria test result, appropriate antimalarials, including parenteral antimalarials for severe malaria, be started without delay (4). Empiric treatment of malaria is not recommended (4).
Acknowledgments
Shirley Lecher, Achala Jayatelleki, Eyal Leshem, Christopher Lehmann, Elliot Raizes, Paul Mead, CDC.
1Division of Parasitic Diseases and Malaria, Center for Global Health, CDC; 2Divison of Reproductive Health, National Center for Chronic Disease Prevention and Health Promotion, CDC.
Corresponding author: Kathrine R. Tan, [email protected], 404-718-4701.
References 1. Cullen KA, Arguin PM. Malaria surveillance—United States, 2012.
MMWR Surveill Summ 2014;63:1–22. 2. CDC. 2014 Ebola outbreak in West Africa: case counts. Atlanta, GA:
US Department of Health and Human Services, CDC; 2014. http://www.cdc.gov/vhf/ebola/outbreaks/2014-west-africa/previous-case-counts.html.
3. CDC. Health information for international travel 2016. New York, NY: Oxford University Press; 2016.
4. CDC. Treatment of malaria (guidelines for clinicians). Atlanta, GA: US Department of Health and Human Services, CDC; 2013. http://www.cdc.gov/malaria/resources/pdf/clinicalguidance.pdf.
5. CDC. Guidance for collection, transport and submission of specimens for Ebola virus testing. Atlanta, GA: US Department of Health and Human Services, CDC; 2015. http://www.cdc.gov/vhf/ebola/healthcare-us/laboratories/specimens.html.
6. Karwowski MP, Meites E, Fullerton KE, et al. Clinical inquiries regarding Ebola virus disease received by CDC—United States, July 9–November 15, 2014. MMWR Morb Mortal Wkly Rep 2014;63:1175–9.
7. CDC. Guidance for malaria diagnosis in patients suspected of Ebola infection in the United States. Atlanta, GA: US Department of Health and Human Services, CDC; 2015. http://www.cdc.gov/malaria/new_info/2014/malaria_ebola.htm.
8. Wilson ME, Weld LH, Boggild A, et al. Fever in returned travelers: results from the GeoSentinel Surveillance Network. Clin Infect Dis 2007;44:1560–8. http://dx.doi.org/10.1086/518173.
9. CDC. Laboratory diagnosis of malaria: staining for malaria parasites. Atlanta, GA: US Department of Health and Human Services, CDC; 2015. http://www.cdc.gov/dpdx/resources/pdf/benchAids/malaria/malaria_staining_benchaid.pdf.
10. Griffith KS, Lewis LS, Mali S, Parise ME. Treatment of malaria in the United States. JAMA 2007;297:2264–77. http://dx.doi.org/10.1001/jama.297.20.2264.
SummaryWhat is already known on this topic?
Malaria cases are rarely diagnosed in the United States; however, malaria is potentially fatal if the diagnosis or treat-ment, or both, are delayed. Febrile travelers who recently visited a malaria-endemic area should be tested for malaria without delay by blood smear microscopy, with results available within hours. Empiric treatment of malaria is not recommended.
What is added by this report?
During the Ebola epidemic, there were deficiencies in malaria diagnosis, treatment, and laboratory practices in the United States related to concerns about exposure of laboratory and clinical staff members to Ebola.
What are the implications for public health practice?
Malaria evaluation should be prioritized in febrile persons who travelled to malaria-endemic areas regardless of travel to an Ebola-affected country. Timely and immediate education is needed for health care providers and laboratory managers to encourage adherence to guidelines for evaluation and manage-ment of malaria in the febrile traveler to prevent poor outcomes.
Morbidity and Mortality Weekly Report
30 MMWR / January 22, 2016 / Vol. 65 / No. 2 US Department of Health and Human Services/Centers for Disease Control and Prevention
On January 19, 2016, this report was posted as an MMWR Early Release on the MMWR website (http://www.cdc.gov/mmwr).
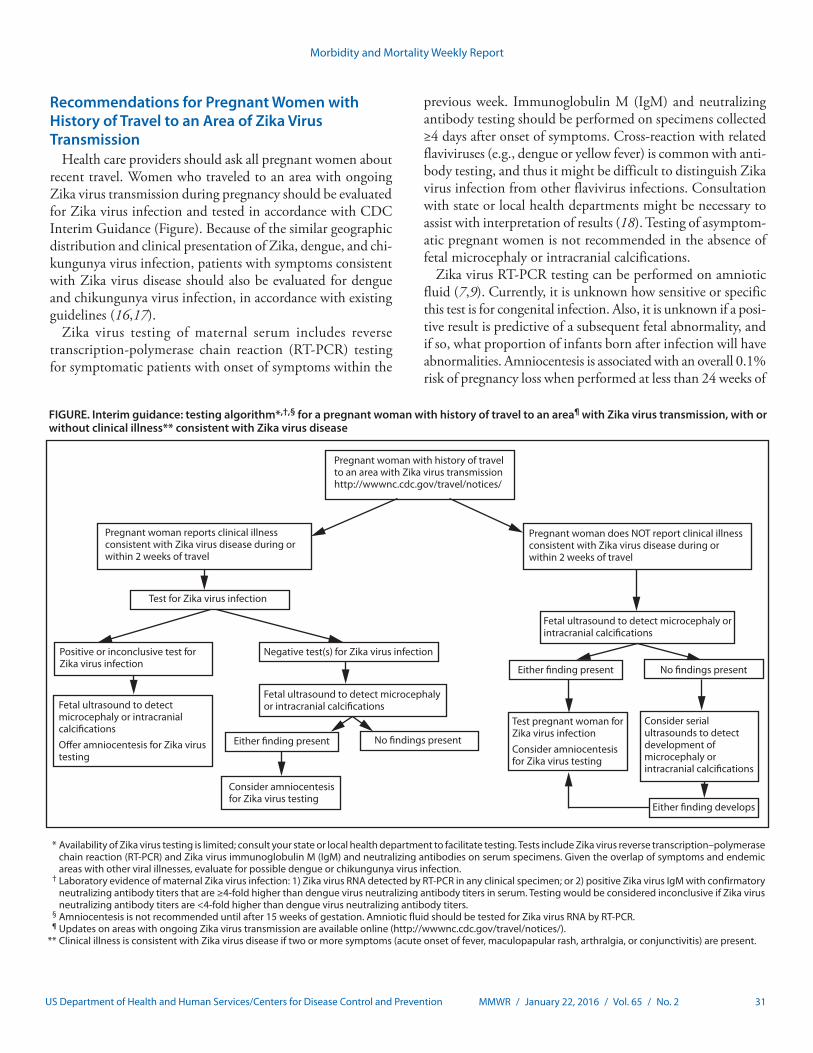
CDC has developed interim guidelines for health care pro-viders in the United States caring for pregnant women during a Zika virus outbreak. These guidelines include recommenda-tions for pregnant women considering travel to an area with Zika virus transmission and recommendations for screening, testing, and management of pregnant returning travelers. Updates on areas with ongoing Zika virus transmission are available online (http://wwwnc.cdc.gov/travel/notices/). Health care providers should ask all pregnant women about recent travel. Pregnant women with a history of travel to an area with Zika virus transmission and who report two or more symptoms consistent with Zika virus disease (acute onset of fever, maculopapular rash, arthralgia, or conjunctivitis) during or within 2 weeks of travel, or who have ultrasound findings of fetal microcephaly or intracranial calcifications, should be tested for Zika virus infection in consultation with their state or local health department. Testing is not indicated for women without a travel history to an area with Zika virus transmission. In pregnant women with laboratory evidence of Zika virus infection, serial ultrasound examination should be considered to monitor fetal growth and anatomy and referral to a maternal-fetal medicine or infectious disease specialist with expertise in pregnancy management is recommended. There is no specific antiviral treatment for Zika virus; supportive care is recommended.
Zika virus is a mosquito-borne flavivirus transmitted primar-ily by Aedes aegypti mosquitoes (1,2). These vectors also trans-mit dengue and chikungunya virus and are found throughout much of the Americas, including parts of the United States. An estimated 80% of persons infected with Zika virus are asymptomatic (2,3). Symptomatic disease is generally mild and characterized by acute onset of fever, maculopapular rash, arthralgia, or nonpurulent conjunctivitis. Symptoms usually last from several days to 1 week. Severe disease requiring hospi-talization is uncommon, and fatalities are rare. Guillain-Barré syndrome has been reported in patients following suspected Zika virus infection (4–6).
Pregnant women can be infected with Zika virus in any trimester (4,7,8). The incidence of Zika virus infection in pregnant women is not currently known, and data on pregnant
women infected with Zika virus are limited. No evidence exists to suggest that pregnant women are more susceptible to Zika virus infection or experience more severe disease during pregnancy.
Maternal-fetal transmission of Zika virus has been docu-mented throughout pregnancy (4,7,8). Although Zika virus RNA has been detected in the pathologic specimens of fetal losses (4), it is not known if Zika virus caused the fetal losses. Zika virus infections have been confirmed in infants with microcephaly (4), and in the current outbreak in Brazil, a marked increase in the number of infants born with micro-cephaly has been reported (9). However, it is not known how many of the microcephaly cases are associated with Zika virus infection. Studies are under way to investigate the association of Zika virus infection and microcephaly, including the role of other contributory factors (e.g., prior or concurrent infec-tion with other organisms, nutrition, and environment). The full spectrum of outcomes that might be associated with Zika virus infections during pregnancy is unknown and requires further investigation.
Recommendations for Pregnant Women Considering Travel to an Area of Zika Virus Transmission
Because there is neither a vaccine nor prophylactic medica-tions available to prevent Zika virus infection, CDC recom-mends that all pregnant women consider postponing travel to areas where Zika virus transmission is ongoing (10). If a pregnant woman travels to an area with Zika virus transmis-sion, she should be advised to strictly follow steps to avoid mosquito bites (11,12). Mosquitoes that spread Zika virus bite both indoors and outdoors, mostly during the daytime; therefore, it is important to ensure protection from mosquitoes throughout the entire day (13). Mosquito prevention strategies include wearing long-sleeved shirts and long pants, using U.S. Environmental Protection Agency (EPA)–registered insect repellents, using permethrin-treated clothing and gear, and staying and sleeping in screened-in or air-conditioned rooms. When used as directed on the product label, insect repellents containing DEET, picaridin, and IR3535 are safe for pregnant women (14,15). Further guidelines for using insect repellents are available online (http://wwwnc.cdc.gov/travel/page/avoid-bug-bites) (11,15).
Interim Guidelines for Pregnant Women During a Zika Virus Outbreak — United States, 2016
Emily E. Petersen, MD1; J. Erin Staples, MD, PhD2; Dana Meaney-Delman, MD3; Marc Fischer, MD2; Sascha R. Ellington, MSPH1; William M. Callaghan, MD1; Denise J. Jamieson, MD1
Morbidity and Mortality Weekly Report
MMWR / January 22, 2016 / Vol. 65 / No. 2 31US Department of Health and Human Services/Centers for Disease Control and Prevention
FIGURE. Interim guidance: testing algorithm*,†,§ for a pregnant woman with history of travel to an area¶ with Zika virus transmission, with or without clinical illness** consistent with Zika virus disease
* Availability of Zika virus testing is limited; consult your state or local health department to facilitate testing. Tests include Zika virus reverse transcription–polymerase chain reaction (RT-PCR) and Zika virus immunoglobulin M (IgM) and neutralizing antibodies on serum specimens. Given the overlap of symptoms and endemic areas with other viral illnesses, evaluate for possible dengue or chikungunya virus infection.
† Laboratory evidence of maternal Zika virus infection: 1) Zika virus RNA detected by RT-PCR in any clinical specimen; or 2) positive Zika virus IgM with confirmatory neutralizing antibody titers that are ≥4-fold higher than dengue virus neutralizing antibody titers in serum. Testing would be considered inconclusive if Zika virus neutralizing antibody titers are <4-fold higher than dengue virus neutralizing antibody titers.
§ Amniocentesis is not recommended until after 15 weeks of gestation. Amniotic fluid should be tested for Zika virus RNA by RT-PCR. ¶ Updates on areas with ongoing Zika virus transmission are available online (http://wwwnc.cdc.gov/travel/notices/). ** Clinical illness is consistent with Zika virus disease if two or more symptoms (acute onset of fever, maculopapular rash, arthralgia, or conjunctivitis) are present.
Pregnant woman with history of travel to an area with Zika virus transmissionhttp://wwwnc.cdc.gov/travel/notices/
Pregnant woman reports clinical illness consistent with Zika virus disease during or within 2 weeks of travel
Test for Zika virus infection
Positive or inconclusive test for Zika virus infection
Fetal ultrasound to detect microcephaly or intracranial calci�cationsO�er amniocentesis for Zika virus testing
Negative test(s) for Zika virus infection
Fetal ultrasound to detect microcephaly or intracranial calci�cations
Either �nding present No �ndings present
Consider amniocentesis for Zika virus testing
Pregnant woman does NOT report clinical illness consistent with Zika virus disease during or within 2 weeks of travel
Fetal ultrasound to detect microcephaly or intracranial calci�cations
Either �nding present No �ndings present
Test pregnant woman for Zika virus infection Consider amniocentesis for Zika virus testing
Consider serial ultrasounds to detect development of microcephaly or intracranial calci�cations
Either �nding develops
Recommendations for Pregnant Women with History of Travel to an Area of Zika Virus Transmission
Health care providers should ask all pregnant women about recent travel. Women who traveled to an area with ongoing Zika virus transmission during pregnancy should be evaluated for Zika virus infection and tested in accordance with CDC Interim Guidance (Figure). Because of the similar geographic distribution and clinical presentation of Zika, dengue, and chi-kungunya virus infection, patients with symptoms consistent with Zika virus disease should also be evaluated for dengue and chikungunya virus infection, in accordance with existing guidelines (16,17).
Zika virus testing of maternal serum includes reverse transcription-polymerase chain reaction (RT-PCR) testing for symptomatic patients with onset of symptoms within the
previous week. Immunoglobulin M (IgM) and neutralizing antibody testing should be performed on specimens collected ≥4 days after onset of symptoms. Cross-reaction with related flaviviruses (e.g., dengue or yellow fever) is common with anti-body testing, and thus it might be difficult to distinguish Zika virus infection from other flavivirus infections. Consultation with state or local health departments might be necessary to assist with interpretation of results (18). Testing of asymptom-atic pregnant women is not recommended in the absence of fetal microcephaly or intracranial calcifications.
Zika virus RT-PCR testing can be performed on amniotic fluid (7,9). Currently, it is unknown how sensitive or specific this test is for congenital infection. Also, it is unknown if a posi-tive result is predictive of a subsequent fetal abnormality, and if so, what proportion of infants born after infection will have abnormalities. Amniocentesis is associated with an overall 0.1% risk of pregnancy loss when performed at less than 24 weeks of
Morbidity and Mortality Weekly Report
32 MMWR / January 22, 2016 / Vol. 65 / No. 2 US Department of Health and Human Services/Centers for Disease Control and Prevention
gestation (19). Amniocentesis performed ≥15 weeks of gesta-tion is associated with lower rates of complications than those performed at earlier gestational ages, and early amniocentesis (≤14 weeks of gestation) is not recommended (20). Health care providers should discuss the risks and benefits of amniocentesis with their patients. A positive RT-PCR result on amniotic fluid would be suggestive of intrauterine infection and potentially useful to pregnant women and their health care providers (20).
For a live birth with evidence of maternal or fetal Zika virus infection, the following tests are recommended: histopatho-logic examination of the placenta and umbilical cord; testing of frozen placental tissue and cord tissue for Zika virus RNA; and testing of cord serum for Zika and dengue virus IgM and neutralizing antibodies. CDC is developing guidelines for infants infected by Zika virus. If a pregnancy results in a fetal loss in a woman with history of travel to an area of Zika virus transmission with symptoms consistent with Zika virus disease during or within 2 weeks of travel or findings of fetal microcephaly, Zika virus RT-PCR and immunohistochemi-cal staining should be performed on fetal tissues, including umbilical cord and placenta.
There is no commercially available test for Zika virus. Testing for Zika virus infection is performed at CDC and several state health departments. Health care providers should contact their state or local health department to facilitate testing and for assistance with interpreting results (4).
How to Treat Pregnant Women with Diagnoses of Zika Virus Disease
No specific antiviral treatment is available for Zika virus disease. Treatment is generally supportive and can include rest, fluids, and use of analgesics and antipyretics (4). Fever should be treated with acetaminophen (21). Although aspirin and other nonsteroidal anti-inflammatory drugs are not typically used in pregnancy, these medications should specifically be avoided until dengue can be ruled out to reduce the risk for hemorrhage (4,9,17).
In pregnant a woman with laboratory evidence of Zika virus in serum or amniotic fluid, serial ultrasounds should be considered to monitor fetal anatomy and growth every 3–4 weeks. Referral to a maternal-fetal medicine or infectious disease specialist with expertise in pregnancy management is recommended.
1Division of Reproductive Health, National Center for Chronic Disease Prevention and Health Promotion, CDC; 2Arboviral Diseases Branch, National Center for Emerging and Zoonotic Infectious Diseases, CDC; 3Office of the Director, National Center for Emerging and Zoonotic Infectious Diseases, CDC.
Corresponding author: Denise Jamieson, [email protected], 770-488-6377.
References 1. Hayes EB. Zika virus outside Africa. Emerg Infect Dis 2009;15:1347–50.
http://dx.doi.org/10.3201/eid1509.090442. 2. CDC. Zika virus. Atlanta, GA: US Department of Health and Human
Services, CDC; 2016. http://www.cdc.gov/zika/index.html. 3. Duffy MR, Chen TH, Hancock WT, et al. Zika virus outbreak on Yap
Island, Federated States of Micronesia. N Engl J Med 2009;360:2536–43. http://dx.doi.org/10.1056/NEJMoa0805715.
4. CDC. CDC health advisory: recognizing, managing, and reporting Zika virus infections in travelers returning from Central America, South America, the Caribbean and Mexico. Atlanta, GA: US Department of Health and Human Services, CDC; 2016. http://emergency.cdc.gov/han/han00385.asp.
5. Oehler E, Watrin L, Larre P, et al. Zika virus infection complicated by Guillain-Barre syndrome—case report, French Polynesia, December 2013. Euro Surveill 2014;19:4–6. http://dx.doi.org/10.2807/1560-7917.ES2014.19.9.20720.
6. Musso D, Nilles EJ, Cao-Lormeau VM. Rapid spread of emerging Zika virus in the Pacific area. Clin Microbiol Infect 2014;20:O595–6. http://dx.doi.org/10.1111/1469-0691.12707.
7. Besnard M, Lastere S, Teissier A, Cao-Lormeau V, Musso D. Evidence of perinatal transmission of Zika virus, French Polynesia, December 2013 and February 2014. Euro Surveill 2014;19:13–6. http://dx.doi.org/10.2807/1560-7917.ES2014.19.13.20751.
8. Oliveira Melo AS, Malinger G, Ximenes R, Szejnfeld PO, Alves Sampaio S, Bispo de Filippis AM. Zika virus intrauterine infection causes fetal brain abnormality and microcephaly: tip of the iceberg? Ultrasound Obstet Gynecol 2016;47:6–7. http://dx.doi.org/10.1002/uog.15831.
9. European Centre for Disease Prevention and Control. Rapid risk assessment. Zika virus epidemic in the Americas: potential association with microcephaly and Guillain-Barré syndrome. Stockholm, Sweden: European Centre for Disease Prevention and Control; 2015. http://ecdc.europa.eu/en/publications/Publications/zika-virus-americas-association-with-microcephaly-rapid-risk-assessment.pdf.
10. CDC. Travelers’ health. CDC issues interim travel guidance related to Zika virus for 14 countries and territories in Central and South America and the Caribbean. Atlanta, GA: US Department of Health and Human Services, CDC; 2016. http://wwwnc.cdc.gov/travel/notices.
11. CDC. Travelers’ health: avoid bug bites. Atlanta, GA: US Department of Health and Human Services, CDC; 2013. http://wwwnc.cdc.gov/travel/page/avoid-bug-bites.
12. CDC. Zika virus: prevention. Atlanta, GA: US Department of Health and Human Services, CDC; 2015. http://www.cdc.gov/zika/prevention/index.html.
13. Schaffner F, Mathis A. Dengue and dengue vectors in the WHO European region: past, present, and scenarios for the future. Lancet Infect Dis 2014;14:1271–80. http://dx.doi.org/10.1016/S1473-3099(14)70834-5.
14. CDC. West Nile virus: insect repellent use & safety. Atlanta, GA: US Department of Health and Human Services, CDC; 2015. http://www.cdc.gov/westnile/faq/repellent.html.
15. CDC. Travelers’ health: protection against mosquitoes, ticks, & other arthropods. Atlanta, GA: US Department of Health and Human Services, CDC; 2015. http://wwwnc.cdc.gov/travel/yellowbook/2016/the-pre-travel-consultation/protection-against-mosquitoes-ticks-other-arthropods.
16. CDC. Chikungunya virus: clinical evaluation & disease. Atlanta, GA: US Department of Health and Human Services, CDC; 2015. http://www.cdc.gov/chikungunya/hc/clinicalevaluation.html.
17. World Health Organization. Dengue: guidelines for diagnosis, treatment, prevention and control. Geneva, Switzerland: World Health Organization; 2009. http://apps.who.int/iris/bitstream/10665/44188/1/9789241547871_eng.pdf.
18. CDC. Zika virus. For health care providers: diagnostic testing. Atlanta, GA: US Department of Health and Human Services, CDC; 2015. http://www.cdc.gov/zika/hc-providers/diagnostic.html.
Morbidity and Mortality Weekly Report
MMWR / January 22, 2016 / Vol. 65 / No. 2 33US Department of Health and Human Services/Centers for Disease Control and Prevention
19. Akolekar R, Beta J, Picciarelli G, Ogilvie C, D’Antonio F. Procedure-related risk of miscarriage following amniocentesis and chorionic villus sampling: a systematic review and meta-analysis. Ultrasound Obstet Gynecol 2015;45:16–26. http://dx.doi.org/10.1002/uog.14636.
20. American Academy of Pediatrics/American College of Obstetricians and Gynecologists. Guidelines for perinatal care. 7th ed. Elk Grove Village, IL: American Academy of Pediatrics/American College of Obstetricians and Gynecologists; 2012.
21. Rasmussen SA, Kissin DM, Yeung LF, et al.; Pandemic Influenza and Pregnancy Working Group. Preparing for influenza after 2009 H1N1: special considerations for pregnant women and newborns. Am J Obstet Gynecol 2011;204(Suppl 1):S13–20. http://dx.doi.org/10.1016/j.ajog.2011.01.048.
Morbidity and Mortality Weekly Report
34 MMWR / January 22, 2016 / Vol. 65 / No. 2 US Department of Health and Human Services/Centers for Disease Control and Prevention
Notes from the Field
Outbreak of Locally Acquired Cases of Dengue Fever — Hawaii, 2015
David Johnston, MPH1; Melissa Viray, MD1; Jenny Ushiroda1; A. Christian Whelen, PhD1; Rebecca Sciulli1; Remedios Gose1; Roland
Lee1; Eric Honda1; Sarah Y. Park, MD1; Hawaii Dengue Response Team1
On October 21, 2015, the Hawaii Department of Health (HDOH) was notified of a positive dengue immunoglobulin M (IgM) antibody result in a woman residing on Hawaii Island (also known as the Big Island). The patient had no history of travel off the island, and other family members reported having similar signs and symptoms, which consisted of fever, headache, myalgias and arthralgias, and a generalized erythematous rash. HDOH initi-ated an investigation to identify any additional cases and potential exposure sources. On October 24, HDOH received report of a group of mainland U.S. visitors who had traveled together on Hawaii Island, including several who had developed a febrile illness. Additionally, on October 27, HDOH was notified of an unrelated person, also on Hawaii Island, with a positive dengue IgM result. As of November 26, 2015, HDOH had identified 107 laboratory-confirmed cases of dengue fever (1), with dates of onset ranging from September 11 to November 18, 2015 (Figure).
To facilitate case finding, a medical advisory was distributed to clinicians on Hawaii Island on October 29 to alert them and request that they report any patients who were evaluated on or after September 1, 2015, for suspected dengue fever (acute onset fever and at least two of the following: headache or retro-orbital pain, nausea, myalgias or arthralgias, or a generalized maculopapular rash). A similar medical advisory was sent to clinicians in the rest of the state on November 5. To identify other suspected cases of den-gue fever in travelers who had been visiting Hawaii Island during September–October 2015, on October 29, HDOH posted a call for cases on Epi-X, CDC’s secure epidemic information exchange.
Among the 107 dengue patients identified, 15 (14%) were hospitalized; no deaths were reported. Ninety-three (87%) cases occurred in Hawaii Island residents, and 14 in travelers visiting Hawaii Island; 62 (58%) patients were female, and the median age was 29 years (range = 0–80 years). Exposure information from a majority of patients suggested at least one area of concern south of Kona, Hawaii. However, further inves-tigations are ongoing, and cases have been reported in persons who traveled to and potentially sustained or recalled actual mosquito bites in other parts of the island. Among these cases are at least 12 (12%) persons who were never in any area south of Kona during the period of likely infection (3–10 days before symptom onset). Staff persons from HDOH Vector Control are conducting assessments across Hawaii Island to identify
possible areas of mosquito activity, and public outreach and education on mosquito avoidance and reduction are ongoing.
Dengue is not endemic in the state of Hawaii; however, Aedes mosquitoes capable of spreading the virus are present, specifically Aedes albopictus on all islands and, on Hawaii Island, A. aegypti as well (2). Locally acquired cases can result when mosquitoes bite infected travelers, including visitors and returning residents, and then bite others. Since World War II, the state of Hawaii has experienced only two other dengue fever outbreaks, in 2011 on the island of Oahu (Disease Outbreak Control Division, Hawaii Department of Health, unpublished data, 2011) and in 2001 on Maui, Oahu, and Kauai (2); before World War II, autochthonous transmission of dengue had been common (2). Although visitors were among the initial cases identified in the latest outbreak, results of the HDOH call for cases suggest the risk for infection is considerably greater for Hawaii Island residents. Nonetheless, travelers to the state, and especially to Hawaii Island, should refer to the HDOH website (http://health.hawaii.gov/docd/dengue-outbreak-2015/) for details regarding the ongoing outbreak or the CDC dengue website (http://www.cdc.gov/Dengue/) for further information regarding dengue, take appropriate precautions to avoid mosquito bites, and be aware of the potential signs of dengue infection.
All travelers, whether visitors to the state of Hawaii or return-ing residents, should consult with and advise their health care providers regarding their recent travel if they develop illness within 2 weeks of their return home. All health care providers, especially those in Hawaii, should be familiar with and alert for signs and symptoms of dengue fever, as well as for other more common infections such as leptospirosis, which sometimes mimics dengue infection. Additionally, health care providers should know the warning signs and management of potential severe dengue (i.e., dengue hemorrhagic fever) (1). It is impor-tant for all persons, and especially for state of Hawaii residents and those on Hawaii Island, to avoid exposure to mosquitoes, eliminate potential mosquito breeding locations from their property, and protect themselves from mosquito bites.
1Hawaii Department of Health.
Corresponding author: Sarah Y. Park, [email protected], 808-587-6845.
References1. CDC. Dengue virus infections. 2015 case definition. Atlanta, GA: US
Department of Health and Human Services, CDC, National Notifiable Diseases Surveillance System; 2015. http://wwwn.cdc.gov/nndss/conditions/dengue-virus-infections/case-definition/2015/.
2. Effler PV, Pang L, Kitsutani P, et al. Dengue fever, Hawaii, 2001–2002. Emerg Infect Dis 2005;11:742–9. http://dx.doi.org/10.3201/eid1105.041063.
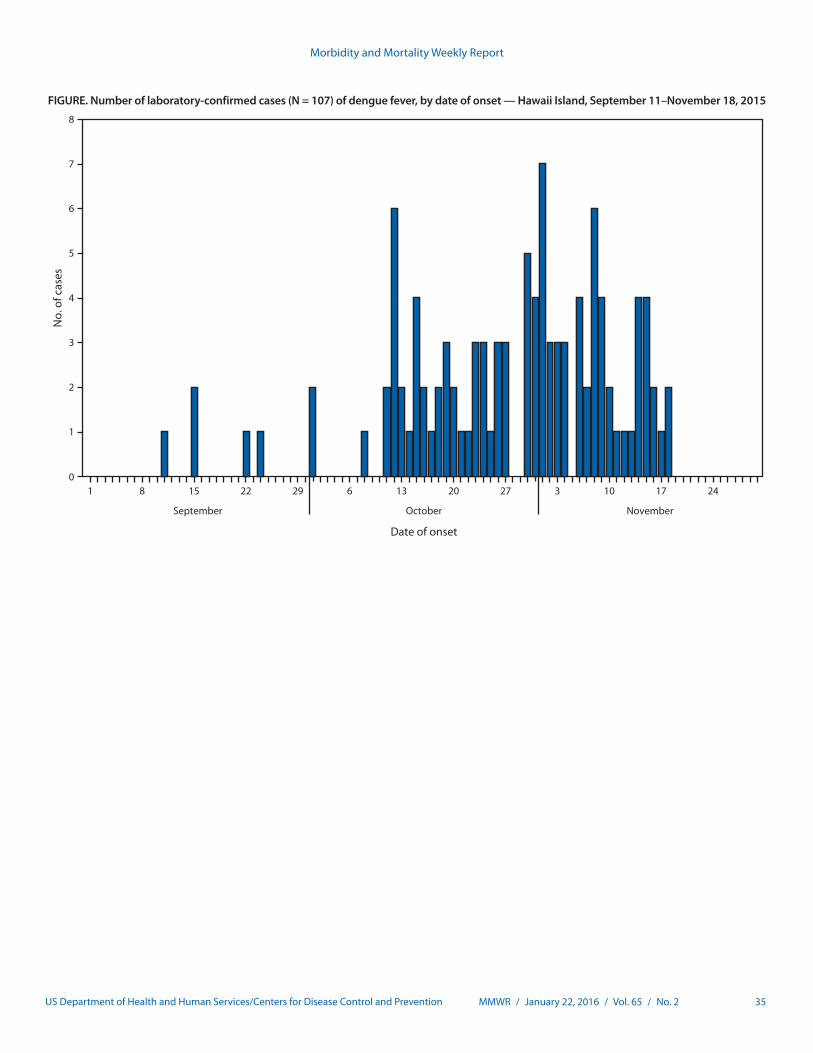
Morbidity and Mortality Weekly Report
MMWR / January 22, 2016 / Vol. 65 / No. 2 35US Department of Health and Human Services/Centers for Disease Control and Prevention
0
1
2
3
4
5
6
7
8
No.
of c
ases
September October November
Date of onset
1 8 15 22 29 6 13 20 27 3 10 17 24
FIGURE. Number of laboratory-confirmed cases (N = 107) of dengue fever, by date of onset — Hawaii Island, September 11–November 18, 2015
Morbidity and Mortality Weekly Report
36 MMWR / January 22, 2016 / Vol. 65 / No. 2 US Department of Health and Human Services/Centers for Disease Control and Prevention
Notes from the Field
Tetanus Cases After Voluntary Medical Male Circumcision for HIV Prevention — Eastern and Southern Africa, 2012–2015
Jonathan M. Grund, MA, MPH1; Carlos Toledo, PhD1; Stephanie M. Davis, MD1; Renee Ridzon, MD2; Edna Moturi, MBChB3;
Heather Scobie, PhD3; Boubker Naouri, MD3; Jason B. Reed, MD4; Emmanuel Njeuhmeli, MD5; Anne G. Thomas, PhD6; Francis Ndwiga
Benson, MSc, MBA7; Martin W. Sirengo, MBChB7; Leon Ngeruka Muyenzi, MD8; Gissenge J.I. Lija, MD9; John H. Rogers, PhD10;
Salli Mwanasalli, DDS10; Elijah Odoyo-June, MBChB, PhD11; Nafuna Wamai, MD12; Geoffrey Kabuye, MD12; James Exnobert Zulu13;
Jane Ruth Aceng, MBChB14; Naomi Bock, MD1
Voluntary medical male circumcision (VMMC) decreases the risk for female-to-male HIV transmission by approximately 60% (1), and the President’s Emergency Plan for AIDS Relief (PEPFAR) is supporting the scale-up of VMMC for adolescent and adult males in countries with high prevalence of human immunodeficiency virus (HIV) and low coverage of male cir-cumcision (2). As of September 2015, PEPFAR has supported approximately 8.9 million VMMCs (3).
During April 2012–November 2015, PEPFAR’s VMMC program reported 12 tetanus cases in five sub-Saharan African countries. Three cases occurred in 2012–2013 (one in Uganda and two in Zambia), six in 2014 (one each in Kenya, Rwanda, and Tanzania and three in Uganda), and three in 2015 (one in Rwanda and two in Uganda). Eight patients received con-ventional VMMC surgery, and four received PrePex, a non-surgical male circumcision device. No other VMMC-related tetanus cases had been previously reported. Intensified adverse event and death monitoring and reporting were instituted in July 2014 in all 14 PEPFAR-supported countries providing VMMC for HIV prevention.*
Detailed information was available for eight of the nine cases reported during 2014 and 2015. Based on a case definition established by the World Health Organization (WHO) (4), five of the eight cases were determined by clinical investigation to be causally associated with VMMC. The remaining three were classified as indeterminate because of inconsistent or insuf-ficient data. The age range of patients was 11–47 years. Each patient was deemed eligible for VMMC through preoperative screening and physical examination, and received counseling on postoperative wound care. Among the six causally associ-ated cases in 2014 and 2015, at least three patients (in Kenya,
Tanzania, and Uganda) reportedly had applied traditional remedies to aid healing; these remedies might have contained substances contaminated with spores of Clostridium tetani, the causative agent of tetanus.
Six of the nine total cases from 2014 and 2015 were fatal within 12–35 days of circumcision (case fatality ratio = 66.7%). A previous study of tetanus among 154 adolescents and adults at a rural Ugandan hospital reported an in-hospital case fatality ratio of 42.1% among persons aged 14–45 years (5), although this is likely an underestimate because it does not account for deaths following hospital discharge. Several factors, including delays in seeking medical attention, access to tetanus immune globulin, and quality of supportive care, can affect survival.
WHO recommends a 3-dose infant primary series of teta-nus vaccination administered as diphtheria-tetanus-pertussis vaccine and, because tetanus immunity wanes over time, 3 booster doses through adolescence and young adulthood (6). However, in most African countries, tetanus vaccination coverage among infants is suboptimal (7), and booster doses required for long-term immunity are predominantly provided for young women as part of maternal and neonatal tetanus elimination programs. As a result, a low proportion of males in the age groups seeking circumcision would be expected to be immune to tetanus.
PEPFAR is working with implementing partners and min-istries of health to strengthen national surveillance systems for VMMC-related adverse events, bolster the rapid investigation of reported adverse events, and support the implementation of tetanus mitigation strategies in accordance with WHO tetanus prevention recommendations for VMMC programs, includ-ing clean wound care for VMMC clients (4). Despite these 12 reported events, VMMC is safe; <2% of VMMC clients experience moderate or severe adverse events (2). As VMMC scale-up continues, sensitive surveillance systems are needed to monitor all adverse events, including rare events.
Acknowledgments
Catey Laube, Office of the US Global AIDS Coordinator, Washington, DC; Daimon Simbeye, Division of Global HIV and TB (Tanzania), CDC; Stella T. Alamo, Joseph Lubwama, Steven Wiersma, Division of Global HIV and TB (Uganda), CDC; Omega Chituwo, Division of Global HIV and TB (Zambia), CDC.
* Botswana, Ethiopia, Kenya, Lesotho, Malawi, Mozambique, Namibia, Rwanda, South Africa, Swaziland, Tanzania, Uganda, Zambia, and Zimbabwe.
Morbidity and Mortality Weekly Report
MMWR / January 22, 2016 / Vol. 65 / No. 2 37US Department of Health and Human Services/Centers for Disease Control and Prevention
1Division of Global HIV and TB, CDC; 2Independent Consultant, Boston, Massachusetts; 3Global Immunization Division, CDC; 4Office of the U.S. Global AIDS Coordinator, Washington, DC; 5U.S. Agency for International Development, Washington, DC; 6Naval Health Research Center, Department of Defense, San Diego, California; 7National AIDS and STI Control Programme, Ministry of Health, Nairobi, Kenya; 8Rwanda Military Hospital, Ministry of Defence, Kigali, Rwanda; 9National AIDS Control Program, Ministry of Health and Social Welfare, Dar es Salaam, Tanzania; 10Division of Global HIV and TB (Tanzania), CDC; 11Division of Global HIV and TB (Kenya), CDC; 12Division of Global HIV and TB (Uganda), CDC; 13Ministry of Community Development, Mother and Child Health, Lusaka, Zambia; 14Uganda Ministry of Health, Kampala, Uganda.
Corresponding author: Jonathan M. Grund, [email protected], 404-639-8978.
References1. Siegfried N, Muller M, Deeks JJ, Volmink J. Male circumcision for prevention
of heterosexual acquisition of HIV in men. Cochrane Database Syst Rev 2009;2:CD003362. http://dx.doi.org/10.1002/14651858.CD003362.
2. CDC. Voluntary medical male circumcision—southern and eastern Africa, 2010–2012. MMWR Morb Mortal Wkly Rep 2013;62:953–7.
3. US President’s Emergency Plan for AIDS Relief. PEPFAR 2015 Latest Results [fact sheet]. Washington, DC: US President’s Emergency Plan for AIDS Relief; 2015. http://www.pepfar.gov/documents/organization/250381.pdf.
4. World Health Organization. Male circumcision for HIV prevention. Meeting report of the WHO Informal consultation on tetanus and voluntary medical male circumcision, March 9–10, 2015, Geneva, Switzerland. Geneva, Switzerland: World Health Organization; 2015. http://apps.who.int/iris/bitstream/10665/181812/1/9789241509237_eng.pdf.
5. Zziwa GB. Review of tetanus admissions to a rural Ugandan Hospital. UMU Press 2009;7:199–202.
6. World Health Organization. Tetanus vaccine.[position paper]. Wkly Epidemiol Rec 2006;81:198–208.
7. World Health Organization; United Nations International Children’s Emergency Fund. WHO and UNICEF estimates of DTP3 coverage, 2015. Geneva, Switzerland: World Health Organization; 2015. http://apps.who.int/immunization_monitoring/globalsummary/timeseries/tswucoveragedtp3.html.
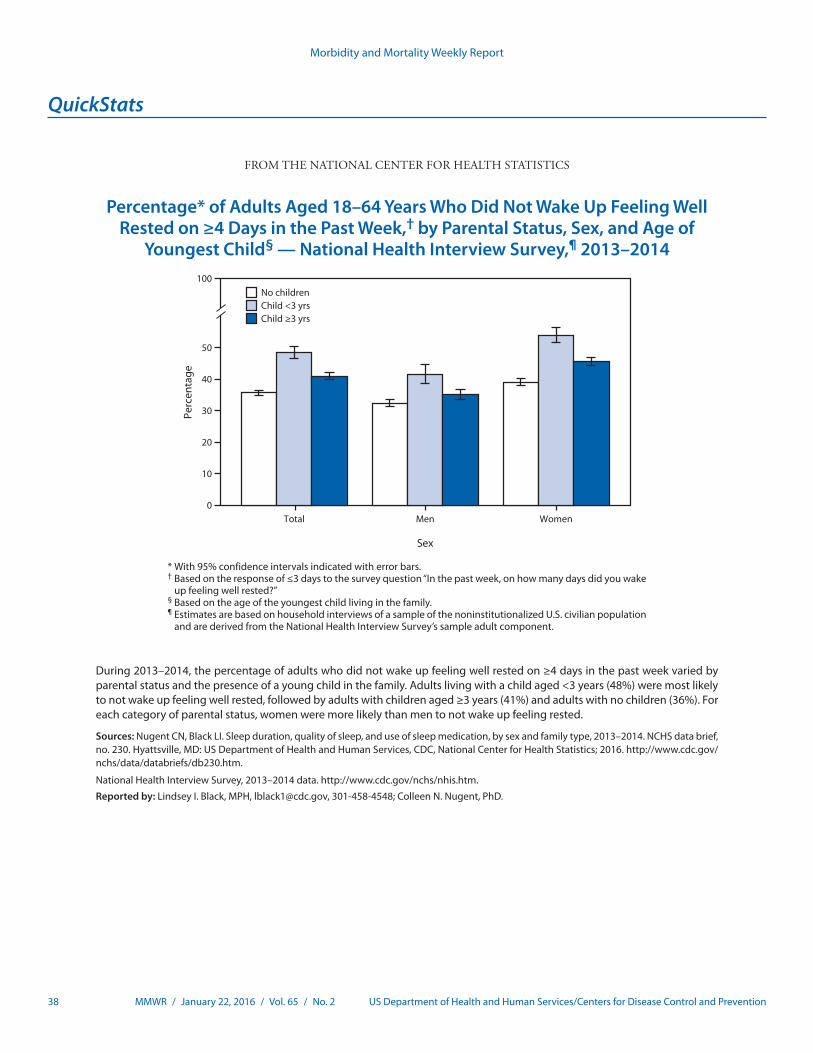
Morbidity and Mortality Weekly Report
38 MMWR / January 22, 2016 / Vol. 65 / No. 2 US Department of Health and Human Services/Centers for Disease Control and Prevention
* With 95% confidence intervals indicated with error bars.† Based on the response of ≤3 days to the survey question “In the past week, on how many days did you wake
up feeling well rested?”§ Based on the age of the youngest child living in the family.¶ Estimates are based on household interviews of a sample of the noninstitutionalized U.S. civilian population
and are derived from the National Health Interview Survey’s sample adult component.
During 2013–2014, the percentage of adults who did not wake up feeling well rested on ≥4 days in the past week varied by parental status and the presence of a young child in the family. Adults living with a child aged <3 years (48%) were most likely to not wake up feeling well rested, followed by adults with children aged ≥3 years (41%) and adults with no children (36%). For each category of parental status, women were more likely than men to not wake up feeling rested.
Sources: Nugent CN, Black LI. Sleep duration, quality of sleep, and use of sleep medication, by sex and family type, 2013–2014. NCHS data brief, no. 230. Hyattsville, MD: US Department of Health and Human Services, CDC, National Center for Health Statistics; 2016. http://www.cdc.gov/nchs/data/databriefs/db230.htm.
National Health Interview Survey, 2013–2014 data. http://www.cdc.gov/nchs/nhis.htm.
Reported by: Lindsey I. Black, MPH, [email protected], 301-458-4548; Colleen N. Nugent, PhD.
0
10
20
30
40
50
100
Total Men Women
Perc
enta
ge
No childrenChild <3 yrsChild ≥3 yrs
Sex
QuickStats
FROM THE NATIONAL CENTER FOR HEALTH STATISTICS
Percentage* of Adults Aged 18–64 Years Who Did Not Wake Up Feeling Well Rested on ≥4 Days in the Past Week,† by Parental Status, Sex, and Age of
Youngest Child§ — National Health Interview Survey,¶ 2013–2014


ISSN: 0149-2195 (Print)
The Morbidity and Mortality Weekly Report (MMWR) Series is prepared by the Centers for Disease Control and Prevention (CDC) and is available free of charge in electronic format. To receive an electronic copy each week, visit MMWR’s free subscription page at http://www.cdc.gov/mmwr/mmwrsubscribe.html. Paper copy subscriptions are available through the Superintendent of Documents, U.S. Government Printing Office, Washington, DC 20402; telephone 202-512-1800.
Readers who have difficulty accessing this PDF file may access the HTML file at http://www.cdc.gov/mmwr/index2016.html. Address all inquiries about the MMWR Series, including material to be considered for publication, to Executive Editor, MMWR Series, Mailstop E-90, CDC, 1600 Clifton Rd., N.E., Atlanta, GA 30329-4027 or to [email protected].
All material in the MMWR Series is in the public domain and may be used and reprinted without permission; citation as to source, however, is appreciated.
Use of trade names and commercial sources is for identification only and does not imply endorsement by the U.S. Department of Health and Human Services.
References to non-CDC sites on the Internet are provided as a service to MMWR readers and do not constitute or imply endorsement of these organizations or their programs by CDC or the U.S. Department of Health and Human Services. CDC is not responsible for the content of these sites. URL addresses listed in MMWR were current as of the date of publication.
Morbidity and Mortality Weekly Report