Embed Size (px)
Citation preview
Math 1 packet for Coordinate Geometry part 1
Reviewing the basics
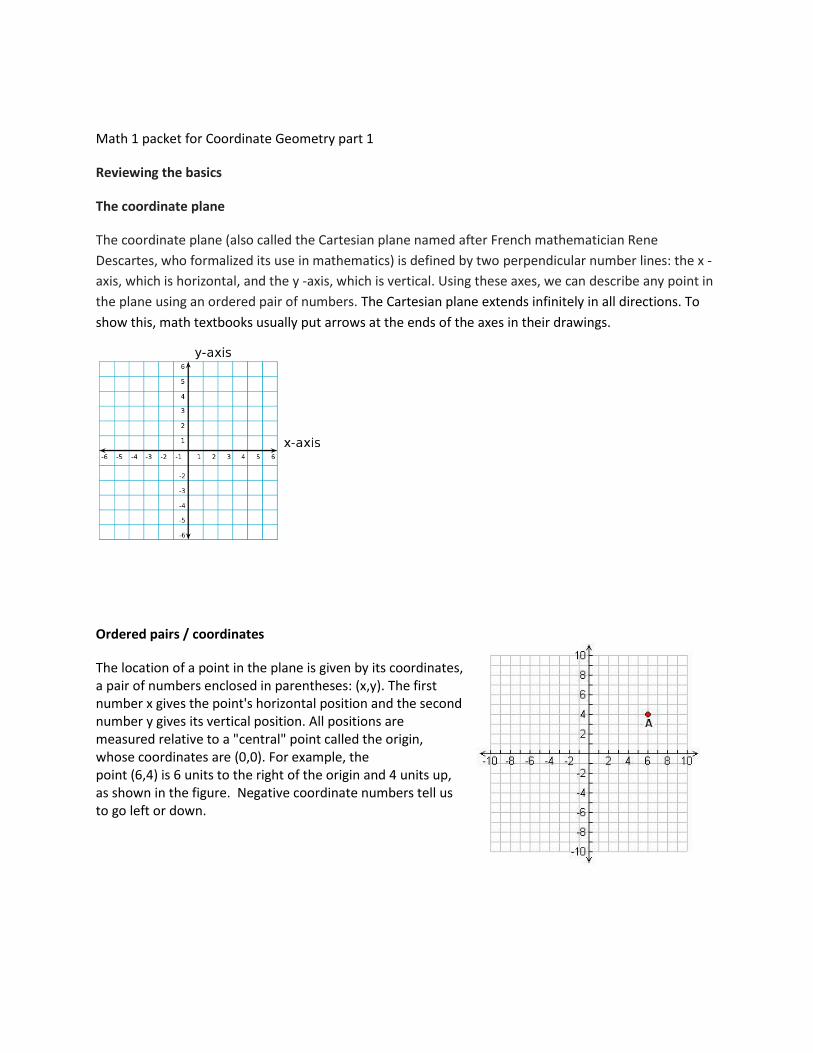
The coordinate plane
The coordinate plane (also called the Cartesian plane named after French mathematician Rene
Descartes, who formalized its use in mathematics) is defined by two perpendicular number lines: the x -
axis, which is horizontal, and the y -axis, which is vertical. Using these axes, we can describe any point in
the plane using an ordered pair of numbers. The Cartesian plane extends infinitely in all directions. To
show this, math textbooks usually put arrows at the ends of the axes in their drawings.
Ordered pairs / coordinates
The location of a point in the plane is given by its coordinates, a pair of numbers enclosed in parentheses: (x,y). The first number x gives the point's horizontal position and the second number y gives its vertical position. All positions are measured relative to a "central" point called the origin, whose coordinates are (0,0). For example, the point (6,4) is 6 units to the right of the origin and 4 units up, as shown in the figure. Negative coordinate numbers tell us to go left or down.
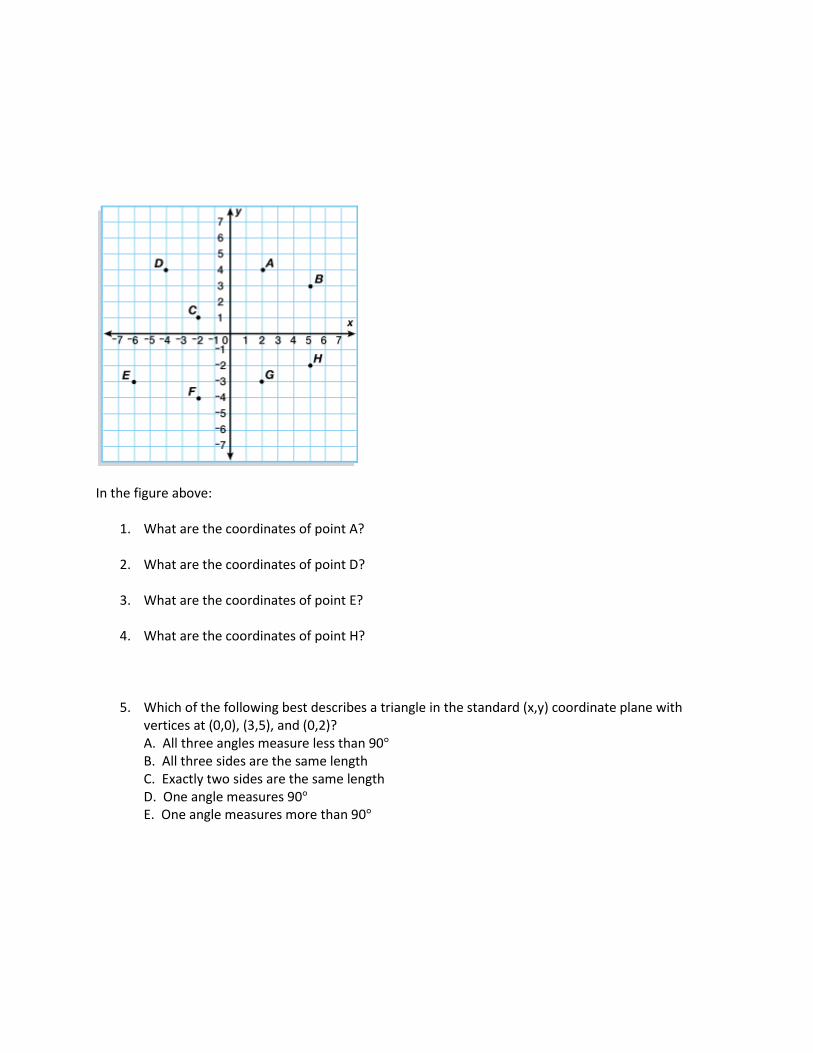
In the figure above:
1. What are the coordinates of point A?
2. What are the coordinates of point D?
3. What are the coordinates of point E?
4. What are the coordinates of point H?
5. Which of the following best describes a triangle in the standard (x,y) coordinate plane with vertices at (0,0), (3,5), and (0,2)? A. All three angles measure less than 90 B. All three sides are the same length C. Exactly two sides are the same length D. One angle measures 90 E. One angle measures more than 90
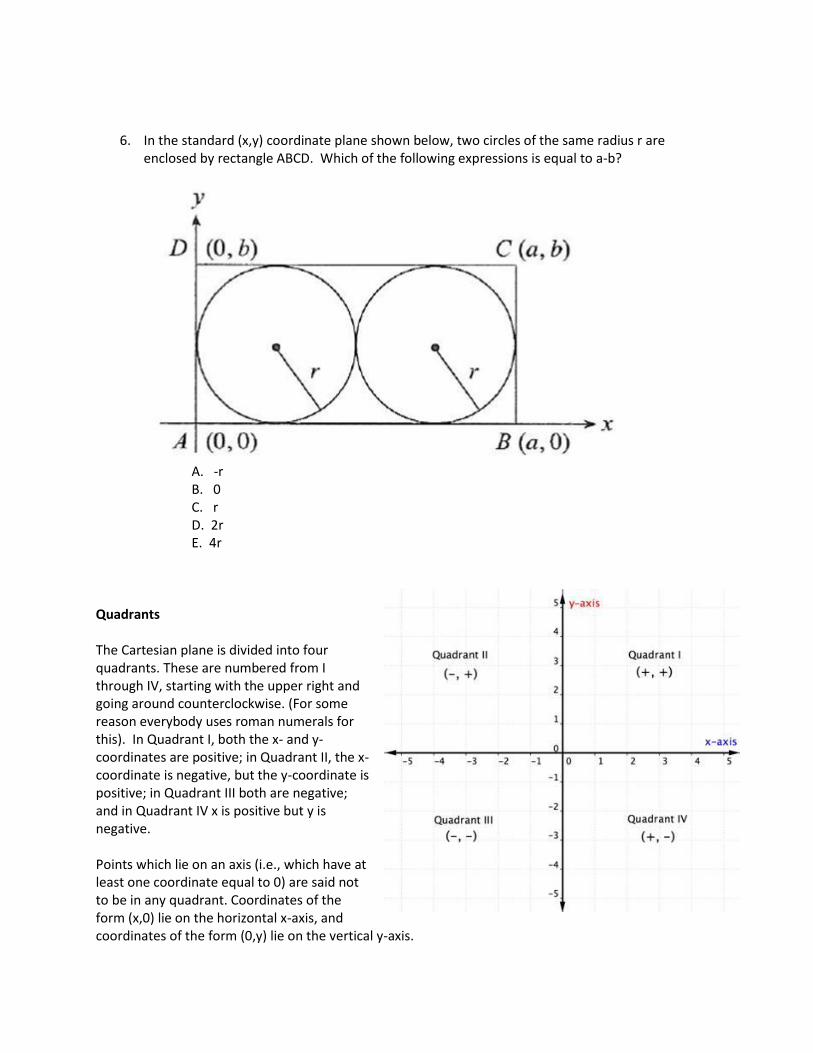
6. In the standard (x,y) coordinate plane shown below, two circles of the same radius r are enclosed by rectangle ABCD. Which of the following expressions is equal to a-b?
A. -r B. 0 C. r D. 2r E. 4r
Quadrants The Cartesian plane is divided into four quadrants. These are numbered from I through IV, starting with the upper right and going around counterclockwise. (For some reason everybody uses roman numerals for this). In Quadrant I, both the x- and y-coordinates are positive; in Quadrant II, the x-coordinate is negative, but the y-coordinate is positive; in Quadrant III both are negative; and in Quadrant IV x is positive but y is negative. Points which lie on an axis (i.e., which have at least one coordinate equal to 0) are said not to be in any quadrant. Coordinates of the form (x,0) lie on the horizontal x-axis, and coordinates of the form (0,y) lie on the vertical y-axis.
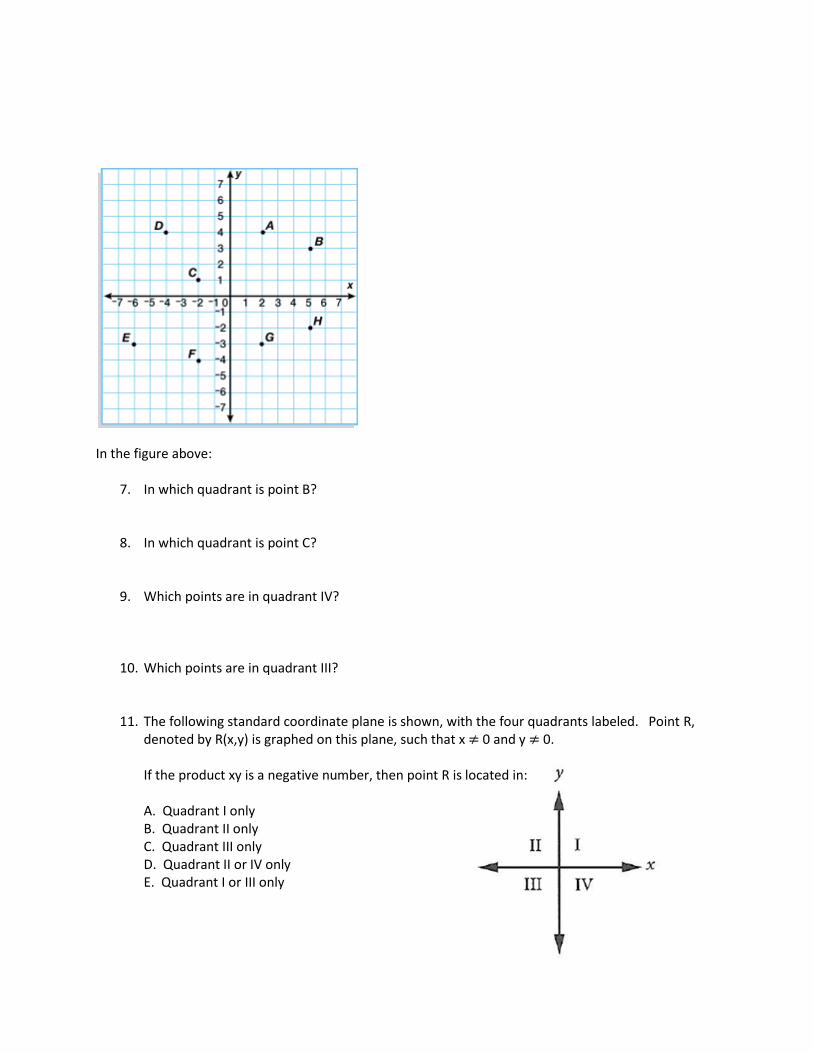
In the figure above:
7. In which quadrant is point B?
8. In which quadrant is point C?
9. Which points are in quadrant IV?
10. Which points are in quadrant III?
11. The following standard coordinate plane is shown, with the four quadrants labeled. Point R, denoted by R(x,y) is graphed on this plane, such that x 0 and y 0.
If the product xy is a negative number, then point R is located in: A. Quadrant I only B. Quadrant II only C. Quadrant III only D. Quadrant II or IV only E. Quadrant I or III only
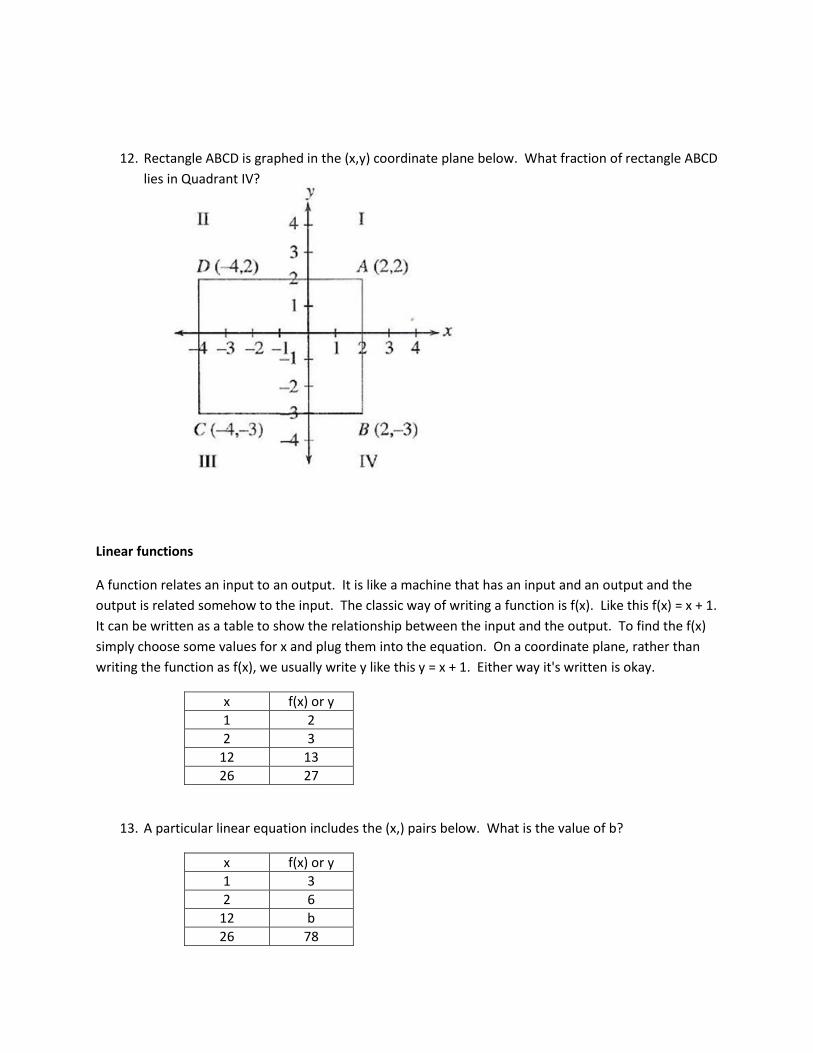
12. Rectangle ABCD is graphed in the (x,y) coordinate plane below. What fraction of rectangle ABCD
lies in Quadrant IV?
Linear functions
A function relates an input to an output. It is like a machine that has an input and an output and the
output is related somehow to the input. The classic way of writing a function is f(x). Like this f(x) = x + 1.
It can be written as a table to show the relationship between the input and the output. To find the f(x)
simply choose some values for x and plug them into the equation. On a coordinate plane, rather than
writing the function as f(x), we usually write y like this y = x + 1. Either way it's written is okay.
x f(x) or y
1 2
2 3
12 13
26 27
13. A particular linear equation includes the (x,) pairs below. What is the value of b?
x f(x) or y
1 3
2 6
12 b
26 78
Introduction to linear equations
Linear equations are functions that can be represented as a line on a graph. The x value is the input and
the y value is the output. It works sort of like this: When we have a question like this: 1 + 7 = Y, I know
the answer is 8. But if I have a question like this: 1 + X = Y. The answer is "it depends" because there is
more than one possible answer. For example if X = 0 then Y would be 1, but if X = 5 then Y would be 6.
There are an infinite number of possible answers. There is a way to find all the possible answers very
quickly. Because Y depends on what we choose for X, there is a relationship that can be written as a line
on a coordinate plane.
A linear equation in two variables describes a relationship in which the value of one of the variables
depends on the value of the other variable. In a linear equation x is the independent variable and y is
the dependent variable. When you assign a value to the independent variable, x, you can compute the
value of the dependent variable, y. You can then plot the points named by each (x,y) pair on a
coordinate grid.
The good news is that if you know 2 points, you can draw a line that includes all the other possible
answers. So finding many pairs of values that satisfy a linear equation is easy: Find two pairs of values
and draw a line through the points they describe. All other points on the line will provide values for x
and y that satisfy the equation.
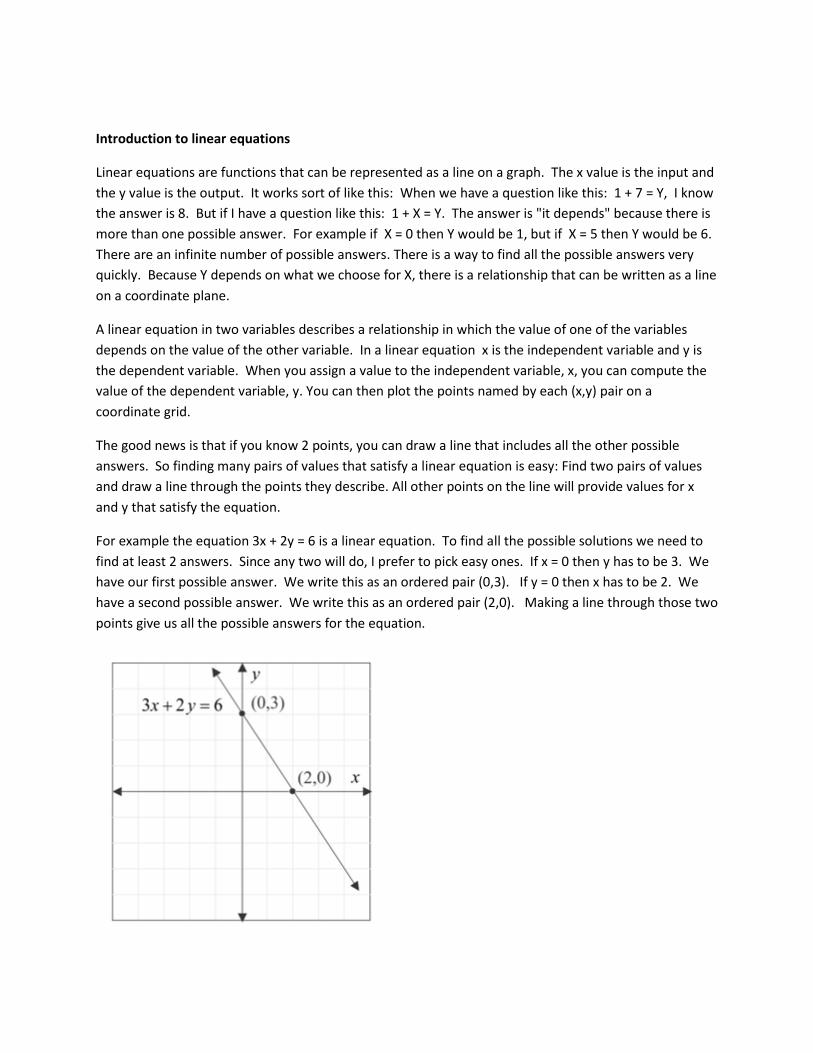
For example the equation 3x + 2y = 6 is a linear equation. To find all the possible solutions we need to
find at least 2 answers. Since any two will do, I prefer to pick easy ones. If x = 0 then y has to be 3. We
have our first possible answer. We write this as an ordered pair (0,3). If y = 0 then x has to be 2. We
have a second possible answer. We write this as an ordered pair (2,0). Making a line through those two
points give us all the possible answers for the equation.
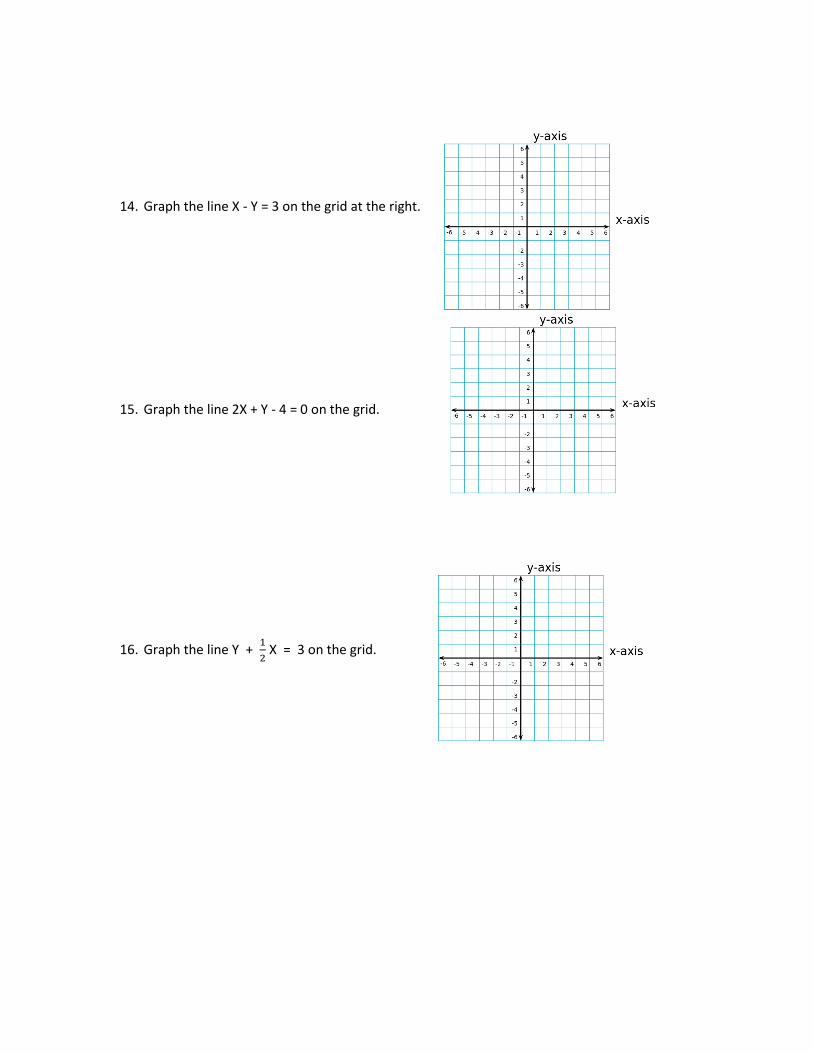
14. Graph the line X - Y = 3 on the grid at the right.
15. Graph the line 2X + Y - 4 = 0 on the grid.
16. Graph the line Y +
X = 3 on the grid.
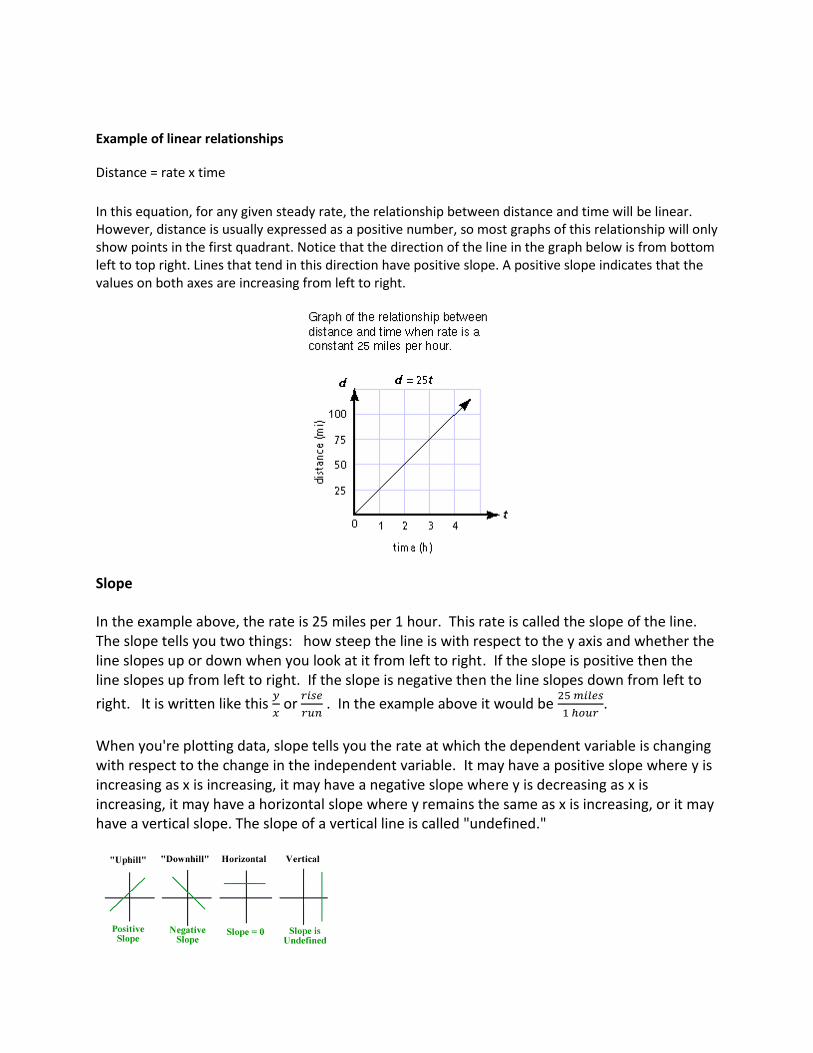
Example of linear relationships
Distance = rate x time
In this equation, for any given steady rate, the relationship between distance and time will be linear. However, distance is usually expressed as a positive number, so most graphs of this relationship will only show points in the first quadrant. Notice that the direction of the line in the graph below is from bottom left to top right. Lines that tend in this direction have positive slope. A positive slope indicates that the values on both axes are increasing from left to right.
Slope
In the example above, the rate is 25 miles per 1 hour. This rate is called the slope of the line. The slope tells you two things: how steep the line is with respect to the y axis and whether the line slopes up or down when you look at it from left to right. If the slope is positive then the line slopes up from left to right. If the slope is negative then the line slopes down from left to
right. It is written like this
or
. In the example above it would be
.
When you're plotting data, slope tells you the rate at which the dependent variable is changing with respect to the change in the independent variable. It may have a positive slope where y is increasing as x is increasing, it may have a negative slope where y is decreasing as x is increasing, it may have a horizontal slope where y remains the same as x is increasing, or it may have a vertical slope. The slope of a vertical line is called "undefined."
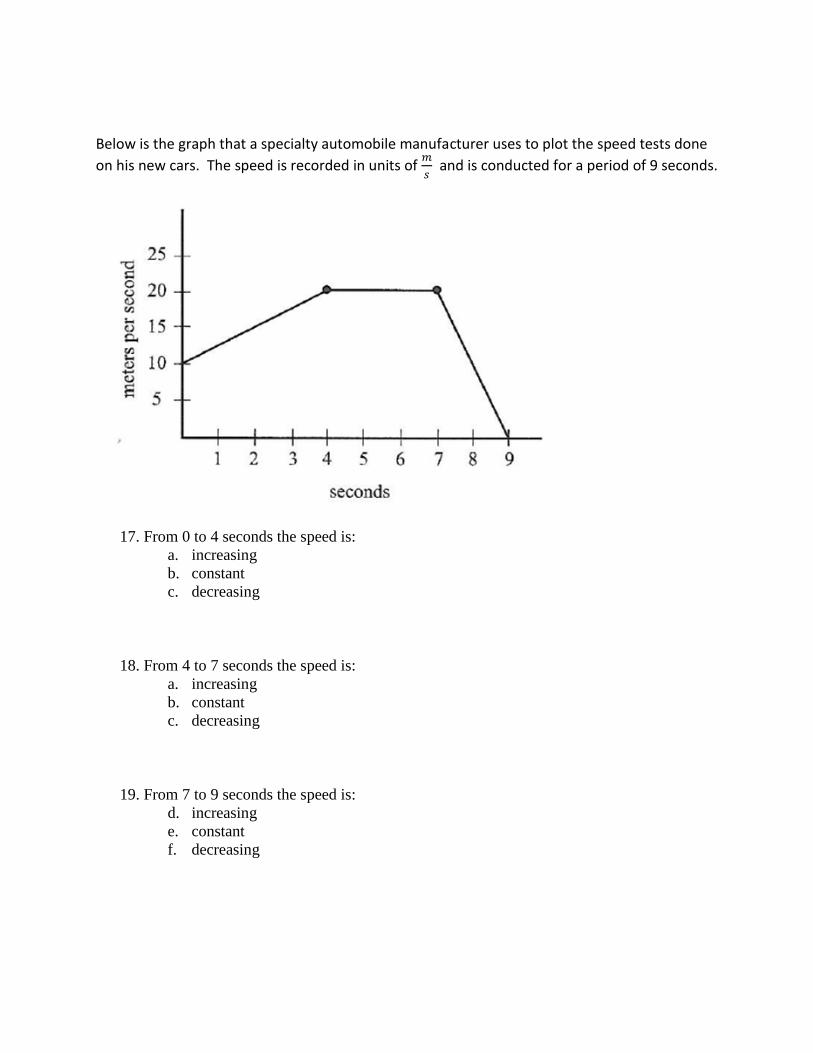
Below is the graph that a specialty automobile manufacturer uses to plot the speed tests done
on his new cars. The speed is recorded in units of
and is conducted for a period of 9 seconds.
17. From 0 to 4 seconds the speed is:
a. increasing
b. constant
c. decreasing
18. From 4 to 7 seconds the speed is:
a. increasing
b. constant
c. decreasing
19. From 7 to 9 seconds the speed is:
d. increasing
e. constant
f. decreasing
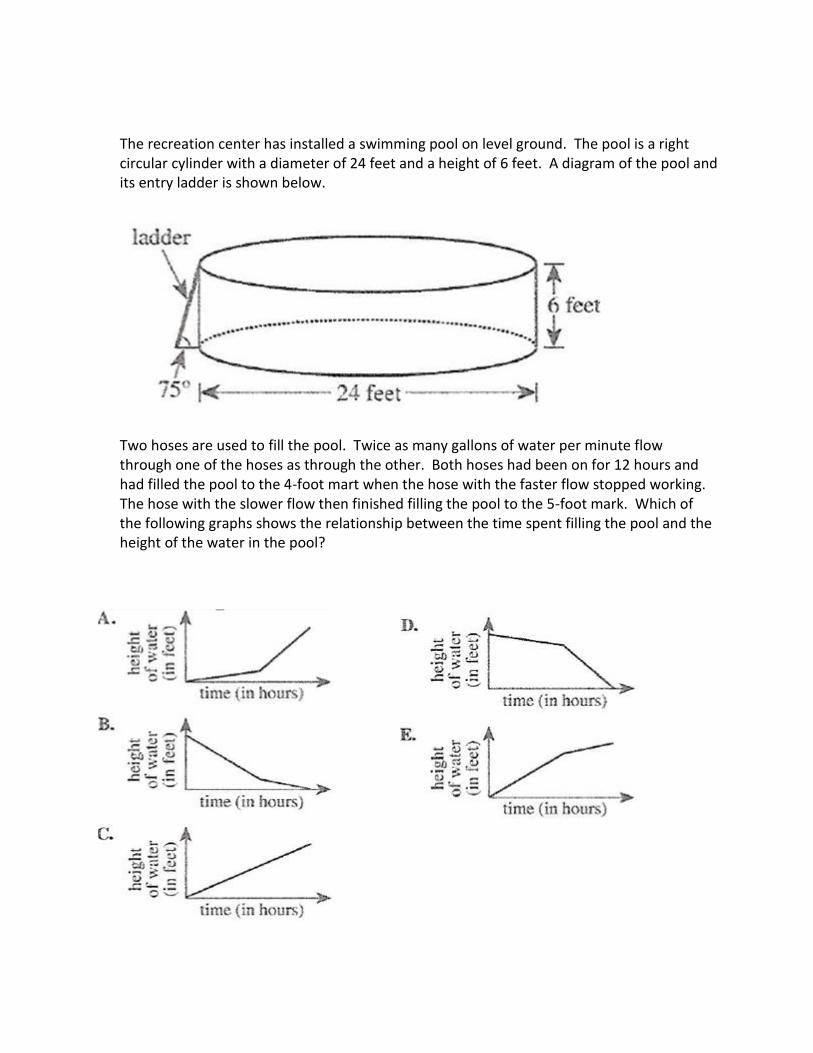
The recreation center has installed a swimming pool on level ground. The pool is a right circular cylinder with a diameter of 24 feet and a height of 6 feet. A diagram of the pool and its entry ladder is shown below.
Two hoses are used to fill the pool. Twice as many gallons of water per minute flow through one of the hoses as through the other. Both hoses had been on for 12 hours and had filled the pool to the 4-foot mart when the hose with the faster flow stopped working. The hose with the slower flow then finished filling the pool to the 5-foot mark. Which of the following graphs shows the relationship between the time spent filling the pool and the height of the water in the pool?
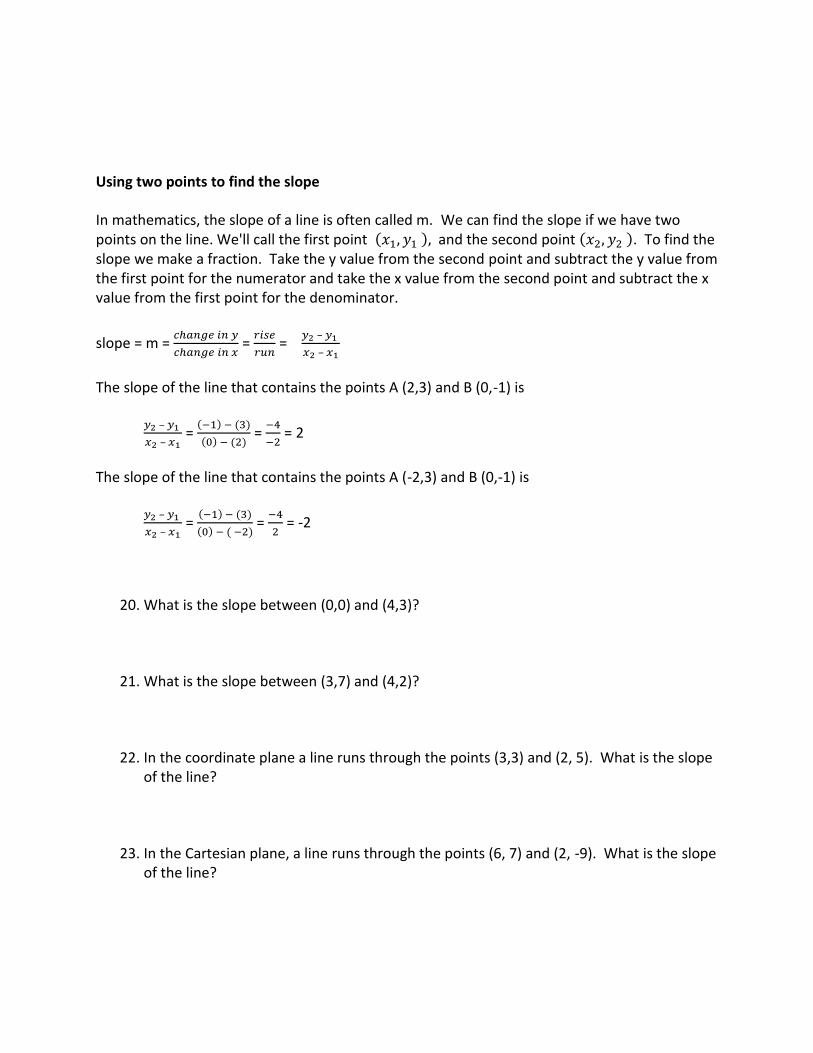
Using two points to find the slope
In mathematics, the slope of a line is often called m. We can find the slope if we have two points on the line. We'll call the first point and the second point . To find the slope we make a fraction. Take the y value from the second point and subtract the y value from the first point for the numerator and take the x value from the second point and subtract the x value from the first point for the denominator.
slope = m =
=
=
–
–
The slope of the line that contains the points A (2,3) and B (0,-1) is
–
– =
=
= 2
The slope of the line that contains the points A (-2,3) and B (0,-1) is
–
– =
=
= -2
20. What is the slope between (0,0) and (4,3)?
21. What is the slope between (3,7) and (4,2)?
22. In the coordinate plane a line runs through the points (3,3) and (2, 5). What is the slope of the line?
23. In the Cartesian plane, a line runs through the points (6, 7) and (2, -9). What is the slope of the line?
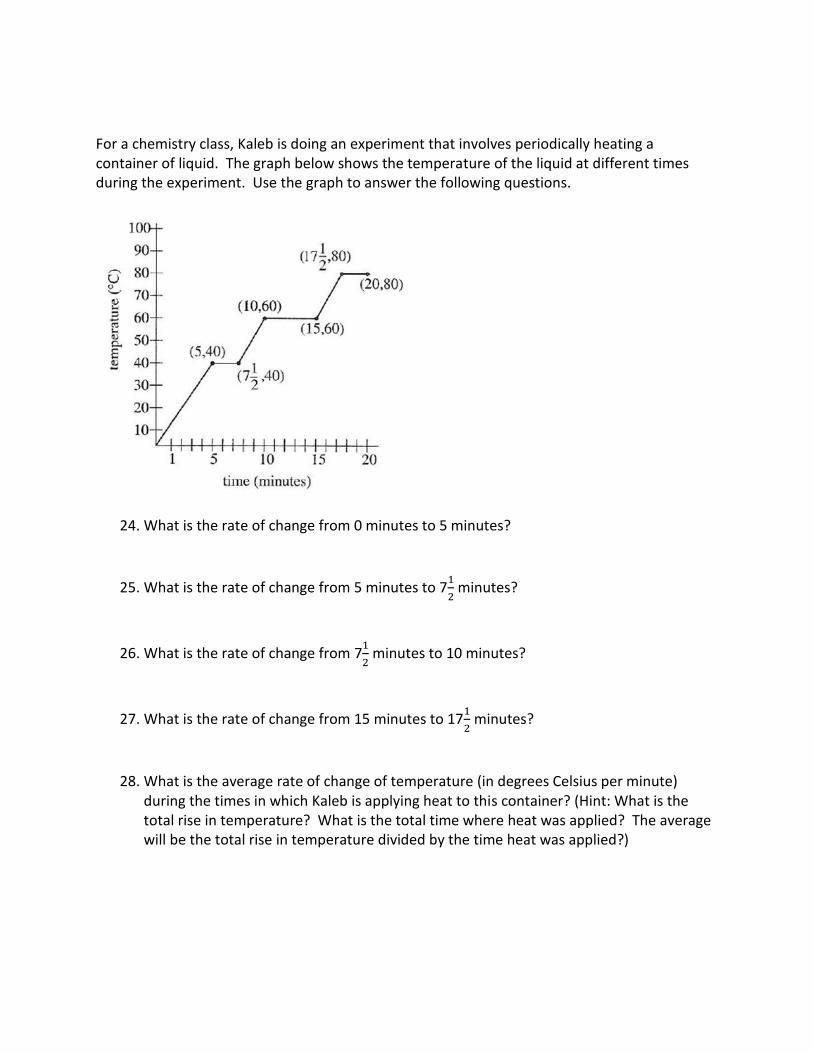
For a chemistry class, Kaleb is doing an experiment that involves periodically heating a container of liquid. The graph below shows the temperature of the liquid at different times during the experiment. Use the graph to answer the following questions.
24. What is the rate of change from 0 minutes to 5 minutes?
25. What is the rate of change from 5 minutes to 7
minutes?
26. What is the rate of change from 7
minutes to 10 minutes?
27. What is the rate of change from 15 minutes to 17
minutes?
28. What is the average rate of change of temperature (in degrees Celsius per minute) during the times in which Kaleb is applying heat to this container? (Hint: What is the total rise in temperature? What is the total time where heat was applied? The average will be the total rise in temperature divided by the time heat was applied?)
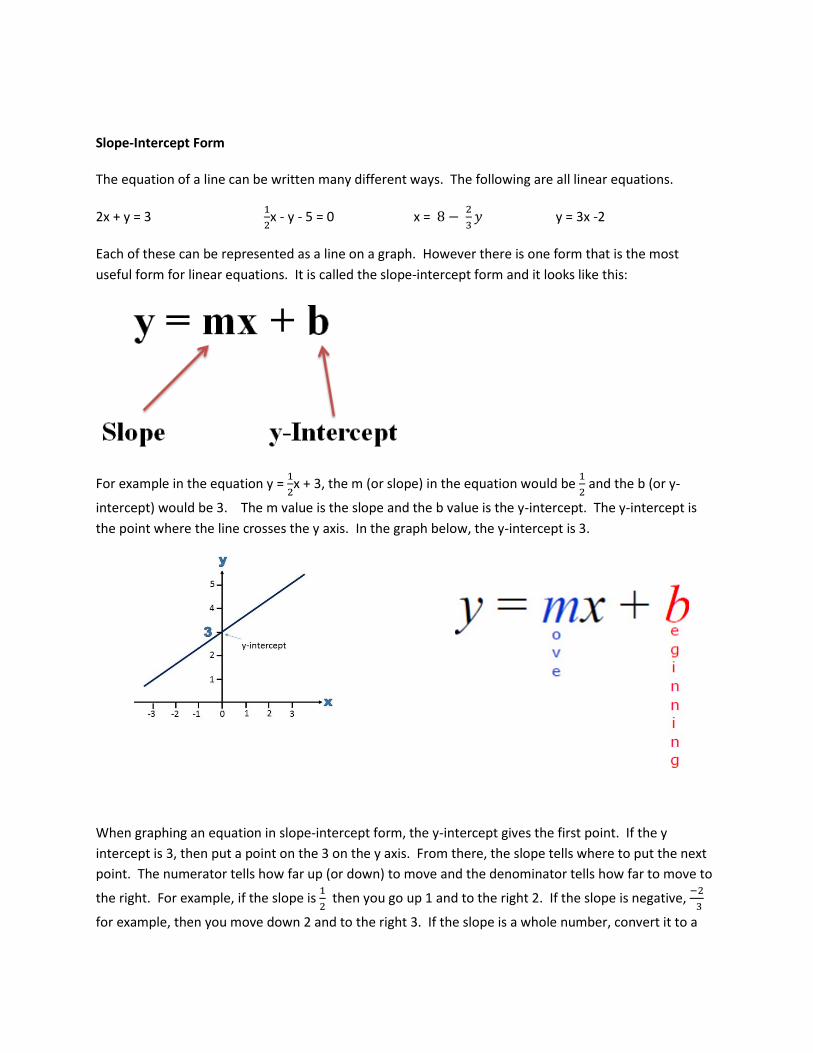
Slope-Intercept Form
The equation of a line can be written many different ways. The following are all linear equations.
2x + y = 3
x - y - 5 = 0 x =
y = 3x -2
Each of these can be represented as a line on a graph. However there is one form that is the most
useful form for linear equations. It is called the slope-intercept form and it looks like this:
For example in the equation y =
x + 3, the m (or slope) in the equation would be
and the b (or y-
intercept) would be 3. The m value is the slope and the b value is the y-intercept. The y-intercept is
the point where the line crosses the y axis. In the graph below, the y-intercept is 3.
When graphing an equation in slope-intercept form, the y-intercept gives the first point. If the y
intercept is 3, then put a point on the 3 on the y axis. From there, the slope tells where to put the next
point. The numerator tells how far up (or down) to move and the denominator tells how far to move to
the right. For example, if the slope is
then you go up 1 and to the right 2. If the slope is negative,
for example, then you move down 2 and to the right 3. If the slope is a whole number, convert it to a
fraction. For example 2 is the same as
which means you move up 2 and to the right 1 and -5 is the
same as
which means you move down 5 and to the right 1.
29. What is the slope of the line y =
X - 3?
30. What is the slope of the line y =
X + 3?
31. What is the slope of the line y =
X - 7?
32. What is the slope of the line y = -7X - 2?
33. What is the slope of the line y = X + 5?
34. What is the slope of the line y =
X + 13?
35. What is the slope of the line y = X + 4?
36. What is the slope of the line y =
X + 3?
37. What is the y-intercept of the line y =
X - 3?
38. What is the y-intercept of the line y =
X - 3?
39. What is the y-intercept of the line y =
X + 3?
40. What is the y-intercept of the line y =
X - 7?
41. What is the y-intercept of the line y = -7X - 2?
42. What is the y-intercept of the line y = 2X?
43. What is the y-intercept of the line y = -7X + 12?
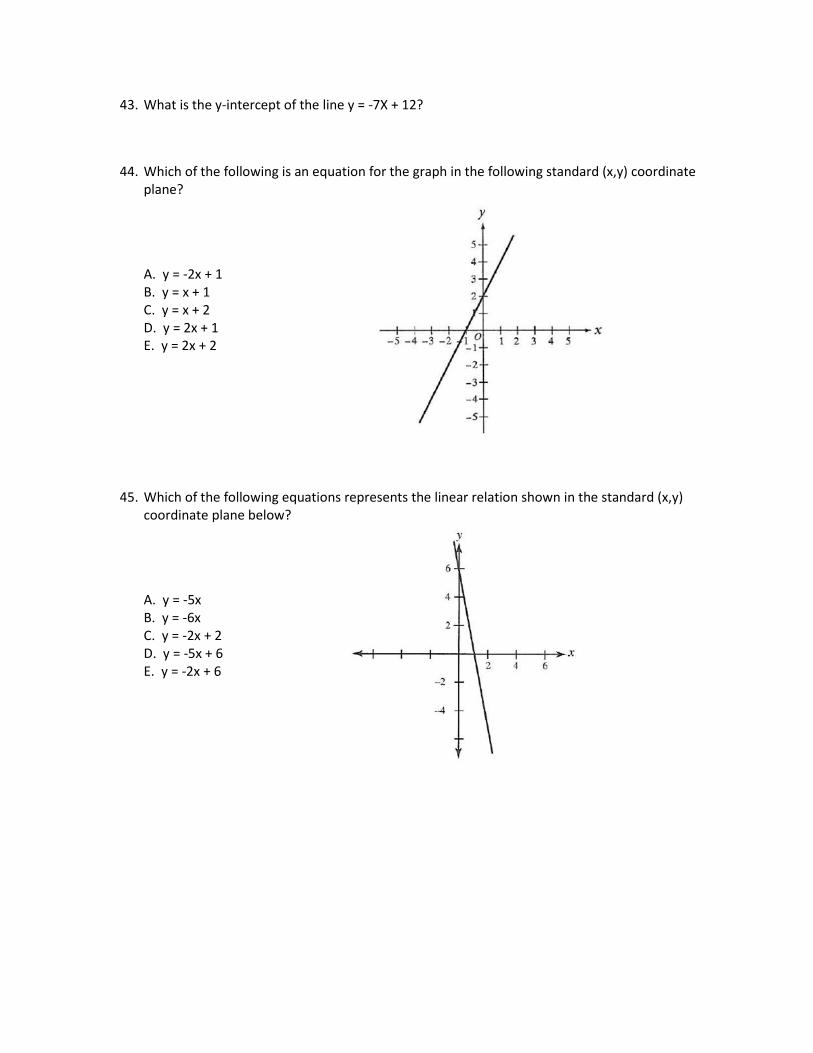
44. Which of the following is an equation for the graph in the following standard (x,y) coordinate plane?
A. y = -2x + 1 B. y = x + 1 C. y = x + 2 D. y = 2x + 1 E. y = 2x + 2
45. Which of the following equations represents the linear relation shown in the standard (x,y) coordinate plane below?
A. y = -5x B. y = -6x C. y = -2x + 2 D. y = -5x + 6 E. y = -2x + 6
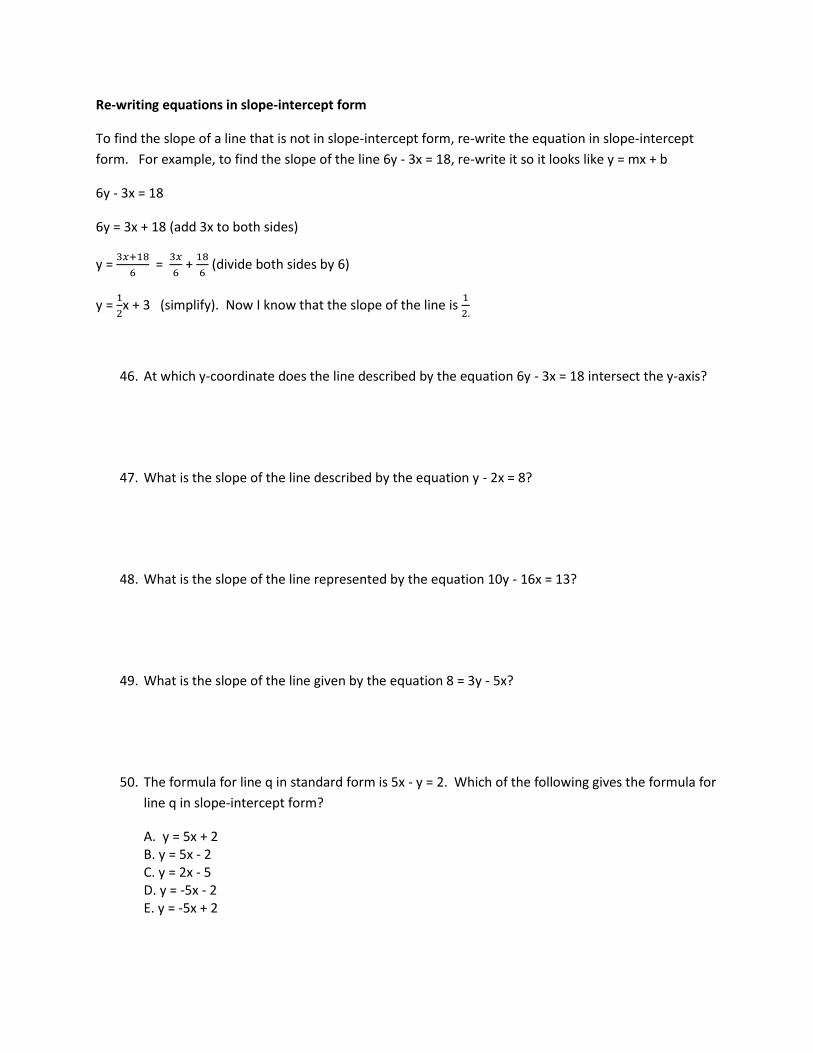
Re-writing equations in slope-intercept form
To find the slope of a line that is not in slope-intercept form, re-write the equation in slope-intercept
form. For example, to find the slope of the line 6y - 3x = 18, re-write it so it looks like y = mx + b
6y - 3x = 18
6y = 3x + 18 (add 3x to both sides)
y =
=
+
(divide both sides by 6)
y =
x + 3 (simplify). Now I know that the slope of the line is
46. At which y-coordinate does the line described by the equation 6y - 3x = 18 intersect the y-axis?
47. What is the slope of the line described by the equation y - 2x = 8?
48. What is the slope of the line represented by the equation 10y - 16x = 13?
49. What is the slope of the line given by the equation 8 = 3y - 5x?
50. The formula for line q in standard form is 5x - y = 2. Which of the following gives the formula for
line q in slope-intercept form?
A. y = 5x + 2 B. y = 5x - 2 C. y = 2x - 5 D. y = -5x - 2 E. y = -5x + 2
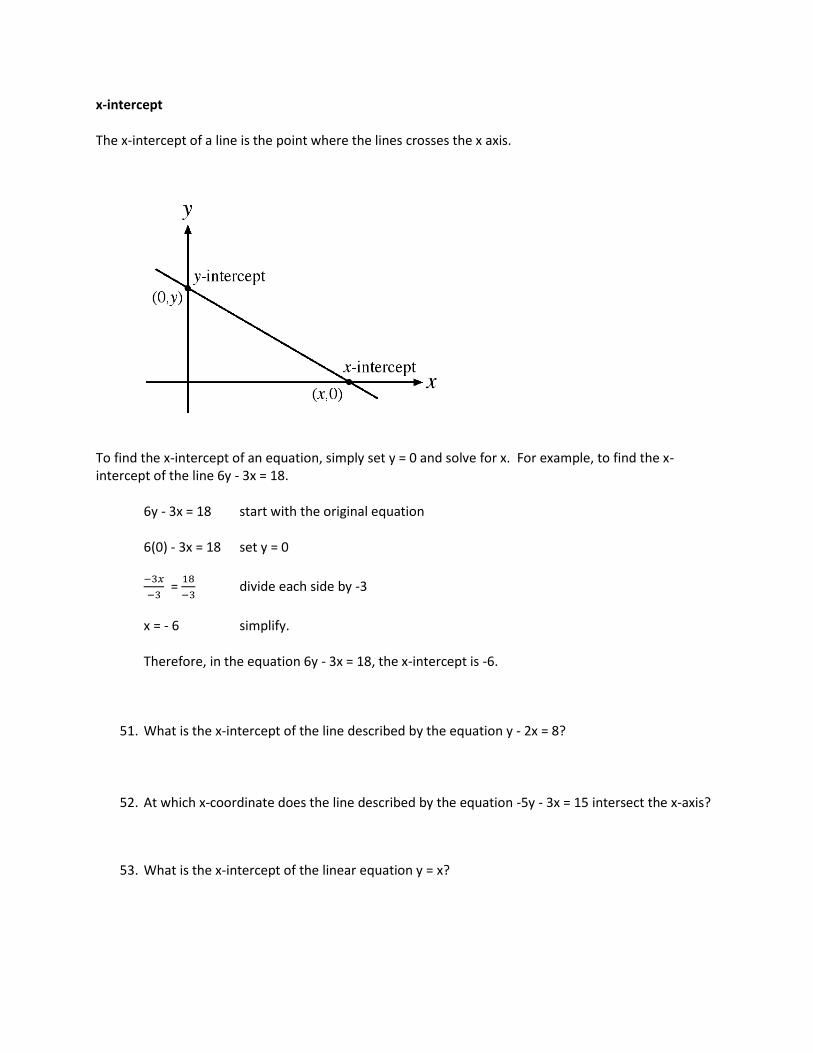
x-intercept The x-intercept of a line is the point where the lines crosses the x axis.
To find the x-intercept of an equation, simply set y = 0 and solve for x. For example, to find the x-intercept of the line 6y - 3x = 18.
6y - 3x = 18 start with the original equation 6(0) - 3x = 18 set y = 0
=
divide each side by -3
x = - 6 simplify. Therefore, in the equation 6y - 3x = 18, the x-intercept is -6.
51. What is the x-intercept of the line described by the equation y - 2x = 8?
52. At which x-coordinate does the line described by the equation -5y - 3x = 15 intersect the x-axis?
53. What is the x-intercept of the linear equation y = x?