Embed Size (px)
Citation preview

Math 1351 Activity 2(Chapter 11)(Due by EOC Mar. 26) Group #_______
1. A fair coin is tossed three times, and we would like to know the probability of getting both a
heads and tails to occur. Here are the results of simulating the tosses 24 times: Fill-in the
column at the right with either Yes or No depending on whether both heads and tails
occurred or not.
Trial # First toss Second toss Third toss Did both occur?
1 H H T
2 H H H
3 T T H
4 T T T
5 H H H
6 T T T
7 T T T
8 T T H
9 T H T
10 T H T
11 H H T
12 T H T
13 H T H
14 T H H
15 H T H
16 T H T
17 T H H
18 H H T
19 H H H
20 H T T
21 H H H
22 H T H
23 T T H
24 H T H
a) Use the results to estimate the probability of seeing both heads and tails in three tosses of a
fair coin. (Empirical Probability)
b) Find the exact probability of seeing both heads and tails in three tosses of a fair coin.
(Theoretical Probability)

2.
a)
b) c)
e)
g)
d)
f)
h)
i)
l)
j)
m)
k)
n)
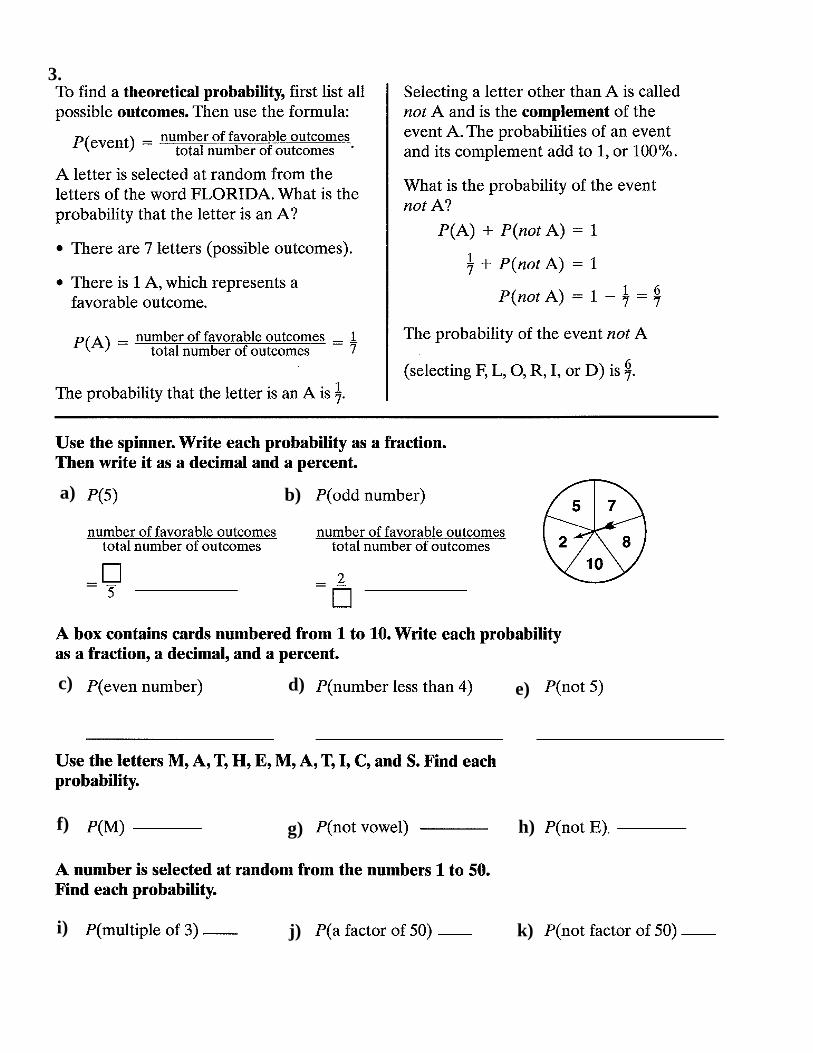
3.
a) b)
c) d) e)
f) g) h)
i) j) k)

4.
a) b) c) d)
e)
f)
g)
h) i) j)
k)
n)
q)
l)
o)
r)
m)
p)
s)

5. Determine the following probability values. Convert them into decimals
rounded to the nearest hundredth.
Spin the spinner once. Find the following probabilities.
a) 9P b) multiple of 2P c) even numberP
d) prime numberP e) number 8P f) factor of 8P
A laundry basket contains 3 red socks, 5 orange socks, 4 blue socks, and 8 black socks.
Without looking, choose a sock. Find the following probabilities.
g) orangeP
h) blueP
i) not blueP
j) whiteP
You roll a fair die and toss a fair coin simultaneously. Find the following probabilities.
k) 1, headsP
l) 2, tailsP
m) 6, heads or tailsP
n) even number, tailsP
o) odd number, heads or tailsP
12 1
2
3
4
5
6 7
8
9
10
11
________
________
________
________
______
______
________
________
________
________
________
________
________
________
________

6. Two fair dice are rolled. Find the following conditional probabilities of rolling:
1,1 1,2 1,3 1,4 1,5 1,6
2,1 2,2 2,3 2,4 2,5 2,6
3,1 3,2 3,3 3,4 3,5 3,6
4,1 4,2 4,3 4,4 4,5 4,6
5,1 5,2 5,3 5,4 5,5 5,6
6,1 6,2 6,3 6,4 6,5 6,6
a) a sum of 8, given that the sum is greater than 7.
b) a sum of 6, given that each die shows the same number.
c) each die shows the same number, given that the sum is 9.
7. Two cards are drawn at random without replacement from an ordinary deck, find the
following conditional probabilities:
a) the second card is a heart, given that the first card is a heart
b) the second card is black, given that the first card is a club
Second die
Fir
st d
ie

8.
h) P(white | lo cut) =
i) P(hi top | red) =
j) P(red | hi top) =
k) P(white | red) =
a)
b)
c)
d)
e)
f)
g)
Total
38
12
Total 25 25 50
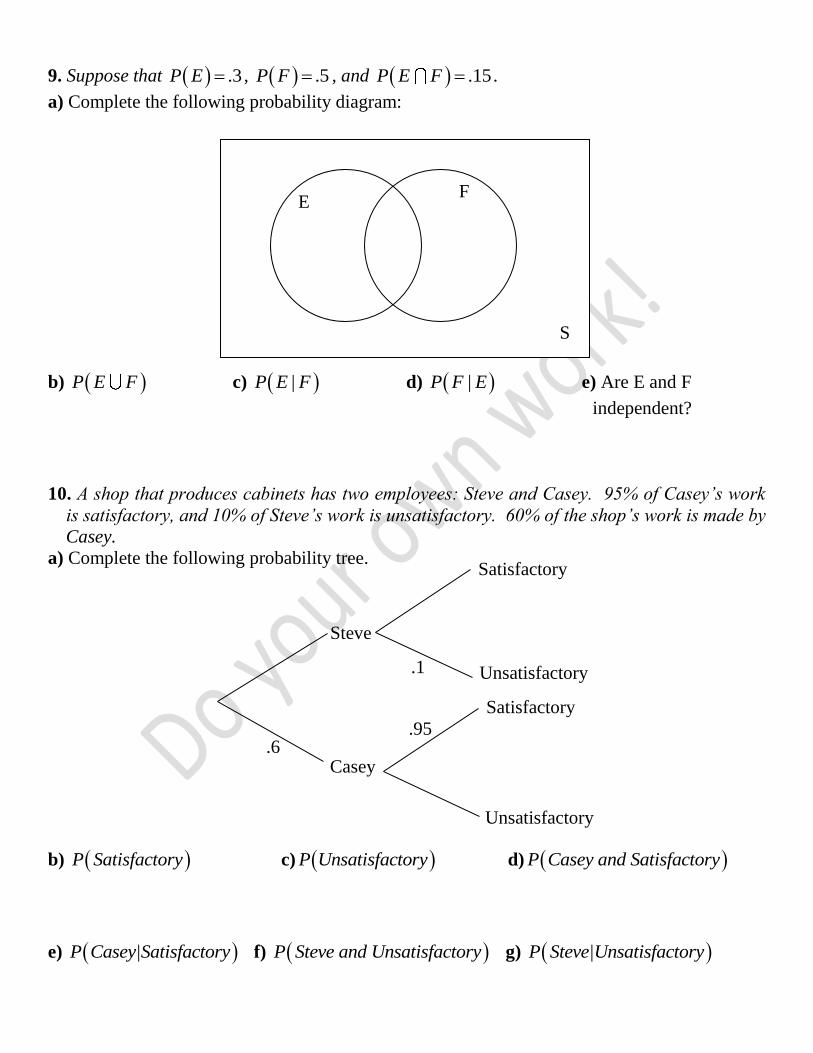
9. Suppose that .3P E , .5P F , and .15P E F .
a) Complete the following probability diagram:
b) P E F c) |P E F d) |P F E e) Are E and F
independent?
10. A shop that produces cabinets has two employees: Steve and Casey. 95% of Casey’s work
is satisfactory, and 10% of Steve’s work is unsatisfactory. 60% of the shop’s work is made by
Casey.
a) Complete the following probability tree.
b) P Satisfactory c) P Unsatisfactory d) P Casey and Satisfactory
e) P Casey|Satisfactory f) P Steve and Unsatisfactory g) P Steve|Unsatisfactory
E F
Steve
Casey
Satisfactory
Satisfactory
Unsatisfactory
Unsatisfactory
.6
.1
.95
S

11. The following table gives the results of 1,000 weather forecasts. If one forecast is chosen at
random, determine the following.
Rain No Rain Total
Forecast of Rain 66 156 222
Forecast of No Rain 14 764 778
Total 80 920 1000
a) P Rain b) P Forecast of Rain c) P Rain and Forecast of Rain
d) P Rain|Forecast of Rain e) P No Rain|Forecast of No Rain
f) Are Forecast of Rain and No Rain independent?
12.
a)
b)
c)
d)
e)

13.
a)
b)
c)
d)
e)
Ten students, Art, Bonnie, Carol, Doug, Ed, Frank, George, Hank, Ivan, and
Jeff, volunteer to sell refreshments at the faculty-student basketball game, and
only three students are needed. In order to select three students, the following
procedure is to be used. Each of the 120 possible selections of three students is
written on a piece of paper, and then one piece of paper is selected at random.

14.
a) b) c) d) e)
f) g) h) i) j)
k) l)
m) n)
o) p)
q) r)
s)
t)

15.
a) b) c) d)
i)
e) f) g) h)
j) k) l)
m
)
q)
o)
n)
r)
p)
s)
t)

16.
a) b) c)
d) e) f)
g)
h)
i)
j)
k)
l)
m)
n)

17.
Find the expected winnings for the following games of chance.
18. Numbers is a game in which you bet $1 on any three-digit number from 000 to 999. If your
number is randomly selected, you get $500.
winnings $1 $499
P winnings
Expected Value =
a)
c)
e)
b)
d)
f)
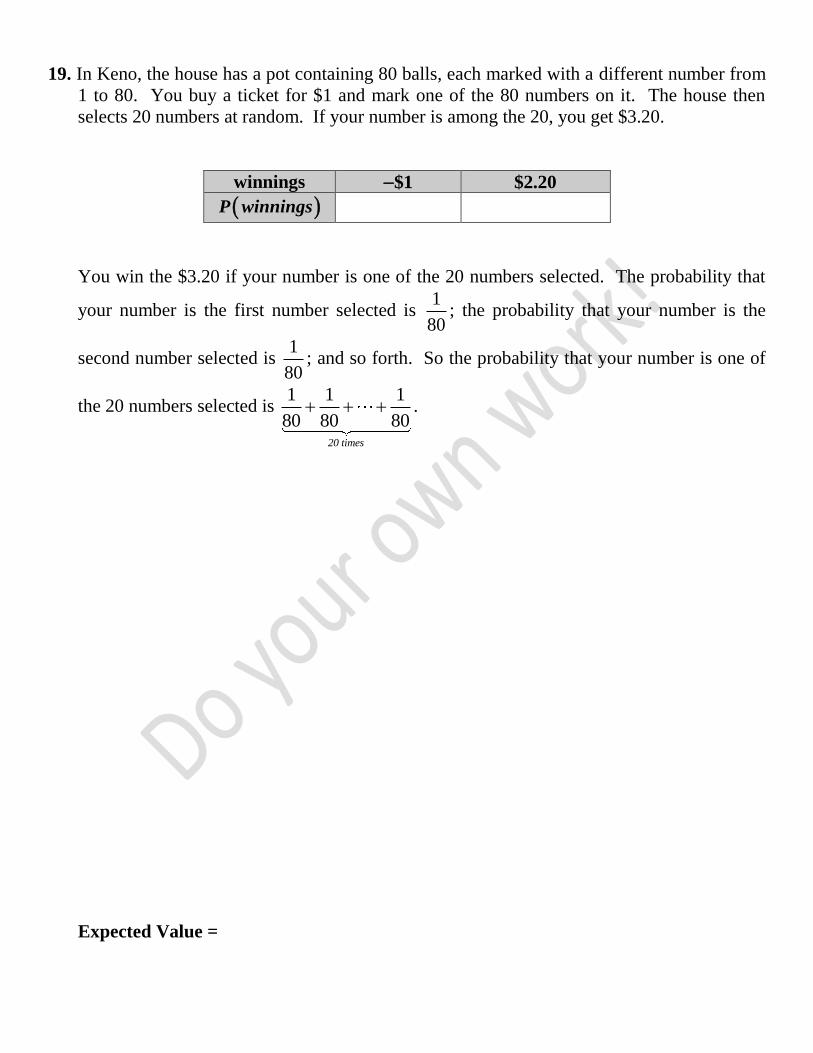
19. In Keno, the house has a pot containing 80 balls, each marked with a different number from
1 to 80. You buy a ticket for $1 and mark one of the 80 numbers on it. The house then
selects 20 numbers at random. If your number is among the 20, you get $3.20.
winnings $1 $2.20
P winnings
You win the $3.20 if your number is one of the 20 numbers selected. The probability that
your number is the first number selected is 1
80; the probability that your number is the
second number selected is 1
80; and so forth. So the probability that your number is one of
the 20 numbers selected is 1 1 1
80 80 8020 times
.
Expected Value =

Complete the probability distribution and histogram for the following random variables, and
determine the expected value.
20. Two fair dice are rolled and the random variable, x , is the sum of the faces showing.
1,1 1,2 1,3 1,4 1,5 1,6
2,1 2,2 2,3 2,4 2,5 2,6
3,1 3,2 3,3 3,4 3,5 3,6
4,1 4,2 4,3 4,4 4,5 4,6
5,1 5,2 5,3 5,4 5,5 5,6
6,1 6,2 6,3 6,4 6,5 6,6
x 2 3 4 5 6 7 8 9 10 11 12
P x 1
36
1
36
E x
Second die
Fir
st d
ie
1 2 3 4 5 6 7 8 9 10 11 12
1
36

21. Two names are randomly drawn from a hat without replacement. Three of the names in the
hat are Aggies, and the other two are Longhorns. Let the random variable, x , be the total
number of Aggies selected.
The sample space for this experiment is
1 1,L A 1 2,L A 1 3,L A
2 1,L A 2 2,L A 2 3,L A
1 2,A A 1 3,A A 2 3,A A
1 2,L L
x 0 1 2
P x 1
10
E x
1
10
1 2 3 1

22. The probability density function for a continuous random variable X, which takes on values
from 1 to 5 inclusive, is given by the following graph.
a) Verify that the probability density function is valid by showing that the total area under
its graph is 1.
b) Find 4.5P X c) Find 1.8 4.2P X
d) Using the idea of a balance point, what’s the mean or expected value of X?
e) Using the idea that the median separates the upper 50% of the values from the lower 50%
of the values, what’s the median of X?
1 2 3 4 5
14

23. The probability density function for a continuous random variable X, which takes on values
from 1 to 5 inclusive, is given by the following graph.
a) Verify that the probability density function is valid by showing that the total area under
its graph is 1.
b) Find 4P X c) Find 2 4P X
d) Using the idea of a balance point, what’s the mean or expected value of X?
e) Using the idea that the median separates the upper 50% of the values from the lower 50%
of the values, what’s the median of X?
f) Using the idea that the mode is the most likely value to occur, what’s the mode of X?
1 2 3 4 5
12

24. The probability density function for a continuous random variable X, which takes on values
from 1 to 5 inclusive, is given by the following graph.
a) Verify that the probability density function is valid by showing that the total area under
its graph is 1.
b) Find 2P X c) Find 2 4P X
d) Using the idea that the median separates the upper 50% of the values from the lower 50%
of the values, what’s the median of X?
e) Using the idea that the mode is the most likely value to occur, what’s the mode of X?
1 2 3 4 5
12

25. A fair die is rolled until all six faces occur, and we would like to know the expected number
of rolls required for this to happen. Here are the results of simulating the rolls 12 times:
Trial # 1 2 3 4 5 6 7 8 9 10 11 12
1 3 5 2 1 3 6 6 2 6 5 6
4 1 4 6 1 5 2 2 6 6 1 4
6 1 3 3 2 5 3 1 2 1 5 4
5 5 4 4 6 2 1 6 4 2 1 5
5 6 4 5 1 4 6 2 2 1 2 6
3 1 2 4 5 1 6 6 6 5 5 4
4 6 1 6 1 2 6 1 6 4 3 1
2 1 3 6 1 6 4 6 5 4 1 6
2 2 4 2 6 6 2 2 6 4
5 3 3 1 4 5 1 6 5 6
4 6 6 2 4 4 4 5 5 5
3 5 5 6 4 5 3 2
4 1 6 5 4 5 3
2 1 2 2 6 6
1 3 4 5 5 2
6 6 2 6 4
5 6 3 1
1 3 3
4
# of rolls to get all 6
Complete the table, and use the results to estimate the expected number of rolls required to
see all six numbers with a fair die.

26.

27.

28.
Average number to get all 10: Average number to get all 6:
The exact expected number is about 29.29. The exact expected number is 14.7.
Average number to get all 8: Average number to get all 12:
The exact expected number is about 21.74. The exact expected number is about 37.24.
See the Collecting Link on my Webpage!!!!
Trial # 1 2 3 4 5
# of rolls to
get all 6
Trial # 1 2 3 4 5
# of rolls to
get all 10
Trial # 1 2 3 4 5
# of rolls to
get all 8
Trial # 1 2 3 4 5
# of rolls to
get all 12
of six shapes on the

29.