Embed Size (px)
Citation preview

1
Math 140C Final Exam Fall 2017 Name:
VERSION B Instructor:
Days and Time of Class:
INSTRUCTIONS
• When capitalized words are separated by slashes ( / ), circle the word(s) that
CORRECTLY / WRONGLY completes the sentence. For each blank line , fill in the best answer.
• SHOW ALL WORK, including needed formulas and calculator commands.
• Please write in pencil and erase anything that you don’t want graded.
• Graphing calculators are allowed only if nothing has been stored in them. Books and notes are NOT allowed.
• You may tear off the formula sheet from the back of the exam and use it as scratch paper, but turn it in with your exam. Nothing on it will be graded.
• Please raise your hand when finished and pack up after your exam has been collected.
• No cell phones may be turned on or in sight at any time during the exam. If your phone is visible during the exam, your papers will be collected and you will receive an F on the exam.
Problem Possible Points Points Scored
1 4
2 12
3 10
4 12
5 10
6 14
7 10
8 10
9 10
10 8
TOTAL 100
2
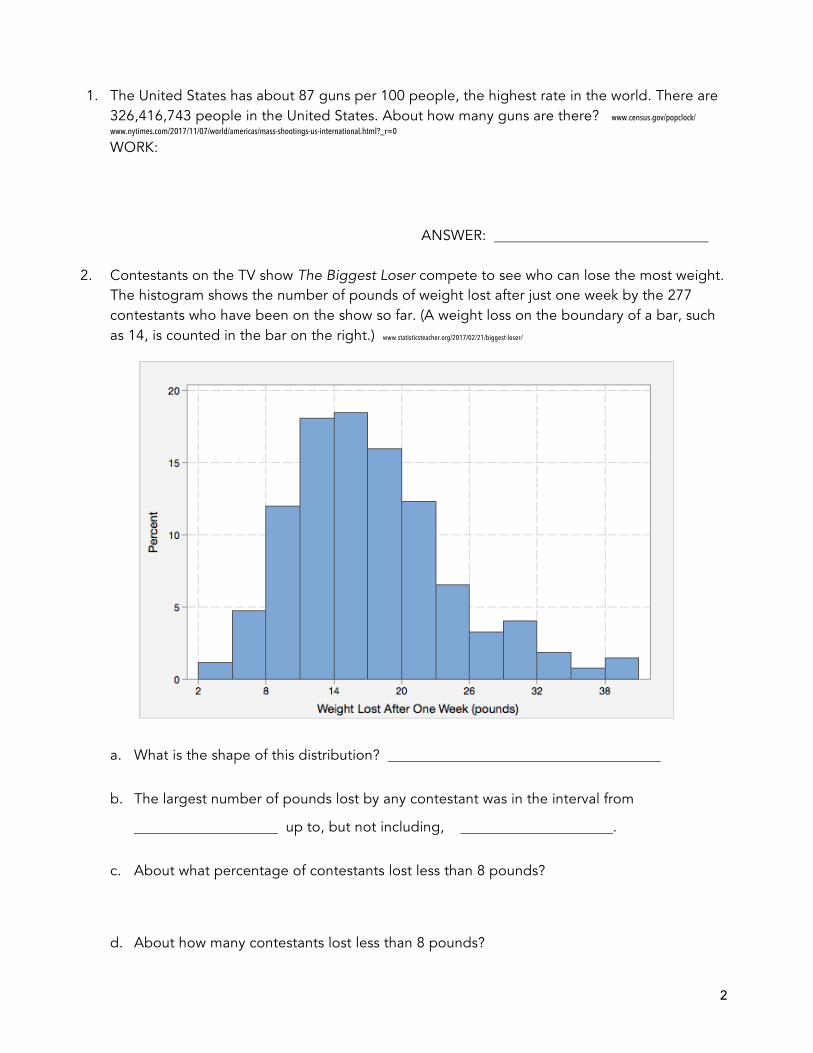
1. The United States has about 87 guns per 100 people, the highest rate in the world. There are 326,416,743 people in the United States. About how many guns are there? www.census.gov/popclock/
www.nytimes.com/2017/11/07/world/americas/mass-shootings-us-international.html?_r=0
WORK:
ANSWER:
2. Contestants on the TV show The Biggest Loser compete to see who can lose the most weight. The histogram shows the number of pounds of weight lost after just one week by the 277 contestants who have been on the show so far. (A weight loss on the boundary of a bar, such as 14, is counted in the bar on the right.) www.statisticsteacher.org/2017/02/21/biggest-loser/
a. What is the shape of this distribution?
b. The largest number of pounds lost by any contestant was in the interval from
up to, but not including, .
c. About what percentage of contestants lost less than 8 pounds?
d. About how many contestants lost less than 8 pounds?

3
3. These boxplots show the number of pounds lost after just one week by the contestants on The Biggest Loser, categorized by age group.
a. The smallest amount of weight lost by any contestant was about pounds.
b. As measured by the median, which two age groups had the largest weight loss?
and
c. As measured by the interquartile range, which age group had the most variability in weight loss?
d. Which age group had the most strongly skewed distribution?
e. are designated by stars.

4
4. The scatterplot shows the starting weight and the total weight loss at the finale for the 277 contestants on The Biggest Loser. The regression equation is graphed on the plot.
a. The correlation is POSITIVE / NEGATIVE / CLOSE TO ZERO. The more a contestant weighed at the start, the LARGER / SMALLER the weight loss tended to be.
b. Circle the point that represents the person who had the smallest starting weight.
c. Put a square around the point that represents the person who had the largest residual (in absolute value). This person’s weight loss was:
LESS THAN PREDICTED / MORE THAN PREDICTED / ABOUT WHAT WAS PREDICTED
d. Use the regression line on the plot to predict the weight loss at the finale for a person whose starting weight was 300 pounds. Show on the plot how you did this.
predicted weight loss at finale: e. The slope of the regression line is .45. Circle the best interpretation of the slope.
A. A contestant who weighs 1000 pounds at the start is predicted to lose 450 pounds.
B. The relationship between the starting weight and the weight loss at the finale is moderate.
C. For every additional pound of starting weight, the regression line predicts a weight loss of .45 more pounds.
D. For every additional pound of weight loss, the regression line predicts that a contestant weighed .45 pounds more at the start.

5
5. The heights of the females on The Biggest Loser were approximately normally distributed with mean 66 inches and standard deviation 2.5 inches. Round answers to four decimal places.
a. Here is a sketch of this distribution. About what proportion of the female contestants were 67 inches or taller? Shade the relevant area and then find the proportion.
WORK:
ANSWER:
b. Suppose that you will take a random sample of 25 female contestants and compute their mean height, 𝑥. Describe the sampling distribution of 𝑥 , showing any necessary work:
shape: mean:
standard error:
Complete the scale on this sketch of the sampling distribution of 𝑥 .
c. What is the probability that the mean height of the 25 females will be 67 inches or more?
Shade the relevant area on the distribution in part b and then find the probability. WORK:
ANSWER:

6
6. An article in Science Daily claims that the mean age at which children take their first step is 12 months. You think that the mean age is less and get a random sample of five children. The ages at which they took their first step were 10, 12, 14, 12, and 11 months. www.sciencedaily.com/releases/2013/03/130328075702.htm
a. What is 𝑥? What is n?
b. Write the hypotheses: Ho: Ha:
c. What does the symbol stand for in your hypotheses in part b? (Circle one.)
A. 12 months
B. 11.8 months
C. the mean age at which all children take their first step
D. the mean age at which all children in the sample took their first step
d. If the null hypothesis is true, this graph shows the sampling distribution of 𝑥 .
• Place an arrow to show where 𝑥 from the sample is located.
• Shade the area that represents
the p-value.
e. Compute the p-value on your calculator, giving the name of the test you used.
test name: p-value:
f. Fill in the blanks to complete this interpretation of the p-value.
If the mean age at which children take their first step is , then there is a chance of getting mean of or even smaller from a random sample of five children.
g. In each sentence below, circle the best word(s) in each capitalized group to state a conclusion. Use a significance level of α = .05.
• Because the p-value is LESS / GREATER than .05, the null hypothesis should be ACCEPTED / REJECTED / NOT REJECTED.
• There IS / IS NOT statistically significant evidence that the mean age that children take their first step is less than 12 months.
• The results from the sample ARE / ARE NOT consistent with the claim that children take their first step at an average of 12 months.

7
7. A study of the effectiveness of flu vaccinations got the following results for samples of Americans age 18–49. Is this statistically significant evidence that people who don’t get flu shots are more likely to get the flu? /statisticsbyjim.com/hypothesis-testing/flu-shots-effectiveness/
Confirmed Case of Flu Total No Flu Shot 35 325
Got Flu Shot 28 813
The hypotheses are Ho: 𝑝% = 𝑝'and Ha:𝑝% > 𝑝' where subscript 1 represents people who don’t get a flu shot and subscript 2 represents people who do get a flu shot.
a. Assume the null hypothesis is true:
• The mean of the sampling distribution of 𝑝% − 𝑝'is .
• Complete the scale on this sampling distribution. The SE is .015.
• Compute𝑝% − 𝑝' to three decimal places and mark its location with an arrow, extending the axis if necessary.
• Where is the area that represents the p-value?
b. Compute the p-value on your calculator, giving the name of the test you used. Write the
p-value as a decimal, rounded to four decimal places.
test name: p-value:
c. Circle the right word(s) in each capitalized group to state a conclusion. Use 𝛼 = .05.
We ACCEPT / REJECT / DO NOT REJECT the null hypothesis.
There IS / IS NOT statistically significant evidence that people who don’t get flu shots are more likely to get the flu.

8
8. The mean age at which a random sample of 222 Swiss babies first sat up was 6.5 months, with standard deviation 1.9 months. www.sciencedaily.com/releases/2013/03/130328075702.htm
a. Compute a 95% confidence interval for this situation. Round to three decimal places and write the interval on the line in the form (lower bound, upper bound).
WORK: 95% confidence interval: ( , )
b. We are 95% confident that THE AGE / THE MEAN AGE at which all babies IN THE SAMPLE / IN SWITZERLAND sit up is 6.5 MONTHS / IN THIS INTERVAL.
c. 95% confident means that, for every 1000 confidence intervals constructed using our
method, we expect that ALL / 950 / 95 / NONE of them will contain the population parameter.
9. This table shows The Biggest Loser contestants categorized by gender and age group.
Age < 30 30 to 39 40 to 49 50 to 59 60 Plus Total Female 70 38 21 12 4 145 Male 46 44 24 11 7 132
Total 116 82 45 23 11 277
Write any numerical answers below as unreduced fractions.
a. What proportion of contestants age 40–49 were male?
b. What proportion of females were age 39 or younger?
c. What proportion of all contestants were female?
d. Which age group had the largest proportion of females?
e. Because the proportion of females varies from age group to age group in this population, the variables of gender and age are INDEPENDENT / ASSOCIATED / RANDOM .

9
10. A sample of 318 people with bipolar disorder were categorized by gender and by whether they were diagnosed early (age 18 or younger) or late (older than age 18). This printout displays the results of a chi-square test. www.statcrunch.com/5.0/viewreport.php?reportid=52472">0503 Family History of Mood Disorders
Male Female Total
Early 60 72.27
81 68.73 141
Late 103 90.73
74 86.27 177
Total 163 155 318
Cell Contents: Count Expected count
Chi-Square DF P-Value Pearson 7.68 1 0.0056
a. Circle the correct word in each capitalized pair to state the hypotheses for the 𝜒' test.
Ho : The variables of gender and age of diagnosis are ASSOCIATED / INDEPENDENT.
Ha : The variables of gender and age of diagnosis are ASSOCIATED / INDEPENDENT.
ASSOCIATED / INDEPENDENT means that in the population one gender is more likely to have been diagnosed early than the other gender.
b. Using the information in the cell for males diagnosed early, compute the quantity (012)4
2,
rounding to four decimal places. WORK:
ANSWER:
c. Circle the best words in each capitalized group to state a conclusion. Use α = .05.
• We REJECT / DO NOT REJECT / ACCEPT the null hypothesis.
• We DO / DON’T have statistically significant evidence that gender and age of diagnosis are INDEPENDENT / ASSOCIATED.
• Specifically, MALES / FEMALES are more likely to be diagnosed early.

10
Use this page for scratch paper. It won’t be graded.

11
Math 140 Formulas
sample mean: x =x∑
n
sample standard deviation: s =(x − x )2∑n −1
z-score: z = x − xs
interquartile range: IQR = Q3 – Q1
standard error of sampling distribution of p̂ : SE =p 1− p( )
n
standard error of sampling distribution of x : SE = σn
general confidence interval: observed value ± margin of error
confidence interval for p: p̂ ± m where m = z*⋅ p̂ 1− p̂( )
n
confidence interval for µ : x ± m where m = t * sn
general test statistic:
observed value− hypothesized valueSE
one-proportion z-test statistic: z = p̂ − p0
SE where SE =
p0 1− p0( )n
two proportion z-test statistic: z =p̂1 − p̂2( )− 0
SE
where SE = p̂ 1− p̂( ) 1n1
+ 1n2
⎛⎝⎜
⎞⎠⎟
and p̂ = number of successes in both samplesn1 + n2
12
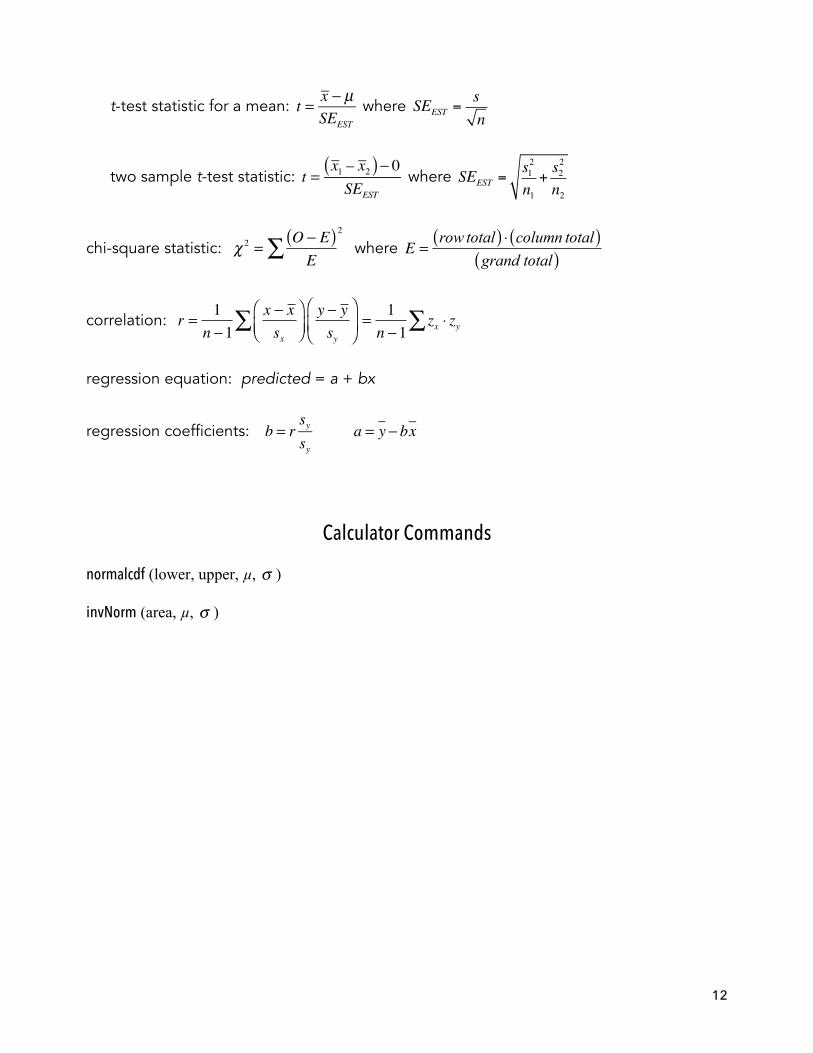
t-test statistic for a mean: t = x − µSEEST
where SEEST =sn
two sample t-test statistic: t =x1 – x2( )− 0SEEST
where SEEST =s12
n1+s22
n2
chi-square statistic: χ 2 =O − E( )E
2
∑ where E =
row total( ) ⋅ column total( )grand total( )
correlation: r =1
n −1x − xsx
⎛⎝⎜
⎞⎠⎟
y − ysy
⎛
⎝⎜⎞
⎠⎟∑ =
1n −1
zx ⋅ zy∑
regression equation: predicted = a + bx
regression coefficients: b = r
sysy
a = y − bx
Calculator Commands
normalcdf (lower, upper, µ, σ )
invNorm (area, µ, σ )


![Gradiente SMZ 140C[1]](https://img.pdfslide.net/doc/110x75/5520f19b497959892f8b50e5/gradiente-smz-140c1.jpg)