Embed Size (px)
Citation preview
1
Math Flash Cards Grade 4
These flash cards were designed with several purposes in mind:
Provide a quick review of key mathematical topics in a fun, fast, frequent, spaced and mixed manner.
Help students become familiar with the kinds of graphics/pictures,
questions, and vocabulary that they see frequently and need to know in math.
Help students prepare for both lower level (recall) and higher level
questions (compare, analyze, apply, generalize) by practicing these questions sequentially.
Allow students to emphasize on process over computing so they can practice
many kinds of questions in the form: explain how you would find…
Build reading skills by asking students to slow down and preview a question before starting, asking: “What do I know here?”. Next, they find key information in the graphs, titles, and sentences which set the context of the problem.
Help students to show work by modeling a condensed but clear explanation.
Allow students to practice skills and recall key concepts independently or
with a partner, a teacher, tutor, aid or parent.
Make students aware of mistakes to avoid and look for common errors.
Help teachers to assign a quick homework: “study these 3 flash cards,” and offer a quick assessment: “fill in these 4 sections from the flash cards.”
Challenge each student at their level by giving opportunities to create their
own problems or try problems from another grade level.
2
Using the Flash Cards 1. Have students quiz each other. One student simply folds back the question/answer
section and looks at the picture while the other student quizzes him/her. Model this for students. When finished, switch places and repeat. Students should get really fast!
2. Have an teacher’s aid, classroom assistant, or student teacher work with students in
small group sessions or one on one. Some classroom helpers feel less secure with math and often need the support of the answers and this sheet provides them.
3. Teacher puts a graphic up on the screen and “peppers” the students with questions
from the cards (see Teach Like a Champion for more information on Pepper). You can differentiate as you see fit.
4. Teacher can call individual students to his or her desk to check for understanding of a
card. 5. Have students practice with them at home by themselves (by covering one side) or with
parents, older siblings, grandparents etc. 6. After encouraging students to “study/review” their cards, clear off the answer side and
give it as a quiz. You may eliminate some of the questions to make more room for answers. And you can change the questions slightly to avoid a simple “regurgitation” of a memorized answer.
7. Provide the graphic and have students make up questions and answers for each picture. A teacher from Amesbury, Massachusetts writes: The flashcards are going very well. I give them flash card each night for homework and tell them that they have to “own it” for baby quiz the following day. It is good because it’s not too big of an assignment. I see kids quizzing each other, and it really helps to reinforce important facts. For the quick quiz, I don’t make them regurgitate it; I ask them to do something that parallels the flashcard. Remember the cards are a flexible tool and you can adjust them as needed. They are not meant to discourage students from writing down or showing their work; rather they are a quick way to verbally review lots of content easily and painlessly. © 2011 Bill Atwood 617-686-2330 [email protected] Lemov, Doug (2010)Teach Like a Champion. San Francisco, Jossey-Bass Teacher
3
Questions Answers
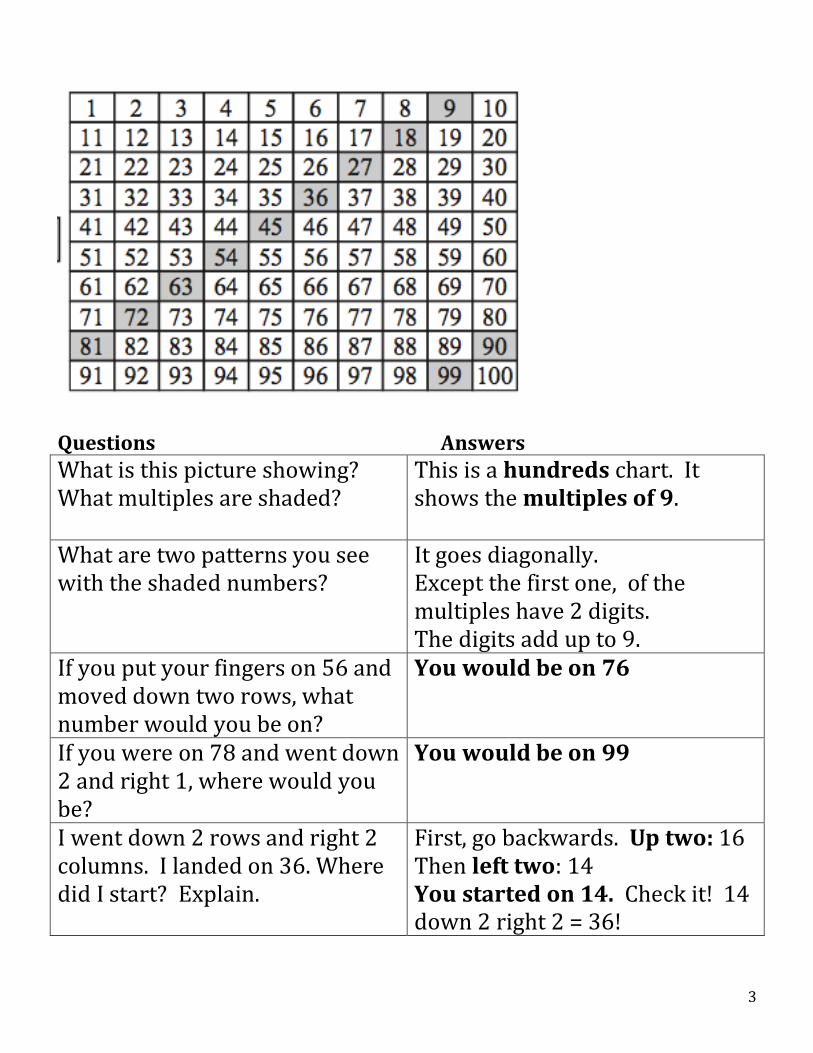
What is this picture showing? What multiples are shaded?
This is a hundreds chart. It shows the multiples of 9.
What are two patterns you see with the shaded numbers?
It goes diagonally. Except the first one, of the multiples have 2 digits. The digits add up to 9.
If you put your fingers on 56 and moved down two rows, what number would you be on?
You would be on 76
If you were on 78 and went down 2 and right 1, where would you be?
You would be on 99
I went down 2 rows and right 2 columns. I landed on 36. Where did I start? Explain.
First, go backwards. Up two: 16 Then left two: 14 You started on 14. Check it! 14 down 2 right 2 = 36!
4
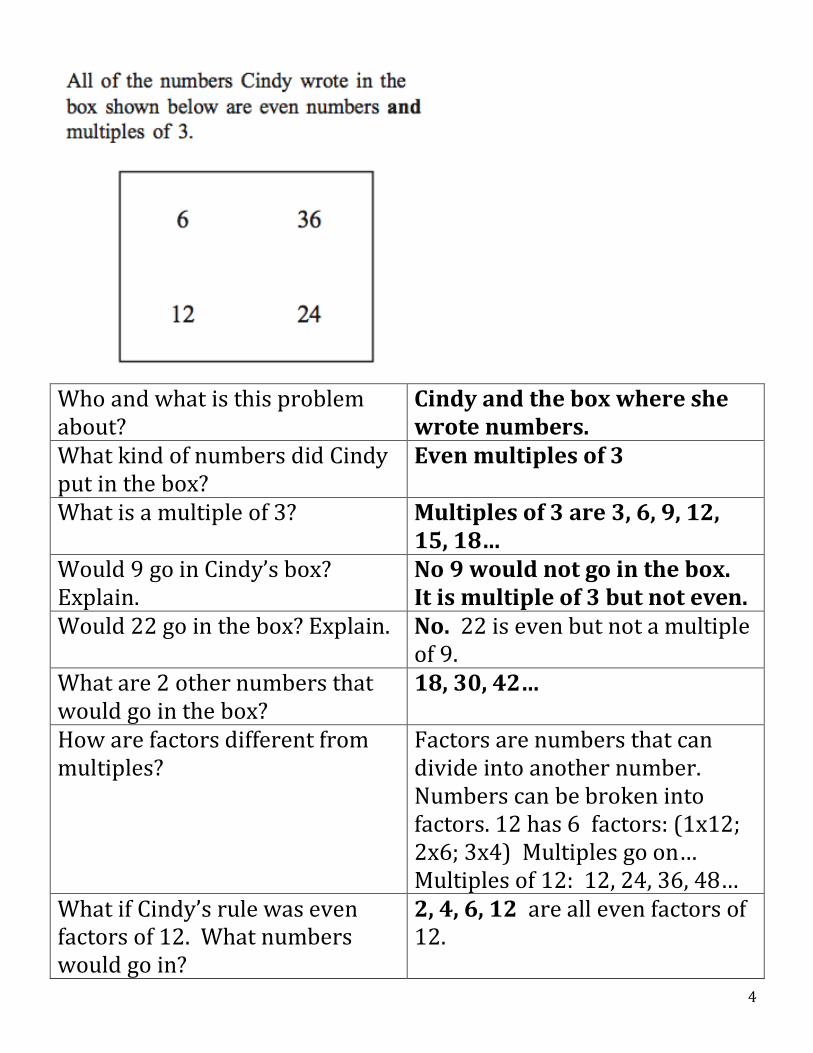
Who and what is this problem about?
Cindy and the box where she wrote numbers.
What kind of numbers did Cindy put in the box?
Even multiples of 3
What is a multiple of 3? Multiples of 3 are 3, 6, 9, 12, 15, 18…
Would 9 go in Cindy’s box? Explain.
No 9 would not go in the box. It is multiple of 3 but not even.
Would 22 go in the box? Explain. No. 22 is even but not a multiple of 9.
What are 2 other numbers that would go in the box?
18, 30, 42…
How are factors different from multiples?
Factors are numbers that can divide into another number. Numbers can be broken into factors. 12 has 6 factors: (1x12; 2x6; 3x4) Multiples go on… Multiples of 12: 12, 24, 36, 48…
What if Cindy’s rule was even factors of 12. What numbers would go in?
2, 4, 6, 12 are all even factors of 12.
5
Questions Answers
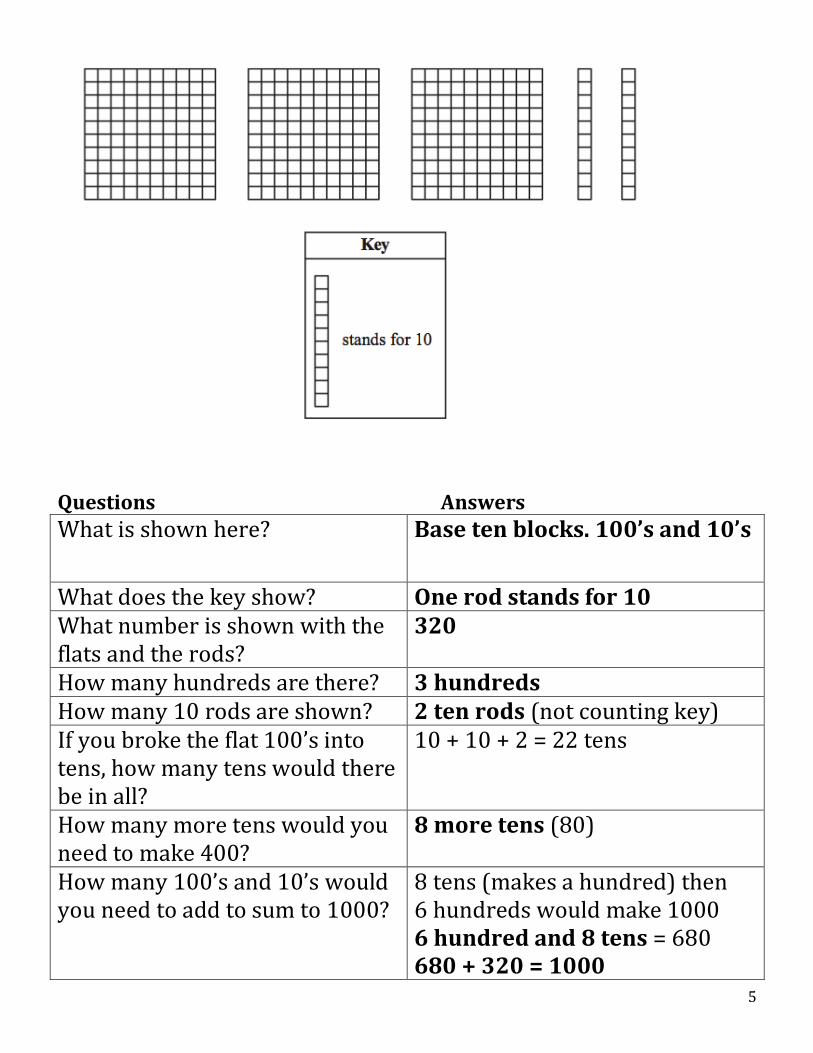
What is shown here? Base ten blocks. 100’s and 10’s
What does the key show? One rod stands for 10 What number is shown with the flats and the rods?
320
How many hundreds are there? 3 hundreds How many 10 rods are shown? 2 ten rods (not counting key) If you broke the flat 100’s into tens, how many tens would there be in all?
10 + 10 + 2 = 22 tens
How many more tens would you need to make 400?
8 more tens (80)
How many 100’s and 10’s would you need to add to sum to 1000?
8 tens (makes a hundred) then 6 hundreds would make 1000 6 hundred and 8 tens = 680 680 + 320 = 1000
6
–
Questions Answers
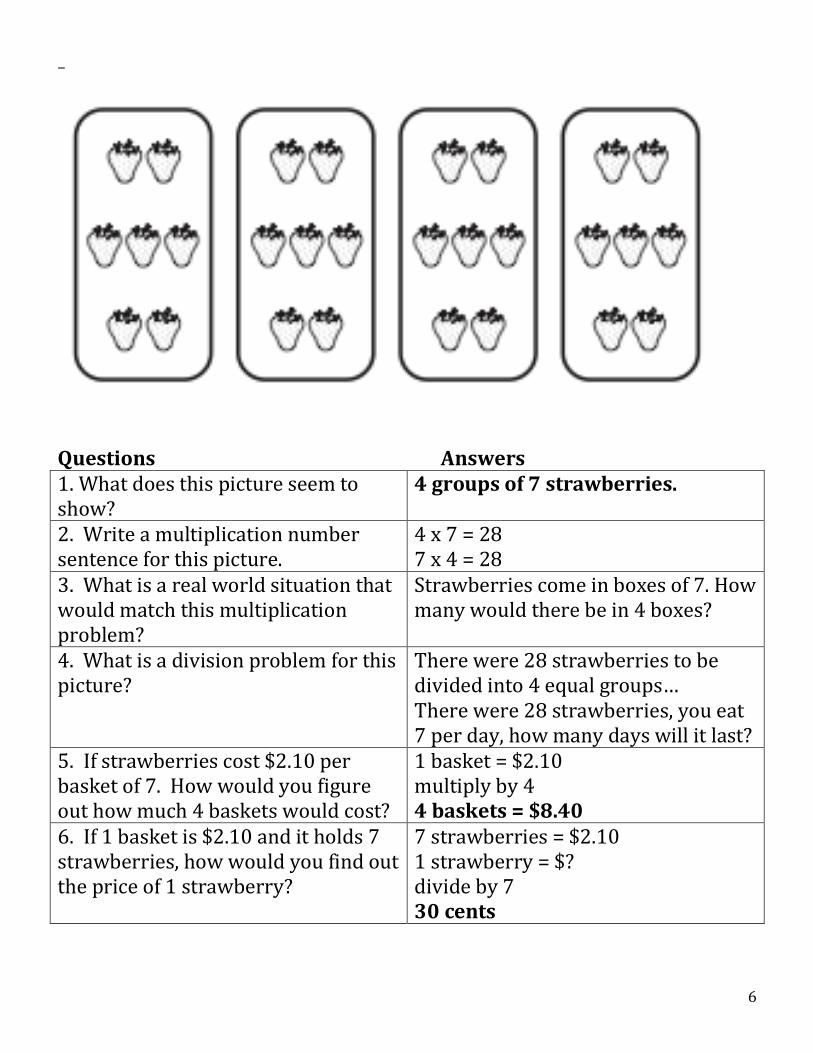
1. What does this picture seem to show?
4 groups of 7 strawberries.
2. Write a multiplication number sentence for this picture.
4 x 7 = 28 7 x 4 = 28
3. What is a real world situation that would match this multiplication problem?
Strawberries come in boxes of 7. How many would there be in 4 boxes?
4. What is a division problem for this picture?
There were 28 strawberries to be divided into 4 equal groups… There were 28 strawberries, you eat 7 per day, how many days will it last?
5. If strawberries cost $2.10 per basket of 7. How would you figure out how much 4 baskets would cost?
1 basket = $2.10 multiply by 4 4 baskets = $8.40
6. If 1 basket is $2.10 and it holds 7 strawberries, how would you find out the price of 1 strawberry?
7 strawberries = $2.10 1 strawberry = $? divide by 7 30 cents
7
Questions Answers
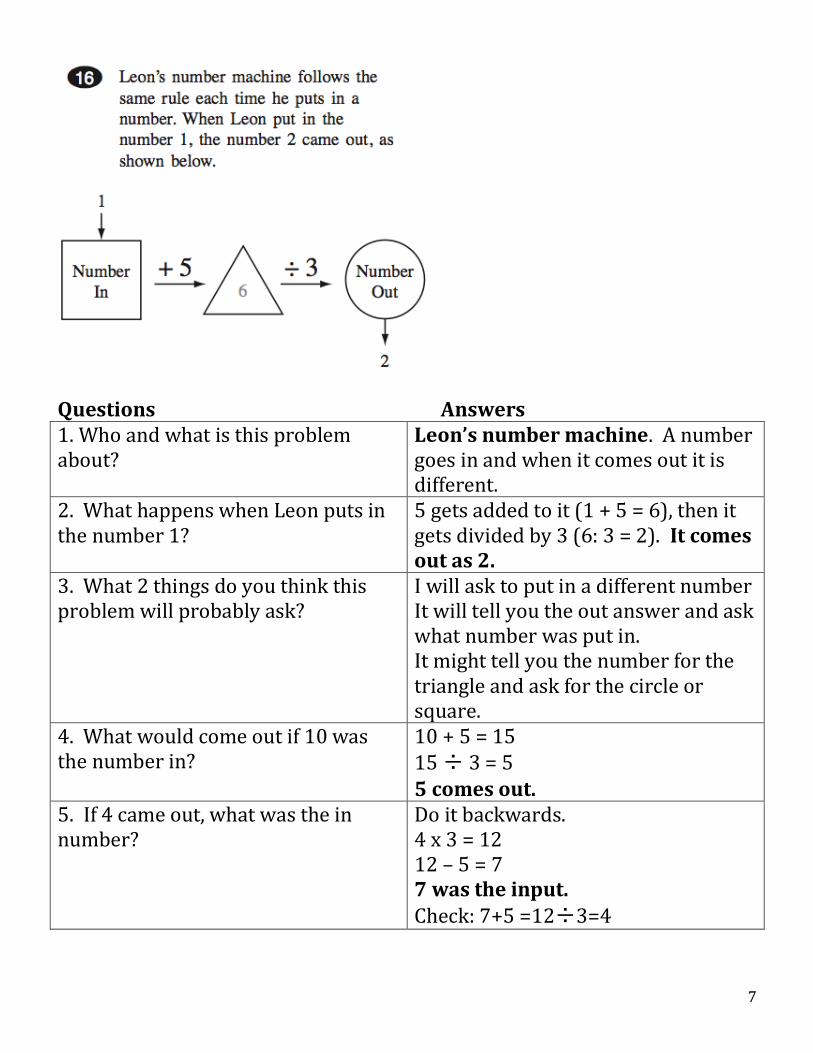
1. Who and what is this problem about?
Leon’s number machine. A number goes in and when it comes out it is different.
2. What happens when Leon puts in the number 1?
5 gets added to it (1 + 5 = 6), then it gets divided by 3 (6: 3 = 2). It comes out as 2.
3. What 2 things do you think this problem will probably ask?
I will ask to put in a different number It will tell you the out answer and ask what number was put in. It might tell you the number for the triangle and ask for the circle or square.
4. What would come out if 10 was the number in?
10 + 5 = 15 15 ÷ 3 = 5 5 comes out.
5. If 4 came out, what was the in number?
Do it backwards. 4 x 3 = 12 12 – 5 = 7 7 was the input. Check: 7+5 =12÷3=4
8
Questions Answers
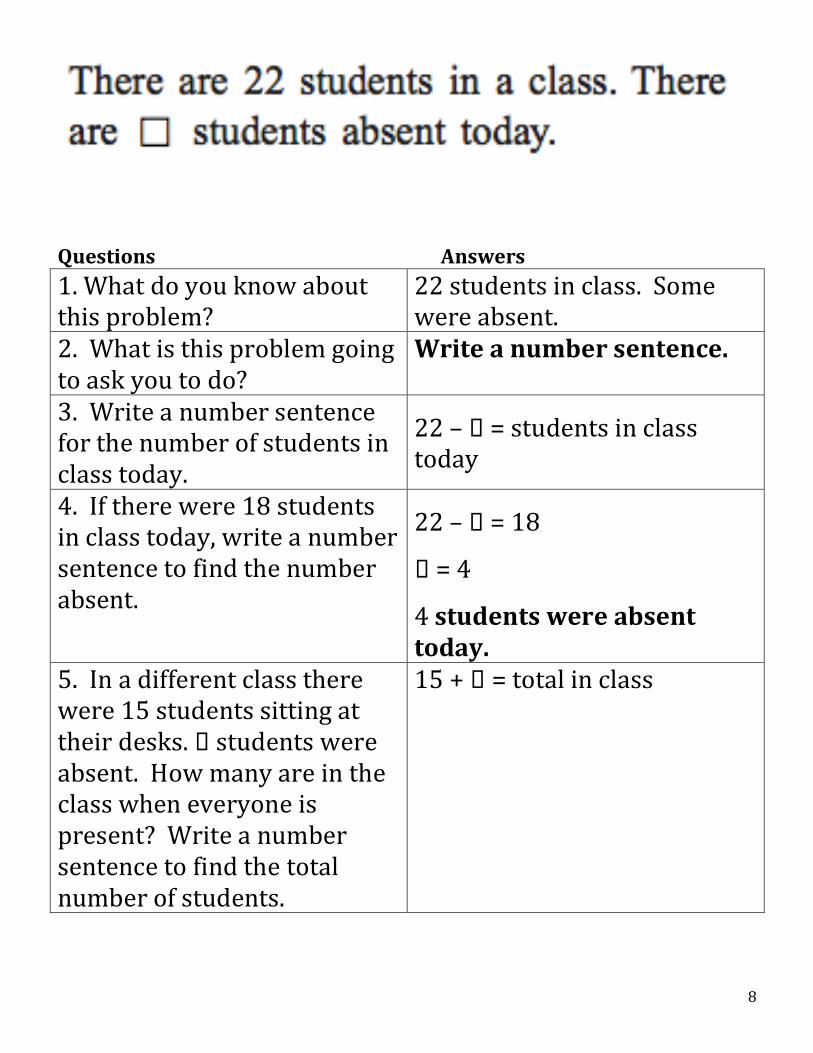
1. What do you know about this problem?
22 students in class. Some were absent.
2. What is this problem going to ask you to do?
Write a number sentence.
3. Write a number sentence for the number of students in class today.
22 – = students in class today
4. If there were 18 students in class today, write a number sentence to find the number absent.
22 – = 18
= 4
4 students were absent today.
5. In a different class there were 15 students sitting at their desks. students were absent. How many are in the class when everyone is present? Write a number sentence to find the total number of students.
15 + = total in class
9
Questions Answers
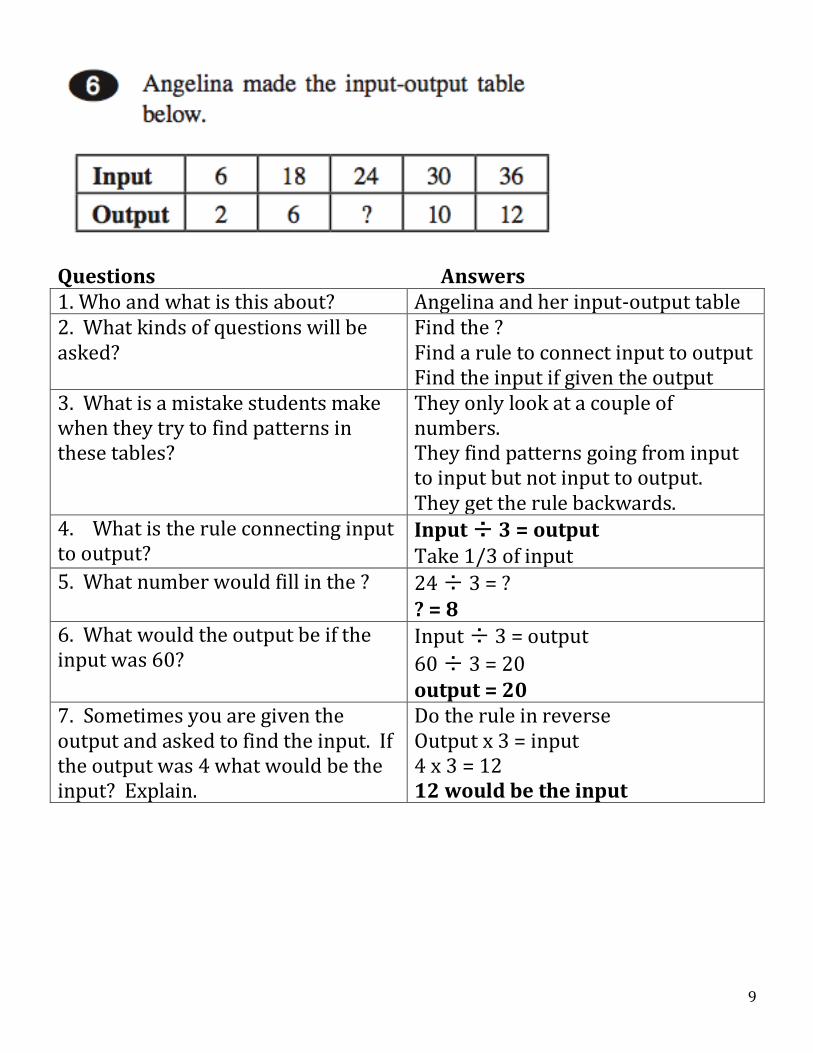
1. Who and what is this about? Angelina and her input-output table 2. What kinds of questions will be asked?
Find the ? Find a rule to connect input to output Find the input if given the output
3. What is a mistake students make when they try to find patterns in these tables?
They only look at a couple of numbers. They find patterns going from input to input but not input to output. They get the rule backwards.
4. What is the rule connecting input to output?
Input ÷ 3 = output Take 1/3 of input
5. What number would fill in the ? 24 ÷ 3 = ? ? = 8
6. What would the output be if the input was 60?
Input ÷ 3 = output
60 ÷ 3 = 20 output = 20
7. Sometimes you are given the output and asked to find the input. If the output was 4 what would be the input? Explain.
Do the rule in reverse Output x 3 = input 4 x 3 = 12 12 would be the input
10
Questions Answers
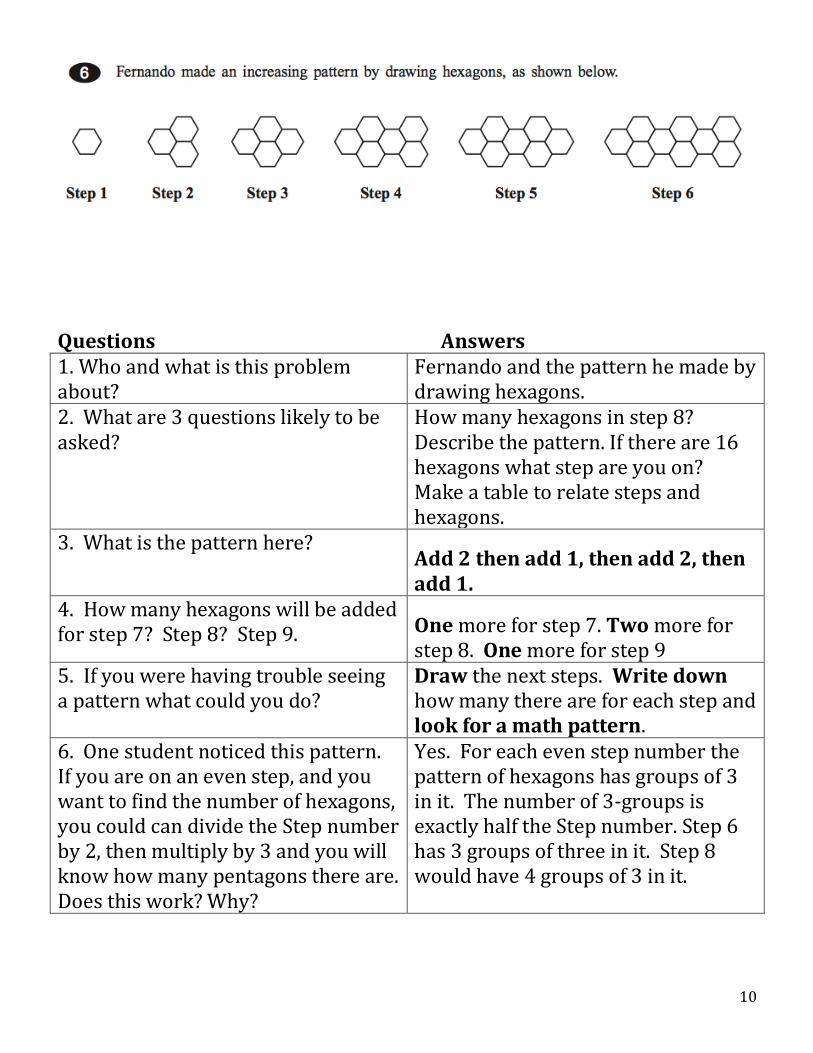
1. Who and what is this problem about?
Fernando and the pattern he made by drawing hexagons.
2. What are 3 questions likely to be asked?
How many hexagons in step 8? Describe the pattern. If there are 16 hexagons what step are you on? Make a table to relate steps and hexagons.
3. What is the pattern here? Add 2 then add 1, then add 2, then add 1.
4. How many hexagons will be added for step 7? Step 8? Step 9. One more for step 7. Two more for
step 8. One more for step 9 5. If you were having trouble seeing a pattern what could you do?
Draw the next steps. Write down how many there are for each step and look for a math pattern.
6. One student noticed this pattern. If you are on an even step, and you want to find the number of hexagons, you could can divide the Step number by 2, then multiply by 3 and you will know how many pentagons there are. Does this work? Why?
Yes. For each even step number the pattern of hexagons has groups of 3 in it. The number of 3-groups is exactly half the Step number. Step 6 has 3 groups of three in it. Step 8 would have 4 groups of 3 in it.
11
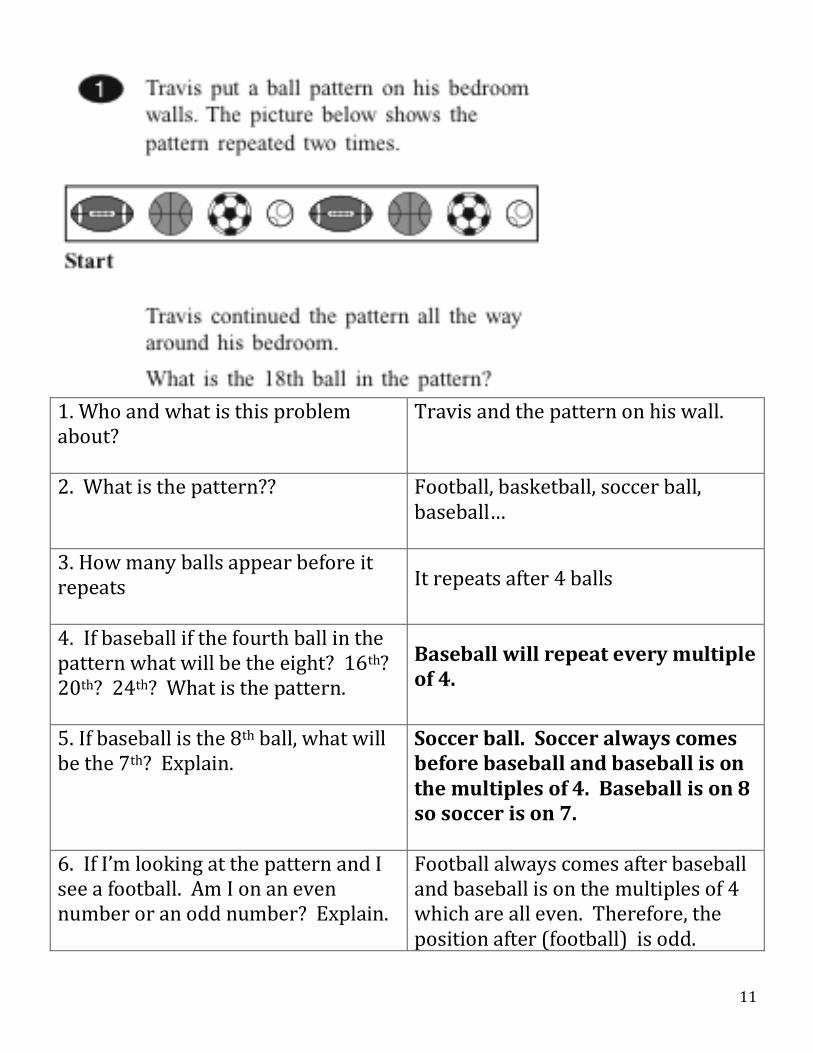
1. Who and what is this problem about?
Travis and the pattern on his wall.
2. What is the pattern?? Football, basketball, soccer ball, baseball…
3. How many balls appear before it repeats
It repeats after 4 balls
4. If baseball if the fourth ball in the pattern what will be the eight? 16th? 20th? 24th? What is the pattern.
Baseball will repeat every multiple of 4.
5. If baseball is the 8th ball, what will be the 7th? Explain.
Soccer ball. Soccer always comes before baseball and baseball is on the multiples of 4. Baseball is on 8 so soccer is on 7.
6. If I’m looking at the pattern and I see a football. Am I on an even number or an odd number? Explain.
Football always comes after baseball and baseball is on the multiples of 4 which are all even. Therefore, the position after (football) is odd.
12
Questions Answers
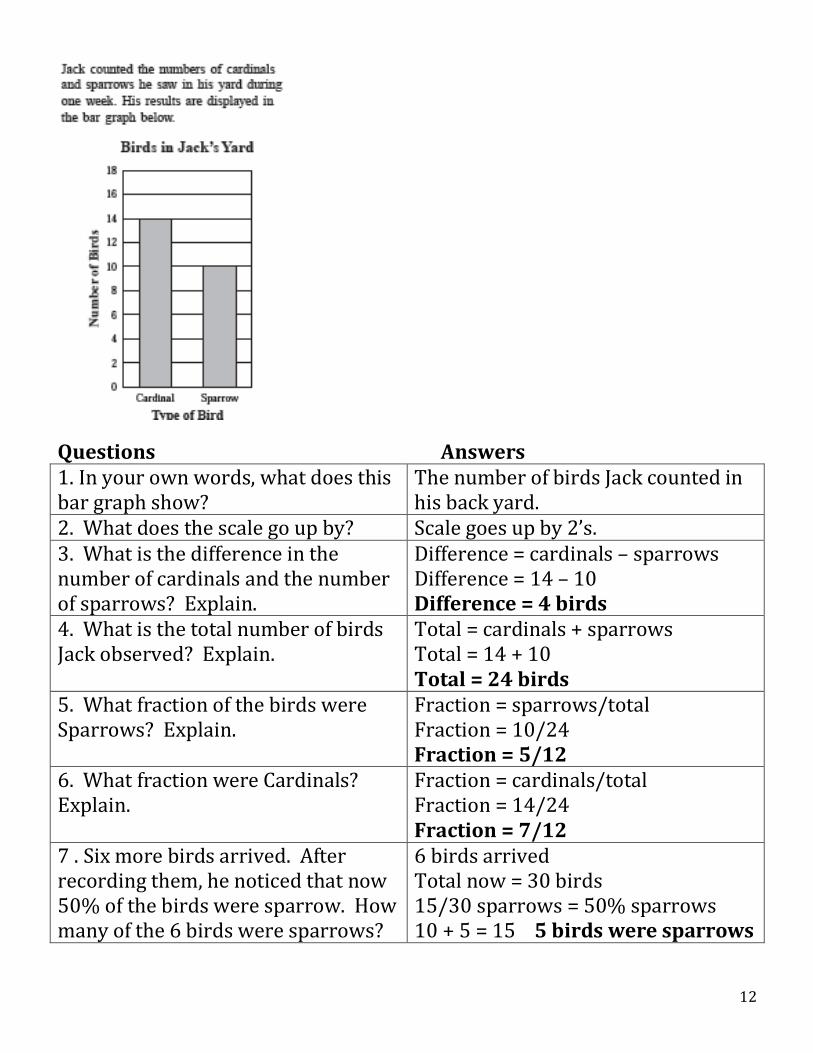
1. In your own words, what does this bar graph show?
The number of birds Jack counted in his back yard.
2. What does the scale go up by? Scale goes up by 2’s. 3. What is the difference in the number of cardinals and the number of sparrows? Explain.
Difference = cardinals – sparrows Difference = 14 – 10 Difference = 4 birds
4. What is the total number of birds Jack observed? Explain.
Total = cardinals + sparrows Total = 14 + 10 Total = 24 birds
5. What fraction of the birds were Sparrows? Explain.
Fraction = sparrows/total Fraction = 10/24 Fraction = 5/12
6. What fraction were Cardinals? Explain.
Fraction = cardinals/total Fraction = 14/24 Fraction = 7/12
7 . Six more birds arrived. After recording them, he noticed that now 50% of the birds were sparrow. How many of the 6 birds were sparrows?
6 birds arrived Total now = 30 birds 15/30 sparrows = 50% sparrows 10 + 5 = 15 5 birds were sparrows
13
Questions Answers
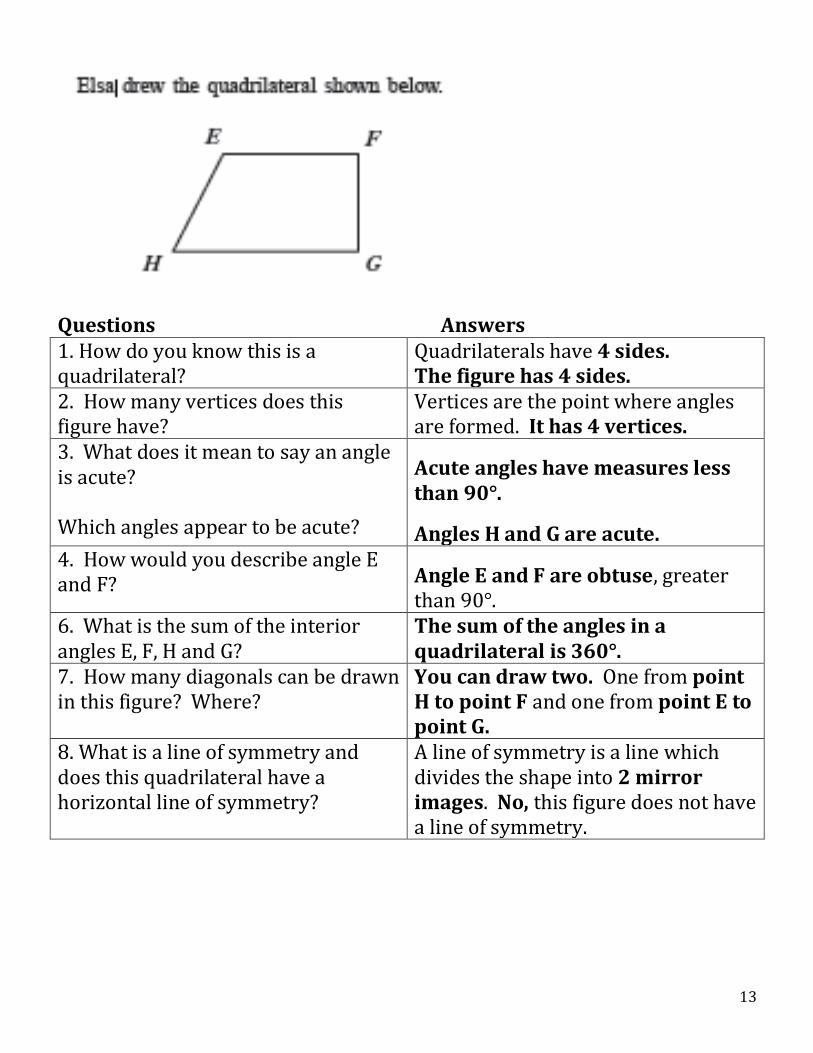
1. How do you know this is a quadrilateral?
Quadrilaterals have 4 sides. The figure has 4 sides.
2. How many vertices does this figure have?
Vertices are the point where angles are formed. It has 4 vertices.
3. What does it mean to say an angle is acute? Which angles appear to be acute?
Acute angles have measures less than 90°.
Angles H and G are acute. 4. How would you describe angle E and F? Angle E and F are obtuse, greater
than 90°. 6. What is the sum of the interior angles E, F, H and G?
The sum of the angles in a quadrilateral is 360°.
7. How many diagonals can be drawn in this figure? Where?
You can draw two. One from point H to point F and one from point E to point G.
8. What is a line of symmetry and does this quadrilateral have a horizontal line of symmetry?
A line of symmetry is a line which divides the shape into 2 mirror images. No, this figure does not have a line of symmetry.
14
Questions Answers
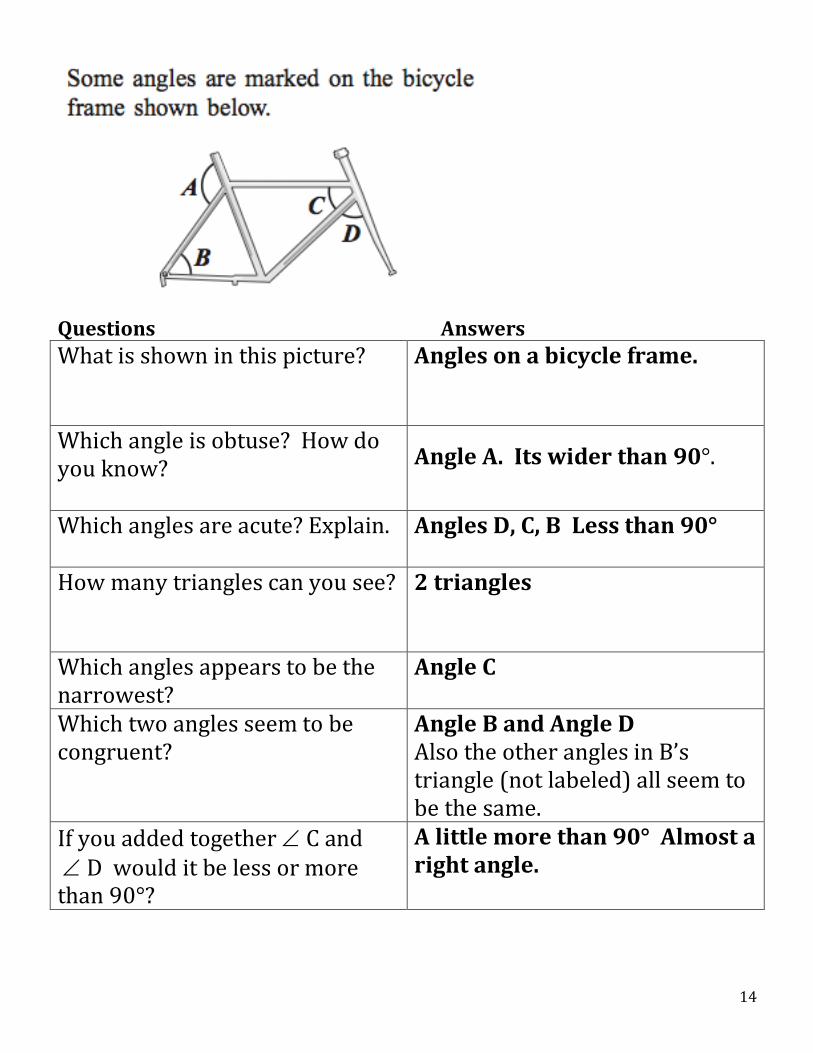
What is shown in this picture?
Angles on a bicycle frame.
Which angle is obtuse? How do you know?
Angle A. Its wider than 90°.
Which angles are acute? Explain.
Angles D, C, B Less than 90°
How many triangles can you see?
2 triangles
Which angles appears to be the narrowest?
Angle C
Which two angles seem to be congruent?
Angle B and Angle D Also the other angles in B’s triangle (not labeled) all seem to be the same.
If you added together C and D would it be less or more than 90°?
A little more than 90° Almost a right angle.
15
Questions Answers
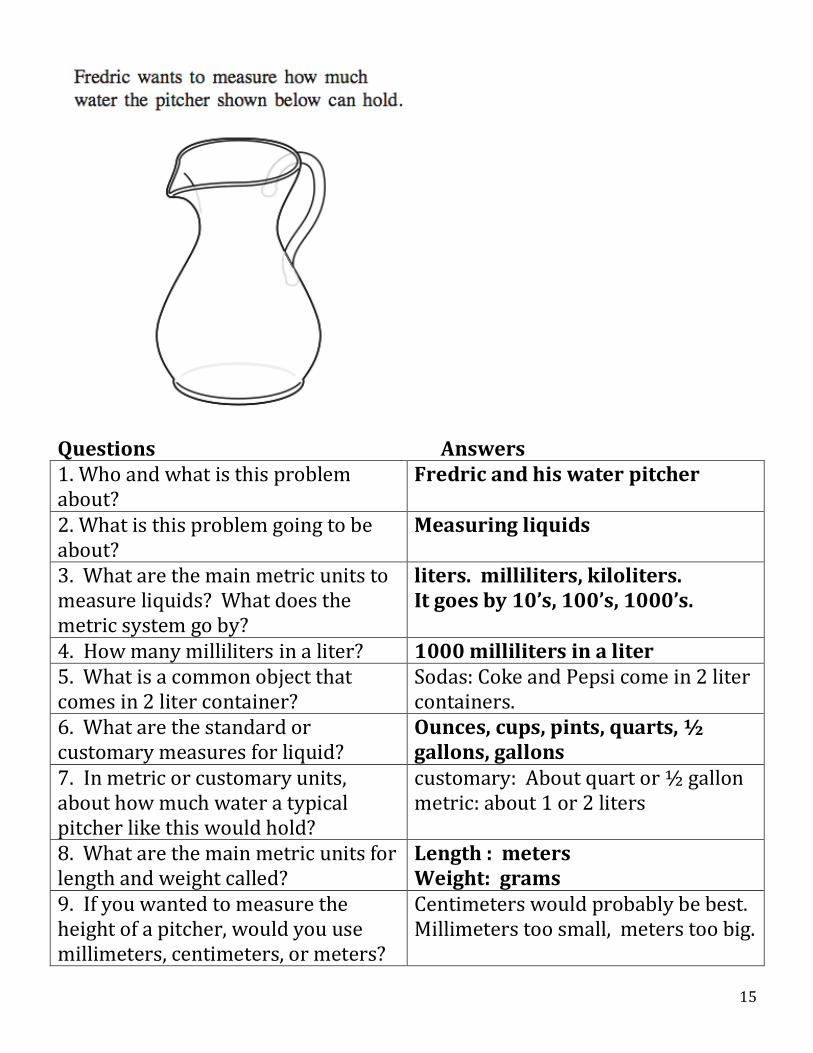
1. Who and what is this problem about?
Fredric and his water pitcher
2. What is this problem going to be about?
Measuring liquids
3. What are the main metric units to measure liquids? What does the metric system go by?
liters. milliliters, kiloliters. It goes by 10’s, 100’s, 1000’s.
4. How many milliliters in a liter? 1000 milliliters in a liter 5. What is a common object that comes in 2 liter container?
Sodas: Coke and Pepsi come in 2 liter containers.
6. What are the standard or customary measures for liquid?
Ounces, cups, pints, quarts, ½ gallons, gallons
7. In metric or customary units, about how much water a typical pitcher like this would hold?
customary: About quart or ½ gallon metric: about 1 or 2 liters
8. What are the main metric units for length and weight called?
Length : meters Weight: grams
9. If you wanted to measure the height of a pitcher, would you use millimeters, centimeters, or meters?
Centimeters would probably be best. Millimeters too small, meters too big.
16
Questions Answers
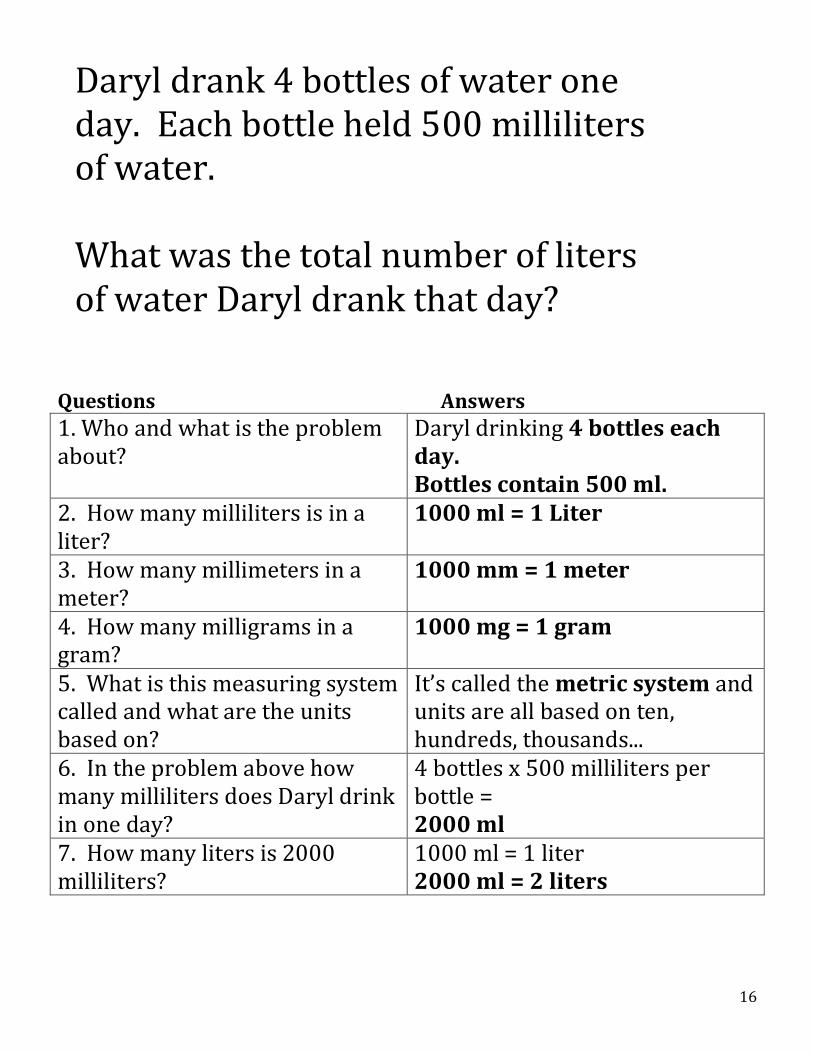
1. Who and what is the problem about?
Daryl drinking 4 bottles each day. Bottles contain 500 ml.
2. How many milliliters is in a liter?
1000 ml = 1 Liter
3. How many millimeters in a meter?
1000 mm = 1 meter
4. How many milligrams in a gram?
1000 mg = 1 gram
5. What is this measuring system called and what are the units based on?
It’s called the metric system and units are all based on ten, hundreds, thousands...
6. In the problem above how many milliliters does Daryl drink in one day?
4 bottles x 500 milliliters per bottle = 2000 ml
7. How many liters is 2000 milliliters?
1000 ml = 1 liter 2000 ml = 2 liters
Daryl drank 4 bottles of water one day. Each bottle held 500 milliliters of water. What was the total number of liters of water Daryl drank that day?
17
Questions Answers
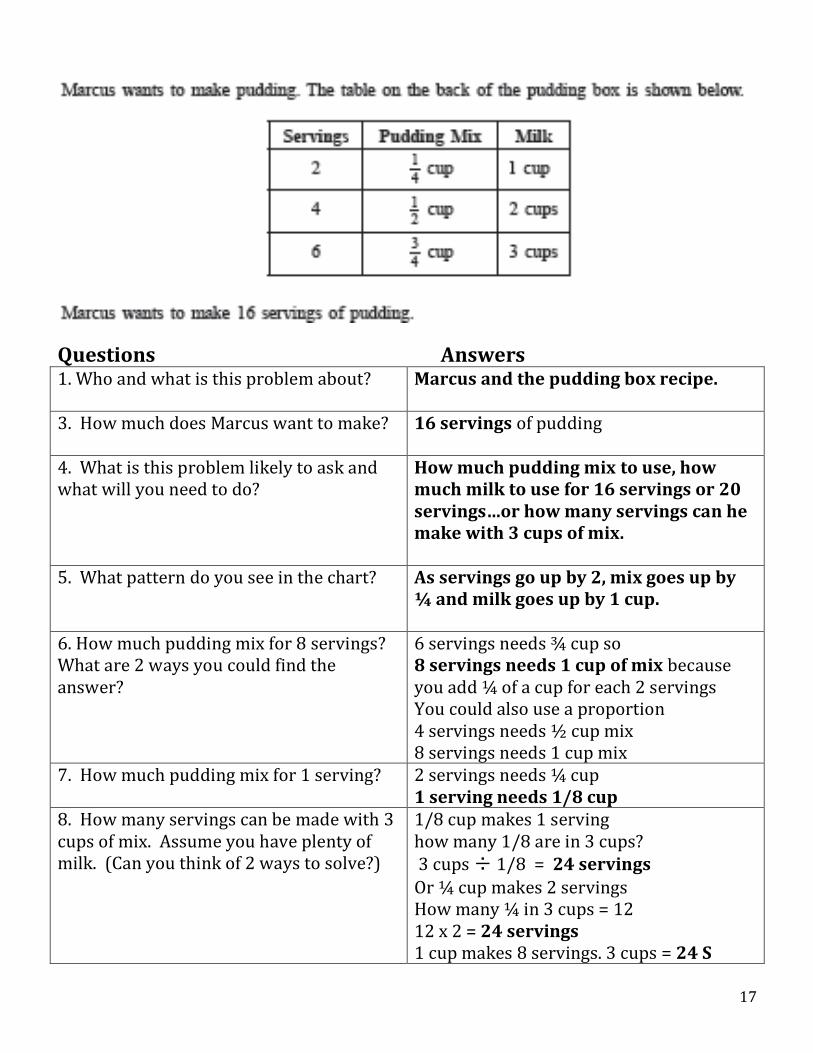
1. Who and what is this problem about? Marcus and the pudding box recipe.
3. How much does Marcus want to make? 16 servings of pudding
4. What is this problem likely to ask and what will you need to do?
How much pudding mix to use, how much milk to use for 16 servings or 20 servings…or how many servings can he make with 3 cups of mix.
5. What pattern do you see in the chart? As servings go up by 2, mix goes up by ¼ and milk goes up by 1 cup.
6. How much pudding mix for 8 servings? What are 2 ways you could find the answer?
6 servings needs ¾ cup so 8 servings needs 1 cup of mix because you add ¼ of a cup for each 2 servings You could also use a proportion 4 servings needs ½ cup mix 8 servings needs 1 cup mix
7. How much pudding mix for 1 serving? 2 servings needs ¼ cup 1 serving needs 1/8 cup
8. How many servings can be made with 3 cups of mix. Assume you have plenty of milk. (Can you think of 2 ways to solve?)
1/8 cup makes 1 serving how many 1/8 are in 3 cups? 3 cups ÷ 1/8 = 24 servings
Or ¼ cup makes 2 servings How many ¼ in 3 cups = 12 12 x 2 = 24 servings 1 cup makes 8 servings. 3 cups = 24 S
18
Questions Answers
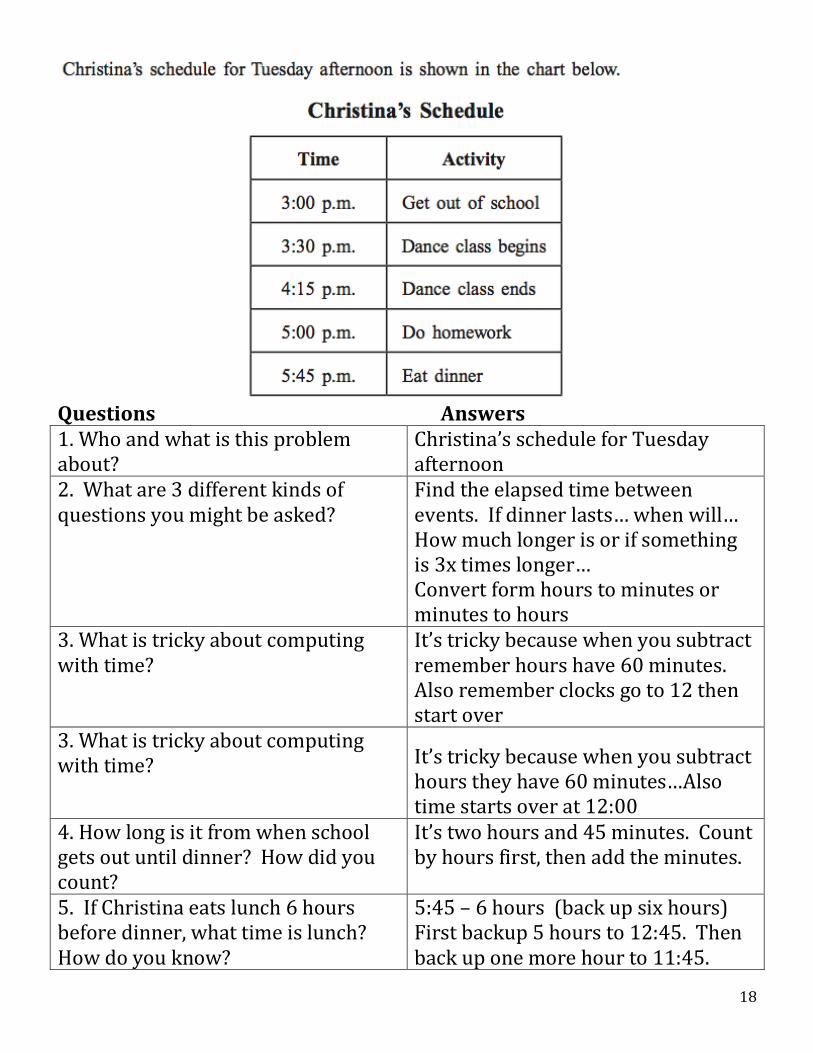
1. Who and what is this problem about?
Christina’s schedule for Tuesday afternoon
2. What are 3 different kinds of questions you might be asked?
Find the elapsed time between events. If dinner lasts… when will… How much longer is or if something is 3x times longer… Convert form hours to minutes or minutes to hours
3. What is tricky about computing with time?
It’s tricky because when you subtract remember hours have 60 minutes. Also remember clocks go to 12 then start over
3. What is tricky about computing with time? It’s tricky because when you subtract
hours they have 60 minutes…Also time starts over at 12:00
4. How long is it from when school gets out until dinner? How did you count?
It’s two hours and 45 minutes. Count by hours first, then add the minutes.
5. If Christina eats lunch 6 hours before dinner, what time is lunch? How do you know?
5:45 – 6 hours (back up six hours) First backup 5 hours to 12:45. Then back up one more hour to 11:45.
19
Questions Answers
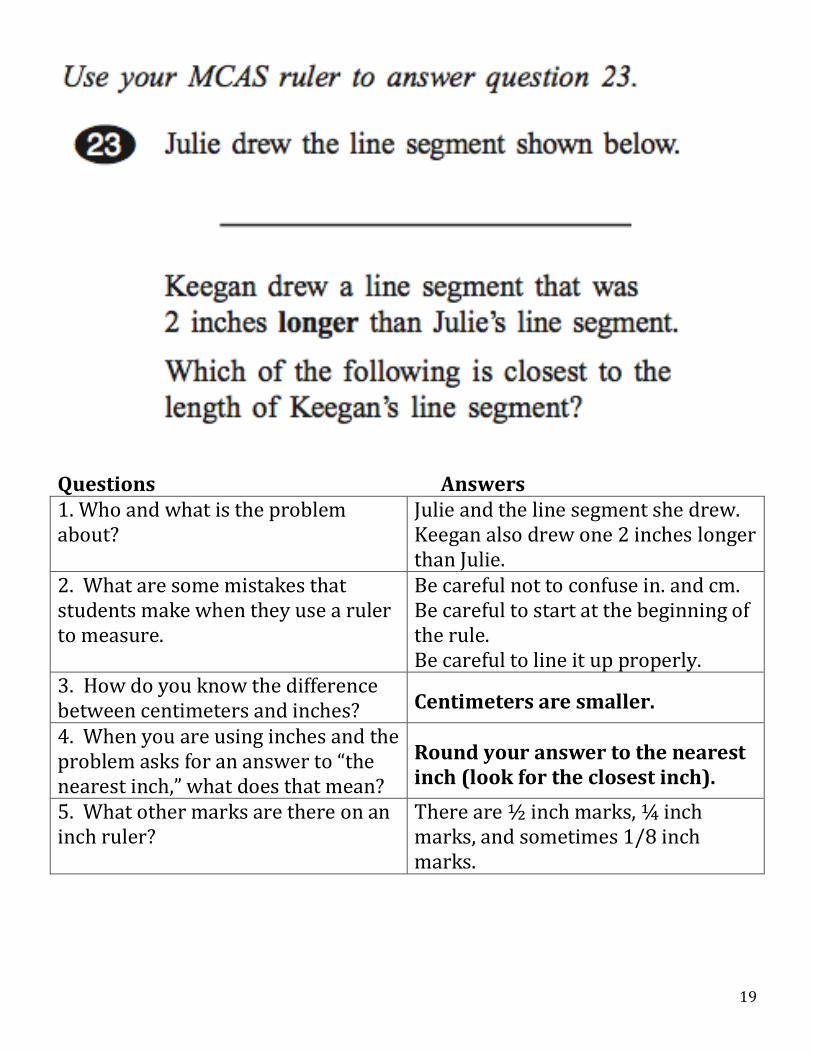
1. Who and what is the problem about?
Julie and the line segment she drew. Keegan also drew one 2 inches longer than Julie.
2. What are some mistakes that students make when they use a ruler to measure.
Be careful not to confuse in. and cm. Be careful to start at the beginning of the rule. Be careful to line it up properly.
3. How do you know the difference between centimeters and inches? Centimeters are smaller.
4. When you are using inches and the problem asks for an answer to “the nearest inch,” what does that mean?
Round your answer to the nearest inch (look for the closest inch).
5. What other marks are there on an inch ruler?
There are ½ inch marks, ¼ inch marks, and sometimes 1/8 inch marks.
20
Questions Answers
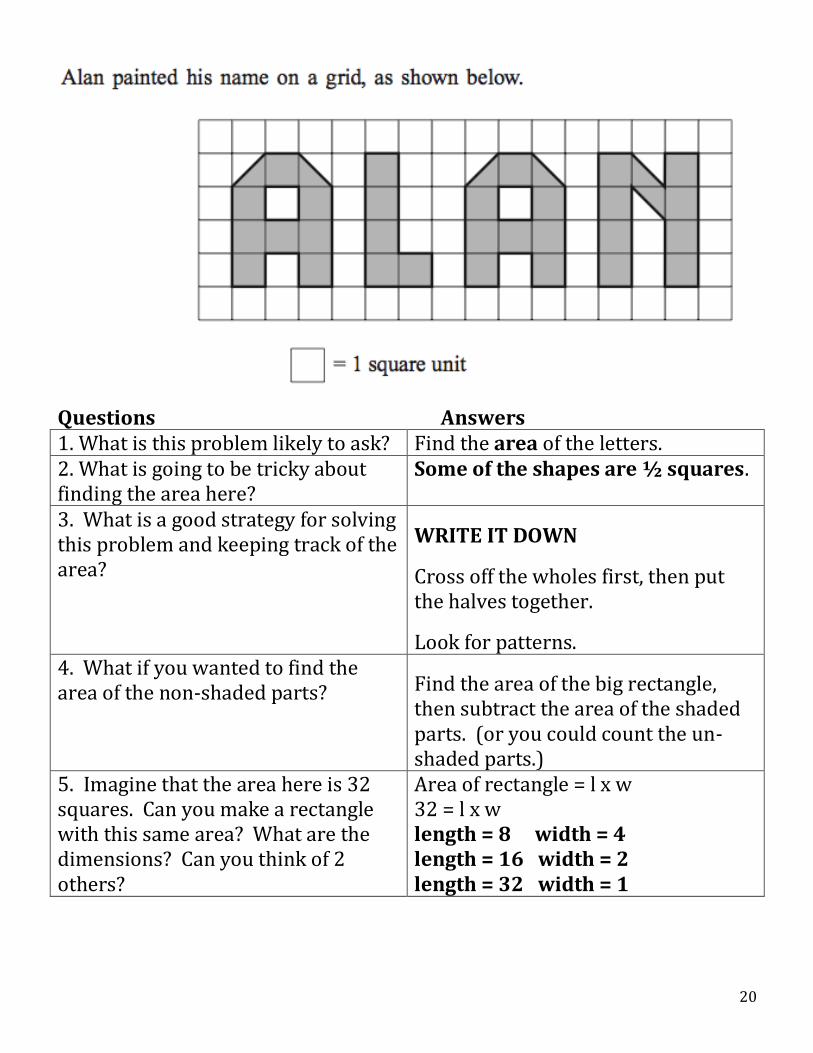
1. What is this problem likely to ask? Find the area of the letters. 2. What is going to be tricky about finding the area here?
Some of the shapes are ½ squares.
3. What is a good strategy for solving this problem and keeping track of the area?
WRITE IT DOWN
Cross off the wholes first, then put the halves together.
Look for patterns. 4. What if you wanted to find the area of the non-shaded parts? Find the area of the big rectangle,
then subtract the area of the shaded parts. (or you could count the un-shaded parts.)
5. Imagine that the area here is 32 squares. Can you make a rectangle with this same area? What are the dimensions? Can you think of 2 others?
Area of rectangle = l x w 32 = l x w length = 8 width = 4 length = 16 width = 2 length = 32 width = 1
21
Questions Answers
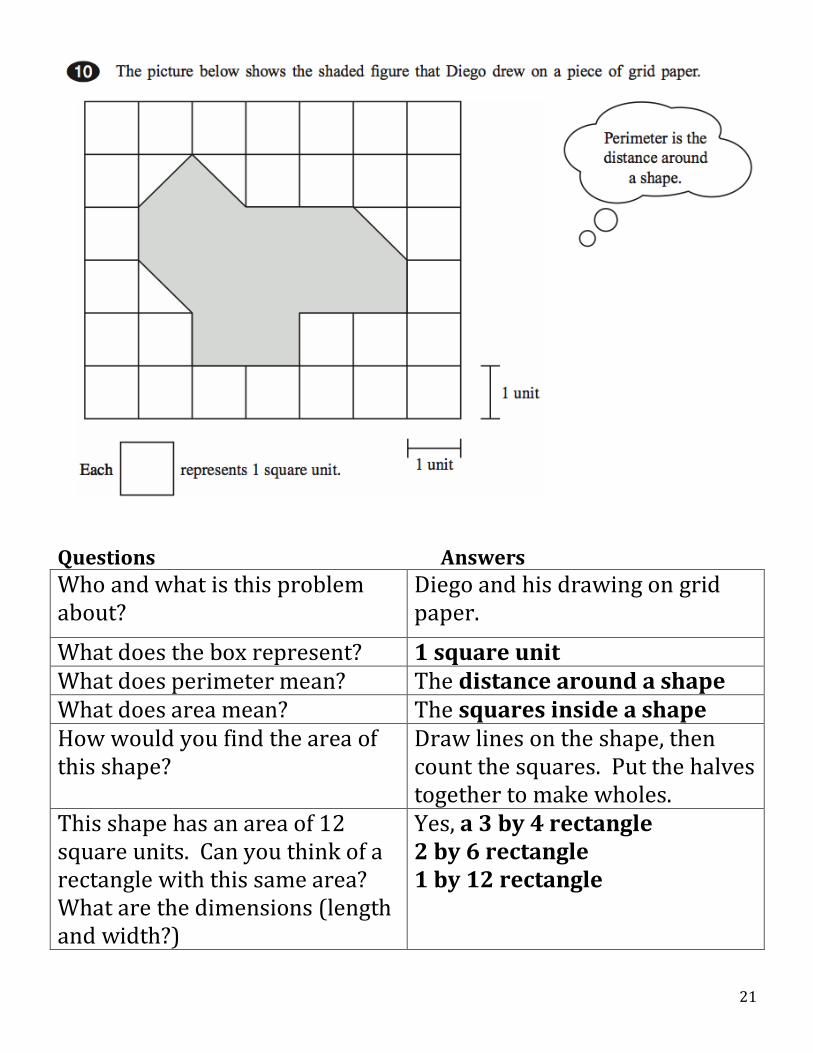
Who and what is this problem about?
Diego and his drawing on grid paper.
What does the box represent? 1 square unit What does perimeter mean? The distance around a shape What does area mean? The squares inside a shape How would you find the area of this shape?
Draw lines on the shape, then count the squares. Put the halves together to make wholes.
This shape has an area of 12 square units. Can you think of a rectangle with this same area? What are the dimensions (length and width?)
Yes, a 3 by 4 rectangle 2 by 6 rectangle 1 by 12 rectangle
22
Questions Answers
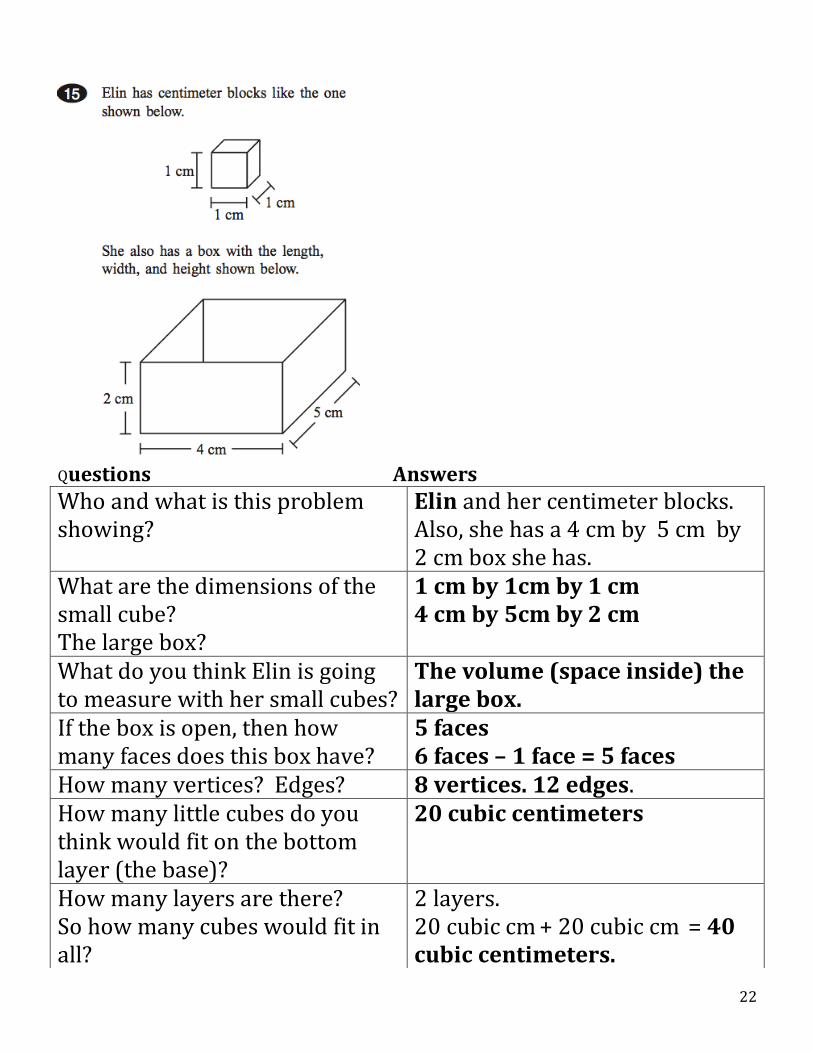
Who and what is this problem showing?
Elin and her centimeter blocks. Also, she has a 4 cm by 5 cm by 2 cm box she has.
What are the dimensions of the small cube? The large box?
1 cm by 1cm by 1 cm 4 cm by 5cm by 2 cm
What do you think Elin is going to measure with her small cubes?
The volume (space inside) the large box.
If the box is open, then how many faces does this box have?
5 faces 6 faces – 1 face = 5 faces
How many vertices? Edges? 8 vertices. 12 edges. How many little cubes do you think would fit on the bottom layer (the base)?
20 cubic centimeters
How many layers are there? So how many cubes would fit in all?
2 layers. 20 cubic cm + 20 cubic cm = 40 cubic centimeters.
23
Questions Answers
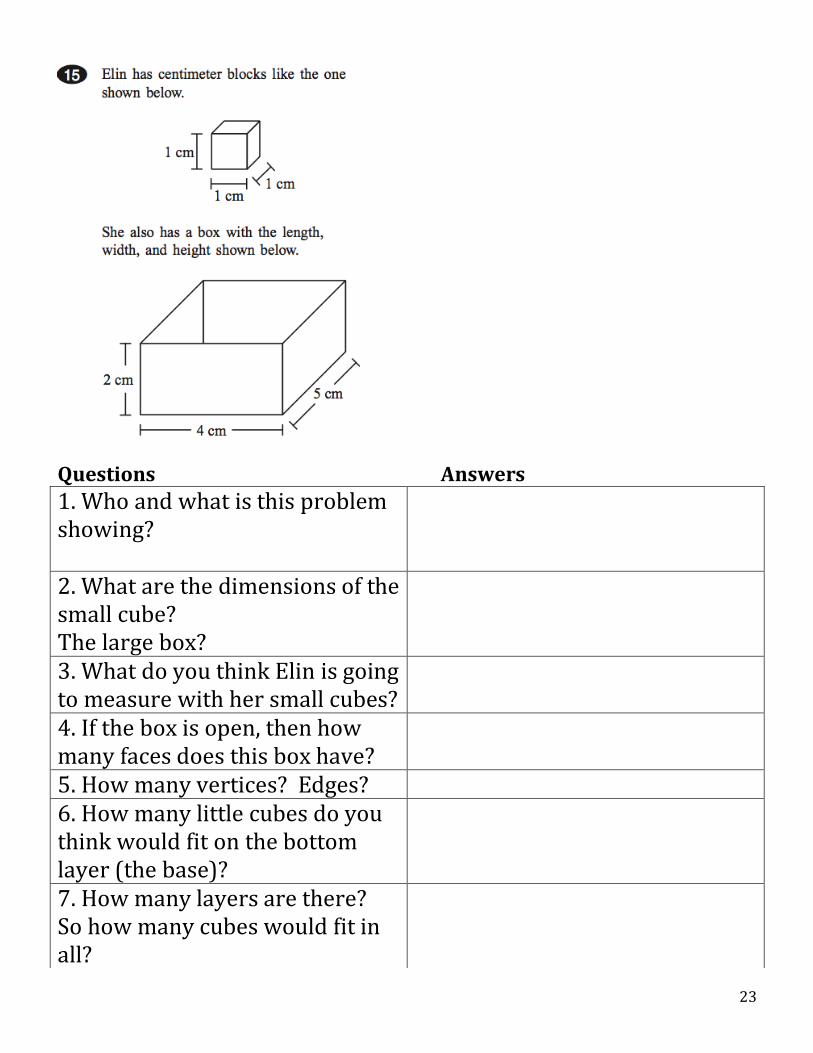
1. Who and what is this problem showing?
2. What are the dimensions of the small cube? The large box?
3. What do you think Elin is going to measure with her small cubes?
4. If the box is open, then how many faces does this box have?
5. How many vertices? Edges? 6. How many little cubes do you think would fit on the bottom layer (the base)?
7. How many layers are there? So how many cubes would fit in all?
24
Questions Answers
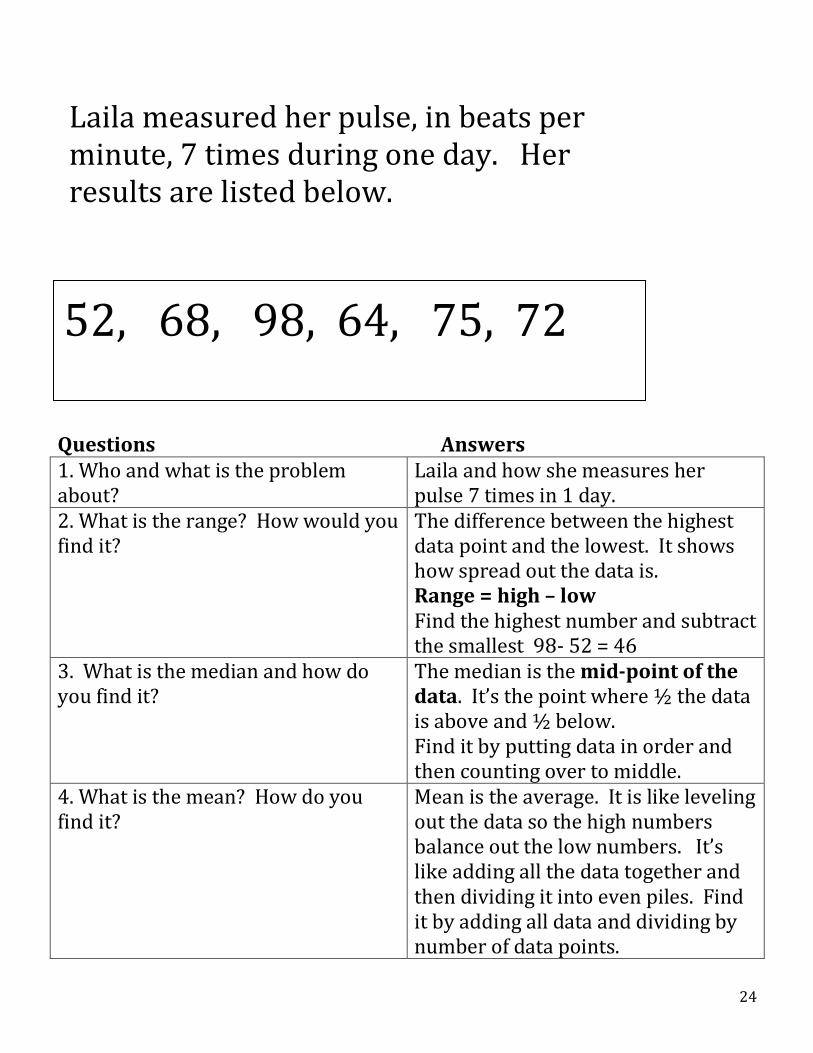
1. Who and what is the problem about?
Laila and how she measures her pulse 7 times in 1 day.
2. What is the range? How would you find it?
The difference between the highest data point and the lowest. It shows how spread out the data is. Range = high – low Find the highest number and subtract the smallest 98- 52 = 46
3. What is the median and how do you find it?
The median is the mid-point of the data. It’s the point where ½ the data is above and ½ below. Find it by putting data in order and then counting over to middle.
4. What is the mean? How do you find it?
Mean is the average. It is like leveling out the data so the high numbers balance out the low numbers. It’s like adding all the data together and then dividing it into even piles. Find it by adding all data and dividing by number of data points.
Laila measured her pulse, in beats per minute, 7 times during one day. Her results are listed below. 52, 68, 98, 64, 75, 72
25
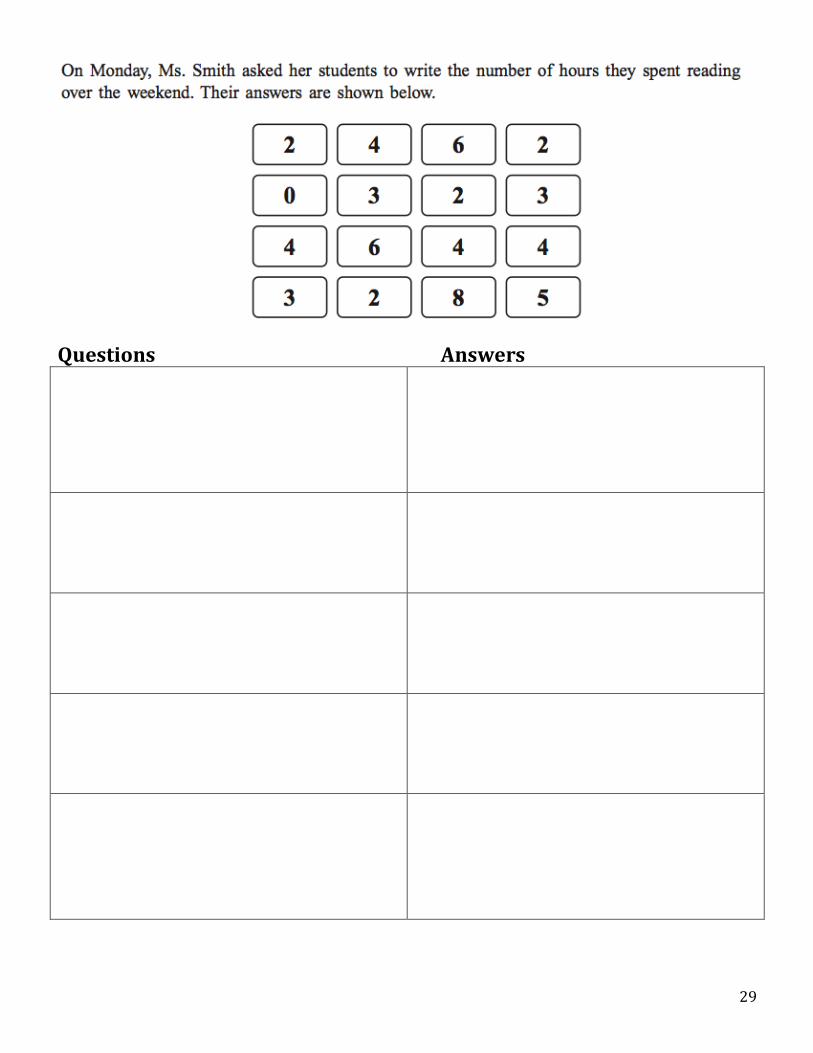
Questions Answers
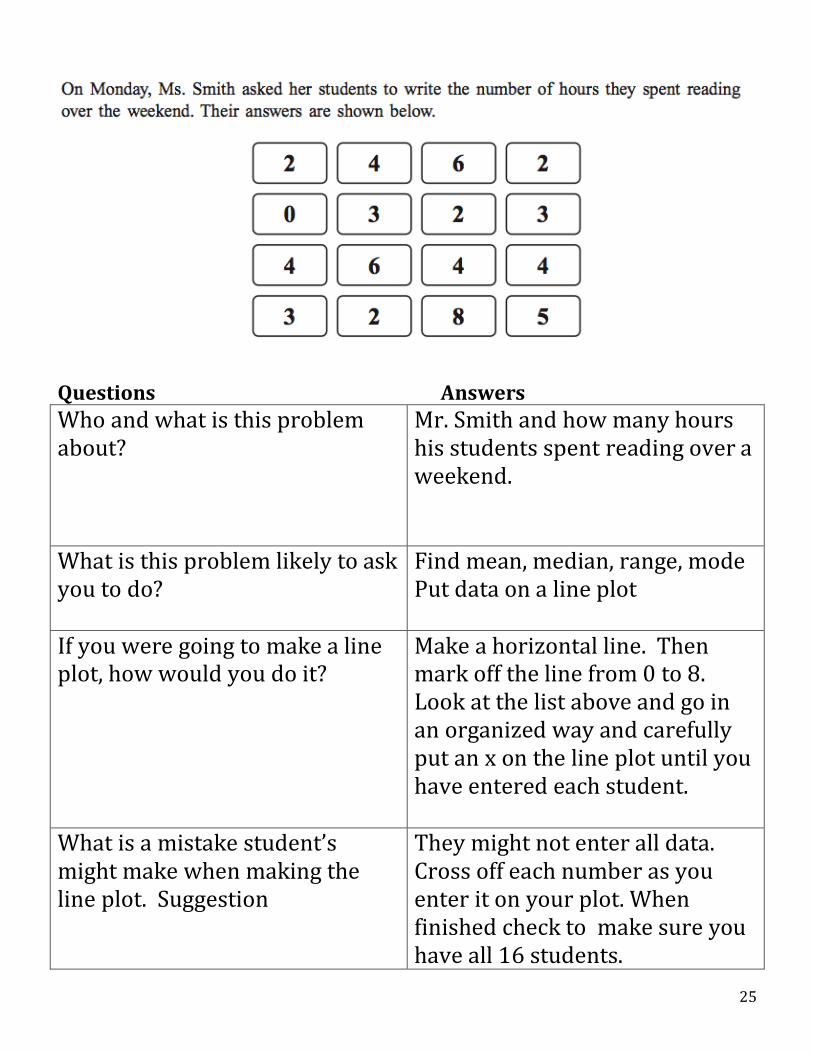
Who and what is this problem about?
Mr. Smith and how many hours his students spent reading over a weekend.
What is this problem likely to ask you to do?
Find mean, median, range, mode Put data on a line plot
If you were going to make a line plot, how would you do it?
Make a horizontal line. Then mark off the line from 0 to 8. Look at the list above and go in an organized way and carefully put an x on the line plot until you have entered each student.
What is a mistake student’s might make when making the line plot. Suggestion
They might not enter all data. Cross off each number as you enter it on your plot. When finished check to make sure you have all 16 students.
26
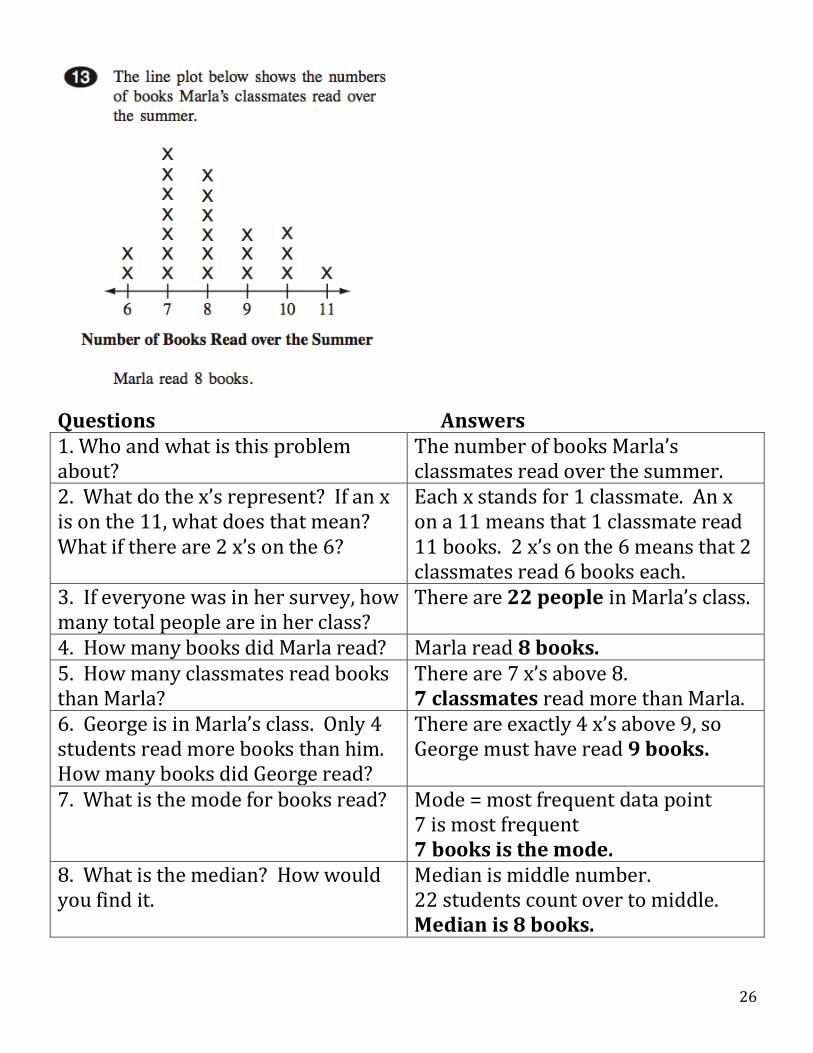
Questions Answers
1. Who and what is this problem about?
The number of books Marla’s classmates read over the summer.
2. What do the x’s represent? If an x is on the 11, what does that mean? What if there are 2 x’s on the 6?
Each x stands for 1 classmate. An x on a 11 means that 1 classmate read 11 books. 2 x’s on the 6 means that 2 classmates read 6 books each.
3. If everyone was in her survey, how many total people are in her class?
There are 22 people in Marla’s class.
4. How many books did Marla read? Marla read 8 books. 5. How many classmates read books than Marla?
There are 7 x’s above 8. 7 classmates read more than Marla.
6. George is in Marla’s class. Only 4 students read more books than him. How many books did George read?
There are exactly 4 x’s above 9, so George must have read 9 books.
7. What is the mode for books read? Mode = most frequent data point 7 is most frequent 7 books is the mode.
8. What is the median? How would you find it.
Median is middle number. 22 students count over to middle. Median is 8 books.
27
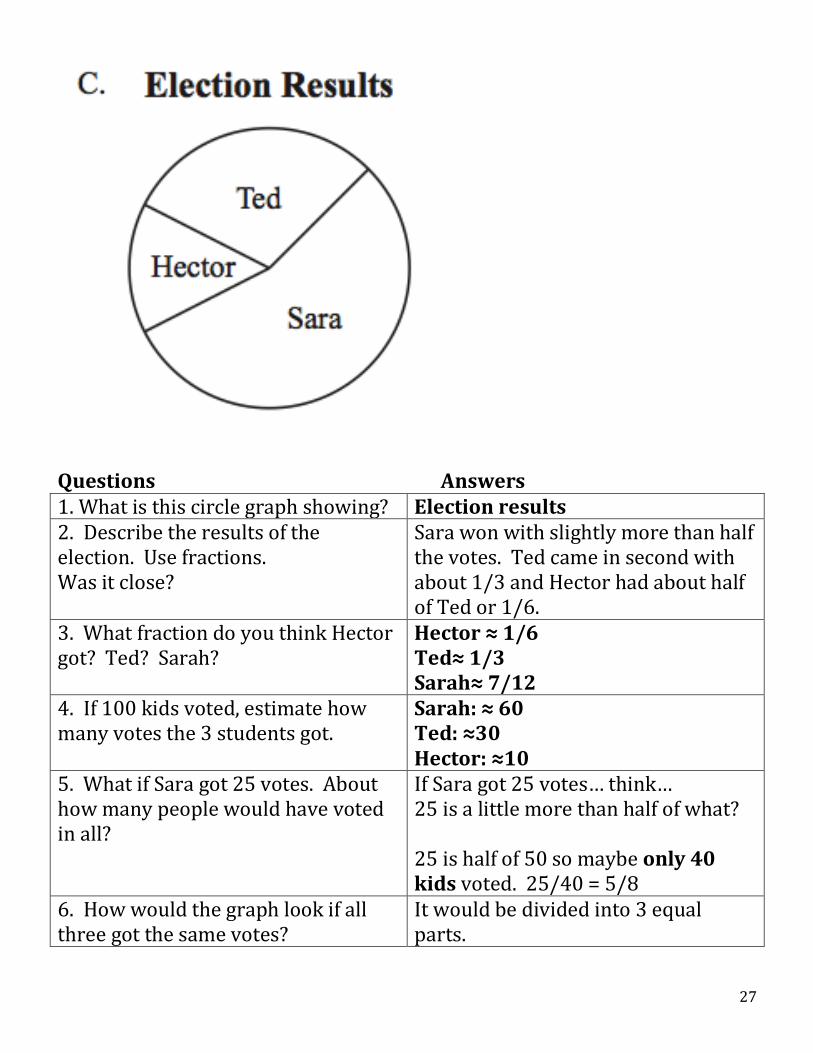
Questions Answers
1. What is this circle graph showing? Election results 2. Describe the results of the election. Use fractions. Was it close?
Sara won with slightly more than half the votes. Ted came in second with about 1/3 and Hector had about half of Ted or 1/6.
3. What fraction do you think Hector got? Ted? Sarah?
Hector ≈ 1/6 Ted≈ 1/3 Sarah≈ 7/12
4. If 100 kids voted, estimate how many votes the 3 students got.
Sarah: ≈ 60 Ted: ≈30 Hector: ≈10
5. What if Sara got 25 votes. About how many people would have voted in all?
If Sara got 25 votes… think… 25 is a little more than half of what? 25 is half of 50 so maybe only 40 kids voted. 25/40 = 5/8
6. How would the graph look if all three got the same votes?
It would be divided into 3 equal parts.
28
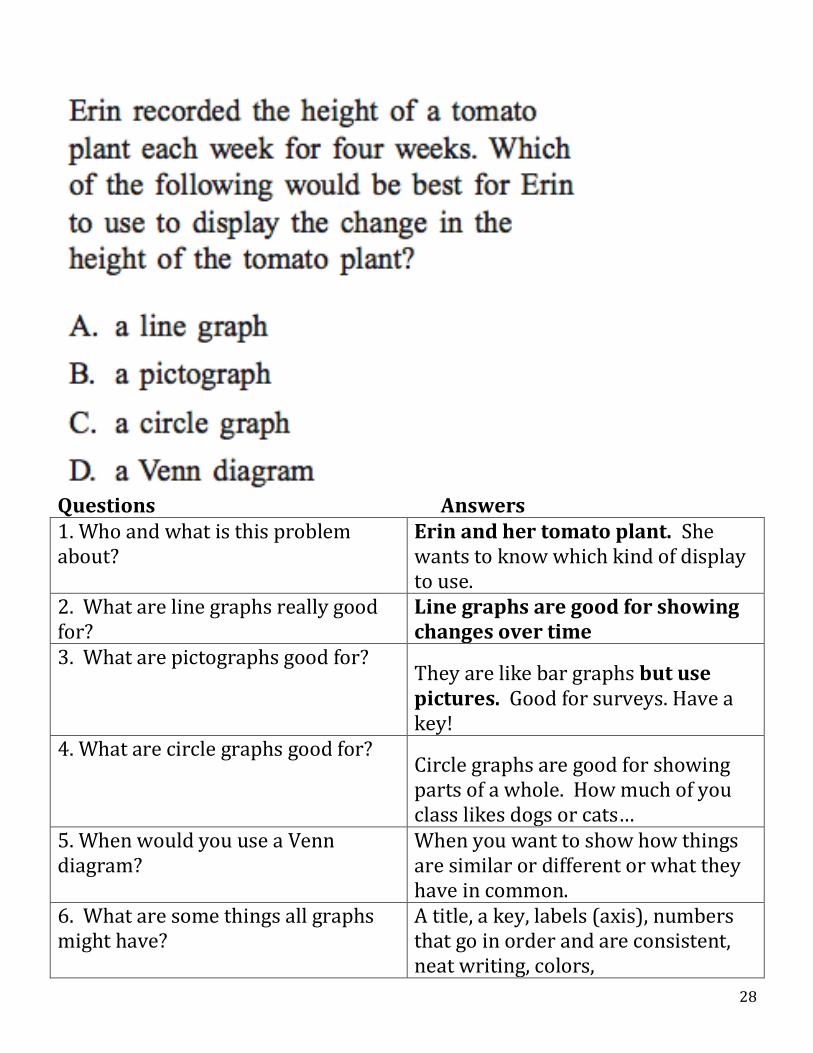
Questions Answers
1. Who and what is this problem about?
Erin and her tomato plant. She wants to know which kind of display to use.
2. What are line graphs really good for?
Line graphs are good for showing changes over time
3. What are pictographs good for? They are like bar graphs but use pictures. Good for surveys. Have a key!
4. What are circle graphs good for? Circle graphs are good for showing parts of a whole. How much of you class likes dogs or cats…
5. When would you use a Venn diagram?
When you want to show how things are similar or different or what they have in common.
6. What are some things all graphs might have?
A title, a key, labels (axis), numbers that go in order and are consistent, neat writing, colors,
29
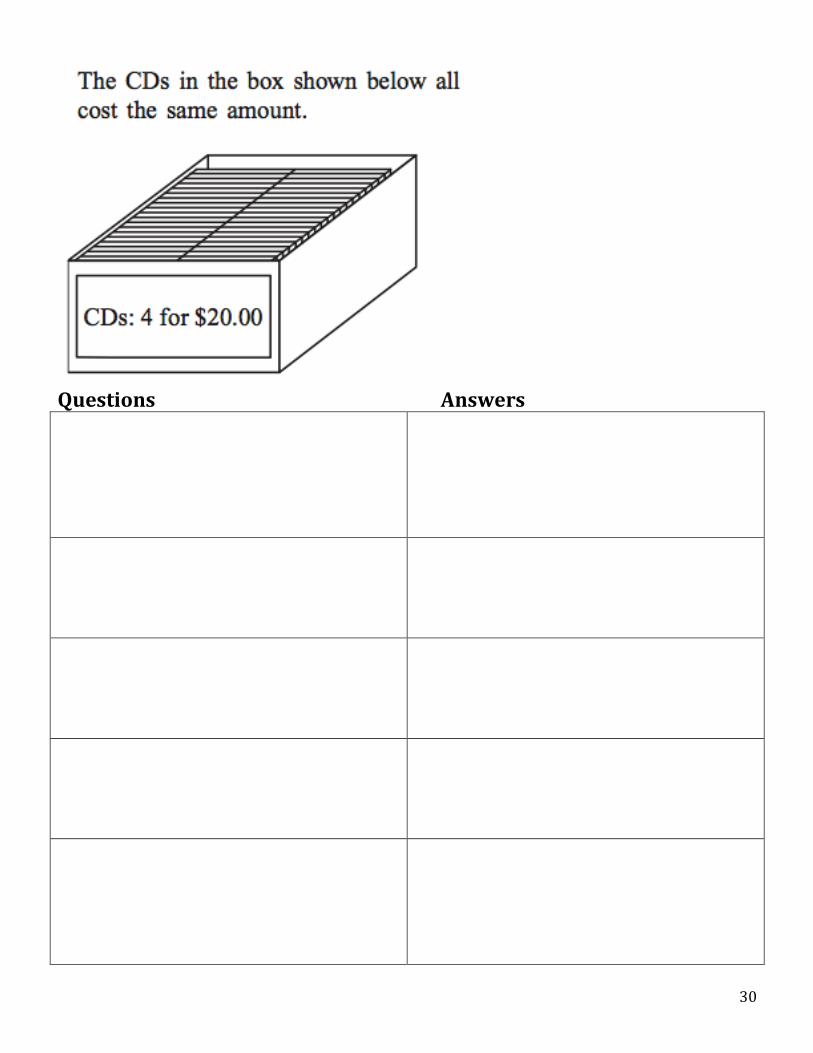
Questions Answers
30
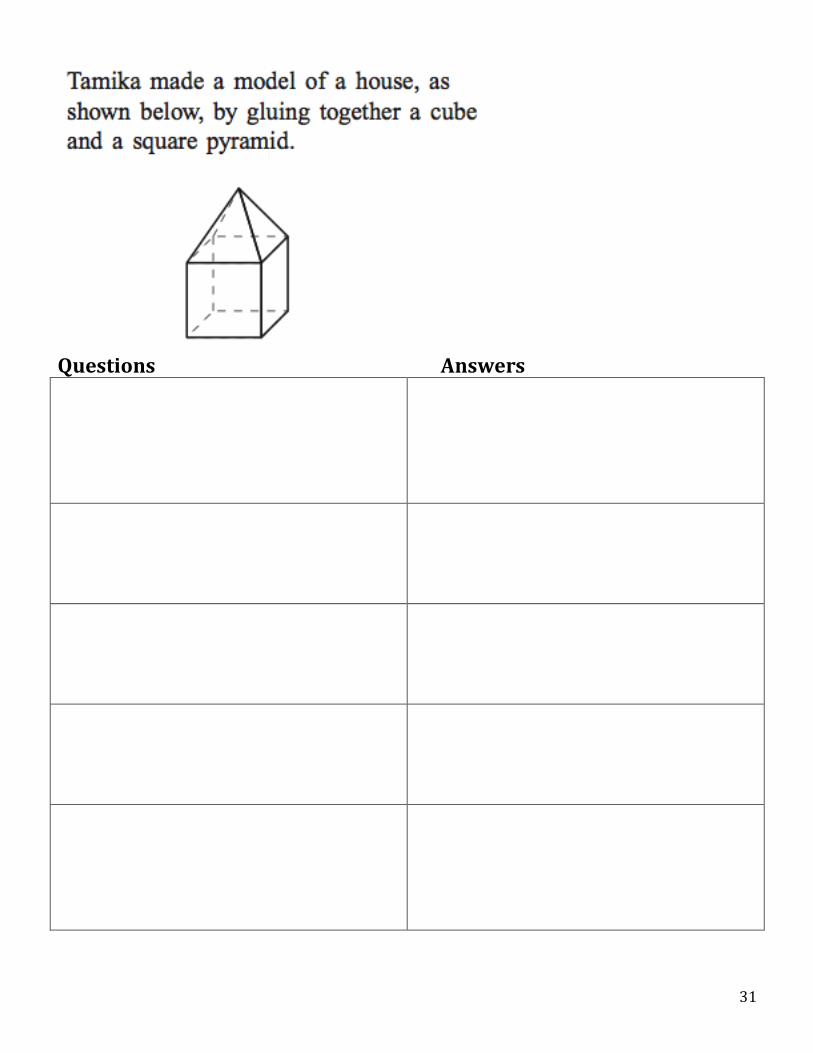
Questions Answers
31
Questions Answers