Embed Size (px)
Citation preview
S T E M
Math Infusion into Science Project
James Lauckhardt, Ph.D.Center for Advanced Study in Education
CUNY Graduate Center
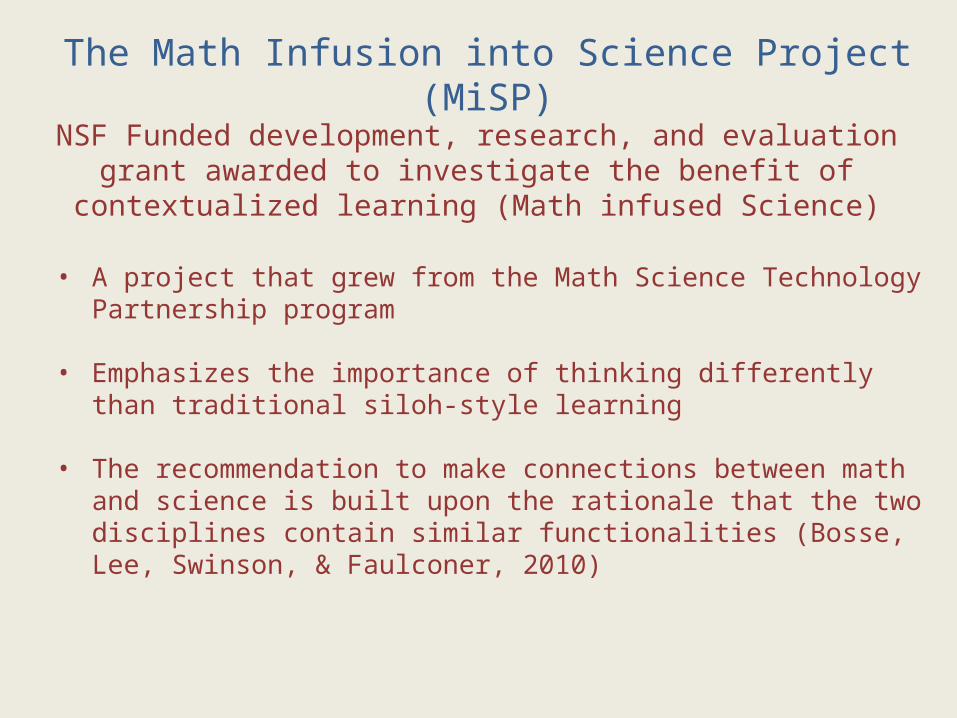
The Math Infusion into Science Project (MiSP)
NSF Funded development, research, and evaluation grant awarded to investigate the benefit of contextualized learning (Math infused Science)
• A project that grew from the Math Science Technology Partnership program
• Emphasizes the importance of thinking differently than traditional siloh-style learning
• The recommendation to make connections between math and science is built upon the rationale that the two disciplines contain similar functionalities (Bosse, Lee, Swinson, & Faulconer, 2010)
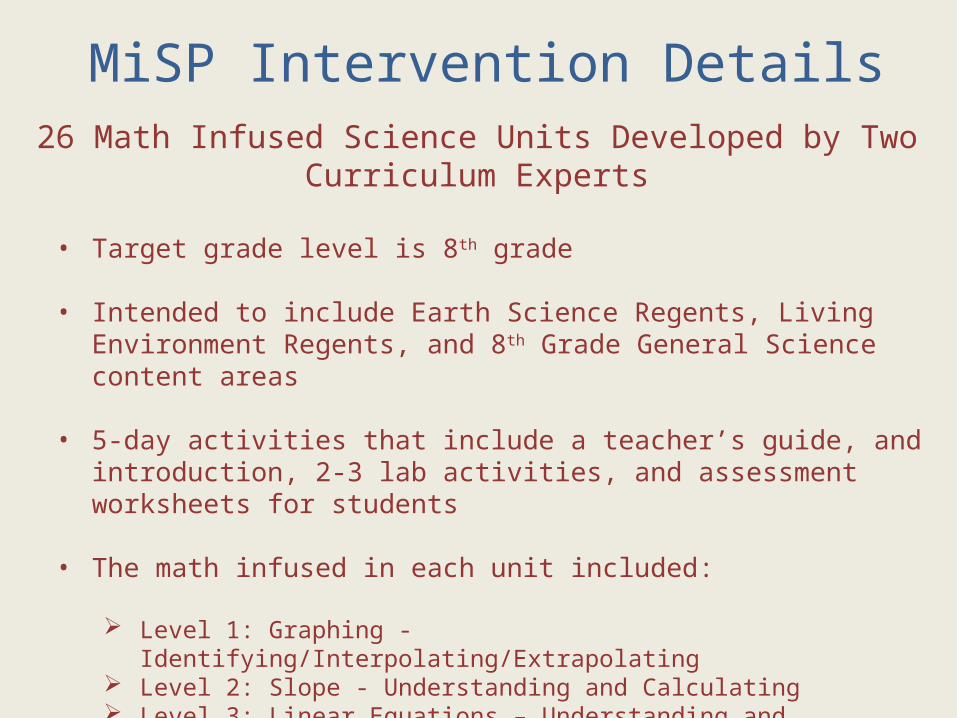
MiSP Intervention Details26 Math Infused Science Units Developed by Two Curriculum Experts
• Target grade level is 8th grade
• Intended to include Earth Science Regents, Living Environment Regents, and 8th Grade General Science content areas
• 5-day activities that include a teacher’s guide, and introduction, 2-3 lab activities, and assessment worksheets for students
• The math infused in each unit included:
Level 1: Graphing - Identifying/Interpolating/Extrapolating Level 2: Slope - Understanding and Calculating Level 3: Linear Equations – Understanding and Calculating
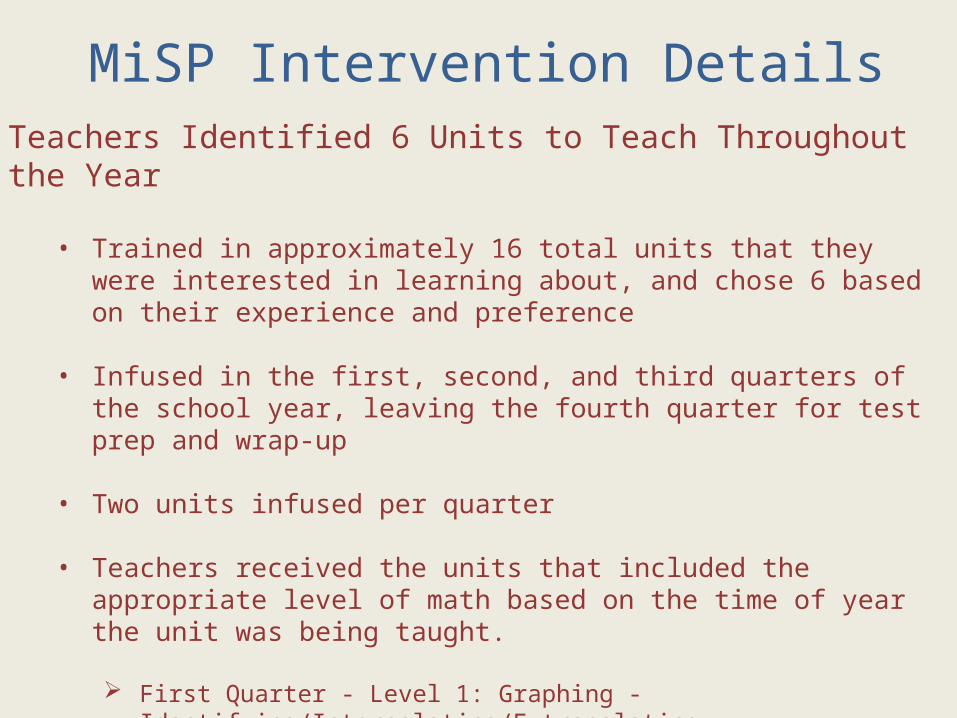
MiSP Intervention DetailsTeachers Identified 6 Units to Teach Throughout the Year
• Trained in approximately 16 total units that they were interested in learning about, and chose 6 based on their experience and preference
• Infused in the first, second, and third quarters of the school year, leaving the fourth quarter for test prep and wrap-up
• Two units infused per quarter
• Teachers received the units that included the appropriate level of math based on the time of year the unit was being taught.
First Quarter - Level 1: Graphing - Identifying/Interpolating/Extrapolating Second Quarter - Level 2: Slope - Understanding and Calculating Third Quarter - Level 3: Linear Equations – Understanding and Calculating
2010 - 2011
Academic
Attitude
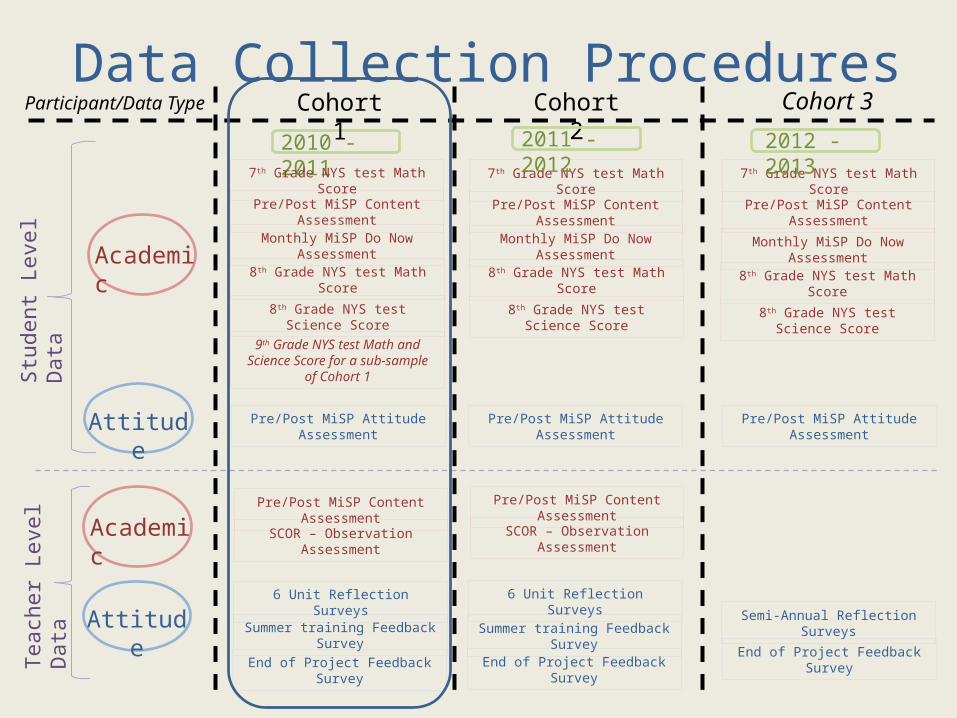
Participant/Data Type Cohort 2 Cohort 3Cohort 1
7th Grade NYS test Math Score
Pre/Post MiSP Content Assessment
Monthly MiSP Do Now Assessment
8th Grade NYS test Math Score
8th Grade NYS test Science Score
Pre/Post MiSP Attitude Assessment
7th Grade NYS test Math Score
Pre/Post MiSP Content Assessment
Monthly MiSP Do Now Assessment
8th Grade NYS test Math Score
8th Grade NYS test Science Score
9th Grade NYS test Math and Science Score for a sub-sample of
Cohort 1
7th Grade NYS test Math Score
Pre/Post MiSP Content Assessment
Monthly MiSP Do Now Assessment
8th Grade NYS test Math Score
8th Grade NYS test Science Score
Pre/Post MiSP Attitude Assessment Pre/Post MiSP Attitude Assessment
Stud
ent L
evel
Dat
aTe
ache
r Lev
el D
ata
Academic
Attitude
Pre/Post MiSP Content Assessment
SCOR – Observation Assessment
Pre/Post MiSP Content Assessment
SCOR – Observation Assessment
6 Unit Reflection Surveys
Summer training Feedback Survey
End of Project Feedback Survey
6 Unit Reflection Surveys
Summer training Feedback Survey
End of Project Feedback SurveyEnd of Project Feedback Survey
Semi-Annual Reflection Surveys
2011 - 2012 2012 - 2013
Data Collection Procedures
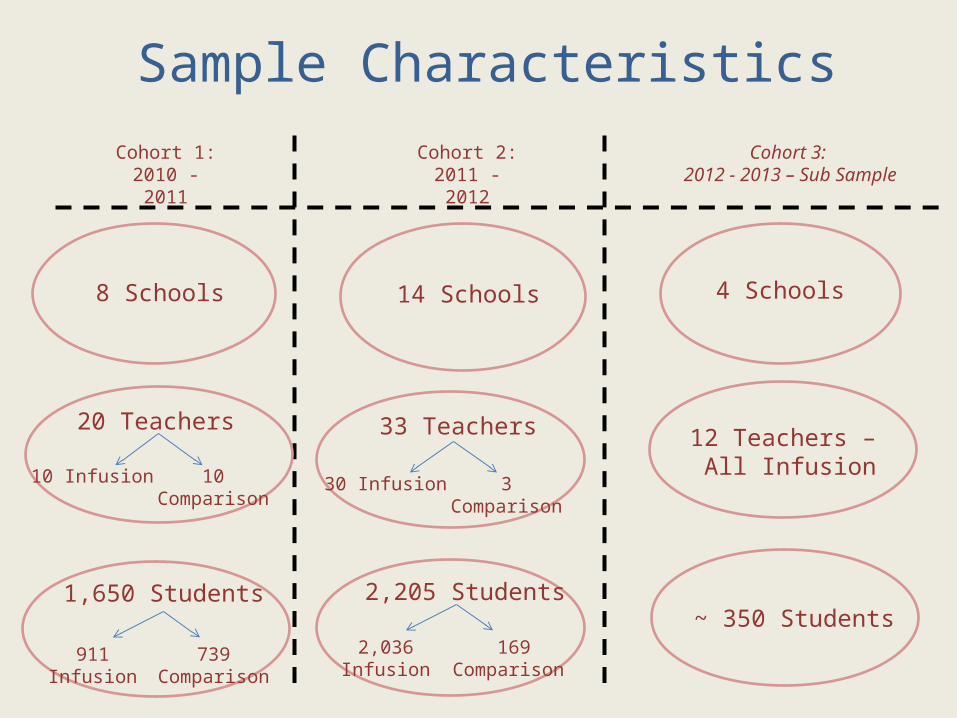
Cohort 2: 2011 - 2012
Cohort 3: 2012 - 2013 – Sub Sample
Cohort 1: 2010 - 2011
8 Schools
20 Teachers
10 Infusion 10 Comparison
1,650 Students
911 Infusion 739 Comparison
14 Schools
33 Teachers
30 Infusion 3 Comparison
2,205 Students
2,036 Infusion 169 Comparison
4 Schools
12 Teachers – All Infusion
~ 350 Students
Sample Characteristics
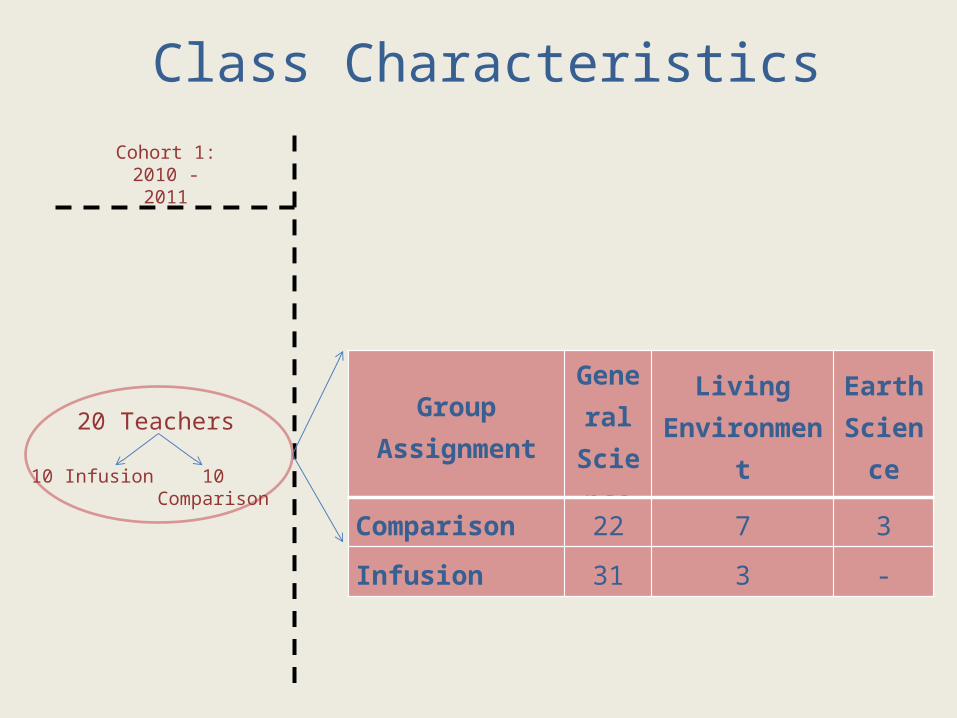
Cohort 1: 2010 - 2011
20 Teachers
10 Infusion 10 Comparison
Class Characteristics
GroupAssignment
General Science
Living Environme
nt
Earth Scien
ce
Comparison 22 7 3
Infusion 31 3 -
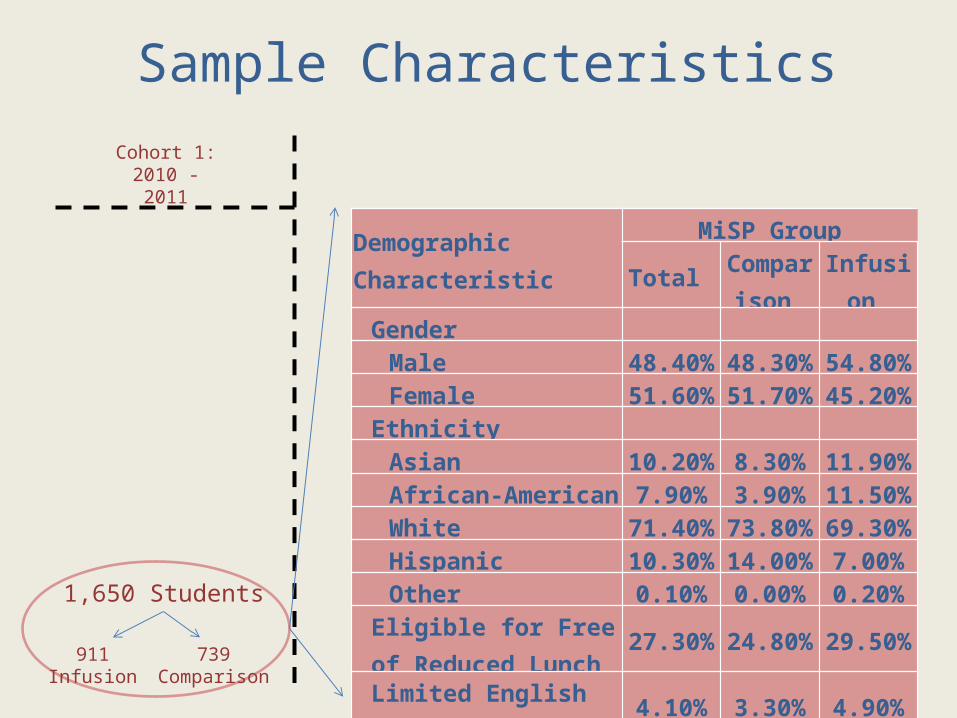
Cohort 1: 2010 - 2011
1,650 Students
911 Infusion 739 Comparison
Sample Characteristics
Demographic Characteristic
MiSP Group
Total Comparison
Infusion
Gender Male 48.40
%48.30
%54.80
%Female 51.60
%51.70
%45.20
%Ethnicity
Asian 10.20%
8.30%11.90
%African-American
7.90% 3.90%11.50
%White 71.40
%73.80
%69.30
%Hispanic 10.30
%14.00
%7.00%
Other 0.10% 0.00% 0.20%Eligible for Free of Reduced Lunch
27.30%
24.80%
29.50%
Limited English Proficiency
4.10% 3.30% 4.90%
Special Ed or IEP 6.90% 8.30% 8.80%
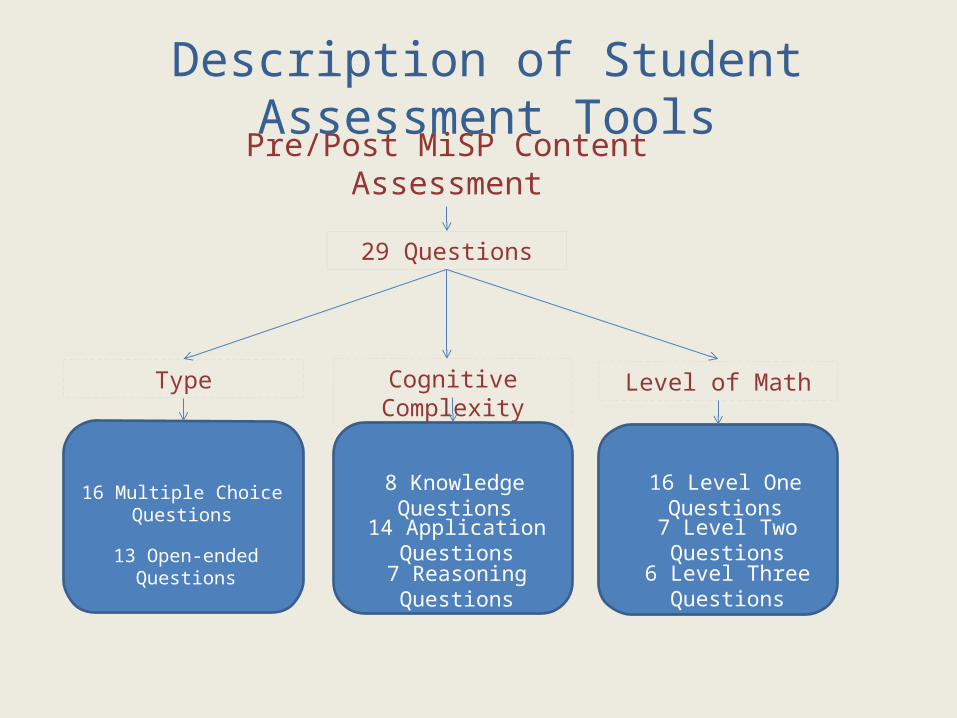
Pre/Post MiSP Content Assessment
Description of Student Assessment Tools
29 Questions
Type Cognitive Complexity Level of Math
16 Multiple Choice Questions
13 Open-ended Questions
8 Knowledge Questions
14 Application Questions
7 Reasoning Questions
16 Level One Questions
7 Level Two Questions
6 Level Three Questions
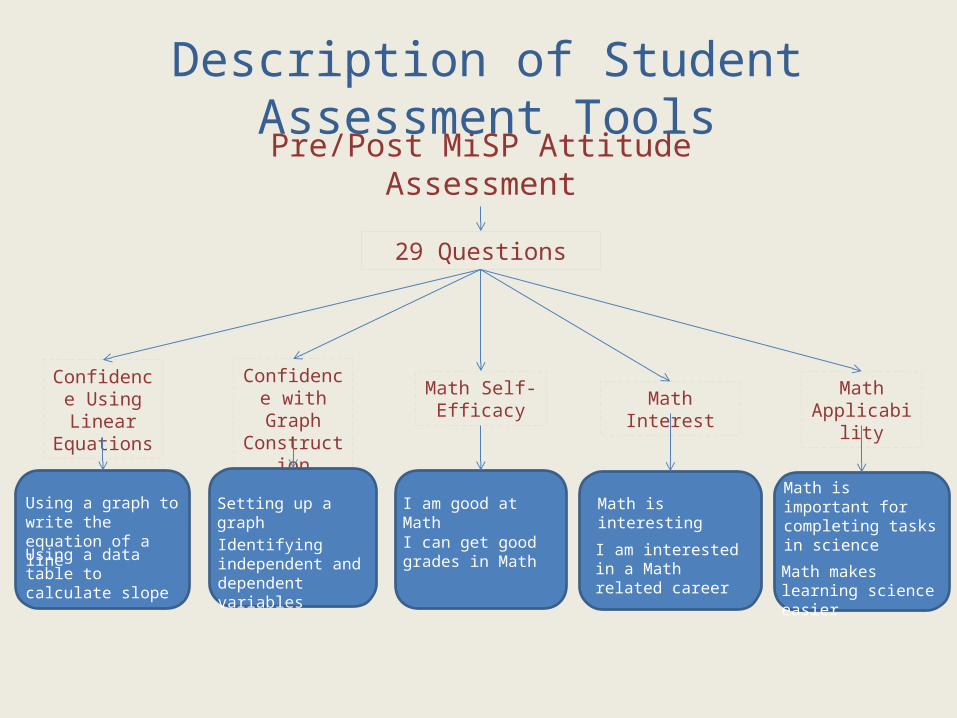
Pre/Post MiSP Attitude Assessment
Description of Student Assessment Tools
29 Questions
Confidence Using Linear
Equations
Confidence with Graph
Construction
Math Self-Efficacy
Math Interest Math Applicability
Math is important for completing tasks in science
Math makes learning science easier
Math is interesting
I am interested in a Math related career
I am good at Math
I can get good grades in Math
Setting up a graph
Identifying independent and dependent variables
Using a graph to write the equation of a line
Using a data table to calculate slope
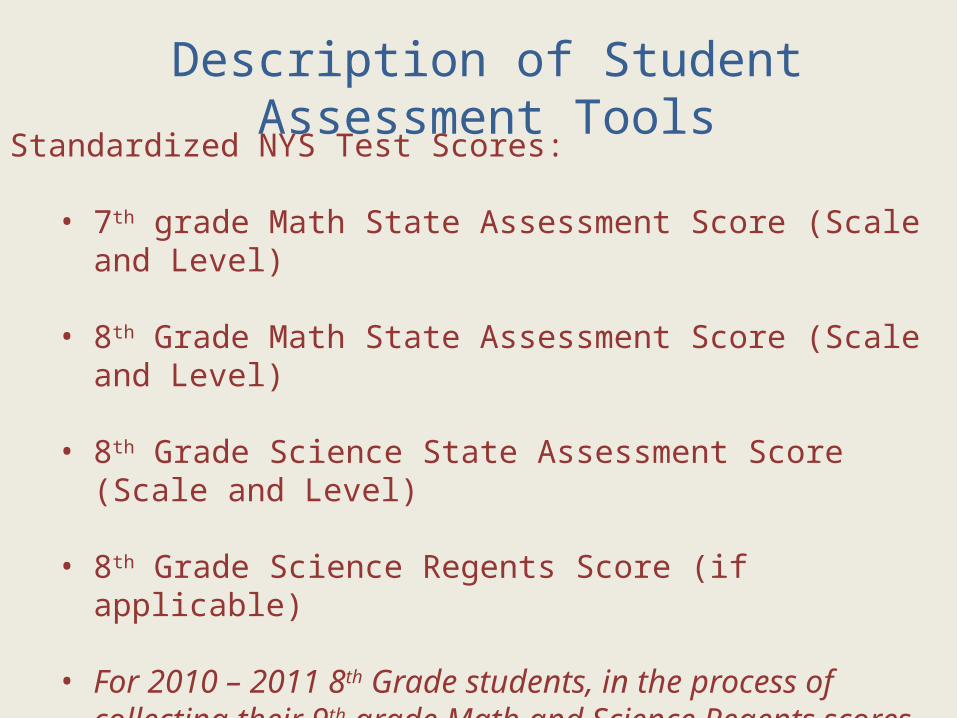
Standardized NYS Test Scores:
• 7th grade Math State Assessment Score (Scale and Level)
• 8th Grade Math State Assessment Score (Scale and Level)
• 8th Grade Science State Assessment Score (Scale and Level)
• 8th Grade Science Regents Score (if applicable)
• For 2010 – 2011 8th Grade students, in the process of collecting their 9th grade Math and Science Regents scores
Description of Student Assessment Tools
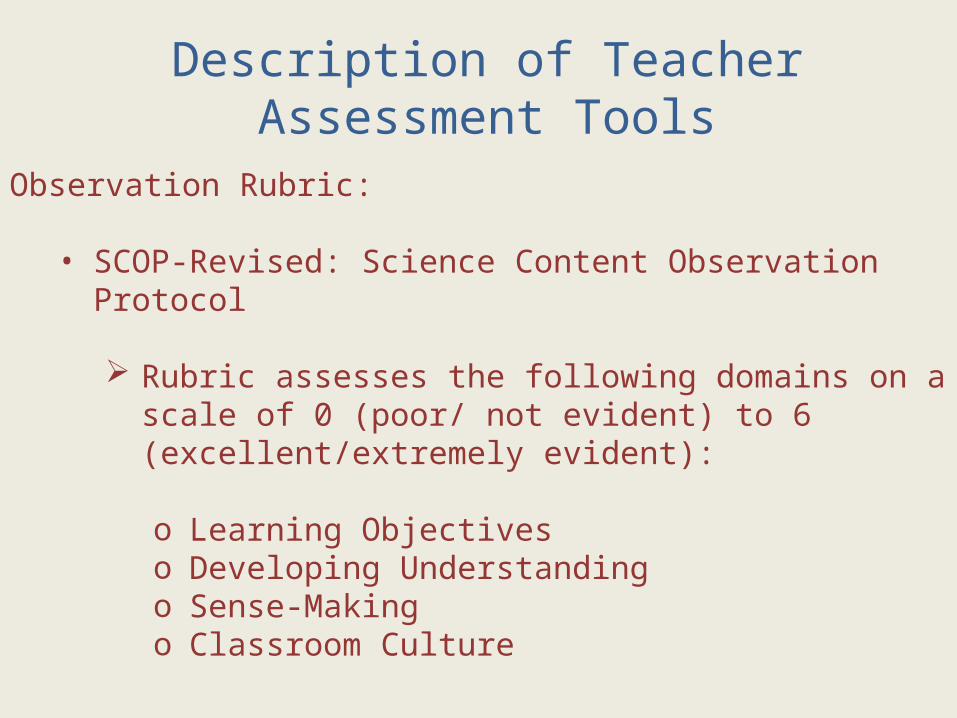
Observation Rubric:
• SCOP-Revised: Science Content Observation Protocol
Rubric assesses the following domains on a scale of 0 (poor/ not evident) to 6 (excellent/extremely evident):
o Learning Objectiveso Developing Understandingo Sense-Makingo Classroom Culture
Description of Teacher Assessment Tools
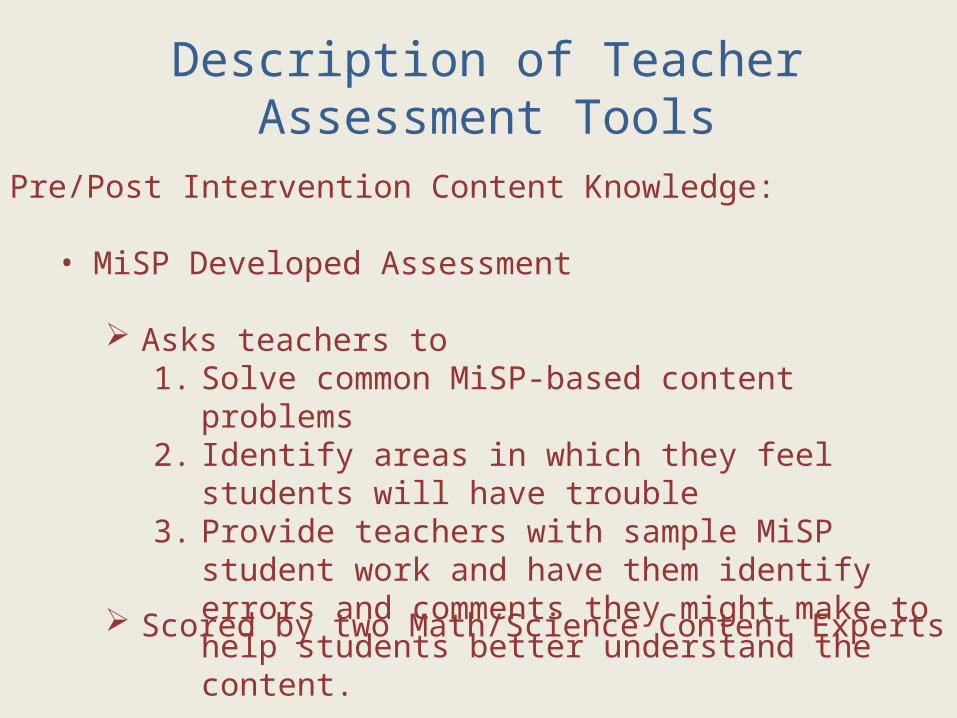
Pre/Post Intervention Content Knowledge:
• MiSP Developed Assessment
Asks teachers to1. Solve common MiSP-based content problems2. Identify areas in which they feel students will have
trouble3. Provide teachers with sample MiSP student work and
have them identify errors and comments they might make to help students better understand the content.
Description of Teacher Assessment Tools
Scored by two Math/Science Content Experts
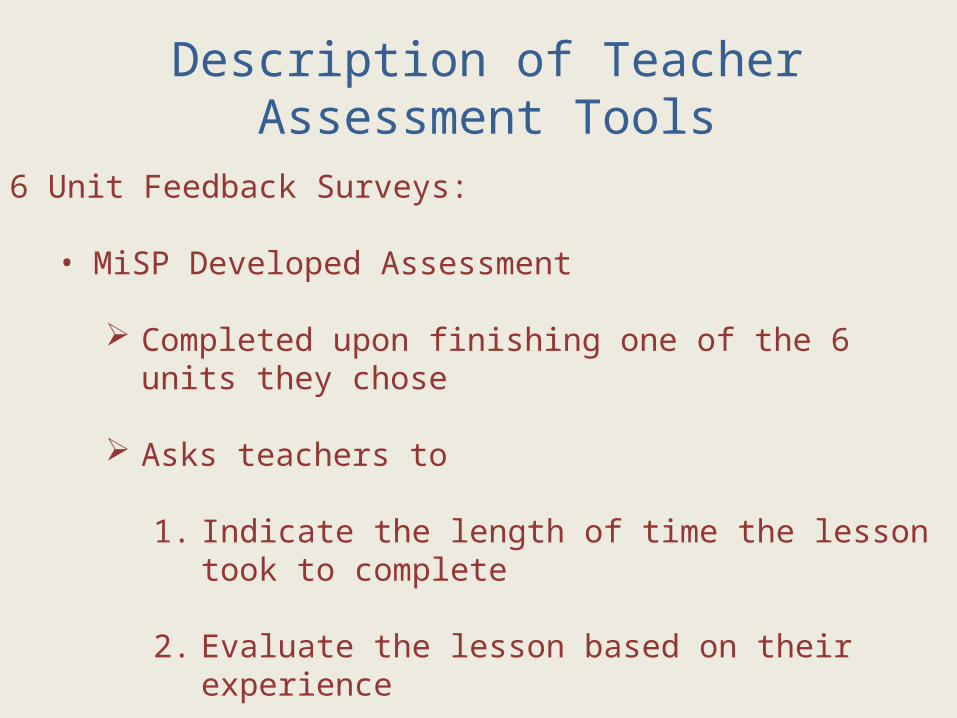
6 Unit Feedback Surveys:
• MiSP Developed Assessment
Completed upon finishing one of the 6 units they chose Asks teachers to
1. Indicate the length of time the lesson took to complete
2. Evaluate the lesson based on their experience
Description of Teacher Assessment Tools
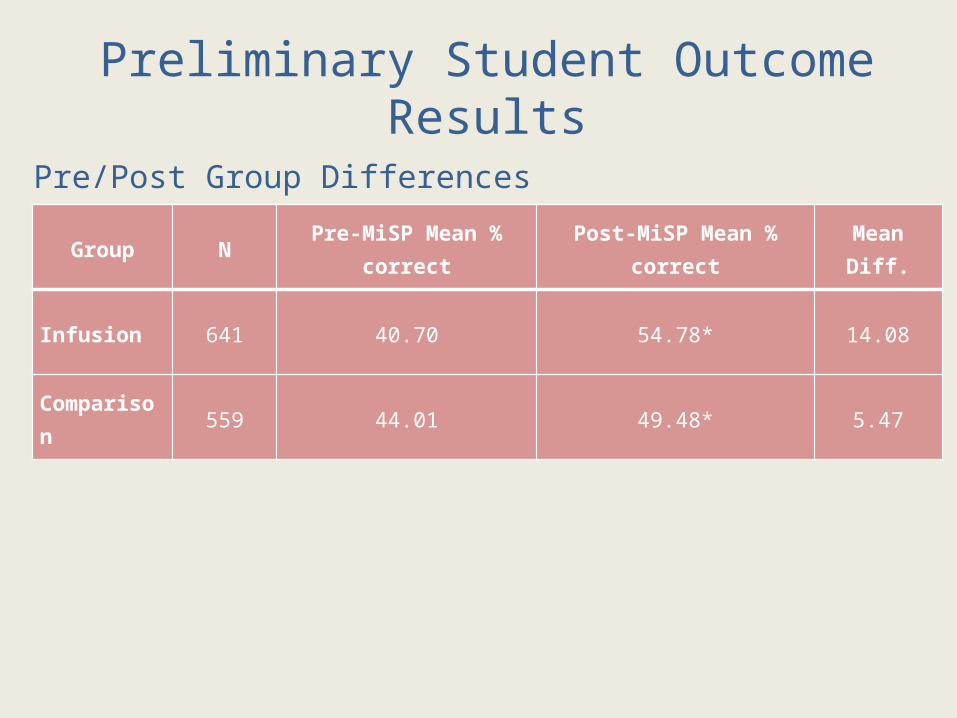
Group N Pre-MiSP Mean % correct Post-MiSP Mean % correct Mean Diff.
Infusion 641 40.70 54.78* 14.08
Comparison 559 44.01 49.48* 5.47
Preliminary Student Outcome Results
Pre/Post Group Differences
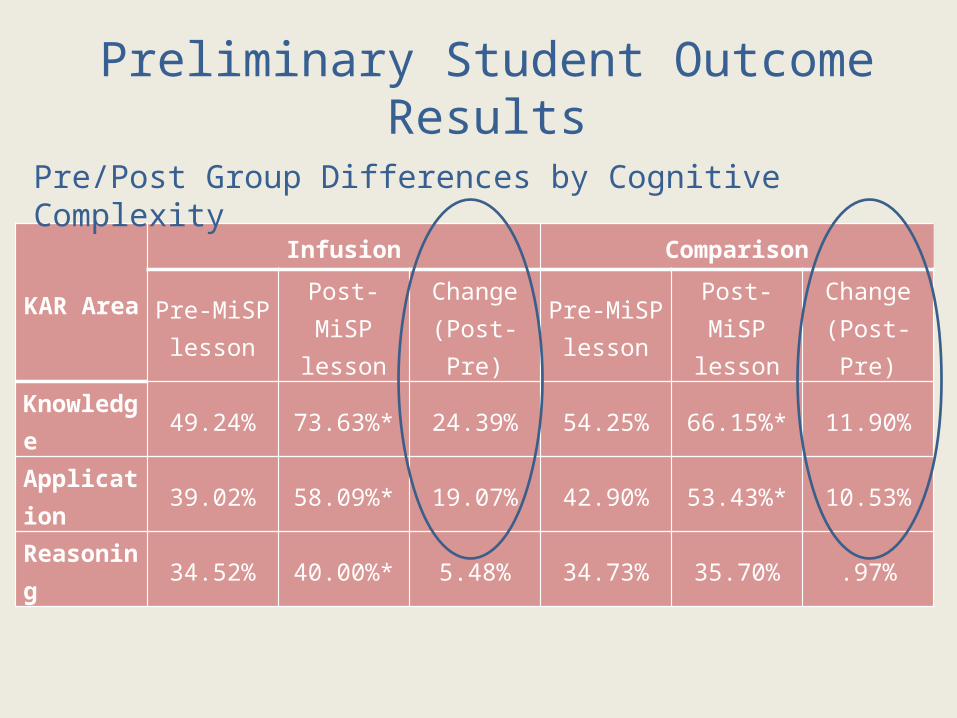
KAR Area
Infusion Comparison
Pre-MiSP lesson
Post-MiSP lesson
Change (Post-Pre)
Pre-MiSP lesson
Post-MiSP lesson
Change (Post-Pre)
Knowledge 49.24% 73.63%* 24.39% 54.25% 66.15%* 11.90%
Application 39.02% 58.09%* 19.07% 42.90% 53.43%* 10.53%
Reasoning 34.52% 40.00%* 5.48% 34.73% 35.70% .97%
Preliminary Student Outcome Results
Pre/Post Group Differences by Cognitive Complexity
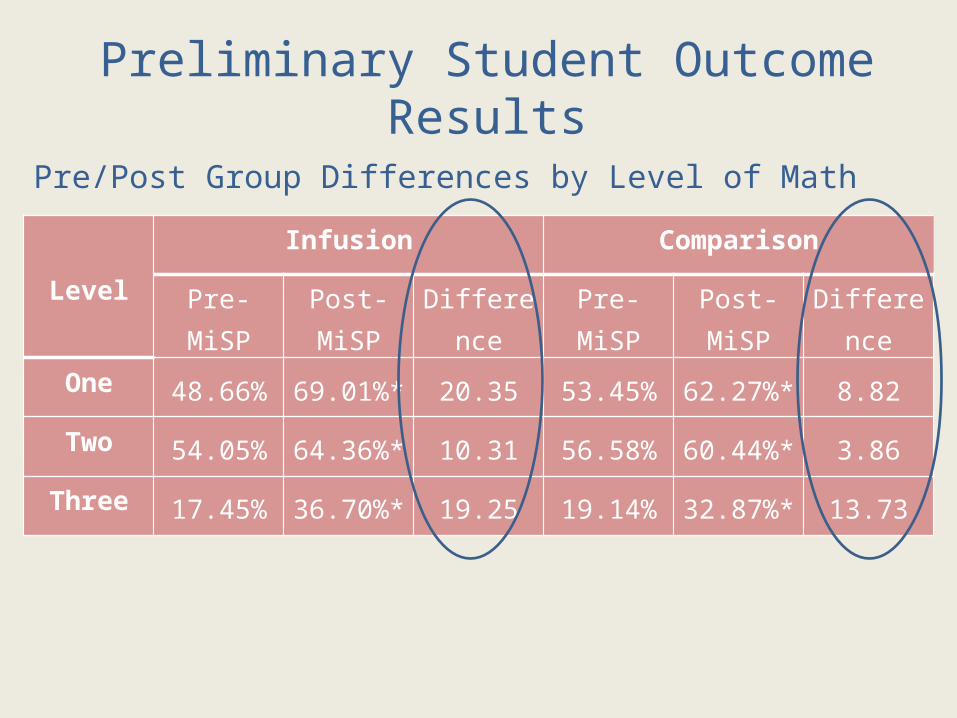
Level
Infusion Comparison
Pre-MiSP Post-MiSP Difference Pre-MiSP Post-MiSP Difference
One 48.66% 69.01%* 20.35 53.45% 62.27%* 8.82
Two 54.05% 64.36%* 10.31 56.58% 60.44%* 3.86
Three 17.45% 36.70%* 19.25 19.14% 32.87%* 13.73
Preliminary Student Outcome Results
Pre/Post Group Differences by Level of Math
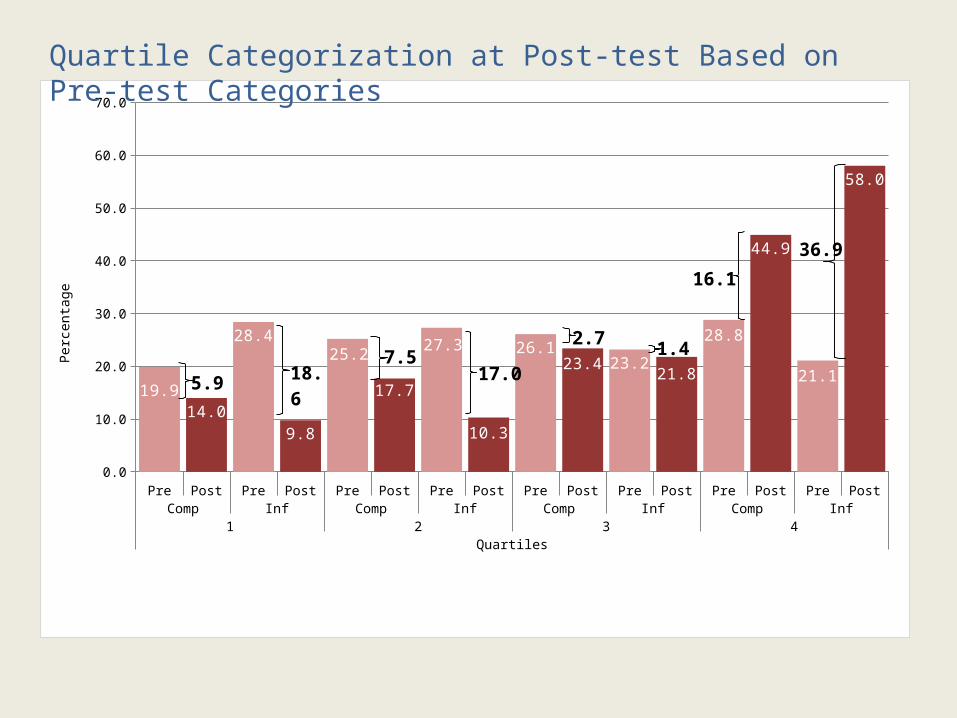
Pre Post Pre Post Pre Post Pre Post Pre Post Pre Post Pre Post Pre PostComp Inf Comp Inf Comp Inf Comp Inf
1 2 3 4Quartiles
0.0
10.0
20.0
30.0
40.0
50.0
60.0
70.0
19.914.0
28.4
9.8
25.2
17.7
27.3
10.3
26.123.4 23.2
21.8
28.8
44.9
21.1
58.0
Perc
enta
ge
5.9 18.67.5
17.0
2.7 1.4
16.1
36.9
Quartile Categorization at Post-test Based on Pre-test Categories
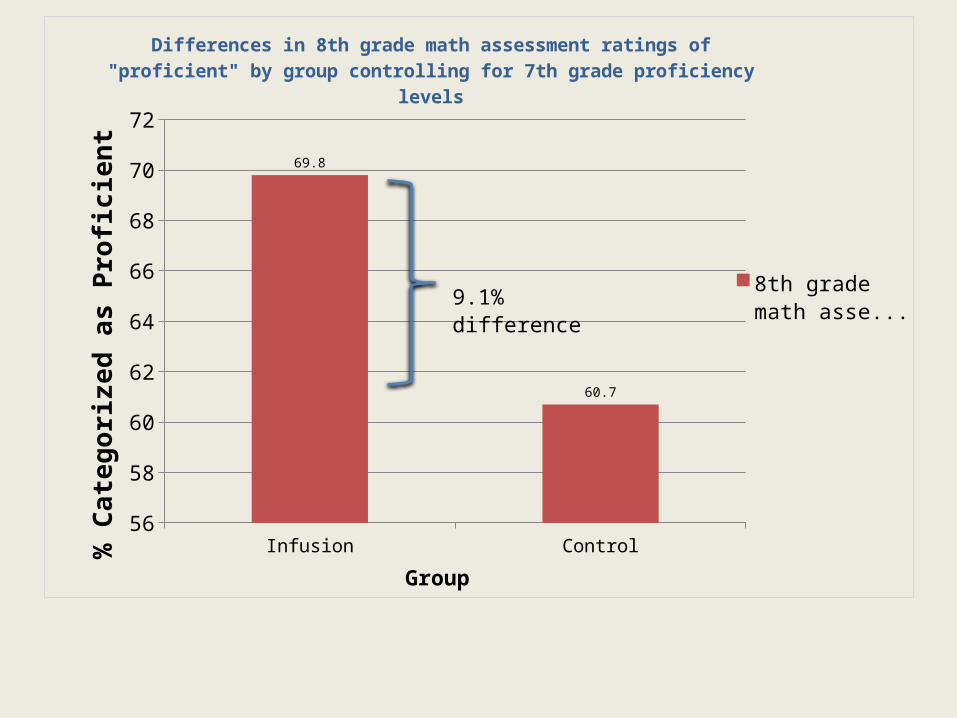
Infusion Control56
58
60
62
64
66
68
70
72
69.8
60.7
Differences in 8th grade math assessment ratings of "pro-ficient" by group controlling for 7th grade proficiency lev-
els
8th grade math assessment
Group
% C
ateg
oriz
ed a
s Pr
ofici
ent
9.1% difference
What We’ve Learned about Interconnected Learning
• Interconnected learning is doable for teacher and students within a regular class period
• Teachers need professional development in both pedagogy and content being infused
• Students learn each content area in greater depth
• When technology is included there must be options for hands on work
• Students recognize the importance of infusion and develop more positive attitudes towards both content areas
• Stakeholder buy-in is critical for success
20
Issues We Have Encountered – DATAG, help!
• Deidentification of data – Who, what, where, why, how
• Lack of access to individual item-level data
• Students learn each content area in greater depth
• Utilization of data results in the classroom– What support is given?– How do we know it is being “utilized” effectively– Are there tangible improvements documented?
21
• WISEngineering
• Simulation and Modeling in Technology Education (SMTE)
22
Two of Our Other Relevant Projects
23
S T E M
• WisEngineering
WiseEngineering is Next Generation Learning Grant that is using engineering pedagogy to teach mathematics using a web-based delivery system that allows for instruction to incorporate both computer based and hands on learning. Lessons engage students in a community based design task, reflections and embedded assessments
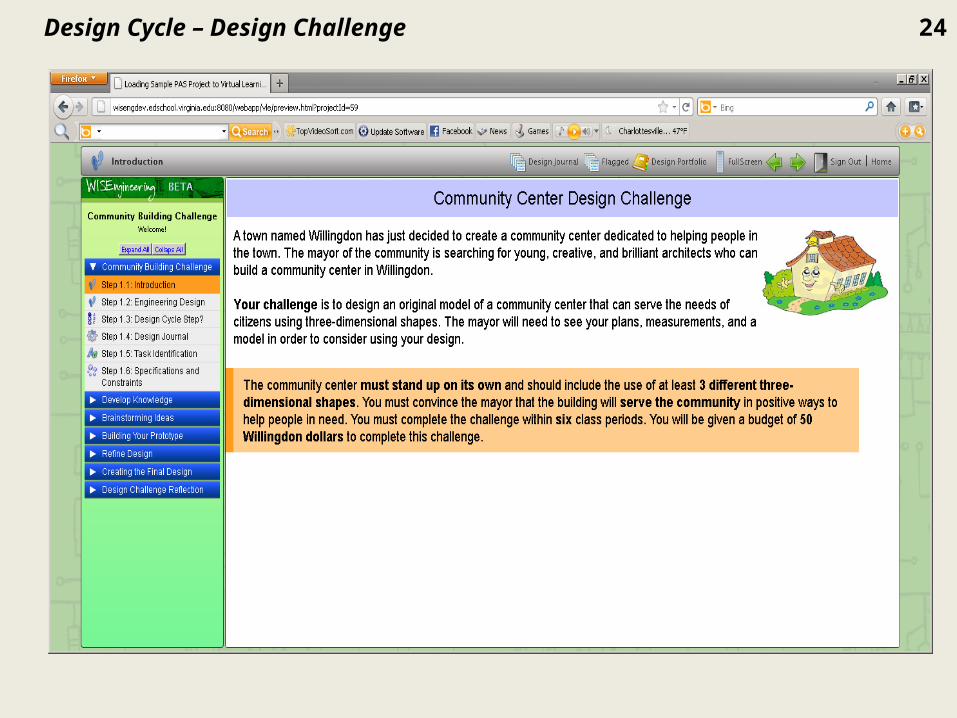
Design Cycle – Design Challenge 24
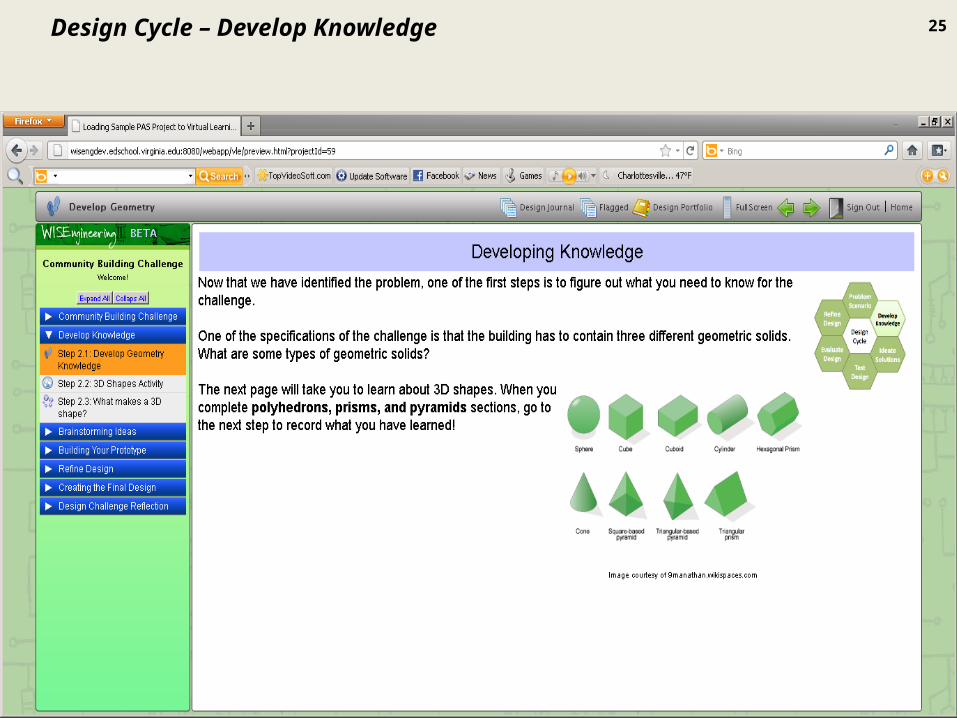
25Design Cycle – Develop Knowledge
26
S T E M
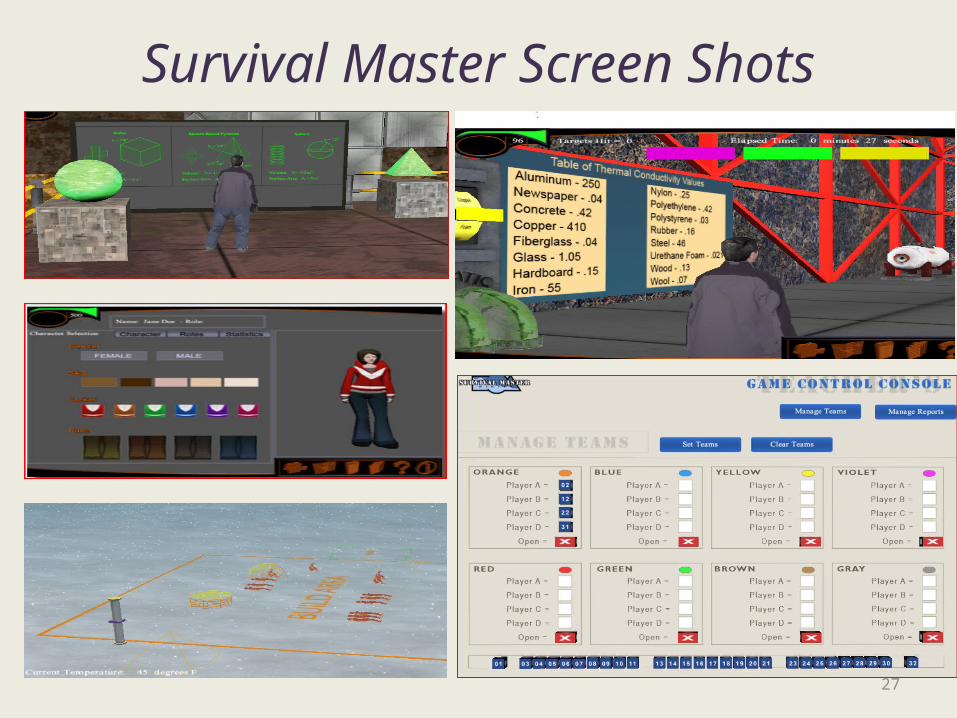
• SMTE Simulation and Modeling in Technology
Education (SMTE) is a DR-K12 project to develop and research the academic potential of a mathematics and engineering infused hybrid instructional model and a set of prototypical materials that integrate 3-D simulation, educational gaming, and real-world physical modeling into middle school technology education programs.
27
Survival Master Screen Shots