Embed Size (px)
Citation preview
Bandung, October 17th, 2015
Proceeding International Seminar on
Mathematics, Science, and Computer Science Education
1
M
LIST OF ARTICLE
MATHEMATICS AND MATHEMATICS EDUCATION
Code Title Page
MATH-07015 A STUDY ON CRITICAL THINGKING SKILLS IN MATHEMATICS ON EIGHT GRADE STUDENTS
Runisah
M- 5
MATH-07017 DEVELOPMENT OF PRINTED TEACHING MATERIALS BASED ON PROBLEM SOLVING APPROACH TO IMPROVE LITERACY MATHEMATICAL ABILITY FOR STUDENT OF JUNIOR HIGH SCHOOL
Huswatun Hasanah
M- 11
MATH-07025 DEVELOPING OF MATHEMATICAL UNDERSTANDING ABILITY THROUGH STUDENT ACTIVITY SHEET AIDED MICROSOFT MATH SOFTWARE IN CALCULUS
Aan Subhan Pamungkas
M- 15
MATH-07045 A STUDY OF CORRELATION BETWEEN LEARNING INTEREST OF STUDENT ON MATH SUBJECT AND THEIR LEARNING ACHIEVEMENT
Anggit Reviana Dewi Agustyani
M- 21
MATH-07065 THE ROLE OF RESEARCHERS TO IMPROVE MATHEMATICAL LITERACY IN INDONESIA
Delsika Pramata Sari
M- 28
MATH-07092
THE ENHANCEMENT OF THE MATHEMATICAL REASONING ABILITY AND SELF-REGULATED LEARNING OF JUNIOR HIGH SCHOOL STUDENT THROUGH INQUIRY LEARNING WITH ALBERTA MODEL
Rafiq Badjeber and Siti Fatimah
M-33
MATH-07102 MODEL OF "UJIAN NASIONAL" PROBLEMS BASED ON MATHEMATICAL REASONING FOR SENIOR HIGH SCHOOL LEVEL
Elah Nurlaelah
M- 39
MATH-07107 DEVELOPMENT MOBILE LEARNING APPLICATION TO INCREASE PEDAGOGICAL COMPETENCE OF MATH TEACHERS IN THE BANTEN PROVINCE
Dr. Aan Hendrayana, S.Si., M.Pd; Cecep Hadi Firdos Sentosa, M.Si
M- 46
MATH-07131 QUALITATIVE BECAME EASIER WITH ATLAS.TI M- 53
Bandung, October 17th, 2015
Proceeding International Seminar on
Mathematics, Science, and Computer Science Education
2
M
Code Title Page
Ekasatya Aldila Afriansyah
MATH-07132 MATHEMATICAL PROOF LEARNING FOR BEGINNER
Indra Siregar
M- 58
MATH-07142 ANALYSIS OF STUDENT DIFFICULTIES IN CONSTRUCTING MATHEMATICAL PROOF ON DISCETE MATHEMATICS COURSE
Abdul Mujib
M- 62
MATH-07178 IMPACT OF SAVI APPROACH TO IMPROVE STUDENT ACHIEVEMENT ON ON SENIOR HIGH SCHOOL IN DELI SERDANG
Siti Zulayfa
M- 69
MATH-07197 DIDACTICAL DESIGN OF JUNIOR HIGH SCHOOLS’S MATHEMATICS TEACHING MATERIAL BASED ON LEARNING OBSTACLES AND LEARNING TRAJECTORY
Encum Sumiaty and Endang Dedy
M-75
MATH-07212 THE ENHANCEMENT OF MATHEMATICAL REPRESENTATION ABILITY OF JUNIOR HIGH SCHOOL STUDENTS THROUGH DISCOVERY LEARNING BY THE SCIENTIFIC APPROACH
Windia Hadi, Yaya S. Kusumah
M- 81
MATH-07218 REVIEWS OF MATHEMATICAL REASONING ABILITY IN JUNIOR HIGH SCHOOL STUDENTS THROUGH GEOMETRY TASK-BASED INTERVIEW
Nurfadilah Siregar
M- 88
MATH-07224 INTERACTIVE MULTIMEDIA COMPUTER-BASED LEARNING TO ENHANCE MATHEMATICAL UNDERSTANDING ABILITIES JUNIOR HIGH SCHOOL STUDENTS
Nurjanah, Didi Suryadi, JozuaSabandar, Darhim
M- 96
MATH-07249 VISUAL AIDS IN ANALYTICAL GEOMETRY COURSE IN CONIC CONCEPT
Tia Purniati and Eyus Sudihartinih
M- 102
MATH-07265 LEARNING EFFECTIVENESS OF MEAS LEARNING INTEGRATED WITH NCV MATHEMATICAL TO THE ABILITY OF MATHEMATICAL REPRESENTATION ANDSELF-EFFICACY
Achmad Fauzan
M- 107
MATH-07268 AN ANALYSIS OF NUMBER SENSE OF MADRASAH ALIYAH STUDENTS
M- 114
Bandung, October 17th, 2015
Proceeding International Seminar on
Mathematics, Science, and Computer Science Education
3
M
Code Title Page
Dadang Juandi, Eyus Sudihartinih, Ririn Sispiyati
MATH-07288 DEVELOPING INTERACTIVE TEACHING MATERIALS BASED ON SCIENTIFIC APPROACH ON THE NUMBER CONCEPT
Heni Pujiastuti
M- 118
MATH-07299 COMPARISON OF MATHEMATICAL CONNECTION ABILITY BETWEEN STUDENTS WHO STUDY UNDER PROBLEM-BASED LEARNING MODEL AND THOSE OF UNDER GUIDED DISCOVERY LEARNING MODEL (A STUDY IN 8TH GRADER JUNIOR HIGH SCHOOL STUDENT)
Ummi Hasanah, Dadan Dasari
M- 122
MATH-07367 MATHEMATICAL MODELING ABILITY IN GEOMETRY MATERIALS OF ELEMENTARY SCHOOL TEACHERS
Didi Suhaedi, Tia Purniati
M- 128
MATH-07439 THE DEVELOPMENT OF LEARNING MATERIAL STUDENT WORKSHEET (LKS) WITH MISSOURI MATHEMATICS PROJECT MODEL (MMP) IN MATHEMATICS SUBJECT AT JUNIOR HIGH SCHOOL
Abdurrahman, Sri Rezeki, Andoko Ageng Setyawan
M- 133
MATH-07444 DIDACTICAL DESIGN OF MATHEMATICAL CONNECTIONS IN CHARACTERISTIC OF QUADRILATERAL CONCEPT AT ELEMENTARY SCHOOL
Epon Nur’aeni L, Yansi Nurani Henrisna
M- 136
MATH-07464 PROBLEM BASED LEARNING AND DISCOVERY LEARNING: THE COMPARATION IN MATHEMATICAL CREATIVE THINKING ABILITY OF JUNIOR HIGH SCHOOL STUDENTS
Jarnawi Afgani Dahlan
M- 142
MATH-07467 THE MATHEMATICS GAME TO FIND THE VALUE OF Π
Warman
M- 152
MATH-07472 THE DEVELOPMENT OF LEARNING INSTRUMENT WITH MISSOURI MATHEMATICS PROJECT MODEL (MMP) IN MATHEMATICS SUBJECT AT JUNIOR HIGH SCHOOL
Sri Rezeki
M- 157
MATH-07476
EXAMINE THE INTERACTION BETWEEN LEARNING AND KKM STUDENTS TO INCREASE COMMUNICATIONS AND PROBLEM SOLVING
M-160
Bandung, October 17th, 2015
Proceeding International Seminar on
Mathematics, Science, and Computer Science Education
4
M
Code Title Page
MATHEMATICS ABILITY IN JUNIOR HIGH SCHOOL WITH APPLYING REACT STRATEGY
Sari Herlina
MATH-07477 DEVELOPMENT OF MATHEMATICAL PROBLEM-SOLVING TEACHING MATERIALS FOR ISLAMIC PRIMARY SCHOOL TEACHER PROSPECTIVE STUDENTS THE PROGRAM OF ENHANCING THE QUALIFICATION
Rahayu Kariadinata
M- 166
MATH-07503 SITUATON-BASED LEARNING FOR ENHANCING STUDENTS’ MATHEMATICAL CREATIVE PROBLEM SOLVING ABILITY IN ELEMENTARY SCHOOL
Isrok’atun,Tiurlina
M- 171
MATH-08026 BOOTSTRAPPED DURBIN–WATSON TEST OF AUTOCORRELATION FOR SMALL SAMPLES
Dewi Rachmatin
M- 177
MATH-08085 MANIPULATIVES AND NON-MANIPULATIVES : A SURVEY
M.A. Shulhany
M- 182
MATH-08126
ZIMMERMANN DEVELOPMENT METHOD SOLUTIONS TO SOLVE THE PROBLEM OPTIMAL FUZZY LINEAR PROGRAMMING
Lukman, Entit Puspita, Fitriani Agustina
M-187
MATH-08204 USING GEOMETERS’ SKETCHPAD SOFTWARE TO PRESENT FRACTAL GEOMETRY
Ali Shodikin
M-193
MATH-07314 THE PROJECT-BASED LEARNING APPROACH USING GEOGEBRA TO DEVELOP CREATIVITY IN UNIVERSITY STUDENTS Hedi Budiman
M-203
Bandung, October 17th, 2015
Proceeding International Seminar on
Mathematics, Science, and Computer Science Education
5
M
MATH-07015
A Study on Critical Thingking Skills in Mathematics
on Eight Grade Students
Runisah1,2
1Department of Mathematics education, Universitas Pendidikan Indonesia, Jl. Dr. Setiabudi no.229, Bandung 40154
2Universitas Wiralodra Jl. Ir H. Djuanda Km 3 Indramayu 45213, Indonesia
Article info Abstract
Keywords: critical thinking, critical thinking skills in mathematics, students' difficulties on Critical thinking skills test.
This study aims to describe the critical thinking skills in mathematics in the eighth grade students and the difficulties in completing critical thinking skills test in mathematics. This research was conducted at one junior high school in Indramayu West Java Province, Indonesia. From all eighth grade students in the school, 33 students were selected to represent a group of students academic ability of low, medium, and high. Data were collected through the administration of tests and interviews. The analysis of the data showed that the critical thinking skills of students on the mathematical aspect is still low. Some difficulties faced by the students in solving mathematical tests critical thinking skills are: (1) the lack of students' understanding of concepts; (2) The lack of students’ ability to use reasoning, in general, students still rely on the memorizing of the sample questions provided by the teacher; (3) The lack of students’ ability in interpreting problems into mathematical form; (4) The lack of students’ ability to analyze the pattern of the relationship of a set of data or information (5) The lack of students’ ability to interpret the graph.
Corresponding Author: [email protected]
INTRODUCTION
Critical thinking is one of the capabilities required to solve various problems. That is because the critical thinking involved interpreting, analyzing, evaluating information and logical reasoning for appropriate decision making that is used in each step to solve the problem.
Critical thinking is reasonable and reflective thinking focused on deciding what to believe or do [1]. Reflective means consider or rethink everything he faced before taking a decision. Reasonable means to have faith and a view supported by the evidence or good reason.
According to [2] critical thinking in mathematics is different from the epistemology of critical thinking in other domains. Critical thinking in mathematics is the ability and disposition to incorporate prior knowledge, mathematical reasoning, and cognitive strategies to generalize, prove, or evaluate unfamiliar in a reflective manner [3]. Based on these opinions, the ability of mathematical reasoning, understanding of concepts in mathematics, and mastery of cognitive strategies such as a strategy for solving the problem is an essential aspect involved in critical thinking in mathematics. More specifically [4] linking aspect of critical thinking with mathematical content includes: concepts, generalization, algorithm and skills, and problem solving.
Various opinions about critical thinking that has been presented above contain similarity that critical thinking involves prior knowledge, cognitive strategies and mathematical reasoning to generalize, prove, evaluating or making judgments about the
Bandung, October 17th, 2015
Proceeding International Seminar on
Mathematics, Science, and Computer Science Education
6
M
adequacy of arguments, data, and conclusions or mathematical situations that are not routine.
Although the critical thinking is necessary to solve the problem, but some studies find any problems associated with critical thinking skills. One of them is the results of TIMSS (2007 and 2011) shows that the average score of mathematic achievement is far below average. In the TIMSS 2011 students are involved in cognitive processes to solve problems [5]. Low ability to solve problems indicate that the critical thinking skills of students is still low.
Many studies have been done about critical thinking in math, but the studies that have been conducted generally evaluated the learning model to improve the critical thinking skills. Study of the students’difficulties in doing tests of critical thinking skills in math is rarely Therefore, it is important to know the cause of the low critical thinking skills of mathematics in students. This study aimed to obtain critical thinking skills of mathematics and the difficulties experienced by students in critical thinking skills test.
METHOD
This research was conducted at one of junior high school in Indramayu West Java Province, Indonesia. From all eighth grade students in that school, 33 students were selected to represent a group of students academic ability of low, medium, and high. Then they were given tests to measure critical thinking skills in mathematics. Further interviews were conducted to some students.
Critical thinking skills tests that was used consisted of four questions. Every question on the test was related to aspect of critical thinking with mathematical content includes concepts, generalization, and problem solving. Indicators measured include: (1) Identify the characteristics of a relation whose four members are known to determine the next relation member; (2) determine the similarities and differences between the example of the concept that is represented on a graph with non-represented on the graph; (3) make generalization; (4) Choose the best way of solving the problem of the settlement of the existing alternatives.
RESULTS AND DISCUSSION
Based on the analysis of data, it was obtained an average score of critical thinking skills tests in mathematics that was equal to 5.19 of the ideal maximum score of 16. This showed that the critical thinking skills of students in mathematics was still low. Some difficulties found in students. As an illustration depicting the difficulties on student will be described in the following sections. Problem 1 (Indicator 1) Find the next two members of a relation as follows {(0, -1), (1,0), (3, 2), (6, 5), ... }! Explain how to get it! From 33 students, there were 19 students who answered correctly and provided a logical reason, 14 students gave wrong answers with varying error. From the analysis of answers and interviews with several other students indicated the same thing that The students only paid attention to two recent data to determine the applicable rules. They have difficulty in analyzing the relationship of existing data to infer patterns formed. As an illustration, the students' answer were presented below:
Bandung, October 17th, 2015
Proceeding International Seminar on
Mathematics, Science, and Computer Science Education
7
M
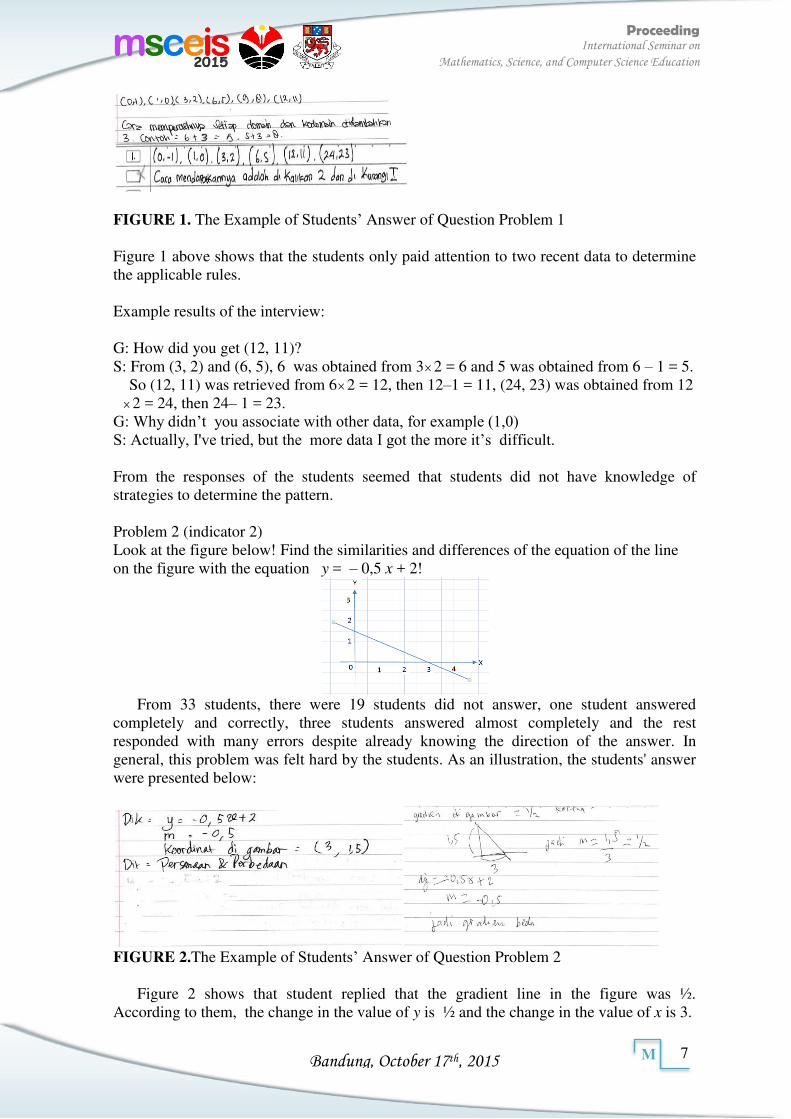
FIGURE 1. The Example of Students’ Answer of Question Problem 1
Figure 1 above shows that the students only paid attention to two recent data to determine the applicable rules.
Example results of the interview: G: How did you get (12, 11)? S: From (3, 2) and (6, 5), 6 was obtained from 32 = 6 and 5 was obtained from 6 – 1 = 5. So (12, 11) was retrieved from 62 = 12, then 12–1 = 11, (24, 23) was obtained from 122 = 24, then 24– 1 = 23.
G: Why didn’t you associate with other data, for example (1,0) S: Actually, I've tried, but the more data I got the more it’s difficult. From the responses of the students seemed that students did not have knowledge of strategies to determine the pattern. Problem 2 (indicator 2) Look at the figure below! Find the similarities and differences of the equation of the line on the figure with the equation y = – 0,5 x + 2!
From 33 students, there were 19 students did not answer, one student answered completely and correctly, three students answered almost completely and the rest responded with many errors despite already knowing the direction of the answer. In general, this problem was felt hard by the students. As an illustration, the students' answer were presented below:
FIGURE 2.The Example of Students’ Answer of Question Problem 2 Figure 2 shows that student replied that the gradient line in the figure was ½. According to them, the change in the value of y is ½ and the change in the value of x is 3.
Bandung, October 17th, 2015
Proceeding International Seminar on
Mathematics, Science, and Computer Science Education
8
M
The result of the analysis the students answers and interview showed that students did not understand about the coordinates of a point which was a prerequisite concepts. Some students replied that the gradient line in the figure was ½. According to them, the change in the value of y is ½ and the change in the value of x is 3. This shows a lack of the ability of students to understand the concepts of gradient and difficulty in interpreting the graph. Problem 3 (Indicator 3) Note the pattern shown below: ……
Figure 1 Figure 2 Figure 3 …… Figure n
a. Find the number of square on figure 4 and 5! b. Find the formula for determining the number of square on figure n!
From 33 students, almost all the students can answer that square was always increased
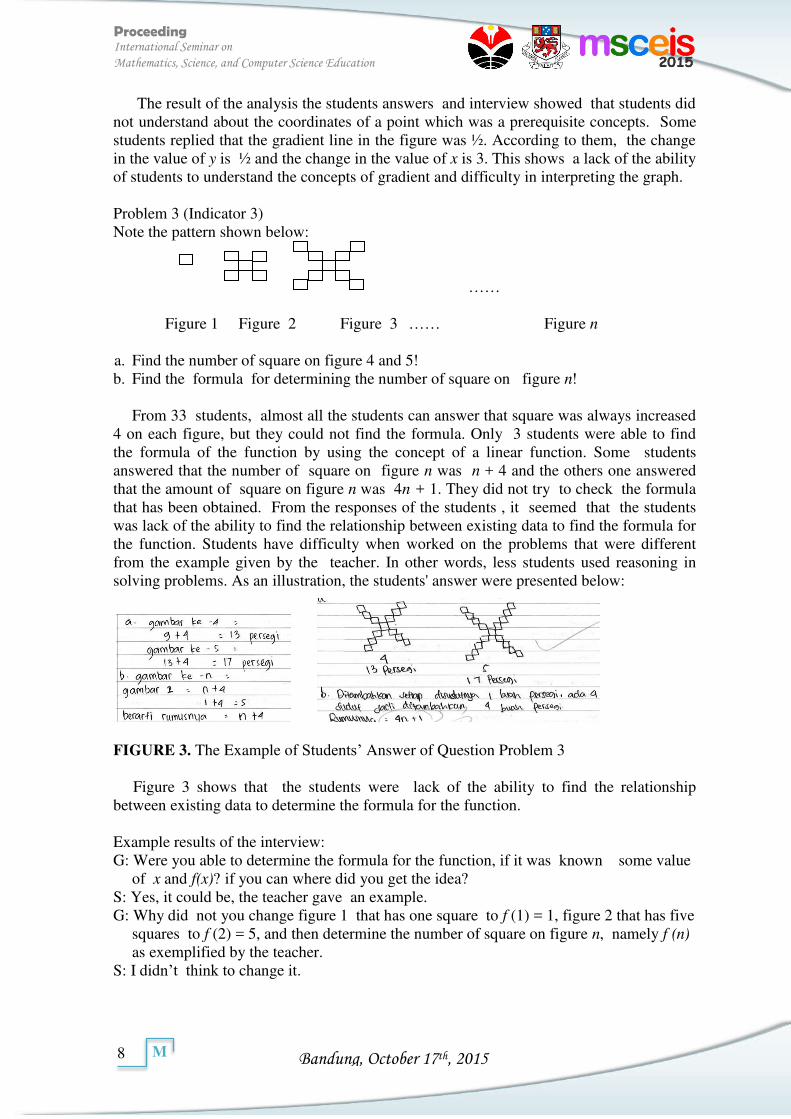
4 on each figure, but they could not find the formula. Only 3 students were able to find the formula of the function by using the concept of a linear function. Some students answered that the number of square on figure n was n + 4 and the others one answered that the amount of square on figure n was 4n + 1. They did not try to check the formula that has been obtained. From the responses of the students , it seemed that the students was lack of the ability to find the relationship between existing data to find the formula for the function. Students have difficulty when worked on the problems that were different from the example given by the teacher. In other words, less students used reasoning in solving problems. As an illustration, the students' answer were presented below:
FIGURE 3. The Example of Students’ Answer of Question Problem 3
Figure 3 shows that the students were lack of the ability to find the relationship between existing data to determine the formula for the function. Example results of the interview: G: Were you able to determine the formula for the function, if it was known some value
of x and f(x)? if you can where did you get the idea? S: Yes, it could be, the teacher gave an example. G: Why did not you change figure 1 that has one square to f (1) = 1, figure 2 that has five
squares to f (2) = 5, and then determine the number of square on figure n, namely f (n) as exemplified by the teacher.
S: I didn’t think to change it.
Bandung, October 17th, 2015
Proceeding International Seminar on
Mathematics, Science, and Computer Science Education
9
M
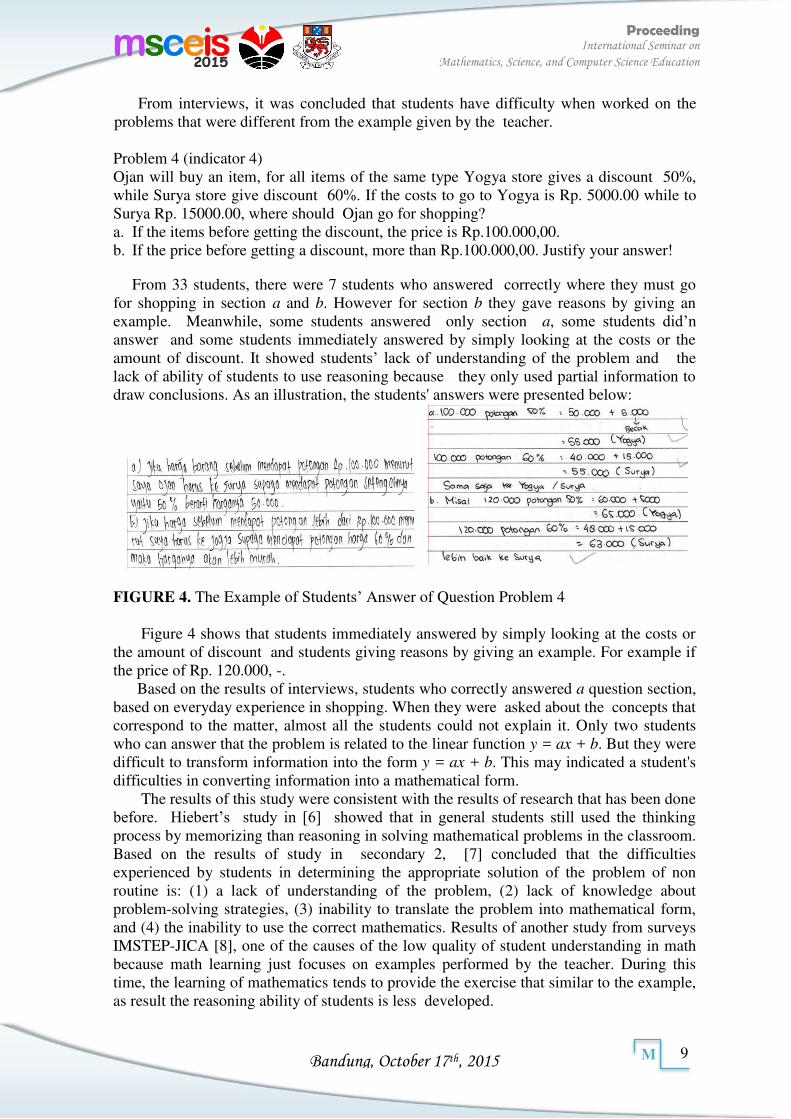
From interviews, it was concluded that students have difficulty when worked on the problems that were different from the example given by the teacher. Problem 4 (indicator 4) Ojan will buy an item, for all items of the same type Yogya store gives a discount 50%, while Surya store give discount 60%. If the costs to go to Yogya is Rp. 5000.00 while to Surya Rp. 15000.00, where should Ojan go for shopping? a. If the items before getting the discount, the price is Rp.100.000,00. b. If the price before getting a discount, more than Rp.100.000,00. Justify your answer!
From 33 students, there were 7 students who answered correctly where they must go for shopping in section a and b. However for section b they gave reasons by giving an example. Meanwhile, some students answered only section a, some students did’n answer and some students immediately answered by simply looking at the costs or the amount of discount. It showed students’ lack of understanding of the problem and the lack of ability of students to use reasoning because they only used partial information to draw conclusions. As an illustration, the students' answers were presented below:
FIGURE 4. The Example of Students’ Answer of Question Problem 4
Figure 4 shows that students immediately answered by simply looking at the costs or the amount of discount and students giving reasons by giving an example. For example if the price of Rp. 120.000, -. Based on the results of interviews, students who correctly answered a question section, based on everyday experience in shopping. When they were asked about the concepts that correspond to the matter, almost all the students could not explain it. Only two students who can answer that the problem is related to the linear function y = ax + b. But they were difficult to transform information into the form y = ax + b. This may indicated a student's difficulties in converting information into a mathematical form. The results of this study were consistent with the results of research that has been done before. Hiebert’s study in [6] showed that in general students still used the thinking process by memorizing than reasoning in solving mathematical problems in the classroom. Based on the results of study in secondary 2, [7] concluded that the difficulties experienced by students in determining the appropriate solution of the problem of non routine is: (1) a lack of understanding of the problem, (2) lack of knowledge about problem-solving strategies, (3) inability to translate the problem into mathematical form, and (4) the inability to use the correct mathematics. Results of another study from surveys IMSTEP-JICA [8], one of the causes of the low quality of student understanding in math because math learning just focuses on examples performed by the teacher. During this time, the learning of mathematics tends to provide the exercise that similar to the example, as result the reasoning ability of students is less developed.

Bandung, October 17th, 2015
Proceeding International Seminar on
Mathematics, Science, and Computer Science Education
10
M
This study has limitations because it is only done at a junior high school in indramayu district, which may have different facilities and levels of education development compare with other cities.
CONCLUSSION
The study shows that critical thinking skills in mathematics students is still low. The difficulties in completing tests students 'critical thinking skills in mathematics due to several reasons including: (1) students' understanding of concepts related to the given problem is still lacking; (2) Students are accustomed to work on about the same or nearly the same as the example, so the ability to use reasoning is still low; (3) students are lack of ability to interpret a problem or change problems into mathematical form; (4) students are lack of ability to analyze the pattern of the relationship of a set of data or information to determine the next data or to make any conclusion or generalization (5) students are lack of ability to read the graph to give the meaning of the concepts contained in the graph.
REFERENCES
Ennis (2011). The Nature of Critical Thinking: An Outline of Critical Thinking
Dispositions and Abilities. Retrieved from http://faculty.education.illinois.edu/rhennis/documents/TheNatureofCriticalThinking_51711_000.pdf
Glazer, E (2004). Technologi Enhanced Learning Environments that are Conductive to
Critical Thinking in Mathematics: Implication for Research about Critical
Thinking on the World Wide Web. Retrieved from http://www.http://lonstar.texas.net/ ~mseifert / crit2.html.
Glazer, E. (2001). Using Web Sources to Promote Critical Thinking in High School
Mathematics. Retrieved from http://math.unipa.it/~grim/AGlazer79-84.PDF Innabi, H. (2003). Aspects of Critical Thinking in Classroom Instruction of
Secondary School Mathematics Teachers in Jordan. Proceedings of the International Conference. P. 124-129. Retrieved from http://www.unipa.it/grim/21_project/21_brno03_Innabi.pdf
Mullis, dkk (2012). TIMSS 2011 International Result in Mathematics.TIMMS &PIRLS International Study Center Lynch School of Ed. Boston College, Cheotnut Hill,MA USA and IEA Amsterdam. Retrieved from http://timssandpirs.bc.edu/timss2011/downloads/T11_IR_Mathematics_Fullbook.pdf.
Lithner, J (2008). Research Framework for Creative and Initative Reasoning. Educational
Studies in Mathematics. 67(3).p. 255-276. Retrieved from http://www.jstore.org/stabe/40284656
Yeo. (2006). Secondary 2 Students Difficulties in Solving Non Routine Problem, Retrieved from http://www.cimt.plymouth.ac.uk/journal/yeo.pdf.
Ulya, N. (2007). Upaya Meningkatkan Kemampuan Penalaran dan Komunikasi
Matematik Siswa SMP/MTs melalui Pembelajaran Kooperatif Tipe Teams-Games-
Tournaments (TGT). (Unpublished Thesis). UPI, Bandung.
Bandung, October 17th, 2015
Proceeding International Seminar on
Mathematics, Science, and Computer Science Education
11
M
MATH-07017
Development of Printed Teaching Materials Based on Problem Solving Approach to Improve Literacy Mathematical Ability for Student of
Junior High School
Huswatun Hasanah
Mathematics Education, Postgraduate of Indonesia University of Education
Article info Abstract
Keywords: printed instructional materials, problem solving approach, mathematical literacy.
The low mathematical literacy ability of students in Indonesia is evidenced by
the results of an international study. Which is Programme for International
Student Assessment (PISA) and Trends in International Mathematics and
Science Study (TIMSS). PISA survey in the 2012 showed that Indonesia was
ranked 64th of 65 countries in mathematical literacy category. TIMSS study
result in 2011, that Indonesia was ranked 38th out of 42 participating countries
with an average score by 386 and international score up to 500. This shows that
Indonesian students are always ranked lower ranks in mathematical literacy
skill. Therefore, creating of teaching materials to determine the characteristics of
printed teaching materials adequate for increasing students' mathematical
literacy skills to be able to solve problems in real life is very important. This
development research through a long process, which is making preliminary
design instructional materials, testing experts, the revision of the advice and
criticism of experts, testing on a limited scale, as well as revised in accordance
limited scale test results. Limited scale test conducted in class VIII SMP. Data
were obtained by using questionnaires. Data processing uses a Likert scale
questionnaire. The conclusion of this research is the result of the analysis of
testing experts that the teaching material based on problem solving approach can
improve students' mathematical literacy skill and can show a good results with
their respective test scores for the acquisition of a mathematician by 81, 5%,
education experts test 82, 67%,design experts test 74,29%, and the limited scale
trial by 83%.
Corresponding Author: Jl. Dr. Setiabudhi no 229, Bandung 40154, Indonesia E-mail : [email protected]
INTRODUCTION
In the 21st century every nation faced with the demands of the importance of quality human resources and be able to compete. This makes the human being should be able to master the skills and abilities needed to understand and solve problems in the life of the ever-evolving all the time. Mathematics is often seen as a tool to solve the problems of human life. Mathematics is important because it gives an opportunity of developing mathematical reasoning ability of students to think logically, systematically, critically and carefully, creatively, foster self-confidence, and develop an objective and open attitude that is indispensable in the face of ever-changing future.
Education policy makers in Indonesia have taken points to evaluate the results of our mathematics education by juxtaposing among other countries. As early as 2000, Indonesia has followed the Programme for International Student Assessment (PISA) and the Trends in International Mathematics and Science Study (TIMSS). PISA 2012 survey results showed Indonesia was ranked 64th of 65 countries in mathematical literacy category. Meanwhile, according to the TIMSS study in 2011 showed that Indonesia is ranked 38th
Bandung, October 17th, 2015
Proceeding International Seminar on
Mathematics, Science, and Computer Science Education
12
M
out of 42 participating countries with an average score of 386, while the international average score of 500.
The main cause of the performance of students in mathematics is they were often wrong to understand mathematical concepts. According Pranoto [2] should the role of mathematics not only as a means to calculate quickly and precisely, but rather so that students are able to solve problems intactly with mastering mathematics cycle, to mathematics an actual problems into a mathematical problem - solving mathematical problems - interpreting mathematical solutions to the original or real situation. Kilpatrick [1] states that study mathematics at school should pay attention to competence in accordance with the times so that it becomes a place to develop components that encapsulate what it should be controlled so that they succeed in learning mathematics.
Mathematical literacy includes the ability to identify and understanding, using the foundations of mathematics in life, it takes a person faced a life every day. This means that mathematical literacy is the ability to know the basic concepts and techniques as well as the principle of mathematical functions to estimate a solution of real problems. The proportion of Indonesian students who have mathematical literacy is low (below level 2) it reached 76, 6%. The impact if this is allowed, Indonesia will face a bleak future.
Thus, Indonesia should prepare a solution in mathematics learning. A Learning that pay attention mathematical literacy can show real purpose of mathematics and also develop components that encapsulate what it should be controlled so that they succeed in learning mathematics. In recently, the learning of mathematics is still traditional where it aplicate teacher-centered means, the approach used is expository, teachers more dominate classroom activities, using more regularly exercises, as well as in the learning process of students being passive. In the frequently-used conventional learning, teachers usually teach by referring to the textbooks or Student Worksheet (LKS), using the expository method and occasionally asked method. This cause less creativities of teachers to develop teaching methods or less time available for learning more interactive. Therefore, methods of math teachers often use textbooks or worksheets that less facilitate lessons to improve students’ mathematical literacy, it necessary for teaching materials or worksheets which trains students to have the ability of students' mathematical literacy. This teaching material is open to daily life, has a character problem which can cause problem solving ability of students and led to the investigation, not merely mathematical problem is far from everyday life. By developing existing teaching materials into teaching materials which have character-based problem solving, and close with the problems given in the PISA expected to improve students' mathematical literacy so that in the next PISA results Indonesia row occupants were able to escape from under the board and could be at a row of advanced nations.
Based on these problems, this research relates to the development of teaching materials, entitled Development of Instructional Materials Print-Based Approach to Improve Problem Solving Ability Mathematical Literacy in Junior High School Students.
METHOD
The study used a method of research and development. According Sugiyono [4] methods of research and development is a research method used to produce a particular product and test the effectiveness of the product. According Puslitjaknov [5] states that in the development research includes three components: (1) Development Model; (2) Development Procedure; (3) Product Testing. Development research procedure may be taken to refer to the development procedures performed by the Borg and Gall [2] develop
Bandung, October 17th, 2015
Proceeding International Seminar on
Mathematics, Science, and Computer Science Education
13
M
mini instruction (mini course). However, because researcher has the limitations of time and cost, therefore this research is only done as much as 7 stages.
Subjects tested in this study consisted of expert testing and limited product user testing, for this case the students. Expert testing consists of 3 parts, it is mathematician, education experts and design experts. Test mathematician expected to provide suggestions related to concepts of mathematics and mathematical literacy as outlined in this printed teaching materials based on problem solving approach. Test experts that play a role in the assessment of educational teaching materials is expected to provide suggestions theoretically the development of teaching materials based problem solving approach to improve students' mathematical literacy. Then, test design expert role in providing an assessment of the design and the overall appearance of teaching materials.
The trials of products in this development is done on a small scale (limited). The questionnaires were given a closed and open questionnaire. Selection of the subject sample test conducted by purposive sampling. According Riduwan [3] purposive sampling is a sampling technique that is used by researchers if the researchers have certain considerations in sample collection or sampling for a particular purpose. In this study, selected samples were junior high school students in the city of Cilegon because it has been studied material quadrilaterals during normal learning by using teaching materials that already exist.
RESULTS AND DISCUSSION
Print product Instructional materials based problem solving approach that integrateed in the capabilities of mathematical literacy on the subject of quadrilaterals for 7th grade of junior high school students is prepared teaching materials with emphasis on Mathematical Literacy indicators through teaching based on problem solving. Therefore, every material in this is presented systematically and oriented on real life to be able to lead students to solve problems in the real daily situations. The teaching materials also show various illustrations of real-world objects into quadrilaterals wake so that they can describe clearly a material and indicates that the material have an application in real life around students. The exercises and sample questions presented in this teaching material prioritize the type of literacy with a certain level of completion levels based on problem solving.
The results of the questionnaire after material testing by two mathematicians obtain a final score that is up to 81.05%. The final results obtained by testing two education experts from different institutions to get the final score of the acquisition of 82, 67%. It highlighted in this testing phase, not only the elements that are easier for students to understand the content of teaching materials, but also to see whether the teaching material is able to grow a thinking nature critically, creatively, encourage curiosity of students and provide a challenge for students. Testing experts latter is the design testing of teaching materials. The results obtained in this test is up to 74.29%.
Final stages of testing is to see the student's response after receiving and attempting to use this teaching material. On a limited scale test questionnaire to get a final score of 83%. In particular some aspects in the questionnaire which refers to the increase in mathematical literacy skills in students have shown positive results.
Through all score acquisitions described above, shows that the average score was above 60%. Therefore, when looking at the overall results obtained, and is supported by expert opinion, that the teaching material based approach to problem solving can improve students' mathematical literacy and showed good results.
CONCLUSIONS
Bandung, October 17th, 2015
Proceeding International Seminar on
Mathematics, Science, and Computer Science Education
14
M
After the various stages of development product in teaching materials based on problem solving, developers concluded that designing a printed teaching materials based on problem solving approach to improve mathematical literacy skills must consider some important things, mainly related to the content of teaching materials. Explanation of material contained in this resource should pay attention to the characteristics of problem solving. Illustration picture of real-world objects into quadrilaterals wake becomes important because it is able to clarify the teaching of material and indicates that the material have its application in real life students. Then, practice questions that are made should include indicators of literacy so that they can train and improve students' mathematical literacy.
Thus, the process of teaching materials testing conducted by three fields of experts, namely the test of a mathematician, education expert test, test and trial design experts also conducted limited to the junior high school students who serve as the main target of the development of teaching materials based problem solving. The final score of each test in which test mathematicians get a percentage of the final score at 81, 05%. Test education experts to get the final score of 82, 67%. Test design experts to get the final score of 74, 29%. Limited scale test to get a final score of 83%. Based on the overall score has been obtained from the testing process showed that the teaching material is very good and can improve the ability of junior high school students' mathematical literacy.
ACKNOWLEDGEMENT
I acknowledged Allah SWT, Rasulullah SAW, my parent, Kementrian Riset, Teknologi dan Pendidikan Tinggi, Postgraduate of Indonesia University of Education, and others who have helped in the preparation of this paper.
REFERENCES
[1]. Kilpatrick, J dkk. 2001. Adding it up: Helping Children Learn Mathematic. Washington DC: National Academic Press.
[2]. Pranoto, dkk. 2011. Program Matematika Sekolah Indonesia. Ringkasan Eksekutif. Tidak diterbitkan
[3]. Riduwan. 2008. Dasar-Dasar Statistika. Bandung: Alfabeta. [4]. Sugiyono. 2010. Metode Penelitian Pendidikan Pendekatan Kuantitatif, Kualitatif,
dan R&D. Bandung: Alfabeta. [5]. Tim Puslitjaknov. 2008. Metode Penelitian Pengembangan. Jakarta : Pusat
Penelitian Kebijakan Dan Inovasi Pendidikan Badan Penelitian Dan Pengembangan Departemen Pendidikan Nasional.
Bandung, October 17th, 2015
Proceeding International Seminar on
Mathematics, Science, and Computer Science Education
15
M
MATH-07025
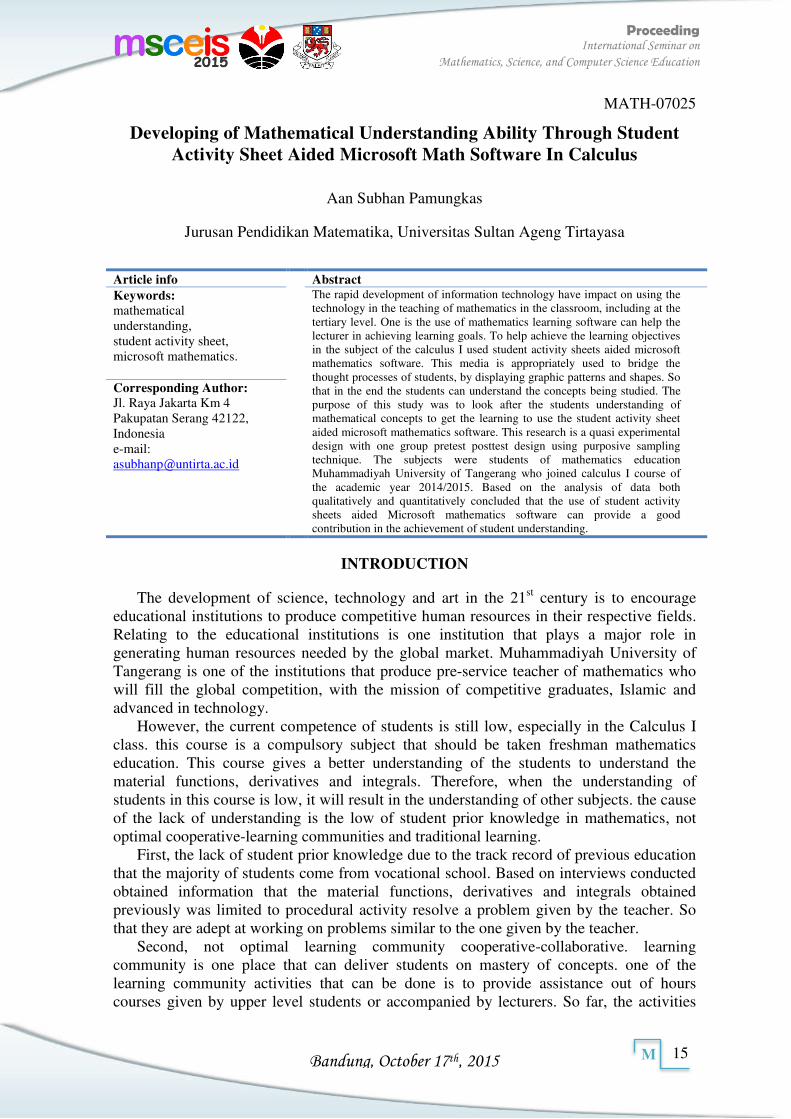
Developing of Mathematical Understanding Ability Through Student Activity Sheet Aided Microsoft Math Software In Calculus
Aan Subhan Pamungkas
Jurusan Pendidikan Matematika, Universitas Sultan Ageng Tirtayasa
Article info Abstract
Keywords: mathematical understanding, student activity sheet, microsoft mathematics.
The rapid development of information technology have impact on using the technology in the teaching of mathematics in the classroom, including at the tertiary level. One is the use of mathematics learning software can help the lecturer in achieving learning goals. To help achieve the learning objectives in the subject of the calculus I used student activity sheets aided microsoft mathematics software. This media is appropriately used to bridge the thought processes of students, by displaying graphic patterns and shapes. So that in the end the students can understand the concepts being studied. The purpose of this study was to look after the students understanding of mathematical concepts to get the learning to use the student activity sheet aided microsoft mathematics software. This research is a quasi experimental design with one group pretest posttest design using purposive sampling technique. The subjects were students of mathematics education Muhammadiyah University of Tangerang who joined calculus I course of the academic year 2014/2015. Based on the analysis of data both qualitatively and quantitatively concluded that the use of student activity sheets aided Microsoft mathematics software can provide a good contribution in the achievement of student understanding.
Corresponding Author: Jl. Raya Jakarta Km 4 Pakupatan Serang 42122, Indonesia e-mail: [email protected]
INTRODUCTION
The development of science, technology and art in the 21st century is to encourage educational institutions to produce competitive human resources in their respective fields. Relating to the educational institutions is one institution that plays a major role in generating human resources needed by the global market. Muhammadiyah University of Tangerang is one of the institutions that produce pre-service teacher of mathematics who will fill the global competition, with the mission of competitive graduates, Islamic and advanced in technology.
However, the current competence of students is still low, especially in the Calculus I class. this course is a compulsory subject that should be taken freshman mathematics education. This course gives a better understanding of the students to understand the material functions, derivatives and integrals. Therefore, when the understanding of students in this course is low, it will result in the understanding of other subjects. the cause of the lack of understanding is the low of student prior knowledge in mathematics, not optimal cooperative-learning communities and traditional learning.
First, the lack of student prior knowledge due to the track record of previous education that the majority of students come from vocational school. Based on interviews conducted obtained information that the material functions, derivatives and integrals obtained previously was limited to procedural activity resolve a problem given by the teacher. So that they are adept at working on problems similar to the one given by the teacher.
Second, not optimal learning community cooperative-collaborative. learning community is one place that can deliver students on mastery of concepts. one of the learning community activities that can be done is to provide assistance out of hours courses given by upper level students or accompanied by lecturers. So far, the activities
Bandung, October 17th, 2015
Proceeding International Seminar on
Mathematics, Science, and Computer Science Education
16
M
carried out in the community to learn yet still tentative regular or just ahead of the midterm and final exams.
Third, the study has been done on a calculus I course monotonous. Describes the activities carried out and doing exercises, this does not provide the opportunity for students to explore concepts independently or in groups. In addition, the study has not been integrated with ICT. So the impact is the use of learning resources that provide interactive information to help students on a good understanding of the concept is not optimal.
Learning by integrating ICT has the objective: (1) to build a knowledge based society habit like problem solving skills, communicating and processing information into new knowledge; (2) to develop the skills to use technology (ICT Literacy); and (3) to improve the effectiveness and efficiency of the learning process (Chaeruman, 2004).
As according to Philip (1997) the use of ICT in learning for the student to have a great power, namely: (1) Using multimedia technology, a variety of conventional media can be integrated into a single type of interactive media; (2) Allows users to browse the teaching materials, according to their ability and background knowledge possessed; (3) With the technology of animation, simulation and visualization computer, the user will get a more real information than the information that is abstract; (4) Has the potential to accommodate users with heterogeneous learning styles.
Improving the quality of learning, one of the ways that can be done is through the expansion of method and content, as well as integrating ICT in learning. As the opinion of Selwyn & Gordar (2003) states that the use of ICT in educational institutions is an important and relevant to the development of the 21st century to improve the quality of teaching calculus I, one of the efforts that could be made and relevant to current technological developments is the use of student activity aided microsoft mathematics software as an innovative learning in calculus I.
Learning to use of this media apart of computer assisted learning. Computer assisted learning has an important role in conveying abstract concepts in mathematics. This is consistent with the advantages of the computer including the ability to work on mathematical models of physical systems faced and the ability to present the results of the model with nice graphics and clear (Suparno, 1998).
Student activity sheets aided mathematic Microsoft software as one of the conceptual change strategy to help explore mathematical concepts in the minds of students through exploration activities software. Learning with the help of Microsoft Math software settings relative mathematic enough in reducing misconceptions students, as well as optimizing the effectiveness and efficiency of the implementation of the exploration of the material can be carried out accurately and real. Sketching of Graphic manually sometimes makes the learning ineffective and takes a relatively long time. In addition, a graphical representation inaccuracy will lead to misconceptions. So the presence of this software can help optimize learning and eliminate misconceptions.
The above statement in accordance with the opinion of the following: (1) Porzio (1995) which states that students who use visual computer program “Mathematica”, has the ability to connect numbers, symbols and graphical representation is better than students who learn using traditional learning methods without simulation; (2) Yoong, WK (1998) excess graphics programs including developing the concept through an understanding of the relationship symbols, graphic and numerical, to reinforce concepts, to correct mistakes that often occur, to check the completion of graphically and analytically, to solve equations graphically, to search for the answers to the allegations of a problem, be metacognitive, to acquire computer skills and increase the motivation to learn.
From some of the above statements, it can be concluded that the use of graphics software can instill good understanding of the concept. So what is the problem in this
Bandung, October 17th, 2015
Proceeding International Seminar on
Mathematics, Science, and Computer Science Education
17
M
study is the low ability students mathematical understanding can be addressed optimally. The understanding is that most low skill levels compared with other skills, but the ability of understanding is the foundation for other skills. So as to achieve a higher capacity needs a good understanding capabilities. With a good understanding of the capabilities will be able to foster understanding of mathematical ability and mathematical ideas, such as: interpreting (interpreting), exemplifying (give examples), classifying (classify), summarizing (summarizing), inferring (suspect), Comparing (comparing) and explaining (explain) Anderson and Krathwohl (Kurniawan, 2010).
According Alfeld (Kurniawan, 2010) features one understands the math is: (1) Explain the mathematical concepts and facts in draft form and the fact that much simpler; (2) It easily can create a logical connection between the facts and concepts; (3) When to see something new concept (either inside or outside the mathematical concepts) then he can recognize its relevance to the concept that has been understood; (4) to identify that the mathematical principles relating to the world of work.
Therefore, an understanding of mathematical ability is a strength that must be considered and treated as functional in the process and learning objectives of mathematics. This can be done through the study of mathematics significantly.
Based on the above background problems, formulation of the problem in this research is "Is there a difference in understanding mathematical ability of students before and after getting learning by using student activity sheets aided microsoft mathematics software ?".
METHOD
This study is a quasi experimental study that consists of one group of research is experimental class. The study design using the design of experiment one group pretest posttest (Ruseffendi, 2005: 52) the following:
Experiment: O X O O : Pretest and posttest X : Students Activity Sheets aided Microsoft Mathematics Software The population in this study were all students of Muhammadiyah University of
Tangerang Mathematics Education. While the research sample is short semester students who signed the calculus I course of the academic year 2014/2015. The research sample is determined by purposive sampling. To obtain the data in this study, the instrument used in the test which tests the ability of understanding the description. The indicator measured the ability of mathematical understanding is as follows: 1. Be able to apply a concept to the calculation routine/simple, algorithmic or doing
something alone. 2. Linking one concept to another, or estimate a truth without hesitation.
RESULTS AND DISCUSSION
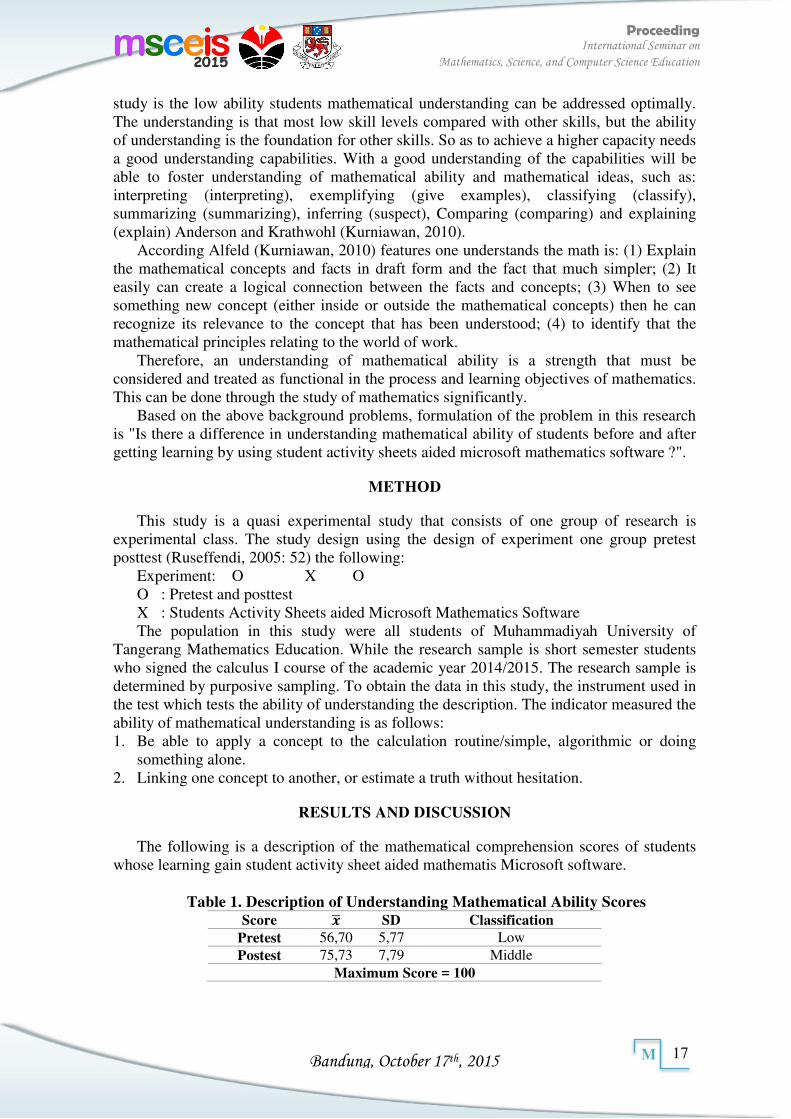
The following is a description of the mathematical comprehension scores of students whose learning gain student activity sheet aided mathematis Microsoft software.
Table 1. Description of Understanding Mathematical Ability Scores
Score � SD Classification Pretest 56,70 5,77 Low Postest 75,73 7,79 Middle
Maximum Score = 100
Bandung, October 17th, 2015
Proceeding International Seminar on
Mathematics, Science, and Computer Science Education
18
M
Based on the table above, it appears that early ability of understanding mathematical ability of students is still low, the which is the average of 56.70. But after a given learning by using student activity sheets aided Microsoft mathematics software, mathematical understanding abilities of students end Increased the quality of the low category into the category of being or the average of 75.73.
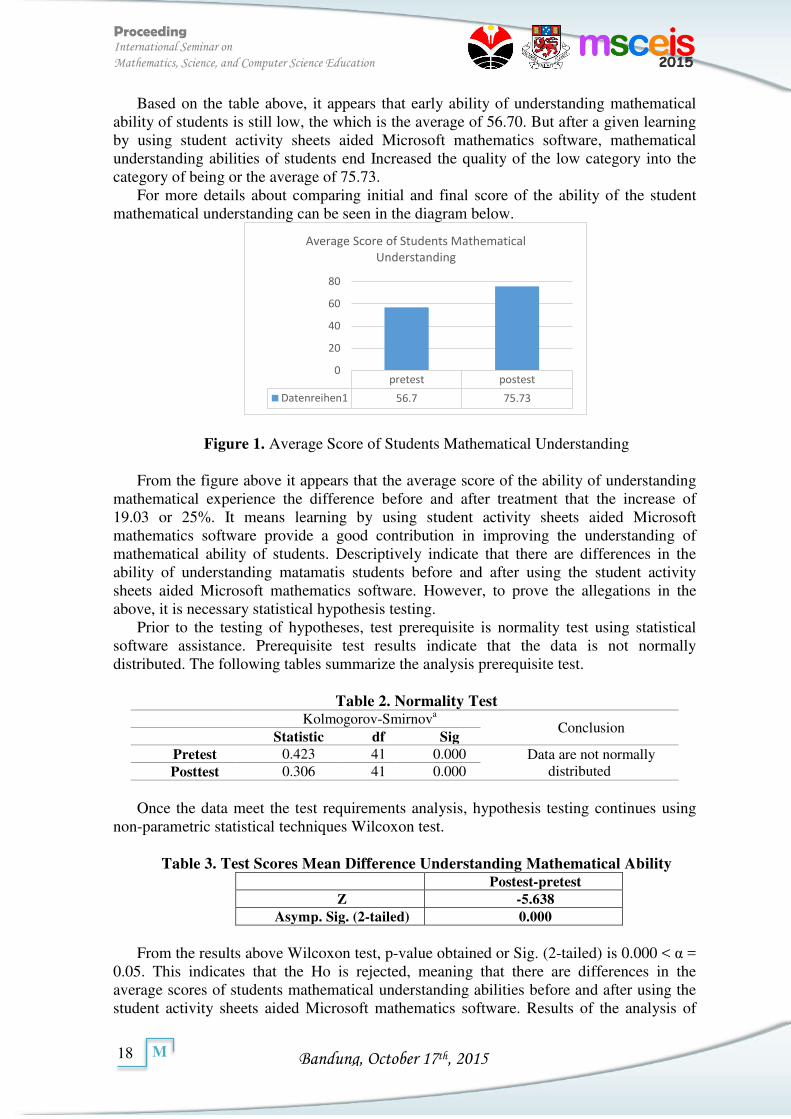
For more details about comparing initial and final score of the ability of the student mathematical understanding can be seen in the diagram below.
Figure 1. Average Score of Students Mathematical Understanding
From the figure above it appears that the average score of the ability of understanding mathematical experience the difference before and after treatment that the increase of 19.03 or 25%. It means learning by using student activity sheets aided Microsoft mathematics software provide a good contribution in improving the understanding of mathematical ability of students. Descriptively indicate that there are differences in the ability of understanding matamatis students before and after using the student activity sheets aided Microsoft mathematics software. However, to prove the allegations in the above, it is necessary statistical hypothesis testing.
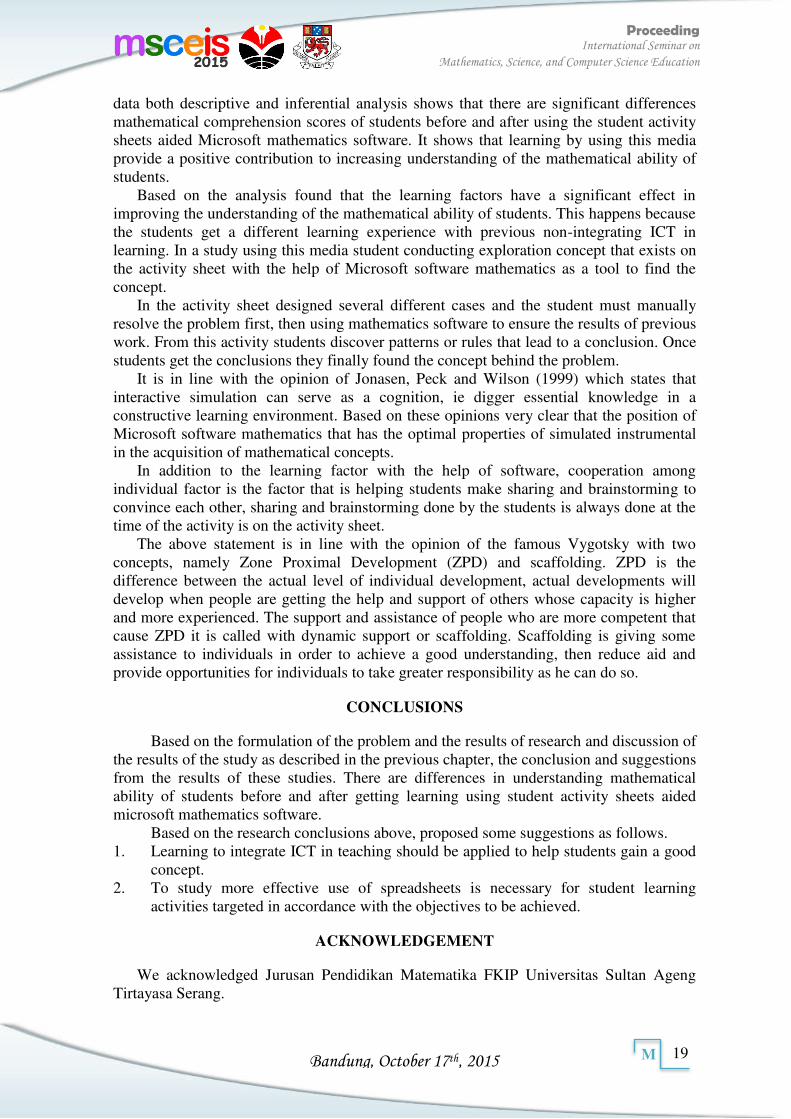
Prior to the testing of hypotheses, test prerequisite is normality test using statistical software assistance. Prerequisite test results indicate that the data is not normally distributed. The following tables summarize the analysis prerequisite test.
Table 2. Normality Test
Kolmogorov-Smirnova Conclusion
Statistic df Sig
Pretest 0.423 41 0.000 Data are not normally distributed Posttest 0.306 41 0.000
Once the data meet the test requirements analysis, hypothesis testing continues using
non-parametric statistical techniques Wilcoxon test.
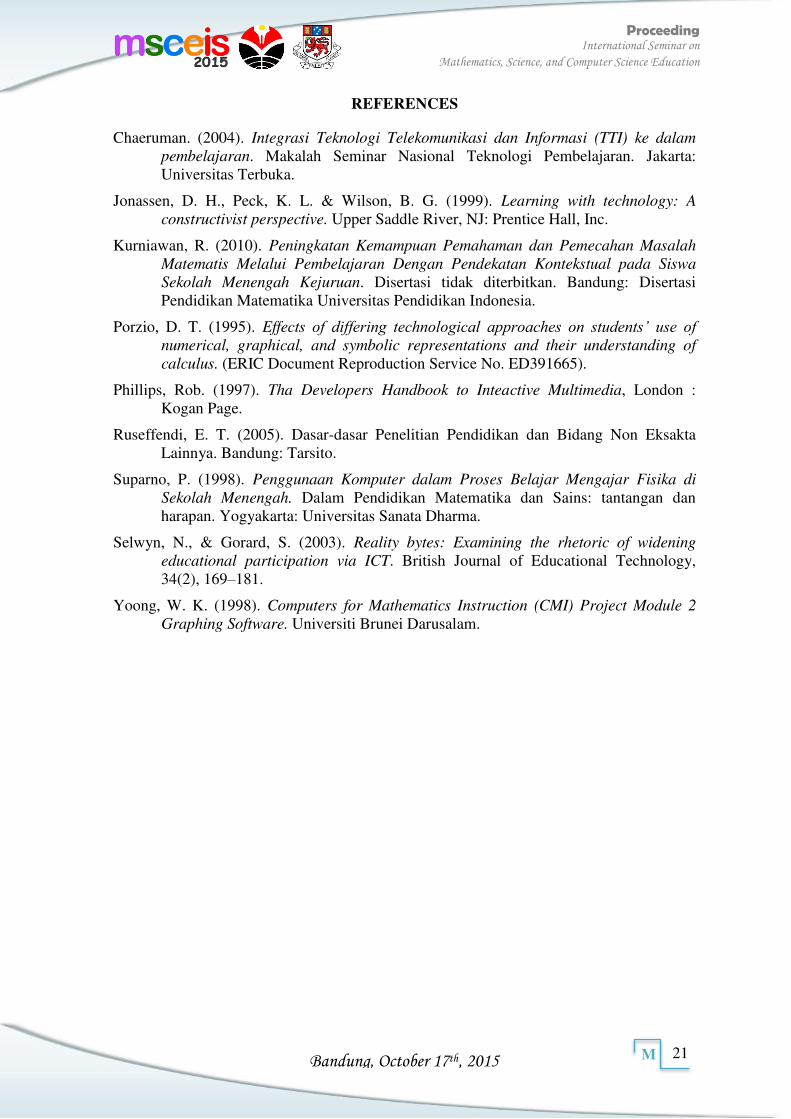
Table 3. Test Scores Mean Difference Understanding Mathematical Ability Postest-pretest
Z -5.638
Asymp. Sig. (2-tailed) 0.000
From the results above Wilcoxon test, p-value obtained or Sig. (2-tailed) is 0.000 < α =
0.05. This indicates that the Ho is rejected, meaning that there are differences in the average scores of students mathematical understanding abilities before and after using the student activity sheets aided Microsoft mathematics software. Results of the analysis of
pretest postest
Datenreihen1 56.7 75.73
0
20
40
60
80
Average Score of Students Mathematical
Understanding
Bandung, October 17th, 2015
Proceeding International Seminar on
Mathematics, Science, and Computer Science Education
19
M
data both descriptive and inferential analysis shows that there are significant differences mathematical comprehension scores of students before and after using the student activity sheets aided Microsoft mathematics software. It shows that learning by using this media provide a positive contribution to increasing understanding of the mathematical ability of students.
Based on the analysis found that the learning factors have a significant effect in improving the understanding of the mathematical ability of students. This happens because the students get a different learning experience with previous non-integrating ICT in learning. In a study using this media student conducting exploration concept that exists on the activity sheet with the help of Microsoft software mathematics as a tool to find the concept.
In the activity sheet designed several different cases and the student must manually resolve the problem first, then using mathematics software to ensure the results of previous work. From this activity students discover patterns or rules that lead to a conclusion. Once students get the conclusions they finally found the concept behind the problem.
It is in line with the opinion of Jonasen, Peck and Wilson (1999) which states that interactive simulation can serve as a cognition, ie digger essential knowledge in a constructive learning environment. Based on these opinions very clear that the position of Microsoft software mathematics that has the optimal properties of simulated instrumental in the acquisition of mathematical concepts.
In addition to the learning factor with the help of software, cooperation among individual factor is the factor that is helping students make sharing and brainstorming to convince each other, sharing and brainstorming done by the students is always done at the time of the activity is on the activity sheet.
The above statement is in line with the opinion of the famous Vygotsky with two concepts, namely Zone Proximal Development (ZPD) and scaffolding. ZPD is the difference between the actual level of individual development, actual developments will develop when people are getting the help and support of others whose capacity is higher and more experienced. The support and assistance of people who are more competent that cause ZPD it is called with dynamic support or scaffolding. Scaffolding is giving some assistance to individuals in order to achieve a good understanding, then reduce aid and provide opportunities for individuals to take greater responsibility as he can do so.
CONCLUSIONS
Based on the formulation of the problem and the results of research and discussion of the results of the study as described in the previous chapter, the conclusion and suggestions from the results of these studies. There are differences in understanding mathematical ability of students before and after getting learning using student activity sheets aided microsoft mathematics software.
Based on the research conclusions above, proposed some suggestions as follows. 1. Learning to integrate ICT in teaching should be applied to help students gain a good
concept. 2. To study more effective use of spreadsheets is necessary for student learning
activities targeted in accordance with the objectives to be achieved.
ACKNOWLEDGEMENT
We acknowledged Jurusan Pendidikan Matematika FKIP Universitas Sultan Ageng Tirtayasa Serang.

Bandung, October 17th, 2015
Proceeding International Seminar on
Mathematics, Science, and Computer Science Education
20
M
Bandung, October 17th, 2015
Proceeding International Seminar on
Mathematics, Science, and Computer Science Education
21
M
REFERENCES
Chaeruman. (2004). Integrasi Teknologi Telekomunikasi dan Informasi (TTI) ke dalam
pembelajaran. Makalah Seminar Nasional Teknologi Pembelajaran. Jakarta: Universitas Terbuka.
Jonassen, D. H., Peck, K. L. & Wilson, B. G. (1999). Learning with technology: A
constructivist perspective. Upper Saddle River, NJ: Prentice Hall, Inc.
Kurniawan, R. (2010). Peningkatan Kemampuan Pemahaman dan Pemecahan Masalah
Matematis Melalui Pembelajaran Dengan Pendekatan Kontekstual pada Siswa
Sekolah Menengah Kejuruan. Disertasi tidak diterbitkan. Bandung: Disertasi Pendidikan Matematika Universitas Pendidikan Indonesia.
Porzio, D. T. (1995). Effects of differing technological approaches on students’ use of numerical, graphical, and symbolic representations and their understanding of
calculus. (ERIC Document Reproduction Service No. ED391665).
Phillips, Rob. (1997). Tha Developers Handbook to Inteactive Multimedia, London : Kogan Page.
Ruseffendi, E. T. (2005). Dasar-dasar Penelitian Pendidikan dan Bidang Non Eksakta Lainnya. Bandung: Tarsito.
Suparno, P. (1998). Penggunaan Komputer dalam Proses Belajar Mengajar Fisika di
Sekolah Menengah. Dalam Pendidikan Matematika dan Sains: tantangan dan harapan. Yogyakarta: Universitas Sanata Dharma.
Selwyn, N., & Gorard, S. (2003). Reality bytes: Examining the rhetoric of widening
educational participation via ICT. British Journal of Educational Technology, 34(2), 169–181.
Yoong, W. K. (1998). Computers for Mathematics Instruction (CMI) Project Module 2
Graphing Software. Universiti Brunei Darusalam.
Bandung, October 17th, 2015
Proceeding International Seminar on
Mathematics, Science, and Computer Science Education
22
M
MATH-07045
A Study of Correlation between Learning Interest of Student on Math Subject and Their Learning Achievement
Anggit Reviana, Dewi Agustyani
School of Postgraduate Study, Indonesia University of Education
Article info Abstract
Keywords: learning interest, learning achievement, math subject, correlation.
Students may differ in their individual learning interest. On the other hand, learning interest of students on math subject might correlate with their achievement. This research aimed to examine whether learning interest of students on math subject positively correlated with their learning achievement. This study was conducted in a junior high school and the subjects were year seventh students. Sample were selected using cluster random sampling technique. Two classes were recruited and each class consisted of 30 students from a total of 170 students. Data of the learning achievement were collected through documentation and data of the learning interest on math subject were gathered through questionnaire. The normality and linearity of the data were adjusted and a Pearson’s correlation analysis was employed, using SPSS. Result showed that there was a positive correlation between learning interest of students on math subject and their learning achievement (R: 0.514, P<0.01). This study suggests that supplying the teacher with information concerning learning interest of students might improve student learning achievement.
Corresponding Author: Anggit Reviana [email protected]
INTRODUCTION
Students tend to regard that math is difficult to learn, students tend to think that learning mathematics only need to memorize math formulas. When the students just memorize formulas without understanding the concept, it is possible students have difficulties in understanding the further material, of course it cause effect on their learning achievement. In addition such factors may influence the learning achievement. Those factors can come from the individual itself or others outside the individual such as teaching method, learning environment, parent background, etc. Researchs aimed to find out factors that affect learning achievement were widely conducted. One of issues that attracted researcher’s attention was interest.
Wu (cited in Lee, Chao, & Chen, 2011) explained, sparking students’ interest in learning and encouraging them to spend more time on school work is currently a problem faced by all teachers. A teacher’s good attitude, in particular, plays an integral part in the effort to improve learning outcomes or teaching efficacy when students are unwilling to participate in class. Sriklaub and Wongwanich (2014) analyzed learning activities aimed at promoting student’ interest, a synthesis of master teachers’activity organizing methods via TV media. Li and Pan (2009) conducted a survey in English major that reveal Interest plays an extremely important role in study and high achievers have a strong sense of achievement. In addition, Vasile (2011) concluded, the cognitive approach should be enriched with major aspects from the global human psychological system like interests/motivation, emotional profile, attitudes and so on. Wang, Wu, Yu, & Lin (2015) explored the influence of implementing inquiry-based instruction on science-learning
Bandung, October 17th, 2015
Proceeding International Seminar on
Mathematics, Science, and Computer Science Education
23
M
motivation and interest. Lee et al (2014) supported the teacher’ charisma has a positive influence on inducing the student’learning interest.
Subramaniam (2009) highlighted the power of interest on student engagement and learning, his research revealed that situational interest can be enhanced through manipulation on the learning environment and contextual factors such as teaching strategis, task presentation and structuring of learning experiences. Hidi (2001) explained the issue of the effect of interest on readers’comprehension and learning, the variables that determine readers’interest and the specific processes such as attention that may mediate the effect of interest on learning. Hidi (cited in Hidi, 2001) further acknowledged that interest may be elicited not only by text features, but by other aspects of a situation. Thus, a person’s interest can also be triggered by a visual stimulus such as a play object, or viewing a picture, an auditory stimulus such as hearing a conversation, or a combination of visual and auditory stimuli like a TV show.
In math, students are dealt with symbols, formulas, objects, pictures and systematical procedures for solving many problems. Thus, according to Hidi’ opinion, learning interest of student on math subject might have strong relationship with their learning achievement. In addition, related researchs were widely focusing on interest of student in reading, physics, english, social and behavioral science. There was lack of focusing on math subject. Started from this idea, the author aimed to examine whether learning interest of student on math subject positively correlate with their learning achievement. Statement of the Research Problem
The problem to be addressed in this research is to determine whether learning interest of 7th grade students positively correlate with their learning achievement. Purpose of the Study
The purpose of this study is to provide a correlation between learning interest of 7th grade students with their learning achievement, especially on math subject. Research Questions
In line with the purpose of the study, this research attempts to answer the following question:
Is there a positive correlation between learning interest of 7th grade students on math subject and their learning achievement? Hypothesis
The hypothesis of this study is “there is a positive correlation between learning interest of 7th grade students on math subject and their learning achievement” Limitations of the Study
This study was limited to the quality of data obtained from the school. The quality and consistency of data received from the school were out of researcher’s control, and it was assumed that the data was accurate. The population of this study is limited to 7th grade students in SMP Negeri 16 Surakarta. There was no consideration of the various method of teaching that teacher use. Because the length of this research was limited to the researcher’s capability, learning achievement of student was measured from one subject matter, that was whole number.
METHOD
Research Design This study was non-experimental because the researcher did not manipulate any
variables in this study (Fraenkel, Wallen, & Hyun, 2011). The design of this study was correlational design.
Bandung, October 17th, 2015
Proceeding International Seminar on
Mathematics, Science, and Computer Science Education
24
M
Site and Participants This study was held in junior high school. Population is the group of individuals
having one characteristics that distinguishes them from others grup (Creswell, 2012). The population of this study was 7th grade student of SMP Negeri 16 Surakarta. Samples were selected using cluster random sampling technique. Cluster random sampling is similar to simple random sampling except that groups rather than individuals are randomly selected (that is, the sampling unit is a group rather than an individual). The advantages of cluster random sampling are that it can be used when it is difficult or impossible to select a random sample of individuals (Fraenkel, Wallen, & Hyun ,2011). Two classes were recruited. Each class consist of 30 students from a total of 170 students. Data Collection
Data were collected through documentation for learning achievement and questionnaire for learning interest on math subject. The questionnaires were validated by two teachers and one lecturer before were tried out to ensure its consistency and reliability. Consistency of the questionnaires was measured using Moment Product Formula ( = 0.83). Reliability was measured using Cronbach Alpha Formula (r11 = 0.72 ). 28 items from a total of 32 items were obtained. Then, targeted students were given the questionnaires. Each student was told to respond to the statements of the questionnaire using four point Likert scale. There were two types of question, namely positive questions and negative questions. For each item with positive question, if student choose A then he get 4 points, B 3 points, C 2 points, D one point and for negative question was weighted in the reverse order. Student learning interest score was sum of all these weights. Data for learning achievement was the student’s score in mathematics examination, that was in whole number subject matter. Data Analyses
Then the normality and linearity of the data were adjusted using SPSS. Since the normality and linearity test were fulfilled, then, a Pearson’s correlation analysis was employed, using SPSS. The significance level was established at the .01 level, one tailed test.
RESULTS AND DISCUSSION
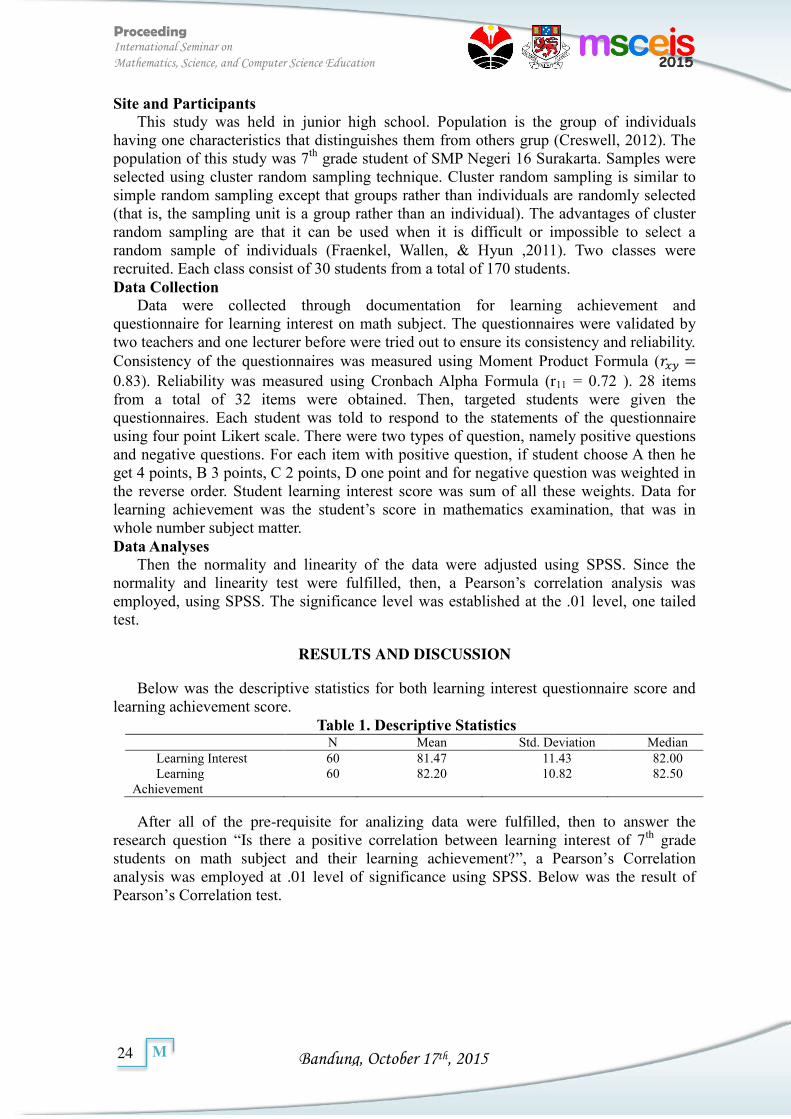
Below was the descriptive statistics for both learning interest questionnaire score and learning achievement score.
Table 1. Descriptive Statistics N Mean Std. Deviation Median Learning Interest 60 81.47 11.43 82.00 Learning
Achievement 60 82.20 10.82 82.50
After all of the pre-requisite for analizing data were fulfilled, then to answer the research question “Is there a positive correlation between learning interest of 7th grade students on math subject and their learning achievement?”, a Pearson’s Correlation analysis was employed at .01 level of significance using SPSS. Below was the result of Pearson’s Correlation test.
Bandung, October 17th, 2015
Proceeding International Seminar on
Mathematics, Science, and Computer Science Education
25
M
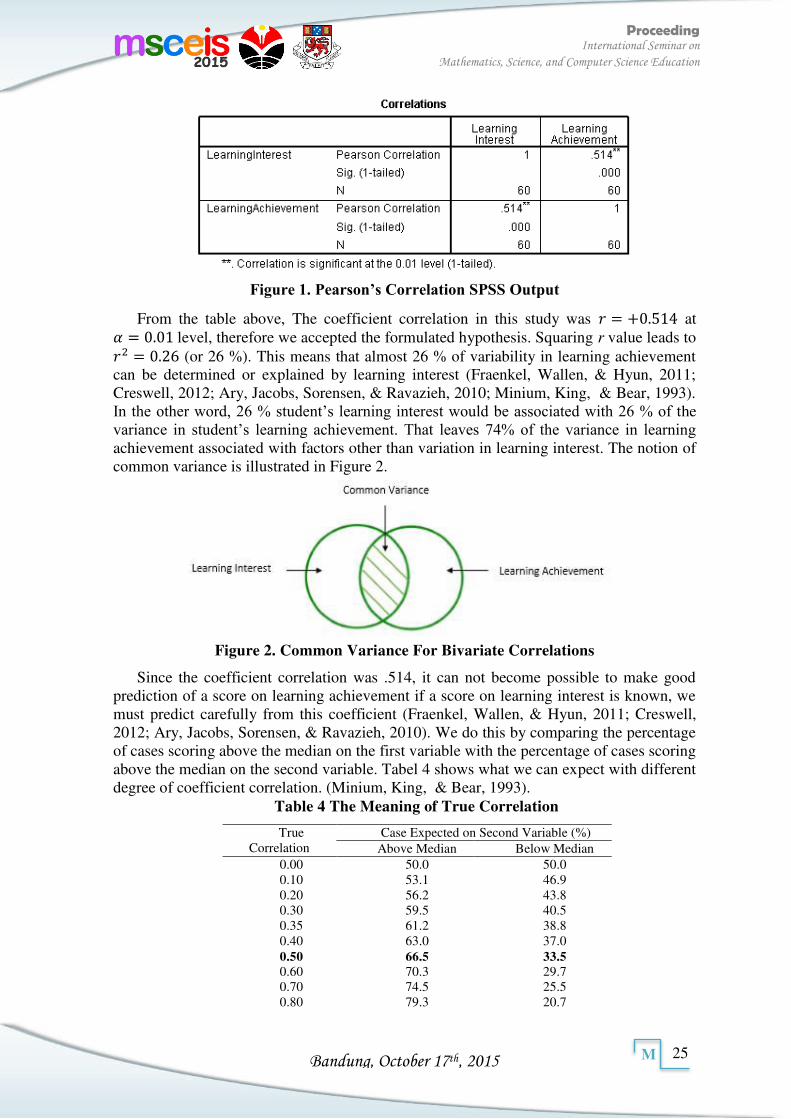
Figure 1. Pearson’s Correlation SPSS Output
From the table above, The coefficient correlation in this study was = + . at = . level, therefore we accepted the formulated hypothesis. Squaring r value leads to = . (or 26 %). This means that almost 26 % of variability in learning achievement can be determined or explained by learning interest (Fraenkel, Wallen, & Hyun, 2011; Creswell, 2012; Ary, Jacobs, Sorensen, & Ravazieh, 2010; Minium, King, & Bear, 1993). In the other word, 26 % student’s learning interest would be associated with 26 % of the variance in student’s learning achievement. That leaves 74% of the variance in learning achievement associated with factors other than variation in learning interest. The notion of common variance is illustrated in Figure 2.
Figure 2. Common Variance For Bivariate Correlations
Since the coefficient correlation was .514, it can not become possible to make good prediction of a score on learning achievement if a score on learning interest is known, we must predict carefully from this coefficient (Fraenkel, Wallen, & Hyun, 2011; Creswell, 2012; Ary, Jacobs, Sorensen, & Ravazieh, 2010). We do this by comparing the percentage of cases scoring above the median on the first variable with the percentage of cases scoring above the median on the second variable. Tabel 4 shows what we can expect with different degree of coefficient correlation. (Minium, King, & Bear, 1993).
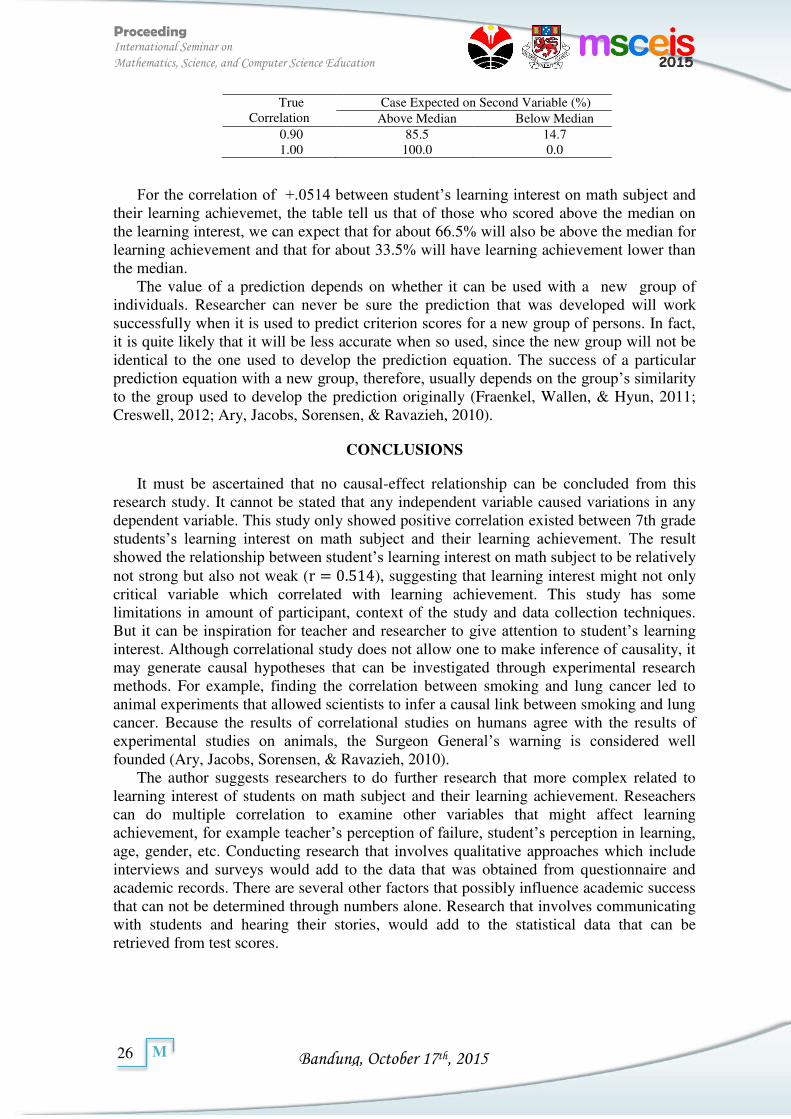
Table 4 The Meaning of True Correlation
True Correlation
Case Expected on Second Variable (%) Above Median Below Median
0.00 50.0 50.0 0.10 53.1 46.9 0.20 56.2 43.8 0.30 59.5 40.5 0.35 61.2 38.8 0.40 63.0 37.0 0.50 66.5 33.5 0.60 70.3 29.7 0.70 74.5 25.5 0.80 79.3 20.7
Bandung, October 17th, 2015
Proceeding International Seminar on
Mathematics, Science, and Computer Science Education
26
M
True Correlation
Case Expected on Second Variable (%) Above Median Below Median
0.90 85.5 14.7 1.00 100.0 0.0
For the correlation of +.0514 between student’s learning interest on math subject and their learning achievemet, the table tell us that of those who scored above the median on the learning interest, we can expect that for about 66.5% will also be above the median for learning achievement and that for about 33.5% will have learning achievement lower than the median.
The value of a prediction depends on whether it can be used with a new group of individuals. Researcher can never be sure the prediction that was developed will work successfully when it is used to predict criterion scores for a new group of persons. In fact, it is quite likely that it will be less accurate when so used, since the new group will not be identical to the one used to develop the prediction equation. The success of a particular prediction equation with a new group, therefore, usually depends on the group’s similarity to the group used to develop the prediction originally (Fraenkel, Wallen, & Hyun, 2011; Creswell, 2012; Ary, Jacobs, Sorensen, & Ravazieh, 2010).
CONCLUSIONS
It must be ascertained that no causal-effect relationship can be concluded from this research study. It cannot be stated that any independent variable caused variations in any dependent variable. This study only showed positive correlation existed between 7th grade students’s learning interest on math subject and their learning achievement. The result showed the relationship between student’s learning interest on math subject to be relatively not strong but also not weak (� = . ), suggesting that learning interest might not only critical variable which correlated with learning achievement. This study has some limitations in amount of participant, context of the study and data collection techniques. But it can be inspiration for teacher and researcher to give attention to student’s learning interest. Although correlational study does not allow one to make inference of causality, it may generate causal hypotheses that can be investigated through experimental research methods. For example, finding the correlation between smoking and lung cancer led to animal experiments that allowed scientists to infer a causal link between smoking and lung cancer. Because the results of correlational studies on humans agree with the results of experimental studies on animals, the Surgeon General’s warning is considered well founded (Ary, Jacobs, Sorensen, & Ravazieh, 2010).
The author suggests researchers to do further research that more complex related to learning interest of students on math subject and their learning achievement. Reseachers can do multiple correlation to examine other variables that might affect learning achievement, for example teacher’s perception of failure, student’s perception in learning, age, gender, etc. Conducting research that involves qualitative approaches which include interviews and surveys would add to the data that was obtained from questionnaire and academic records. There are several other factors that possibly influence academic success that can not be determined through numbers alone. Research that involves communicating with students and hearing their stories, would add to the statistical data that can be retrieved from test scores.

Bandung, October 17th, 2015
Proceeding International Seminar on
Mathematics, Science, and Computer Science Education
27
M
REFERENCES
Ary, Donald., Jacobs, Lucy Cheser., Sorensen, Chris., & Ravazieh, Asghar. (2010). Introduction to Research in Education Eight Edition. USA : Wadsworth Cengage Learning
Chamorro-Premuzic, T. & Furnham, A. (2003). Personality predicts academic performance: Evidence from two longitudinal university samples. Journal of
Research in Personality, 37(4), 319-338.
Creswell, John W. (2012). Educational Research Fourth Edition. Boston : Pearson Education Inc.
Driesel, Deborah Walker. (2013). Mathematics Interventions: A Correlational Study of The Relationship between Level of Implementation of The Accelerated Math program and Student Achievement. Dissertation. :Liberty University.
Duff, A., Boyle, E., Dunleavy, K., & Ferguson, J. (2004). The relationship between personality, approach to learning and academic performance. Personality and Individual Differences, 36, 1907-1920.
Fakeye, David O. (2014). English Language Proficiency as a Predictor of Academic Achievement among EFL Students in Nigeria. Journal of Education and Practice, 5 No.9, 38-41.
Fraenkel, Jack R., Wallen, Norman E., & Hyun, Helen. (2012). How to Design and
Evaluate Research in Education Eight Edition. United States of America : The McGraw-Hill Companies
Hidi, Suzanne. (2001) Interest, Reading, and Learning: Theoretical and Practical Considerations. Educational Psychology Review, 13 No 3, 191-209
http://dictionary.reference.com/browse/interest?s=t
Lee, De-Chih., et al. (2014). Does Teachers Charisma Can Really Induce Students Learning Interest. Procedia Social and Behavioral Sciences, 116, 1143-1148.
Lee, Yu-Je., Chao, Chia-Hui., Chen, Ching Yaw. (2011). The Infuences of Interest in Learning and Learning Hours on Learning Outcomes of Vocational College Students in Taiwan: Using a Teacher’s Instructional Attitude as The Moderator. Global Journal of Engineering Education, 13 No.3, 140-153.
Li, Peipei., Pan, Guirong. (2009). A Relathionship between Motivation and Achievement: A Survey of the Study Motivation of English Majors in Qingdao Agricultural University. CCSE English Language Teaching, 2, 123-128. Retrieved from www.ccsenet.org/journal.html
Minium, Edward W., King, Bruce M., Bear, Gordon. (1993). Statictical Reasoning in Psychology and Education. Singapore : John Wiley & Sons Inc.
Rusyan, T., Kusdinar, A., & Arifin, Z. (1989). Pendekatan dalam Proses Belajar Mengajar. Bandung : CV Remadja Karya
Singer, K. (1987). Membina Hasrat Belajar di Sekolah. Bandung: Remaja Karya
Slameto. (1995). Belajar dan Faktor-Faktor yang Mempengaruhinya. Jakarta: Rineka Cipta.
Bandung, October 17th, 2015
Proceeding International Seminar on
Mathematics, Science, and Computer Science Education
28
M
Sriklaub, Kanit., Wongwanich, Suwimon. (2014). Learning Activities Aimed at Promoting Students’Interest: Synthesis of Master teachers’ Activity Organizing Methods via TV Media. Procedia Social and Behavioral Sciences, 116, 3375-3380.
Subramaniam, P.R. (2009). Motivational Effect of Interest on Student Engagement and Learning in Physical Edcation: A Review. International Journal of Physics
Education, 46 no2, 11-19.
Tirtonegoro, Dra. S. (1984). Anak Supernormal dan Program Pendidikannya. Jakarta : PT. Bina Aksara
Vasile, Cristian. (2011). Entry Points, Interest and Attitudes. An Integrative Approach of Learning. Procedia Social and Behavioral Sciences, 11, 77-81.
Wang, Pi-Hsia., Wu, Pai-Lu., Yu, ker-Wei., Lin, Yi-Xian. (2015). Influence of Impelementing Inquiry Based-Instruction on Science Learning Motivation And Interest: A Perspective of Comparison. Procedia Social and Behavioral Sciences, 174, 1292-1299.
Winkel, WS. (1996). Psikologi Pendidikan. Jakarta: Gramedia.
Bandung, October 17th, 2015
Proceeding International Seminar on
Mathematics, Science, and Computer Science Education
29
M
MATH-07065
The Role of Researchers to Improve Mathematical Literacy In Indonesia
Delsika Pramata Sari
Departemen Pendidikan Matematika, Universitas Pendidikan Indonesia
Article info Abstract
Keywords: the role of researchers, mathematical literacy in Indonesia.
Mathematics is a study that has an important role in daily life and the development of the world. An understanding of mathematics is needed to prepare the students for life in modern society. Indonesia has participated in the PISA since 2000 to determine the mathematical literacy achievement Indonesian students 15 years of age. If the position of Indonesia is compared to the other countries in mathematical literacy is still unsatisfying. Therefore, there are so many efforts of various parties to improve the quality of Indonesian students’ mathematical literacy, particularly among researchers in mathematics education.
Corresponding Author: Delsika Permata Sari Indonesia University of Education Jl. Dr. Setiabudi No. 229, Bandung 40154, Indonesia [email protected]
INTRODUCTION
Mathematics is a study that has an important role in daily life and the development of the world. An understanding of mathematics is needed to prepare the students for life in modern society. According to the Organisation for Economic Co-operation and
Development or OECD (2013), mathematics is a critical tool for young people as they confront issues and challenges in personal, occupational, societal, and scientific aspects of their lives. OECD (2013) in the draft PISA 2015 mathematics framework, defining that mathematical literacy is an individual’s capacity to formulate, employ, and interpret mathematics in a variety of contexts. It includes reasoning mathematically and using mathematical concepts, procedures, facts and tools to describe, explain and predict phenomena. It assists individuals to recognise the role that mathematics plays in the world and to make the well-founded judgments and decisions needed by constructive, engaged and reflective citizens. Thus, possess mathematical literacy is so important for the future of students and the development of the nation.
The aim of PISA with regard to mathematical literacy is to develop indicators that show how effectively countries are preparing students to use mathematics in every aspect of their personal, civic and professional lives, as part of their constructive, engaged and reflective citizenship (OECD, 2013). PISA (Programme for International Student
Assessment) is an international study that examined every three years on the mathematical literacy achievement of students aged 15 years, coordinated by the OECD is based in Paris, France (Balitbang,2011). This three-year program cycle carried out to obtain continuous information on the progress of student achievement over time.
Indonesia has participated in the PISA study since 2000. For Indonesia, the results of the PISA study can be used to compare student achievement Indonesia with other countries, interprovincial student achievement and kind of school, and can also be used for monitoring the quality of national education in a sustainable manner. Based on the results
Bandung, October 17th, 2015
Proceeding International Seminar on
Mathematics, Science, and Computer Science Education
30
M
of PISA 2012 report by the OECD (2014), Indonesia's position compared to other countries in mathematical literacy could be said to be worse, because it is in a position 64 of the 65 participating countries and are still unable to compete with Thailand in the 50th position and Malaysia in a position to 52.
The result of course is caused by many factors. The causes of low achievement of students' mathematical literacy Indonesia is a big question in education, especially the education of mathematics. This leads to a strong curiosity of many researchers to evaluate and improve students' mathematical literacy.
According to the Oxford Dictionary (2015), the research is the systematic investigation into and study of materials and sources in order to establish facts and reach new conclusions. People who do research are called researchers. The success of the research is highly dependent role of the researcher. The role of researchers in a study influenced by direct involvement in the range, tools, and procedures for proper research. This is the underlying researchers to solve problems, provide answers to questions about the low achievement of students' mathematical literacy Indonesia compared to other countries, and gain new knowledge on this subject.
Related to that, Drs. Firman Syah Noor, M. Pd (in Nurfuadah, 2013) explained, based on the TIMMS study conducted by Frederick K. S. Leung in 2003, the main cause of students' mathematical literacy index in Indonesia is very low due to the weak curriculum in Indonesia, lack of trained teachers in Indonesia, and lack of support from the neighborhood and school. Drs. Firman Syah Noor, M.Pd outlines, curriculum mathematics education in Indonesia does not emphasize on solving the problem, but on procedural matters, students are trained to memorize formulas, but did not master its application in solving a problem. In addition, the object of the teacher's subject matter also is incomplete when compared to the international curriculum, such as Cambridge, as well as the lack of use of calculators by students in Indonesia. He illustrates, abroad, the students do not need to memorize formulas as already provided in front of the class. In contrast, in Indonesia, it is emphasized to students memorize formulas and often prohibited from using calculators in the work on the problems.
Based on the above, it has become a very important need to develop research on mathematical literacy in Indonesia, then in this discussion paper on "The Role of Researchers to Improve Mathematical Literacy In Indonesia".
Mathematical Literacy in Indonesia
Transform PISA mathematical literacy principles into three components, namely components of content, process and context. A model of mathematical literacy in practice by the OECD (2013):
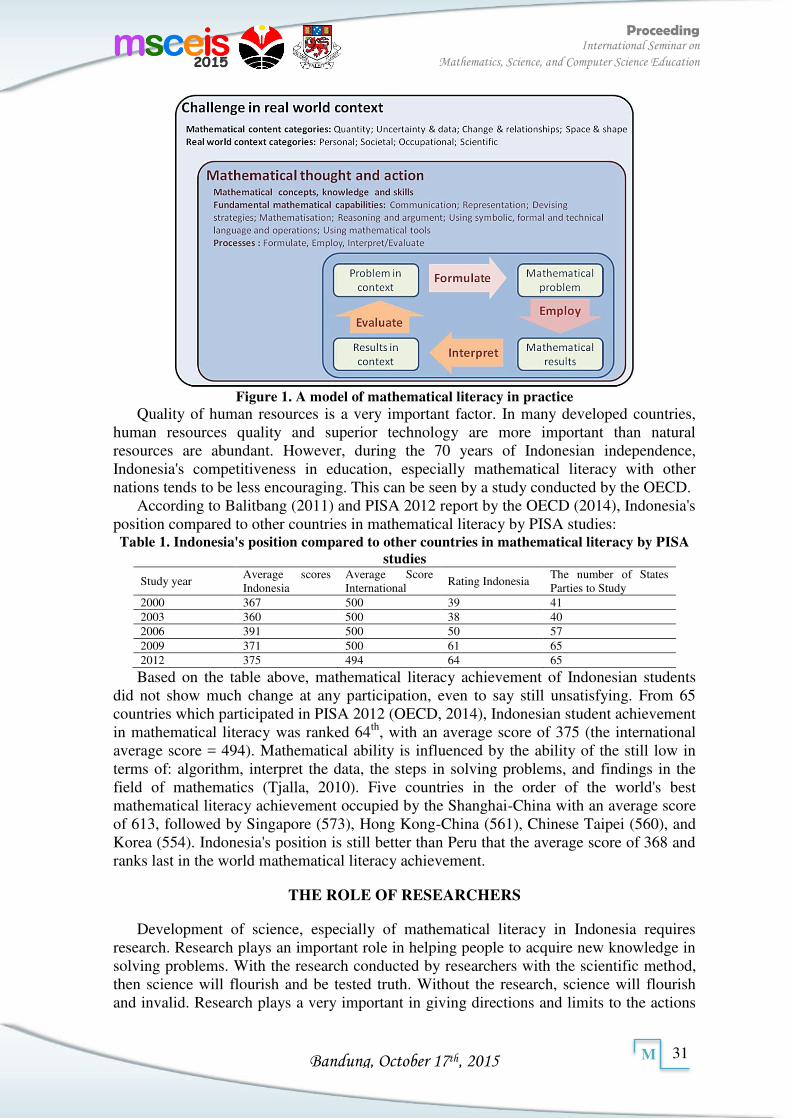
Bandung, October 17th, 2015
Proceeding International Seminar on
Mathematics, Science, and Computer Science Education
31
M
Figure 1. A model of mathematical literacy in practice
Quality of human resources is a very important factor. In many developed countries, human resources quality and superior technology are more important than natural resources are abundant. However, during the 70 years of Indonesian independence, Indonesia's competitiveness in education, especially mathematical literacy with other nations tends to be less encouraging. This can be seen by a study conducted by the OECD.
According to Balitbang (2011) and PISA 2012 report by the OECD (2014), Indonesia's position compared to other countries in mathematical literacy by PISA studies: Table 1. Indonesia's position compared to other countries in mathematical literacy by PISA
studies
Study year Average scores Indonesia
Average Score International
Rating Indonesia The number of States Parties to Study
2000 367 500 39 41 2003 360 500 38 40 2006 391 500 50 57 2009 371 500 61 65 2012 375 494 64 65
Based on the table above, mathematical literacy achievement of Indonesian students did not show much change at any participation, even to say still unsatisfying. From 65 countries which participated in PISA 2012 (OECD, 2014), Indonesian student achievement in mathematical literacy was ranked 64th, with an average score of 375 (the international average score = 494). Mathematical ability is influenced by the ability of the still low in terms of: algorithm, interpret the data, the steps in solving problems, and findings in the field of mathematics (Tjalla, 2010). Five countries in the order of the world's best mathematical literacy achievement occupied by the Shanghai-China with an average score of 613, followed by Singapore (573), Hong Kong-China (561), Chinese Taipei (560), and Korea (554). Indonesia's position is still better than Peru that the average score of 368 and ranks last in the world mathematical literacy achievement.
THE ROLE OF RESEARCHERS
Development of science, especially of mathematical literacy in Indonesia requires research. Research plays an important role in helping people to acquire new knowledge in solving problems. With the research conducted by researchers with the scientific method, then science will flourish and be tested truth. Without the research, science will flourish and invalid. Research plays a very important in giving directions and limits to the actions
Bandung, October 17th, 2015
Proceeding International Seminar on
Mathematics, Science, and Computer Science Education
32
M
and decisions in all aspects related to the problem to be solved, because it requires accurate data to support the theory and findings.
Based on that and the problems of education in Indonesia, the role of researchers in conducting research is so important in order to improve mathematical literacy in particular and the quality of national education in general. Discusses the achievements of Indonesian students' mathematical literacy course is part of the quality of education in Indonesia. Improvement of students' mathematical literacy is part of improving the quality of education in Indonesia. Hope to improve performance of mathematical literacy is approached every circle to meet the nation's development in various sectors.
In this case, the PISA international study that discussed the achievements of mathematical literacy OECD member countries illustrate the position of Indonesian students in comparison with other countries. From several studies, including research conducted by Aini (2013) states that learning using skills approach mathematical process provide a greater contribution to the improvement of literacy mathematical students compared to conventional learning, and research conducted by Nurhayati (2014) concluded that increased literacy mathematical students acquire learning with model-Eliciting Activities (MEAs) better than students who received conventional learning. The quasi-experimental research showed one of the efforts of researchers to improve students' mathematical literacy Indonesia. Of course, many researchers from various parties such as university students, teachers, professors, universities, and governments are trying to do research in order to improve students' mathematical literacy in Indonesia.
CONCLUSIONS
Quality human resources is a very important factor. Qualified human resources can only be created by improving the quality of national education. In this case, the mathematics is one of the sciences that have an important role in our daily lives and even development of the world. An understanding of mathematics is needed to prepare the students for life in modern society. Hope to improve performance of mathematical literacy is approached every circle to meet the nation's development in various sectors. Indonesia has participated in the PISA study since 2000. The aim of PISA with regard to mathematical literacy is to develop indicators that show how effectively countries are preparing students to use mathematics in every aspect of their personal, civic and professional lives, as part of their constructive, engaged and reflective citizenship.
For the realization of an advanced nation in various sectors, then Indonesia must prepare students for the future of himself and his country. The low literacy achievement of mathematical Indonesia compared to other countries has led many people strive to improve students' mathematical literacy, especially researchers. Researchers play an important role in the development of science and solving the problems faced by this nation. Researchers from various groups such as university students, teachers, professors, universities, governments, and others. The goal is to improve students' mathematical literacy Indonesia. Various studies conducted by researchers associated mathematical literacy achievement of students in Indonesia stating the cause of low mathematical literacy because of the weakness curriculum in Indonesia, lack of trained Indonesian teachers, and the lack of support from the neighborhood and school. This raises new hope for the nation to improve the curriculum that emphasizes problem solving, housekeeping material object lessons given teachers, training teachers, holding seminars, use of calculators as a tool to count, and others.
Bandung, October 17th, 2015
Proceeding International Seminar on
Mathematics, Science, and Computer Science Education
33
M
ACKNOWLEDGEMENT
Thanks to Allah and Muhammad, the Universe, and MSCEIS 2015, which paved the way and an opportunity for me to participate in this international seminar. To Universitas Pendidikan Indonesia and the lecturers of mathematics education graduate inspiring. To all my beloved family, whose support and encouragement to make my dreams come true. Because they all make me think, someday my name should be listed in a book and journal of science.
REFERENCES
Aini, I. N. (2013). Meningkatkan Literasi Matematis Siswa Melalui Pendekatan
Keterampilan Proses Matematis. Thesis Universitas Pendidikan Indonesia. Bandung: Unpublished.
Balitbang. (2011). Survei Internasional PISA: PISA (Programme for International Student
Assessment). Retrived from http://litbang.kemdikbud.go.id/index.php/survei-internasional-pisa.
Nurfuadah, R. N. Penyebab Indeks Matematika Siswa RI Terendah di Dunia. (2013, Januari 8). Okezone Online. Retrieved Mei 17, 2015, from: http://news.okezone.com/read/2013/01/08/373/743021/penyebab-indeks-matematika-siswa-ri-terendah-di-dunia.
Nurhayati, I. N. (2014). Meningkatkan Literasi Matematis Siswa Sekolah Menengah
Pertama dengan Menggunakan Pendekatan Pembelajaran Model-Eliciting
Activities. Thesis Universitas Pendidikan Indonesia. Bandung: Unpublished.
OECD. (2013). Draft PISA 2015 Mathematics Framework. Paris, France: OECD.
OECD. (2014). PISA 2012 Results In Focus: What 15-Year-Olds Know And What They
Can Do With What They Know. Paris, France: OECD.
-----. (2015). Oxford dictionaries. Retrived from http://www.oxforddictionaries.com/definition/english/research
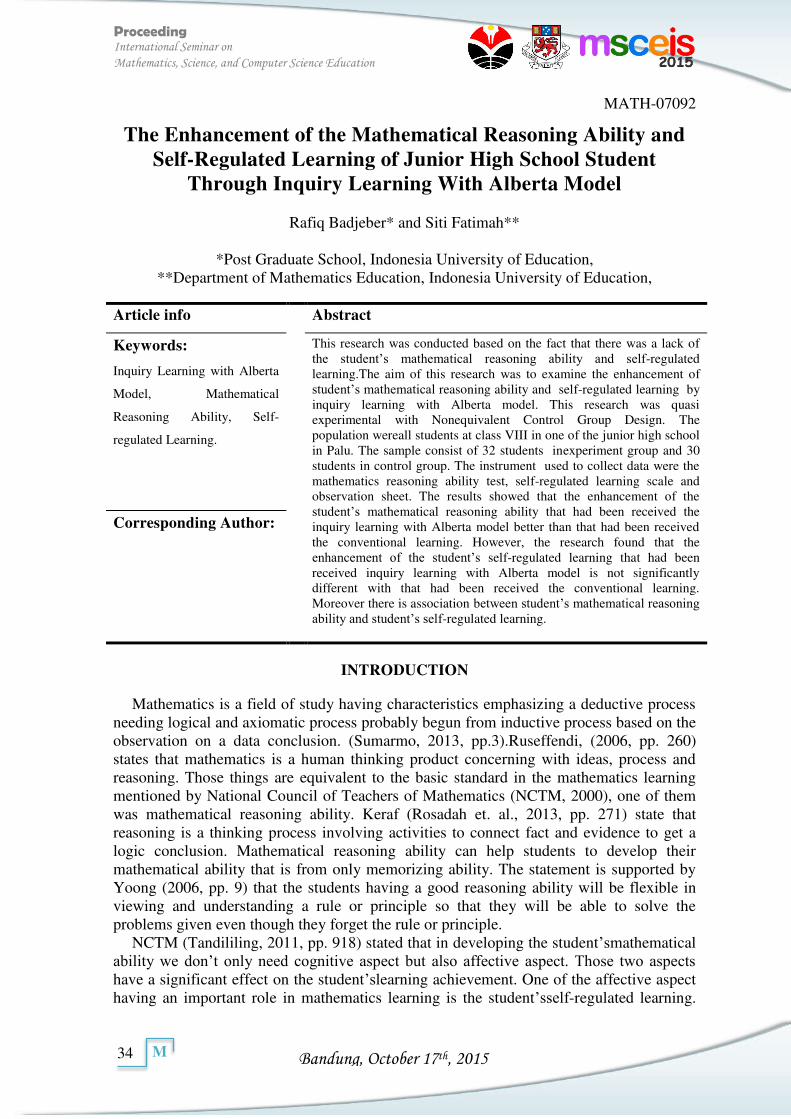
Bandung, October 17th, 2015
Proceeding International Seminar on
Mathematics, Science, and Computer Science Education
34
M
MATH-07092
The Enhancement of the Mathematical Reasoning Ability and Self-Regulated Learning of Junior High School Student
Through Inquiry Learning With Alberta Model
Rafiq Badjeber* and Siti Fatimah**
*Post Graduate School, Indonesia University of Education, **Department of Mathematics Education, Indonesia University of Education,
Article info Abstract
Keywords:
Inquiry Learning with Alberta
Model, Mathematical
Reasoning Ability, Self-
regulated Learning.
This research was conducted based on the fact that there was a lack of the student’s mathematical reasoning ability and self-regulated learning.The aim of this research was to examine the enhancement of student’s mathematical reasoning ability and self-regulated learning by inquiry learning with Alberta model. This research was quasi experimental with Nonequivalent Control Group Design. The population wereall students at class VIII in one of the junior high school in Palu. The sample consist of 32 students inexperiment group and 30 students in control group. The instrument used to collect data were the mathematics reasoning ability test, self-regulated learning scale and observation sheet. The results showed that the enhancement of the student’s mathematical reasoning ability that had been received the inquiry learning with Alberta model better than that had been received the conventional learning. However, the research found that the enhancement of the student’s self-regulated learning that had been received inquiry learning with Alberta model is not significantly different with that had been received the conventional learning. Moreover there is association between student’s mathematical reasoning ability and student’s self-regulated learning.
Corresponding Author:
INTRODUCTION
Mathematics is a field of study having characteristics emphasizing a deductive process needing logical and axiomatic process probably begun from inductive process based on the observation on a data conclusion. (Sumarmo, 2013, pp.3).Ruseffendi, (2006, pp. 260) states that mathematics is a human thinking product concerning with ideas, process and reasoning. Those things are equivalent to the basic standard in the mathematics learning mentioned by National Council of Teachers of Mathematics (NCTM, 2000), one of them was mathematical reasoning ability. Keraf (Rosadah et. al., 2013, pp. 271) state that reasoning is a thinking process involving activities to connect fact and evidence to get a logic conclusion. Mathematical reasoning ability can help students to develop their mathematical ability that is from only memorizing ability. The statement is supported by Yoong (2006, pp. 9) that the students having a good reasoning ability will be flexible in viewing and understanding a rule or principle so that they will be able to solve the problems given even though they forget the rule or principle.
NCTM (Tandililing, 2011, pp. 918) stated that in developing the student’smathematical ability we don’t only need cognitive aspect but also affective aspect. Those two aspects have a significant effect on the student’slearning achievement. One of the affective aspect having an important role in mathematics learning is the student’sself-regulated learning.
Bandung, October 17th, 2015
Proceeding International Seminar on
Mathematics, Science, and Computer Science Education
35
M
De Corte et. al. (Papeet. al., 2003, pp. 180) state that “self-regulation is a major objective of Mathematics education … and …. a crucial characteristic of effective Mathematics learning. Zimmerman (1998, pp. 73) states that self-regulated learning refers to thinking, feeling and action which is planned and suited for a personal objective achievement.Anself-regulated learner’s believes that a learning process is a proactive activity, needing personal initiative and behavior process as well as meta cognitive. Cheng (2011) and Samuelson (2011) found that the self-regulated learning has contribution on the students’ learning activity and a significant relation with the students’ mathematical achievement. Therefore, the self-regulated learning is one of the important factors having influence towards the learning success of a student.
A hope on the important role of the students’ reasoning ability and the self-regulated learning on the mathematics learning is not equivalent to the facts found. Several research showed that the students’ mathematical reasoning ability and tself-regulated learning had by the students was still low. Pakpahan (2014) found that the students still experienced difficulties; they are in drawing analogy, estimating the answer and the solution process, drawing a logic conclusion and drawing generalization. Sulistiawati (2014) also revealed that issues about mathematical reasoning were not mastered by the students in Junior High School well. This case is related to the research finding of Wahyudin (Putra, 2011, pp. 293) that one of factors of the student’s difficulty in mastering mathematics topic was because the lack of logic reasoning ability in solving mathematics problems. Besides, De Corte at al (Darr& Fisher, 2004) reported the existence of the basic weakness on the components of the student’sself-regulated learning. Meanwhile, a special attention is needed on the student’s reasoning ability and self-regulated learning to develop the student’s Mathematical ability. One of the attempts can be done is through a learning model emphasizing the student’s activeness in constructing their knowledge independently based on the observation they have done.
NCTM (Sumarmo, 2013, pp. 31) states that mathematics learning should prioritize the student’smathematical power development consisting of digging ability, arranging conjuncture and logic thinking ability, finishing non-routine tests ability, problem solving ability, mathematical communication ability and associating ability in relating mathematics to other intellectual activities. The study done by Sumarmo (Herman, 2007, pp. 44) showed that the students’ ability on mathematical reasoning and thinking be developed optimally, the student’s must have a very open chance to think and to do their activities in solving problems. Moreover, Darr and Fisher (2004, pp. 9) reveal that to develop the student’sself-regulated learning in mathematics, student’s need a supporting learning situation by giving chance to the students to arrange and reflect their thinking to observe others’ thinking.
Bruner (Djaeng, 2007, pp. 35) states “learning is an active process making it is possible for people to find new things out of the information given to them”. Bruner considers that learning finding is suitable with searching knowledge actively by human and can contribute the best result. Meanwhile, one of the proper learning can be implemented is Inquiry Learning with Alberta Model. Students are encouraged to personally find and to transform complex information, to compare new information to the information that they have had on mind and to develop their reasoning and thinking. The role of the teacher is as a facilitator and motivator directing the students to achieve the learning objectives. The steps of Inquiry Learning with Alberta Model according to Donham (Alberta Learning, 2004, pp. 10) consist of six phases, they are planning, retrieving, processing, creating, sharing and evaluating. Every phase they have experienced, students do reflecting, to associate the student’s cognitive and affective aspect. The phases in Inquiry Learning with Alberta Model encourage the students to develop their learning initiative so that they can
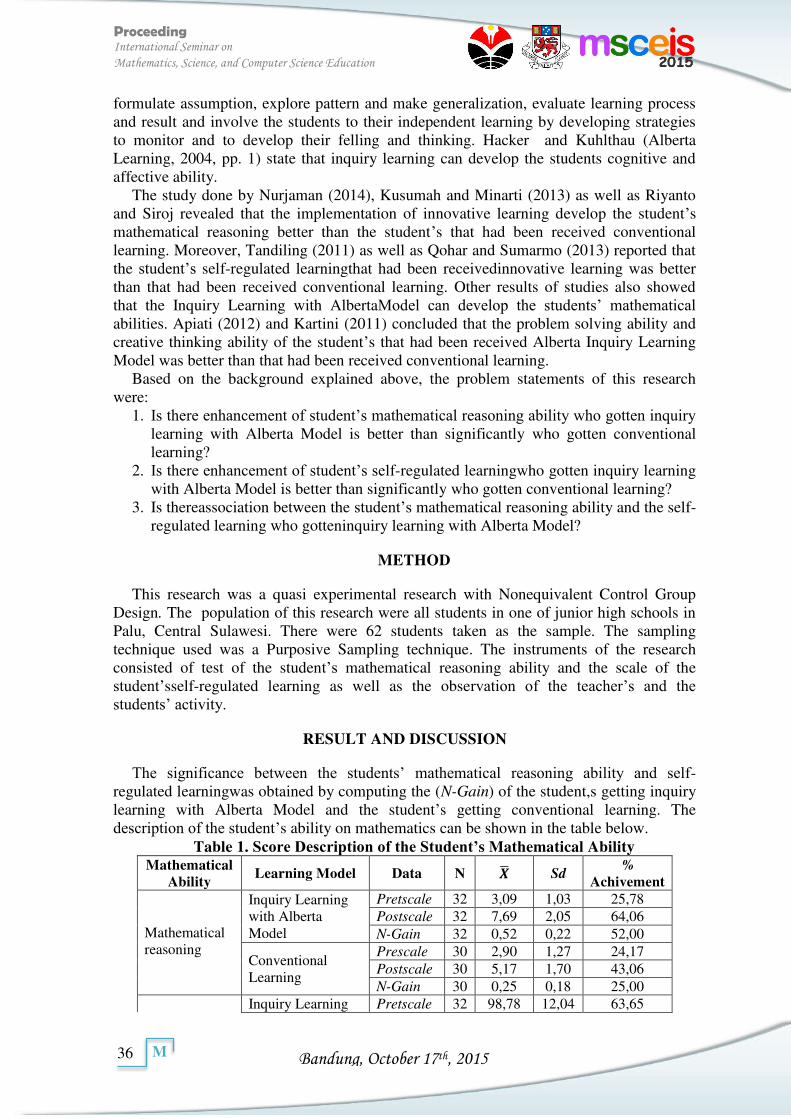
Bandung, October 17th, 2015
Proceeding International Seminar on
Mathematics, Science, and Computer Science Education
36
M
formulate assumption, explore pattern and make generalization, evaluate learning process and result and involve the students to their independent learning by developing strategies to monitor and to develop their felling and thinking. Hacker and Kuhlthau (Alberta Learning, 2004, pp. 1) state that inquiry learning can develop the students cognitive and affective ability.
The study done by Nurjaman (2014), Kusumah and Minarti (2013) as well as Riyanto and Siroj revealed that the implementation of innovative learning develop the student’s mathematical reasoning better than the student’s that had been received conventional learning. Moreover, Tandiling (2011) as well as Qohar and Sumarmo (2013) reported that the student’s self-regulated learningthat had been receivedinnovative learning was better than that had been received conventional learning. Other results of studies also showed that the Inquiry Learning with AlbertaModel can develop the students’ mathematical abilities. Apiati (2012) and Kartini (2011) concluded that the problem solving ability and creative thinking ability of the student’s that had been received Alberta Inquiry Learning Model was better than that had been received conventional learning.
Based on the background explained above, the problem statements of this research were:
1. Is there enhancement of student’s mathematical reasoning ability who gotten inquiry learning with Alberta Model is better than significantly who gotten conventional learning?
2. Is there enhancement of student’s self-regulated learningwho gotten inquiry learning with Alberta Model is better than significantly who gotten conventional learning?
3. Is thereassociation between the student’s mathematical reasoning ability and the self-regulated learning who gotteninquiry learning with Alberta Model?
METHOD
This research was a quasi experimental research with Nonequivalent Control Group Design. The population of this research were all students in one of junior high schools in Palu, Central Sulawesi. There were 62 students taken as the sample. The sampling technique used was a Purposive Sampling technique. The instruments of the research consisted of test of the student’s mathematical reasoning ability and the scale of the student’sself-regulated learning as well as the observation of the teacher’s and the students’ activity.
RESULT AND DISCUSSION
The significance between the students’ mathematical reasoning ability and self-regulated learningwas obtained by computing the (N-Gain) of the student,s getting inquiry learning with Alberta Model and the student’s getting conventional learning. The description of the student’s ability on mathematics can be shown in the table below.
Table 1. Score Description of the Student’s Mathematical Ability Mathematical
Ability Learning Model Data N � Sd
%
Achivement
Mathematical reasoning
Inquiry Learning with Alberta Model
Pretscale 32 3,09 1,03 25,78 Postscale 32 7,69 2,05 64,06 N-Gain 32 0,52 0,22 52,00
Conventional Learning
Prescale 30 2,90 1,27 24,17 Postscale 30 5,17 1,70 43,06 N-Gain 30 0,25 0,18 25,00
Inquiry Learning Pretscale 32 98,78 12,04 63,65
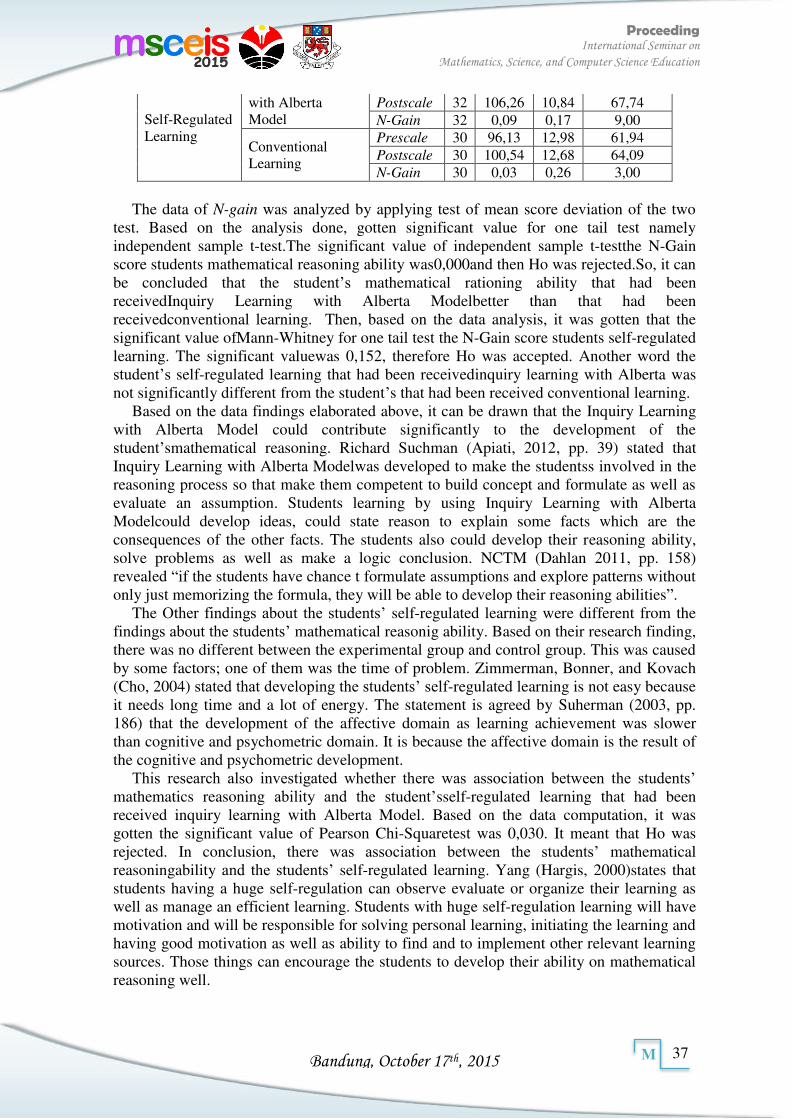
Bandung, October 17th, 2015
Proceeding International Seminar on
Mathematics, Science, and Computer Science Education
37
M
Self-Regulated Learning
with Alberta Model
Postscale 32 106,26 10,84 67,74 N-Gain 32 0,09 0,17 9,00
Conventional Learning
Prescale 30 96,13 12,98 61,94 Postscale 30 100,54 12,68 64,09 N-Gain 30 0,03 0,26 3,00
The data of N-gain was analyzed by applying test of mean score deviation of the two
test. Based on the analysis done, gotten significant value for one tail test namely independent sample t-test.The significant value of independent sample t-testthe N-Gain score students mathematical reasoning ability was0,000and then Ho was rejected.So, it can be concluded that the student’s mathematical rationing ability that had been receivedInquiry Learning with Alberta Modelbetter than that had been receivedconventional learning. Then, based on the data analysis, it was gotten that the significant value ofMann-Whitney for one tail test the N-Gain score students self-regulated learning. The significant valuewas 0,152, therefore Ho was accepted. Another word the student’s self-regulated learning that had been receivedinquiry learning with Alberta was not significantly different from the student’s that had been received conventional learning.
Based on the data findings elaborated above, it can be drawn that the Inquiry Learning with Alberta Model could contribute significantly to the development of the student’smathematical reasoning. Richard Suchman (Apiati, 2012, pp. 39) stated that Inquiry Learning with Alberta Modelwas developed to make the studentss involved in the reasoning process so that make them competent to build concept and formulate as well as evaluate an assumption. Students learning by using Inquiry Learning with Alberta Modelcould develop ideas, could state reason to explain some facts which are the consequences of the other facts. The students also could develop their reasoning ability, solve problems as well as make a logic conclusion. NCTM (Dahlan 2011, pp. 158) revealed “if the students have chance t formulate assumptions and explore patterns without only just memorizing the formula, they will be able to develop their reasoning abilities”.
The Other findings about the students’ self-regulated learning were different from the findings about the students’ mathematical reasonig ability. Based on their research finding, there was no different between the experimental group and control group. This was caused by some factors; one of them was the time of problem. Zimmerman, Bonner, and Kovach (Cho, 2004) stated that developing the students’ self-regulated learning is not easy because it needs long time and a lot of energy. The statement is agreed by Suherman (2003, pp. 186) that the development of the affective domain as learning achievement was slower than cognitive and psychometric domain. It is because the affective domain is the result of the cognitive and psychometric development.
This research also investigated whether there was association between the students’ mathematics reasoning ability and the student’sself-regulated learning that had been received inquiry learning with Alberta Model. Based on the data computation, it was gotten the significant value of Pearson Chi-Squaretest was 0,030. It meant that Ho was rejected. In conclusion, there was association between the students’ mathematical reasoningability and the students’ self-regulated learning. Yang (Hargis, 2000)states that students having a huge self-regulation can observe evaluate or organize their learning as well as manage an efficient learning. Students with huge self-regulation learning will have motivation and will be responsible for solving personal learning, initiating the learning and having good motivation as well as ability to find and to implement other relevant learning sources. Those things can encourage the students to develop their ability on mathematical reasoning well.
Bandung, October 17th, 2015
Proceeding International Seminar on
Mathematics, Science, and Computer Science Education
38
M
CONCLUSION
Based on the data analysis and discussion above, the researcher concluded: 1. The enhancement of the student’s mathematical reasoning ability that had been received
inquiry learning with Alberta Model better than significantly that had been received conventional learning.
2. The enhancement of the student’s self-regulated learningthat had been received inquiry learning with Alberta Model better than significantly that had been received conventional learning.
3. Therewas association between the student’s mathematical reasoning ability and the student’s self-regulated learning that had been receivedinquiry learning with Alberta Model.
REFERENCES
Alberta Learning. (2004). Focus on inquiry: a teacher’s guided to implementing inquiry-
based learning. Alberta Learning : Edmonton. Apiati, V. (2012). Peningkatan kemampuan pemahamandan pemecahan masalah
matematis siswa melalui metode inkuiri model Alberta. (Tesis). Sekolah Pascasarjana, Universitas Pendidikan Indonesia, Bandung.
Cheng, E. (2011). The role of self-regulated learning in enhancing learning performance. The International Journal of Research and Review, 6(1), pp. 1-16.
Cho, M. (2004). The effects of design strategies for promoting students’ self-regulated
learning skills on students’ self regulation and achievements in online learning environments. (Online). Diakses dari http://files.eric.ed.gov/fulltext/ED485062.pdf.
Dahlan, J. A. (2011). Analisis kurikulum matematika. Jakarta: Universitas Terbuka. Darr, C & Fisher, J. (2004). Self-regulated learning in the mathematics class. (Online).
Diakses dari http://www.nzcer.org.nz/pdfs/13903.pdf . Djaeng, M. (2007). Belajar dan pembelajaran matematika. Palu : Universitas Tadulako
Press. Hargis. (2000). The self regulated learner adventage : learning science on the internet.
(Online). Diakses dari http://ejse.southwestern.edu/article/view/ 7637/5404. Herman, T. (2007). Pembelajaran berbasis masalah untuk meningkatkan kemampuan
penalaran matematis siswa SMP. Cakrawala Pendidikan, 1(1), hlm. 41-62. Kartini. (2011). Peningkatan kemampuan berpikir kreatif matematis siswa SMA melalui
pembelajaran inkuiri model Alberta. Prosiding Seminar Nasional Pendidikan
Matematika STKIP Siliwangi Bandung (hlm. 145-153) .Cimahi : STKIP Siliwangi Bandung Press.
Kusumah, Y &Minarti, E. (2013). Enhancing students’ mathematical reasoning in Junior High School through generative learning. Proceeding International Seminar on
Mathematics, Science and Computer Science Education Faculty of Mathematics and
Science Education UPI (pp. 304-307). Bandung : UPI Press. National Council of Teachers of Mathematics.(2000). Principles and standards for school
mathematics.Reston, VA: NCTM. Nurjaman, A. (2014). Meningkatkan kemampuan komunikasi matematik siswa SMP
melalui model pembelajaran kooperatif tipe Think Pair Share (TPS). Prosiding
Seminar Nasional Pendidikan Matematika STKIP Siliwangi Bandung (hlm. 171-178).Cimahi : STKIP Siliwangi Bandung Press.
Bandung, October 17th, 2015
Proceeding International Seminar on
Mathematics, Science, and Computer Science Education
39
M
Pakpahan, H L. (2014).Analisisself efficacy dan kesalahan dalam mengerjakan soal
penalaran matematis siswa SMA. (Tesis). Sekolah Pascasarjana, Universitas Pendidikan Indonesia, Bandung.
Pape, et. al. (2003).Developing mathematical thinking and self-regulated learning: a teaching experiment in a seventh-grade mathematics classroom. Journal Educational
Studies in Mathematics, 53 (3), pp. 179-202. Putra, H D. (2011). Pembelajaran geometri dengan pendekatan SAVI berbantuan
Wingeom untuk meningkatkan kemampuan analogi matematis siswa SMP. Prosiding Seminar NasionalPendidikan Matematika STKIP Siliwangi Bandung (hlm. 292-1302).Cimahi : STKIP Siliwangi Bandung Press.
Qohar, A &Sumarmo, U. (2013).Improving mathematical communication ability and self regulation learning ofyunior high students by using reciprocal teaching.IndoMS-
JME, 4 (1), hlm. 59-74. Riyanto, B &Siroj, R. (2011).Meningkatkan kemampuan penalaran dan prestasi
matematika dengan pendekatan konstruktivisme pada siswa Sekolah Menengah Atas. Jurnal Pendidikan Matematika, 5 (2), hlm. 111-127.
Rosyadah, dkk. (2013). Develop inductive reasoning on pattern numbers with a realistic mathematics education approach in the ninth grade students in MTS Al-Kenaniyah, Jakarta. Proceeding The First South East Asia Design/Development Research (SEA-
DR) International Conference, Sriwijaya University, Palembang, (hlm 269-278). Palembang : Universitas Sriwijaya.
Ruseffendi, E. T. (2006). Pengantar kepada membantu guru mengembangkan
kompetensinya dalam pengajaran matematika untuk meningkatkan CBSA. Bandung :Tarsito.
Samuelsson, J. (2011). Important prerequisites to educational success in mathematics in
lower secondary school.(Online).Diakses dari http://www.cimt.plymouth.ac.uk/ journal/samuelsson.pdf.
Suherman, E.(2003). Evaluasi pembelajaran matematika. Bandung: Jurusan Pendidikan Matematika FPMIPA UPI.
Sulistiawati.(2014). Analisis kesulitan belajar kemampuan penalaran matematis siswa SMP pada materi luas permukaan dan volume limas. Prosiding Seminar Nasional
Pendidikan Matematika, Sains, dan TIK STKIP Surya (hlm. 205-225). Tangerang : STKIP Surya Press.
Sumarmo, U. (2013). Kumpulan makalah berpikir dan disposisi matematika serta
pembelajarannya. Bandung : JurusanPendidikanMatematika F-MIPA UPI. Tandililing, E. (2011). The enhancement of mathematical communication and self
regulated learning of Senior High School students through PQ4R strategy accompanied by refutation text reading. Proceeding International Seminar and the
Fourth National Conference onMathematics EducationDepartment of Mathematics
Education, UNY (hlm. 917-928). Yogyakarta :UNY Press. Yoong, W K. (2006) Enhancing mathematical reasoning at secondary school level.
(Online). Diakses dari http://math.nie.edu.sg/ame/mtc06 /Mathematics%20Teachers%27%20Conference%20WongKY%20Math%20Reasoning.pdf
Zimmerman, B. (1998). Academic studying and the development of personal skill : a self-regulatory perspective . Journal Educational Psychologist, 33(2), hlm. 73-86.

Bandung, October 17th, 2015
Proceeding International Seminar on
Mathematics, Science, and Computer Science Education
40
M
Bandung, October 17th, 2015
Proceeding International Seminar on
Mathematics, Science, and Computer Science Education
41
M
MATH-07102
Model Of “Ujian Nasional” Problems Based On Mathematical Reasoning
For Senior High School Level
Elah Nurlaelah Department of Mathematics Education, FPMIPA
Universitas Pendidikan Indonesia Article info Abstract
Keywords: mathematical reasoning indicators, Taksonomi Bloom, Brookhat reasoning indicators, Ujian Nasional Problems.
This article presents the result of “Ujian Nasional (UN) Problems Analysis“ and the constructing MODEL of the problems based on mathematical reasoning. The method of this research was descriptive. By using this method was been analysed the problems of Ujian Nasional at 2014, concept of mathematical reasoning and its’ indicator, and then constructing problem based on mathematical reasoning indicators. Analysis result based on Taksonomi Bloom to problems of UN which consisted of 40 multiple choice problems with 5 options were found that 65% problems measured memorizing and understanding. The problems just measured memorized of formulas, rule, or counting skill. There were 35% problems which measured the aplication, analysis, evaluation, and creating skill. But, If the problems were analysed using Brookhart criteria/indicators about reasoning, there were only 15% (6 problems) which measured mathematical reasoning. This founding showed that 2014 UN problems still have not met a demand all mathematical reasoning indicators from Brookhart indicators. Another result from this research was the changing our paradigm about UN constructing problems. Ussually UN problems were constructed to measure memorizing, using of formulas or rule (to measure low order thinking) to be measuring high order thinking. One of the changing can be made is the instruction word in the problems. In the conventional problems the instruction are “ determine, count, and choose the right answer, ... etc”, whenever in this article the instruction are” analysis, make conclussion, check correctness of a statement, construct a counter example ...etc” The new construction problems was expected can push students to solve the problems not only based on memorizing but also they can use their reasoning.
Corresponding Author: Elah Nurlaelah Department of Mathematics Education, FPMIPA UPI Jl. Dr. Setiabudi No. 229, Bandung 40154, Indonesia [email protected]
INTRODUCTION
National test (ujian nasional) more over called un is a measure activity and a competency standard achievement assessment which was done nationally for specific course and all level (at the end in elementary school, junior high school, and senior high school [3]. National test is an evaluation to students, schools, and education program which was done periodic, comprehensive, transparency and systemic by independent organization. This test was used to assess education national standard achievement that stated in section 28 subsection 2 in national education system adjustment. Result of national test will be used for; a) program and/or school quality mapping, b) as a selection consideration to enter furthermore education, and c) as a founding and school assist supporting to improve the education quality.
Problems which used in national test based on special criteria that determined by educational ministry collaborated with educational national standard adjusment (badan nasional standar pendidikan). Generally special criteria consist of two dimensions, concept dimension and thinking level. For senior high school, concept dimension are algebra,
Bandung, October 17th, 2015
Proceeding International Seminar on
Mathematics, Science, and Computer Science Education
42
M
calculus, geometry-trigonometry, and statistics. Thinking level dimension are knowledge and comprehension (identification, data classification, conclusion, explanation, compare, determine, and calculation); application (using, make a model, and solve problems); reasoning (analysis, applying idea, organizing idea, synthesis, evaluation, formulate, conclude, and interpretation.
Analysis result based on bloom taxonomy for 40 objective test with 5 answer choices which tested in 2014 national test got result as follows; 65% the problems measured mathematical remembering and comprehension. The problems just focus to remember the formula, rule, or counting. 35% the problems measured application, analysis, evaluation and creation of mathematics. If we analysis based on brookhart reasoning indicators, there are 6 problems that assess mathematical reasoning. That six reasoning problems consist of; one problem measured logic conclusion indicator, two problems measured guessing answer and solution process, one problem measured pattern and relation to analysis mathematics situation, and one problem measured validity check and construct a valid argument.
Based on that analysis, it can be seen that the problems which measured reasoning just consist of six problems. Whereas reasoning is one of the mathematical ability which need to construct mathematical high order thinking better. So, it is needed to change our paradigm to move on and concstruct national test based on reasoning indicator. This paper will present the result of our research, how to construct the problems based on reasoning indicators. Theorytical Framework For Depeloving Problem Test Based On Reasoning
1. Characteristic and mathematical turth Mathematical thinking has a meaning as way of thinking which related to
mathematical characteristics and mathematical truth. Someone may be think that mathematics as a tool to count, mathematics a tool to solve the problem, so it called a mathematical problem solving” and “mathematical reasoning. A counting and doing addition are two examples of simple and routine mathematics activities. These activities always done almost everybody. Whereas mathematics activities such as “mathematical problem solving” and “mathematical reasoning” are mathematical activities just done by special person. Another person, think that “mathematics as a human activity”. This means that mathematics as an active, dynamic, and generative process.
We can think mathematics as language, as examples there are ” positive and negative numbers”, and the forms 2x + 5 and 34 - 2,5 are called “expression, and forms y = 6 and 2x - 4 < 50 were called “mathematics statement” [6]. There is diverification between mathematical language and general language or another language. Mathematical language is special and it has properties unique. Because of the properties unique, sometime mathematics called as “fomal language” or “symbolic language” (in [8])
Mathematics has special characteristics, that is mathematics emphasize to deductive and inductive process. Deductive process need logical reasoning and axiomatic which will be started by inductive process. As we know, mathematics well known as hierarchical concept. It means that every concept in mathematics connect with each other, and sometimes one concept to be a requisite for the other. Therefore, mastery of some mathematics concept can be achieved when the concept was related one with each other.
Based on mathematical properties as explained before, mathematics has two dimensional to be improved, that are to fulfill recently and future needed. Both of needed, will be teaching and learning vision. The first is to guide of teaching and learning for comprehension and mathematical idea which needed to solve mathematics problems and other branch of sciences. The second vision is wider meaning for future vision, mathematics promote logical reasoning, systematic, critical and accurate, promote self
Bandung, October 17th, 2015
Proceeding International Seminar on
Mathematics, Science, and Computer Science Education
43
M
confident, beautification of mathematical properties, and promote objective ability for opening thinking which needed to force of changing word [12]. Indonesia 2006 curriculum for mathematics go in a certain direction such as; 1) mathematics concept comprehension, explain the connection between concept, application concept or algorithm, flexible, accurately, efficient, and appropriate in solving problem; 2) make use of reasoning to pattern and nature, doing manipulative of mathematics to arrange generalization, arrange proof, or explaining idea and mathematical statement; 2) solve problem covers comprehension of problem, arrange a mathematical model, solve model and interpret the achievement solution; 4) communicate ide using symbol, table, graph, or another media to make clear situation and problem; 5) have attitude to appreciate of mathematics pertinence in daily life, and have curiosity, give attention, and interest to learn mathematics, persevering attitude and self confidence to solve problem.
In that curriculum was written explicitly that reasoning be one of the purpose of ability that have to be achieved by student after they studied mathematics. So, the reasoning ability have to promote to be implementation in teaching and learning process, and the result have to be measured.
2. Mathematical reasoning Broadly speaking, mathematical reasoning consists of two types of inductive
reasoning and deductive reasoning. Inductive reasoning include: making forecasts, drawing an analogy, and generalize and deductive reasoning include: direct evidence [10].
Ability to do estimation is characterized by the ability to assess the data or trends without performing analytic calculations. Analogy is the ability to draw conclusions based on similarity of process or data provided. The ability of generalization is to find the form or the general formula is based on a number of data or processes are given. In detail indicator to see the reasoning abilities of the students are presented as follows; a) do logical conclusion, b ) provide an explanation by using models, facts, properties, and relationships, c ) estimate the answer and the solution process, d) use patterns and relationships to analyze mathematical situations, draw analogies and generalizations, e) develop and test the conjecture, f) provide opponent example (counter examples), g) following the rules of inference ; check the validity of the argument, h) develop a valid argument, i) develop direct evidence , indirect evidence , and mathematical induction.
According to shurter and pierce in[11], the reasoning is the process to reach a logical conclusion based on data and relevant sources. In the disciplines of mathematics and psychology, inductive reasoning is very important because it can be trained to think creatively intuitive and reflective. Standard evaluation 7 in curriculum and evaluation standards for school mathematics [10] outlines that the students are called skilled in reasoning mathematically if it can : 1) implement the inductive reasoning to identify a trend or form a conjecture, 2) use reasoning to develop logical arguments, 3) apply the proportional and spatial reasoning to solve problems, 4) use deductive reasoning to verification a settlement and justify the validity of an argument, 5) analyze the situation to establish the nature and general structure, and 6) appreciate the mathematical axioms form.
Brookhart [2] wrote that reasoning ability can be grouped into deductive reasoning and inductive reasoning. Deductive reasoning is defined as the reasoning derived from the general principles to sample, or a matter of principle to the particular case. In deductive reasoning preceded by one or more premises ( the basis of an argument ) by using reasoning further move towards a conclusion. If the reasoning followed by the premise, the conclusion may be wrong.
Inductive reasoning interpreted as reasoning that originating from samples to the general principles. Let students make up a hypothesis based on theory and conducting research to test the hypothesis. The results are analyzed and interpreted whether to support
Bandung, October 17th, 2015
Proceeding International Seminar on
Mathematics, Science, and Computer Science Education
44
M
or reject the hypothesis. Inductive reasoning includes the activity of the data, examples, from other information and make inferences. Other inductive reasoning is reasoning by analogy. This reasoning is based on the similarity of two things, and the quality of the reasoning depends on whether the two had an argument that it is relevant or not.
Reasoning indicator according to brookhart [2] as follows;
No Types of reasoning 1 Deductive reasoning Skills to decide whether elements get in or not in a class or category 2 Inductive reasoning Reasoning from the data
Reasoning of examples Reasoning from other information Reasoning in making inferences Reasoning by analogy Skills to create patterns Make a relevan decision
METHOD
This research used descriptive methodology, because the data was un problems for 2014. Un 2014 problems [6] were analysis, and then separated the problems based on bloom and brokhaart taksonomy.
ANALYSIS AND DISCUSSION
Standards For The Developing Of Un Based On Reasoning Problems 1. Development of grid standards tests Test capability that will be developed in this section focus to measure reasoning
ability. Reasoning tests can be developed properly prepared based on the indicators of reasoning that should be achieved or predetermined.
Based on the description of indicators has been stated previously, an outline of mathematical reasoning is divided into two inductive reasoning and deductive reasoning. Besides, mathematics as a science that emphasizes the deductive process, then in mathematics is required logical reasoning and axiomatic, that begins with the inductive process through the steps of preparing a conjecture, mathematical modeling, preparation or analogy and generalization. So that in mathematics a concept is said to be true in general, if the concept has proven deductively. This means that in mathematics a concept that is true in general, cannot be proved by presenting one, two or even a thousand examples. This proof may be different patterns for the natural sciences (science), because in science a concept generally considered correct if it can be observed from several special events. Thus the un reasoning tests to be developed must refer to indicators presented reasoning and material /concepts contained in curriculum prevailing in indonesia at this time.
Determination of the material/content to measure reasoning indicators should be adjusted, meaning that there are materials or certain concepts that can only be used to measure certain indicators reasoning. Material/content of mathematics can be seen in indonesia curriculum [4] and [5].
2. Construction standards test objective. There are various objective tests, including true-false tests, multiple choice tests,
matching, and test fields. Objective test has several advantages, including: easy to carry
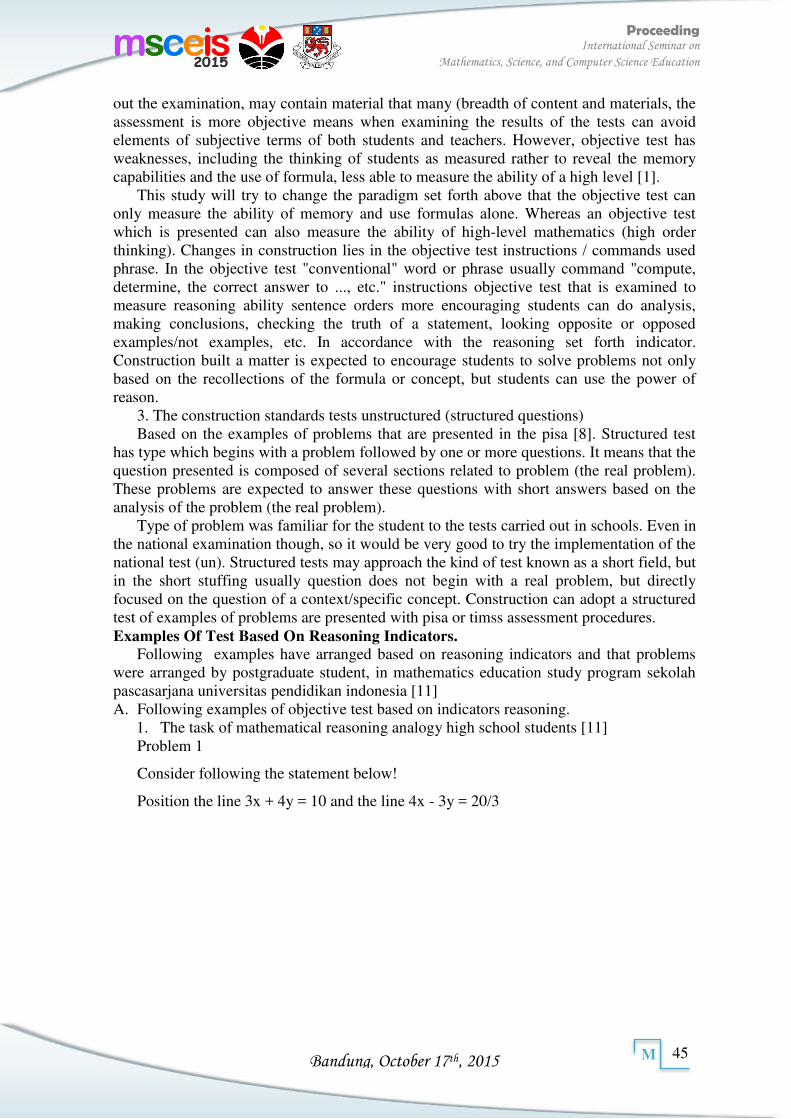
Bandung, October 17th, 2015
Proceeding International Seminar on
Mathematics, Science, and Computer Science Education
45
M
out the examination, may contain material that many (breadth of content and materials, the assessment is more objective means when examining the results of the tests can avoid elements of subjective terms of both students and teachers. However, objective test has weaknesses, including the thinking of students as measured rather to reveal the memory capabilities and the use of formula, less able to measure the ability of a high level [1].
This study will try to change the paradigm set forth above that the objective test can only measure the ability of memory and use formulas alone. Whereas an objective test which is presented can also measure the ability of high-level mathematics (high order thinking). Changes in construction lies in the objective test instructions / commands used phrase. In the objective test "conventional" word or phrase usually command "compute, determine, the correct answer to ..., etc." instructions objective test that is examined to measure reasoning ability sentence orders more encouraging students can do analysis, making conclusions, checking the truth of a statement, looking opposite or opposed examples/not examples, etc. In accordance with the reasoning set forth indicator. Construction built a matter is expected to encourage students to solve problems not only based on the recollections of the formula or concept, but students can use the power of reason.
3. The construction standards tests unstructured (structured questions) Based on the examples of problems that are presented in the pisa [8]. Structured test
has type which begins with a problem followed by one or more questions. It means that the question presented is composed of several sections related to problem (the real problem). These problems are expected to answer these questions with short answers based on the analysis of the problem (the real problem).
Type of problem was familiar for the student to the tests carried out in schools. Even in the national examination though, so it would be very good to try the implementation of the national test (un). Structured tests may approach the kind of test known as a short field, but in the short stuffing usually question does not begin with a real problem, but directly focused on the question of a context/specific concept. Construction can adopt a structured test of examples of problems are presented with pisa or timss assessment procedures. Examples Of Test Based On Reasoning Indicators.
Following examples have arranged based on reasoning indicators and that problems were arranged by postgraduate student, in mathematics education study program sekolah pascasarjana universitas pendidikan indonesia [11] A. Following examples of objective test based on indicators reasoning.
1. The task of mathematical reasoning analogy high school students [11] Problem 1
Consider following the statement below!
Position the line 3x + 4y = 10 and the line 4x - 3y = 20/3
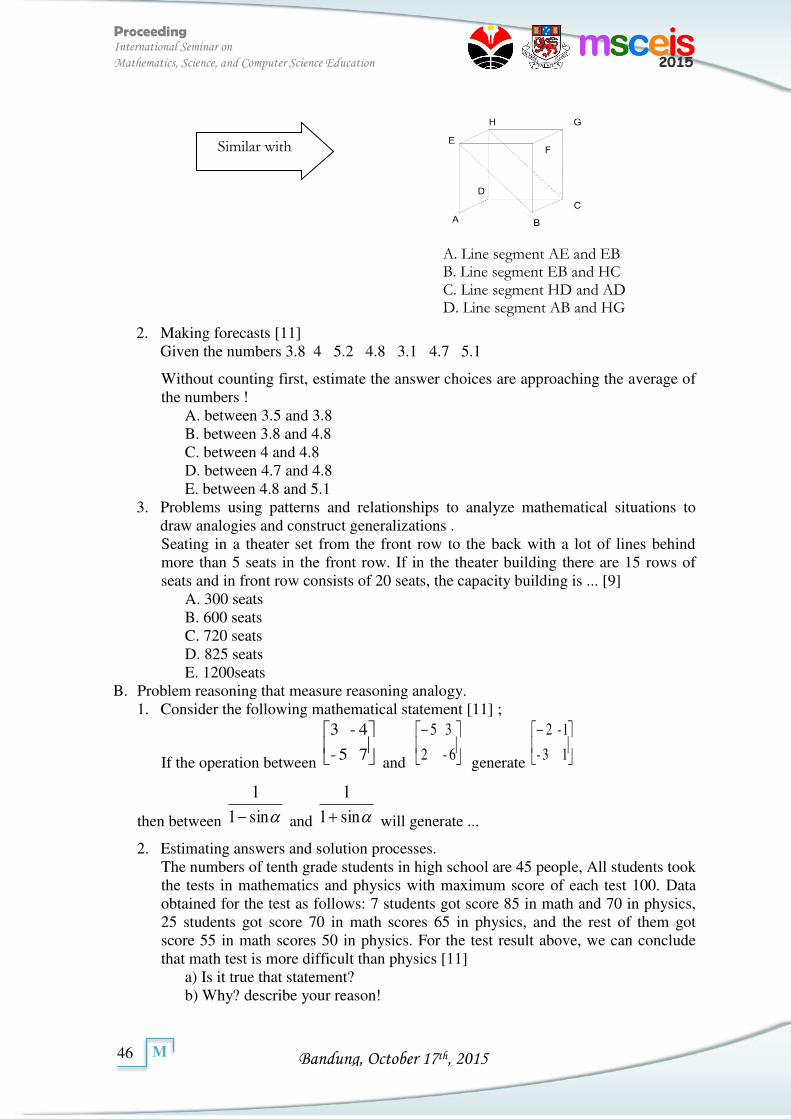
Bandung, October 17th, 2015
Proceeding International Seminar on
Mathematics, Science, and Computer Science Education
46
M
2. Making forecasts [11]
Given the numbers 3.8 4 5.2 4.8 3.1 4.7 5.1
Without counting first, estimate the answer choices are approaching the average of the numbers !
A. between 3.5 and 3.8 B. between 3.8 and 4.8 C. between 4 and 4.8 D. between 4.7 and 4.8 E. between 4.8 and 5.1
3. Problems using patterns and relationships to analyze mathematical situations to draw analogies and construct generalizations . Seating in a theater set from the front row to the back with a lot of lines behind more than 5 seats in the front row. If in the theater building there are 15 rows of seats and in front row consists of 20 seats, the capacity building is ... [9]
A. 300 seats B. 600 seats C. 720 seats D. 825 seats E. 1200seats
B. Problem reasoning that measure reasoning analogy. 1. Consider the following mathematical statement [11] ;
If the operation between
7 5-
4- 3
and
6- 2
3 5
generate
1 3-
1- 2
then between sin1
1
and sin1
1
will generate ...
2. Estimating answers and solution processes. The numbers of tenth grade students in high school are 45 people, All students took the tests in mathematics and physics with maximum score of each test 100. Data obtained for the test as follows: 7 students got score 85 in math and 70 in physics, 25 students got score 70 in math scores 65 in physics, and the rest of them got score 55 in math scores 50 in physics. For the test result above, we can conclude that math test is more difficult than physics [11]
a) Is it true that statement? b) Why? describe your reason!
Similar with
A. Line segment AE and EB B. Line segment EB and HC C. Line segment HD and AD D. Line segment AB and HG E. Line segment HC and HG
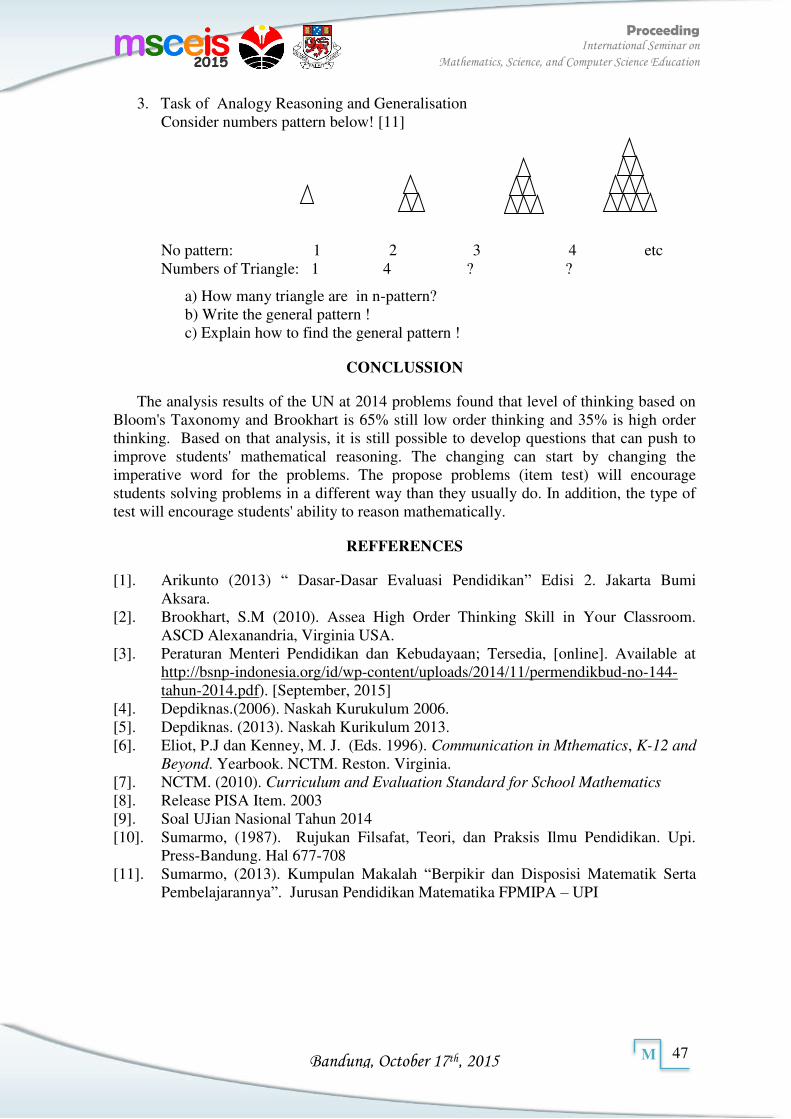
Bandung, October 17th, 2015
Proceeding International Seminar on
Mathematics, Science, and Computer Science Education
47
M
3. Task of Analogy Reasoning and Generalisation Consider numbers pattern below! [11]
No pattern: 1 2 3 4 etc Numbers of Triangle: 1 4 ? ?
a) How many triangle are in n-pattern? b) Write the general pattern ! c) Explain how to find the general pattern !
CONCLUSSION
The analysis results of the UN at 2014 problems found that level of thinking based on Bloom's Taxonomy and Brookhart is 65% still low order thinking and 35% is high order thinking. Based on that analysis, it is still possible to develop questions that can push to improve students' mathematical reasoning. The changing can start by changing the imperative word for the problems. The propose problems (item test) will encourage students solving problems in a different way than they usually do. In addition, the type of test will encourage students' ability to reason mathematically.
REFFERENCES
[1]. Arikunto (2013) “ Dasar-Dasar Evaluasi Pendidikan” Edisi 2. Jakarta Bumi Aksara.
[2]. Brookhart, S.M (2010). Assea High Order Thinking Skill in Your Classroom. ASCD Alexanandria, Virginia USA.
[3]. Peraturan Menteri Pendidikan dan Kebudayaan; Tersedia, [online]. Available at http://bsnp-indonesia.org/id/wp-content/uploads/2014/11/permendikbud-no-144-tahun-2014.pdf). [September, 2015]
[4]. Depdiknas.(2006). Naskah Kurukulum 2006. [5]. Depdiknas. (2013). Naskah Kurikulum 2013. [6]. Eliot, P.J dan Kenney, M. J. (Eds. 1996). Communication in Mthematics, K-12 and
Beyond. Yearbook. NCTM. Reston. Virginia. [7]. NCTM. (2010). Curriculum and Evaluation Standard for School Mathematics [8]. Release PISA Item. 2003 [9]. Soal UJian Nasional Tahun 2014 [10]. Sumarmo, (1987). Rujukan Filsafat, Teori, dan Praksis Ilmu Pendidikan. Upi.
Press-Bandung. Hal 677-708 [11]. Sumarmo, (2013). Kumpulan Makalah “Berpikir dan Disposisi Matematik Serta
Pembelajarannya”. Jurusan Pendidikan Matematika FPMIPA – UPI
Bandung, October 17th, 2015
Proceeding International Seminar on
Mathematics, Science, and Computer Science Education
48
M
MATH-07107
The Development of Mobile Learning Application to Increase Pedagogical Competence of Mathematics Teachers in Banten
Aan Hendrayana and Cecep Anwar Hadi Firdos Santosa
Universitas Sultan Ageng Tirtayasa
Article info Abstract
Keywords: pedagogical competencies, mobile learning applications, Mathematics Teacher in Banten.
Students’ success in mathematics is determined by the mathematics teacher who has a good pedagogical competence. The achievement of pedagogical competence requires a mathematics teacher development. This development need to be effective and efficient. For that reason, we need some innovative ways to achieve an effective and efficient of cognitive development to improve the competence of teachers. One of innovative waysin this era is involving the learning resources. The efficient learning resources are resources that closer and familiar to the teacher in various regions of Banten. As we know, the device that almost teachers have is smartphone.This learning resources need to be designed and developed by pedagogical experts through somestages of assessment and development. The method of this study useresearch method which is developed by Borg and Gall (2003).There are ten step of this methods, the first five steps have been done until this paper reported. As a result, according to the experts’ evaluation, this mobile application is suitable to improve teachers’ pedagogical knowledge. The best appreciation comes from media expert, followed by content and learning expert.
Corresponding Author: Aan Hendrayana a)
Cecep Anwar Hadi Firdos Santosa b)
Universitas Sultan Ageng Tirtayasa Jalan Raya Jakarta km.4 Pakupatan, SerangBanten a)[email protected] b)[email protected]
INTRODUCTION
Various efforts to improve the professional competence of teachers have been done. However, the quality of teachers in Indonesia still not satisfying. This is evidenced by Initial Competency Exam for teachers who will get Professional Teacher Education and Training is not “positive”[1]. It is also; according to the findings of the National Education Standards Agency that there are certain areas that is identified to have a good quality of education was only 60% of teachers who have a good ability[2]. Likewise, [3] states that the lack of mathematical skills of students due to the lack of trained teachers. This fact was confirmed by the Minister of Education and Culture that the quality of teachers in Indonesia is still low[4].
One of the efforts to increase the professionalism of teachers are deepening their pedagogical abilities. Good pedagogical abilities will have implications on the ease teachers in designing and delivering appropriate learning situations in the classroom. However, not all teachers could absorb, understand, and implement effective learning situation. Several variables need to be explored by the teacher to overcome this situation.
Deepening pedagogic competency requires process such as training and workshops in long period of time. On the other word, its need sustainability. However, this has implications on the cost of which is not less when training and workshops conducted conventional. For that, we need innovative ways to solve this problem.
One of the innovative efforts to solve the above problem is to utilize the smartphone or in other words create a smartphone based training. The reason for using this tool because a smartphone is well known for this era, especially for most teachersin Banten. Another reason, the smartphone can access learning resources via Internet, according to [5]the
Bandung, October 17th, 2015
Proceeding International Seminar on
Mathematics, Science, and Computer Science Education
49
M
benefits of the Internet for education is the ability to get a huge information and as a media to collaborative working. In addition, the uses of internet facilities are not limited by space and time, so that the exchange of information and knowledge can take place anywhere and anytime. Meanwhile, internet access in Banten is easy to do with the cost affordable by the teacher. Computer-Based Applications
Products of technology, especially computer-based, have an important role in growing the proficiency of learners, especially in the pedagogical material. The products of this technology can represent different pedagogical concepts ranging from simple concepts to the complex. These concepts are displayed in a computer application designed into products in a variety of tools that allows the display of such products. By using the computer-based products students can freely create and analyze these concepts.
Based on studies by[6],A computer application which is designed with deep thinking can bring many positive impact.It may display repetitive presentation dynamically than with static media, such as a book or a blackboard. The advantages of computer application are the ability to display the educational process in energetic, dynamic visual display, especially for pedagogic. Pedagogic learning with the use of computers will allow teachers deliver course material which is dealing with graphics, pictures, video, and interactivity. Computers can present it as a visual form that can be observed and studied by the learners. Mobile Learning Application
Mobile learning was defined as distance learning that bridges learning directly and indirectly[7]. Mobile learning is called directly and indirectly because these mobile devices can be accessed in the classroom and outside the classroom. Mobile applications are very popular. This is because the increase in mobile phone technology, both in terms of hardware and software, is growing fast.In this era, the phone hardware specification is similar with computer. For example the processor of cell phone is built with quad core processor. Besides, mobile phone screens are already adapting retina display (technology that makes it very convenient) so that our eyes do not get tired. Mobile phone which is adapting the computer technology is called a smartphone.
Powerful capabilities on smartphones makes this tool can be used for various necessities of life, as well as a computer, even betterits device can be carried anywhere (because of the size).Teachers can learn and think anytime and anywhere about pedagogical competence knowledge and mathematic topic which is represented in application that installed in their device. By this way, we said that this learning application is the innovative learning device.
METHOD
The method used in this research is the developmental research. According to (Borg & Gall, 2003, pp. 783-795)the approach to Research and Development (R & D) in education includes 10 steps, which is: 1. Preliminary Study
a. Analysis of needs: to perform a needs analysis there are several criteria: 1) Is the product/model that will be developed is important for education? 2) Does the product / model has the possibility to be developed? 3) Is there a human who has the skills, knowledge, and experience that will develop the product? 4) Is it time to develop a product/model is adequate?
b. Literature: literature study conducted for the temporary introduction of the product/model to be developed. Literature study was undertaken to gather research
Bandung, October 17th, 2015
Proceeding International Seminar on
Mathematics, Science, and Computer Science Education
50
M
findings and other information pertinent to the development of products/models planned.
c. Small Scale Research: developers often have questions that cannot be answered by referring to the research study. Therefore, developers need to conduct small-scale research to find out some things about the product / model to be developed.
2. Planning Research: the research plan. R & D planning is the study includes: 1) formulate research objectives; 2) estimate the funds, manpower and time; 3) formulating the qualifications of researchers and other forms of participation in the study.
3. Design Development: These steps include: 1) Determine the product design/model to be developed (hypothetical design); 2) determine the research facilities needed for research and development process; 3) determine the stages of the implementation of the design in field trials; 4) define the job description for the parties involved in the research.
4. Preliminary Field Test: This step is a test of a product / model on a limited basis. These steps include: 1) conduct initial field testing of the product design / model; 2) is limited, both the substance of the design nor the parties involved; 3) The initial field test performed repeatedly to obtain a decent design, both the substance and methodology.
5. Revised Limited Field Test Results: This step is an improvement model or design based on limited field testing.
6. Main Field Test: a step test product / model on a wide scale. These steps include: 1) testing the effectiveness of the design of the product; 2) testing the effectiveness of the design, in general, to use experimental techniques models; 3) Results of field trials is obtaining effective design, both in terms of substance and methodology.
7. Revision of Wider Field Test: This step is the improvement of the product/model after more extensive field tests.
8. Feasibility: This step is done on a large scale. These steps include: 1) to test the effectiveness and adaptability of product design/model; 2) test the effectiveness and adaptability design involves prospective users of a product/model; 3) The field test results are obtained design model is ready for use, both in terms of substance and methodology.
9. Revised Final Feasibility Test Results: This step will further refine the product / model that is being developed.
10. Final Product Dissemination and Implementation: report on the results of R&D through scientific forums. Distribution of products/ models made after a phase of quality control.
RESULTS
Research has produced mobile applications to enhance the pedagogical competence of mathematics’ teacher in Banten. There are a lot of inputsand recommendations from materials/contents, educational, and media expert to the product being developed. The interface has built show in Figure 1.
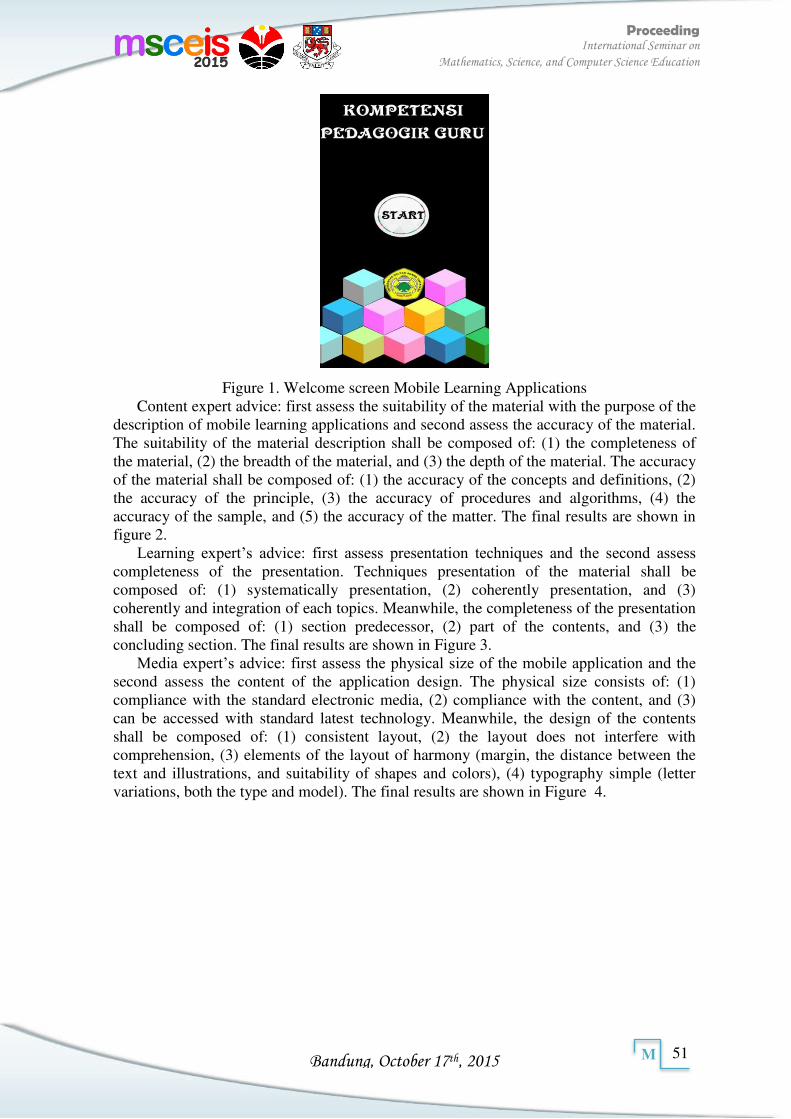
Bandung, October 17th, 2015
Proceeding International Seminar on
Mathematics, Science, and Computer Science Education
51
M
Figure 1. Welcome screen Mobile Learning Applications Content expert advice: first assess the suitability of the material with the purpose of the
description of mobile learning applications and second assess the accuracy of the material. The suitability of the material description shall be composed of: (1) the completeness of the material, (2) the breadth of the material, and (3) the depth of the material. The accuracy of the material shall be composed of: (1) the accuracy of the concepts and definitions, (2) the accuracy of the principle, (3) the accuracy of procedures and algorithms, (4) the accuracy of the sample, and (5) the accuracy of the matter. The final results are shown in figure 2.
Learning expert’s advice: first assess presentation techniques and the second assess completeness of the presentation. Techniques presentation of the material shall be composed of: (1) systematically presentation, (2) coherently presentation, and (3) coherently and integration of each topics. Meanwhile, the completeness of the presentation shall be composed of: (1) section predecessor, (2) part of the contents, and (3) the concluding section. The final results are shown in Figure 3.
Media expert’s advice: first assess the physical size of the mobile application and the second assess the content of the application design. The physical size consists of: (1) compliance with the standard electronic media, (2) compliance with the content, and (3) can be accessed with standard latest technology. Meanwhile, the design of the contents shall be composed of: (1) consistent layout, (2) the layout does not interfere with comprehension, (3) elements of the layout of harmony (margin, the distance between the text and illustrations, and suitability of shapes and colors), (4) typography simple (letter variations, both the type and model). The final results are shown in Figure 4.
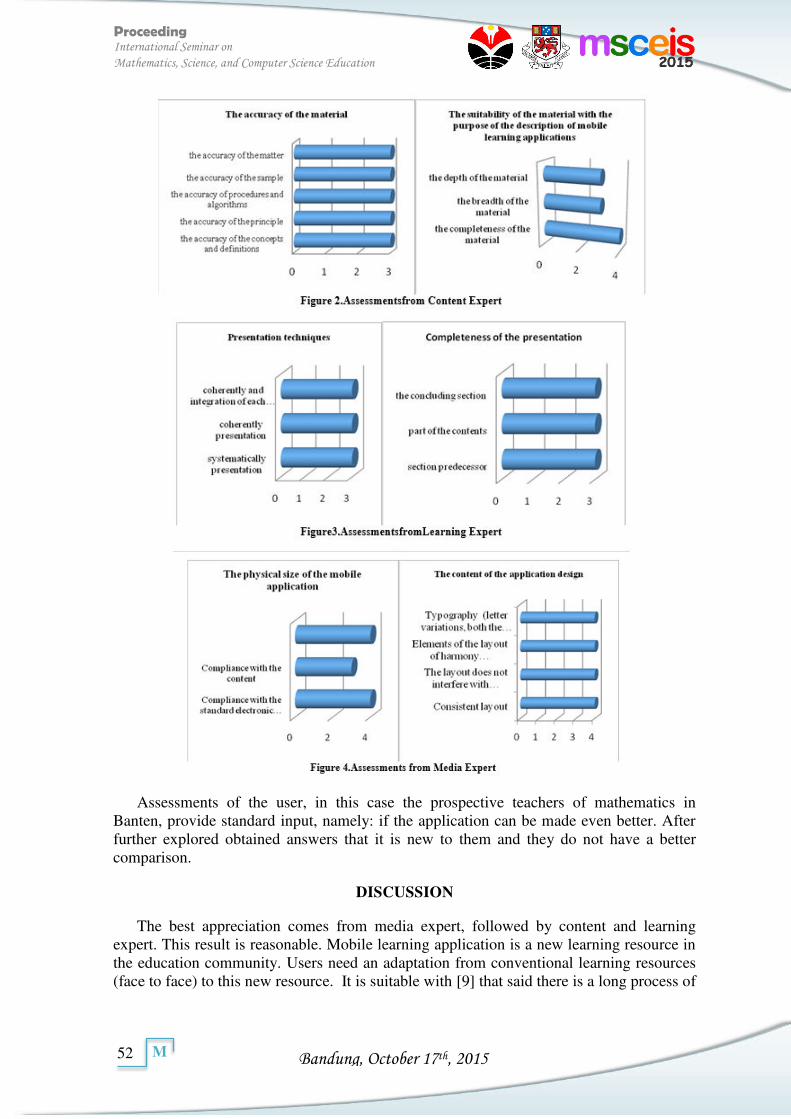
Bandung, October 17th, 2015
Proceeding International Seminar on
Mathematics, Science, and Computer Science Education
52
M
Assessments of the user, in this case the prospective teachers of mathematics in Banten, provide standard input, namely: if the application can be made even better. After further explored obtained answers that it is new to them and they do not have a better comparison.
DISCUSSION
The best appreciation comes from media expert, followed by content and learning expert. This result is reasonable. Mobile learning application is a new learning resource in the education community. Users need an adaptation from conventional learning resources (face to face) to this new resource. It is suitable with [9] that said there is a long process of
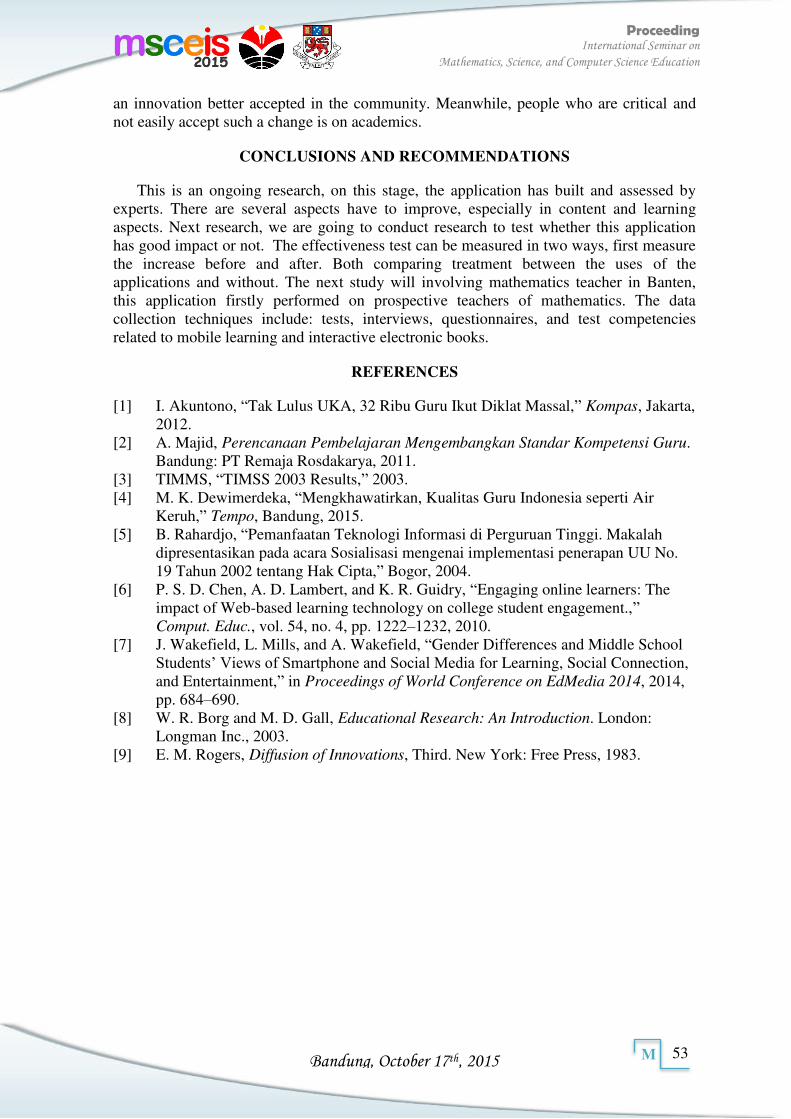
Bandung, October 17th, 2015
Proceeding International Seminar on
Mathematics, Science, and Computer Science Education
53
M
an innovation better accepted in the community. Meanwhile, people who are critical and not easily accept such a change is on academics.
CONCLUSIONS AND RECOMMENDATIONS
This is an ongoing research, on this stage, the application has built and assessed by experts. There are several aspects have to improve, especially in content and learning aspects. Next research, we are going to conduct research to test whether this application has good impact or not. The effectiveness test can be measured in two ways, first measure the increase before and after. Both comparing treatment between the uses of the applications and without. The next study will involving mathematics teacher in Banten, this application firstly performed on prospective teachers of mathematics. The data collection techniques include: tests, interviews, questionnaires, and test competencies related to mobile learning and interactive electronic books.
REFERENCES
[1] I. Akuntono, “Tak Lulus UKA, 32 Ribu Guru Ikut Diklat Massal,” Kompas, Jakarta, 2012.
[2] A. Majid, Perencanaan Pembelajaran Mengembangkan Standar Kompetensi Guru. Bandung: PT Remaja Rosdakarya, 2011.
[3] TIMMS, “TIMSS 2003 Results,” 2003. [4] M. K. Dewimerdeka, “Mengkhawatirkan, Kualitas Guru Indonesia seperti Air
Keruh,” Tempo, Bandung, 2015. [5] B. Rahardjo, “Pemanfaatan Teknologi Informasi di Perguruan Tinggi. Makalah
dipresentasikan pada acara Sosialisasi mengenai implementasi penerapan UU No. 19 Tahun 2002 tentang Hak Cipta,” Bogor, 2004.
[6] P. S. D. Chen, A. D. Lambert, and K. R. Guidry, “Engaging online learners: The impact of Web-based learning technology on college student engagement.,” Comput. Educ., vol. 54, no. 4, pp. 1222–1232, 2010.
[7] J. Wakefield, L. Mills, and A. Wakefield, “Gender Differences and Middle School Students’ Views of Smartphone and Social Media for Learning, Social Connection, and Entertainment,” in Proceedings of World Conference on EdMedia 2014, 2014, pp. 684–690.
[8] W. R. Borg and M. D. Gall, Educational Research: An Introduction. London: Longman Inc., 2003.
[9] E. M. Rogers, Diffusion of Innovations, Third. New York: Free Press, 1983.
Bandung, October 17th, 2015
Proceeding International Seminar on
Mathematics, Science, and Computer Science Education
54
M
Bandung, October 17th, 2015
Proceeding International Seminar on
Mathematics, Science, and Computer Science Education
55
M
MATH-07131
Qualitative Became Easier With ATLAS.ti
Ekasatya Aldila Afriansyah1
1Doctoral Student of Mathematics Education Departement
Universitas Pendidikan Indonesia
Article info Abstract
Keywords:
qualitative research, qualitative software, ATLAS.ti, grounded theory, coding.
According to some Indonesian research, especially in mathematics education, qualitative research was still less interested. It became one of basic problem that the researcher wanted to discuss. Hoping after all researchers read this study, the interest of them appeared to do qualitative research. In this study, researcher introduced one of data analysis qualitative software, namely ATLAS.ti. This software was useful in helping with the process of data analysis qualitative research, especially grounded theory. Grounded theory, as ATLAS.ti, was given coding in any research data. It would be making easier for researchers to call back data later, or so on. Based on this helpful thing, researcher hoped through this research it would create a procedure data analysis qualitative research assisted by ATLAS.ti. This procedure appeared through an example of an application of one case in the field of mathematics education. The result of this research was a procedure based on the case of researcher used.
Corresponding Author:
Ekasatya Aldila Afriansyah
INTRODUCTION
Years ago, quantitative and qualitative research be a rival as the researchers selection in conducting a study1. However now, qualitative research in among researchers became less desirable especially in the field of mathematics education in Indonesia. This could be seen from several educational institutions having tendency to conduct quantitative research. The reason these elections are very diverse, as an example in managing data of quantitative research tend to be easier than data qualitative research and so on, in need of doing further observation/research to amplify the reason.
Along with the development of technology, various software developed as tools for researchers in conducting research. The impact of qualitative research began to be interested due to appearing some qualitative software be able to assist researchers in organizing qualitative data obtained. On this occasion, the researchers would like to discuss one of the software. It can be used in qualitative research which are rarely used by Indonesian researchers, particularly in the areas of mathematics, namely ATLAS.ti.
Based on the previous explanation, this study has a research question "What is the procedure of data analysis process assisted by ATLAS.ti qualitative software?"
ATLAS.ti is used in qualitative research. This software includes the type of program CAQDAS (Computer-Aided Qualitative Data Analysis Software) or the same as QDA software (Qualitative Data Analysis Software). Name of ATLAS sustains the idea of a world map, and it is described in managing meaningful document. As for the abbreviation .ti in naming the software provides the meaning of text interpretation2.
ATLAS.ti can help us organize the data, provide the code, and analyze the data efficiently and structured. This software is able to read various types of data, such as audio data, video data, image data, and the reference data (articles, books, survey data, or a transcript of the interview). This allows us to perform the triangulation with various types of data collection. In line with the explanation by Drijvers, ATLAS.ti have four advantages
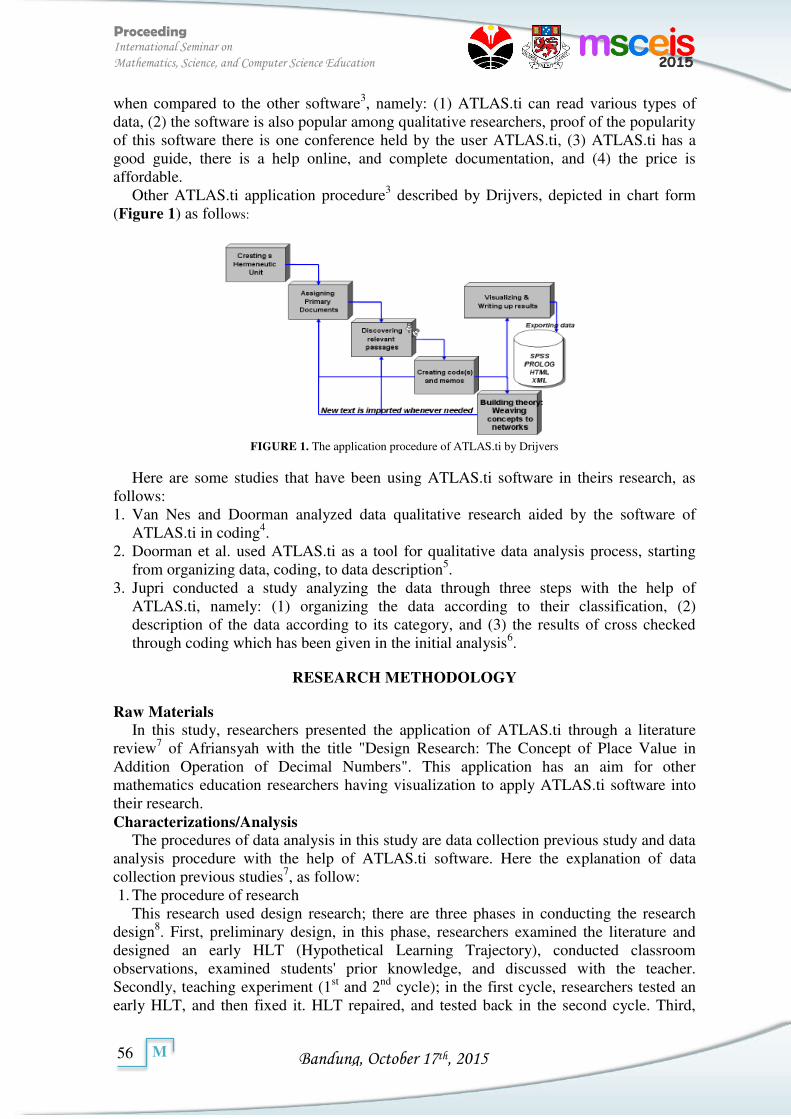
Bandung, October 17th, 2015
Proceeding International Seminar on
Mathematics, Science, and Computer Science Education
56
M
when compared to the other software3, namely: (1) ATLAS.ti can read various types of data, (2) the software is also popular among qualitative researchers, proof of the popularity of this software there is one conference held by the user ATLAS.ti, (3) ATLAS.ti has a good guide, there is a help online, and complete documentation, and (4) the price is affordable.
Other ATLAS.ti application procedure3 described by Drijvers, depicted in chart form (Figure 1) as follows:
FIGURE 1. The application procedure of ATLAS.ti by Drijvers
Here are some studies that have been using ATLAS.ti software in theirs research, as follows: 1. Van Nes and Doorman analyzed data qualitative research aided by the software of
ATLAS.ti in coding4. 2. Doorman et al. used ATLAS.ti as a tool for qualitative data analysis process, starting
from organizing data, coding, to data description5. 3. Jupri conducted a study analyzing the data through three steps with the help of
ATLAS.ti, namely: (1) organizing the data according to their classification, (2) description of the data according to its category, and (3) the results of cross checked through coding which has been given in the initial analysis6.
RESEARCH METHODOLOGY
Raw Materials In this study, researchers presented the application of ATLAS.ti through a literature
review7 of Afriansyah with the title "Design Research: The Concept of Place Value in Addition Operation of Decimal Numbers". This application has an aim for other mathematics education researchers having visualization to apply ATLAS.ti software into their research. Characterizations/Analysis
The procedures of data analysis in this study are data collection previous study and data analysis procedure with the help of ATLAS.ti software. Here the explanation of data collection previous studies7, as follow: 1. The procedure of research
This research used design research; there are three phases in conducting the research design8. First, preliminary design, in this phase, researchers examined the literature and designed an early HLT (Hypothetical Learning Trajectory), conducted classroom observations, examined students' prior knowledge, and discussed with the teacher. Secondly, teaching experiment (1st and 2nd cycle); in the first cycle, researchers tested an early HLT, and then fixed it. HLT repaired, and tested back in the second cycle. Third,
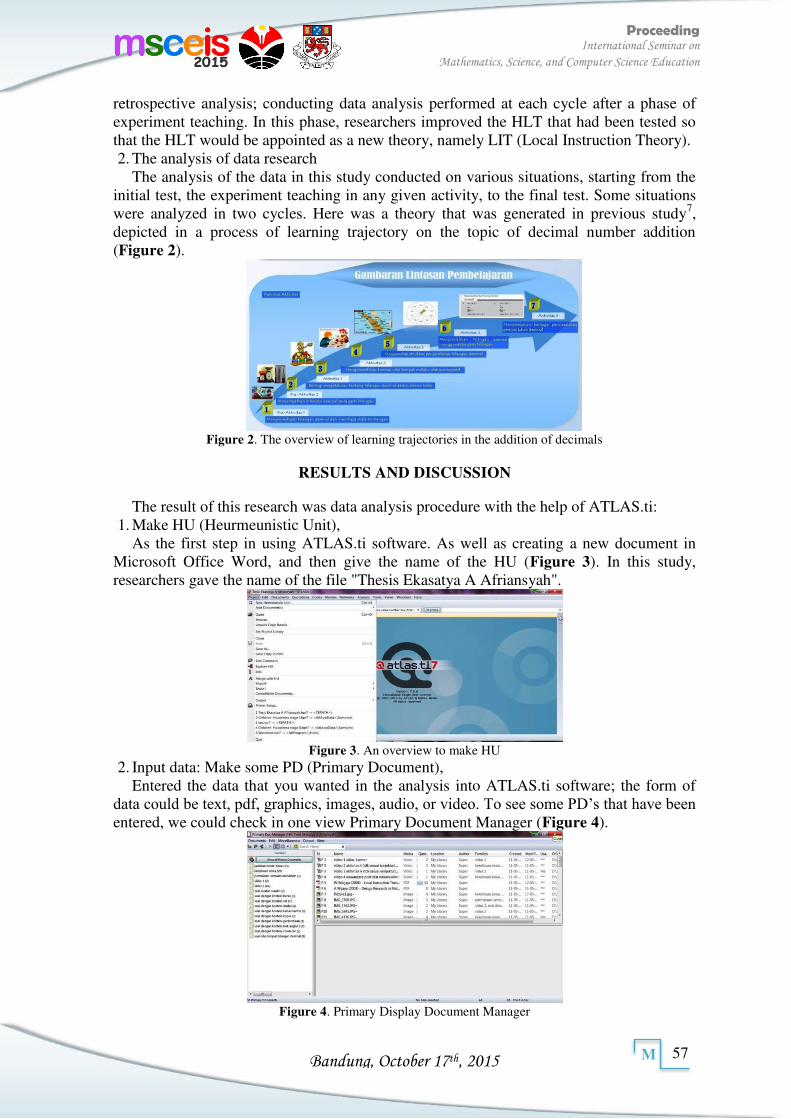
Bandung, October 17th, 2015
Proceeding International Seminar on
Mathematics, Science, and Computer Science Education
57
M
retrospective analysis; conducting data analysis performed at each cycle after a phase of experiment teaching. In this phase, researchers improved the HLT that had been tested so that the HLT would be appointed as a new theory, namely LIT (Local Instruction Theory). 2. The analysis of data research
The analysis of the data in this study conducted on various situations, starting from the initial test, the experiment teaching in any given activity, to the final test. Some situations were analyzed in two cycles. Here was a theory that was generated in previous study7, depicted in a process of learning trajectory on the topic of decimal number addition (Figure 2).
Figure 2. The overview of learning trajectories in the addition of decimals
RESULTS AND DISCUSSION
The result of this research was data analysis procedure with the help of ATLAS.ti: 1. Make HU (Heurmeunistic Unit),
As the first step in using ATLAS.ti software. As well as creating a new document in Microsoft Office Word, and then give the name of the HU (Figure 3). In this study, researchers gave the name of the file "Thesis Ekasatya A Afriansyah".
Figure 3. An overview to make HU
2. Input data: Make some PD (Primary Document), Entered the data that you wanted in the analysis into ATLAS.ti software; the form of
data could be text, pdf, graphics, images, audio, or video. To see some PD’s that have been entered, we could check in one view Primary Document Manager (Figure 4).
Figure 4. Primary Display Document Manager
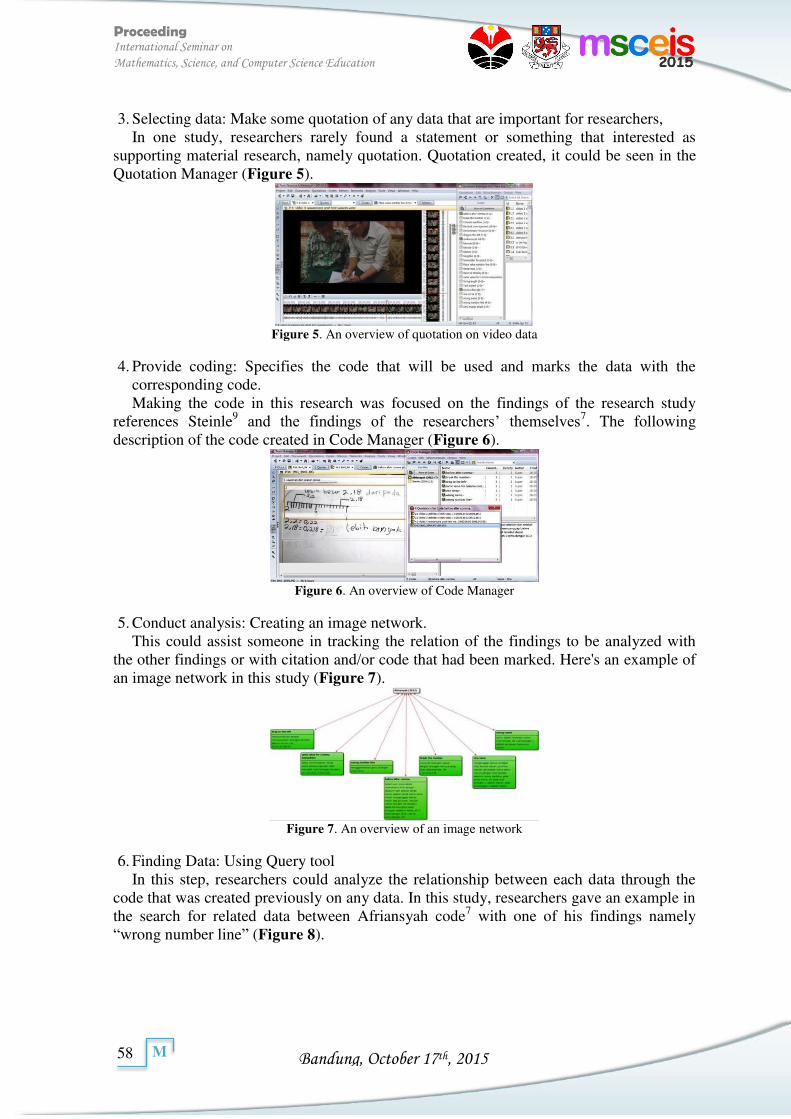
Bandung, October 17th, 2015
Proceeding International Seminar on
Mathematics, Science, and Computer Science Education
58
M
3. Selecting data: Make some quotation of any data that are important for researchers, In one study, researchers rarely found a statement or something that interested as
supporting material research, namely quotation. Quotation created, it could be seen in the Quotation Manager (Figure 5).
Figure 5. An overview of quotation on video data
4. Provide coding: Specifies the code that will be used and marks the data with the corresponding code. Making the code in this research was focused on the findings of the research study
references Steinle9 and the findings of the researchers’ themselves7. The following description of the code created in Code Manager (Figure 6).
Figure 6. An overview of Code Manager
5. Conduct analysis: Creating an image network. This could assist someone in tracking the relation of the findings to be analyzed with
the other findings or with citation and/or code that had been marked. Here's an example of an image network in this study (Figure 7).
Figure 7. An overview of an image network
6. Finding Data: Using Query tool In this step, researchers could analyze the relationship between each data through the
code that was created previously on any data. In this study, researchers gave an example in the search for related data between Afriansyah code7 with one of his findings namely “wrong number line” (Figure 8).
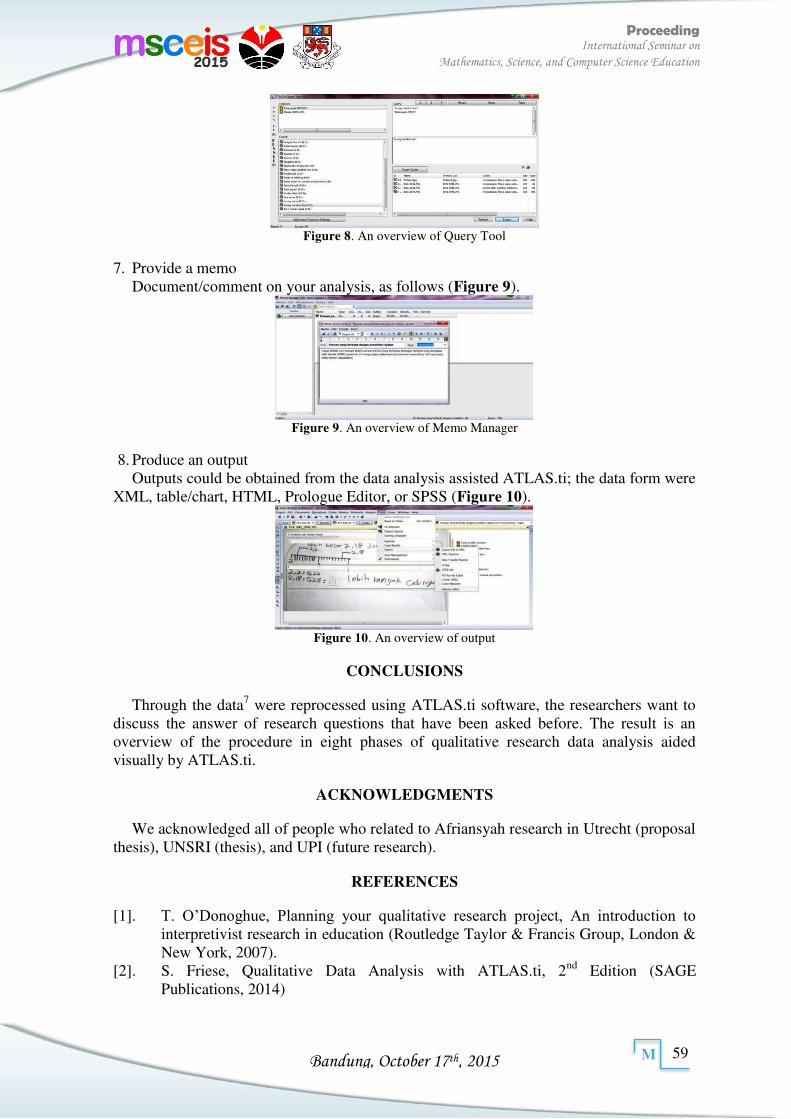
Bandung, October 17th, 2015
Proceeding International Seminar on
Mathematics, Science, and Computer Science Education
59
M
Figure 8. An overview of Query Tool
7. Provide a memo Document/comment on your analysis, as follows (Figure 9).
Figure 9. An overview of Memo Manager
8. Produce an output Outputs could be obtained from the data analysis assisted ATLAS.ti; the data form were
XML, table/chart, HTML, Prologue Editor, or SPSS (Figure 10).
Figure 10. An overview of output
CONCLUSIONS
Through the data7 were reprocessed using ATLAS.ti software, the researchers want to discuss the answer of research questions that have been asked before. The result is an overview of the procedure in eight phases of qualitative research data analysis aided visually by ATLAS.ti.
ACKNOWLEDGMENTS
We acknowledged all of people who related to Afriansyah research in Utrecht (proposal thesis), UNSRI (thesis), and UPI (future research).
REFERENCES
[1]. T. O’Donoghue, Planning your qualitative research project, An introduction to interpretivist research in education (Routledge Taylor & Francis Group, London & New York, 2007).
[2]. S. Friese, Qualitative Data Analysis with ATLAS.ti, 2nd Edition (SAGE Publications, 2014)
Bandung, October 17th, 2015
Proceeding International Seminar on
Mathematics, Science, and Computer Science Education
60
M
[3]. P. Drijvers, “Analysing qualitative data with ATLAS.ti,” in Modul Presentation by
Drijvers (Freudenthal Institute, Utrecht University, Netherlands, 2012), pp. 1-37. [4]. F. Van Nes and M. Doorman, “The Interaction Between Multimedia Data Analysis
and Theory Development in Design Research,” in Mathematics Education
Research Journal Vol. 22 No. 1, (2010), pp. 6-30. [5]. M. Doorman, P. Drijvers, K. Gravemeijer, P. Boon, and H. Reed, “Tool use and the
development of the function concept: From repeated calculations to functional thinking,” in International Journal of Science and Mathematics Education 10, (2012), pp. 1243-1267.
[6]. A.Jupri, “The use of applets to improve Indonesian student performance in algebra,” Ph.D. thesis, Utrecht University, 2015.
[7]. E. A. Afriansyah, “Design Research: Konsep Nilai Tempat pada Penjumlahan Bilangan Desimal,” Master thesis, Sriwijaya University – Utrecht University, 2012.
[8]. K. Gravemeijer and P. Cobb, “Design research from the learning design perspective,” in Educational design research (Routladge, London, 2006), pp. 17-51
[9]. W. Widjaja, “Local Instruction Theory on Desimals: The Case of Indonesian Pre-Service Teachers,” Ph.D. thesis, Melbourne University, 2008.
Bandung, October 17th, 2015
Proceeding International Seminar on
Mathematics, Science, and Computer Science Education
61
M
MATH-07132
Mathematical Proof Learning for Beginner
Indra Siregar
Universitas Pendidikan Indonesia
Article info Abstract
Keywords: Mathematical Proof, analysis epistemological learning obstacle, ontogenis/ didactic learning obstacle, mathematical university, logical mathematics.
Mathematical proof is very important in mathematics learning at university level,but mathematical proof was not easy to be learned. To answer these problems, a research was conducted to figure out why the mathematical proof was difficult to be learned and how the solutions helped students in mastering the mathematical proof. In attempt to resolve these issues, analysis epistemological learning obstacle and ontogenis/ didactic learning obstacle was done. The result is students learning difficulties of proof due to lack of mastery in logical mathematics and founded the missing link between logical mathematics theory and mathematical proof. The existance of the missing link made the books could be understood by those who have mastered the mathematical proof only.
Corresponding Author: Indra Siregar [email protected]
INTRODUCTION
Every one who learn mathematics at university will see Definition/Aksioma, teorema, and lemma. That is rule on mathematics. Definition/Aksioma not need a proof, but teorema and lemma need a proof. Therefore mathematical proof is very important in mathematics learning at university level. Students were often faced with the theorems and lemma that demanding proof.
In the fact, mathematical proof was not easy to be learned. Mathematical proof is difficult think for university student in Indonesia (Maya, 2011). If the students faced the difficulties in learning proof, it would have made worse effect to the process of mathematical learning.
In this research will answer the question what’s the problem which make mathematical proof is difficult for many Indonesian student? And What’s the solution?
METHOD
To answer these problems, a research was conducted to figure out why the mathematical proof was difficult to be learned and how the solutions helped students in mastering the mathematical proof. In attempt to resolve these issues, analysis epistemological learning obstacle and ontogenis/ didactic learning obstacle was done.
Brown (Perbowo, 2012), said that learning obstacle is the way to understanding learning problem on student. Brown (Perbowo, 2012) dividing learning obstacle to ontogenical learning obstacle, didaktical learning obstacle, and epistimological leaning obstacle. Epistemological learning obstacle analysis is leaning problem which be related with subject metter. Ontogenical and didactical learning obstacle analysis is leaning problem which be related with development of thinking. Ontogenic is related with development of thingking on student, didactic is related with development of thingking on teaching materials.
Epistemological learning obstacle analysis were done by give proof problem to some student in a university. Ontogenical/ didactical learning obstacle analysis were done by
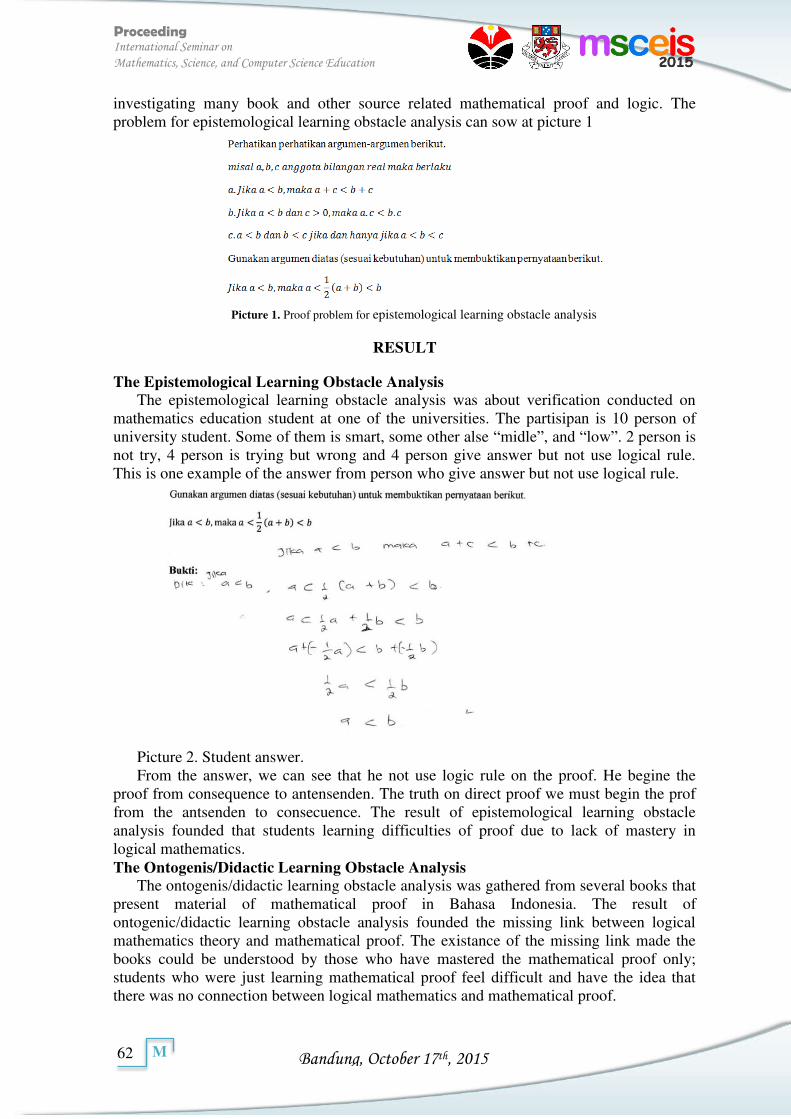
Bandung, October 17th, 2015
Proceeding International Seminar on
Mathematics, Science, and Computer Science Education
62
M
investigating many book and other source related mathematical proof and logic. The problem for epistemological learning obstacle analysis can sow at picture 1
Picture 1. Proof problem for epistemological learning obstacle analysis
RESULT
The Epistemological Learning Obstacle Analysis
The epistemological learning obstacle analysis was about verification conducted on mathematics education student at one of the universities. The partisipan is 10 person of university student. Some of them is smart, some other alse “midle”, and “low”. 2 person is not try, 4 person is trying but wrong and 4 person give answer but not use logical rule. This is one example of the answer from person who give answer but not use logical rule.
Picture 2. Student answer. From the answer, we can see that he not use logic rule on the proof. He begine the
proof from consequence to antensenden. The truth on direct proof we must begin the prof from the antsenden to consecuence. The result of epistemological learning obstacle analysis founded that students learning difficulties of proof due to lack of mastery in logical mathematics. The Ontogenis/Didactic Learning Obstacle Analysis
The ontogenis/didactic learning obstacle analysis was gathered from several books that present material of mathematical proof in Bahasa Indonesia. The result of ontogenic/didactic learning obstacle analysis founded the missing link between logical mathematics theory and mathematical proof. The existance of the missing link made the books could be understood by those who have mastered the mathematical proof only; students who were just learning mathematical proof feel difficult and have the idea that there was no connection between logical mathematics and mathematical proof.
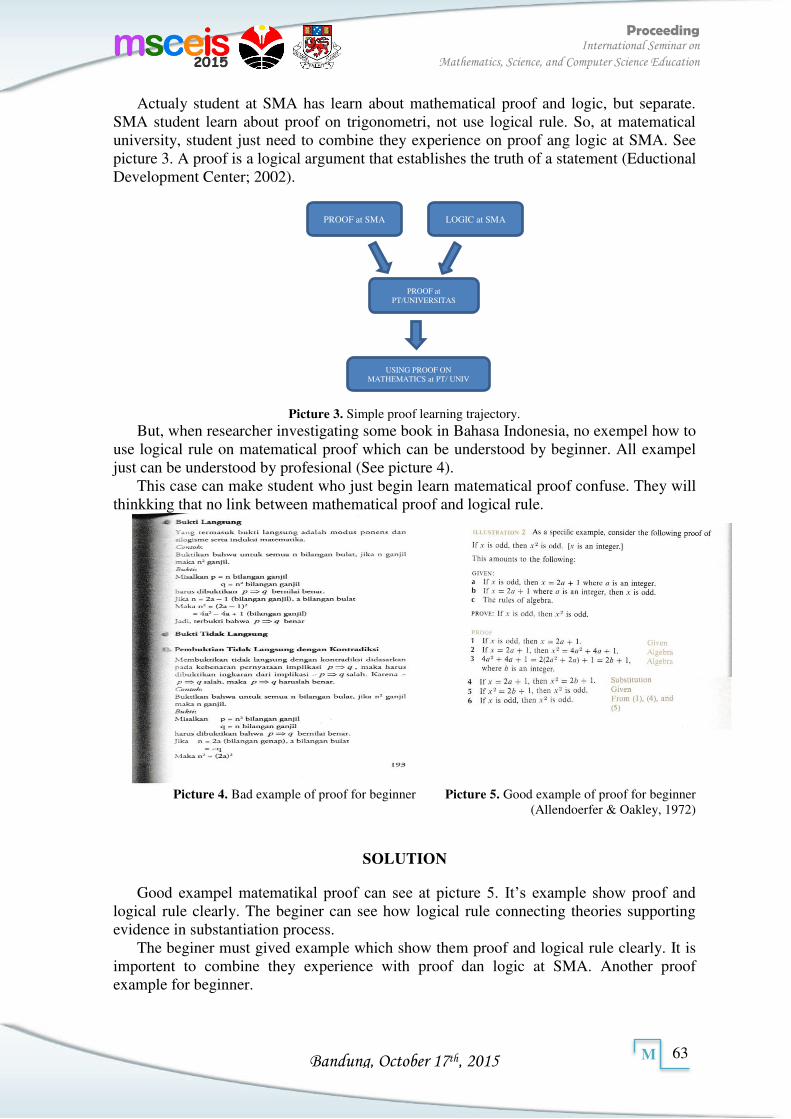
Bandung, October 17th, 2015
Proceeding International Seminar on
Mathematics, Science, and Computer Science Education
63
M
Actualy student at SMA has learn about mathematical proof and logic, but separate. SMA student learn about proof on trigonometri, not use logical rule. So, at matematical university, student just need to combine they experience on proof ang logic at SMA. See picture 3. A proof is a logical argument that establishes the truth of a statement (Eductional Development Center; 2002).
Picture 3. Simple proof learning trajectory.
But, when researcher investigating some book in Bahasa Indonesia, no exempel how to use logical rule on matematical proof which can be understood by beginner. All exampel just can be understood by profesional (See picture 4).
This case can make student who just begin learn matematical proof confuse. They will thinkking that no link between mathematical proof and logical rule.
Picture 4. Bad example of proof for beginner Picture 5. Good example of proof for beginner
(Allendoerfer & Oakley, 1972)
SOLUTION
Good exampel matematikal proof can see at picture 5. It’s example show proof and logical rule clearly. The beginer can see how logical rule connecting theories supporting evidence in substantiation process.
The beginer must gived example which show them proof and logical rule clearly. It is importent to combine they experience with proof dan logic at SMA. Another proof example for beginner.
PROOF at SMA
PROOF at
PT/UNIVERSITAS
LOGIC at SMA
USING PROOF ON MATHEMATICS at PT/ UNIV
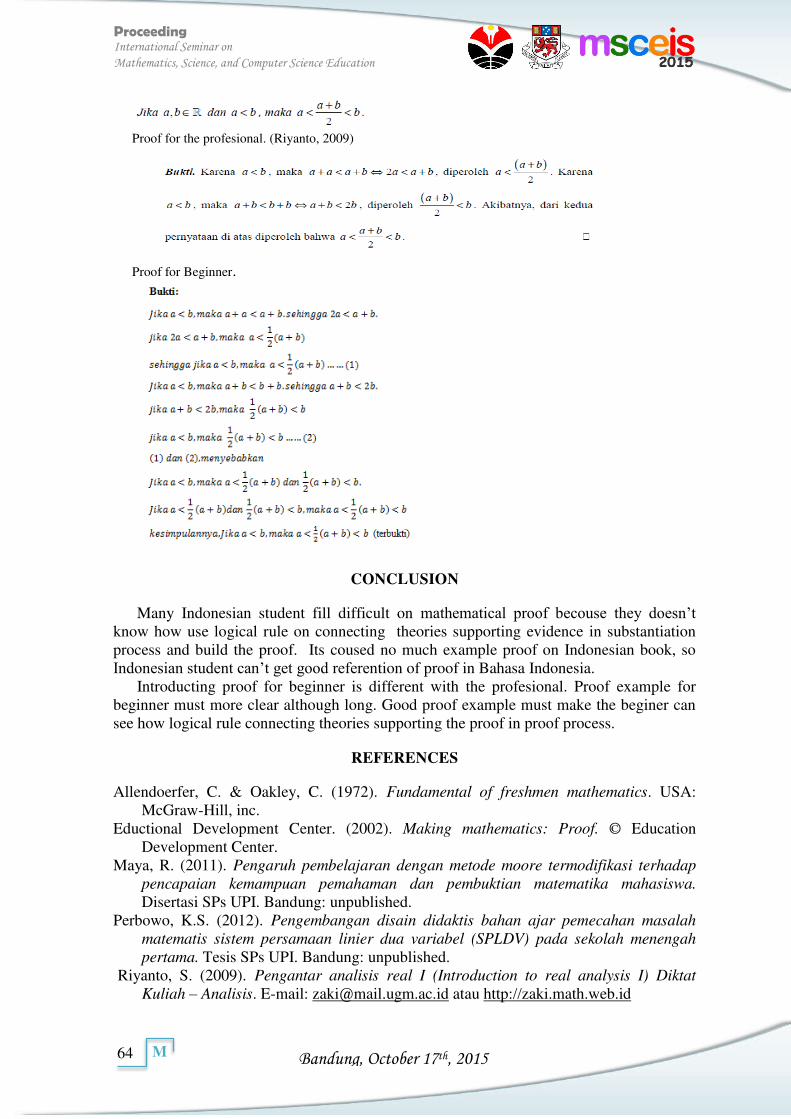
Bandung, October 17th, 2015
Proceeding International Seminar on
Mathematics, Science, and Computer Science Education
64
M
Proof for the profesional. (Riyanto, 2009)
Proof for Beginner.
CONCLUSION
Many Indonesian student fill difficult on mathematical proof becouse they doesn’t know how use logical rule on connecting theories supporting evidence in substantiation process and build the proof. Its coused no much example proof on Indonesian book, so Indonesian student can’t get good referention of proof in Bahasa Indonesia.
Introducting proof for beginner is different with the profesional. Proof example for beginner must more clear although long. Good proof example must make the beginer can see how logical rule connecting theories supporting the proof in proof process.
REFERENCES
Allendoerfer, C. & Oakley, C. (1972). Fundamental of freshmen mathematics. USA: McGraw-Hill, inc.
Eductional Development Center. (2002). Making mathematics: Proof. © Education Development Center.
Maya, R. (2011). Pengaruh pembelajaran dengan metode moore termodifikasi terhadap
pencapaian kemampuan pemahaman dan pembuktian matematika mahasiswa.
Disertasi SPs UPI. Bandung: unpublished. Perbowo, K.S. (2012). Pengembangan disain didaktis bahan ajar pemecahan masalah
matematis sistem persamaan linier dua variabel (SPLDV) pada sekolah menengah
pertama. Tesis SPs UPI. Bandung: unpublished. Riyanto, S. (2009). Pengantar analisis real I (Introduction to real analysis I) Diktat
Kuliah – Analisis. E-mail: [email protected] atau http://zaki.math.web.id
Bandung, October 17th, 2015
Proceeding International Seminar on
Mathematics, Science, and Computer Science Education
65
M
MATH-07142
Analysis Of Student Difficulties In Constructing Mathematical
Proof On Discrete Mathematics Course
Abdul Mujib1,2
1Departemen PMIPA, Universitas Pendidikan Indonesia 2Departemen Pendidikan Matematika, Universitas Muslim Nusantara Al-Washliyah
Article info Abstract
Keywords: Difficulties student, proof construction, discrete mathematics.
This study aimed to analyze the difficulties students in constructing mathematical proof on discrete mathematics course. This study was conducted in mathematics education student who contracted course discrete mathematics. Data were collected by test results and interviews with students. The result of the analyses revealed four main difficulties faced by students: (1) understanding of mathematical concepts, (2) language and mathematical notation, (3) strategies of proof, and (4) read of proof. In addition, student perception about mathematics and mathematical proof construction affected student proof. Writing about a good proof was another difficulty faced by students.
Corresponding Author: Abdul Mujib Departemen PMIPA, Universitas Pendidikan Indonesia, Jl. Dr. Setiabudi no 229, Bandung 40154, Indonesia Departemen Pendidikan Matematika, Universitas Muslim Nusantara Al-Washliyah, Jl. Garu II no 2, Medan, Indonesia
INTRODUCTION
Study of college-level mathematics, can’t be separated from the ability to proof. The proof is one of the advanced mathematical skills are perceived as the most difficult ability to achieve most of the students [3; 4; 8]. Some studies show that the ability of proving the students, even students, are still low [2; 4; 6; 7]. Topics studied mathematics as well as diverse as number theory, calculus, geometry, real analysis and algebraic structure. Student difficulties in constructing proof on discrete mathematics course still rarely studied.
Discrete mathematics is one of the subjects that can not be separated from the problem of proof, although more discrete mathematics examines the counting, algorithmic computing, and its application in daily life [1]. But, in addition to the study, the basic concepts of mathematics: the ability to prove is an important issue that must be mastered by the students in the study of discrete mathematics. Discrete mathematics course is a lecture given at the final level in Mathematics Education courses are not spared from studying the mathematical proofs, although discrete mathematics known as applied mathematics are very important in our lives. For examples smartphone technology applications, communication network systems, and other highly related to discrete mathematics. But before reaching that stage, the concepts related to discrete mathematics theorems need to be proved mathematically. So the ability of proving indispensable in the study of this course. And the character of this course are discrete, so it requires a certain creativity by students in constructing proof. Learning with an emphasis on axiomatic deductive reasoning made through the concepts and properties of the mathematical system
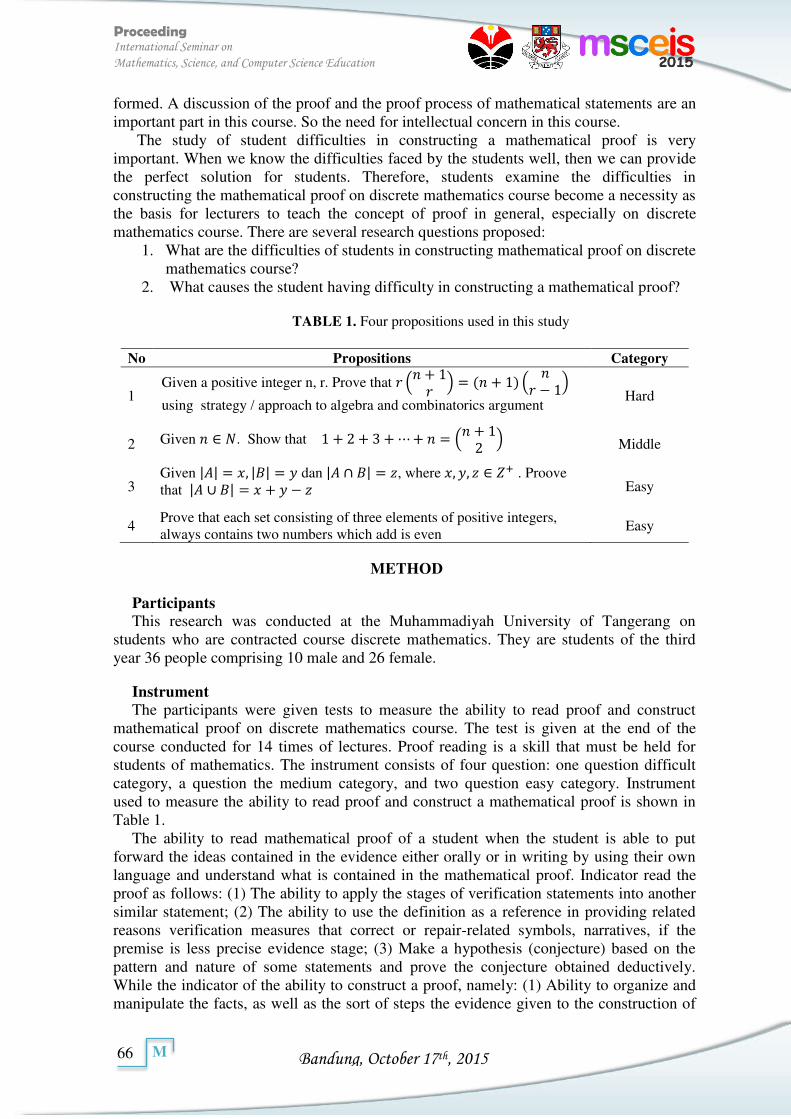
Bandung, October 17th, 2015
Proceeding International Seminar on
Mathematics, Science, and Computer Science Education
66
M
formed. A discussion of the proof and the proof process of mathematical statements are an important part in this course. So the need for intellectual concern in this course.
The study of student difficulties in constructing a mathematical proof is very important. When we know the difficulties faced by the students well, then we can provide the perfect solution for students. Therefore, students examine the difficulties in constructing the mathematical proof on discrete mathematics course become a necessity as the basis for lecturers to teach the concept of proof in general, especially on discrete mathematics course. There are several research questions proposed:
1. What are the difficulties of students in constructing mathematical proof on discrete mathematics course?
2. What causes the student having difficulty in constructing a mathematical proof?
TABLE 1. Four propositions used in this study
No Propositions Category
1 Given a positive integer n, r. Prove that
+ = + −
using strategy / approach to algebra and combinatorics argument Hard
2 Given ∈ . Show that + + + + = + Middle
3 Given | | = , | | = dan | | = , where , , ∈ + . Proove that | | = + − Easy
4 Prove that each set consisting of three elements of positive integers, always contains two numbers which add is even
Easy
METHOD
Participants This research was conducted at the Muhammadiyah University of Tangerang on
students who are contracted course discrete mathematics. They are students of the third year 36 people comprising 10 male and 26 female.
Instrument The participants were given tests to measure the ability to read proof and construct
mathematical proof on discrete mathematics course. The test is given at the end of the course conducted for 14 times of lectures. Proof reading is a skill that must be held for students of mathematics. The instrument consists of four question: one question difficult category, a question the medium category, and two question easy category. Instrument used to measure the ability to read proof and construct a mathematical proof is shown in Table 1.
The ability to read mathematical proof of a student when the student is able to put forward the ideas contained in the evidence either orally or in writing by using their own language and understand what is contained in the mathematical proof. Indicator read the proof as follows: (1) The ability to apply the stages of verification statements into another similar statement; (2) The ability to use the definition as a reference in providing related reasons verification measures that correct or repair-related symbols, narratives, if the premise is less precise evidence stage; (3) Make a hypothesis (conjecture) based on the pattern and nature of some statements and prove the conjecture obtained deductively. While the indicator of the ability to construct a proof, namely: (1) Ability to organize and manipulate the facts, as well as the sort of steps the evidence given to the construction of
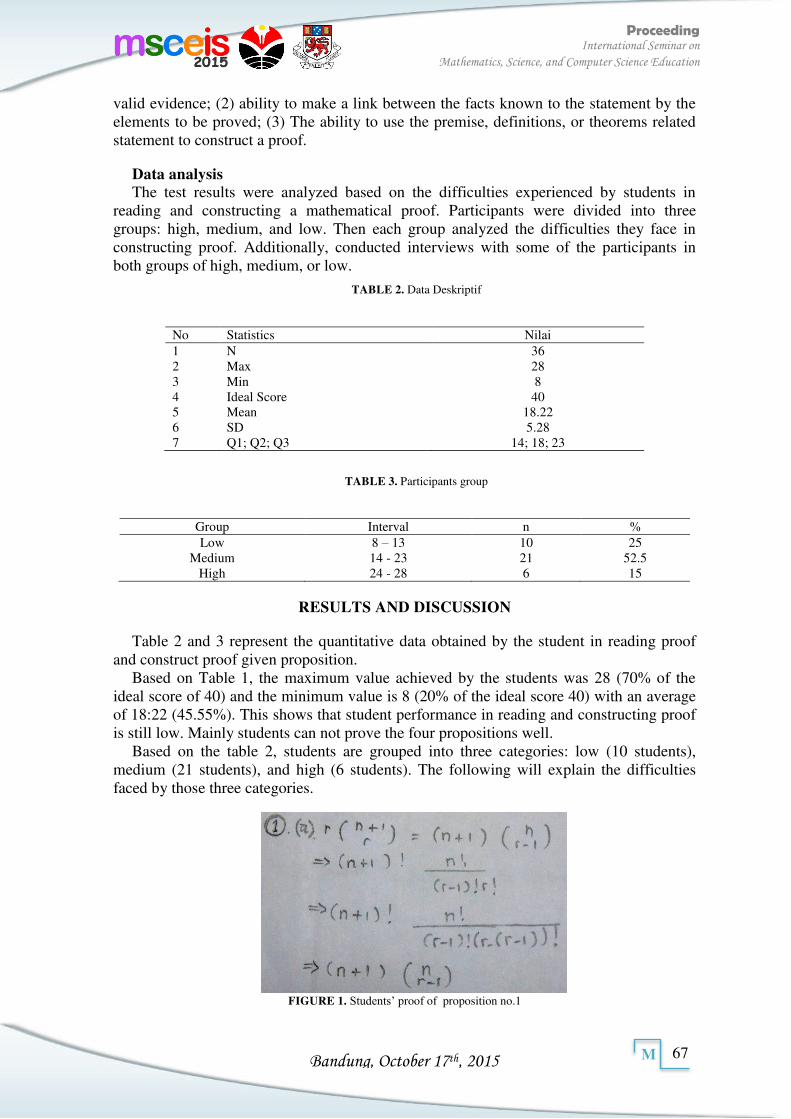
Bandung, October 17th, 2015
Proceeding International Seminar on
Mathematics, Science, and Computer Science Education
67
M
valid evidence; (2) ability to make a link between the facts known to the statement by the elements to be proved; (3) The ability to use the premise, definitions, or theorems related statement to construct a proof.
Data analysis The test results were analyzed based on the difficulties experienced by students in
reading and constructing a mathematical proof. Participants were divided into three groups: high, medium, and low. Then each group analyzed the difficulties they face in constructing proof. Additionally, conducted interviews with some of the participants in both groups of high, medium, or low.
TABLE 2. Data Deskriptif
No Statistics Nilai 1 N 36 2 Max 28 3 Min 8 4 Ideal Score 40 5 Mean 18.22 6 SD 5.28 7 Q1; Q2; Q3 14; 18; 23
TABLE 3. Participants group
Group Interval n % Low 8 – 13 10 25
Medium 14 - 23 21 52.5 High 24 - 28 6 15
RESULTS AND DISCUSSION
Table 2 and 3 represent the quantitative data obtained by the student in reading proof and construct proof given proposition.
Based on Table 1, the maximum value achieved by the students was 28 (70% of the ideal score of 40) and the minimum value is 8 (20% of the ideal score 40) with an average of 18:22 (45.55%). This shows that student performance in reading and constructing proof is still low. Mainly students can not prove the four propositions well.
Based on the table 2, students are grouped into three categories: low (10 students), medium (21 students), and high (6 students). The following will explain the difficulties faced by those three categories.
FIGURE 1. Students’ proof of proposition no.1
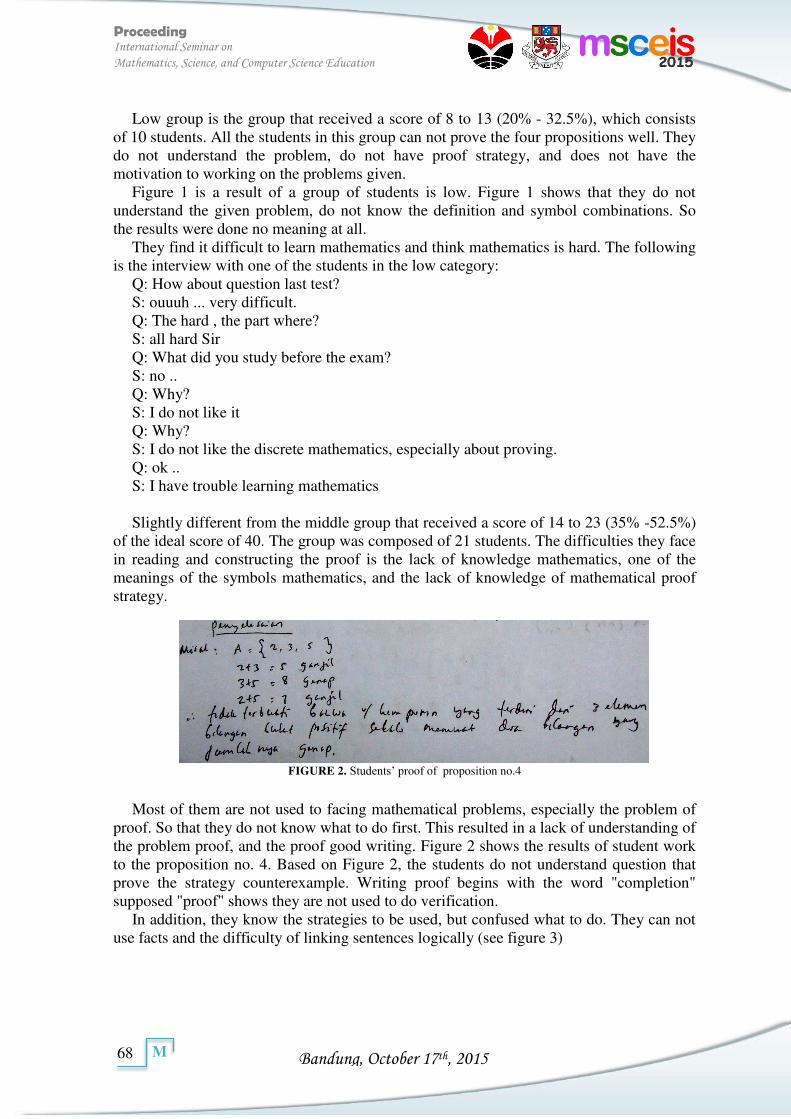
Bandung, October 17th, 2015
Proceeding International Seminar on
Mathematics, Science, and Computer Science Education
68
M
Low group is the group that received a score of 8 to 13 (20% - 32.5%), which consists of 10 students. All the students in this group can not prove the four propositions well. They do not understand the problem, do not have proof strategy, and does not have the motivation to working on the problems given.
Figure 1 is a result of a group of students is low. Figure 1 shows that they do not understand the given problem, do not know the definition and symbol combinations. So the results were done no meaning at all.
They find it difficult to learn mathematics and think mathematics is hard. The following is the interview with one of the students in the low category:
Q: How about question last test? S: ouuuh ... very difficult. Q: The hard , the part where? S: all hard Sir Q: What did you study before the exam? S: no .. Q: Why? S: I do not like it Q: Why? S: I do not like the discrete mathematics, especially about proving. Q: ok .. S: I have trouble learning mathematics Slightly different from the middle group that received a score of 14 to 23 (35% -52.5%)
of the ideal score of 40. The group was composed of 21 students. The difficulties they face in reading and constructing the proof is the lack of knowledge mathematics, one of the meanings of the symbols mathematics, and the lack of knowledge of mathematical proof strategy.
FIGURE 2. Students’ proof of proposition no.4
Most of them are not used to facing mathematical problems, especially the problem of proof. So that they do not know what to do first. This resulted in a lack of understanding of the problem proof, and the proof good writing. Figure 2 shows the results of student work to the proposition no. 4. Based on Figure 2, the students do not understand question that prove the strategy counterexample. Writing proof begins with the word "completion" supposed "proof" shows they are not used to do verification.
In addition, they know the strategies to be used, but confused what to do. They can not use facts and the difficulty of linking sentences logically (see figure 3)
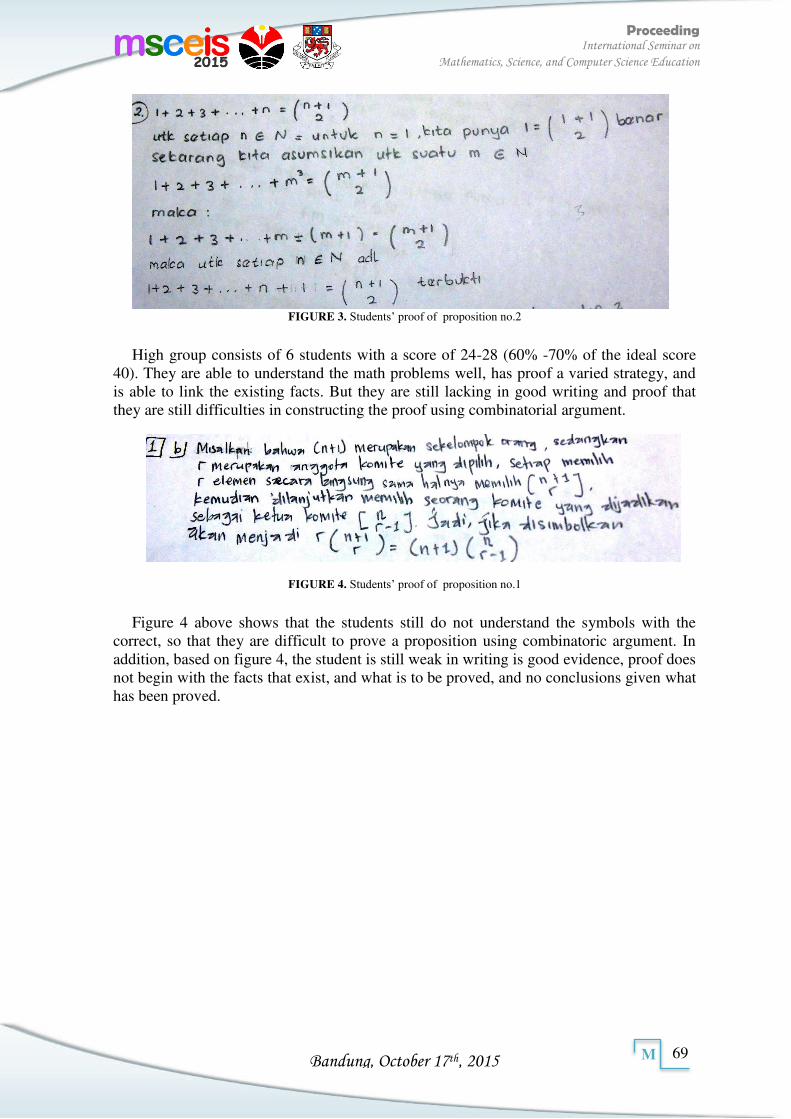
Bandung, October 17th, 2015
Proceeding International Seminar on
Mathematics, Science, and Computer Science Education
69
M
FIGURE 3. Students’ proof of proposition no.2
High group consists of 6 students with a score of 24-28 (60% -70% of the ideal score 40). They are able to understand the math problems well, has proof a varied strategy, and is able to link the existing facts. But they are still lacking in good writing and proof that they are still difficulties in constructing the proof using combinatorial argument.
FIGURE 4. Students’ proof of proposition no.1
Figure 4 above shows that the students still do not understand the symbols with the correct, so that they are difficult to prove a proposition using combinatoric argument. In addition, based on figure 4, the student is still weak in writing is good evidence, proof does not begin with the facts that exist, and what is to be proved, and no conclusions given what has been proved.
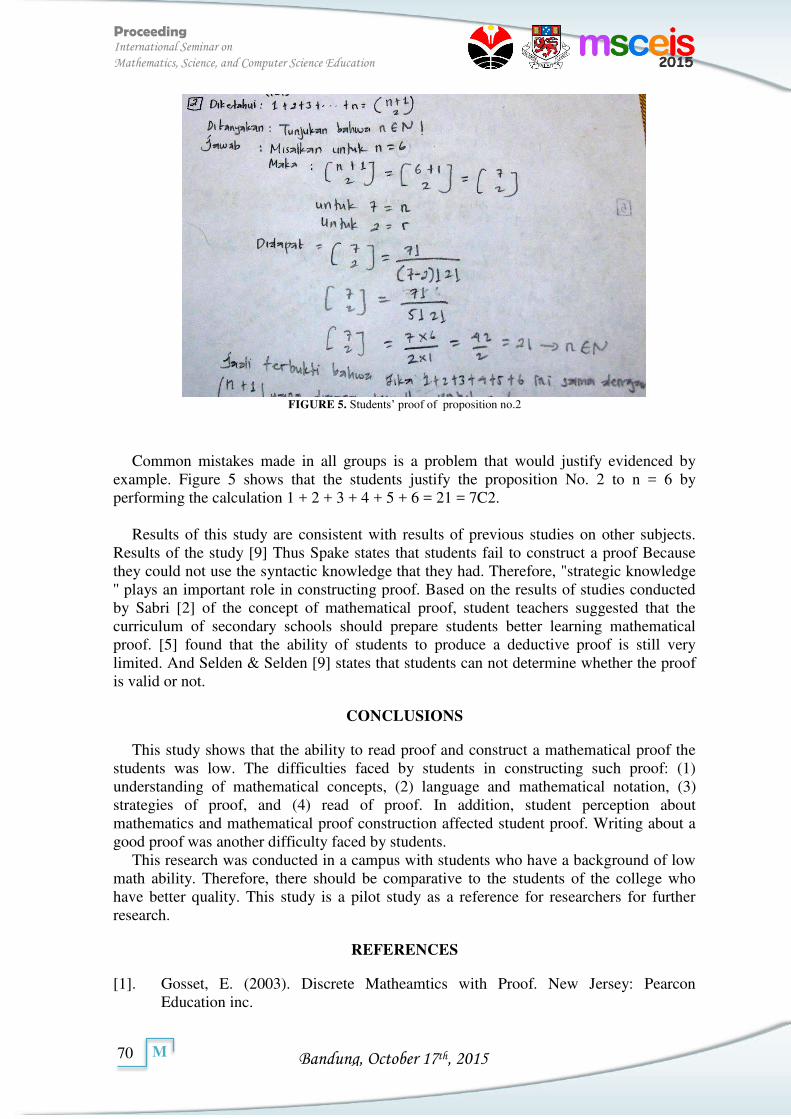
Bandung, October 17th, 2015
Proceeding International Seminar on
Mathematics, Science, and Computer Science Education
70
M
FIGURE 5. Students’ proof of proposition no.2
Common mistakes made in all groups is a problem that would justify evidenced by
example. Figure 5 shows that the students justify the proposition No. 2 to n = 6 by performing the calculation 1 + 2 + 3 + 4 + 5 + 6 = 21 = 7C2.
Results of this study are consistent with results of previous studies on other subjects.
Results of the study [9] Thus Spake states that students fail to construct a proof Because they could not use the syntactic knowledge that they had. Therefore, "strategic knowledge '' plays an important role in constructing proof. Based on the results of studies conducted by Sabri [2] of the concept of mathematical proof, student teachers suggested that the curriculum of secondary schools should prepare students better learning mathematical proof. [5] found that the ability of students to produce a deductive proof is still very limited. And Selden & Selden [9] states that students can not determine whether the proof is valid or not.
CONCLUSIONS
This study shows that the ability to read proof and construct a mathematical proof the students was low. The difficulties faced by students in constructing such proof: (1) understanding of mathematical concepts, (2) language and mathematical notation, (3) strategies of proof, and (4) read of proof. In addition, student perception about mathematics and mathematical proof construction affected student proof. Writing about a good proof was another difficulty faced by students.
This research was conducted in a campus with students who have a background of low math ability. Therefore, there should be comparative to the students of the college who have better quality. This study is a pilot study as a reference for researchers for further research.
REFERENCES
[1]. Gosset, E. (2003). Discrete Matheamtics with Proof. New Jersey: Pearcon Education inc.
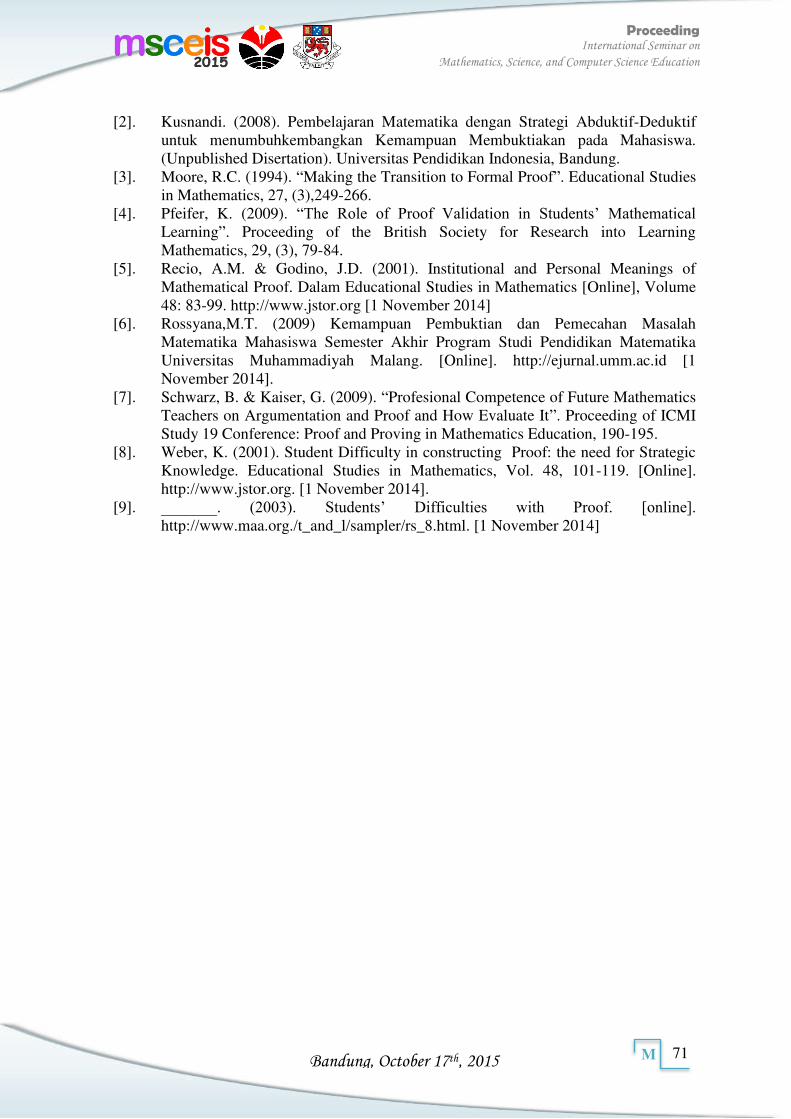
Bandung, October 17th, 2015
Proceeding International Seminar on
Mathematics, Science, and Computer Science Education
71
M
[2]. Kusnandi. (2008). Pembelajaran Matematika dengan Strategi Abduktif-Deduktif
untuk menumbuhkembangkan Kemampuan Membuktiakan pada Mahasiswa. (Unpublished Disertation). Universitas Pendidikan Indonesia, Bandung.
[3]. Moore, R.C. (1994). “Making the Transition to Formal Proof”. Educational Studies in Mathematics, 27, (3),249-266.
[4]. Pfeifer, K. (2009). “The Role of Proof Validation in Students’ Mathematical Learning”. Proceeding of the British Society for Research into Learning Mathematics, 29, (3), 79-84.
[5]. Recio, A.M. & Godino, J.D. (2001). Institutional and Personal Meanings of Mathematical Proof. Dalam Educational Studies in Mathematics [Online], Volume 48: 83-99. http://www.jstor.org [1 November 2014]
[6]. Rossyana,M.T. (2009) Kemampuan Pembuktian dan Pemecahan Masalah Matematika Mahasiswa Semester Akhir Program Studi Pendidikan Matematika Universitas Muhammadiyah Malang. [Online]. http://ejurnal.umm.ac.id [1 November 2014].
[7]. Schwarz, B. & Kaiser, G. (2009). “Profesional Competence of Future Mathematics Teachers on Argumentation and Proof and How Evaluate It”. Proceeding of ICMI Study 19 Conference: Proof and Proving in Mathematics Education, 190-195.
[8]. Weber, K. (2001). Student Difficulty in constructing Proof: the need for Strategic Knowledge. Educational Studies in Mathematics, Vol. 48, 101-119. [Online]. http://www.jstor.org. [1 November 2014].
[9]. _______. (2003). Students’ Difficulties with Proof. [online]. http://www.maa.org./t_and_l/sampler/rs_8.html. [1 November 2014]
Bandung, October 17th, 2015
Proceeding International Seminar on
Mathematics, Science, and Computer Science Education
72
M
MATH-07178
Impact of SAVI Approach to Improve Student Achievement on Senior High School in Deli Serdang
Siti Zulayfa
Department of Mathematics Education, Indonesia University of Education, Jl. Dr. Setiabudi No. 229, Bandung 40154, Indonesia
Article info Abstract
Keywords: SAVI approach, students achievement, improvement, students attitude, conventional approach
This study aims to investigate the impact from application of SAVI (Somatic, auditory, visual and intellectual) approach to improve student’s mathematics achievement on volume and distance of three dimension material. Quasi experimental method was used in the study. The population of the study were 10th grade students of Senior High School in Deli serdang Academic Year of 2013/2014. The samples of this study were 60 students which divided into two groups, experiment group and control group. The 30 students in experimental class were given SAVI approach and 30 students in control class were given conventional approach. The data were collected using a set of test and a set of questionnaire. A set of test was used to measure student’s achievement in learning volume and distance and a set of questionnaire was used to measured student’s attitude toward learning by SAVI approach. Both instruments were validated by expert. Software SPSS was used to analyze the data. The result of this study are: (1) students’ achievement after treatment given is higher than before treatment given both by SAVI approach and conventional approach; (2) the improvement of students’ achievement in SAVI class is better than students’ achievement in conventional class on the subtopic of volume and distance in grade X; (3) students attitude toward mathematics generally show a positive attitude.
Corresponding Author: Siti Zulayfa [email protected]
INTRODUCTION
There are many problem occurred in Indonesia education include low quality of education and lack of awareness in learning. We need some effort to fix the problem. Effort to improve the quality of national education, one of them is increasing student learning achievement at every level of education. (Purwanto, 2009) In effort to improve the quality of education is not separated from the role of teacher. Each media, approaches and learning method are used in learning process are extremely influential on student learning outcomes. In the process of teaching and learning the teacher has a duty to select the models of learning media which appropriate to the material submitted for the achievement of learning objective.
Application of method or learning approach that viewed according to characteristics of students will avoid boredom and create a comfortable and fun atmosphere in learning process. Teacher can use some learning approach to achieve learning goals and improving student learning outcome. One alternative approach to learning that can be applied student achievement is SAVI (somatic, auditory, visual, and intellectual) approach.
SAVI is a learning approach that emphasize that learning should make use all of the senses of student. SAVI is a short term of Somatic means learning by moving and doing; Auditory means learning by listening, speaking, presentation, argumentation, expression and respond; Visualization means learning must use eye sense through observation, drawing, demonstrating, reading, using the media and props; while Intellectual means
Bandung, October 17th, 2015
Proceeding International Seminar on
Mathematics, Science, and Computer Science Education
73
M
learning by solving problems that free and brooding (minds-on). Through SAVI approach, students can learn mathematics with an optimal intellectual activity and all the senses are combined in a learning process. So it can create a fun learning, student-centered, and actively involve students in order for them to develop their potential well by ability, interest, learning styles, experience has, and can improve academic achievement.
From result of interviews with some mathematics teachers of junior high school in Deli Serdang, especially for grade 10 there are some material that difficult to teach. The subject of three dimensions was the hard one. Many of students cannot achieve the basic competencies of the material. The difficulty in teaching these subject due to the high of criteria and indicators to be achieved by students, unavailability of visual aids that are needed to realized the three dimensions subjects and learning approach which not suitable with the subject while teachers used to teach all mathematics material conventionally. In this study, the researcher investigate that whether SAVI approach can improve student achievement and to obtain information about students’ attitudes toward mathematics learning using SAVI. Also this study can provide additional knowledge about mathematics learning and serve as one of the inputs to select and develop appropriate alternative learning approach for improving student achievement and makes students get a different learning experience than usual. Teachers gain experience of other learning activities. So, they can create better learning activities.
METHOD
This study was conducted in Junior High School in Deli Serdang, in the second semester of 10th grade students in academic year 2012/2013. A quasi experiment non-equivalent pretest-post test control group design was used. Sixty students was involved in this study, and they were divided into two groups, namely the control group and the treatment group. The students in treatment group learned three dimension topics used SAVI approach and the control group learned same topic using conventional methods. The teaching and learning process was done within four weeks. After the teaching and learning process ended, the students from control class were interviewed to know their attitude toward SAVI approach. The data was collected using a test of Mathematics learning achievement and a questionnaire of student’s attitude toward SAVI. The test instrument were validated by expert. In the pre-test, analysis variance test using Kolmogrov-Smirnov test for normality and Levene test for homogeneity test. With α = 0.05, sample come from normal distributed population and homogeneous.
Method of hypothesis testing used is the independent sample t-test (t-test). This study uses t-test s it aims to test whether any difference in the effect of a treatment (factor) on the dependent variable. In this study there are on independent variable studied its effect on the dependent variable, namely teaching approach. Where the dependent variable in this study is student achievement. Normalized gain or gain index is used in this study to determine the improvement in student achievement. The criteria of gain levels, according to Hake are presented in the following table:
Bandung, October 17th, 2015
Proceeding International Seminar on
Mathematics, Science, and Computer Science Education
74
M
Table 1. Criteria of Normalized gain
G Description
g > 0.7 High
0.3 < g ≤ 0.7 Medium
g ≤ 0.3 Low
Questionnaire given to students for the purpose to know the student’s responses toward learning mathematics using SAVI approach and to manage the data obtained from questionnaire is used Likert scale. To conduct the t-test in this study, t-test using SPSS software with the hypothesis s follows:
H0 accepted if
For Experimental group: H0 : SAVI approach cannot improve student achievement on the subtopic of volume and distance in grade X H1 : SAVI approach can improve student achievement on the subtopic of volume and distance in grade X For Control group: H0 : Conventional approach cannot improve student achievement on the subtopic of volume and distance in
grade X H1 : Conventional approach can improve student achievement on the subtopic of volume and distance in
grade X
For gain index or normalized gain on improvement in student achievement with the t-test used the following hypotheses with description: H0 : The average improvement of Index gain in experimental group (SAVI approach) is not better than the
control group (Conventional approach) H1 : The average improvement of Index gain in experimental group (SAVI approach) is better than the
control group (Conventional approach)
RESULT
The improvement data on student achievement is obtained from the score of pretest and post-test. The data of pretest and post-test of experimental group and control group on sub topic Volume and Distance are tested by used independent t-test with using SPSS. And the result of analysis on Achievement score of two groups are described below:
Table 2. Independent T Test Achievement Score of Experimental group and Control group
Group tcalculate df Sig.(2-tailed) Decision
Experimental 12.963 58 0 H0 rejected
Control 9.152 58 0 H0 rejected
Based on the table above, by used = 0.05, for experimental group H0 is rejected. It means that SAVI approach can improve students achievement on subtopic of volume and distance in grade X. For control group, H0 is rejected which means conventional approach can improve student achievement on subtopic volume and distance in grade X. Because of two groups can improve student achievement, this study also want to know which
2 2calculatet t t
0 1 2
1 1 2
:
:
H
H
Bandung, October 17th, 2015
Proceeding International Seminar on
Mathematics, Science, and Computer Science Education
75
M
approaches can improve better. Therefore, the gain index analysis was conducted to determine the improvement quality of student achievement in two groups. The following table is a descriptive statistical analysis of the data gain index from experimental group and control group.
Table 3. Result of Gain Index from Achievement Score of Experimental group and Control group
Group N mean G (Index Gain) Criteria Maximum
Gain Minimum
Gain
Experimental 30 43 0.72 High 66 26
Control 30 31.2 0.53 Medium 59 14
Based on these data, the average of index gain in experimental group and control group had quite far difference. Where the average of student achievement improvement on experimental group is higher than on control group. Experimental group which used SAVI approach had high criteria for index gain that indicate improvement of student achievement in experimental class is high. However, for more details and to see if SAVI approach is better to improve student achievement than conventional approach, the study tested hypotheses based on the result of the improvement student achievement as seen from pretest and post-test for each group. By using independent t-test data obtained as shown in table below:
Table 3. Result of 2-tailed test with Independent t Test
tcalculate Df Sig. (2-tailed) Decision
3.281 58 0.002 H0 rejected
Based on the table above, H0 rejected which means the average improvement of gain index in experimental group is better than the control group. Therefore can be conclude that the improvement of student achievement in experimental group that used SAVI approach is better than improvement of student achievement in control class that used conventional approach. From the analysis of the questionnaire that given to students about student’s attitude toward learning mathematics by SAVI approach, the result are presented below:
Figure 1. Result about student’s attitude toward SAVI approach
The result of the questionnaire survey indicated that 86.1% of students are motivated by SAVI approach and 76.2% of them fell interested with the learning approach and media used in the learning process. Only 8.3% students who didn’t agree that worksheet and
Agree and Strong
Bandung, October 17th, 2015
Proceeding International Seminar on
Mathematics, Science, and Computer Science Education
76
M
visual aids can help them to understand the lesson. Also when came to the agreement that SAVI approach will improve their learning achievement, 82% students agree with that. According to this, student’s attitude toward SAVI approach on learning mathematics shows a positive attitude.
DISCUSSION, CONCLUSIONS, AND RECOMMENDATION
In experimental group that using SAVI approach, the teacher provides some visual aids or props and worksheet that help students to understand the material by self. Although teacher gives explanation about the topic but with available of visual aids, students can realize the material and also the content of worksheet which help students found their knowledge about the topic and led them to be able to solve the problem. With emphasize to students activity which Combine their somatic, auditory, visual and intellectual activity, students construct their own knowledge and crate a pleasant atmosphere, attractive and effective learning.
Because of the reasons above and supported by the result of this study can be conclude that SAVI approach has impact to improve students achievement and the improvement of student achievement using SAVI approach is better than used conventional approach. Also students’ attitude towards learning by SAVI approach are positive. Students feel SAVI approach is very interesting and attractive and most of them feel confident of getting a good mark or high achievement with the implementation of SAVI approach on subtopic of Volume and Distance. From this conclusion, it is recommended to teachers should adapt different learning approaches to the material presented in teaching and learning activities. As example SAVI (somatic, auditory, visual and intellectual) is appropriate approach when it is used on topic three dimension because this approach can help students to understand the topic and more active in the learning process. Applying SAVI approach as alternative way to use in learning process can improve student achievement especially on subtopic of volume and distance rather than using conventional approach To the next researcher is hoped to be better to do the study because of the weakness of this study is the visual aids used are very simple.
ACKNOWLEDGMENTS
Thanks to The Almighty Allah SWT for blessing me and my beloved family whose support and loving me. My supervisor lecturer in State University of Medan who has given much attention, kindness and suggestion. Also thanks to Indonesia University of Education for being a great place to study and the lecturers from department mathematics for being my inspiration. And thanks to MSCEIS 2015 for giving me an opportunity for me to participate in this international seminar. I really hope this study can give contribution in Education.
References
[1]. Arikunto, Suharsimi. Prosedur Penelitian Suatu Pendekatan Praktik. (Rineka Cipta, Jakarta, 2006).
[2]. Colleta, Vincent. Online America Journal: Interpreting FCI Scores: Normalized
Gain, Pre-Instruction Scores, and Scientific Reasoning Ability. 45, 2-21 (2012). [3]. Creswell, W. John. Educational Research. (Pearson Education Inc, New Jersey,
2008). [4]. Gary D, Borich. Educational Testing and Measurement. (Willey & Sons Inc, Texas
1996).
Bandung, October 17th, 2015
Proceeding International Seminar on
Mathematics, Science, and Computer Science Education
77
M
[5]. Krismanto, Ali. Dimensi Tiga Pembelajaran Jarak. (Ministry of Education, Jakarta, 2008)
[6]. McCullough, Joe. Accelerated Learning for Students. (Cabrillo College, 2003). [7]. Meier, Dave. Accelerated Learning Handbook. (McGraw-Hill, New York, 2000). [8]. Purwanto. Evaluasi Hasil Belajar. (Pustaka Pelajar, Yogyakarta, 2009). [9]. Surya, Edy. Visual Thinking Dalam Memaksimalkan Pebelajaran Matematika
Siswa Dapat Membaangun Karakter Bangsa-2010. Online. http://jurnal.upi.edu/file/Edi_S.pdf. Accessed January, 28th 2013
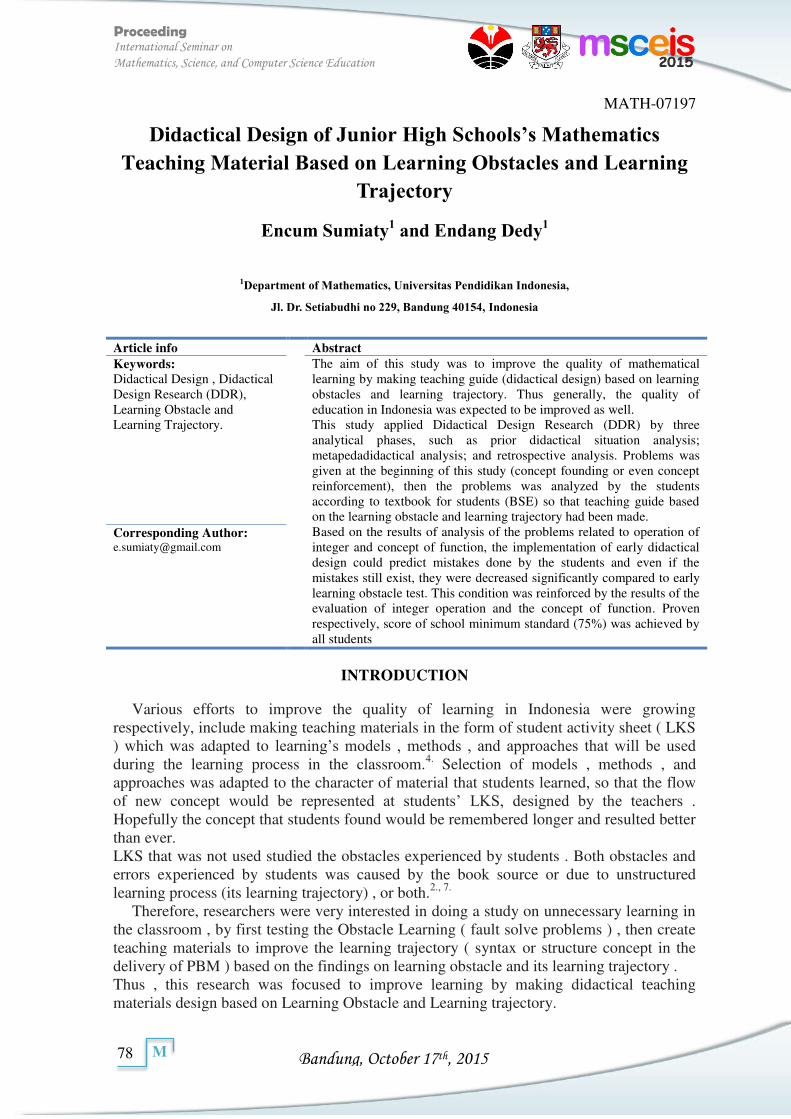
Bandung, October 17th, 2015
Proceeding International Seminar on
Mathematics, Science, and Computer Science Education
78
M
MATH-07197
Didactical Design of Junior High Schools’s Mathematics Teaching Material Based on Learning Obstacles and Learning
Trajectory
Encum Sumiaty1 and Endang Dedy1
1Department of Mathematics, Universitas Pendidikan Indonesia,
Jl. Dr. Setiabudhi no 229, Bandung 40154, Indonesia
Article info Abstract
Keywords: Didactical Design , Didactical Design Research (DDR), Learning Obstacle and Learning Trajectory.
The aim of this study was to improve the quality of mathematical learning by making teaching guide (didactical design) based on learning obstacles and learning trajectory. Thus generally, the quality of education in Indonesia was expected to be improved as well. This study applied Didactical Design Research (DDR) by three analytical phases, such as prior didactical situation analysis; metapedadidactical analysis; and retrospective analysis. Problems was given at the beginning of this study (concept founding or even concept reinforcement), then the problems was analyzed by the students according to textbook for students (BSE) so that teaching guide based on the learning obstacle and learning trajectory had been made. Based on the results of analysis of the problems related to operation of integer and concept of function, the implementation of early didactical design could predict mistakes done by the students and even if the mistakes still exist, they were decreased significantly compared to early learning obstacle test. This condition was reinforced by the results of the evaluation of integer operation and the concept of function. Proven respectively, score of school minimum standard (75%) was achieved by all students
Corresponding Author: [email protected]
INTRODUCTION
Various efforts to improve the quality of learning in Indonesia were growing respectively, include making teaching materials in the form of student activity sheet ( LKS ) which was adapted to learning’s models , methods , and approaches that will be used during the learning process in the classroom.4. Selection of models , methods , and approaches was adapted to the character of material that students learned, so that the flow of new concept would be represented at students’ LKS, designed by the teachers . Hopefully the concept that students found would be remembered longer and resulted better than ever. LKS that was not used studied the obstacles experienced by students . Both obstacles and errors experienced by students was caused by the book source or due to unstructured learning process (its learning trajectory) , or both.2., 7.
Therefore, researchers were very interested in doing a study on unnecessary learning in the classroom , by first testing the Obstacle Learning ( fault solve problems ) , then create teaching materials to improve the learning trajectory ( syntax or structure concept in the delivery of PBM ) based on the findings on learning obstacle and its learning trajectory . Thus , this research was focused to improve learning by making didactical teaching materials design based on Learning Obstacle and Learning trajectory.
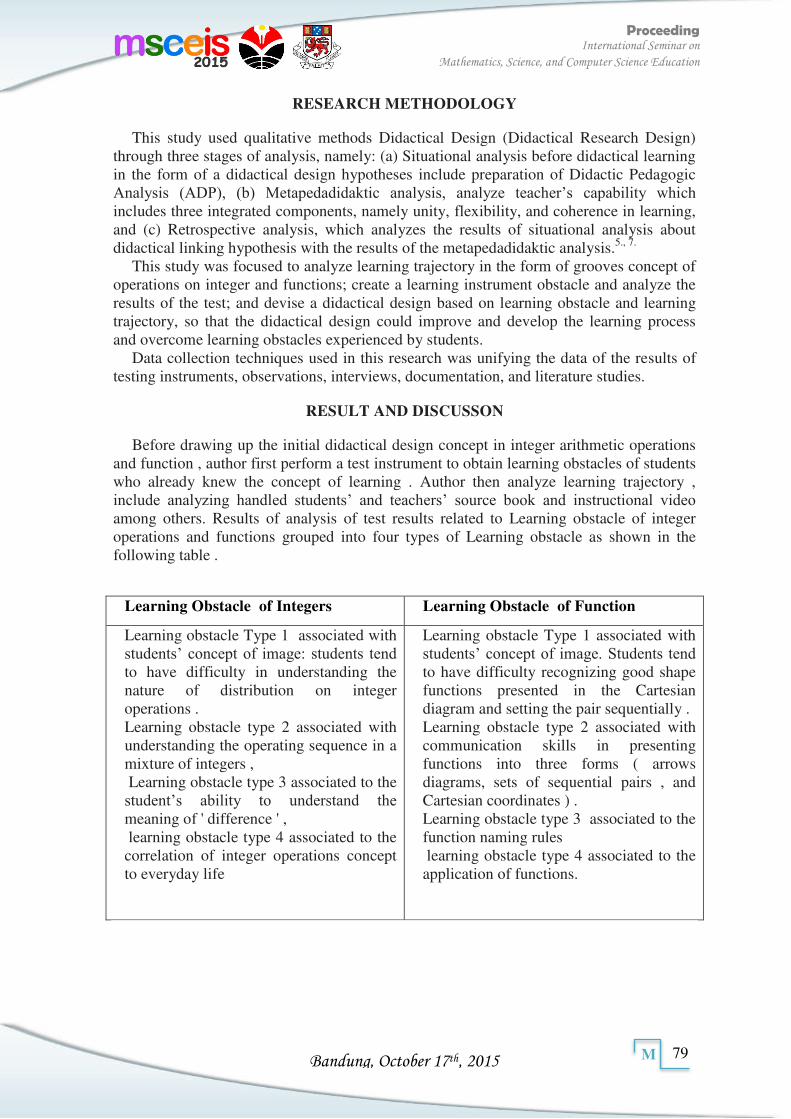
Bandung, October 17th, 2015
Proceeding International Seminar on
Mathematics, Science, and Computer Science Education
79
M
RESEARCH METHODOLOGY
This study used qualitative methods Didactical Design (Didactical Research Design) through three stages of analysis, namely: (a) Situational analysis before didactical learning in the form of a didactical design hypotheses include preparation of Didactic Pedagogic Analysis (ADP), (b) Metapedadidaktic analysis, analyze teacher’s capability which includes three integrated components, namely unity, flexibility, and coherence in learning, and (c) Retrospective analysis, which analyzes the results of situational analysis about didactical linking hypothesis with the results of the metapedadidaktic analysis.5., 7.
This study was focused to analyze learning trajectory in the form of grooves concept of operations on integer and functions; create a learning instrument obstacle and analyze the results of the test; and devise a didactical design based on learning obstacle and learning trajectory, so that the didactical design could improve and develop the learning process and overcome learning obstacles experienced by students.
Data collection techniques used in this research was unifying the data of the results of testing instruments, observations, interviews, documentation, and literature studies.
RESULT AND DISCUSSON
Before drawing up the initial didactical design concept in integer arithmetic operations and function , author first perform a test instrument to obtain learning obstacles of students who already knew the concept of learning . Author then analyze learning trajectory , include analyzing handled students’ and teachers’ source book and instructional video among others. Results of analysis of test results related to Learning obstacle of integer operations and functions grouped into four types of Learning obstacle as shown in the following table .
Learning Obstacle of Integers Learning Obstacle of Function
Learning obstacle Type 1 associated with students’ concept of image: students tend to have difficulty in understanding the nature of distribution on integer operations . Learning obstacle type 2 associated with understanding the operating sequence in a mixture of integers , Learning obstacle type 3 associated to the student’s ability to understand the meaning of ' difference ' , learning obstacle type 4 associated to the correlation of integer operations concept to everyday life
Learning obstacle Type 1 associated with students’ concept of image. Students tend to have difficulty recognizing good shape functions presented in the Cartesian diagram and setting the pair sequentially . Learning obstacle type 2 associated with communication skills in presenting functions into three forms ( arrows diagrams, sets of sequential pairs , and Cartesian coordinates ) . Learning obstacle type 3 associated to the function naming rules learning obstacle type 4 associated to the application of functions.
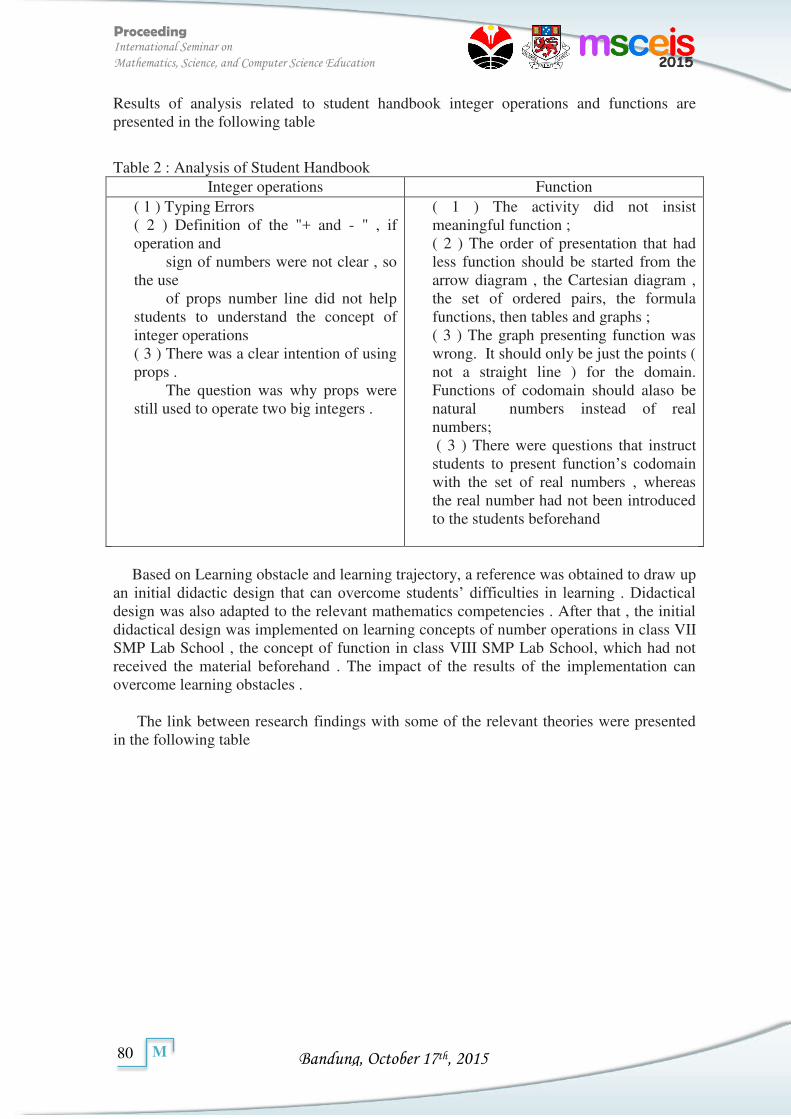
Bandung, October 17th, 2015
Proceeding International Seminar on
Mathematics, Science, and Computer Science Education
80
M
Results of analysis related to student handbook integer operations and functions are presented in the following table
Table 2 : Analysis of Student Handbook Integer operations Function
( 1 ) Typing Errors ( 2 ) Definition of the "+ and - " , if operation and sign of numbers were not clear , so the use of props number line did not help students to understand the concept of integer operations ( 3 ) There was a clear intention of using props . The question was why props were still used to operate two big integers .
( 1 ) The activity did not insist meaningful function ; ( 2 ) The order of presentation that had less function should be started from the arrow diagram , the Cartesian diagram , the set of ordered pairs, the formula functions, then tables and graphs ; ( 3 ) The graph presenting function was wrong. It should only be just the points ( not a straight line ) for the domain. Functions of codomain should alaso be natural numbers instead of real numbers; ( 3 ) There were questions that instruct students to present function’s codomain with the set of real numbers , whereas the real number had not been introduced to the students beforehand
Based on Learning obstacle and learning trajectory, a reference was obtained to draw up
an initial didactic design that can overcome students’ difficulties in learning . Didactical design was also adapted to the relevant mathematics competencies . After that , the initial didactical design was implemented on learning concepts of number operations in class VII SMP Lab School , the concept of function in class VIII SMP Lab School, which had not received the material beforehand . The impact of the results of the implementation can overcome learning obstacles . The link between research findings with some of the relevant theories were presented in the following table
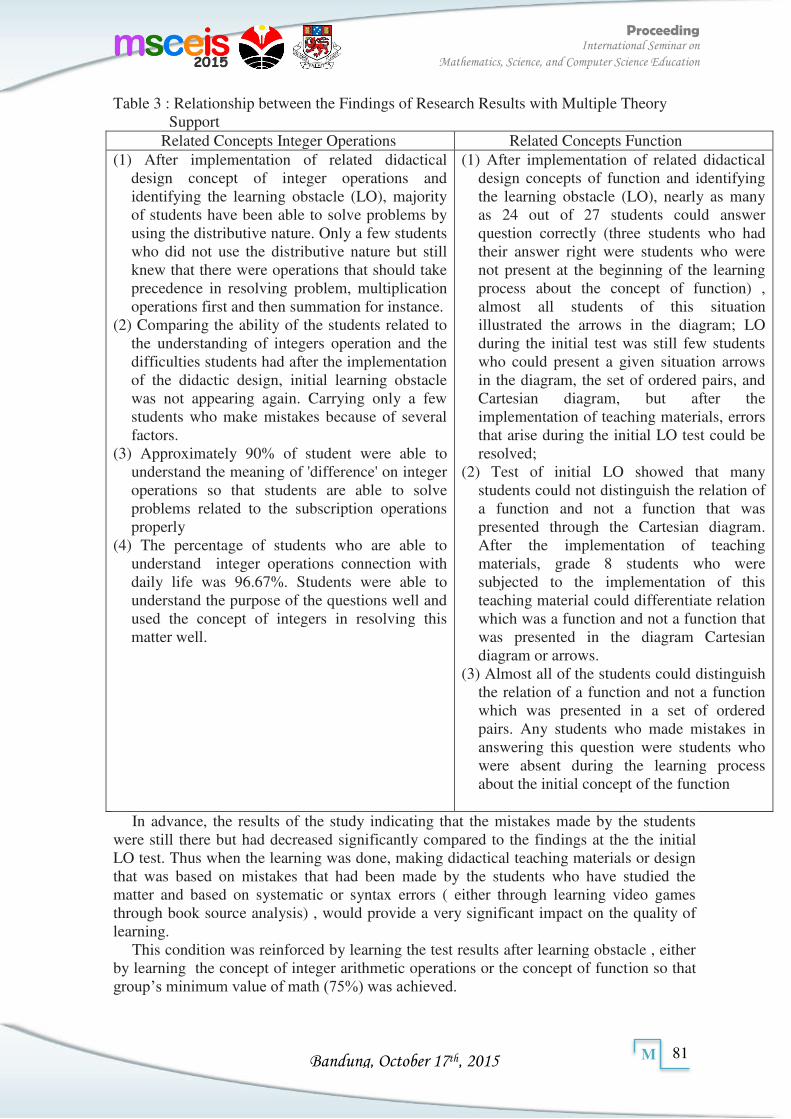
Bandung, October 17th, 2015
Proceeding International Seminar on
Mathematics, Science, and Computer Science Education
81
M
Table 3 : Relationship between the Findings of Research Results with Multiple Theory Support
Related Concepts Integer Operations Related Concepts Function (1) After implementation of related didactical
design concept of integer operations and identifying the learning obstacle (LO), majority of students have been able to solve problems by using the distributive nature. Only a few students who did not use the distributive nature but still knew that there were operations that should take precedence in resolving problem, multiplication operations first and then summation for instance.
(2) Comparing the ability of the students related to the understanding of integers operation and the difficulties students had after the implementation of the didactic design, initial learning obstacle was not appearing again. Carrying only a few students who make mistakes because of several factors.
(3) Approximately 90% of student were able to understand the meaning of 'difference' on integer operations so that students are able to solve problems related to the subscription operations properly
(4) The percentage of students who are able to understand integer operations connection with daily life was 96.67%. Students were able to understand the purpose of the questions well and used the concept of integers in resolving this matter well.
(1) After implementation of related didactical design concepts of function and identifying the learning obstacle (LO), nearly as many as 24 out of 27 students could answer question correctly (three students who had their answer right were students who were not present at the beginning of the learning process about the concept of function) , almost all students of this situation illustrated the arrows in the diagram; LO during the initial test was still few students who could present a given situation arrows in the diagram, the set of ordered pairs, and Cartesian diagram, but after the implementation of teaching materials, errors that arise during the initial LO test could be resolved;
(2) Test of initial LO showed that many students could not distinguish the relation of a function and not a function that was presented through the Cartesian diagram. After the implementation of teaching materials, grade 8 students who were subjected to the implementation of this teaching material could differentiate relation which was a function and not a function that was presented in the diagram Cartesian diagram or arrows.
(3) Almost all of the students could distinguish the relation of a function and not a function which was presented in a set of ordered pairs. Any students who made mistakes in answering this question were students who were absent during the learning process about the initial concept of the function
In advance, the results of the study indicating that the mistakes made by the students
were still there but had decreased significantly compared to the findings at the the initial LO test. Thus when the learning was done, making didactical teaching materials or design that was based on mistakes that had been made by the students who have studied the matter and based on systematic or syntax errors ( either through learning video games through book source analysis) , would provide a very significant impact on the quality of learning.
This condition was reinforced by learning the test results after learning obstacle , either by learning the concept of integer arithmetic operations or the concept of function so that group’s minimum value of math (75%) was achieved.
Bandung, October 17th, 2015
Proceeding International Seminar on
Mathematics, Science, and Computer Science Education
82
M
CONCLUSIONS
Based on the description of the results of research and discussion, it could be concluded as follows. 1. Type of problems identified during the learning process for concept of integer
operations and the concept of function were related to the concept of image learning obstacle, communication-related learning obstacle, and connections-related learning obstacles.
2. The abilities of students who could be raised through learning the nature of integer operations were the ability to solve problems by force operations, the ability to utilize operating properties (distributive nature), and the ability to create a mathematical model of the problem contextually in everyday life and solve them through distributive nature; The abilities of students that could be raised through learning the concept of function were the ability to understand the function, the ability to distinguish between the function and not a function, the ability to distinguish a relationship that included a function and not a function, the ability to write or seek rules function, the ability to present a function in a variety of ways (diagram arrows, ordered pairs, and graphics), and the ability to use the concept of a function to resolve problems in everyday life
3. Alternative didactical design of concepts related integer operations (distributive nature) was to simply add the editorial with the sentence affirmation and relate concepts of typos and change the position of number 1 into question which was a function and not a function which then presented in a set of ordered pairs. Any students who are mistaken in answering this question were students who were absent during the learning process of the initial concept of the function
4. Initial didactic design implementation could predict errors committed despite the mistakes students made which were still there but had decreased significantly compared to the findings at the time of the initial LO test
ACKNOWLEDGEMENTS
We acknowledged Universitas Pendidikan Indonesia (Grant: kolaborasi institusi)
REFERENCES
1. Brousseau, Guy. 2002. Theory of Didactical Situation in Mathematics. New York: Kluwer Academic Publisher.
2. Clements, Douglas H. dan Sarama, Julie. 2009. Learning and Teaching Early Math
(The Learning Trajectories Approach). New York: Routledge. 3. Ryanti, Fresty. 2012. Teori Belajar Ausubel. [Online]. Available in :
http://physickasyik.blogspot.com/2012/11/teori-belajar-ausubel_28.html. [11 February 2013]
4. Suratno, T. 2009. Memahami Kompleksitas Pengajaran-Pembelajaran dan Kondisi
Pendidikan dan Pekerjaan Guru. [Online]. Available in :
http://the2the.com/eunice/document/TSuratno_complex_syndrome.pdf. [8 December 2012] 5. Suryadi, Didi. (2010). “Metapedidaktik dan Didactical Design Research (DDR):
Sintesis Hasil Pemikiran Berdasarkan Lesson Study”, dalam Teori, Paradigma,
Bandung, October 17th, 2015
Proceeding International Seminar on
Mathematics, Science, and Computer Science Education
83
M
Prinsip, dan Pendekatan Pembelajaran MIPA dalam Konteks Indonesia. Bandung: FPMIPA UPI.
6. Suratno, Tatang dan Suryadi, Didi. 2013. Metapedadidaktik dan Didactical Design
Research (DDR) dalam Implementasi Kurikulum Praktik Lesson Study. Hand-out
Seminar. Surabaya: Unpublished . 7. Suryadi, Didi. 2013. Didactical Design Research (DDR) to Improve the Teaching
of Mathematics. Far East Journal of Mathematics Education, 10(1), pp.91-107. 8. Suryadi, Didi. 2010a. “Metapedadidaktik dan Didactical Design Research (DDR):
Sintesis Hasil Pemikiran Berdasarkan Lesson Study”, dalam Teori, Paradigma,
Prinsip, dan Pendekatan Pembelajaran MIPA dalam Konteks Indonesia. Bandung: FPMIPA UPI.
9. Suryadi, Didi. 2010b. Menciptakan Proses Belajar Aktif : Kajian Sudut Pandang
Teori Belajar dan Teori Didaktik. Hand-out Seminar. Bandung: Unpublished .
Bandung, October 17th, 2015
Proceeding International Seminar on
Mathematics, Science, and Computer Science Education
84
M
MATH-07212
The Enhancement of Mathematical Representation Ability of Junior High School Students Through Discovery Learning By
The Scientific Approach
Windia Hadi*, Yaya S. Kusumah**
*Post Graduate School, Indonesia University of Education **Department of Mathematics Education, Indonesia University of Education
Article info Abstract
Keywords:
Discovery Learning, Scientific approach, conventional Learning, Mathematical Representation Ability.
This research is motivated by the importance and low of mathematical representation ability. The aims of this research is to analyze students enhancement of mathematical representation ability of students. This research was a quasi-experimental with nonequivalent control group design. The population of students at eighth grade in one of Junior High School West Jakarta and sampling were selected by purposive sampling techniques. The study consisted of two group of learning, that is discovery learning by the scientific approach and conventional learning. VIII-D class used as the experimental group, while the VIII-F class used the control group. VIII-D and VIII-F class consisted of 35 students and 34 students. The instruments used test of mathematical representation ability. Data analysis by descriptive analysis, prerequisite test and test the hypothesis used t-test (independent sample T-Test) and Mann Whitney test. The result showed that the enhancement of mathematical representation ability of students who received the discovery learning with scientific approach was better than students who received conventional learning. The study confirms the importance of the enhancement of mathematical representation ability and concluded by making insightful suggestions and recommendations to stakeholders in education in helping students to enhance mathematical representation ability through discovery learning by the scientific approach.
Corresponding Author: Windia Hadi [email protected] Yaya S. Kusumah [email protected]
INTRODUCTION
Currently, Curriculum 2013 is one of the government's efforts in improving the education system in Indonesia. The application of curriculum 2013 aimed at encouraging students in their learning activities e.g. to observe, to speak up, to communicate/represent their ideas and to be able to summarize their learning materials in schools. In Curriculum 2013, students are required to be more active and creative in class.
The learning process in the curriculum in 2013 is slightly different from the previous one. In previous curriculum 2013 the main function of the teachers still dominate in presenting the material and remains centered to the teacher. In Curriculum 2013, the main activities are described further into; exploration, elaboration and confirmation. They are preceded by doing: observation, asking questions, giving reasons, having experiments and communicating. The main activity in curriculum 2013 is based on scientific approach learning.
Mathematics is a universal science that underlies the development of modern technology. Mathematics has a very important role in variety of disciplines and has been proven that Mathematics ability has everything to do with human IQ. Depdiknas (in Sugandi, 2014) suggests that the mathematics courses should be offered to all students from elementary schools to equip students with the ability to think logically, analytical,
Bandung, October 17th, 2015
Proceeding International Seminar on
Mathematics, Science, and Computer Science Education
85
M
systematic, critical and creative and also to have the ability to cooperate. The importance of students having mathematical representation capability is also included in the NCTM (2000) stated that mathematical representation is main point in learning mathematics and is the inseparable part of the mathematics learning in school. Unfortunately, mathematical representations are often taught and learned separately from the goals in mathematics (Wahyudin, 2008).
In reality, the expected goal has not been fully achieved. The ability of students’ mathematical representation, especially in junior high are still not handled properly. In the his preliminary research, Hutagaol (in Widyastuti, 2011) stated that the underdeveloped students’ ability in mathematical representation, especially in junior high, are because of they don’t have enough opportunity to do the representations themselves, instead they have to follow what has been exemplified by the teachers who lead the students to understand about mathematical representation without direct experiment. Amri (2009) expressed that mathematics teacher who deals with the representation are still using conventional methods. It is also means that students tend to imitate the teacher measures; students were never given the opportunity to present mathematical representation capabilities. Hudiono (in Widyastuti, 2011) states that only small numbers of students can answer correctly in solving math problems related to the ability of representation. Umar (2011) as the results of the interviews with mathematics teachers stated that students rarely use image representation to assist them in solving problems, so that they could not imagine the problems needs. Based on those opinions, we believe that the ability of mathematical representation are still lacking and need to be improved.
According to Jones and Knuth (Haji, 2014, p. 50; widyastuti, 2011) representation is a model, or alternate form, of a problem situation or aspect of a problem situation used in finding a solution. For example, problem can be represented by objects, picture, word, or mathematical symbols. Students can use a representation of the variety of ways that can describe, represent or symbolize. For example, a word can describe a real-life object or a figure can represent a position on the number line. Graphs in Cartesian field may be used as a representation of equation (mathematical expression) by way of settlement or describe the set of equations is a graphical representation by creating a pattern of relationships which meet all of the coordinates of the point. According to As’ari (2001) the use a good representation will be able to relate the information learned with a collection of information that is already owned by students. Students who already have the ability to represent the problem into pictures, graphics, mathematical models, symbols, tables, and words with easy students will be given in his memory, so that once students get the next lesson students easily use the representation in the next material because the material mathematics intertwined with each other.
To prevent this situation, an innovation is needed in mathematics learning. The new way in a learning process will surely help and attract students to love mathematics. Also, we need an effective way to learn mathematics that will easily assist students to understand math’s problems. The innovation should make students discover and develop the concepts of mathematics, by using representation and will directly teach the student instead of having the usual learning. This process is included in discovery learning term.
Sund (in Suryasubroto, 2009; Hosnan, 2014) reveals that the discovery is able to assimilate students’ mental processes of a concept or principle and discovery learning is a model for developing an active student learning by oneself finding and investigating. The term mental processes are including: observe, digest, understand, classify, make conjectures, explain, assess, and draw conclusions etc. Students are actively engaged in finding a fundamental principle on their own, students will understand the concept better, long-lasting in the memory and be able to use them in various contexts. Learning the
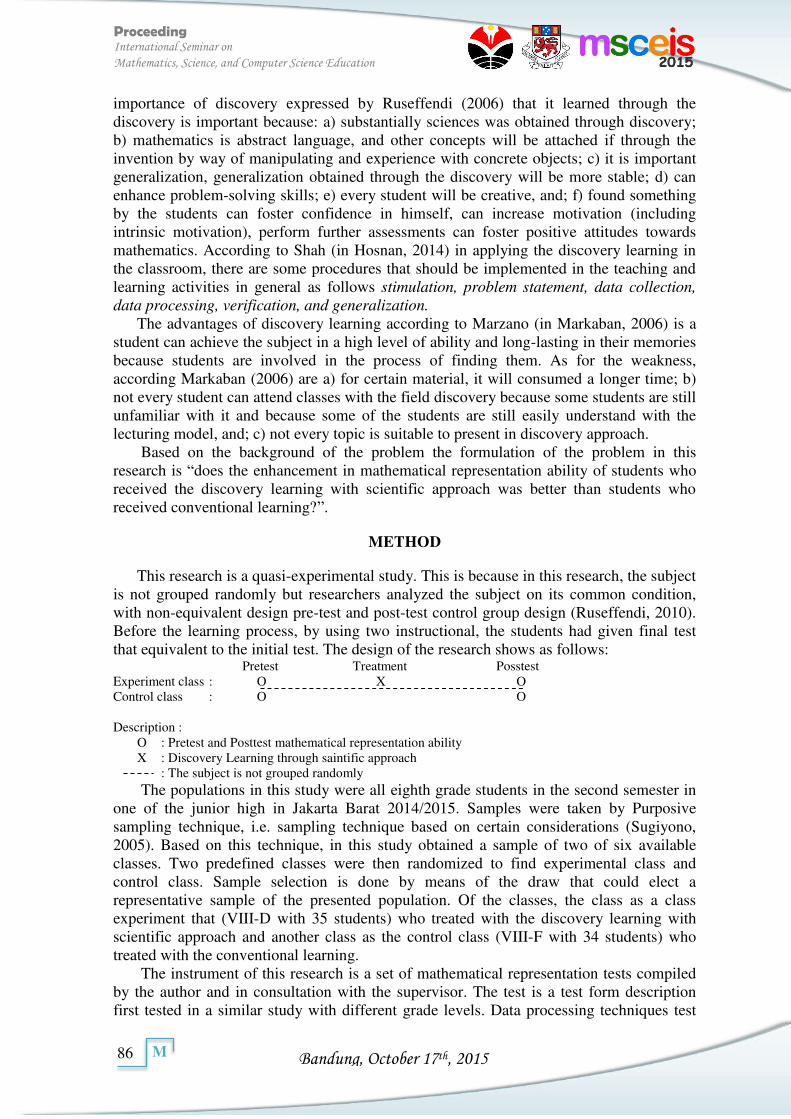
Bandung, October 17th, 2015
Proceeding International Seminar on
Mathematics, Science, and Computer Science Education
86
M
importance of discovery expressed by Ruseffendi (2006) that it learned through the discovery is important because: a) substantially sciences was obtained through discovery; b) mathematics is abstract language, and other concepts will be attached if through the invention by way of manipulating and experience with concrete objects; c) it is important generalization, generalization obtained through the discovery will be more stable; d) can enhance problem-solving skills; e) every student will be creative, and; f) found something by the students can foster confidence in himself, can increase motivation (including intrinsic motivation), perform further assessments can foster positive attitudes towards mathematics. According to Shah (in Hosnan, 2014) in applying the discovery learning in the classroom, there are some procedures that should be implemented in the teaching and learning activities in general as follows stimulation, problem statement, data collection,
data processing, verification, and generalization.
The advantages of discovery learning according to Marzano (in Markaban, 2006) is a student can achieve the subject in a high level of ability and long-lasting in their memories because students are involved in the process of finding them. As for the weakness, according Markaban (2006) are a) for certain material, it will consumed a longer time; b) not every student can attend classes with the field discovery because some students are still unfamiliar with it and because some of the students are still easily understand with the lecturing model, and; c) not every topic is suitable to present in discovery approach.
Based on the background of the problem the formulation of the problem in this research is “does the enhancement in mathematical representation ability of students who received the discovery learning with scientific approach was better than students who received conventional learning?”.
METHOD
This research is a quasi-experimental study. This is because in this research, the subject is not grouped randomly but researchers analyzed the subject on its common condition, with non-equivalent design pre-test and post-test control group design (Ruseffendi, 2010). Before the learning process, by using two instructional, the students had given final test that equivalent to the initial test. The design of the research shows as follows:
Pretest Treatment Posstest Experiment class : O X O Control class : O O Description :
O : Pretest and Posttest mathematical representation ability X : Discovery Learning through saintific approach : The subject is not grouped randomly
The populations in this study were all eighth grade students in the second semester in one of the junior high in Jakarta Barat 2014/2015. Samples were taken by Purposive sampling technique, i.e. sampling technique based on certain considerations (Sugiyono, 2005). Based on this technique, in this study obtained a sample of two of six available classes. Two predefined classes were then randomized to find experimental class and control class. Sample selection is done by means of the draw that could elect a representative sample of the presented population. Of the classes, the class as a class experiment that (VIII-D with 35 students) who treated with the discovery learning with scientific approach and another class as the control class (VIII-F with 34 students) who treated with the conventional learning.
The instrument of this research is a set of mathematical representation tests compiled by the author and in consultation with the supervisor. The test is a test form description first tested in a similar study with different grade levels. Data processing techniques test
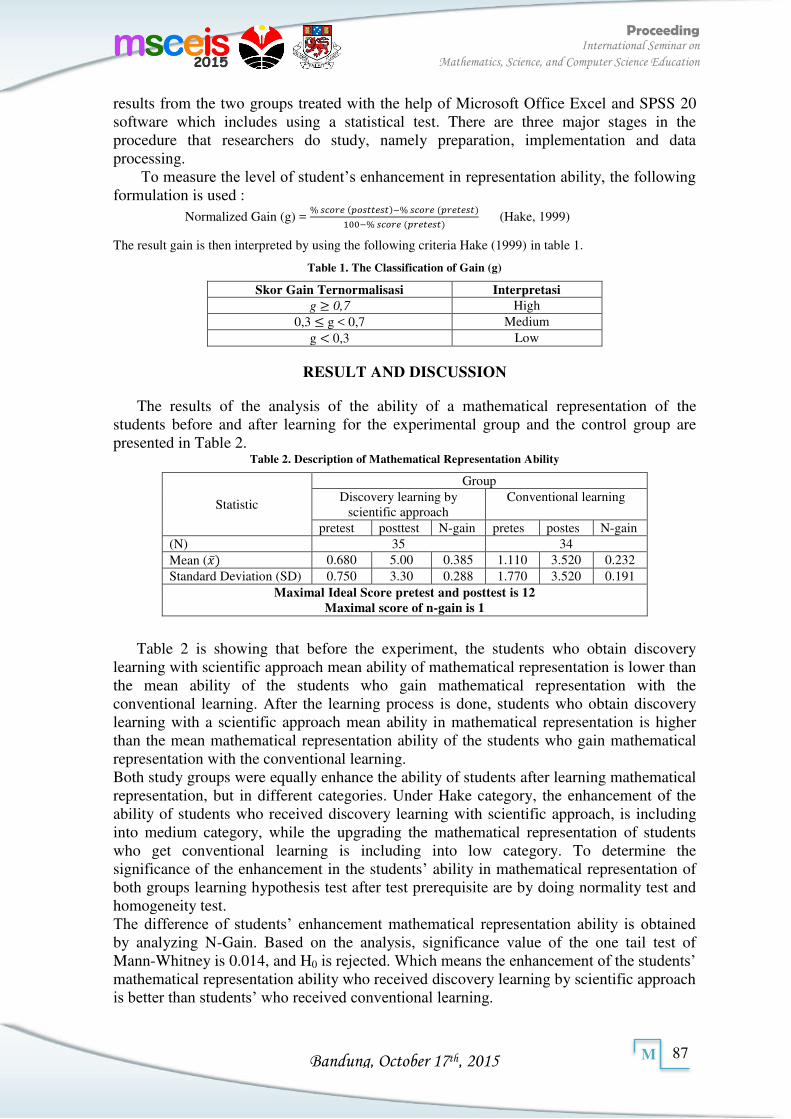
Bandung, October 17th, 2015
Proceeding International Seminar on
Mathematics, Science, and Computer Science Education
87
M
results from the two groups treated with the help of Microsoft Office Excel and SPSS 20 software which includes using a statistical test. There are three major stages in the procedure that researchers do study, namely preparation, implementation and data processing.
To measure the level of student’s enhancement in representation ability, the following formulation is used :
Normalized Gain (g) = % −% −% (Hake, 1999)
The result gain is then interpreted by using the following criteria Hake (1999) in table 1.
Table 1. The Classification of Gain (g)
Skor Gain Ternormalisasi Interpretasi
g 0,7 High 0,3 g < 0,7 Medium
g < 0,3 Low
RESULT AND DISCUSSION
The results of the analysis of the ability of a mathematical representation of the students before and after learning for the experimental group and the control group are presented in Table 2.
Table 2. Description of Mathematical Representation Ability
Statistic
Group Discovery learning by
scientific approach Conventional learning
pretest posttest N-gain pretes postes N-gain (N) 35 34 Mean ( 0.680 5.00 0.385 1.110 3.520 0.232 Standard Deviation (SD) 0.750 3.30 0.288 1.770 3.520 0.191
Maximal Ideal Score pretest and posttest is 12 Maximal score of n-gain is 1
Table 2 is showing that before the experiment, the students who obtain discovery learning with scientific approach mean ability of mathematical representation is lower than the mean ability of the students who gain mathematical representation with the conventional learning. After the learning process is done, students who obtain discovery learning with a scientific approach mean ability in mathematical representation is higher than the mean mathematical representation ability of the students who gain mathematical representation with the conventional learning. Both study groups were equally enhance the ability of students after learning mathematical representation, but in different categories. Under Hake category, the enhancement of the ability of students who received discovery learning with scientific approach, is including into medium category, while the upgrading the mathematical representation of students who get conventional learning is including into low category. To determine the significance of the enhancement in the students’ ability in mathematical representation of both groups learning hypothesis test after test prerequisite are by doing normality test and homogeneity test. The difference of students’ enhancement mathematical representation ability is obtained by analyzing N-Gain. Based on the analysis, significance value of the one tail test of Mann-Whitney is 0.014, and H0 is rejected. Which means the enhancement of the students’ mathematical representation ability who received discovery learning by scientific approach is better than students’ who received conventional learning.
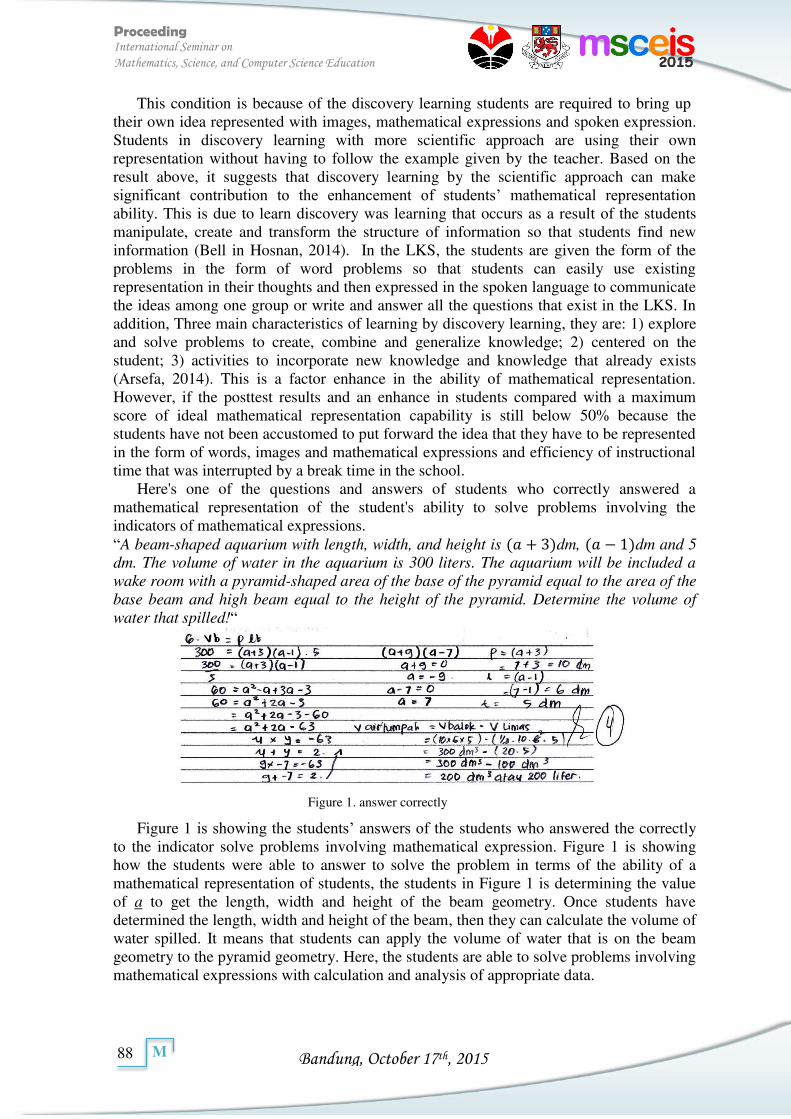
Bandung, October 17th, 2015
Proceeding International Seminar on
Mathematics, Science, and Computer Science Education
88
M
This condition is because of the discovery learning students are required to bring up their own idea represented with images, mathematical expressions and spoken expression. Students in discovery learning with more scientific approach are using their own representation without having to follow the example given by the teacher. Based on the result above, it suggests that discovery learning by the scientific approach can make significant contribution to the enhancement of students’ mathematical representation ability. This is due to learn discovery was learning that occurs as a result of the students manipulate, create and transform the structure of information so that students find new information (Bell in Hosnan, 2014). In the LKS, the students are given the form of the problems in the form of word problems so that students can easily use existing representation in their thoughts and then expressed in the spoken language to communicate the ideas among one group or write and answer all the questions that exist in the LKS. In addition, Three main characteristics of learning by discovery learning, they are: 1) explore and solve problems to create, combine and generalize knowledge; 2) centered on the student; 3) activities to incorporate new knowledge and knowledge that already exists (Arsefa, 2014). This is a factor enhance in the ability of mathematical representation. However, if the posttest results and an enhance in students compared with a maximum score of ideal mathematical representation capability is still below 50% because the students have not been accustomed to put forward the idea that they have to be represented in the form of words, images and mathematical expressions and efficiency of instructional time that was interrupted by a break time in the school.
Here's one of the questions and answers of students who correctly answered a mathematical representation of the student's ability to solve problems involving the indicators of mathematical expressions. “A beam-shaped aquarium with length, width, and height is + dm, − dm and 5
dm. The volume of water in the aquarium is 300 liters. The aquarium will be included a
wake room with a pyramid-shaped area of the base of the pyramid equal to the area of the
base beam and high beam equal to the height of the pyramid. Determine the volume of
water that spilled!“
Figure 1 is showing the students’ answers of the students who answered the correctly to the indicator solve problems involving mathematical expression. Figure 1 is showing how the students were able to answer to solve the problem in terms of the ability of a mathematical representation of students, the students in Figure 1 is determining the value of a to get the length, width and height of the beam geometry. Once students have determined the length, width and height of the beam, then they can calculate the volume of water spilled. It means that students can apply the volume of water that is on the beam geometry to the pyramid geometry. Here, the students are able to solve problems involving mathematical expressions with calculation and analysis of appropriate data.
Figure 1. answer correctly
Bandung, October 17th, 2015
Proceeding International Seminar on
Mathematics, Science, and Computer Science Education
89
M
CONCLUSION
Based on the results of research and discussion which has been described previously, it can be argued conclusion that the enhancement of mathematical representation ability of students who received the discovery learning with scientific approach was better than students who received conventional learning and concluded by making insightful suggestions and recommendations to stakeholders in education in helping students to enhance mathematical representation ability through discovery learning by the scientific approach.
REFERENCES
Amri. (2009). Peningkatan Kemampuan Representasi Matematik Siswa SMP Melalui
Pembelajaran Induktif-Deduktif. (Tesis). Sekolah Pascasarjana, Universitas Pendidikan Indonesia, Bandung.
Arsefa, D. (2014). Kemampuan Penalaran Matematika Siswa dalam Pembelajaran Penemuan Terbimbing. Prosiding Seminar Nasional Program Pascasarjana
Pendidikan Matematika STKIP Siliwangi Bandung, 1, hlm. 270-277.
As’ari, A. R. (2001). Representasi Pentingnya Dalam Pembelajaran Matematika. Jurnal
Matematika atau Pembelajarannya, 2, hlm. 81 – 91.
Haji, S. (2014). Strategi Think-Talk-Write (TTW) untuk Meningkatkan Kemampuan Representasi Matematik. Prosiding Seminar Nasional Program Pascasarjana
Pendidikan Matematika STKIP Siliwangi Bandung, 1, hlm. 49-56.
Hake, R.R. (1999). Analyzing Change/Gain Scores. [Online]. Tersedia: http://www.physics.indiana.edu/~sdi/Analyzingchange-Gain.pdf.
Hosnan. (2014). Pendekatan Saintifik Dan Kontekstual Dalam Pembelajaran Abad 21. Bogor: Ghalia Indonesia.
Markaban. (2006). Model Pembelajaran Matematika dengan Pendekatan Penemuan Terbimbing. Yogyakarta: PPPG Matematika.
National Council of Teacher of Mathematics. (2000). Curriculum and Evaluation
Standards for School Mathematics. Reston,VA: NCTM.
Ruseffendi, H. E. T. (2006). Pengantar Kepada Membantu Guru Mengembangkan
Kompetensinya dan Pengajaran Matematika untuk Meningkatkan CBSA. Bandung: Tarsito
________________. (2010). Dasar-dasar Penelitian Pendidikan dan Bidang Non Eksata
Lainnya. Semarang: Ikip Semarang Press.
Sugandi, A. I. (2014). Pendekatan Kontektual sebagai Pendekatan dalam Pembelajaran yang Humanis untuk Meningkatkan Kemampuan Berpikir Matematis Tingkat Tinggi. Prosiding Seminar Nasional Program Pascasarjana Pendidikan
Matematika STKIP Siliwangi Bandung, 1, hlm. 24-38.
Sugiyono. (2005). Statistika Untuk Penelitian.Bandung: Alfabeta.
Suryosubroto. (2009). Proses Belajar Mengajar Di Sekolah (Rev.ed.). Jakarta: PT. Rineka Cipta.
Bandung, October 17th, 2015
Proceeding International Seminar on
Mathematics, Science, and Computer Science Education
90
M
Umar, W. (2011). Kemampuan Representasi Matematis Melalui Pendidikan Matematika Realistik pada konsep pecahan dan pecahan senilai. Prosiding Seminar Nasional
Pendidikan Matematika STKIP Siliwangi Bandung, 1, hlm. 177–185.
Wahyudin. (2008). Pembelajaran dan Model-Model Pembelajaran. Bandung: UPI Press.
Widyastuti. (2011). Pengaruh Pembelajaran Model Eliciting Activities Terhadap Kemampuan Representasi Matematis Siswa. Prosiding Seminar Nasional
Pendidikan MIPA Bandar lampung,hlm. 141-148.
Bandung, October 17th, 2015
Proceeding International Seminar on
Mathematics, Science, and Computer Science Education
91
M
MATH-07218
Reviews of Mathematical Reasoning Ability in Junior High School Students through Geometry Task-Based Interview
Nurfadilah Siregar1
1Student of Postgraduate in Mathematics Education, Universitas Pendidikan Indonesia
Article info Abstract
Keywords:
Preliminary study or commonly called the pilot study is a study conducted by most researchers as an important issue in future research projects. In this paper, the author present results of interviews conducted with two students in seventh grade at one of junior high school in West Bandung regency about digging their mathematical reasoning. Interviews were conducted by using a task-based geometry. The results indicate that mathematical reasoning of the students’ related to the completion of geometry task still low. Students more likely to complete tasks directly without knowing the reason they answered the geometry tasks.
Corresponding Author: Nurfadilah Siregar
INTRODUCTION
In general, preliminary study or commonly called the pilot study is a study conducted by most researchers as an important issue in future research projects. In this paper, the author presents the results of a preliminary study that has been done in the form of the transcript of an interview conducted with two students in seventh grade at one junior high school in West Bandung regency. The purpose of doing this preliminary study was to review the mathematical reasoning ability of middle school students to the concepts of geometry.
Interviews done by noticed the students' answers to a given task. From previous studies conducted by 1 task-based interviews is very important, one of which is to obtain information about appropriate teaching methods to develop students' mathematical abilities.
Basically the scientific nature of this task-based interviews are used in long-term studies that require an in-depth exploration, whereas in this paper is only a pilot study. The author realized that the transcript of the interview given to students is not yet the end result because there are still many shortcomings in arranging structured interviews, both in terms of validity and reliability. However, it is becoming a fundamental reason that in preparing this paper is not justified initial studies using a task-based interviews.
METHOD
This paper provides a review of the transcript of an interview between the author with two students in eighth grade at one junior high school in West Bandung regency. Implementation of the interview on Friday after the student's core activities in class (at 13:30 to 14:30 pm, at that time there is extracurricular activities at school). To both of these students, the author previously introduced herself as a friend of their teachers and want to ask some questions about geometry concepts they have learned until now. The students choosen by considering the abilities of different level of students, level’s namely good and mid was based on judgment from the class teacher. Start from introduction of
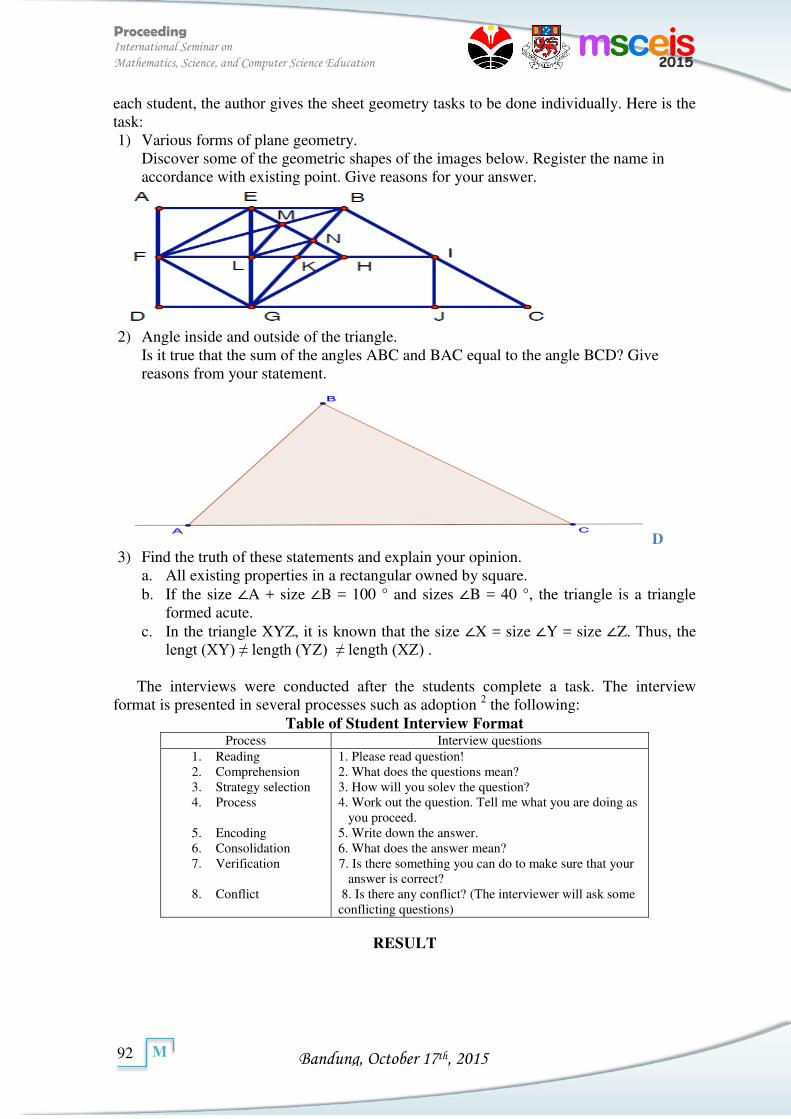
Bandung, October 17th, 2015
Proceeding International Seminar on
Mathematics, Science, and Computer Science Education
92
M
each student, the author gives the sheet geometry tasks to be done individually. Here is the task: 1) Various forms of plane geometry.
Discover some of the geometric shapes of the images below. Register the name in accordance with existing point. Give reasons for your answer.
2) Angle inside and outside of the triangle.
Is it true that the sum of the angles ABC and BAC equal to the angle BCD? Give reasons from your statement.
D 3) Find the truth of these statements and explain your opinion.
a. All existing properties in a rectangular owned by square. b. If the size ∠A + size ∠B = 100 ° and sizes ∠B = 40 °, the triangle is a triangle
formed acute. c. In the triangle XYZ, it is known that the size ∠X = size ∠Y = size ∠Z. Thus, the
lengt (XY) ≠ length (YZ) ≠ length (XZ) .
The interviews were conducted after the students complete a task. The interview format is presented in several processes such as adoption 2 the following:
Table of Student Interview Format Process Interview questions
1. Reading 2. Comprehension 3. Strategy selection 4. Process
5. Encoding 6. Consolidation 7. Verification
8. Conflict
1. Please read question! 2. What does the questions mean? 3. How will you solev the question? 4. Work out the question. Tell me what you are doing as
you proceed. 5. Write down the answer. 6. What does the answer mean? 7. Is there something you can do to make sure that your
answer is correct? 8. Is there any conflict? (The interviewer will ask some conflicting questions)
RESULT
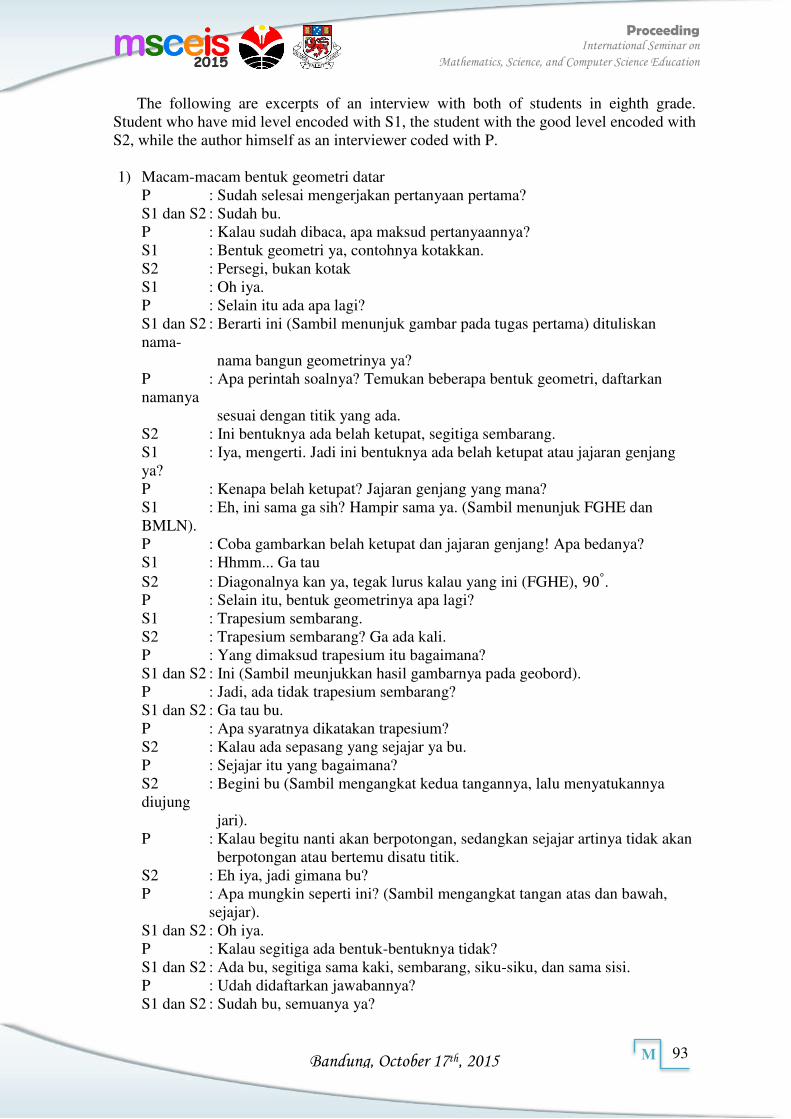
Bandung, October 17th, 2015
Proceeding International Seminar on
Mathematics, Science, and Computer Science Education
93
M
The following are excerpts of an interview with both of students in eighth grade. Student who have mid level encoded with S1, the student with the good level encoded with S2, while the author himself as an interviewer coded with P. 1) Macam-macam bentuk geometri datar
P : Sudah selesai mengerjakan pertanyaan pertama? S1 dan S2 : Sudah bu. P : Kalau sudah dibaca, apa maksud pertanyaannya? S1 : Bentuk geometri ya, contohnya kotakkan. S2 : Persegi, bukan kotak S1 : Oh iya. P : Selain itu ada apa lagi? S1 dan S2 : Berarti ini (Sambil menunjuk gambar pada tugas pertama) dituliskan nama- nama bangun geometrinya ya? P : Apa perintah soalnya? Temukan beberapa bentuk geometri, daftarkan namanya sesuai dengan titik yang ada. S2 : Ini bentuknya ada belah ketupat, segitiga sembarang. S1 : Iya, mengerti. Jadi ini bentuknya ada belah ketupat atau jajaran genjang ya? P : Kenapa belah ketupat? Jajaran genjang yang mana? S1 : Eh, ini sama ga sih? Hampir sama ya. (Sambil menunjuk FGHE dan BMLN). P : Coba gambarkan belah ketupat dan jajaran genjang! Apa bedanya? S1 : Hhmm... Ga tau S2 : Diagonalnya kan ya, tegak lurus kalau yang ini (FGHE), °. P : Selain itu, bentuk geometrinya apa lagi? S1 : Trapesium sembarang. S2 : Trapesium sembarang? Ga ada kali. P : Yang dimaksud trapesium itu bagaimana? S1 dan S2 : Ini (Sambil meunjukkan hasil gambarnya pada geobord). P : Jadi, ada tidak trapesium sembarang? S1 dan S2 : Ga tau bu. P : Apa syaratnya dikatakan trapesium? S2 : Kalau ada sepasang yang sejajar ya bu. P : Sejajar itu yang bagaimana? S2 : Begini bu (Sambil mengangkat kedua tangannya, lalu menyatukannya diujung jari). P : Kalau begitu nanti akan berpotongan, sedangkan sejajar artinya tidak akan berpotongan atau bertemu disatu titik. S2 : Eh iya, jadi gimana bu? P : Apa mungkin seperti ini? (Sambil mengangkat tangan atas dan bawah,
sejajar). S1 dan S2 : Oh iya. P : Kalau segitiga ada bentuk-bentuknya tidak? S1 dan S2 : Ada bu, segitiga sama kaki, sembarang, siku-siku, dan sama sisi. P : Udah didaftarkan jawabannya? S1 dan S2 : Sudah bu, semuanya ya?
Bandung, October 17th, 2015
Proceeding International Seminar on
Mathematics, Science, and Computer Science Education
94
M
P : Terserah kamu, seberapa banyak, kalau banyak juga tidak apa, minimal 1. Bagaimana dengan bentuk persegi dan persegi panjang? S1 dan S2 : Sudah juga bu, semuanya dituliskan ya bu. P : Jadi udah semua bentuk geometri dituliskan? S1 dan S2 : Iya bu, sudah semua. P : Jadi yang masuk segi empat apa saja? Bagaimana dengan segi tiga? S1 dan S2 : (Sambil menunjukkan jawabannya masing-masing). P : Bisakah kamu membuat diagram yang menunjukkan kalau itu (Sambil menunjukkan gambar pada tugas pertama) termasuk segi empat atau segi tiga? S1 dan S2 : Udah gini aja deh bu. Ga usah dikelompokkan lagi. P : Baiklah.
2) Sudut dalam dan luar segitiga. P : Sekarang tugas yang kedua, sudah dikerjakan? S1 : Ini maksudnya apa bu? Eh, sudah tau bu. P : Coba baca pertanyaannya, maksudnya apa kira-kira? S2 : Begini bu, ini kan sudut sejajar. Eh, sudut pelurus ya (Sambil menunjuk gambar pada tugas kedua, membuat setengah lingkaran). Ini kan sudut dalam segitiga ° (Sambil menunjuk sudut dalam segitiga ABC), benarkan? S1 : Haduh, ga ngerti. Ga suka yang begini bu. P : Kenapa? Coba yang mana yang tidak mengerti? S1 : Udah kan bu, gini ajalah, sudutnya °. P : Eh, belum, terus diapakan? S2 : Ini sudut apa bu namanya? (Sambil menunjuk sudut C) P : Coba buat masing-masing sudut C1 dan C2 (Buat berbeda pada masing-masing sudut dalam dan luar). S2 : Oh, ini jadi sudut C1, yang ini jadinya sudut C2. Kalau mau bilang yang ini (Sambil menunjuk sudut C) diapain gitu ya. Saya menjawabnya dijelaskan aja ya bu, tidak usah ditulis, diomongin aja, kalau dituliskan susah. S1 : Saya sudah bu, begini aja. Ga tau lagi mau diapain. P : Coba tuliskan sepemahaman kamu saja. Tidak masalah kalau benar ataupun salah. Ibu hanya mau melihat kemampuan kamu dalam menuliskan bukti, kalau memang tidak bisa, tidak mengapa. S1 dan S2 : Baik bu (Sambil menuliskan jawaban pada lembar yang tersedia).
3) Menentukan kebenaran pernyataan. a. P : Bagaimana dengan pernyataan bagian (a), benar atau salah? S2 : Ini dibuat perbedaannya ya bu? S1 : Sudah bu, begini kan bu (Sambil menggambar persegi panjang). Karna kalau persegi panjang dibagi dua atau dibagi berapa jadinya persegi. Jadi jawabnya benar. P : Apa sifat yang dimiliki persegi panjang dan persegi? Ada yang tau? S1 dan S2: Apa ya bu.
S2 : (Membuat perbedaan antara persegi panjang dan persegi), kalau begitu persegi ini bagian dari persegi panjang. Benar jawabannya, karena apa ya.
Bandung, October 17th, 2015
Proceeding International Seminar on
Mathematics, Science, and Computer Science Education
95
M
P : Bagaimana dengan ukuran sudut dan sisinya? S2 : Sudutnya sama bu, °. Kalau sisinya, persegi panjang kedua sisinya sejajar, persegi sisinya sama panjang. P : Iya, kalau memang seperti itu silahkan tuliskan jawaban kamu dilembar yang disediakan. b. P : Sekarang masuk pernyataan pada bagian (b). Mengerti maksud pernyataan
tersebut? S2 : Ini maksudnya ukuran sudut A ° ya kan bu. P : Kenapa begitu? Taunya darimana? S2 : Karena ° − ° = ° S1 : Oh, terus bagaimana? S2 : Sudut C nya diamana ya? P : Coba digambarkan segitiga yang dimaksud. S2 : (Menggambarkan segitiga dengan masing-masing sudutnya). Oh, jadi sudut C nya disini (Sambil menunjuk sudut yang belum memiliki ukuran. S1 : Tidak ada sudut C nya bu. Adanya sudut B1 dan B2 ya bu? P : Jadi kalau udah tau masing-masing ukuran sudutnya, selanjutnya bagaimana? S2 : Namanya segitiga apa ya, sudutnya kurang dari °. P : Apa namanya sudut yang kurang dari °? S1 dan S2: Sudut lancip bu. P : Nah, kalau semua sudut segitiganya kurang dari °, jadinya segitiga apa?
S2 : Oh iya, kan sudut segitiga jumlahnya °, ukuran sudut C nya berarti °, jadi namanya segitiga lancip. Benar ya bu. S1 : Oh iya deh bu. Jadi benar ya, segitiga lancip karena sudut lancip kurang dari °. P : Kalau memang begitu, tulisan yang kamu buat bagaimana? S1 dan S2: Harus ditulis lagi ya bu?
P : Iya, mau dilihat pernyataan dari jawaban yang kamu buat. Jangan hanya jawab benar atau salah saja.
S1 dan S2: Iya bu.
c. P : Bagaimana dengan pernyataan bagian (c)? Sudah ada yang menjawab? Apa
jawabannya? S1 : Ini maksudnya apa bu? Mungkin jawabannya benar bu. Iya kan bu? S2 : Sepertinya jawabannya salah deh. Harusnya benar kan, segitiga sama sisi, sisinya sama panjang dan sudutnya sama besar. Jadi jawabannya salah ya kan bu. P : Harusnya bagaimana? Benar atau salah? Terserah kamu yang penting buat alasan kenapa kamu memberikan jawaban seperti itu. S1 dan S2: Baik bu (Sambil menuliskan jawaban ditempat yang disediakan).
On the part time, the authors also propose some questions that are not directly
associated with a given task, here are the following questions: P : Diantara mata pelajaran yang ada di sekolah, suka tidak dengan mata pelajaran Matematika? S1 : Ga suka bu, saya lebih suka sama Bahasa Indonesia. Kalau S2 itu pasti suka bu. S2 : Saya suka bu, daripada pelajaran yang menghafal, lebih suka yang menghitung
bu. Tapi ga suka kalau membuktikan yang seperti tadi bu (Sambil mengingat tugas no.2).
Bandung, October 17th, 2015
Proceeding International Seminar on
Mathematics, Science, and Computer Science Education
96
M
P : Kenapa begitu? S1 : Ga suka aja bu, memang saya lemah kalau matematika bu. S2 : Saya sering diajarin sama mama dan kakak di rumah bu. Jadi lebih paham lagi, kalau membuktikan gitu kan ga pernah bu. P : Itu tadi tugas yang dikerjakan mengenai Geometri, tau kan? S1 dan S2: Iya bu, tau. S2 : Saya sukanya yang Aljabar bu. S1 : Saya ga suka semuanya bu. P : Oh, kalau di kelas pernah menggunakan alat bantu apa dalam belajar Geometri?
Selain jangka, penggaris, dan busur? Komputer mungkin? S1 dan S2: Ga pernah bu, hanya menggunakan jangka, dan busur saja. P : Mungkin kalau pembelajarannya menggunakan alat bantu komputer bisa lebih
menarik dan mudah dipahami. Jadi kalian juga bisa tambah suka dengan Matematika.
S1 dan S2: Iya bu, mau dicoba kapan-kapan ya bu.
DISCUSSION
At this pilot study, task-based interview were used to review the student's ability to reason, especially in geometry concepts. According to 1 one of the goals of the task-based interview in mathematics education is to enable us to characterize students strategy, structure of knowledge, or competencies that may be effective in teaching, understanding the developmental process better, or to explore the problem-solving behavior. In this case, the observed ability is the ability of students' mathematical reasoning.
Still according to 1 questions asked in the task-based interview should rely on the theory that referenced. Thus because the authors take the discussion on the concept of geometry and mathematical reasoning, the authors present the following brief description of it.
Students are said to be capable of reasoning if he or she is able to use reasoning on the pattern and nature, perform mathematical manipulation in making generalizations, compile evidence, or explain mathematical ideas and statements 3. In that regard the technical explanations charging indicator report outlined that students have the ability reasoning is: (a) Asking the alleged; (b) the mathematical manipulation; (c) Draw conclusions, compile evidence, giving reasons or evidence of the truth of the solution; (d) Draw conclusions from the statement; (e) To verify the validity of an argument; (f) Finding the pattern or nature of the phenomenon mathematically to make generalizations.
From interviews conducted by the author, it turns out each student has a different mathematical reasoning ability in completing task. It can be seen from the answers and excerpts of an interview between students who have mid level encoded with S1, the student with the good level encoded with S2. According to the author of the gap between the two students can be minimized by implementing learning of geometry suitable for all abilities of students.
Lack of students' skills or ability in reasoning of geometry task can be seen from their answers as follows:
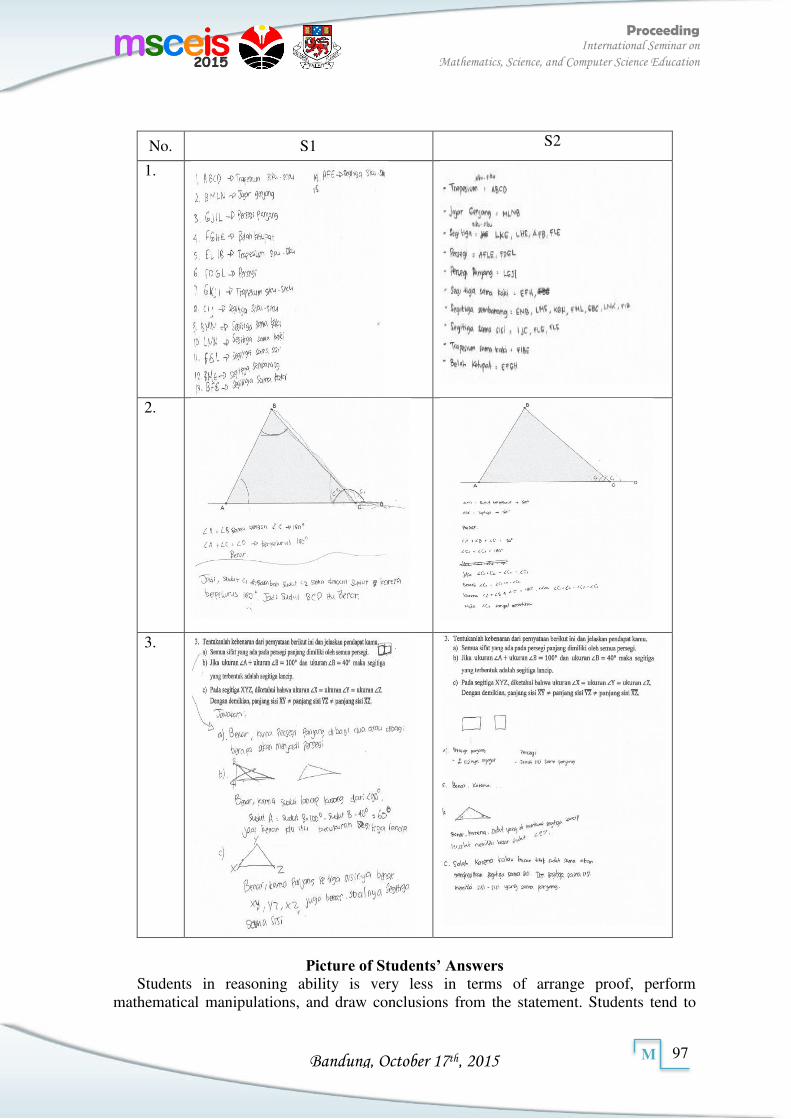
Bandung, October 17th, 2015
Proceeding International Seminar on
Mathematics, Science, and Computer Science Education
97
M
No. S1 S2
1.
2.
3.
Picture of Students’ Answers
Students in reasoning ability is very less in terms of arrange proof, perform mathematical manipulations, and draw conclusions from the statement. Students tend to
Bandung, October 17th, 2015
Proceeding International Seminar on
Mathematics, Science, and Computer Science Education
98
M
answer questions without asking first allegation, this is happen because of the students rarely obtain similar tasks. Supposedly students' mathematical reasoning is developed, so that students are expected to settle the problems not only in geometry concepts which relates to reasoning but also on other materials. The purpose of learning geometry in general is that the students gain confidence regarding math skills, be good problem solvers, to communicate mathematically, and to reason mathematically 4. Finally, from the interviews based on the geometry task with the two students in class VIII obtained some records as follows: a) Altough the two students had been learning about the material rectangles and
triangles, but they still have difficulty in determine the type of rectangular or triangular by properties.
b) The possibility of teachers rarely give problems associated with mathematical reasoning to the concept of geometry.
c) So far learning geometry seem boring because only using the tools of the "traditional" form of a compass, ruler, and bows.
d) The ability of the students at both levels when answering the tasks and interviews that had been conducted, maybe giving a great influence on the students' final answers.
CONCLUSIONS
This pilot study was not the end of the research that be conducted by author. This pilot study serves as an initial step to determine what to do next to improve mathematical reasoning abilities of students in the concepts of geometry. Preparation of teaching materials by paying particular attention to the level of student thinking is possible for further research, as well as the use of tools such as computer media in learning geometry or other materials, so that students will be interested in the subjects of Mathematics.
REFERENCES
[1]. Goldin, D. 1998. Observing Mathematical Problem Solving Throgh Task-Based Interview. In Teppo, A. Qualitative Research Methods in Mathematics Educationx. Reston: The National Council of Teachers of Mathematics Inc.
[2]. Luka, M.T. 2013. Misconceptions And Errors In Algebra At Grade 11 Level: The Case
Of Two Selected Secondary Schools In Petauke District. Thesis in The University Of Zambia.
[3]. Wardhani, S. 2008. Analisis SI dan SKL Mata Pelajaran Matematika SMP/MTs untuk
Optimalisasi Tujuan Mata Pelajaran Matematika. Pusat Pengembangand Pemberdayaan Pendidik dan Tenaga Kependidikan Matematika. Yogyakarta.
[4]. Mulyana, E. 2003. Masalah Ketidaktepatan Istilah dan Simbol dalam Geometri SLTP
Kelas 1. Makalah. FPMIPA UPI.
Bandung, October 17th, 2015
Proceeding International Seminar on
Mathematics, Science, and Computer Science Education
99
M
MATH-07224
Interactive Multimedia Computer-Based Learning to Enhance Mathematical Understanding Abilities JuniorHhigh School
Students
Nurjanah, Didi Suryadi, Jozua Sabandar, Darhim
Department of Mathematics Education, Universitas Pendidikan Indonesia, Bandung 40 154, Indonesia
Article info Abstract
Keywords:
Computer-based interactive multimedia learning, Mathematical understanding.
Interactive multimedia computer-based learning is a learning program using computer software, which contains the title, objectives, learning materials, and evaluation. Multimedia that has been done using models separately multimedia , such as models of drill and practice , tutorial models, simulation models, models Games. However, multimedia like this less meaningful because it does not build students' understanding of the concept . In this paper, ,multimedia are made based on constructivism, in which students build their own concept based on its understanding . In addition, a multimedia mix of models made drill and practice , tutorial models , simulation model coupled with a model of discovery of learning by using a combined model of drill and practice, tutorial models, simulations, and discovery models in computer programs created. Different from other reports, made multimedia includes how to build concepts through computer-based learning, navigation, feedback, and interactivity. This study Aimed to examine the enhancement of the understanding mathematical abilities of junior high school students through computer-based interactive multimedia learning. This study was quasi-experimental in nature with pretest and posttest control group design. Based on the results of data, it could be concluded that; (1) The enhancement of student 'understanding of mathematical abilities through computer-based interactive multimedia learning was higher than the conventional learning approaches; (2) based on the school levels, there were no differences of mathematical understanding students who exposed with computer-based interactive multimedia and conventional learning approaches; (3) based on KAM test, there was significant enhancement of students' mathematical understanding among ability of high, middle, and low KAM. The differences occur between high KAM and middle KAM, and also between high KAM and low KAM. Based on this result, computer-based interactive multimedia learning can be applied in the process of Mathematics Learning in Junior High School.
Corresponding Author: Nurjanah [email protected]
INTRODUCTION
Interactive multimedia computer-based learning is a learning program using computer software (CD learning) in the form of a computer program that contains a payload of learning include: title, objectives, learning materials, and evaluation of learning. This is in line with what is proposed by Heinich et al [7] which states that the so-called computer-based learning is learning indivuidual and directly to the students by interacting with subjects that are programmed into the computer system. Models of computer -based interactive multimedia conducted by researchers previously made separately, including models drill and practice , tutorial models , simulation models , models games [1,2,4,5]. Some studies Kulik (1985) and Bangert-Drown (1985) [1] stated that compared to
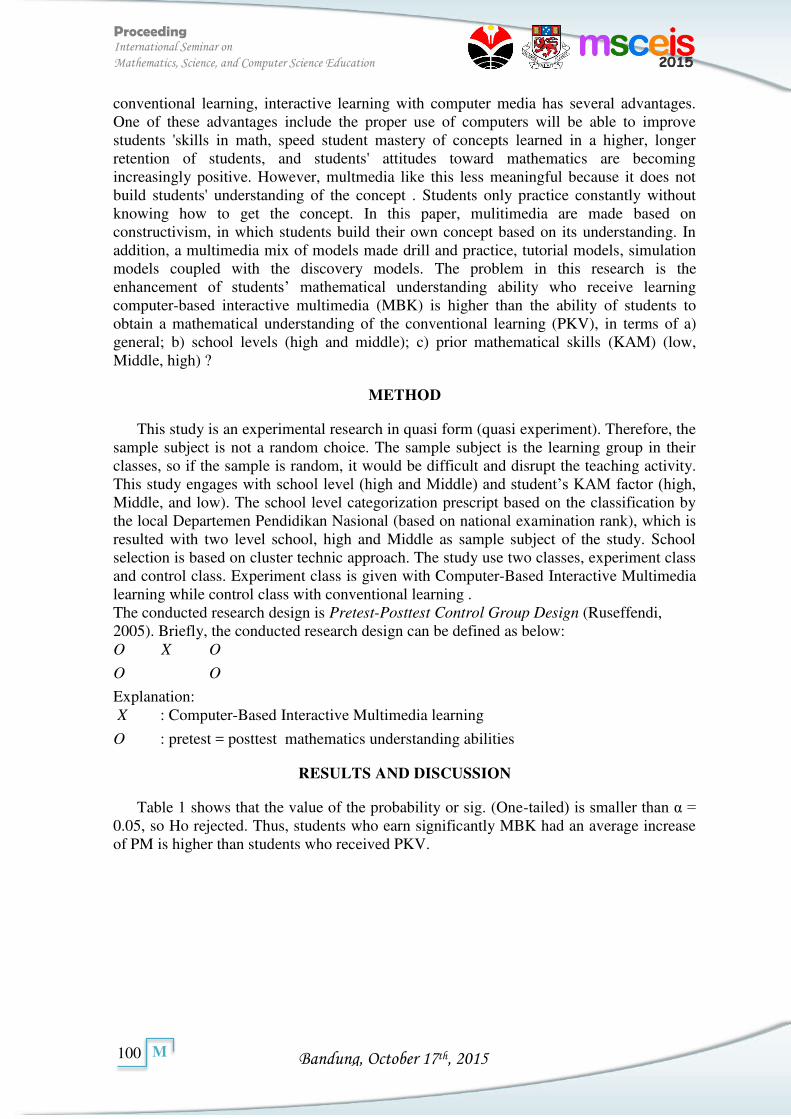
Bandung, October 17th, 2015
Proceeding International Seminar on
Mathematics, Science, and Computer Science Education
100
M
conventional learning, interactive learning with computer media has several advantages. One of these advantages include the proper use of computers will be able to improve students 'skills in math, speed student mastery of concepts learned in a higher, longer retention of students, and students' attitudes toward mathematics are becoming increasingly positive. However, multmedia like this less meaningful because it does not build students' understanding of the concept . Students only practice constantly without knowing how to get the concept. In this paper, mulitimedia are made based on constructivism, in which students build their own concept based on its understanding. In addition, a multimedia mix of models made drill and practice, tutorial models, simulation models coupled with the discovery models. The problem in this research is the enhancement of students’ mathematical understanding ability who receive learning computer-based interactive multimedia (MBK) is higher than the ability of students to obtain a mathematical understanding of the conventional learning (PKV), in terms of a) general; b) school levels (high and middle); c) prior mathematical skills (KAM) (low, Middle, high) ?
METHOD
This study is an experimental research in quasi form (quasi experiment). Therefore, the sample subject is not a random choice. The sample subject is the learning group in their classes, so if the sample is random, it would be difficult and disrupt the teaching activity. This study engages with school level (high and Middle) and student’s KAM factor (high, Middle, and low). The school level categorization prescript based on the classification by the local Departemen Pendidikan Nasional (based on national examination rank), which is resulted with two level school, high and Middle as sample subject of the study. School selection is based on cluster technic approach. The study use two classes, experiment class and control class. Experiment class is given with Computer-Based Interactive Multimedia learning while control class with conventional learning . The conducted research design is Pretest-Posttest Control Group Design (Ruseffendi, 2005). Briefly, the conducted research design can be defined as below: O X O
O O
Explanation: X : Computer-Based Interactive Multimedia learning
O : pretest = posttest mathematics understanding abilities
RESULTS AND DISCUSSION
Table 1 shows that the value of the probability or sig. (One-tailed) is smaller than α = 0.05, so Ho rejected. Thus, students who earn significantly MBK had an average increase of PM is higher than students who received PKV.
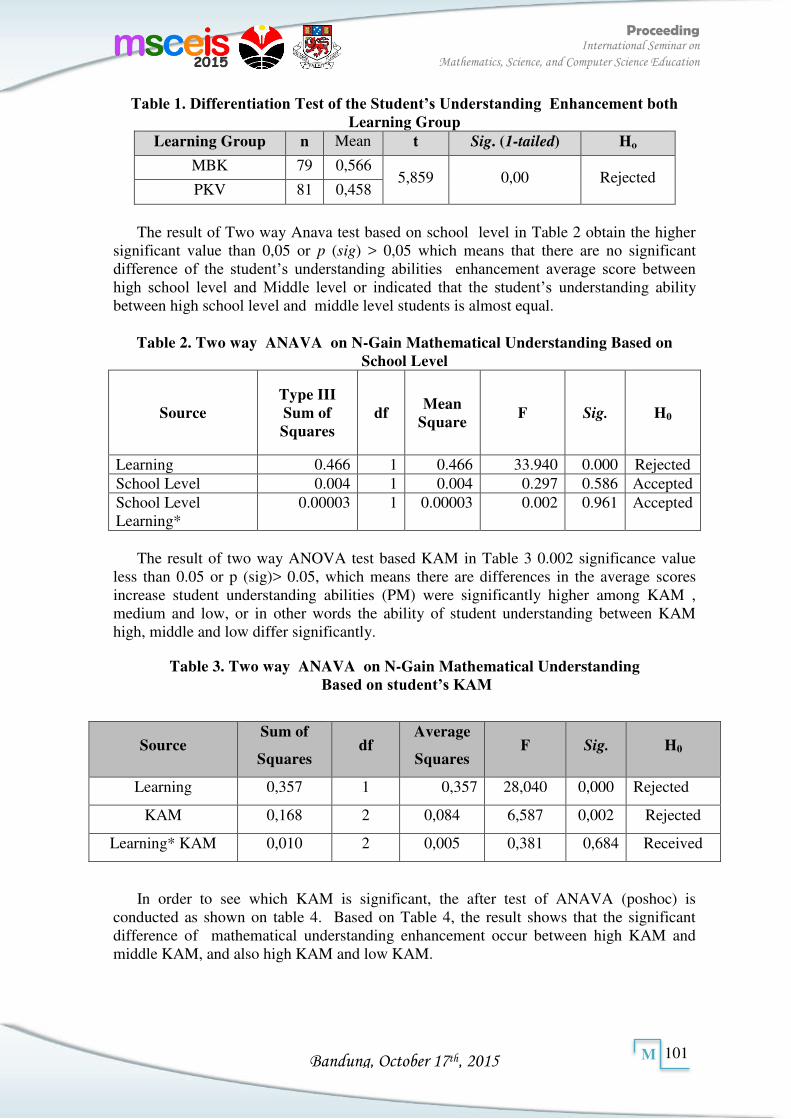
Bandung, October 17th, 2015
Proceeding International Seminar on
Mathematics, Science, and Computer Science Education
101
M
Table 1. Differentiation Test of the Student’s Understanding Enhancement both Learning Group
Learning Group n Mean t Sig. (1-tailed) Ho
MBK 79 0,566 5,859 0,00 Rejected
PKV 81 0,458
The result of Two way Anava test based on school level in Table 2 obtain the higher
significant value than 0,05 or p (sig) > 0,05 which means that there are no significant difference of the student’s understanding abilities enhancement average score between high school level and Middle level or indicated that the student’s understanding ability between high school level and middle level students is almost equal.
Table 2. Two way ANAVA on N-Gain Mathematical Understanding Based on
School Level
Source Type III Sum of Squares
df Mean
Square F Sig. H0
Learning 0.466 1 0.466 33.940 0.000 Rejected School Level 0.004 1 0.004 0.297 0.586 Accepted School Level Learning*
0.00003 1 0.00003 0.002 0.961 Accepted
The result of two way ANOVA test based KAM in Table 3 0.002 significance value
less than 0.05 or p (sig)> 0.05, which means there are differences in the average scores increase student understanding abilities (PM) were significantly higher among KAM , medium and low, or in other words the ability of student understanding between KAM high, middle and low differ significantly.
Table 3. Two way ANAVA on N-Gain Mathematical Understanding Based on student’s KAM
Source Sum of
Squares df
Average
Squares F Sig. H0
Learning 0,357 1 0,357 28,040 0,000 Rejected
KAM 0,168 2 0,084 6,587 0,002 Rejected
Learning* KAM 0,010 2 0,005 0,381 0,684 Received
In order to see which KAM is significant, the after test of ANAVA (poshoc) is conducted as shown on table 4. Based on Table 4, the result shows that the significant difference of mathematical understanding enhancement occur between high KAM and middle KAM, and also high KAM and low KAM.
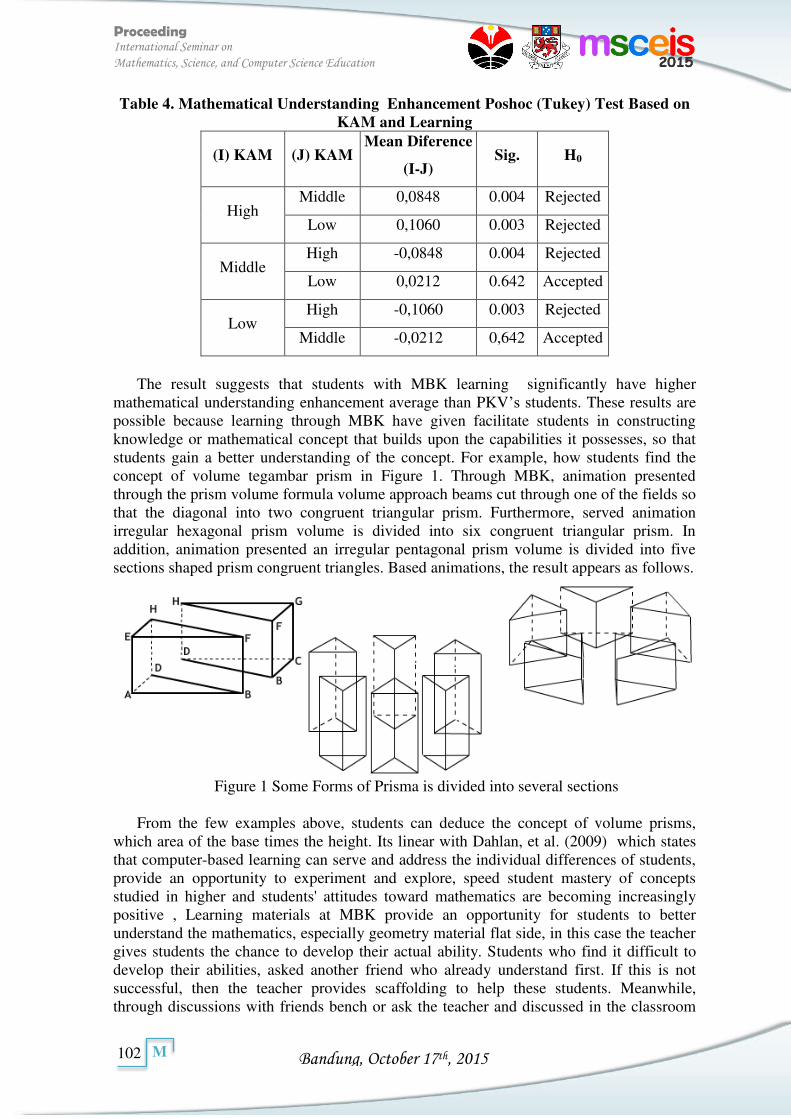
Bandung, October 17th, 2015
Proceeding International Seminar on
Mathematics, Science, and Computer Science Education
102
M
Table 4. Mathematical Understanding Enhancement Poshoc (Tukey) Test Based on KAM and Learning
(I) KAM (J) KAM Mean Diference
(I-J) Sig. H0
High Middle 0,0848 0.004 Rejected
Low 0,1060 0.003 Rejected
Middle High -0,0848 0.004 Rejected
Low 0,0212 0.642 Accepted
Low High -0,1060 0.003 Rejected
Middle -0,0212 0,642 Accepted
The result suggests that students with MBK learning significantly have higher
mathematical understanding enhancement average than PKV’s students. These results are possible because learning through MBK have given facilitate students in constructing knowledge or mathematical concept that builds upon the capabilities it possesses, so that students gain a better understanding of the concept. For example, how students find the concept of volume tegambar prism in Figure 1. Through MBK, animation presented through the prism volume formula volume approach beams cut through one of the fields so that the diagonal into two congruent triangular prism. Furthermore, served animation irregular hexagonal prism volume is divided into six congruent triangular prism. In addition, animation presented an irregular pentagonal prism volume is divided into five sections shaped prism congruent triangles. Based animations, the result appears as follows.
Figure 1 Some Forms of Prisma is divided into several sections
From the few examples above, students can deduce the concept of volume prisms,
which area of the base times the height. Its linear with Dahlan, et al. (2009) which states that computer-based learning can serve and address the individual differences of students, provide an opportunity to experiment and explore, speed student mastery of concepts studied in higher and students' attitudes toward mathematics are becoming increasingly positive , Learning materials at MBK provide an opportunity for students to better understand the mathematics, especially geometry material flat side, in this case the teacher gives students the chance to develop their actual ability. Students who find it difficult to develop their abilities, asked another friend who already understand first. If this is not successful, then the teacher provides scaffolding to help these students. Meanwhile, through discussions with friends bench or ask the teacher and discussed in the classroom
Bandung, October 17th, 2015
Proceeding International Seminar on
Mathematics, Science, and Computer Science Education
103
M
together the potential ability of students is more developed so that students' understanding of mathematics more deeply. One foundation that can be used untu achieve these objectives, among others, is the Zone of Proximal Development (ZPD) of Vygotsky [8], which states that learning can generate various mental processes stored can only be operated when someone interacts with adults or collaborate with peers. The learning process occurs in two stages: The first stage occurs when collaborating with others, and the next stage is done on an individual basis which includes a process of internalization. At the end of the lesson, MBK supply problems with the feedback process, so that when students work on the problems still one could fix it until the answer is correct. According to Gagne [3] concept of feedback was very important in the learning process, without feedback learners will not know the result of his actions.
Statistical analysis showed that there was no difference in the average scores increase student understanding abilities is significant among top level school and middle school level or in other words the ability of students' mathematical understanding between upper-level school and middle school levels did not differ significantly. Based on the results of statistical tests, we can conclude that learning can be applied to school MBK top level and middle level to improve students' mathematical understanding. Students at any school level can benefit equally from their lessons.
Statistical analysis showed that there was no difference in the average scores increase student mathematical understanding abilities is significant among top level school and middle school level or in other words the ability of students' mathematical understanding between upper-level school and middle school levels did not differ significantly. Based on the results of statistical tests, we can conclude that learning can be applied to school MBK top level and middle level to improve students' mathematical understanding. Students at any school level can benefit equally from their lessons.
Other findings in this study is that KAM has a significant influence on the improvement of students' mathematical understanding. This means that, in addition to learning factors, factors KAM also provide a strong enough influence on the differences increase students' mathematical understanding. To know the KAM where the difference increased understanding of mathematical occur, Poshoc next test (Tukey). The result suggests that the differences of student’s mathematical understanding enhancement are significantly occurs between high KAM and middle KAM, and also high KAM and low KAM. This means that the enhancement of student’s mathematical understanding with high KAM is better than middle or low KAM, while middle and low KAM is equal. This finding suggests that there are other factors that also influential, that is student’s KAM. Therefore, in order to optimize the student’s mathematical understanding, the teacher is suggested to observe student’s KAM before the teaching session started.
CONCLUSION
Based on the results of research and discussion above, it can be concluded: (1) in general, the of student’s enhancement mathematical understanding with Computer-Based Interactive Multimedia learning higher rather than students in conventional learning. (2) in school level (high and Middle), there are no significant differences in the enhancement of ability of students’ between high and middle level students. (3) According to KAM (high, middle, and low) there are significant average enhancement of mathematical understanding ability between high, middle, and low KAM. The differences occur between high KAM and middle KAM, and also between high KAM and low KAM. Learning with interactive multimedia computer-based recommended to be applied in the process of mathematics learning in junior high school (S.
Bandung, October 17th, 2015
Proceeding International Seminar on
Mathematics, Science, and Computer Science Education
104
M
REFERENCES
[1]. Dahlan, J.A, Kusumah, Y.S., Sutarno, H. (2009). Pengembangan Model Computer
Based E-Learning untuk Meningkatkan Kemampuan High-Order Mathematical
Thinking Siswa SMA. Penelitian Hibah Bersaing Perguruan Tinggi. Universitas Pendidikan Indonesia: Dikti.
[2]. Kusumah, Y.S., Nurjanah, Sutarno, H. (2005). Desain dan Pengembangan
Courseware Berbasis Komputer dalam Implementasi E-Learning Matematika untuk
Meningkatkan Pemehaman Matematik dan Kemampuan Berfikir Kritis Siswa SMA.
Penelitian Hibah Bersaing Perguruan Tinggi. Universitas Pendidikan Indonesia: Dkiti. [3]. Munir. (2012). Multimedia: Konsep & Aplikasi dalam Pendidikan. Bandung:
ALFABETA. [4]. Priarna N, Priatna, B.A.,(2007). Desain dan Pengembangan Multimedia Matematika
Interaktif untuk Meningkatkan Kemampuan Penalaran, Komunikasi, dan Pemecahan
Masalah Matematika Siswa SMP. Penelitian Hibah Bersaing Perguruan Tinggi. Universitas Pendidikan Indonesia: Dkiti.
[5]. Nurjanah, Wibowo, Y., Marwati. R. (2011). Pengembangan Bahan Ajar Multimedia
Interaktif dalam Pembelajaran Geometri untuk Meningkatkan Spatial Sense Siswa
SMP dan SMA. Penelitian Hibah Bersaing Perguruan Tinggi. Universitas Pendidikan Indonesia: DIKTI.
[6]. Ruseffendi, E.T. (2005). Dasar-dasar Penelitian Pendidikan & Bidang Non-Eksakta
Lainnya. Bandung : Tarsito. [7]. Rusman, Kurniawan, D., Riyana, C. (2012). Pembelajaran Berbasis Teknologi
Informasi dan Komunikasi: Mengembangkan profesionalitas Guru. Jakarta: Rajawali Pers.
[8]. Suryadi, D. (2010). Metapedadidaktik dan Didactical Design Research (DDR):
Sintesis Hasil Pemikiran Berdasarkan Lesson Study. Teori Paradigma, Prinsip, dan Pendekatan Pembelajaran MIPA dalam Konteks Indonesia. Bandung: JICA FPMIPA UPI
Bandung, October 17th, 2015
Proceeding International Seminar on
Mathematics, Science, and Computer Science Education
105
M
MATH-07249
Visual Aids in Analytical Geometry Course in Conic Concept
Tia Purniati1,a) and Eyus Sudihartinih2,b)
1,2Departement of Mathematics Education, Indonesia University of Education
Article info Abstract
Keywords: visual aids, conic.
Analytic geometry is a subject that must be contracted by student teachers in the second semester. Analytic Geometry concepts are abstract. One of the concepts studied in Analytic Geometry is conic. Conic is a new concept for students, because in school the concept is not studied. Based on the interview, students have difficulty in understanding of conic concepts. Therefore it is necessary visual aids can help students in understanding conic concepts. Visual aids mathematics is a tool whose is used integrated with the objectives and learning content that can facilitate the delivery of mathematical concepts. Using of visual aids on conic concepts are expected to concretize the concepts through demonstration, understanding easily, creating an atmosphere conducive learning, and improve student learning motivation.
Corresponding Author: a)[email protected] b)[email protected]
INTRODUCTION
Geometry is one of the material that presented in schools began elementary school level to high school level. In geometry discussed things related to plane and space. Ansyar says that geometry needs to be studied in schools because of the geometry includes exercises to think logically, systematically, growing up creativity, and can develop innovate ability7. In addition, Bobango says that the purpose of studying the geometry is for students have self-confidence about their math skills, be good problem solvers, able to communicate, and to mathematical reasoning1.
The role of geometry in mathematics is important. Therefore, a student of Mathematics Education as a student teachers must have a good understanding of the geometry in order to become professional teachers. One of the courses in which to learn the concept of geometry is the subject of Analytical Geometry. This course will contracted by student teachers of mathematics in the second semester with three credits. Conic is one of the concepts studied in Analytical Geometry. Based on the results of students interview is found that they still have difficult to understanding of conic concepts.
Piaget's theory states that the student is in the stage of formal thinking, so that at that stage they have the ability of think abstractly2. But in reality some students still have difficulty in understanding conic concepts. Geometry concepts are abstract, whereas in general the students to think of things that are concrete to the abstract things. Thus, to overcome these difficulties required visual aids that can help understand these concepts 3,5.
Visual aids on conic concepts that already exist are visual aids that shows the intersection of a plane with a cone to obtain a circle, parabola, ellipse, and hyperbola6. However, visual aids are less able to explain the definition of circle, parabola, ellipse, and hyperbola.
The problem in this study is how the visual aids that can be used in analytic geometry course on conic concepts by definition of the circle, parabola, ellipse, and hyperbola.
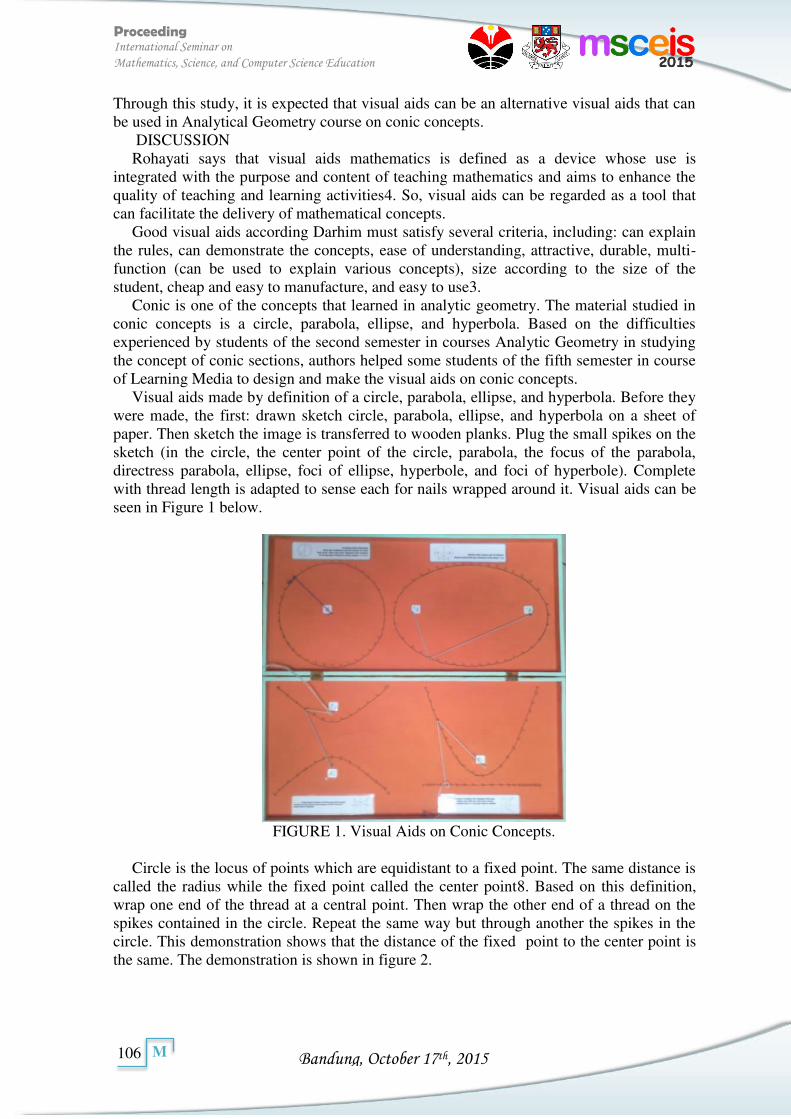
Bandung, October 17th, 2015
Proceeding International Seminar on
Mathematics, Science, and Computer Science Education
106
M
Through this study, it is expected that visual aids can be an alternative visual aids that can be used in Analytical Geometry course on conic concepts.
DISCUSSION Rohayati says that visual aids mathematics is defined as a device whose use is
integrated with the purpose and content of teaching mathematics and aims to enhance the quality of teaching and learning activities4. So, visual aids can be regarded as a tool that can facilitate the delivery of mathematical concepts.
Good visual aids according Darhim must satisfy several criteria, including: can explain the rules, can demonstrate the concepts, ease of understanding, attractive, durable, multi-function (can be used to explain various concepts), size according to the size of the student, cheap and easy to manufacture, and easy to use3.
Conic is one of the concepts that learned in analytic geometry. The material studied in conic concepts is a circle, parabola, ellipse, and hyperbola. Based on the difficulties experienced by students of the second semester in courses Analytic Geometry in studying the concept of conic sections, authors helped some students of the fifth semester in course of Learning Media to design and make the visual aids on conic concepts.
Visual aids made by definition of a circle, parabola, ellipse, and hyperbola. Before they were made, the first: drawn sketch circle, parabola, ellipse, and hyperbola on a sheet of paper. Then sketch the image is transferred to wooden planks. Plug the small spikes on the sketch (in the circle, the center point of the circle, parabola, the focus of the parabola, directress parabola, ellipse, foci of ellipse, hyperbole, and foci of hyperbole). Complete with thread length is adapted to sense each for nails wrapped around it. Visual aids can be seen in Figure 1 below.
FIGURE 1. Visual Aids on Conic Concepts.
Circle is the locus of points which are equidistant to a fixed point. The same distance is
called the radius while the fixed point called the center point8. Based on this definition, wrap one end of the thread at a central point. Then wrap the other end of a thread on the spikes contained in the circle. Repeat the same way but through another the spikes in the circle. This demonstration shows that the distance of the fixed point to the center point is the same. The demonstration is shown in figure 2.
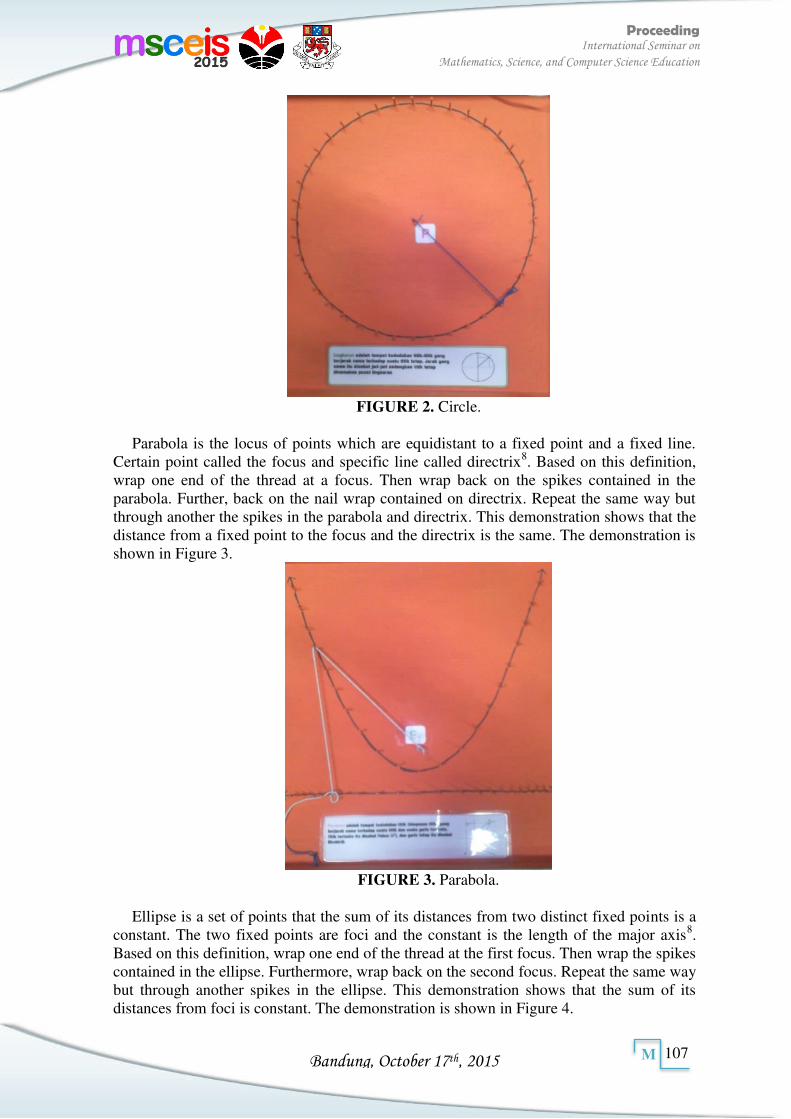
Bandung, October 17th, 2015
Proceeding International Seminar on
Mathematics, Science, and Computer Science Education
107
M
FIGURE 2. Circle.
Parabola is the locus of points which are equidistant to a fixed point and a fixed line.
Certain point called the focus and specific line called directrix8. Based on this definition, wrap one end of the thread at a focus. Then wrap back on the spikes contained in the parabola. Further, back on the nail wrap contained on directrix. Repeat the same way but through another the spikes in the parabola and directrix. This demonstration shows that the distance from a fixed point to the focus and the directrix is the same. The demonstration is shown in Figure 3.
FIGURE 3. Parabola.
Ellipse is a set of points that the sum of its distances from two distinct fixed points is a
constant. The two fixed points are foci and the constant is the length of the major axis8. Based on this definition, wrap one end of the thread at the first focus. Then wrap the spikes contained in the ellipse. Furthermore, wrap back on the second focus. Repeat the same way but through another spikes in the ellipse. This demonstration shows that the sum of its distances from foci is constant. The demonstration is shown in Figure 4.
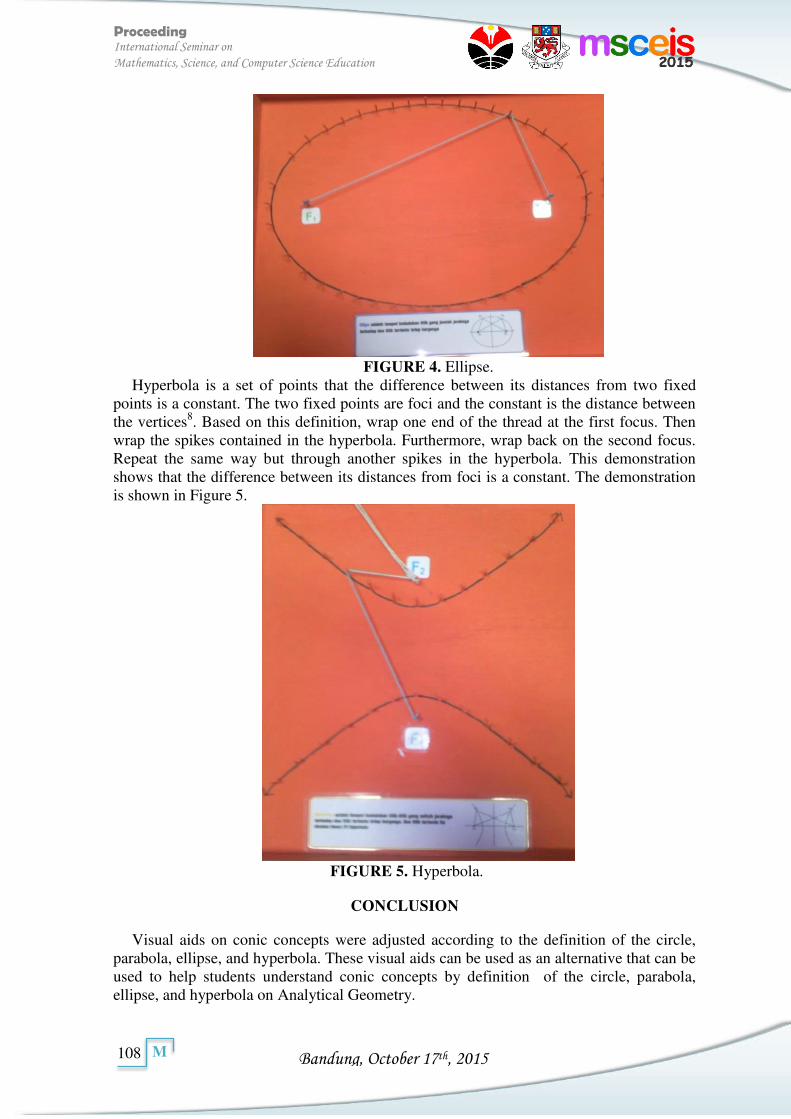
Bandung, October 17th, 2015
Proceeding International Seminar on
Mathematics, Science, and Computer Science Education
108
M
FIGURE 4. Ellipse.
Hyperbola is a set of points that the difference between its distances from two fixed points is a constant. The two fixed points are foci and the constant is the distance between the vertices8. Based on this definition, wrap one end of the thread at the first focus. Then wrap the spikes contained in the hyperbola. Furthermore, wrap back on the second focus. Repeat the same way but through another spikes in the hyperbola. This demonstration shows that the difference between its distances from foci is a constant. The demonstration is shown in Figure 5.
FIGURE 5. Hyperbola.
CONCLUSION
Visual aids on conic concepts were adjusted according to the definition of the circle, parabola, ellipse, and hyperbola. These visual aids can be used as an alternative that can be used to help students understand conic concepts by definition of the circle, parabola, ellipse, and hyperbola on Analytical Geometry.
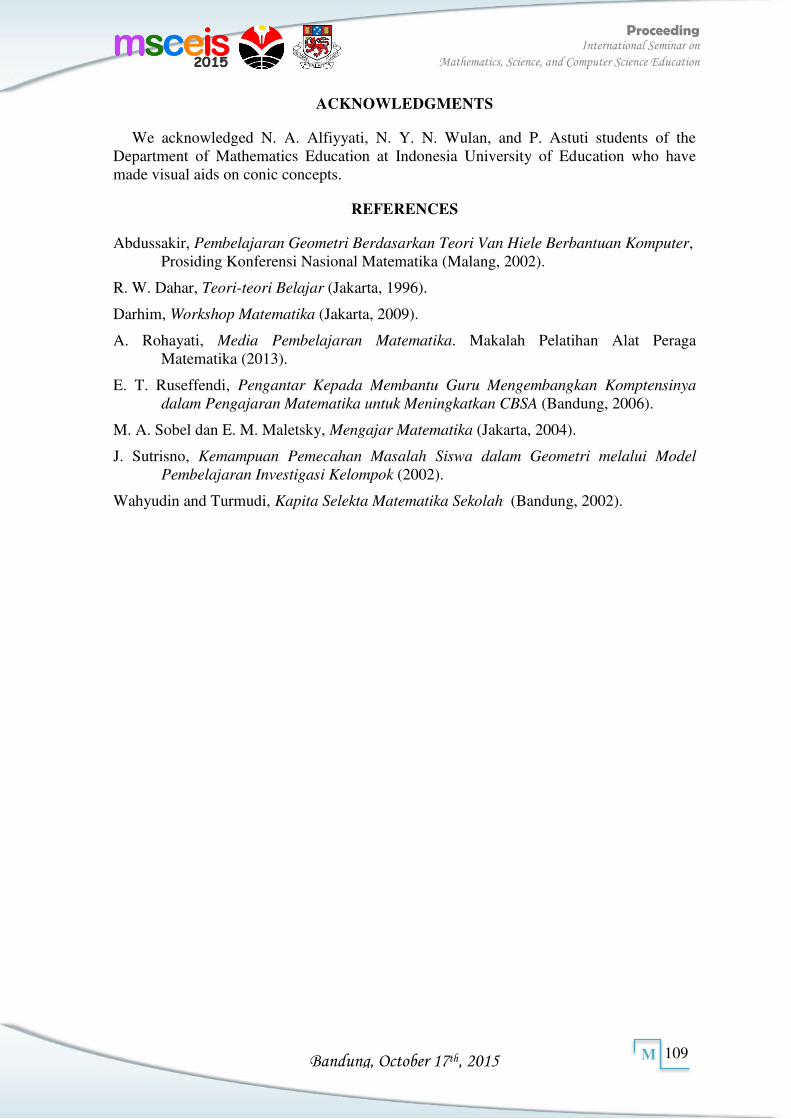
Bandung, October 17th, 2015
Proceeding International Seminar on
Mathematics, Science, and Computer Science Education
109
M
ACKNOWLEDGMENTS
We acknowledged N. A. Alfiyyati, N. Y. N. Wulan, and P. Astuti students of the Department of Mathematics Education at Indonesia University of Education who have made visual aids on conic concepts.
REFERENCES
Abdussakir, Pembelajaran Geometri Berdasarkan Teori Van Hiele Berbantuan Komputer, Prosiding Konferensi Nasional Matematika (Malang, 2002).
R. W. Dahar, Teori-teori Belajar (Jakarta, 1996).
Darhim, Workshop Matematika (Jakarta, 2009).
A. Rohayati, Media Pembelajaran Matematika. Makalah Pelatihan Alat Peraga Matematika (2013).
E. T. Ruseffendi, Pengantar Kepada Membantu Guru Mengembangkan Komptensinya
dalam Pengajaran Matematika untuk Meningkatkan CBSA (Bandung, 2006).
M. A. Sobel dan E. M. Maletsky, Mengajar Matematika (Jakarta, 2004).
J. Sutrisno, Kemampuan Pemecahan Masalah Siswa dalam Geometri melalui Model
Pembelajaran Investigasi Kelompok (2002).
Wahyudin and Turmudi, Kapita Selekta Matematika Sekolah (Bandung, 2002).
Bandung, October 17th, 2015
Proceeding International Seminar on
Mathematics, Science, and Computer Science Education
110
M
MATH-07265
Learning Effectiveness of MEAs Learning Integrated with NCV Mathematical to the Ability of Mathematical Representation
and Self-Efficacy
Achmad Fauzan1,Amin Sutiyno2, Iwan Junaedi3
1Mathematics Department, Bandung Institue of Technology, Jl. Ganesha no. 10, Bandung 40132, Indonesia 2,3Mathematics Department, Semarang State University, Kel. Sekaran Kec. Gunung Pati, Semarang 50229,
Indonesia.
Article info
Abstract
Keywords:
According to National Council of Teachers Mathematics (NTCM) [1], mathematical representation is a skill in the process of mathematics learning that should possessed by the students. In addition, the increase of confidence (self-efficacy) in mathematics learning is required. Furthermore, the students need self motivation in the process of mathematic learning to acknowledge their own abilities that combine the obtained information to achieve maximum and intact learning in mathematics. The purposes of this research were (1) to investigate the ability of MEAs integrated with National Character Value (NCV) learning model to reach a passing grade (KKM) either individually or classically, (2) to compare mathematical representation and self-efficiency ability of the students who study with MEAs integrated with NCV learning model and expository models. The method in this experiment was the quasi experiment. The population of this experiment was 2012/2013 X class of SMA Islam Sudirman Ambarawa School. The results were: (1) the mathematical representation ability test showed that 24 of 26 students (92.31%) fulfill the required KKM, (2) the average mathematical representation of the experimental class (81.31) was better than the average of control class (62.1) and average self-efficacy ability of experiment class (96.92) was better than the average of control class (61.76). The conclusion of this research were: (1) MEAs integrated with NCV learning model achieved KKM, both individually and classically; (2) the mathematical representation and self-efficacy ability of students who study with MEAs model integrated with NCV was better than who study with expository conventional learning.
Corresponding Author: Achmad Fauzan
INTRODUCTION
National Council of Teachers Mathematics[1] establishes that there are five skills that the students should have through the standard learning mathematics process which is included in: (1) problem solving; (2) reasoning and proof; (3) communication; (4) connection; and (5) representation. Every aspect of the high-level mathematical thinking has a very broad scope. Thus, in order to limit the scope, this study will only measure a mathematical representation skill of students. Representation skill not only shows the level of understanding, but also forms the problem solving skill for doing the mathematic tasks. Yuniawatika [2] stated that mathematics understanding through representation is by encouraging the students to find and make a representation as a means or way of thinking in communicating mathematical ideas from abstract towards the concrete.
Bandung, October 17th, 2015
Proceeding International Seminar on
Mathematics, Science, and Computer Science Education
111
M
Ansari[3] describes the forms of Representation can be visual presentation such as pictures (drawing), graphs / charts, tables, and mathematical expressions. One of the ways to improve the Representation Skill is by enhancing the students' self-assessment or self-efficacy. Self-efficacy is related to a process of which a person assesses his/her own ability in completing certain task. Self-efficacy of a person will influence his/her actions, effort, perseverance, flexibility, and realization of the objectives. Therefore, self-efficacy which is related to one’s ability, often determines the outcome before the action happens. The measurement of self-efficacy has three dimensions, namely Magnitude, Strength, and Generality. For further information please see Bandura[4].
The increase of self-assessment will be more easily developed if there is an interaction or communication between a student and one another. Besides looking at the students' knowledge, it is important also to look at the students’ character. According to that, it is beneficial to use Model eliciting Activities (MEAs). Hamilton[5] stated that MEAs is "a problem that simulates real-world situations that small teams of 3-5 students work to solve over one or two class periods. The crucial problem-solving iteration of an MEAs is to express, test and revise models that will solve the problem.Then, based on the theory explained above, a study was conducted, entitled "Effectiveness of Integrating MEAs Learning with National Character Value (NCV) toward the Representation of Mathematical Ability and Self-Efficacy in X class".
RESEARCH METHODS
The research uses quasi-experimental based on Russeffendi [6] with an experimental class, a controlling class, and a class for testing research instruments. The types of quasi experiment used are pretest and posttest. The material used in this study is the distance of the three dimensions
TABLE 1. EXPERIMENTAL DESIGN RESEARCH
First Condition Class Treatment Final Condition
Pretest Experimental Class MEAs with NCV Test of Representation Skill and
self-efficacy Pretest controlling class Conventional
The population in this study is all students of class X of Senior High Scholl (SMA)
Islam Sudirman Ambarawa academic year 2012/2013 which was in the second semester. The samples were selected to be the objects of this study are the students of class X-2 (26 students) as an experimental class and class X-1 (26 students) as a controlling class, and class XI IPA 1 (30 students) as a class to experiment the test. According to Chamberlin[7] MEAs is applied as follows. 1. The teacher reads an article that builds up the students’ understanding. 2. Students must be aware with the questions emerge from the article. 3. The teacher reads a statement of the problem and make sure each group understands the
problems. 4. Students try to solve those problems. 5. Students present their mathematical model after discussing and reviewing solutions. Scoring based on the Holistic Scoring Rubrics by Hutagaol[8]. Bandura[4] states the making of statement of self-efficacy scales follows. 1. The scale of self-efficacy is unipolar, ranging from 0 to maximum confidence. 2. The Item scale of self-efficacy is items which correspond to a statement area or specific tasks of the respondents. 3. Likert scale response format generally uses five statements.
Bandung, October 17th, 2015
Proceeding International Seminar on
Mathematics, Science, and Computer Science Education
112
M
Response format self-efficacy scale used is 10-point scale Data analysis was conducted to answer the research question about student’s self-
efficacy. The description of the position and self-efficacy of students either totally or dimensions obtained by grouping the data using ideal criteria calculation is based on ideal mean and standard deviation of the ideal by Sudrajat[9] as follows. + .
Description: = The maximum score that may be obtained by students. = The ideal mean = ��om . =The Ideal Standard Deviation = ��om .
Z = raw scores. Based on this formula, the categories discovered are presented in Table 4 below.
TABEL 2. KATEGORI SELF-EFFICACY
No Scores Category
1 > + , Very High (VH) 2 + , < + , High (H) 3 − , < + , Medium (M) 4 − , < + , Low ( L ) 5 − , Very Low (VL)
RESULTS AND DISCUSSION
RESULTS
Hypothesis I (Test Criteria for completeness) a. Test of Master I dividual Average of Class E peri e t Test average μ
The hypothesis being tested is as follows. ∶ . , meaning that the average of the students’ mathematical representation skill has not reached a complete learn individual at 70 yet. ∶ > , , meaning that the average of the students’ mathematical representation skill has reached complete learn individual at 70.
Accept if ,where , = −� − obtained from t distribution with significance level of 5%. From the results of the calculation, obtained
= 2.58 and = , = , . Because = . >. = ,then accepted. b. Test of Mastery Learning Classical Class Experiment (Test Proportion)
The hypothesis is being tested as follows. : , meaning that the percentage of students in the experimental class scored ≥70 not reached 75% yet (not yet reached complete learn classical). : > , , meaning that the percentage of students in the experimental class scored ≥70 already reached 75% or more (has reached complete learn classical).
Reject H0 if , −∝ wh��� , −∝ = 1,64. The proportion of one-party test results obtained experimental class = 2.08. Because = 2.08> 1.64 = , −∝ then H0 is rejected.
Hypothesis II (Test Similarity Two average)
The hypothesis is being tested as follows. : : average ability MEAs learning mathematical representation is less than or equal to the average ability of the mathematical representation of students at controlling class. : > : average ability MEAs learning mathematical representation of more than the average ability students' mathematical representation of the controlling class.
Bandung, October 17th, 2015
Proceeding International Seminar on
Mathematics, Science, and Computer Science Education
113
M
Accept H0 if < . From the calculation results obtained = 3.56 and = , = 2.009. The results of the Similarity Test analysis of two averages (right hand testr) based on the similarity of the two test calculations on average (right-hand test) is , = 3.56> 2.009 = then is rejected.
The data of self-efficacy through a questionnaire given at the end of the treatment in the second class of students in both experimental class and controlling class. Once the data of the students’ self-efficacy in both classes gathered, the data was calculated and collected using ideal criteria calculation that based on ideal mean and standard deviation.
Table 3. Results of Self-Efficacy Questions
Class
Many Students
The Ideal Score
Self Efficacy � � Category � �� Category � Category
Experiment 26 210 32 Very Low (VL) 179 High (H) 96,92 Medium (M) Control 26 210 13 Very Low (VL) 137 High (H) 61,76 Low ( L)
Then we compare between self-efficacy from conventional and MEAs learning.
Because the Data is Ordinal data then used a nonparametric test Mann-Whitney test and SPSS.
: self-efficacy conventional learning students better than students learning MEAs. : self-efficacy of students teaching stdents MEAs better than conventional learning.
Reject if ≥ . Retrieved value = 3.67, while = 2.009. So, we reject
Table 4. Results Of The Scale Of Self-Efficacy Dimension
Dimension Class The Ideal
Score Self Efficacy � � Category � �� Category � Category
Magnitude/
level Experiment 90 10 Very Low (VL) 79 Very High (VH) 39,88 Medium (M) Control 90 6 Very Low (VL) 61 High (H) 25,42 Low (L)
Strength Experiment 60 13 Low (L) 47 High (H) 28,38 Medium (M) Control 60 6 Very Low (VL) 35 Medium (M) 18,5 Low (L)
Generally Experiment 60 4 Very Low (VL) 54 Very High (VH) 28,65 Medium (M) Control 60 6 Very Low (VL) 35 Medium (M) 18,5 Low (L)
DISCUSSION
In the beginning, students were not familiar with the form of mathematical models. They are used to working on the problems with clear procedures and contains clear elements of which are already known and asked. They were not accustomed yet to communicate the things that actually exist in their minds. In addition, they also have difficulty in conducting presentations and representing their ideas. However, by giving questions to the students, they started to explore ideas and concepts that exist in their mind to understand and solve problems before they present their work. Thus, the learning process will run gradually to be better.
At the stage of MEAs was given to students and teachers giving questions. The purpose of giving questions was to ensure that students had a basic knowledge they need to solve the problems. At this stage, students showed the diversity of mindset and they had better understanding about the problems given to them. They also learned from the mistakes that they did in the previous lesson and begin to show their creativity. The students’ creativity shown by the various interpretations emerged towards a given issue. Furthermore, students were suggested to solve the problems given in class. While the students were studying in the classroom, the researchers observed, supervised the students’ activities and provided guidance when the students ask questions. Then the selected students were asked to present their work. In the presentation session, the teacher acted as
Bandung, October 17th, 2015
Proceeding International Seminar on
Mathematics, Science, and Computer Science Education
114
M
a facilitator, motivator and moderator. Furthermore, after the completion of this activity, the teacher gave an evaluation of the entire work of the students. Students were directed to conclude the things they had learned in the learning process. In the closing activity, students were given exercises and home assignments. Mathematical Representation Ability and Self Efficacy
Based on the final analysis of the research data, it was known that the analysis results of the Model-Eliciting Activities (MEAs) learning supports the hypothesis which stated that the mathematical representation ability of the students given MEAs were better than students who received teaching expository models. After MEAs learning was given in experiments class, students obtained post-test scores about mathematical representation ability of students in both classes. The mean of post-test score of mathematical representation ability of the experiment class students was 81.31, or approximately 114.28% of the balance score with the highest score of 95, the lowest score of 58 and a standard deviation of 8.72. Meanwhile, the students’ average scores in the control class was 62.15, or approximately 88.7% of the ideally balanced with a highest score of 92, the lowest score of 48, and a standard deviation of 12.85. Based on the standard deviation, it was known that the post-test score of both classes showed that the control class students were more flock on the average compared to a score of post-test of experimental class students.
Visual Representations of the experiment class increase by 14 students or 53,84% of class experiment students answered correctly compared to the control class students which only had 5 students or 19,23% answered correctly. Based on the equality test of two means, there was difference between two means, then by using the right parties test, it was proven that H was rejected or receiving H which defined that the visual representation of the experimental class was better than a visual representation of the control class. By testing the one party, obtained � l l i = 2.63 and t table � , = , . So � l l i >� le. Because t was in the rejection area of H , it can be concluded that the experimental class Visual representation was better than the control class.
The increase of equation representation or words score was not significantly different. Although the number of students who complete the equation representations or words in the experimental class are more than control class that were 12 or 46.15%, while the control class were only 5 or 19.23%, as shown in the following diagram. However, by test the two parties, the value obtained were � l l i = 1,032 and � le� , = , . So � l l i <� le. consequently we accepted H and it can be said that there was no difference representations of mathematical equations between Experiment class and Control class.
Text representation shows that there were five (5) students or 19.23% answer correctly compared to the experimental class students control classes that only one (1) student or about 3.8% of students who answered correctly.
The research result showed the tendency of self-efficacy in experiment class students (acquire learning MEAs) included in the mid category. This meant that the experimental class students had enough confidence in their ability to solve a problem or mathematical representation task successfully. If it was seen in more detailed view in each dimension, it was obtained good three dimensions such as dimensional magnitude / level, strength, and generally which are included in the medium category. This was interpreted as the high level of confidence in the competence to determine the level of problem or tasks difficulties encountered in mathematical representation (magnitude / level), students were quite interested in solving problems of mathematical representation, a sense of optimism to answer questions and had a confident feeling to be able to solve the problems that involves a mathematical representation.
Bandung, October 17th, 2015
Proceeding International Seminar on
Mathematics, Science, and Computer Science Education
115
M
In relation with the sufficient confidence of students to their competence in dealing with problems or difficulties that was arisen as a result of the mathematical representation matter (strength), shows a good effort and demonstrate the high commitment to solve the problems of mathematical representation. Furthermore, based on the confidence of the students’ competence to generalize the questions and previous experience (generality) indicates that the students were able to face the diverse situation and condition flexibly. It also indicates that students may be possible to be able to respond to the situation and the conditions well and positively but they had not been able to make the previous learning experience as the guidelines to achieve success in solving problems of mathematical representation. The results also show that self-efficacy of the control class students had lower category of self-efficacy than the experimental class students in each dimension.
CONCLUSIONS
The students’ ability of the mathematical representation by using Model Eliciting
Activities (MEAs) achieves the completeness criteria. The achievement can be seen from the results of the competence tests of Grade X students’ mathematical representation which shows that students were able to achieve learning mastery criteria ≥70 individually and the number of students who got score ≥70 more than ≥75% from the whole class. Students’ Mathematical Representation Ability and Self-efficacy MEAs learning with NKB integration was better than students who received teaching expository model of the control class.
ACKNOWLEDGMENTS
We acknowledged Semarang State University (Final Project of Undergraduate Mathematics Education).
REFERENCES
[1]. National Council of Teachers of Mathematics. 2000. Principles and Standars for
School Mathematics. Reston VA: The National Council of Teachers of Mathematics Inc.
[2]. Yuniawatika. 2011. Penerapan Pembelajaran Matematika dengan Strategi REACT untuk Meningkatkan Kemampuan Koneksi dan Representasi Matematik Siswa Sekolah Dasar (Studi Kuasi Eksperimen di Kelas V Sekolah Dasar Kota Cimahi). Journal of Indonesian Education University Special 2. (online) in:http://webcache.googleusercontent.com/search?q=cache:_8lKAGa8MLoJ:jurnal.upi.edu/file/12-Yuniawatika EDIT. pdf+ &cd= 1&hl= id&ct=clnk&client=firefox-. Downloaded on August 1, 2013.
[3]. Ansari, B.I. (2003). Menumbuhkembangkan Kemampuan Pemahaman dan
Komunikasi Matematis Siswa SMU Melalui Strategi Think-Talk-Write. Dissertation. UPI: Unpublished.
[4]. Bandura, A. 1997. Self-Efficacy The Exercise of Control. New York: W. H. Freeman and Company.
[5]. Hamilton, et. al. 2008. Model Eliciting Activities (MEAs) as a Bridge Between
Engineering Education Research and Mathematics Education Research. Journal of Advances inn Engineering Education. Pepperdine University.
[6]. Rusefendi. (2001). Dasar-dasar Penelitian Pendidikan dan Bidang non-Eksakta Lainnya. Semarang: IKIP Semarang Press.
Bandung, October 17th, 2015
Proceeding International Seminar on
Mathematics, Science, and Computer Science Education
116
M
[7]. Chamberlin, S. A. , Moon, S. M. (2005). Model Eliciting Activities as Tool to Develop
and Identivy Creatively Gifted Mathematicians. Journal of Secondary Gifted Education, Vol. XVII, No. 1 (pp. 37-47). [Online]. Avaliable: http:// www. eric. ed. gov/ ERICWebPortal/ Custom/ portlets/ recordDetails/ detailmini.jsp? _nfpb=true&_&ERICExtSearch_Search Value_0= EJ746044&ERICExtSearchType_0= no&accno= EJ746044.
[8]. Hutagaol, K. (2007). Pembelajaran Matematika Kontekstual untuk Meningkatkan Kemampuan Representasi Matematis Siswa Sekolah Menengah Pertama. Thesis. UPI: Unpublished.
[9]. Sudrajat, D. (2008). Program Pengembangan Self-Efficacy Bagi Konselor di SMA Negeri Se-Kota Bandung. Thesis. UPI: Unpublished.
Bandung, October 17th, 2015
Proceeding International Seminar on
Mathematics, Science, and Computer Science Education
117
M
MATH-07268
An Analysis of Number Sense of Madrasah Aliyah Students
Dadang Juandi1, Eyus Sudihartinih1, Ririn Sispiyati1
1Departemen Pendidikan Matematika, Universitas Pendidikan Indonesia, Jl. Dr. Setiabudi no 229, Bandung 40154, Indonesia
Article info Abstract
Keywords: Number Sense, Madrasah Aliyah.
The purpose of this research was to assess students understanding of number sense in madrasah aliyah as same level with senior high school in Bandung city. The subject for this study was 19 students. The design for this study was quantitative and all students were given a 50-item paper and pencil test on number sense. The result from this study indicate 50% students able to understanding and use of the meaning and size of numbers, 62,3% students able to understanding and use of equivalent forms and representations of numbers, 60,4% students able to understanding the meaning and effect of operations, 54,4% students able to understanding and use of equivalent expressions, and 73,3% students able to computing and counting strategies.
Corresponding Author: Dadang Juandi [email protected]
INTRODUCTION
Number sense is one of the sensitivity stages in mathematics. Number sense is often termed as the taste or sensitivity of numbers. Number sense is an essential capability in doing math process9.
According Burton and Reys1, number sense refers to a person’s general understanding of number and operation along with ability to use this understanding in flexible ways to make mathematical judgments and to develop useful strategies for solving complex problems. Number sense refers to the ability to use numbers and quantitative methods as a means of communicating, processing and interpreting information6. Moreover Ghazali and Zanzali said number sense refers to understanding about numbers and their related mathematical operations and the ability (tendency) to use this understanding to make decisions about mathematically related to situations17.
Number sense ability of students was variants. This is similar with Pilmer which stated that number sense ability of each student is different because of number sense evolved along with students experience and knowledge gained from formal and informal education12. While Van de Walle said different responses will give a lot of information about number sense of students16.
Based on mathematics assessment dimension of NAEP document, number sense belonged to content strands, which implies that almost all mathematical topics always involve numbers11. With number sense ability, students will have mathematical problem solving ability. This is similar with Ekawati4 which states that students who have good number sense will be able to use his understanding to solve mathematical problems that are not limited by traditional algorithms or procedures.
According to the NCTM there are five components form the characteristic of number sense which is number meaning, number relationship, number magnitude, number operation, and number referent8. Those components have been researched at junior high school level and the results inclined not achieved by the students. Based on the research of Acoi and Sabrianti the description of number sense of student grade VII was low11. We have known the importance of number sense in mathematics, therefore it is needed to
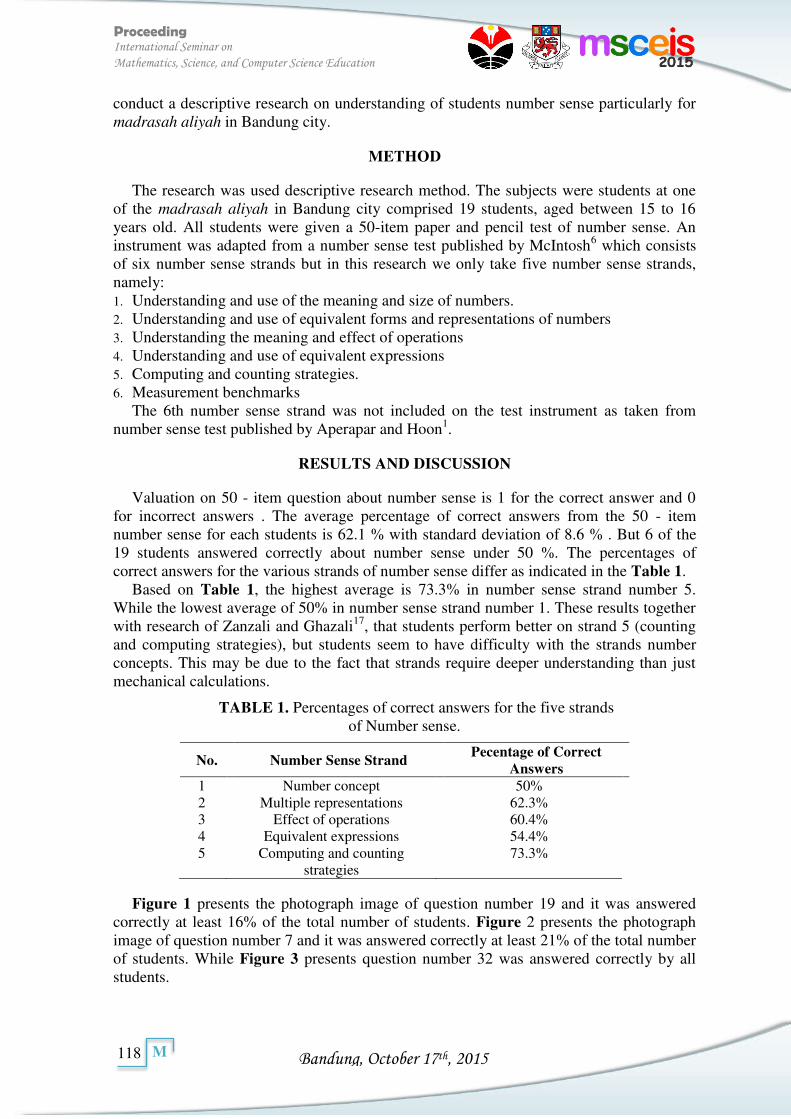
Bandung, October 17th, 2015
Proceeding International Seminar on
Mathematics, Science, and Computer Science Education
118
M
conduct a descriptive research on understanding of students number sense particularly for madrasah aliyah in Bandung city.
METHOD
The research was used descriptive research method. The subjects were students at one of the madrasah aliyah in Bandung city comprised 19 students, aged between 15 to 16 years old. All students were given a 50-item paper and pencil test of number sense. An instrument was adapted from a number sense test published by McIntosh6 which consists of six number sense strands but in this research we only take five number sense strands, namely: 1. Understanding and use of the meaning and size of numbers. 2. Understanding and use of equivalent forms and representations of numbers 3. Understanding the meaning and effect of operations 4. Understanding and use of equivalent expressions 5. Computing and counting strategies. 6. Measurement benchmarks
The 6th number sense strand was not included on the test instrument as taken from number sense test published by Aperapar and Hoon1.
RESULTS AND DISCUSSION
Valuation on 50 - item question about number sense is 1 for the correct answer and 0 for incorrect answers . The average percentage of correct answers from the 50 - item number sense for each students is 62.1 % with standard deviation of 8.6 % . But 6 of the 19 students answered correctly about number sense under 50 %. The percentages of correct answers for the various strands of number sense differ as indicated in the Table 1.
Based on Table 1, the highest average is 73.3% in number sense strand number 5. While the lowest average of 50% in number sense strand number 1. These results together with research of Zanzali and Ghazali17, that students perform better on strand 5 (counting and computing strategies), but students seem to have difficulty with the strands number concepts. This may be due to the fact that strands require deeper understanding than just mechanical calculations.
TABLE 1. Percentages of correct answers for the five strands of Number sense.
No. Number Sense Strand Pecentage of Correct
Answers 1 Number concept 50% 2 Multiple representations 62.3% 3 4 5
Effect of operations Equivalent expressions
Computing and counting strategies
60.4% 54.4% 73.3%
Figure 1 presents the photograph image of question number 19 and it was answered correctly at least 16% of the total number of students. Figure 2 presents the photograph image of question number 7 and it was answered correctly at least 21% of the total number of students. While Figure 3 presents question number 32 was answered correctly by all students.
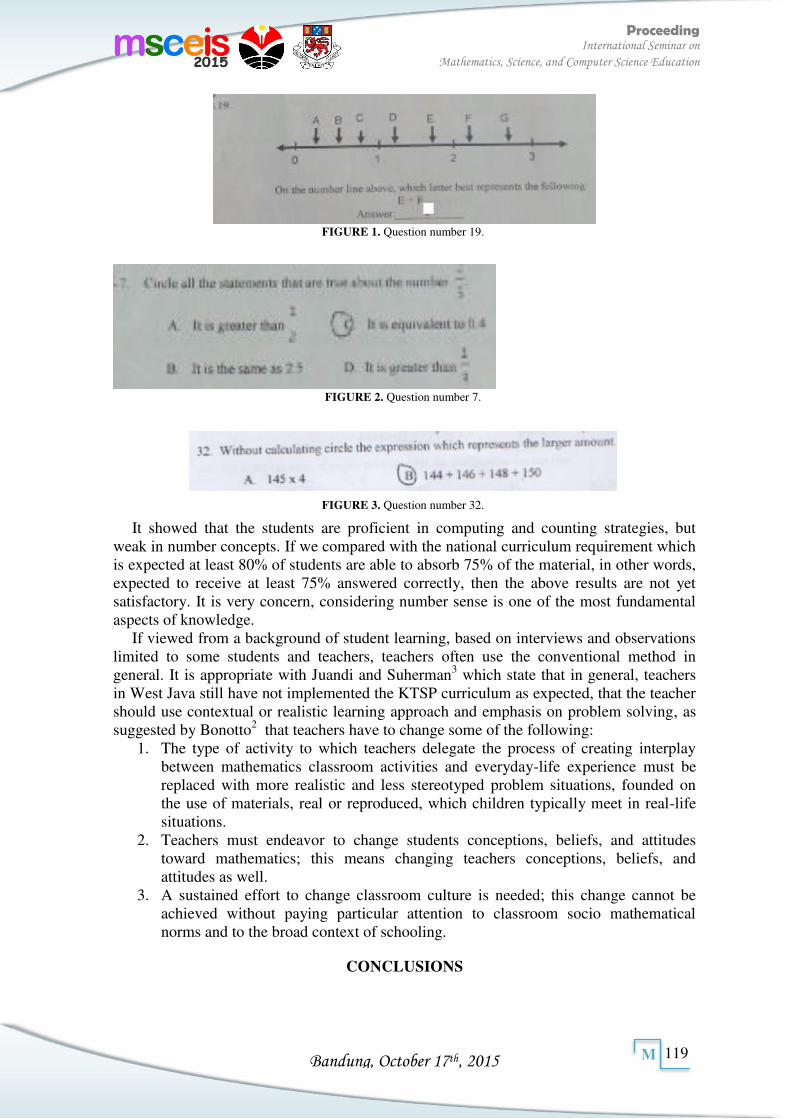
Bandung, October 17th, 2015
Proceeding International Seminar on
Mathematics, Science, and Computer Science Education
119
M
FIGURE 1. Question number 19.
FIGURE 2. Question number 7.
FIGURE 3. Question number 32.
It showed that the students are proficient in computing and counting strategies, but weak in number concepts. If we compared with the national curriculum requirement which is expected at least 80% of students are able to absorb 75% of the material, in other words, expected to receive at least 75% answered correctly, then the above results are not yet satisfactory. It is very concern, considering number sense is one of the most fundamental aspects of knowledge.
If viewed from a background of student learning, based on interviews and observations limited to some students and teachers, teachers often use the conventional method in general. It is appropriate with Juandi and Suherman3 which state that in general, teachers in West Java still have not implemented the KTSP curriculum as expected, that the teacher should use contextual or realistic learning approach and emphasis on problem solving, as suggested by Bonotto2 that teachers have to change some of the following:
1. The type of activity to which teachers delegate the process of creating interplay between mathematics classroom activities and everyday-life experience must be replaced with more realistic and less stereotyped problem situations, founded on the use of materials, real or reproduced, which children typically meet in real-life situations.
2. Teachers must endeavor to change students conceptions, beliefs, and attitudes toward mathematics; this means changing teachers conceptions, beliefs, and attitudes as well.
3. A sustained effort to change classroom culture is needed; this change cannot be achieved without paying particular attention to classroom socio mathematical norms and to the broad context of schooling.
CONCLUSIONS

Bandung, October 17th, 2015
Proceeding International Seminar on
Mathematics, Science, and Computer Science Education
120
M
The result from this study indicate 50% students able to understanding and use of the meaning and size of numbers, 62,3% students able to understanding and use of equivalent forms and representations of numbers, 60,4% students able to understanding the meaning and effect of operations, 54,4% students able to understanding and use of equivalent expressions, and 73,3% students able to computing and counting strategies.
ACKNOWLEDGMENTS
We acknowledged to Parmijit Singh Aperapar.
REFERENCES
[1]. P. S. Aperapar and T. S. Hoon, The Analysis of Number Sense and Mental
Coputation in the Learning of Mathematics, Jurnal Pengajaran MIPA (FPMIPA UPI, Bandung, 2011), pp. 21–27.
[2]. Bonotto, How Informal Out-of-School Mathematics Can Help Students Make Sense
of Formal In-School Mathematics: The Case of Multiplying by Decimal Numbers. Mathematical Thinking and Learning, (2009), pp. 313-344.
[3]. Juandi and E. Suherman, Pembelajaran Guru Matematika di Jawa Barat, Jurnal Sigma Didaktika (Bandung, 2013).
[4]. Ekawati, Profil Kemampuan Number Sense Siswa Kelas VII Sekolah Menengah
Pertama (SMP) dalam Memecahkan Masalah Matematika pada Materi Bilangan
Bulat (2013). [5]. H. Howden, “Teaching number sense,” Arithmetic Teacher ( 1989), pp. 6-11. [6]. A.McIntosh, J. Bana, and B. FarreII, Assessing Number Sense: Collaborative
Initiatives in Australia, United States, Sweden and Taiwan (1997). [7]. AMcIntosh, Teaching mental algorithms constructively. In L. J. Morrow & M. J.
Kenney (Eds.), The teaching and learning of algorithms in school mathematics, (1998), pp. 44–48
[8]. NCTM, Curriculum and Evaluation Standards for School Mathematics, (1989). [9]. NCTM, Principles and Standards for School Mathematics, (2000). [10]. S. D. Nickerson and I. Whitacre, A Local Instruction Theory for the Development
of Number Sense Mathematical Thinking and Learning (2010), pp. 227-252. [11]. Nurmaulisihitni, D. Sugiatno, Number Sense Bentukan Siswa Dalam
Menyelesaikan Soal Operasi Hitung Bilangan Bulat di MTs, (nd). Artikel Online. Tersedia:http://download.portalgaruda.org/article.php (15 Juli 2015)
[12]. D. Pilmer, Number Sense. Nova Scotia School for Adult Learning. Department of
Labour and Workforce Development (2008). [13]. R. E. Reys and D. C. Yang, Relationship between computational performance and
number sense among sixth and eighth-grade students in Taiwan (1998). Journal for
Research in Mathematics Education 29, pp. 225–237. [14]. R. E Reys, B. J. Reys, N. Nohda, and H. Emori, Mental computation performance
and strategies used by Japanese students in Grades 2, 4, 6, and 8 (1995). Journal
for Research in Mathematics Education 26, pp. 304–326. [15]. J. Sowder, Estimation and number sense. In D. A. Grouws (Ed.), Handbook of
research in mathematics teaching and learning (Macmillan, New York, 1992), pp. 371–389.
[16]. Van De Walle, et al. (Pearson Education, New York, 2010). Elementary And
Middle School Mathematics Teaching Developmentally, 7th Edition. [17]. N. A. A. Zanzali, M. and Ghazali, Assessment Of School Childrens’ Number Sense
(nd).
Bandung, October 17th, 2015
Proceeding International Seminar on
Mathematics, Science, and Computer Science Education
121
M
MATH-07288
Developing Interactive Teaching Materials Based on Scientific Approach on The Number Concept
Heni Pujiastuti
Jurusan Pendidikan Matematika, Universitas SultanAgeng Tirtayasa Jl. Raya Jakarta KM 4 Serang, Indonesia
Article info Abstract
Keywords:
Curriculum 2013 is one of the Indonesian government efforts to improve the quality of education. To support the implementation of Curriculum 2013 necessary teaching materials in accordance with the characteristics of the students, utilizing computer technology facilities are being developed, and including components of the scientific approach. Therefore, in this research developed teaching materials that fit the demands of Curriculum 2013, namely Interactive Teaching Materials based on Scientific Approach (ITMSA). The research method used is research and development (R&D) which consist of ten steps. Design validation performed by mathematicians expert and mathematics education expert involving lecturers and mathematics teacher. Product testing and utility testing conducted on junior high school students in Serang City, Banten Province, Indonesia. Based on the result of product testing and utility testing is concluded that the ITMSA: (1) received total score from mathematicians expert with a total percentage of 87,5%; (2) received total score from mathematics education expert with a total percentage of 91%; (3) received total score from multimedia expert with a total percentage of 86,8%; (4) received a positive response from students with a total percentage of 92,8%; (5) students mathematical understanding ability who learn using ITMSA better than student who learn without ITMSA. From these results concluded that the interactive teaching material based on scientific approach is considered feasible and can be used in mathematics teaching in schools.
Corresponding Author: Heni Pujiastuti [email protected]
INTRODUCTION
Curriculum change is one of the government's efforts to improve the quality of education. Similarly, the Curriculum 2006 changes to the Curriculum 2013 aimed to improving the quality of education, so as to bulid a generation of people able to compete globally in the future. However, the undeniable changes in the curriculum itself has many consequences, one of which is a lack of understanding of practitioners educators in implementing the new curriculum. In addition to training, to help the implementation of Curriculum 2013 is also necessary to support others in the form of books or other teaching materials that facilitate teachers and students to learn. In this regard, the government has published a companion text books for teachers and students based curriculum in 2013, namely systematics using scientific approach. The scientific approach to learning includes observe (mengamati), to question (menanya), to reason (menalar), to try (mencoba) and make a networking (membentuk jejaring)1. Through this approach the expected learning becomes more meaningful for students and students become active. Of course in practice it takes a textbook or other instructional materials types that can guide teachers and students in learning, so that learning is more focused. However, the presence of a companion text books that exist today it is still not enough. In addition, government-published book is still in text book type, so it has not been able to facilitate students to learn through the use of
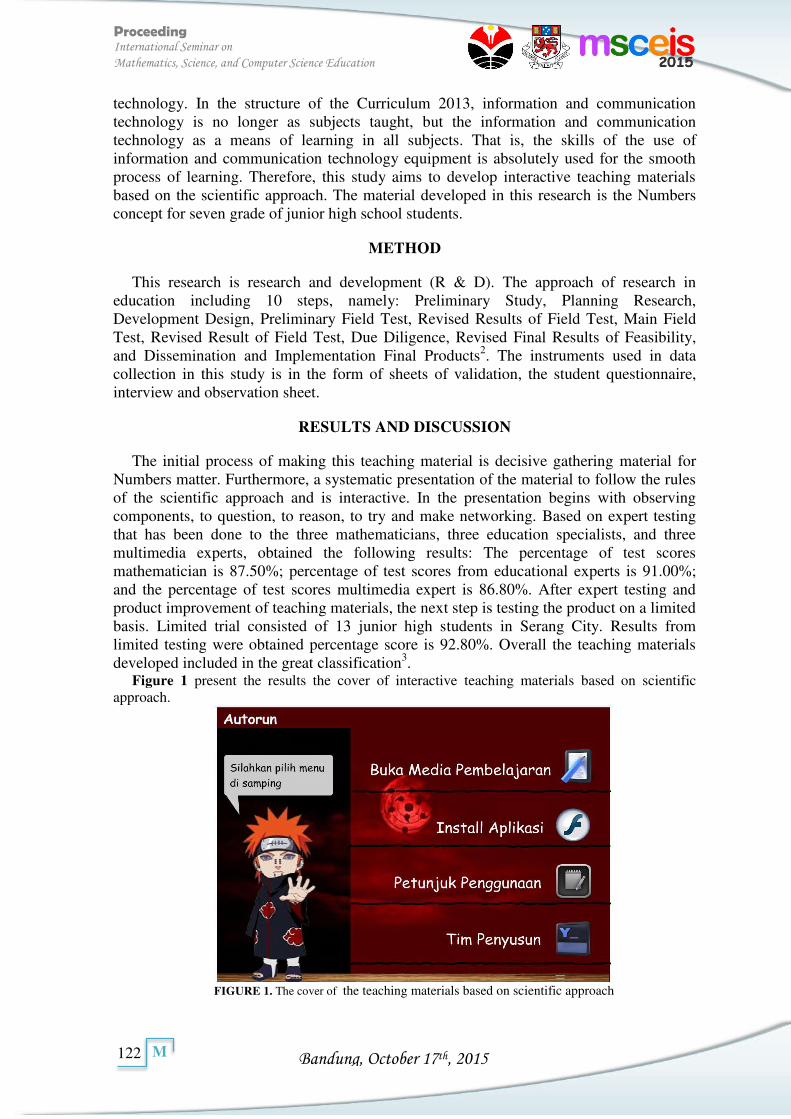
Bandung, October 17th, 2015
Proceeding International Seminar on
Mathematics, Science, and Computer Science Education
122
M
technology. In the structure of the Curriculum 2013, information and communication technology is no longer as subjects taught, but the information and communication technology as a means of learning in all subjects. That is, the skills of the use of information and communication technology equipment is absolutely used for the smooth process of learning. Therefore, this study aims to develop interactive teaching materials based on the scientific approach. The material developed in this research is the Numbers concept for seven grade of junior high school students.
METHOD
This research is research and development (R & D). The approach of research in education including 10 steps, namely: Preliminary Study, Planning Research, Development Design, Preliminary Field Test, Revised Results of Field Test, Main Field Test, Revised Result of Field Test, Due Diligence, Revised Final Results of Feasibility, and Dissemination and Implementation Final Products2. The instruments used in data collection in this study is in the form of sheets of validation, the student questionnaire, interview and observation sheet.
RESULTS AND DISCUSSION
The initial process of making this teaching material is decisive gathering material for Numbers matter. Furthermore, a systematic presentation of the material to follow the rules of the scientific approach and is interactive. In the presentation begins with observing components, to question, to reason, to try and make networking. Based on expert testing that has been done to the three mathematicians, three education specialists, and three multimedia experts, obtained the following results: The percentage of test scores mathematician is 87.50%; percentage of test scores from educational experts is 91.00%; and the percentage of test scores multimedia expert is 86.80%. After expert testing and product improvement of teaching materials, the next step is testing the product on a limited basis. Limited trial consisted of 13 junior high students in Serang City. Results from limited testing were obtained percentage score is 92.80%. Overall the teaching materials developed included in the great classification3.
Figure 1 present the results the cover of interactive teaching materials based on scientific approach.
FIGURE 1. The cover of the teaching materials based on scientific approach
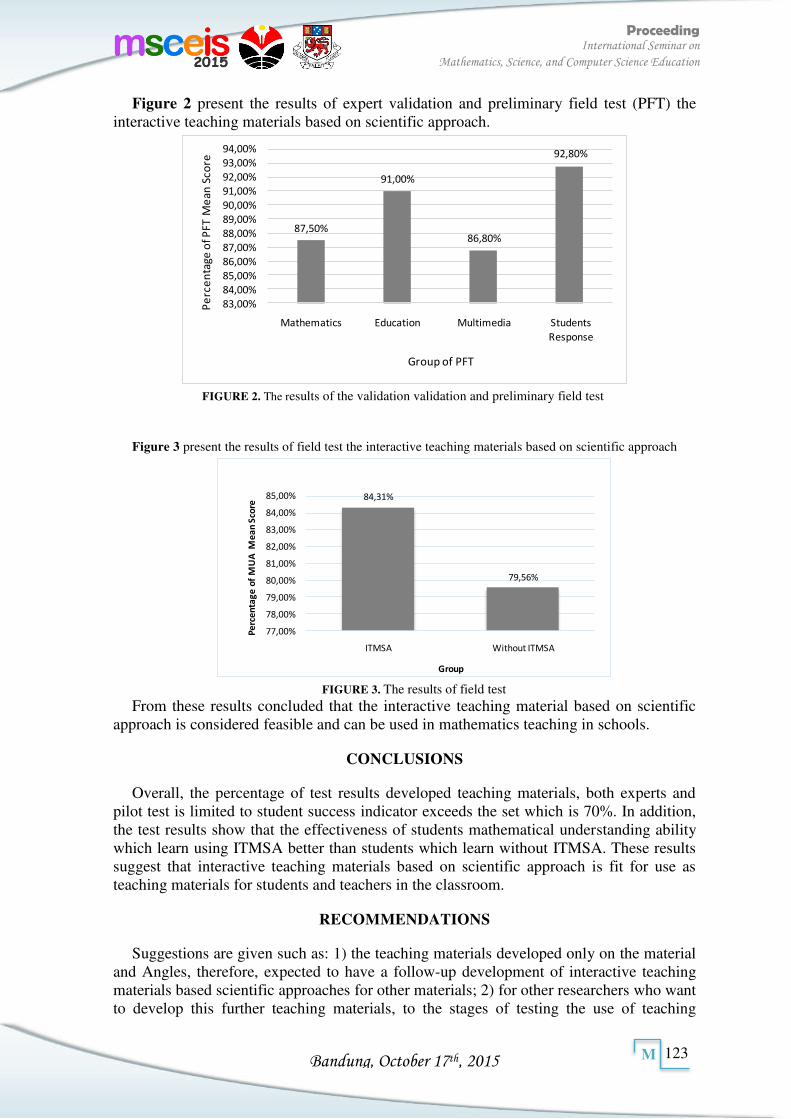
Bandung, October 17th, 2015
Proceeding International Seminar on
Mathematics, Science, and Computer Science Education
123
M
Figure 2 present the results of expert validation and preliminary field test (PFT) the interactive teaching materials based on scientific approach.
87,50%
91,00%
86,80%
92,80%
83,00%
84,00%
85,00%
86,00%
87,00%
88,00%
89,00%
90,00%
91,00%
92,00%
93,00%
94,00%
Mathematics Education Multimedia Students
Response
Pe
rce
nta
ge
of
PF
T M
ea
n S
co
re
Group of PFT
FIGURE 2. The results of the validation validation and preliminary field test
Figure 3 present the results of field test the interactive teaching materials based on scientific approach
84,31%
79,56%
77,00%
78,00%
79,00%
80,00%
81,00%
82,00%
83,00%
84,00%
85,00%
ITMSA Without ITMSA
Pe
rce
nta
ge
of
MU
A M
ea
n S
core
Group
FIGURE 3. The results of field test
From these results concluded that the interactive teaching material based on scientific approach is considered feasible and can be used in mathematics teaching in schools.
CONCLUSIONS
Overall, the percentage of test results developed teaching materials, both experts and pilot test is limited to student success indicator exceeds the set which is 70%. In addition, the test results show that the effectiveness of students mathematical understanding ability which learn using ITMSA better than students which learn without ITMSA. These results suggest that interactive teaching materials based on scientific approach is fit for use as teaching materials for students and teachers in the classroom.
RECOMMENDATIONS
Suggestions are given such as: 1) the teaching materials developed only on the material and Angles, therefore, expected to have a follow-up development of interactive teaching materials based scientific approaches for other materials; 2) for other researchers who want to develop this further teaching materials, to the stages of testing the use of teaching

Bandung, October 17th, 2015
Proceeding International Seminar on
Mathematics, Science, and Computer Science Education
124
M
materials is done to students in larger groups, so that can know the effectiveness of the teaching materials to improve students' mathematical abilities; 3) for other researchers who want to develop this further teaching materials in order to better focus on specific mathematical ability, so the goal becomes more focused.
ACKNOWLEDGMENTS
We acknowledged Kementrian Riset, Teknologi dan Pendidikan Tinggi (Grant: Hibah Bersaing), and Lembaga Penelitian dan Pengabdian kepada Masyarakat Universitas Sultan Ageng Tirtayasa.
REFERENCES
[1]. Kemdikbud. Matematika SMP/MTS Kelas VII. Kementrian Pendidikan dan Kebudayaan: Jakarta (2013).
[2]. Borg. W.R. and Gall, M.D. Educational Research: An Introduction. Longman, Inc: London (1987).
[3]. Tim Puslitjaknov. Metode Penelitian Pengembangan. Pusat Penelitian Kebijakan dan Inovasi Pendidikan Badan Penelitian dan Pengembangan Departemen Pendidikan Nasional: Jakarta (2008).
Bandung, October 17th, 2015
Proceeding International Seminar on
Mathematics, Science, and Computer Science Education
125
M
MATH-07299
Comparison of Mathematical Connection Ability between Students who Study under Problem-Based Learning Model and
those of under Guided Discovery Learning Model (A study in 8
th grader Junior High School Student)
Ummi Hasanah1 and Dadan Dasari2
1 Sekolah Pascasarjana, Universitas Pendidikan Indonesia, Indonesia
2 Departemen Pendidikan Matematika, Universitas Pendidikan Indonesia, Indonesia
Article info Abstract
Keywords: mathematical connection ability, problem-based learning, guided discovery.
This paper presents the findings of pretest-posttest quasi experimental study which was conducted on 8th grader students in one of junior high schools in Bandung. The purpose of this study is to examine the difference of the achievement and the enhancement of mathematical connection ability between the students who studied under PBL model and those of under guided discovery learning model. The instrument of this study was mathematical connection ability test. The quantitative data were analyzed by mean difference test: Mann-Whitney test and T-test. The results of this study are: (a) there was difference achievement in mathematical connection ability between the students who studied under PBL model and those of under guided discovery learning model. The significant difference was indicated in the second indicator: using the concepts of mathematics in daily life; (b) there was difference enhancement in mathematical connection ability between the students who studied under PBL model and those of under guided discovery learning model. The n-gain of mathematical connection ability of students who got PBL and guided discovery learning model was medium.
Corresponding Author: Ummi Hasanah* [email protected] Dadan Dasari [email protected]
INTRODUCTION
Mathematical connection ability is one of the expected mathematical abilities of students after participating in the learning of mathematics (NTCM, 2000; BNSP, 2006). Students who have good mathematical connection ability will obtain better performance in mathematics (Fauzi, 2011; Sulistyaningsih, Waluyo, & Kartono, 2012; Mandur, Sandra, and Supatra, 2013). Students are able to (1) connect each mathematical concept he has studied with being studied; (2) connect mathematics with others subject areas; and (3) also connect mathematics with everyday life. Furthermore, by connecting a wide range of ideas or mathematical ideas they received, give them opportunity to develop mathematical understanding optimally (Qohar, 2011; Cheeseman, McDonough, & Ferguson, 2012).
In mathematics learning, the mathematical connection among mathematics concepts will facilitate student’s ability to formulate and examine conjecture or presumption. Then, the new ideas or concepts can be applied to solve others problems in mathematics (Permana&Sumarmo, 2007, p. 117-118). By doing so, the mathematical connection is very important role in the resolution of problem-solving. Glacey (2011) also stated that students who have good mathematical connection ability will become a good thinker and critical.
However, some of the results of the previous studies indicate that the student’s mathematical connection ability is still not achieved encouraging result. Sugiman (2008) conducted a study in 9th grader of junior high school students on Comparison topic. The result of his study revealed that the student’s achievement for the inter connection of
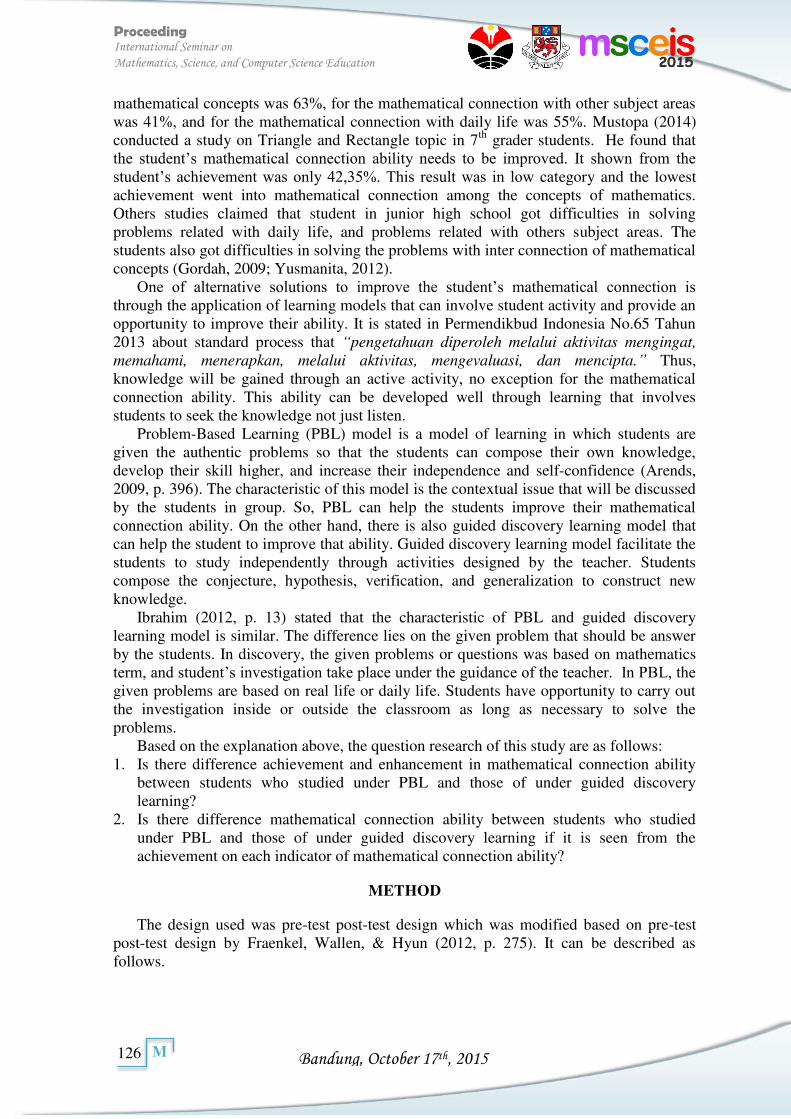
Bandung, October 17th, 2015
Proceeding International Seminar on
Mathematics, Science, and Computer Science Education
126
M
mathematical concepts was 63%, for the mathematical connection with other subject areas was 41%, and for the mathematical connection with daily life was 55%. Mustopa (2014) conducted a study on Triangle and Rectangle topic in 7th grader students. He found that the student’s mathematical connection ability needs to be improved. It shown from the student’s achievement was only 42,35%. This result was in low category and the lowest achievement went into mathematical connection among the concepts of mathematics. Others studies claimed that student in junior high school got difficulties in solving problems related with daily life, and problems related with others subject areas. The students also got difficulties in solving the problems with inter connection of mathematical concepts (Gordah, 2009; Yusmanita, 2012).
One of alternative solutions to improve the student’s mathematical connection is through the application of learning models that can involve student activity and provide an opportunity to improve their ability. It is stated in Permendikbud Indonesia No.65 Tahun 2013 about standard process that “pengetahuan diperoleh melalui aktivitas mengingat,
memahami, menerapkan, melalui aktivitas, mengevaluasi, dan mencipta.” Thus, knowledge will be gained through an active activity, no exception for the mathematical connection ability. This ability can be developed well through learning that involves students to seek the knowledge not just listen.
Problem-Based Learning (PBL) model is a model of learning in which students are given the authentic problems so that the students can compose their own knowledge, develop their skill higher, and increase their independence and self-confidence (Arends, 2009, p. 396). The characteristic of this model is the contextual issue that will be discussed by the students in group. So, PBL can help the students improve their mathematical connection ability. On the other hand, there is also guided discovery learning model that can help the student to improve that ability. Guided discovery learning model facilitate the students to study independently through activities designed by the teacher. Students compose the conjecture, hypothesis, verification, and generalization to construct new knowledge.
Ibrahim (2012, p. 13) stated that the characteristic of PBL and guided discovery learning model is similar. The difference lies on the given problem that should be answer by the students. In discovery, the given problems or questions was based on mathematics term, and student’s investigation take place under the guidance of the teacher. In PBL, the given problems are based on real life or daily life. Students have opportunity to carry out the investigation inside or outside the classroom as long as necessary to solve the problems.
Based on the explanation above, the question research of this study are as follows: 1. Is there difference achievement and enhancement in mathematical connection ability
between students who studied under PBL and those of under guided discovery learning?
2. Is there difference mathematical connection ability between students who studied under PBL and those of under guided discovery learning if it is seen from the achievement on each indicator of mathematical connection ability?
METHOD
The design used was pre-test post-test design which was modified based on pre-test post-test design by Fraenkel, Wallen, & Hyun (2012, p. 275). It can be described as follows.
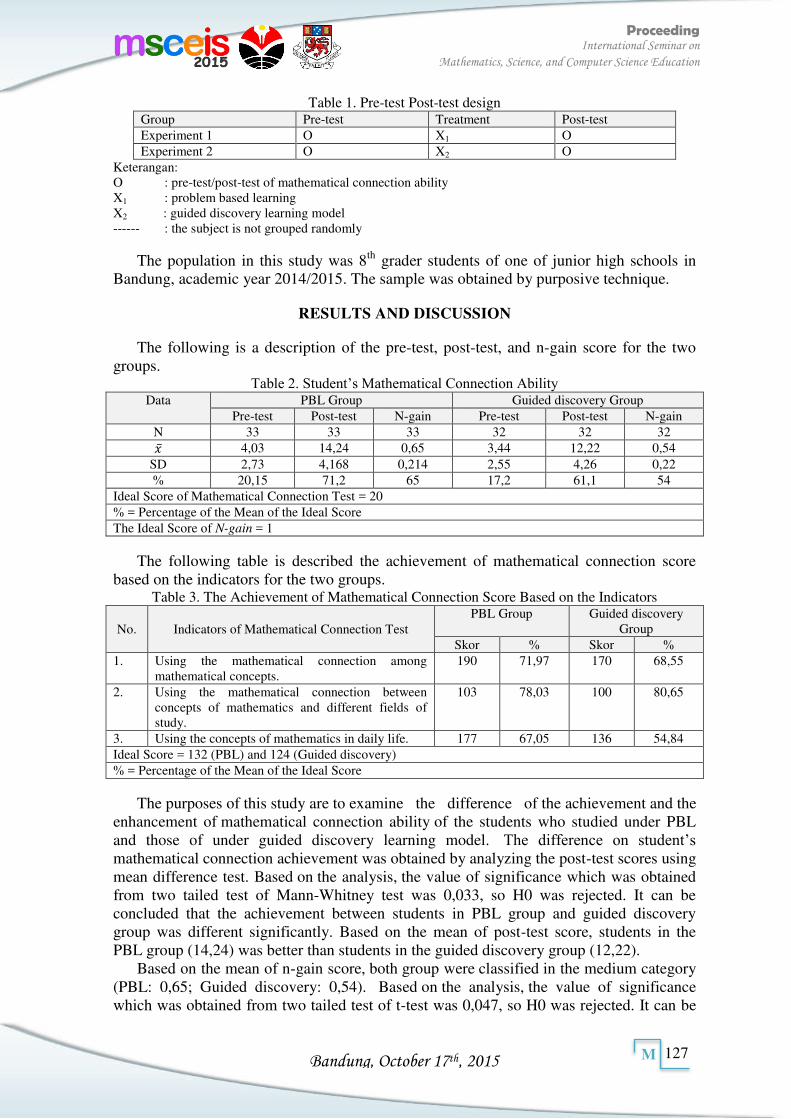
Bandung, October 17th, 2015
Proceeding International Seminar on
Mathematics, Science, and Computer Science Education
127
M
Table 1. Pre-test Post-test design Group Pre-test Treatment Post-test Experiment 1 O X1 O Experiment 2 O X2 O
Keterangan: O : pre-test/post-test of mathematical connection ability X1 : problem based learning X2 : guided discovery learning model ------ : the subject is not grouped randomly
The population in this study was 8th grader students of one of junior high schools in Bandung, academic year 2014/2015. The sample was obtained by purposive technique.
RESULTS AND DISCUSSION
The following is a description of the pre-test, post-test, and n-gain score for the two groups.
Table 2. Student’s Mathematical Connection Ability Data PBL Group Guided discovery Group
Pre-test Post-test N-gain Pre-test Post-test N-gain N 33 33 33 32 32 32 4,03 14,24 0,65 3,44 12,22 0,54
SD 2,73 4,168 0,214 2,55 4,26 0,22 % 20,15 71,2 65 17,2 61,1 54
Ideal Score of Mathematical Connection Test = 20 % = Percentage of the Mean of the Ideal Score The Ideal Score of N-gain = 1
The following table is described the achievement of mathematical connection score based on the indicators for the two groups.
Table 3. The Achievement of Mathematical Connection Score Based on the Indicators
No. Indicators of Mathematical Connection Test PBL Group Guided discovery
Group Skor % Skor %
1. Using the mathematical connection among mathematical concepts.
190 71,97 170 68,55
2. Using the mathematical connection between concepts of mathematics and different fields of study.
103 78,03 100 80,65
3. Using the concepts of mathematics in daily life. 177 67,05 136 54,84 Ideal Score = 132 (PBL) and 124 (Guided discovery) % = Percentage of the Mean of the Ideal Score
The purposes of this study are to examine the difference of the achievement and the enhancement of mathematical connection ability of the students who studied under PBL and those of under guided discovery learning model. The difference on student’s mathematical connection achievement was obtained by analyzing the post-test scores using mean difference test. Based on the analysis, the value of significance which was obtained from two tailed test of Mann-Whitney test was 0,033, so H0 was rejected. It can be concluded that the achievement between students in PBL group and guided discovery group was different significantly. Based on the mean of post-test score, students in the PBL group (14,24) was better than students in the guided discovery group (12,22).
Based on the mean of n-gain score, both group were classified in the medium category (PBL: 0,65; Guided discovery: 0,54). Based on the analysis, the value of significance which was obtained from two tailed test of t-test was 0,047, so H0 was rejected. It can be
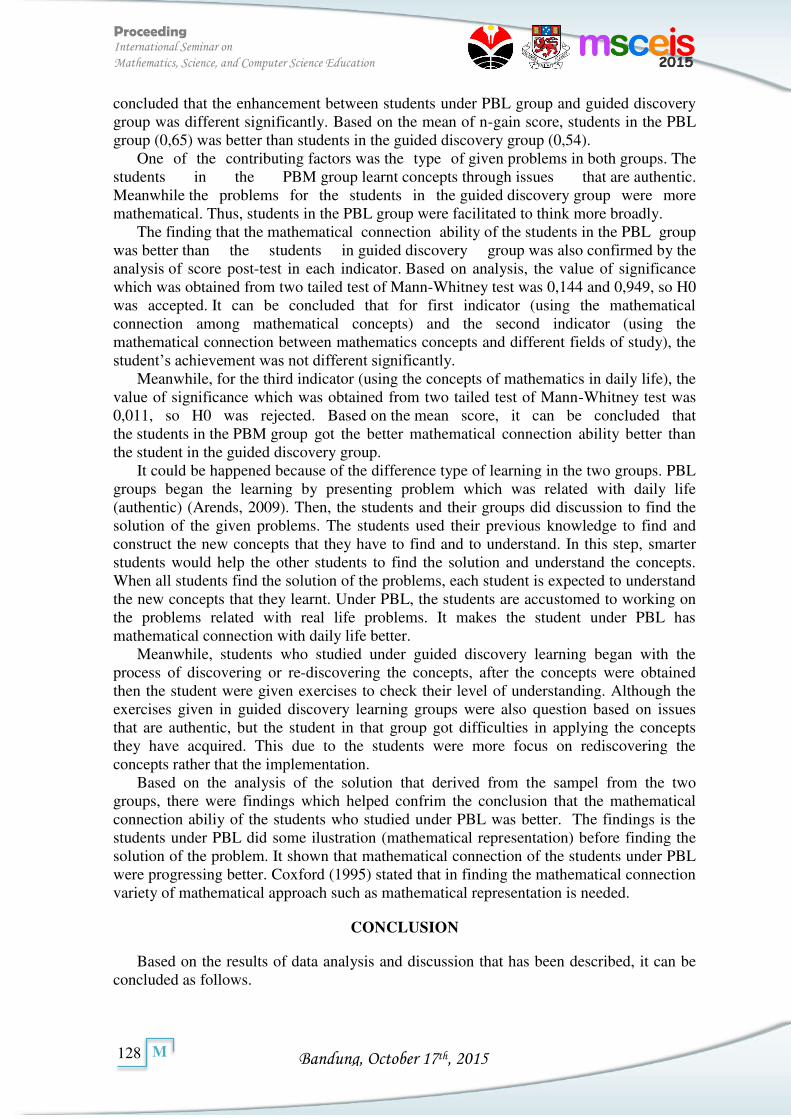
Bandung, October 17th, 2015
Proceeding International Seminar on
Mathematics, Science, and Computer Science Education
128
M
concluded that the enhancement between students under PBL group and guided discovery group was different significantly. Based on the mean of n-gain score, students in the PBL group (0,65) was better than students in the guided discovery group (0,54).
One of the contributing factors was the type of given problems in both groups. The students in the PBM group learnt concepts through issues that are authentic. Meanwhile the problems for the students in the guided discovery group were more mathematical. Thus, students in the PBL group were facilitated to think more broadly.
The finding that the mathematical connection ability of the students in the PBL group was better than the students in guided discovery group was also confirmed by the analysis of score post-test in each indicator. Based on analysis, the value of significance which was obtained from two tailed test of Mann-Whitney test was 0,144 and 0,949, so H0 was accepted. It can be concluded that for first indicator (using the mathematical connection among mathematical concepts) and the second indicator (using the mathematical connection between mathematics concepts and different fields of study), the student’s achievement was not different significantly.
Meanwhile, for the third indicator (using the concepts of mathematics in daily life), the value of significance which was obtained from two tailed test of Mann-Whitney test was 0,011, so H0 was rejected. Based on the mean score, it can be concluded that the students in the PBM group got the better mathematical connection ability better than the student in the guided discovery group.
It could be happened because of the difference type of learning in the two groups. PBL groups began the learning by presenting problem which was related with daily life (authentic) (Arends, 2009). Then, the students and their groups did discussion to find the solution of the given problems. The students used their previous knowledge to find and construct the new concepts that they have to find and to understand. In this step, smarter students would help the other students to find the solution and understand the concepts. When all students find the solution of the problems, each student is expected to understand the new concepts that they learnt. Under PBL, the students are accustomed to working on the problems related with real life problems. It makes the student under PBL has mathematical connection with daily life better.
Meanwhile, students who studied under guided discovery learning began with the process of discovering or re-discovering the concepts, after the concepts were obtained then the student were given exercises to check their level of understanding. Although the exercises given in guided discovery learning groups were also question based on issues that are authentic, but the student in that group got difficulties in applying the concepts they have acquired. This due to the students were more focus on rediscovering the concepts rather that the implementation.
Based on the analysis of the solution that derived from the sampel from the two groups, there were findings which helped confrim the conclusion that the mathematical connection abiliy of the students who studied under PBL was better. The findings is the students under PBL did some ilustration (mathematical representation) before finding the solution of the problem. It shown that mathematical connection of the students under PBL were progressing better. Coxford (1995) stated that in finding the mathematical connection variety of mathematical approach such as mathematical representation is needed.
CONCLUSION
Based on the results of data analysis and discussion that has been described, it can be concluded as follows.
Bandung, October 17th, 2015
Proceeding International Seminar on
Mathematics, Science, and Computer Science Education
129
M
1. There was a difference achievement of mathematical connection ability between students who studied under PBL and those of under guided discovery learning model. The achievement of mathematical connection ability of students who studied under PBL was better. Students who studied under PBL got the higher score on second indicators: using the concepts of mathematics in daily life.
2. There was a difference enhancement of mathematical connection ability between students who studied under PBL and those of under guided discovery learning model. The enhancement of mathematical connection ability of students who studied under PBL was better. Both of the n-gain of the students under PBL and guided discovery learning model was in medium category.
REFERENCES
Arends, R., I. (2009). Learning to Teach. New York: Mc.Graw-Hill.
Badan Standar Nasional Pendidikan. (2006). Standar Isi untuk Satuan Pendidikan Dasar
dan menengah: Standar Kompetensi dan Komptensi Dasar SMP/MTS. Jakarta.
Cheeseman, J., McDonough, A., & Ferguson, S. (2012). The Effect of Creating Rich Learning Environment for Children to Measure Mass. In J. Dindyal, L. P. Cheng & S. F. Ng (Eds.), Mathematics education: Expanding horizons (Proceedings of
the 35th annual conference of the Mathematics Education Research Group of
Australasia (pp.178-185). Singapore: MERGA
Coxford, A.F. (1995). “The Case for Connections”, dalam Connecting Mathematics
across the Curriculum. Editor: House, P.A. dan Coxford, A.F. Virginia: NCTM.
Fauzi, M, A. (2011). Peningkatan Kemampuan Koneksi Matematis dan Kemandirian Belajar Siswa dengan Pendekatan Pembelajaran Metakognitif di Sekolah Menengah Pertama. Presented at International Seminar and the Fourth National
Conference on Mathematics Education 2011, July 21-23, 2011. Yogyajarta: Universitas Negeri Yogyakarta.
Fraenkel, J., R., Wallen, N., E., & Hyun, H., H. (2012). How to Design and Evaluate
Research in Education. Newyork: McGraw Hill.
Glacey, K. (2011). A Study of Mathematical Connection through Children’s Literature in a Fifth- and Sixth-Grade Classroom. Lincoln: University of Nebraska.
Gordah, E. K. (2009). Meningkatkan Kemampuan Koneksi dan Pemecahan Masalah
Matematis Melalui Pendekatan Open-Ended. SPs UPI Bandung: Tidak diterbitkan.
Ibrahim, M. (2012). Pembelajaran Berdasarkan Masalah. Surabaya: Unesa University Press.
Mandur, I. N., Sadra, I. W., & Suparta, K.. (2013). Kontribusi Kemampuan Koneksi, Kemampuan Representadi, dan Disposisi Matematis Terhadap Prestasi Belajar Matematika Siswa SMA Swasta di Kabupaten Manggarai. Jurnal Program
Pascasarjana Universitas Pendidikan Ganesha. Vol. 2.
Mustopa, A., D. (2014). Meningkatkan Kemampuan Koneksi, Representasi, dan Self-
Efficacy Matematis Siswa SMP Melalui Pendekatan Kontekstual dengan Strategi
Formulate-Share-Listen-Create (FSLC). SPs UPI Bandung: Tidak diterbitkan.
NCTM. (2000). Principles and Standards for School Mathematics. Reston, Virginia: NCTM.

Bandung, October 17th, 2015
Proceeding International Seminar on
Mathematics, Science, and Computer Science Education
130
M
Permana, Y., & Sumarno, U. (2007). Mengembangkan Kemampuan Penalaran dan Koneksi Matematik Siswa SMA Melalui Pembelajaran Berbasis Masalah. Jurnal
EDUCATIONIST, Vol 1 No. 2 Hal 116-123.
Permendikbud. (2013). Standar Proses Pendidikan Dasar dan Menengah. Jakarta: Depdikbud.
Qohar, A. (2011). Asosiasi Antara Koneksi Matematis dan Komunikasi Matematis serta
Kemandirian Belajar Matematika Siswa SMP. Retrived from http://eprints.uny.ac.id/6967/1/Makalah%20Peserta%203% 20-%20Abd .%20 Qohar1.pdf.
Sugiman. (2008). Koneksi Matemamatik dalam Pembelajaran Matematika di Sekolah Menengah Pertama. Jurnal Jurusan Pendidikan Matematika FMIPA Universitas
Negeri Yogyakarta.
Sulistyaningsih, D., Waluya, S.B., & Kartono. (2012). Model Pembelajaran Kooperatif Tipe CIRC dengan Pendekatan Konstruktivisme untuk Meningkatkan Kemampuan Koneksi Matematik. Unnes Journal of Mathematics Education Research. Vol 2, pp.121-127.
Yusmanita. (2012). Peningkatan Kemampuan Pemahaman dan Koneksi Matematis Siswa
SMA dengan Menggunakan Pendekatan Metakognitif. SPs UPI Bandung: Tidak diterbitkan.
Bandung, October 17th, 2015
Proceeding International Seminar on
Mathematics, Science, and Computer Science Education
131
M
MATH-07367
Mathematical Modeling Ability in Geometry Materials of Elementary School Teachers
Didi Suhaedi1,*, Tia Purniati2
1Departement of Mathematics, Bandung Islamic University Jl. Rangga Malela No 1, Bandung 40116, Indonesia
2Department of Mathematics Education, Indonesia University of Education Jl. Dr. Setiabudi no 229, Bandung 40154, Indonesia
Article info Abstract
Keywords: mathematical modeling, geometry, algebra
Connectivity theory of Bruner16 said that for every concept, proposition and math skills related to the concept, proposition and other math skills. Similarly, the geometry material are closely related with algebra material3, especially of modeling (as part of the study algebra) for the geometry material. Modeling is one of the ability that continuously researched and developed by experts in mathematics education. This condition is reflected in appearance of at least some of the literature, such as: Modeling Students’ Mathematical Modeling Competencies9, Mathematical Modelling: from Theory to Practice7. Teacher is one of important aspects that determine the success of students in studying mathematical modeling. This paper presents descriptive analysis of mathematical modeling ability in the geometry material (in particular plane materials) are owned by elementary school teachers. Data were obtained in 2014 and 2015 of 64 elementary school teachers.
Corresponding Author: *Didi Suhaedi [email protected]
INTRODUCTION
The scope of mathematics is studied by students include: numbers, geometry and measurement, algebra; trigonometry, calculus, statistics and probability. One aspect of the study in algebra is mathematical model. A model of an object is not an object itself but is a scaled-down version of the actual object. We are familiar with such models, building models created by an architect before the actual building was built. Car models are made as a reference to make the actual cars17.
A model consists of two important aspects, namely a model consists of aspects that exist in the real object; a model can be studied and manipulated easily so it can be easier to understand the real object. Likewise, a mathematical model is a mathematical structure as approximates an important aspect of a situation. This model may be in the form of equations, graphs, tables, or other mathematical tools are applicable to a particular situation. Mathematical modeling is a process of examining a real-world problem and then develop equations, formulas, tables, or graphs that represents correctly main aspects of the situation17.
A straight line that made by two points on the cartesian coordinates (as a representation of geometry) can be expressed as an equation of a straight line (a mathematical model). The simple idea suggests that there is a link between algebra and geometry. Algebraic thinking3 can be used in solving the problems of geometry, as well as geometric ideas can provide a source of insight for algebra problems. Based on these conditions, in this paper will be presented a descriptive analysis of mathematical modeling ability in the geometry material (in particular plane materials) of elementary school teachers.
METHOD
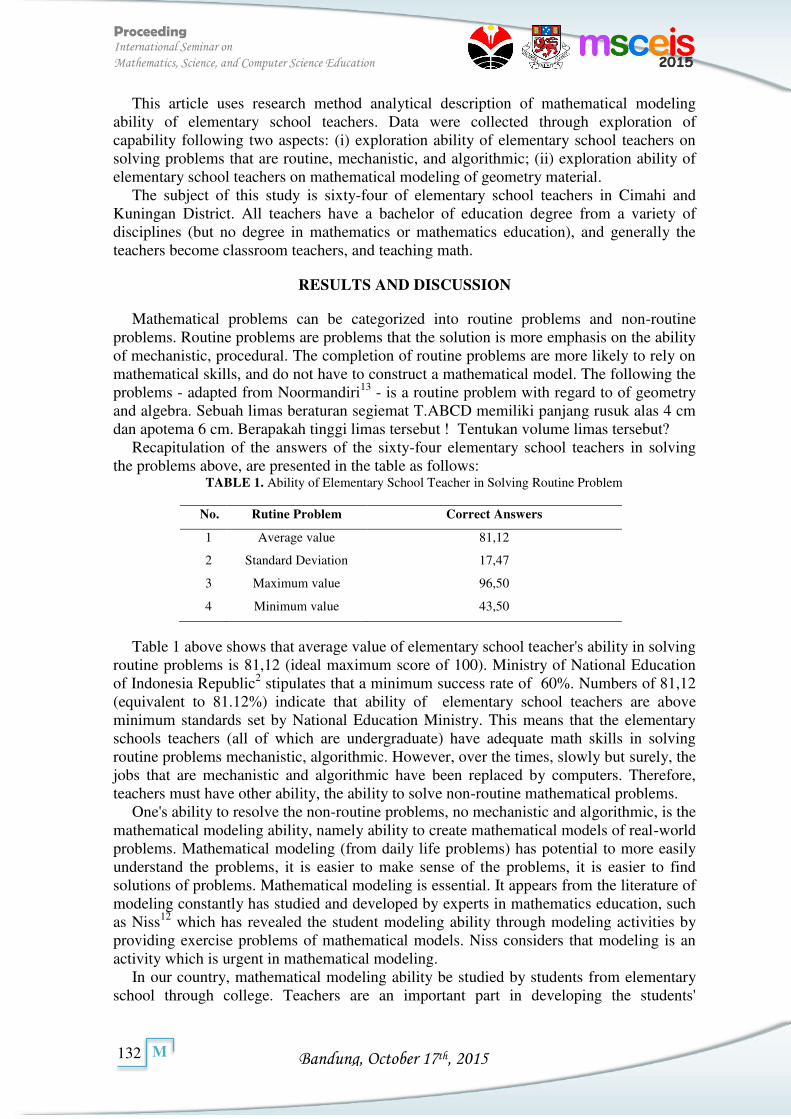
Bandung, October 17th, 2015
Proceeding International Seminar on
Mathematics, Science, and Computer Science Education
132
M
This article uses research method analytical description of mathematical modeling ability of elementary school teachers. Data were collected through exploration of capability following two aspects: (i) exploration ability of elementary school teachers on solving problems that are routine, mechanistic, and algorithmic; (ii) exploration ability of elementary school teachers on mathematical modeling of geometry material.
The subject of this study is sixty-four of elementary school teachers in Cimahi and Kuningan District. All teachers have a bachelor of education degree from a variety of disciplines (but no degree in mathematics or mathematics education), and generally the teachers become classroom teachers, and teaching math.
RESULTS AND DISCUSSION
Mathematical problems can be categorized into routine problems and non-routine problems. Routine problems are problems that the solution is more emphasis on the ability of mechanistic, procedural. The completion of routine problems are more likely to rely on mathematical skills, and do not have to construct a mathematical model. The following the problems - adapted from Noormandiri13 - is a routine problem with regard to of geometry and algebra. Sebuah limas beraturan segiemat T.ABCD memiliki panjang rusuk alas 4 cm dan apotema 6 cm. Berapakah tinggi limas tersebut ! Tentukan volume limas tersebut?
Recapitulation of the answers of the sixty-four elementary school teachers in solving the problems above, are presented in the table as follows:
TABLE 1. Ability of Elementary School Teacher in Solving Routine Problem
No. Rutine Problem Correct Answers
1 Average value 81,12
2 Standard Deviation 17,47
3 Maximum value 96,50
4 Minimum value 43,50
Table 1 above shows that average value of elementary school teacher's ability in solving routine problems is 81,12 (ideal maximum score of 100). Ministry of National Education of Indonesia Republic2 stipulates that a minimum success rate of 60%. Numbers of 81,12 (equivalent to 81.12%) indicate that ability of elementary school teachers are above minimum standards set by National Education Ministry. This means that the elementary schools teachers (all of which are undergraduate) have adequate math skills in solving routine problems mechanistic, algorithmic. However, over the times, slowly but surely, the jobs that are mechanistic and algorithmic have been replaced by computers. Therefore, teachers must have other ability, the ability to solve non-routine mathematical problems.
One's ability to resolve the non-routine problems, no mechanistic and algorithmic, is the mathematical modeling ability, namely ability to create mathematical models of real-world problems. Mathematical modeling (from daily life problems) has potential to more easily understand the problems, it is easier to make sense of the problems, it is easier to find solutions of problems. Mathematical modeling is essential. It appears from the literature of modeling constantly has studied and developed by experts in mathematics education, such as Niss12 which has revealed the student modeling ability through modeling activities by providing exercise problems of mathematical models. Niss considers that modeling is an activity which is urgent in mathematical modeling.
In our country, mathematical modeling ability be studied by students from elementary school through college. Teachers are an important part in developing the students'
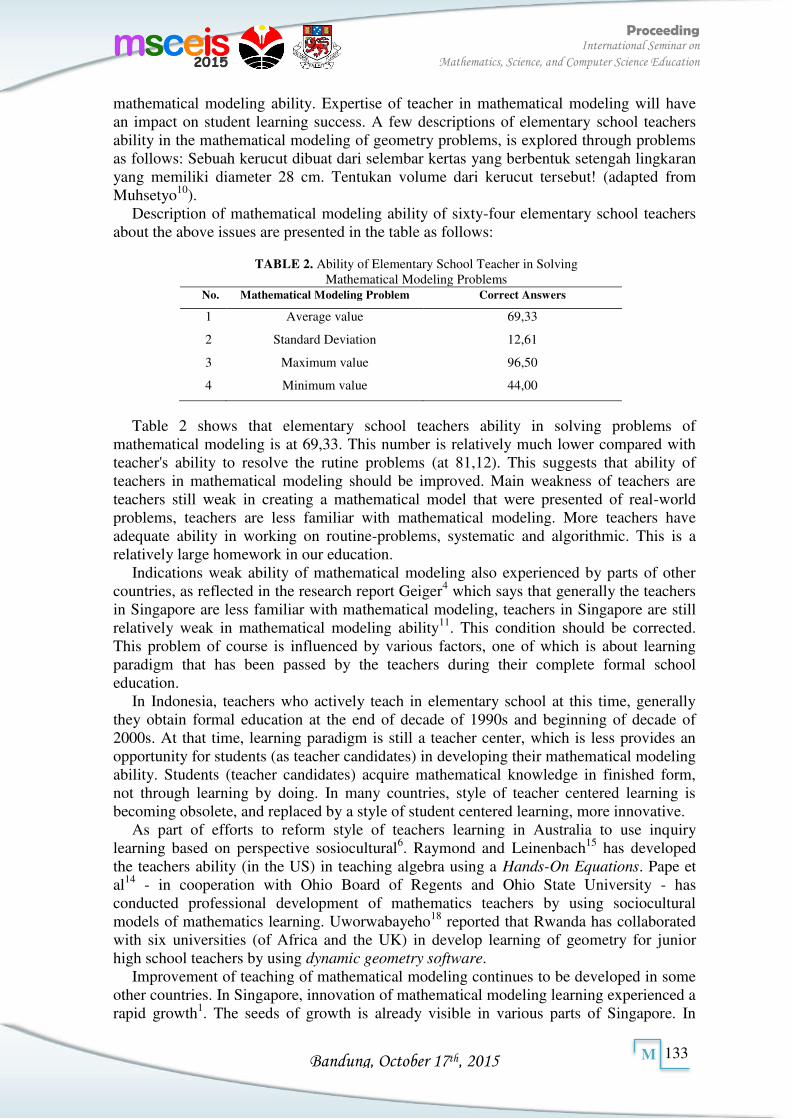
Bandung, October 17th, 2015
Proceeding International Seminar on
Mathematics, Science, and Computer Science Education
133
M
mathematical modeling ability. Expertise of teacher in mathematical modeling will have an impact on student learning success. A few descriptions of elementary school teachers ability in the mathematical modeling of geometry problems, is explored through problems as follows: Sebuah kerucut dibuat dari selembar kertas yang berbentuk setengah lingkaran yang memiliki diameter 28 cm. Tentukan volume dari kerucut tersebut! (adapted from Muhsetyo10).
Description of mathematical modeling ability of sixty-four elementary school teachers about the above issues are presented in the table as follows:
TABLE 2. Ability of Elementary School Teacher in Solving
Mathematical Modeling Problems No. Mathematical Modeling Problem Correct Answers
1 Average value 69,33
2 Standard Deviation 12,61
3 Maximum value 96,50
4 Minimum value 44,00
Table 2 shows that elementary school teachers ability in solving problems of mathematical modeling is at 69,33. This number is relatively much lower compared with teacher's ability to resolve the rutine problems (at 81,12). This suggests that ability of teachers in mathematical modeling should be improved. Main weakness of teachers are teachers still weak in creating a mathematical model that were presented of real-world problems, teachers are less familiar with mathematical modeling. More teachers have adequate ability in working on routine-problems, systematic and algorithmic. This is a relatively large homework in our education.
Indications weak ability of mathematical modeling also experienced by parts of other countries, as reflected in the research report Geiger4 which says that generally the teachers in Singapore are less familiar with mathematical modeling, teachers in Singapore are still relatively weak in mathematical modeling ability11. This condition should be corrected. This problem of course is influenced by various factors, one of which is about learning paradigm that has been passed by the teachers during their complete formal school education.
In Indonesia, teachers who actively teach in elementary school at this time, generally they obtain formal education at the end of decade of 1990s and beginning of decade of 2000s. At that time, learning paradigm is still a teacher center, which is less provides an opportunity for students (as teacher candidates) in developing their mathematical modeling ability. Students (teacher candidates) acquire mathematical knowledge in finished form, not through learning by doing. In many countries, style of teacher centered learning is becoming obsolete, and replaced by a style of student centered learning, more innovative.
As part of efforts to reform style of teachers learning in Australia to use inquiry learning based on perspective sosiocultural6. Raymond and Leinenbach15 has developed the teachers ability (in the US) in teaching algebra using a Hands-On Equations. Pape et al14 - in cooperation with Ohio Board of Regents and Ohio State University - has conducted professional development of mathematics teachers by using sociocultural models of mathematics learning. Uworwabayeho18 reported that Rwanda has collaborated with six universities (of Africa and the UK) in develop learning of geometry for junior high school teachers by using dynamic geometry software.
Improvement of teaching of mathematical modeling continues to be developed in some other countries. In Singapore, innovation of mathematical modeling learning experienced a rapid growth1. The seeds of growth is already visible in various parts of Singapore. In
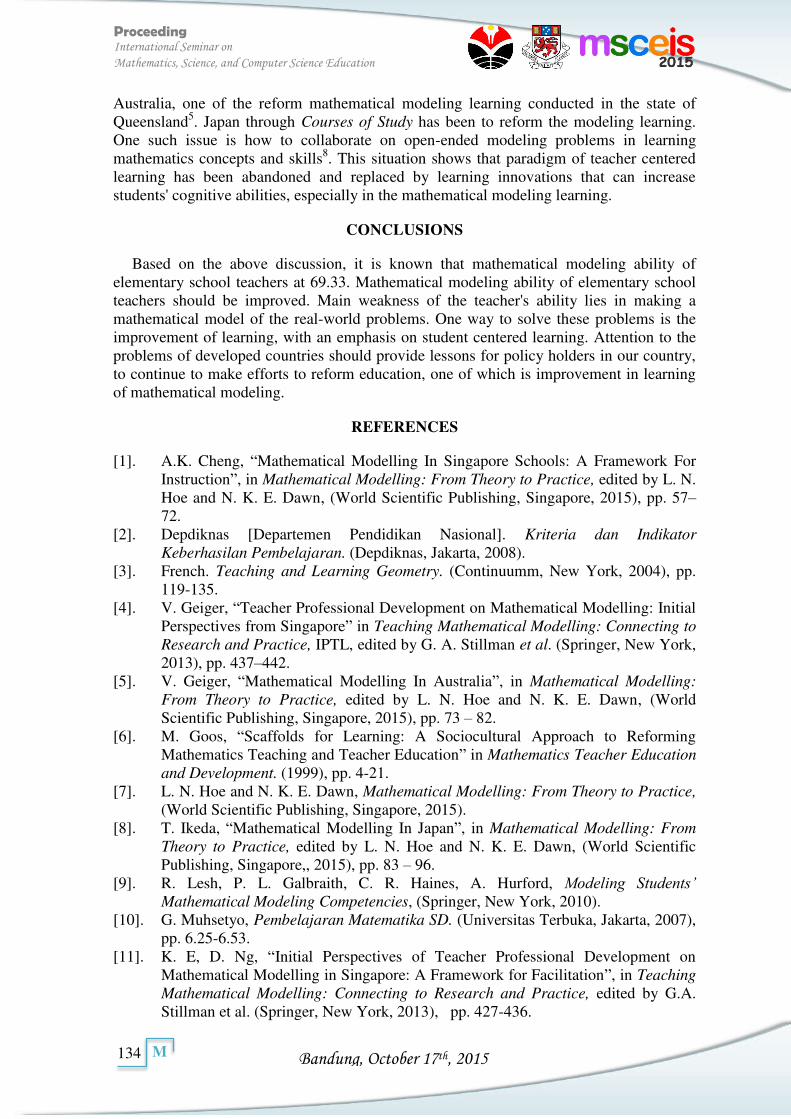
Bandung, October 17th, 2015
Proceeding International Seminar on
Mathematics, Science, and Computer Science Education
134
M
Australia, one of the reform mathematical modeling learning conducted in the state of Queensland5. Japan through Courses of Study has been to reform the modeling learning. One such issue is how to collaborate on open-ended modeling problems in learning mathematics concepts and skills8. This situation shows that paradigm of teacher centered learning has been abandoned and replaced by learning innovations that can increase students' cognitive abilities, especially in the mathematical modeling learning.
CONCLUSIONS
Based on the above discussion, it is known that mathematical modeling ability of elementary school teachers at 69.33. Mathematical modeling ability of elementary school teachers should be improved. Main weakness of the teacher's ability lies in making a mathematical model of the real-world problems. One way to solve these problems is the improvement of learning, with an emphasis on student centered learning. Attention to the problems of developed countries should provide lessons for policy holders in our country, to continue to make efforts to reform education, one of which is improvement in learning of mathematical modeling.
REFERENCES
[1]. A.K. Cheng, “Mathematical Modelling In Singapore Schools: A Framework For Instruction”, in Mathematical Modelling: From Theory to Practice, edited by L. N. Hoe and N. K. E. Dawn, (World Scientific Publishing, Singapore, 2015), pp. 57–72.
[2]. Depdiknas [Departemen Pendidikan Nasional]. Kriteria dan Indikator
Keberhasilan Pembelajaran. (Depdiknas, Jakarta, 2008). [3]. French. Teaching and Learning Geometry. (Continuumm, New York, 2004), pp.
119-135. [4]. V. Geiger, “Teacher Professional Development on Mathematical Modelling: Initial
Perspectives from Singapore” in Teaching Mathematical Modelling: Connecting to
Research and Practice, IPTL, edited by G. A. Stillman et al. (Springer, New York, 2013), pp. 437–442.
[5]. V. Geiger, “Mathematical Modelling In Australia”, in Mathematical Modelling:
From Theory to Practice, edited by L. N. Hoe and N. K. E. Dawn, (World Scientific Publishing, Singapore, 2015), pp. 73 – 82.
[6]. M. Goos, “Scaffolds for Learning: A Sociocultural Approach to Reforming Mathematics Teaching and Teacher Education” in Mathematics Teacher Education
and Development. (1999), pp. 4-21. [7]. L. N. Hoe and N. K. E. Dawn, Mathematical Modelling: From Theory to Practice,
(World Scientific Publishing, Singapore, 2015). [8]. T. Ikeda, “Mathematical Modelling In Japan”, in Mathematical Modelling: From
Theory to Practice, edited by L. N. Hoe and N. K. E. Dawn, (World Scientific Publishing, Singapore,, 2015), pp. 83 – 96.
[9]. R. Lesh, P. L. Galbraith, C. R. Haines, A. Hurford, Modeling Students’ Mathematical Modeling Competencies, (Springer, New York, 2010).
[10]. G. Muhsetyo, Pembelajaran Matematika SD. (Universitas Terbuka, Jakarta, 2007), pp. 6.25-6.53.
[11]. K. E, D. Ng, “Initial Perspectives of Teacher Professional Development on Mathematical Modelling in Singapore: A Framework for Facilitation”, in Teaching
Mathematical Modelling: Connecting to Research and Practice, edited by G.A. Stillman et al. (Springer, New York, 2013), pp. 427-436.
Bandung, October 17th, 2015
Proceeding International Seminar on
Mathematics, Science, and Computer Science Education
135
M
[12]. M. Niss, “Modeling a Crucial Aspect of Students’ Mathematical Modeling” in Modeling Students’ Mathematical Modeling Competencies, ICTMA 13, edited by R. Lesh et al. (Springer, New York, 2010), pp. 42–59.
[13]. A.K. Noormandiri and E. Sucipto. Matematika SMA untuk Kelas X (Erlangga, Jakarta,2004).
[14]. S. J. Pape, C. V. Bell, and I. E. Yetkin, “Developing Mathematical Thinking and Self-regulated Learning: A Teaching Experiment in a Seventh-Grade Mathematics Classroom”, in Educational Studies in Mathematics, (Kluwer Academic Publishers, London, 2003), pp. 179-202.
[15]. A.M. Raymond and M. Leinenbach, Collaborative Action Research on The Learning and Teaching of Algebra: A Story of One Mathematics Teacher’s Development”, in Educational Studies in Mathematics, (Kluwer Academic Publishers, London, 2000), pp. 283-307.
[16]. Suherman, dkk. Strategi Pembelajaran Matematika Kontemporer (UPI . Bandung:, 2005).
[17]. L. Timmons, C. W. Johnson, S. M. Mccook. Fundamentals of Algebraic Modeling
(Brooks/Cole, Belmont, 2010), pp. 2-4. [18]. A.Uworwabayeho, “Teachers’ innovative change within countrywide reform: a
case study in Rwanda”, in Journal of Mathematics Teacher Education, (2009), pp. 315 – 324.
Bandung, October 17th, 2015
Proceeding International Seminar on
Mathematics, Science, and Computer Science Education
136
M
MATH-07439
The Development of Learning Material Student Worksheet (LKS) with Missouri Mathematics Project Model (MMP) in
Mathematics Subject at Junior High School
Abdurrahmana, Sri Rezekib, Andoko Ageng Setyawanc
a,b,c Lecturer in Mathematics Education Department FKIP UIR
Article info Abstract
Keywords: The Development of Learning Material, Student Worksheet, Missouri Mathematics Project.
The aim of this research is to develop learning material in the form of LKS so that it can be a communication bridge between teacher and students. The samples was students in grade VII1 and VII2 SMP Muhammadiyah 2 Pekanbaru in academic year 2014/2015. The type of this research is modification research development from Sugiyono with two field tests. The research data were collected through validation sheet, observation sheet, and questionnaire. The collected data were analyzed descriptively, the researcher revised based on the records from validator, the legibility of product, then field tested, next revised the product to make it becomes final product that tested its feasibility. The research result showed that learning material LKS developed has good quality. The response of students to this learning material used were good based on data from questionnaire analysis result. According to the research result, the researcher can conclude that the worksheet used by students can support the study activity in learning process.
Corresponding Author: Abdurrahman [email protected] Sri Rezeki [email protected] Andoko Ageng Setyawan [email protected]
INTRODUCTION
Curriculum 2013 is essentially an attempt to repair education/learning process in formal education. According to Daryanto and Aris Dwicahyono (2014: 171) “teachers must have or use learning material that suitable with curriculum, characteristics of target, and guidance of learning problem solving”. So that teachers themselves are required to create and develop LKS adapted to the student’s activity as a form of teacher’s creativity, not printed in large scale by a group of teachers because every school is distinctive, unique, and unequal (Esti Ismawati, 2012: 250). The arrangement of learning material in curriculum 2013 must suitable with the components in that curriculum (Imas Kurinasih, 2014:155)
Based on observation of researchers in SMP Muhammadiyah 2 Pekanbaru on Thursday, December 18, 2014, it is still acquired some problems regarding to the learning material as a cause for the low student’s activity in mathematical learning process: (1) the lack of creativity and innovation of teachers in developing and creating the learning material for students; (2) there is still no mathematical learning material that support the student’s learning activity; (3) there is still no socialization to the teachers on how to develop a good learning material; (4) there are some teachers that still use instant LKS without adjust with learning program designed by him/her.
Because of the gap between learning material expected by curriculum 2013 with learning material used by students at school, then researchers are interested in creating the new innovation in learning. That new innovation is to develop LKS for students in grade VII SMP Muhammadiyah 2 Pekanbaru in quadrilateral subject. With the conduct of this research, it is expected to make the mathematical learning in a creative, innovative, and effective way.
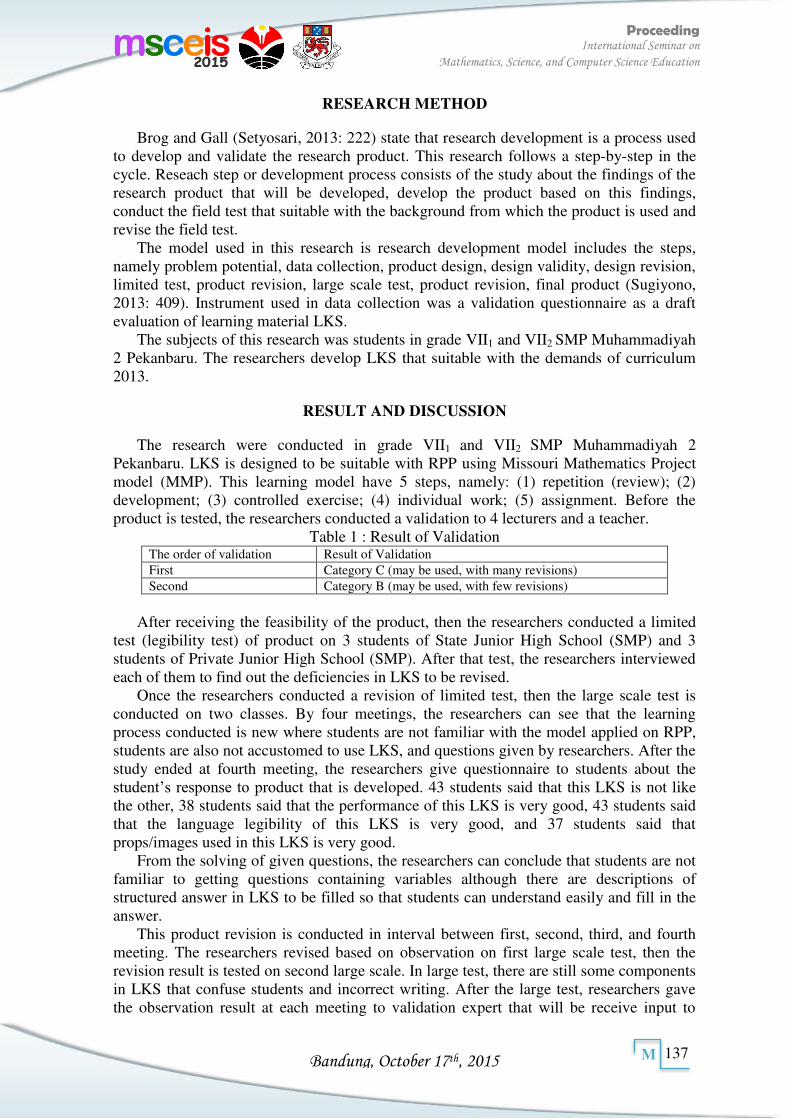
Bandung, October 17th, 2015
Proceeding International Seminar on
Mathematics, Science, and Computer Science Education
137
M
RESEARCH METHOD
Brog and Gall (Setyosari, 2013: 222) state that research development is a process used to develop and validate the research product. This research follows a step-by-step in the cycle. Reseach step or development process consists of the study about the findings of the research product that will be developed, develop the product based on this findings, conduct the field test that suitable with the background from which the product is used and revise the field test.
The model used in this research is research development model includes the steps, namely problem potential, data collection, product design, design validity, design revision, limited test, product revision, large scale test, product revision, final product (Sugiyono, 2013: 409). Instrument used in data collection was a validation questionnaire as a draft evaluation of learning material LKS.
The subjects of this research was students in grade VII1 and VII2 SMP Muhammadiyah 2 Pekanbaru. The researchers develop LKS that suitable with the demands of curriculum 2013.
RESULT AND DISCUSSION
The research were conducted in grade VII1 and VII2 SMP Muhammadiyah 2 Pekanbaru. LKS is designed to be suitable with RPP using Missouri Mathematics Project model (MMP). This learning model have 5 steps, namely: (1) repetition (review); (2) development; (3) controlled exercise; (4) individual work; (5) assignment. Before the product is tested, the researchers conducted a validation to 4 lecturers and a teacher.
Table 1 : Result of Validation The order of validation Result of Validation First Category C (may be used, with many revisions) Second Category B (may be used, with few revisions)
After receiving the feasibility of the product, then the researchers conducted a limited
test (legibility test) of product on 3 students of State Junior High School (SMP) and 3 students of Private Junior High School (SMP). After that test, the researchers interviewed each of them to find out the deficiencies in LKS to be revised.
Once the researchers conducted a revision of limited test, then the large scale test is conducted on two classes. By four meetings, the researchers can see that the learning process conducted is new where students are not familiar with the model applied on RPP, students are also not accustomed to use LKS, and questions given by researchers. After the study ended at fourth meeting, the researchers give questionnaire to students about the student’s response to product that is developed. 43 students said that this LKS is not like the other, 38 students said that the performance of this LKS is very good, 43 students said that the language legibility of this LKS is very good, and 37 students said that props/images used in this LKS is very good.
From the solving of given questions, the researchers can conclude that students are not familiar to getting questions containing variables although there are descriptions of structured answer in LKS to be filled so that students can understand easily and fill in the answer.
This product revision is conducted in interval between first, second, third, and fourth meeting. The researchers revised based on observation on first large scale test, then the revision result is tested on second large scale. In large test, there are still some components in LKS that confuse students and incorrect writing. After the large test, researchers gave the observation result at each meeting to validation expert that will be receive input to
Bandung, October 17th, 2015
Proceeding International Seminar on
Mathematics, Science, and Computer Science Education
138
M
revise the final product. The final product is obtained after researchers revised the product and then it will be validated again by expert team for its improvement so that the final product will be tested its feasibility.
REFERENCES
Daryanto & Aris Dwicahyano. 2014. Pengembangan Perangkat Pembelajaran. Yogyakarta: Gava Media Publisher
Esti Ismawati. 2012. Telaah Kurikulum dan Pengembangan Bahan Ajar. Yogyakarta: Ombak
Imas Kurinasih & Berlin Sani. 2014. Implementasi Kurikulum 2013 Konsep Penerapan. Surabaya: Kata Pena
Setyosari Punaji. 2013. Metode Penelitian Pendidikan dan Pengembangan. Jakarta: Fajar Interpratama Mandiri
Sugiyono. 2013. Metode Penelitian Pendidikan Pendekatan Kuantitatif, Kualitatif dan
R&D. Bandung: Alfabeta.
Bandung, October 17th, 2015
Proceeding International Seminar on
Mathematics, Science, and Computer Science Education
139
M
MATH-07444
Didactical Design Of Mathematical Connections In Characteristic Of Quadrilateral Concept At Elementary
School
Epon Nur’aeni L, Yansi Nurani Henrisna
Program S-1PGSD Universitas Pendidikan Indonesia Kampus Tasikmalaya
Article info Abstract
Keywords: didactical design, mathematical connection, quadrilateral characteristics, learning obstacle.
This research is motivated by habituation hypothesis conventional learning without the anticipation of student learning and learning is done so that the obstacle appears. This study tried to uncover learning obstacle of the mathematical connection on learning obstacle to the concept of quadrilateral characteristics. Preferred study material on mathematical connection of parallelogram characteristics. Indicators mathematical connections are inter-topics of mathematics and mathematical connection with life. The development of the didactical design based learning obstacle is revealed and reinforced by learning theories relevant. The sampling technique used is saturated sample in which all members of the population as the sample. The research subject is determined by students who have studied the material of quadrilateral characteristics, fifth grade. Preliminary studies conducted in SDN Cieunteung 1 and 2 in class V and class VI in order to meet the prerequisite material. Phase of didactical design implementation done in SDN Nagarawangi 1 consists of two cycles where each cycle consisted of two meetings. Initial didactic design is implemented in V-A and didactical design revisions implemented in grade V-B. Location of the study are in Tasikmalaya. Location as the implementation phase of design research performed in the SD State didactic Nagarawangi 1 Tasikmalaya is divided into two cycles. Cycle 1 was conducted in the VA class with 26 students enrolled. Cycle 2 was conducted in VC class with 28 students enrolled. The results of this study are alternative designs that can be used in a mathematical learning about mathematical connection at the concept of quadrilateral characteristics.
Corresponding Author: Epon Nur’aeni L. [email protected]
INTRODUCTION
The preliminary research showed that problem extant at mathematics, especially at primary school. Most students reveal that mathematics is difficult and should memorize a lot of formula. It supported by the conventional learning which not accustom students reconstruct new knowledge actively. Whereas Susanto (2013, p. 186) said that mathematics learning is a teaching process which developed by teacher to evolving students thinking creativity along with evolving new knowledge to increase mathematics mastery.
Conventional learning program caused students conventional habitual learning. Whereas teacher activity not only to guide students at learning process and also students activity not just to abreast learning process monotonously. Suryadi (2010) said that “teacher thiking process at teaching occure three times that is before, during, and after learning process”. It means that teacher should have teaching plan and be able reflect the result for next class. Whereas teacher thinking at learning process related to predict students response.
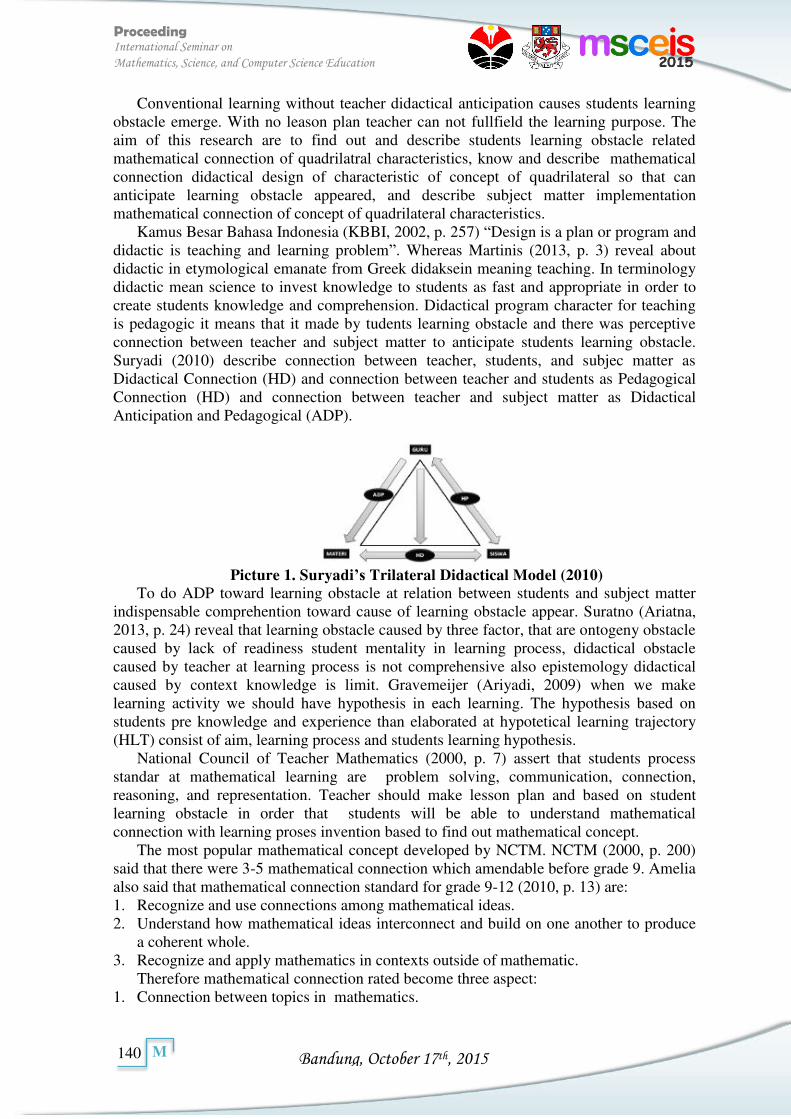
Bandung, October 17th, 2015
Proceeding International Seminar on
Mathematics, Science, and Computer Science Education
140
M
Conventional learning without teacher didactical anticipation causes students learning obstacle emerge. With no leason plan teacher can not fullfield the learning purpose. The aim of this research are to find out and describe students learning obstacle related mathematical connection of quadrilatral characteristics, know and describe mathematical connection didactical design of characteristic of concept of quadrilateral so that can anticipate learning obstacle appeared, and describe subject matter implementation mathematical connection of concept of quadrilateral characteristics.
Kamus Besar Bahasa Indonesia (KBBI, 2002, p. 257) “Design is a plan or program and didactic is teaching and learning problem”. Whereas Martinis (2013, p. 3) reveal about didactic in etymological emanate from Greek didaksein meaning teaching. In terminology didactic mean science to invest knowledge to students as fast and appropriate in order to create students knowledge and comprehension. Didactical program character for teaching is pedagogic it means that it made by tudents learning obstacle and there was perceptive connection between teacher and subject matter to anticipate students learning obstacle. Suryadi (2010) describe connection between teacher, students, and subjec matter as Didactical Connection (HD) and connection between teacher and students as Pedagogical Connection (HD) and connection between teacher and subject matter as Didactical Anticipation and Pedagogical (ADP).
Picture 1. Suryadi’s Trilateral Didactical Model (2010)
To do ADP toward learning obstacle at relation between students and subject matter indispensable comprehention toward cause of learning obstacle appear. Suratno (Ariatna, 2013, p. 24) reveal that learning obstacle caused by three factor, that are ontogeny obstacle caused by lack of readiness student mentality in learning process, didactical obstacle caused by teacher at learning process is not comprehensive also epistemology didactical caused by context knowledge is limit. Gravemeijer (Ariyadi, 2009) when we make learning activity we should have hypothesis in each learning. The hypothesis based on students pre knowledge and experience than elaborated at hypotetical learning trajectory (HLT) consist of aim, learning process and students learning hypothesis.
National Council of Teacher Mathematics (2000, p. 7) assert that students process standar at mathematical learning are problem solving, communication, connection, reasoning, and representation. Teacher should make lesson plan and based on student learning obstacle in order that students will be able to understand mathematical connection with learning proses invention based to find out mathematical concept.
The most popular mathematical concept developed by NCTM. NCTM (2000, p. 200) said that there were 3-5 mathematical connection which amendable before grade 9. Amelia also said that mathematical connection standard for grade 9-12 (2010, p. 13) are: 1. Recognize and use connections among mathematical ideas. 2. Understand how mathematical ideas interconnect and build on one another to produce
a coherent whole. 3. Recognize and apply mathematics in contexts outside of mathematic.
Therefore mathematical connection rated become three aspect: 1. Connection between topics in mathematics.
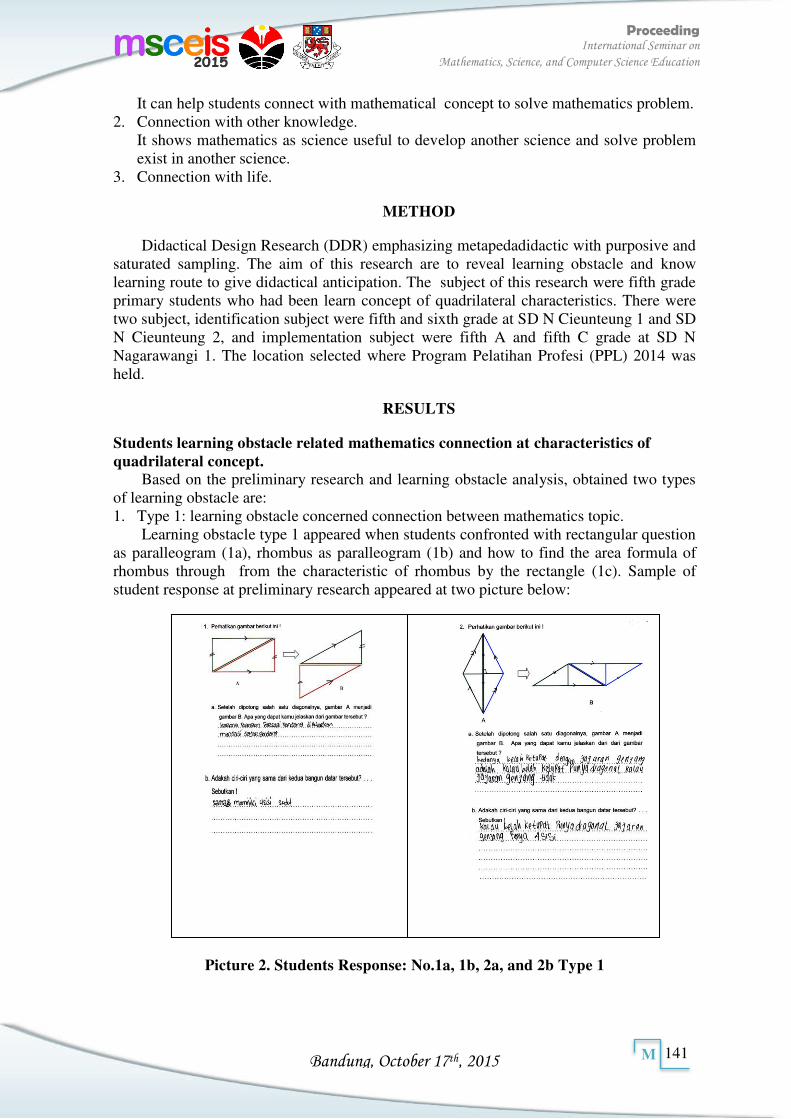
Bandung, October 17th, 2015
Proceeding International Seminar on
Mathematics, Science, and Computer Science Education
141
M
It can help students connect with mathematical concept to solve mathematics problem. 2. Connection with other knowledge.
It shows mathematics as science useful to develop another science and solve problem exist in another science.
3. Connection with life.
METHOD
Didactical Design Research (DDR) emphasizing metapedadidactic with purposive and saturated sampling. The aim of this research are to reveal learning obstacle and know learning route to give didactical anticipation. The subject of this research were fifth grade primary students who had been learn concept of quadrilateral characteristics. There were two subject, identification subject were fifth and sixth grade at SD N Cieunteung 1 and SD N Cieunteung 2, and implementation subject were fifth A and fifth C grade at SD N Nagarawangi 1. The location selected where Program Pelatihan Profesi (PPL) 2014 was held.
RESULTS
Students learning obstacle related mathematics connection at characteristics of quadrilateral concept.
Based on the preliminary research and learning obstacle analysis, obtained two types of learning obstacle are: 1. Type 1: learning obstacle concerned connection between mathematics topic.
Learning obstacle type 1 appeared when students confronted with rectangular question as paralleogram (1a), rhombus as paralleogram (1b) and how to find the area formula of rhombus through from the characteristic of rhombus by the rectangle (1c). Sample of student response at preliminary research appeared at two picture below:
Picture 2. Students Response: No.1a, 1b, 2a, and 2b Type 1
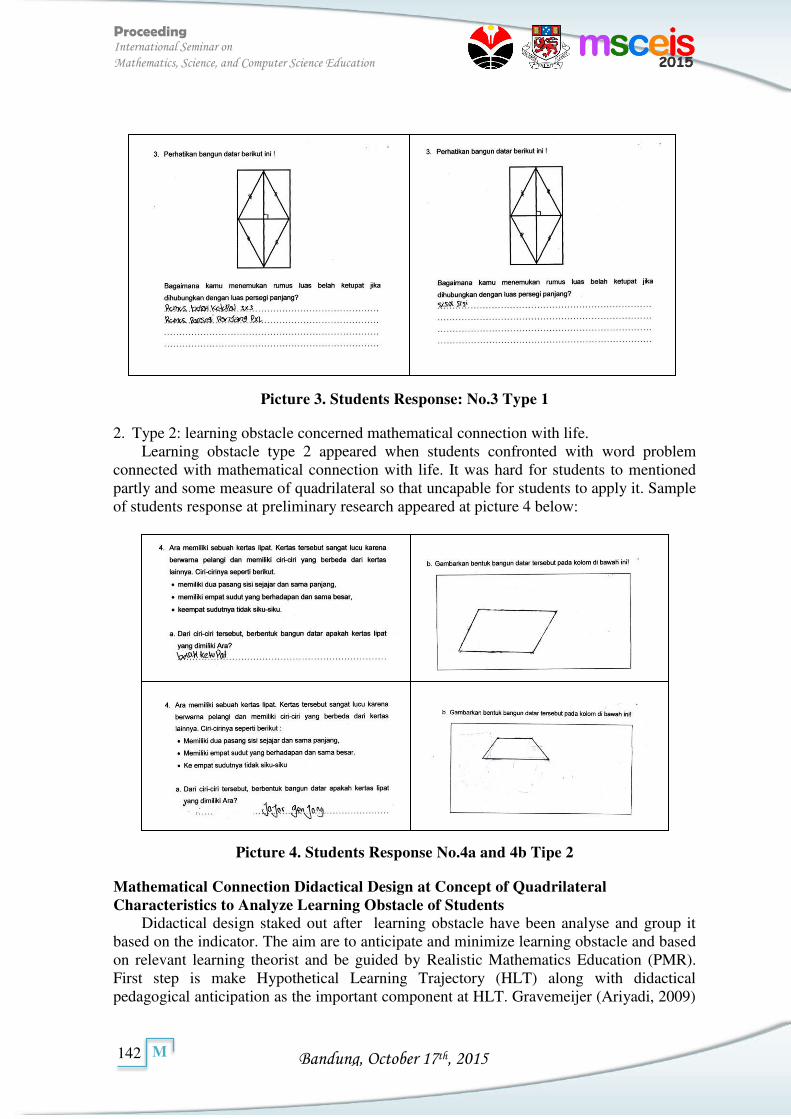
Bandung, October 17th, 2015
Proceeding International Seminar on
Mathematics, Science, and Computer Science Education
142
M
Picture 3. Students Response: No.3 Type 1
2. Type 2: learning obstacle concerned mathematical connection with life. Learning obstacle type 2 appeared when students confronted with word problem
connected with mathematical connection with life. It was hard for students to mentioned partly and some measure of quadrilateral so that uncapable for students to apply it. Sample of students response at preliminary research appeared at picture 4 below:
Picture 4. Students Response No.4a and 4b Tipe 2
Mathematical Connection Didactical Design at Concept of Quadrilateral Characteristics to Analyze Learning Obstacle of Students
Didactical design staked out after learning obstacle have been analyse and group it based on the indicator. The aim are to anticipate and minimize learning obstacle and based on relevant learning theorist and be guided by Realistic Mathematics Education (PMR). First step is make Hypothetical Learning Trajectory (HLT) along with didactical pedagogical anticipation as the important component at HLT. Gravemeijer (Ariyadi, 2009)
Bandung, October 17th, 2015
Proceeding International Seminar on
Mathematics, Science, and Computer Science Education
143
M
said that HLT should load three basic component, there are learning goals, learning activity, and hypothetical learning process. After categorize learning obstacle, four indicator and four learning process obtain as goal process be guided by Kurikulum Tingkat Satuan Pendidikan (KTSP) 2006 to establish Standar Kompetensi (SK), and Kompetensi Dasar (KD). Than hypothetical learning process do with hypothes the learning groove and predict students response appeared at learning process and steaked out ADP. It produce learning alternative and subjact matter, there is Students Action Paper (LKS) to implemented and developed at learning process. The LKS consist of first and second meeting at one cycle. First meeting LKS consist of activity 1 and activity 2 which steaked out based on student learning obstacle concerned mathematics connection with life. Second meeting LKS consist of 3 activity which steaked out to make students find out connection between mathematics topic and characteristics of parallelogram and develope students comprehension. Implementation of Mathematical Connection Didactical Design at Concept of Quadrilateral Characteristics
Didactical design developed appropriate with research plot that is early design prospective analysis (appropriate with RPP), early design implementation (V-A SD N Nagarawangi 1 at two meeting), early design retrospective analysis (cooperative learning as didactical design), revision design verse 1 prospective analysis.
Response at activity 1 showed that students had understand characteristics of parallelogram but unable to show it. It becomes reflection to repair but theorycal concept is defensible.
Activity 1 conclude that it charges students to infuse their knowledge concerned characteristics of parallelogram in order to infact and comprehensive. Students able to mention characteristics of quadrilateral so that defensible. Students rejoinder appropriate with prediction. Activity 2 at first meeting is defensible and no remedical because students response appeared appropriate with prediction. At second meeting students comprehention amended to find connection between mathematic topic concerned characteristics of parallelogram.
Proofed rectangular as parallelogram developed based on first meeting comprehention. Students understood the connection between rectangular and parallelogram but unable to interpret it based on the characteristic.
Rhombus concept as parallelogram provable with identify the characterictic equation and manipulate it. Activity 2 also need remedical at instruction conclution context. Activity 3 student development continued to find formula based on similarity of characteristics of parallelogram.
Based on didactical design implementation, obteined mathematics connection learning phases activity at characteristics of parallelogram: 1. Apply the concept of parallelogram’s characteristics started with contectual learning,
concerned eith mathematics connection with life. 2. Developed concept comprehention parallelogram’s characteristics through investigate
the characteristic. 3. Developed conprehention through draw parallelogram through investigate the
characteristic. 4. Practice question concerned with mathematics connection with life. 5. Developed comprehention parallelogram’s characteristics to find connection between
mathematics topic and apply it as question. Second meeting at second cycle do based on RPP. Learning activity emphasized at
detected learning obstacle. Didactical design at design implementation revision 1
Bandung, October 17th, 2015
Proceeding International Seminar on
Mathematics, Science, and Computer Science Education
144
M
defensible because some revision can reach the research purpose, but need additional time, do it round and round and at different meeting.
Bandung, October 17th, 2015
Proceeding International Seminar on
Mathematics, Science, and Computer Science Education
145
M
CONCLUSION
This paper has been providing part of result from didactical design of mathematical connection research on concept of quadrilateral characteristics, especially parallelogram. These alternative design can be implemented at elementary school level for fifth students. Learning obstacle appeared at previously learning can be minimized with applying this didactical design. However, for the optimal results, this didactical design need to develop continuously and adaptable with learning situation and condition.
REFERENCES
Ariatna, I. (2013). Desain Didaktis Bahan Ajar Koneksi Matematika pada Konsep Luas Daerah Trapesium. (Skripsi). Universitas Pendidikan Indonesia, Kampus Tasikmalaya
Sa’dijah. (1998). Pendidikan Matematika II. Departeman pendidikan dan Kebudayaan Direktorat Jendral Jendral Pendidikan Tinggi Proyek Pendidikan Guru Sekolah Dasar
Susanto, A. (2013). Teori Belajar dan Pembelajaran di Sekolah Dasar. Jakarta: Kharisma Putra Utama
Suryadi, D. (2010). Menciptakan Proses Belajar Aktif: Kajian dari Sudut Pandang Teori Belajar dan Teori Didaktik1. [Online]. Available at: http://didi-suryadi.staf.upi.edu/files/2011/06/MODEL-ANTISIPASI-DAN-SITUASI-DIDAKTIS.pdf. Accessed at 16 January 2014
Tim Redaksi KBBI. (2003). Kamus Besar Bahasa Indonesia. Jakarta: Balai Pustaka Wijaya, Ariyadi. (2009). Hypotetycal Learning Trajectory dan Peningkatan Pemahaman
Konsep Pengukuran Panjang. [Online]. Available at: http://staff.uny.ac.id/sites/default/files/penelitian/Ariyadi%20Wijaya,%20M.Sc/A%20Wijaya_SemNas%20Mat%UNY%202009_HLT%20dan%20Peningkatan%20Pemahaman%20Konsep%20Pengukuran.pdf . Accesed at 29 January 2014
Bandung, October 17th, 2015
Proceeding International Seminar on
Mathematics, Science, and Computer Science Education
146
M
MATH-07464
Problem Based Learning and Discovery Learning: The Comparation in Mathematical Creative Thinking Ability
of Junior High School Students
Jarnawi Afgani Dahlan
Universitas Pendidikan Indonesia
Article info Abstract
Keywords: Problem based learning, Discovery learning, Creative Thinking.
Curriculum 2013 recommended the application of learning models that is oriented to the enhancement of students learning activity or known as student centered learning. Through the learning process, knowledge, especially mathematical knowledge is not directly informed by the teacher, but the students acquire the knowledge by undergoing constructive processes through individual as well as group activities. The activities consist of observation, questioning, gathering information, inferenting, testing and communicating findings. This research done to gain information about effects of two learning models recommended by Curriculum 2013, which are Problem Based Learning and Discovery Learning in increasing creative thinking ability of Junior High School Students. As the results, this research revealed that descriptively the mean of student’s creative thinking ability (in scale of 100) is 78.52 with standard deviation 13.09. As for the Discovery Learning model the mean is 77.78 with standard deviation 19.00. The increment of the ability measured by normalized gain. For Problem Based Learning the mean is 0.69 (medium) with standard deviation 0.18, and for Discovery Learning the mean is 0.70 (high) with standard deviation 0.25. Inferentially testing showed that in level of significance 0.05 the achievement and the creative thinking increment of both groups are not significantly different. This research concluded that both models of learning have relatively similar potentials in increasing creative thinking ability of Junior High Student.
Corresponding Author: [email protected]
PENDAHULUAN
Berfikir kreatif merupakan salah satu kompetensi yang harus dicapai oleh siswa dalam pendidikan. Hal ini secara formal tercantum dalam Peraturan Menteri Pendidikan dan Kebudayaan Nomor 68 Tahun 2013 tentang Kerangka Dasar dan Struktur Kurikulum Sekolah. Dalam peraturan tersebut tertulis bahwa tujuan pendidikan nasional adalah mempersiapkan manusia Indonesia agar memiliki kemampuan hidup sebagai pribadi dan warga negara yang beriman, produktif, kreatif, inovatif dan afektif, serta mampu berkontribusi pada kehidupan bermasyarakat, berbangsa, bernegara dan peradaban dunia. Selain itu, kaitannya dengan berfikir kreatif, dalam kurikulum tersebut tertulis bahwa salah satu kriteria mengenai kualifikasi kemampuan lulusan yang harus dimiliki oleh siswa adalah memiliki kemampuan berfikir kreatif dalam ranah abstrak dan konkrit sesuai dengan yang dipelajari di sekolah dan sumber lain yang sejenis. Informasi di atas memberikan gambaran betapa pentingnya kemampuan berfikir kreatif dicapai oleh siswa, sehingga harus mampu dikembangkan dalam proses pendidikan.
Berfikir kreatif adalah suatu aktivitas mental untuk membuat hubungan-hubungan yang terus menerus sehingga ditemukan kombinasi yang “benar” sampai orang menyerah (Evans dalam Siswono, 2008). Dalam kaitannya dengan kemampuan kreatif
Bandung, October 17th, 2015
Proceeding International Seminar on
Mathematics, Science, and Computer Science Education
147
M
matematik di sekolah, Krutetskii (Siwono, 2008) menjelaskan bahwa kemampuan berfikir kreatif matematik berkaitan dengan suatu penguasaan kreatif mandiri (independent) matematika dibawah pengajaran matematika, formulasi mandiri masalah-masalah matematis yang tidak rumit (unconflicated), penemuan cara-cara dan sarana dari penyelesaian masalah, penemuan bukti-bukti teorema, pendekatan mandiri rumus-rumus dan penemuan metode-metode asli penyelesaian masalah non standar.
Upaya untuk meningkatkan kemampuan berfikir kreatif melalui pembelajaran matematika telah banyak dilakukan. La Moma (2104) menggunakan pembelajaran generatif sebagai strategi pembelajaran matematika. Hasil penelitiannya menemukan bahwa ada perbedaan kemampuan berfikir kreatif siswa Sekolah Menengah Pertama (SMP) kelas VIII di Jogjakarta dalam matematika melalui pembelajaran generatif dengan pembelajaran konvensional. Namun jika dilihat peningkatan kemampuan berfikir kreatifnya, hasil penelitian menunjukkan bahwa kualitas kemampuan berfikir kreatif masih berada pada level rendah. Rendahnya kualitas berfikir kreatif diakibatkan belum optimalnya pencapaian pada indikator fleksibilitas (Purwaningrum, 2012; dan Huda, 2014), dan kebaruan (Purwaningrum, 2012). Selain itu, dalam penelitian Purwaningrum (2012) ditemukan bahwa siswa memerlukan waktu yang relatif lama dalam menemukan atau memunculkan ide/gagasannya. Dengan demikian kemampuan berfikir kreatif siswa sekolah, khususnya dalam mata pelajaran matematika masih belum mencapai hasil yang diharapkan.
Untuk mengembangkan kemampuan berfikir kreatif, Fasko (2000 – 2001) memberikan empat cara agar orang mempunyai kemampuan berfikir kreatif, yakni harus sanggup dan siap untuk berfikir kreatif, memahami topik kreativitas, menggunakan probadi dan standar tehnik berfikir kreatif, serta dapat menagktualisasi diri. Untuk itulah proses pembelajaran di sekolah akan mampu mengembangkan atau meningkatkan kemampuan berfikir kreatif apabila lingkungan belajar memuat kegiatan-kegiatan empat hal di atas. Dalam pembelajaran matematika sekolah, pendapat Fasko tersebut sejalan dengan Sumarmo (2006) bahwa secara umum berfikir matematik berkaitan erat dengan pelaksanaan kegiatan atau proses matematika (doing math) atau tugas matematik (mathematical task). Ditinjau dari kedalamannya, kegiatan berfikir matematik dibagi menjadi dua bagian, yakni berfikir matematik tingkat rendah (low order thinking) dan berfikir matematik tingkat tinggi (high order thinking). Dengan demikian, lingkungan dalam hal ini kegiatan belajar mengajar memberi peran yang besar terhadap peningkatan kemampuan berfikir kreatif siswa.
Dalam memilih model atau strategi pembelajaran, Kementrian Pendidikan dan Kebudayaan melalui Kurikulum sekolah 2013 telah menetapkan pendekatan saintifik dan tiga model pembelajaran untuk digunakan guru dalam proses pembelajaran. Ketiga model pembelajaran tersebut adalah model problem based learning, model discovery learning, dan model project based learning. Penetapan ketiga model tersebut setelah dilakukan analisis dan sintesis bahwa ketiganya memuat kegiatan-kegiatan mengamati, menanya, mengumpulkan informasi, menyimpulkan, serta mengkomunikasikan, yang merupakan unsur-unsur pembangun pendekatan saintifik. Menarik untuk mengkaji kontribusi model problem based learning dan model discovery learning terhadap kemampuan berfikir kreatif siswa dalam pembelajaran matematika.
Pemilihan model problem based learning dalam meningkatkan kemampuan berfikir kreatif siswa sesuai dengan rekomendasi dari Sumarmo (2005) bahwa pembelajaran matematika yang mendorong berfikir kreatif dan berfikir tingkat tinggi lainnya antara lain dapat dilakukan melalui kegiatan belajar dalam kelompok kecil, menyajikan tugas non rutin, dan tugas yang menuntut strategi kognitif dan metakognitif siswa. Hal yang sama dikemukakan oleh Trianto (2007) bahwa problem based learning merupakan model yang
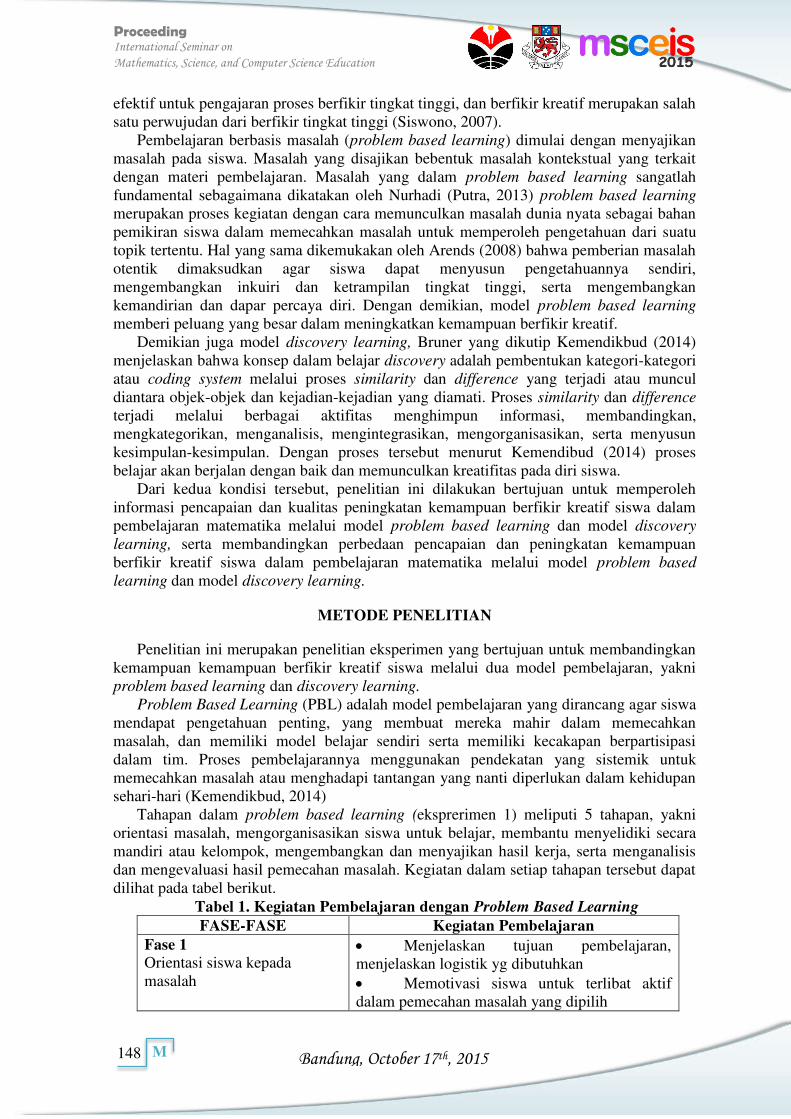
Bandung, October 17th, 2015
Proceeding International Seminar on
Mathematics, Science, and Computer Science Education
148
M
efektif untuk pengajaran proses berfikir tingkat tinggi, dan berfikir kreatif merupakan salah satu perwujudan dari berfikir tingkat tinggi (Siswono, 2007).
Pembelajaran berbasis masalah (problem based learning) dimulai dengan menyajikan masalah pada siswa. Masalah yang disajikan bebentuk masalah kontekstual yang terkait dengan materi pembelajaran. Masalah yang dalam problem based learning sangatlah fundamental sebagaimana dikatakan oleh Nurhadi (Putra, 2013) problem based learning merupakan proses kegiatan dengan cara memunculkan masalah dunia nyata sebagai bahan pemikiran siswa dalam memecahkan masalah untuk memperoleh pengetahuan dari suatu topik tertentu. Hal yang sama dikemukakan oleh Arends (2008) bahwa pemberian masalah otentik dimaksudkan agar siswa dapat menyusun pengetahuannya sendiri, mengembangkan inkuiri dan ketrampilan tingkat tinggi, serta mengembangkan kemandirian dan dapar percaya diri. Dengan demikian, model problem based learning memberi peluang yang besar dalam meningkatkan kemampuan berfikir kreatif.
Demikian juga model discovery learning, Bruner yang dikutip Kemendikbud (2014) menjelaskan bahwa konsep dalam belajar discovery adalah pembentukan kategori-kategori atau coding system melalui proses similarity dan difference yang terjadi atau muncul diantara objek-objek dan kejadian-kejadian yang diamati. Proses similarity dan difference terjadi melalui berbagai aktifitas menghimpun informasi, membandingkan, mengkategorikan, menganalisis, mengintegrasikan, mengorganisasikan, serta menyusun kesimpulan-kesimpulan. Dengan proses tersebut menurut Kemendibud (2014) proses belajar akan berjalan dengan baik dan memunculkan kreatifitas pada diri siswa.
Dari kedua kondisi tersebut, penelitian ini dilakukan bertujuan untuk memperoleh informasi pencapaian dan kualitas peningkatan kemampuan berfikir kreatif siswa dalam pembelajaran matematika melalui model problem based learning dan model discovery
learning, serta membandingkan perbedaan pencapaian dan peningkatan kemampuan berfikir kreatif siswa dalam pembelajaran matematika melalui model problem based
learning dan model discovery learning.
METODE PENELITIAN
Penelitian ini merupakan penelitian eksperimen yang bertujuan untuk membandingkan kemampuan kemampuan berfikir kreatif siswa melalui dua model pembelajaran, yakni problem based learning dan discovery learning.
Problem Based Learning (PBL) adalah model pembelajaran yang dirancang agar siswa mendapat pengetahuan penting, yang membuat mereka mahir dalam memecahkan masalah, dan memiliki model belajar sendiri serta memiliki kecakapan berpartisipasi dalam tim. Proses pembelajarannya menggunakan pendekatan yang sistemik untuk memecahkan masalah atau menghadapi tantangan yang nanti diperlukan dalam kehidupan sehari-hari (Kemendikbud, 2014)
Tahapan dalam problem based learning (eksprerimen 1) meliputi 5 tahapan, yakni orientasi masalah, mengorganisasikan siswa untuk belajar, membantu menyelidiki secara mandiri atau kelompok, mengembangkan dan menyajikan hasil kerja, serta menganalisis dan mengevaluasi hasil pemecahan masalah. Kegiatan dalam setiap tahapan tersebut dapat dilihat pada tabel berikut.
Tabel 1. Kegiatan Pembelajaran dengan Problem Based Learning
FASE-FASE Kegiatan Pembelajaran Fase 1 Orientasi siswa kepada masalah
Menjelaskan tujuan pembelajaran, menjelaskan logistik yg dibutuhkan Memotivasi siswa untuk terlibat aktif dalam pemecahan masalah yang dipilih
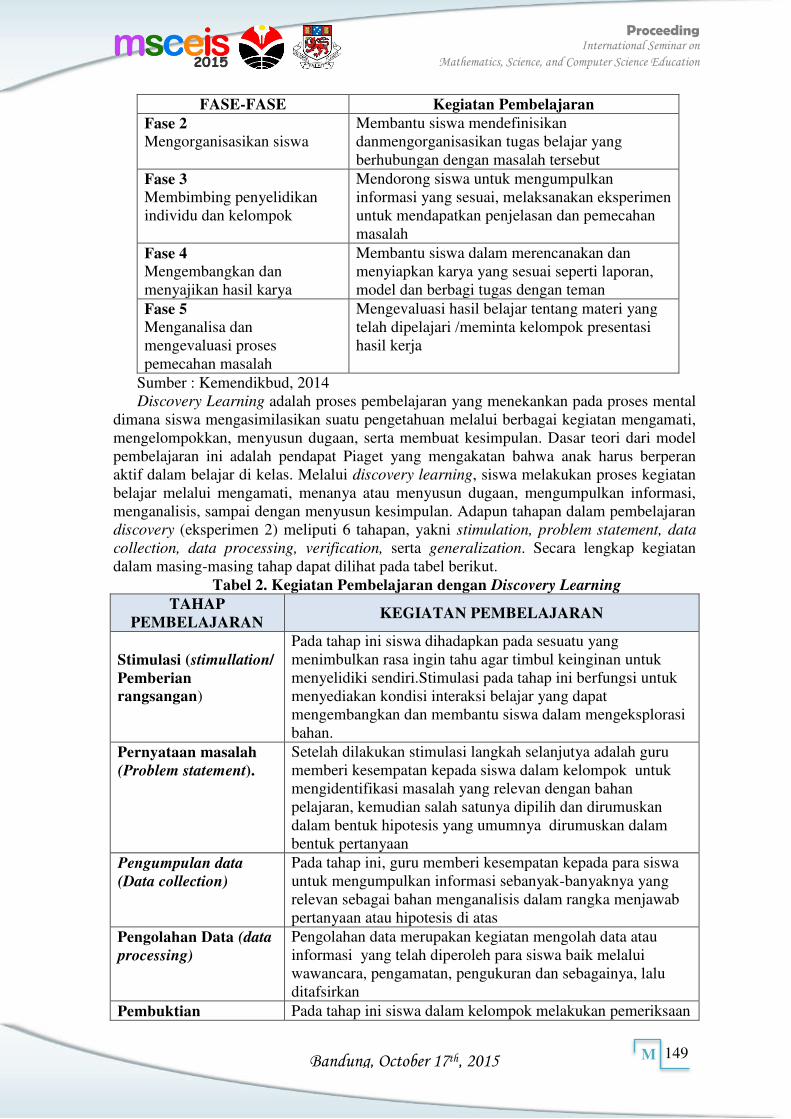
Bandung, October 17th, 2015
Proceeding International Seminar on
Mathematics, Science, and Computer Science Education
149
M
FASE-FASE Kegiatan Pembelajaran Fase 2 Mengorganisasikan siswa
Membantu siswa mendefinisikan danmengorganisasikan tugas belajar yang berhubungan dengan masalah tersebut
Fase 3 Membimbing penyelidikan individu dan kelompok
Mendorong siswa untuk mengumpulkan informasi yang sesuai, melaksanakan eksperimen untuk mendapatkan penjelasan dan pemecahan masalah
Fase 4 Mengembangkan dan menyajikan hasil karya
Membantu siswa dalam merencanakan dan menyiapkan karya yang sesuai seperti laporan, model dan berbagi tugas dengan teman
Fase 5 Menganalisa dan mengevaluasi proses pemecahan masalah
Mengevaluasi hasil belajar tentang materi yang telah dipelajari /meminta kelompok presentasi hasil kerja
Sumber : Kemendikbud, 2014 Discovery Learning adalah proses pembelajaran yang menekankan pada proses mental
dimana siswa mengasimilasikan suatu pengetahuan melalui berbagai kegiatan mengamati, mengelompokkan, menyusun dugaan, serta membuat kesimpulan. Dasar teori dari model pembelajaran ini adalah pendapat Piaget yang mengakatan bahwa anak harus berperan aktif dalam belajar di kelas. Melalui discovery learning, siswa melakukan proses kegiatan belajar melalui mengamati, menanya atau menyusun dugaan, mengumpulkan informasi, menganalisis, sampai dengan menyusun kesimpulan. Adapun tahapan dalam pembelajaran
discovery (eksperimen 2) meliputi 6 tahapan, yakni stimulation, problem statement, data
collection, data processing, verification, serta generalization. Secara lengkap kegiatan dalam masing-masing tahap dapat dilihat pada tabel berikut.
Tabel 2. Kegiatan Pembelajaran dengan Discovery Learning
TAHAP PEMBELAJARAN
KEGIATAN PEMBELAJARAN
Stimulasi (stimullation/ Pemberian rangsangan)
Pada tahap ini siswa dihadapkan pada sesuatu yang menimbulkan rasa ingin tahu agar timbul keinginan untuk menyelidiki sendiri.Stimulasi pada tahap ini berfungsi untuk menyediakan kondisi interaksi belajar yang dapat mengembangkan dan membantu siswa dalam mengeksplorasi bahan.
Pernyataan masalah
(Problem statement). Setelah dilakukan stimulasi langkah selanjutya adalah guru memberi kesempatan kepada siswa dalam kelompok untuk mengidentifikasi masalah yang relevan dengan bahan pelajaran, kemudian salah satunya dipilih dan dirumuskan dalam bentuk hipotesis yang umumnya dirumuskan dalam bentuk pertanyaan
Pengumpulan data
(Data collection)
Pada tahap ini, guru memberi kesempatan kepada para siswa untuk mengumpulkan informasi sebanyak-banyaknya yang relevan sebagai bahan menganalisis dalam rangka menjawab pertanyaan atau hipotesis di atas
Pengolahan Data (data
processing) Pengolahan data merupakan kegiatan mengolah data atau informasi yang telah diperoleh para siswa baik melalui wawancara, pengamatan, pengukuran dan sebagainya, lalu ditafsirkan
Pembuktian Pada tahap ini siswa dalam kelompok melakukan pemeriksaan
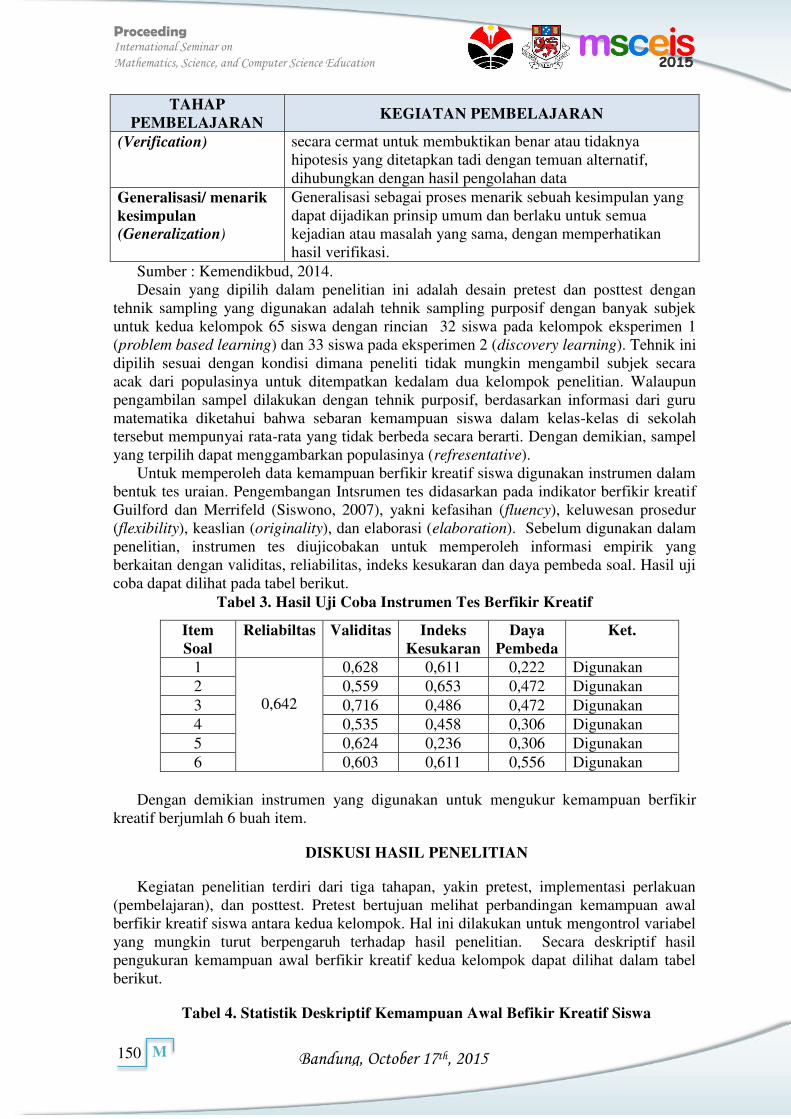
Bandung, October 17th, 2015
Proceeding International Seminar on
Mathematics, Science, and Computer Science Education
150
M
TAHAP PEMBELAJARAN
KEGIATAN PEMBELAJARAN
(Verification) secara cermat untuk membuktikan benar atau tidaknya hipotesis yang ditetapkan tadi dengan temuan alternatif, dihubungkan dengan hasil pengolahan data
Generalisasi/ menarik kesimpulan
(Generalization)
Generalisasi sebagai proses menarik sebuah kesimpulan yang dapat dijadikan prinsip umum dan berlaku untuk semua kejadian atau masalah yang sama, dengan memperhatikan hasil verifikasi.
Sumber : Kemendikbud, 2014. Desain yang dipilih dalam penelitian ini adalah desain pretest dan posttest dengan
tehnik sampling yang digunakan adalah tehnik sampling purposif dengan banyak subjek untuk kedua kelompok 65 siswa dengan rincian 32 siswa pada kelompok eksperimen 1 (problem based learning) dan 33 siswa pada eksperimen 2 (discovery learning). Tehnik ini dipilih sesuai dengan kondisi dimana peneliti tidak mungkin mengambil subjek secara acak dari populasinya untuk ditempatkan kedalam dua kelompok penelitian. Walaupun pengambilan sampel dilakukan dengan tehnik purposif, berdasarkan informasi dari guru matematika diketahui bahwa sebaran kemampuan siswa dalam kelas-kelas di sekolah tersebut mempunyai rata-rata yang tidak berbeda secara berarti. Dengan demikian, sampel yang terpilih dapat menggambarkan populasinya (refresentative).
Untuk memperoleh data kemampuan berfikir kreatif siswa digunakan instrumen dalam bentuk tes uraian. Pengembangan Intsrumen tes didasarkan pada indikator berfikir kreatif Guilford dan Merrifeld (Siswono, 2007), yakni kefasihan (fluency), keluwesan prosedur (flexibility), keaslian (originality), dan elaborasi (elaboration). Sebelum digunakan dalam penelitian, instrumen tes diujicobakan untuk memperoleh informasi empirik yang berkaitan dengan validitas, reliabilitas, indeks kesukaran dan daya pembeda soal. Hasil uji coba dapat dilihat pada tabel berikut.
Tabel 3. Hasil Uji Coba Instrumen Tes Berfikir Kreatif
Item Soal
Reliabiltas Validitas Indeks Kesukaran
Daya Pembeda
Ket.
1
0,642
0,628 0,611 0,222 Digunakan 2 0,559 0,653 0,472 Digunakan 3 0,716 0,486 0,472 Digunakan 4 0,535 0,458 0,306 Digunakan 5 0,624 0,236 0,306 Digunakan 6 0,603 0,611 0,556 Digunakan
Dengan demikian instrumen yang digunakan untuk mengukur kemampuan berfikir
kreatif berjumlah 6 buah item.
DISKUSI HASIL PENELITIAN
Kegiatan penelitian terdiri dari tiga tahapan, yakin pretest, implementasi perlakuan (pembelajaran), dan posttest. Pretest bertujuan melihat perbandingan kemampuan awal berfikir kreatif siswa antara kedua kelompok. Hal ini dilakukan untuk mengontrol variabel yang mungkin turut berpengaruh terhadap hasil penelitian. Secara deskriptif hasil pengukuran kemampuan awal berfikir kreatif kedua kelompok dapat dilihat dalam tabel berikut.
Tabel 4. Statistik Deskriptif Kemampuan Awal Befikir Kreatif Siswa
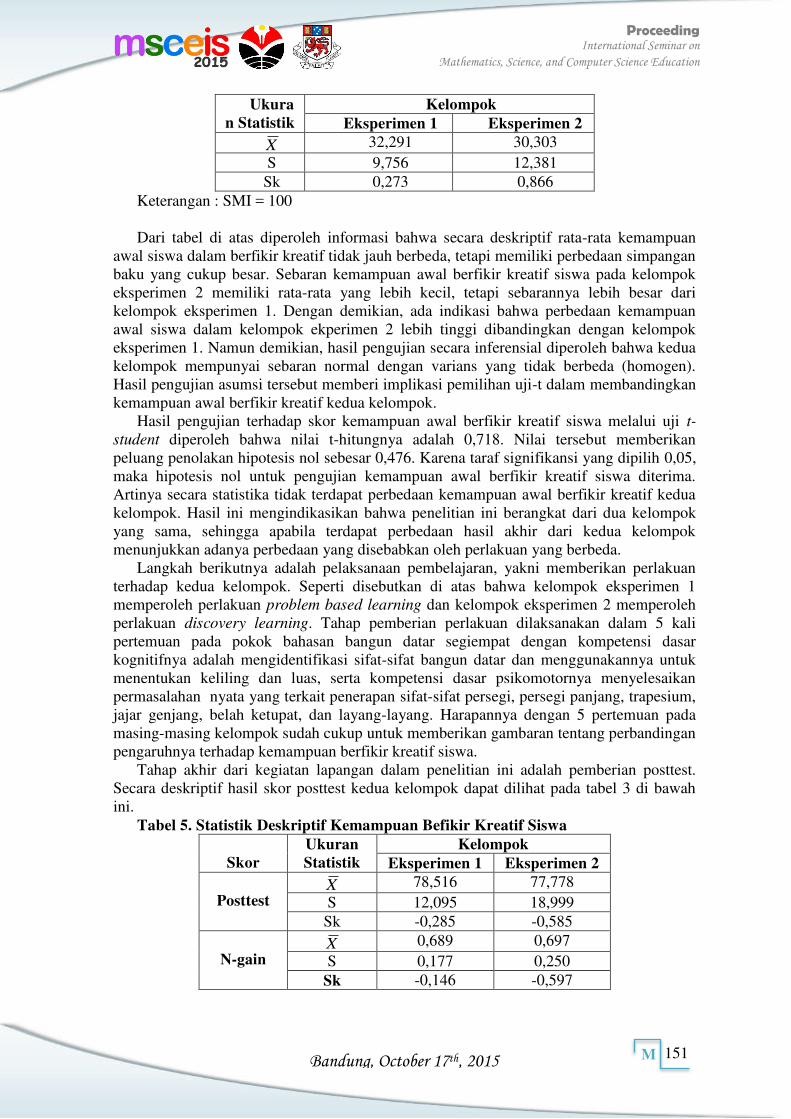
Bandung, October 17th, 2015
Proceeding International Seminar on
Mathematics, Science, and Computer Science Education
151
M
Ukuran Statistik
Kelompok
Eksperimen 1 Eksperimen 2
X 32,291 30,303 S 9,756 12,381 Sk 0,273 0,866
Keterangan : SMI = 100 Dari tabel di atas diperoleh informasi bahwa secara deskriptif rata-rata kemampuan
awal siswa dalam berfikir kreatif tidak jauh berbeda, tetapi memiliki perbedaan simpangan baku yang cukup besar. Sebaran kemampuan awal berfikir kreatif siswa pada kelompok eksperimen 2 memiliki rata-rata yang lebih kecil, tetapi sebarannya lebih besar dari kelompok eksperimen 1. Dengan demikian, ada indikasi bahwa perbedaan kemampuan awal siswa dalam kelompok ekperimen 2 lebih tinggi dibandingkan dengan kelompok eksperimen 1. Namun demikian, hasil pengujian secara inferensial diperoleh bahwa kedua kelompok mempunyai sebaran normal dengan varians yang tidak berbeda (homogen). Hasil pengujian asumsi tersebut memberi implikasi pemilihan uji-t dalam membandingkan kemampuan awal berfikir kreatif kedua kelompok.
Hasil pengujian terhadap skor kemampuan awal berfikir kreatif siswa melalui uji t-
student diperoleh bahwa nilai t-hitungnya adalah 0,718. Nilai tersebut memberikan peluang penolakan hipotesis nol sebesar 0,476. Karena taraf signifikansi yang dipilih 0,05, maka hipotesis nol untuk pengujian kemampuan awal berfikir kreatif siswa diterima. Artinya secara statistika tidak terdapat perbedaan kemampuan awal berfikir kreatif kedua kelompok. Hasil ini mengindikasikan bahwa penelitian ini berangkat dari dua kelompok yang sama, sehingga apabila terdapat perbedaan hasil akhir dari kedua kelompok menunjukkan adanya perbedaan yang disebabkan oleh perlakuan yang berbeda.
Langkah berikutnya adalah pelaksanaan pembelajaran, yakni memberikan perlakuan terhadap kedua kelompok. Seperti disebutkan di atas bahwa kelompok eksperimen 1 memperoleh perlakuan problem based learning dan kelompok eksperimen 2 memperoleh perlakuan discovery learning. Tahap pemberian perlakuan dilaksanakan dalam 5 kali pertemuan pada pokok bahasan bangun datar segiempat dengan kompetensi dasar kognitifnya adalah mengidentifikasi sifat-sifat bangun datar dan menggunakannya untuk menentukan keliling dan luas, serta kompetensi dasar psikomotornya menyelesaikan permasalahan nyata yang terkait penerapan sifat-sifat persegi, persegi panjang, trapesium, jajar genjang, belah ketupat, dan layang-layang. Harapannya dengan 5 pertemuan pada masing-masing kelompok sudah cukup untuk memberikan gambaran tentang perbandingan pengaruhnya terhadap kemampuan berfikir kreatif siswa.
Tahap akhir dari kegiatan lapangan dalam penelitian ini adalah pemberian posttest. Secara deskriptif hasil skor posttest kedua kelompok dapat dilihat pada tabel 3 di bawah ini.
Tabel 5. Statistik Deskriptif Kemampuan Befikir Kreatif Siswa Skor
Ukuran Statistik
Kelompok
Eksperimen 1 Eksperimen 2
Posttest
X 78,516 77,778 S 12,095 18,999
Sk -0,285 -0,585
N-gain X 0,689 0,697 S 0,177 0,250
Sk -0,146 -0,597
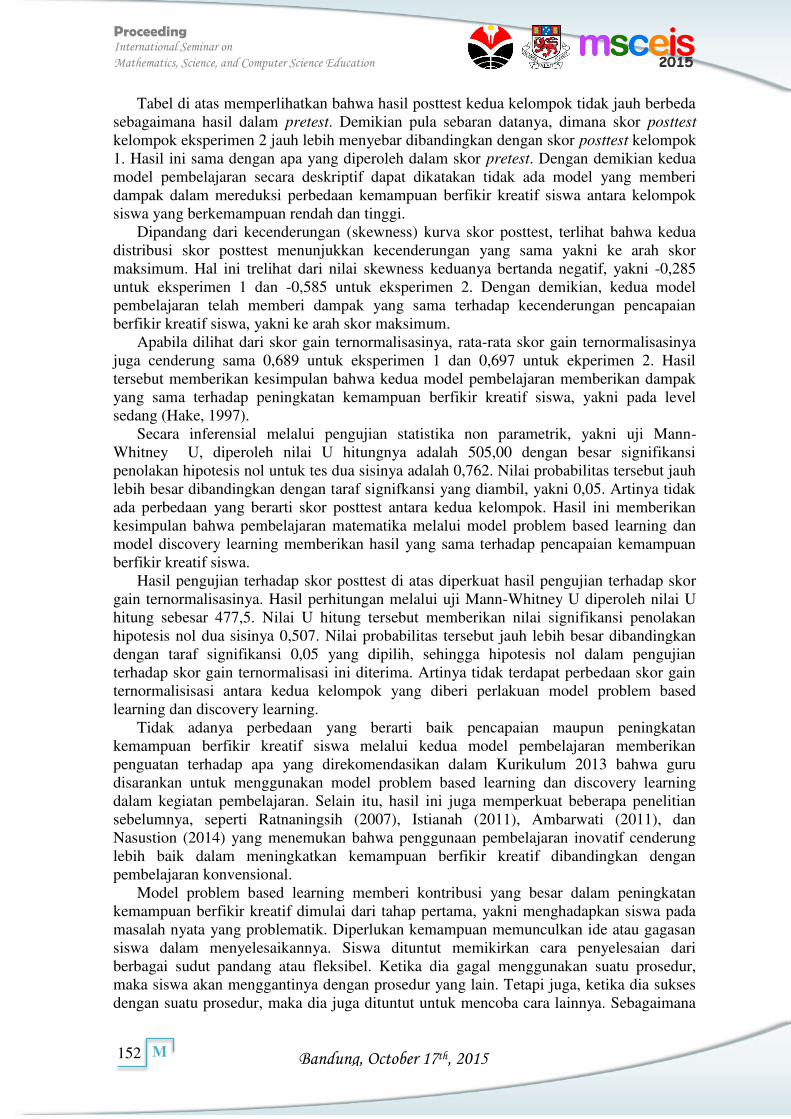
Bandung, October 17th, 2015
Proceeding International Seminar on
Mathematics, Science, and Computer Science Education
152
M
Tabel di atas memperlihatkan bahwa hasil posttest kedua kelompok tidak jauh berbeda sebagaimana hasil dalam pretest. Demikian pula sebaran datanya, dimana skor posttest kelompok eksperimen 2 jauh lebih menyebar dibandingkan dengan skor posttest kelompok 1. Hasil ini sama dengan apa yang diperoleh dalam skor pretest. Dengan demikian kedua model pembelajaran secara deskriptif dapat dikatakan tidak ada model yang memberi dampak dalam mereduksi perbedaan kemampuan berfikir kreatif siswa antara kelompok siswa yang berkemampuan rendah dan tinggi.
Dipandang dari kecenderungan (skewness) kurva skor posttest, terlihat bahwa kedua distribusi skor posttest menunjukkan kecenderungan yang sama yakni ke arah skor maksimum. Hal ini trelihat dari nilai skewness keduanya bertanda negatif, yakni -0,285 untuk eksperimen 1 dan -0,585 untuk eksperimen 2. Dengan demikian, kedua model pembelajaran telah memberi dampak yang sama terhadap kecenderungan pencapaian berfikir kreatif siswa, yakni ke arah skor maksimum.
Apabila dilihat dari skor gain ternormalisasinya, rata-rata skor gain ternormalisasinya juga cenderung sama 0,689 untuk eksperimen 1 dan 0,697 untuk ekperimen 2. Hasil tersebut memberikan kesimpulan bahwa kedua model pembelajaran memberikan dampak yang sama terhadap peningkatan kemampuan berfikir kreatif siswa, yakni pada level sedang (Hake, 1997).
Secara inferensial melalui pengujian statistika non parametrik, yakni uji Mann-Whitney U, diperoleh nilai U hitungnya adalah 505,00 dengan besar signifikansi penolakan hipotesis nol untuk tes dua sisinya adalah 0,762. Nilai probabilitas tersebut jauh lebih besar dibandingkan dengan taraf signifkansi yang diambil, yakni 0,05. Artinya tidak ada perbedaan yang berarti skor posttest antara kedua kelompok. Hasil ini memberikan kesimpulan bahwa pembelajaran matematika melalui model problem based learning dan model discovery learning memberikan hasil yang sama terhadap pencapaian kemampuan berfikir kreatif siswa.
Hasil pengujian terhadap skor posttest di atas diperkuat hasil pengujian terhadap skor gain ternormalisasinya. Hasil perhitungan melalui uji Mann-Whitney U diperoleh nilai U hitung sebesar 477,5. Nilai U hitung tersebut memberikan nilai signifikansi penolakan hipotesis nol dua sisinya 0,507. Nilai probabilitas tersebut jauh lebih besar dibandingkan dengan taraf signifikansi 0,05 yang dipilih, sehingga hipotesis nol dalam pengujian terhadap skor gain ternormalisasi ini diterima. Artinya tidak terdapat perbedaan skor gain ternormalisisasi antara kedua kelompok yang diberi perlakuan model problem based learning dan discovery learning.
Tidak adanya perbedaan yang berarti baik pencapaian maupun peningkatan kemampuan berfikir kreatif siswa melalui kedua model pembelajaran memberikan penguatan terhadap apa yang direkomendasikan dalam Kurikulum 2013 bahwa guru disarankan untuk menggunakan model problem based learning dan discovery learning dalam kegiatan pembelajaran. Selain itu, hasil ini juga memperkuat beberapa penelitian sebelumnya, seperti Ratnaningsih (2007), Istianah (2011), Ambarwati (2011), dan Nasustion (2014) yang menemukan bahwa penggunaan pembelajaran inovatif cenderung lebih baik dalam meningkatkan kemampuan berfikir kreatif dibandingkan dengan pembelajaran konvensional.
Model problem based learning memberi kontribusi yang besar dalam peningkatan kemampuan berfikir kreatif dimulai dari tahap pertama, yakni menghadapkan siswa pada masalah nyata yang problematik. Diperlukan kemampuan memunculkan ide atau gagasan siswa dalam menyelesaikannya. Siswa dituntut memikirkan cara penyelesaian dari berbagai sudut pandang atau fleksibel. Ketika dia gagal menggunakan suatu prosedur, maka siswa akan menggantinya dengan prosedur yang lain. Tetapi juga, ketika dia sukses dengan suatu prosedur, maka dia juga dituntut untuk mencoba cara lainnya. Sebagaimana
Bandung, October 17th, 2015
Proceeding International Seminar on
Mathematics, Science, and Computer Science Education
153
M
yang dikemukakan oleh Budi (2003) bahwa tahap memeriksa hasil sebuah solusi tidak hanya melihat apakah jawaban yang telah diperoleh itu benar atau salah, tetapi juga mendorong siswa untuk mengembangkan cara lain yang berbeda dalam menyelesaikan masalah yang telah diselesaikannya.
Kemampuan fleksibilitas juga terbentuk ketika siswa berada pada tahap menyajikan hasil karya. Ketika tahap ini berlangsung, siswa akan memperoleh infomasi keseluruhan solusi yang ditemukan masing-masing kelompok. Apabila cara penyelesaian kelompok lain sama dengan kelompoknya, ini memberikan penguatan pada dirinya. Apabila cara penyelesaian kelompok lain berbeda dengan cara yang digunakan dalam kelompoknya, maka ini memberi informasi bahwa cara penyelesaian masalah tersebut ternyata beragam. Akhirnya diperoleh pengetahuan pada diri siswa bahwa ada cara berbeda yang dapat digunakan dalam menyelesaikan suatu masalah. Dengan demikian, akan terbentuk kemampuan procedural fluency pada diri siswa yang akan berguna ketika mereka dihadapkan pada penyelesaian masalah di masa yang akan datang secara efektif dan efisien. Sebagaimana dikemukakan oleh Kilpatric, Swafford, dan Findell (2001) bahwa kelancaran prosedur berkaitan dengan pengetahuan prosedur atau algortima, pengetahuan yang berkaitan dengan kapan dan bagaimana menggunakan secara tepat, dan keterampilan dalam keluwesan, keakuratan, serta keefesienannya.
Temuan di atas memperkuat hasil penelitian Ashari (2014) bahwa pengajuan masalah sehari-hari dalam pembelajaran berbasis masalah memberikan dampak adanya rasa senang pada diri siswa dalam belajar matematika, mereka mampu merumuskan sendiri aturan atau sifat-sifat suatu konsep melalui proses kolaborasi antar anggota kelompok, serta mampu mempresentasikan hasil temuannya pada diskusi antar kelompok.
Hasil ini juga memperkuat argumentasi Delisle (Abidin, 2014) bahwa implementasi problem based learning memberikan banyak keuntungan, yakni pembelajaran akan bermakna. Kebermaknaan diperoleh melalui proses kegiatan siswa memecahkan masalah sehingga dapat menerapkan pengetahuan yang dimilikinya. Siswa akan mengintegrasikan pengetahuan dan keterampilan secara simultan, serta mengaplikasikannya dalam konteks yang relevan. Siswa akan mempunyai inisiatif sendiri dalam bekerja, memilih suatu prosedur, serta mengembangkan hubungan interpersonal dalam kerja kelompok.
Pada sisi lain, Model discovery learning memberi banyak kontribusi dalam kemampuan berfikir kreatif siswa pada tahap pengajuan pertanyaan terhadap situasi yang diberikan. Misalkan siswa dihadapkan pada berbagai benda yang salah satu permukaanya persegi, misalnya ubin, kertas, dinding, kain, kebun, dan lain sebagainya. Siswa diminta menyusun berbagai pertanyaan terkait unsur-unsur dalam persegi, hubungan antar unsur, atau lainnya. Melalui aktivitas ini, siswa akan berfikir secara elaboratif, memunculkan ide atau gagasan yang orisinil, luwes, serta fleksibel. Hal ini sebagaimana dikemukakan oleh Sund (Suryosubroto, 2009) bahwa discovery adalah proses mental (berfikir), dimana siswa mengasimilasi suatu konsep atau suatu prinsip. Proses mental tersebut dilalukan melalui proses mengamati, menggolongkan, membuat dugaan, menjelaskan, menggukur, membuat kesimpulan, dan sebagainya. Kegiatan-kegiatan tersebut berpotensi dalam mengembangkan kemampuan siswa untuk berfikir elaboratif, menemukan banyak ide atau gagasan baru, serta luwes dalam menggunakan suatu prosedur.
PENUTUP
Dari hasil penilitian ini diperoleh beberapa kesimpulan sebagai berikut: 1. Peningkatan kemampuan berfikir kreatif melalui pembelajaran model problem based
learning dan discovery learning pada pembelajaran matematika berada pada kualitas
Bandung, October 17th, 2015
Proceeding International Seminar on
Mathematics, Science, and Computer Science Education
154
M
sedang, dengan besar peningkatan keduanya adalah 0,689 pada pembelajaran problem
based learning dan 0,697 melalui pembelajaran discovery learning. 2. Tidak terdapat perbedaan yang berarti tingkat pencapaian kemampuan berfikir kreatif
siswa melalui kedua model pembelajara, problem based learning dan discovery
learning. 3. Tidak terdapat perbedaan yang berarti peningkatan kemampuan berfikir kreatif siswa
melalui kedua model pembelajaran, problem based learning dan discovery learning. Dari kesimpulan tersebut, maka dapat disusun rekomendasi sebagai berikut.
1. Kedua model pembelajaran, problem based learning dan discovery learning, sangat baik digunakan oleh guru dalam mengajar matematika, terutuama untuk meningkatkan kemampuan berfikir kreatif siswa.
2. Dalam mengimplementasikan problem based learning masalah pertama yang dihadapi oleh guru adalah pengembangan masalah nyata yang berkaitan dengan topik yang diajarkan. Untuk itu perlu upaya guru menambah wawasan dengan usaha mandiri, misalnya membaca buku, membuka internet, dan lain sebagainya. Kendala yang kedua adalah perlu adanya kesabaran guru dalam memberikan bimbingan pada siswa baik secara individu maupun kelompok. Ditemukan bahwa siswa seringkali mengalami kendala dalam memilih dan menetapkan prosedur penyelesaian suatu masalah. Untuk itu guru perlu memberikan banyak scaffolding sehingga memberi ruang berfikir pada siswa untuk memilih dan menetapkan prosedur yang akan digunakannya.
3. Dalam mengimplementasikan model discovery learning hambatan yang muncul adalah pengajuan masalah dari situasi yang diberikan oleh guru. Untuk itu, guru perlu memberikan motivasi pada siswa untuk berani mengajukan pertanyaan-petanyaan sebanyak-banyaknya. Selain itu, diperlukan kemampuan guru dalam memilih pertanyaan-pertanyaan yang diajukan oleh siswa atau diajukan sendiri sehingga menjadi alat bagi siswa untuk melakukan elaborasi dan investigasi dalam kegiatan pembelajaran.
4. Dalam penelitian ini, pencapaian dan peningkatan kemampuan berfikir kreatif pada kedua model pembelajaran belum optimal, yakni rata-rata pencapaian masih kurang dari 80 (skala 100), dan kualitas peningkatan dibawah 0,70. Untuk itu perlu dilakukan kajian lebih lanjut penyebab tidak optimalnya proses kegiatan melalui kedua model tersebut.
DAFTAR PUSTAKA
[1]. Abidin, Y. (2014). Desain sistem pembelajaran dalam konteks Kurikulum 2013. Bandung: Refika Aditama.
[2]. Ambarwati,D. (2011). Mengembangkan kemampuan berfikir kritis dan kreatif
melalui pendekatan pembelajaran langusng dan tak langsung. Tesis. Sekolah Pascasarjana Universitas Pendidikan Indonesia. (tidak diterbitkan).
[3]. Learning to teach (terjemahan). Yogyakarta: Pustaka Belajar. [4]. Pembelajaran berbasis masalah (PBM) untuk meningkatkan kemampuan analisis
dan evaluasi matematik siswa SMP. Tesis. Sekolah Pascasarjana Universitas Pendidikan Indonesia. (tidak diterbitkan).
[5]. Budhi, Wono S. (2003). Langkah awal menuju ke Olimpade Matematika. Jakarta : Rizky Grafis.
[6]. Fasko, D. Jr. (2000 - 2001). Education and creativity. Creativity Research Journal, Vol. 13. No. 3 & 4. Halaman 317 – 327. Tersedia: http://www.tandfonline.com. Oktober 2014.

Bandung, October 17th, 2015
Proceeding International Seminar on
Mathematics, Science, and Computer Science Education
155
M
[7]. Hake, R. (1997). Analyzing change/gain scores. Tersedia: http//www. Physics.indiana.edu. 19 Desember 2014.
[8]. Huda, U. (2014). Peningkatan kemampuan berfikir kreatif matematis dan habits of
thinking independently (HTI) siswa melalui pendekatan open-ended dengan setting
kooperatif. Tesis. Sekolah Pascasarjana Universitas Pendidikan Indonesia. (tidak diterbitkan).
[9]. Istianah, E. (2011). Meningkatkan kemampuan berfikir kritis dan kreatif matematik
dengan pendeketan model eliciting activities (MEAS) pada siswa SMA. Tesis. Sekolah Pascasarjana Universitas Pendidikan Indonesia. (tidak diterbitkan).
[10]. La Moma. (2014). Peningkatan berfikir kreatif matematis, self-efficacy dan soft
skills siswa SMP melalui pembelajaran Generatif. Disertasi. Sekolah Pascasarjana Universitas Pendidikan Indonesia. (tidak diterbitkan).
[11]. Kilpatric, J., Swafford, J., & Findell, B., (2001). Adding It Up. Helping children
learn Mathematics. USA : National Research Council. [12]. Kemendikbud. (2014). Materi pelatihan guru implementasi Kurikulum 2013.
Jakarta: Badan Pengembangan Sumber daya Manusia Pendidikan dan Kebudayaan dan Penjaminan Mutu Pendidikan.
[13]. Nasution, E.Y.P. (2014). Meningkatkan kemampuan disposisi berfikir kreatif siswa
melalui pendekatan open-ended. Tesis. Sekolah Pascasarjana Universitas Pendidikan Indonesia. (tidak diterbitkan).
[14]. Purwaningrum, J.P. (2012). Penerapan model Wallace untuk mengidentifikasi
proses berfikir kreatif dalam pengajuan masalah matematika peserta didik kelas
XII IPA SMA N 1 Kedungwuni materi pkok fungsi komposisi. Skripsi. Universitas Negeri Semarang. Tidak diterbitkan.
[15]. Putra, S. R. (2013). Desain belajar mengajar kreatif berbasis sains. Jogjakarta: Diva Press.
[16]. Ratnaningsih. (2007). Pengaruh pembelajaran kontekstual terhadap kemampuan
berfikir kritis dan kreatif matematik serta kemandirian belajar siswa Sekolah
Menengah Atas. Disertasi. Sekolah Pascasarjana Universitas Pendidikan Indonesia. (tidak diterbitkan).
[17]. Siswono, Y.T. (2007). Meningkatkan kemampuan berfikir kreatif melalui
pemecahan masalah tipe what’s another way. Tersedia: www://http.tatatgyes.wordpress.com/karay-tulis. 10 Oktober 2014.
[18]. Siswono, Y.T. (2008). Model pembelajaran matematika berbasis pengajuan dan pemecahan masalah untuk meningkatkan kemampuan berfikir kreatif. Surabaya: UNESA University Press.
[19]. Sumarmo, U. (2005). Pengembangan berfikir matematis tingkat tinggi siswa SLTP
dan SMU serta mahasiswa strata satu melalui berbagai pendekatan pembelajaran. Lemlit UPI. Laporan Penelitian.
Bandung, October 17th, 2015
Proceeding International Seminar on
Mathematics, Science, and Computer Science Education
156
M
MATH-07467
The Mathematics Game to Find The Value Of π
Warman
Teacher of State Junior High School 1 Gandusari Blitar, East Java, Indonesia
Article info Abstract
Keywords: Circle, polygon, exterior, interior, game, function.
Determining a value of π is very important in Mathematics. This paper is presented to find a value of π through Mathematics game. Actually, finding a value of π can be done through exterior and interior circle of polygon with trigonometry function. For example: 1. The number of Indonesian population is 245,348,763. So, the value
of is
π = 2453487630 sin
2. Budi was born on November 25th 1961. So, the value of π is
The main problem is that people often say the value of π is irrational. But they can’t show why it is irrational. While in the students’ case, they don’t know the value of π clearly. This paper is the writer’s discovery from some references discussing the materials about how to find the value of π through exterior and interior circle of polygon with trigonometry function.
Corresponding Author: SMPN 1 Gandusari, Blitar
INTRODUCTION
The material of circle is learned by students from Elementary School up to University. This material generally discusses about the circumference and the area of a circle which both contain the value of , that is the value of the ratio of the circumference divided by the diameter of a circle. The material aims to make the teaching and learning process attractive for students, and is explained through Mathematics game.
So far, to find the value of , students do experiment by measuring objects like
cylinder, cone, or sphere. Teacher generally explains directly that the value of π, is or
3.14, and that the value of is irrational, i.e. 3.141592654…., without explaining wherefrom they get the value of .
Those activities are all right. However, all teachers have to know that the value of is irrational. Then, where do we get 3.141592654 from? Based on this reason, the writer arranges paper on the research on the value of entitled “The Mathematics Game to Find the Value of π”.
DISCUSSION
a. Polygon Exterior Circle 1. The angles of the regular hexagon on a circle.
Let K = the perimeter of polygon r = the radius of a circle t = semi side of polygon
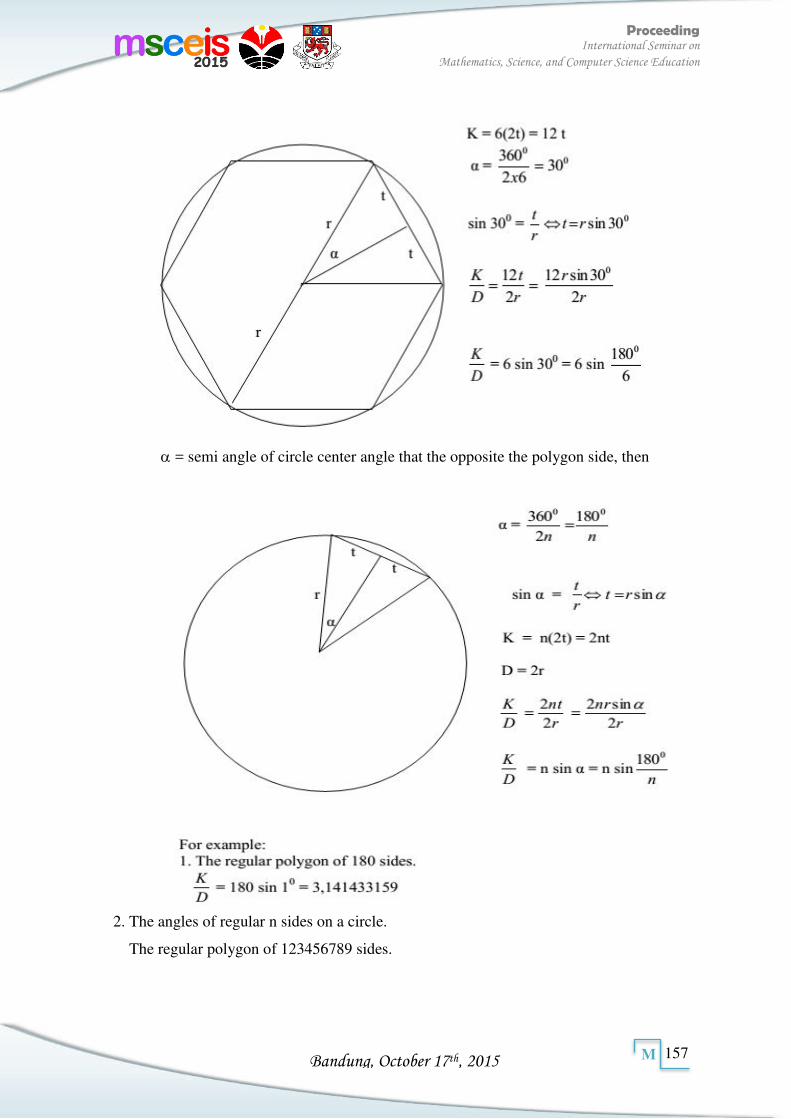
Bandung, October 17th, 2015
Proceeding International Seminar on
Mathematics, Science, and Computer Science Education
157
M
= semi angle of circle center angle that the opposite the polygon side, then
2. The angles of regular n sides on a circle.
The regular polygon of 123456789 sides.
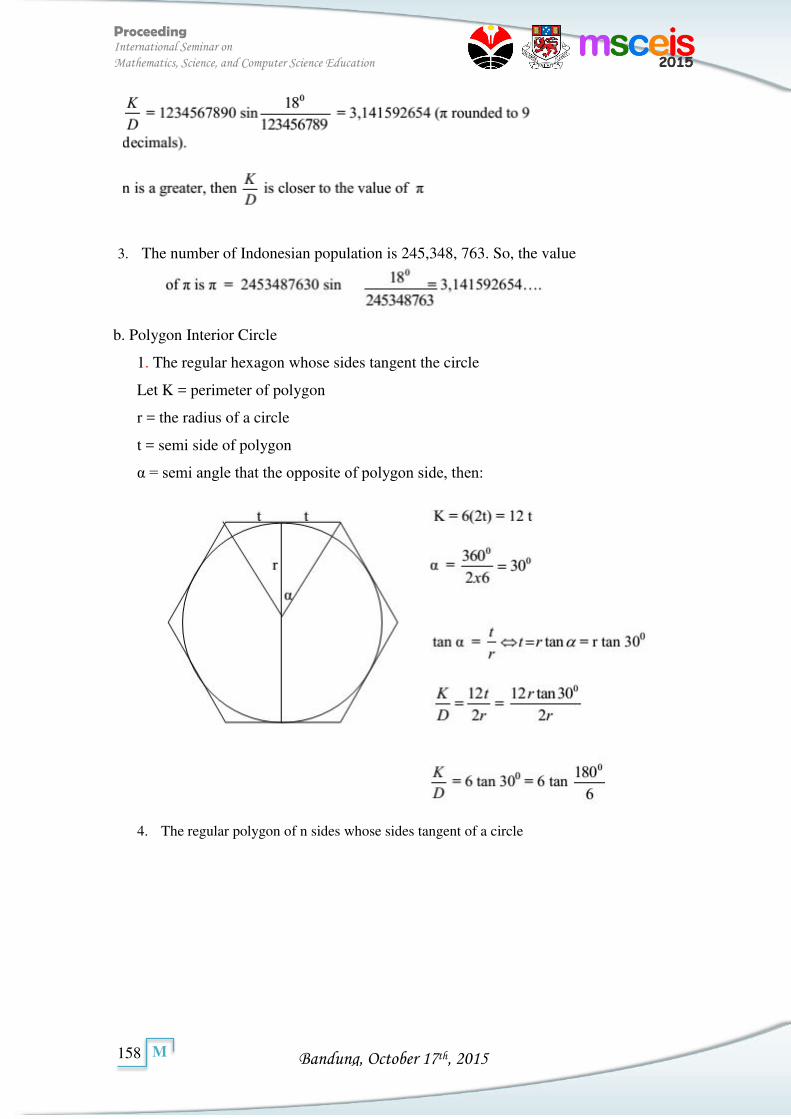
Bandung, October 17th, 2015
Proceeding International Seminar on
Mathematics, Science, and Computer Science Education
158
M
3. The number of Indonesian population is 245,348, 763. So, the value
b. Polygon Interior Circle
1. The regular hexagon whose sides tangent the circle
Let K = perimeter of polygon
r = the radius of a circle
t = semi side of polygon
α = semi angle that the opposite of polygon side, then:
4. The regular polygon of n sides whose sides tangent of a circle
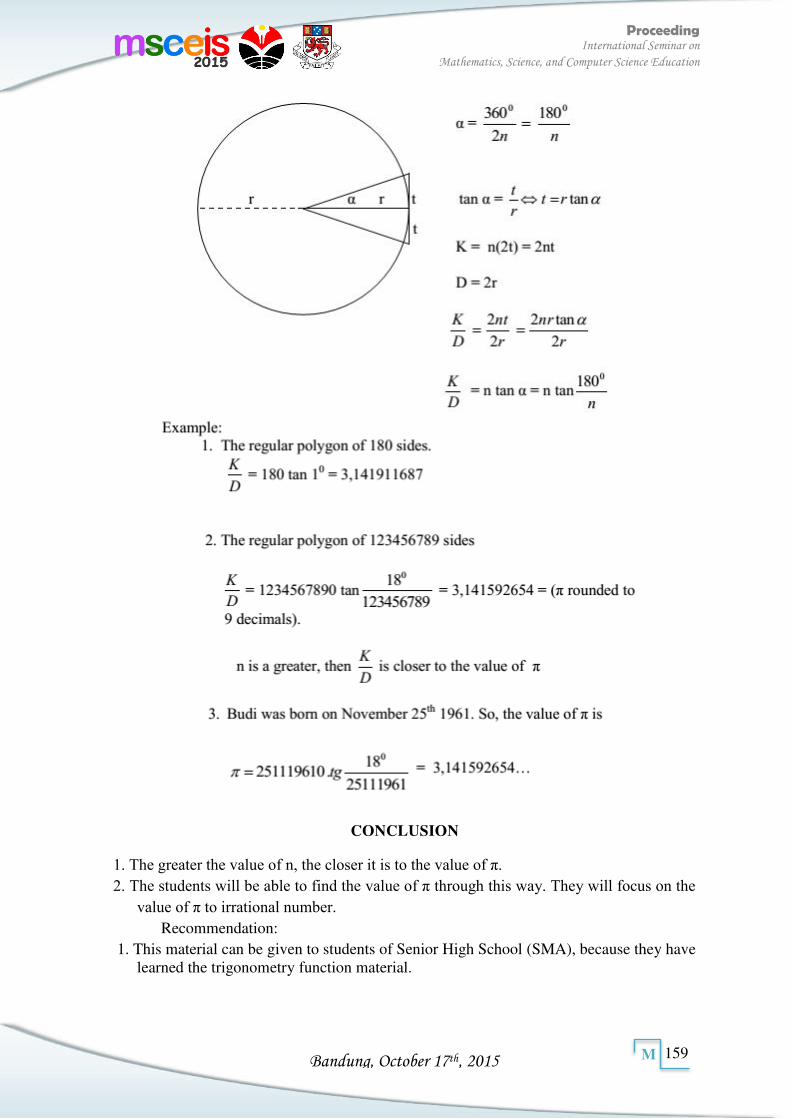
Bandung, October 17th, 2015
Proceeding International Seminar on
Mathematics, Science, and Computer Science Education
159
M
CONCLUSION
1. The greater the value of n, the closer it is to the value of π. 2. The students will be able to find the value of π through this way. They will focus on the
value of π to irrational number. Recommendation:
1. This material can be given to students of Senior High School (SMA), because they have learned the trigonometry function material.
Bandung, October 17th, 2015
Proceeding International Seminar on
Mathematics, Science, and Computer Science Education
160
M
2. If this material is presented to students of Junior High School (SMP), trigonometry function material should be presented in advance as the prerequisite, as it was 11 years ago when the 1994 Curriculum was applied.
REFERENCERS
Dewi Nurharini, dan Tri wahyuni, 2008. Matematika Konsep dan Aplikasinya. Jakarta: Balai Pustaka Departemen Pendidikan Nasional.
Harry Lewis, 1968. Geometry A Contemporary Course. New Jersey: D. Van Nostrand Company, Inc.
Tazudin, dkk. 2005. Matematika Kontekstual Kelas
Bandung, October 17th, 2015
Proceeding International Seminar on
Mathematics, Science, and Computer Science Education
161
M
MATH-07472
The Development of Learning Instrument with Missouri Mathematics Project Model (MMP) in Mathematics Subject at
Junior High School
Sri Rezekia, Mefa Indriatib, Andoko Ageng Setyawanc
a,b,c Lecturer in Mathematics Education Department FKIP UIR
Article info Abstract
Keywords: The Development of Learning Instrument, Missouri Mathematics Project.
The research aim is to develop the learning instrument in the form of RPP and Assessment of Knowledge and Attitude with Missouri Mathematics Project model (MMP) in quadrilateral subject at Junior High School. The samples of this research was students in grade VII1 and VII2 SMP Muhammadiyah 2 Pekanbaru. The type of this research is research development following the procedure of modification development of Sugiyono with two field tests. The research data were collected through validation sheet, observation sheet, and questionnaire. The collected data were analyzed descriptively. The validity of RPP and Assessment was based on the opinion of validator. The research result showed that this RPP of quadrilateral subject in grade VII had been valid and has the characteristic arranged based on stages of learning with MMP model containing motivation gymnastics and Do Mi Kado games. The level of effectiveness achieved on a range of cognitive assessment (17% - 82%) and the effectiveness of affective assessment range (70% - 96%). After revised, we obtain the final product of cognitive and affective assessment instrument in quadrilateral subject in grade VII Junior High School that tested its validity and effectivity.
Corresponding Author: Sri Rezeki, [email protected] Mefa Indriati, [email protected] Andoko Ageng Setyawan
INTRODUCTION
In view of curriculum 2013, learning activity is an education process providing an opportunity for students to develop all their potential become abilities that increase progressively from the aspect of attitude, knowledge, and skill. Therefore, the curriculum contains what should be taught to students, while learning is the way to how the material that is taught can be understood by students. This concepts are packed in RPP that must be developed by teachers either individually or in a group referring to syllabus.
There are not a few teachers who have difficulties in arranging RPP. With this difficulties, then one of various efforts done by them is copy paste from the RPP arranged at other schools. This is done with the aim to showed to the principal or school supervisors when it is asked (Kemendikbud, 2013: 12). Evaluation of learning outcomes, among others, using test to measure learning outcomes as learning achievement, in this case is the mastery of competency of each student. In the practice of learning, generally emphasize to the evaluation of both learning process and learning outcomes. Thus, both types of evaluation are very important components in learning system.
On cognitive and affective aspects, the reality on the field and from interview results with teachers of SMP Muhammadiyah 2 Pekanbaru and SMP Negeri 2 Perawang for cognitive aspect indicate that now assessment tools created by teachers still not measure cognitive abilities until the highest level of Taxonomy of Bloom, namely C4, C5, and C6 (based on analysis of books of students and teachers). While on the affective aspect, it is still not fully developed by teachers.

Bandung, October 17th, 2015
Proceeding International Seminar on
Mathematics, Science, and Computer Science Education
162
M
RESEARCH METHOD
Brog and Gall (Setyosari, 2013: 222) state that research development is a process used to develop and validate the research product. This research follows a step-by-step cyclically. Research step or development process consists of the study about the findings of the research product that will be developed, develop the product based on that findings, conduct the field test that suitable with the background from which the product is used and revise the field test.
The model used in this research is research development model includes the steps, namely problem potential, data collection, product design, design validity, design revision, limited test, product revision, large scale test, product revision, final product (Sugiyono, 2013: 409). Instrument used in data collection was a validation questionnaire as a draft evaluation of learning material LKS.
The subjects of this research was students in grade VII1 and VII2 SMP Muhammadiyah 2 Pekanbaru. The researchers develop RPP, cognitive and affective assessment tools that suitable with the demands of curriculum 2013.
RESULT AND DISCUSSION
The research were conducted in grade VII1 and VII2 SMP Muhammadiyah 2 Pekanbaru. RPP, cognitive and affective assessment tools are designed to be suitable with RPP using Missouri Mathematics Project model (MMP). This learning model have 5 steps, namely: (1) repetition (review); (2) development; (3) controlled exercise; (4) individual work; (5) assignment. Before the product is tested, the researchers conducted a validation to 4 lecturers and a teacher.
From the first until fourth meeting on RPP grade VII1, it is obtained that the average is 89,56 with very valid category and can be used without revision. The weakness in grade VII1 is set the time as efficiently as possible, give the students examples that they are familiar to do it, control the class and do not too noisy at the execution time of Do Mi Kado games in order not disturb the next class. Use the time as efficiently as possible, do not too long in controlled exercise and development activities, and do the steps ordered.
From the first until fourth meeting on RPP grade VII2, it is obtained that the average is 94,53 with very valid category and can be used without revision. The weakness in grade VII2 in research is the teacher can not bring the definition about perimeter evidently first, such that when the students are asked about perimeter, some of them answer it correctly on review activity, the teacher is still not give the well response to question given by students about the unit of measure and question that is not understood by students.
While for cognitive assessment, the following data is obtained: Table 1. Value of Effectiveness on Cognitive Assessment Grade VII1
Meeting
Problem Number of Students Completed
Value of Effectiveness
Category
II Individual Work 5 students 17% Ineffective III Individual Work 23 students 82% Very Effective
Quiz 17 students 60% Sufficient IV Individual Work 21 students 70% Effective
Quiz 9 students 30% Ineffective
Based on the result of cognitive assessment on grade VII1, the researchers revise the language, image on questions according to advice from observers. And also the students are still not familiar with contextual question. Next on grade VII2, the following data is obtained:
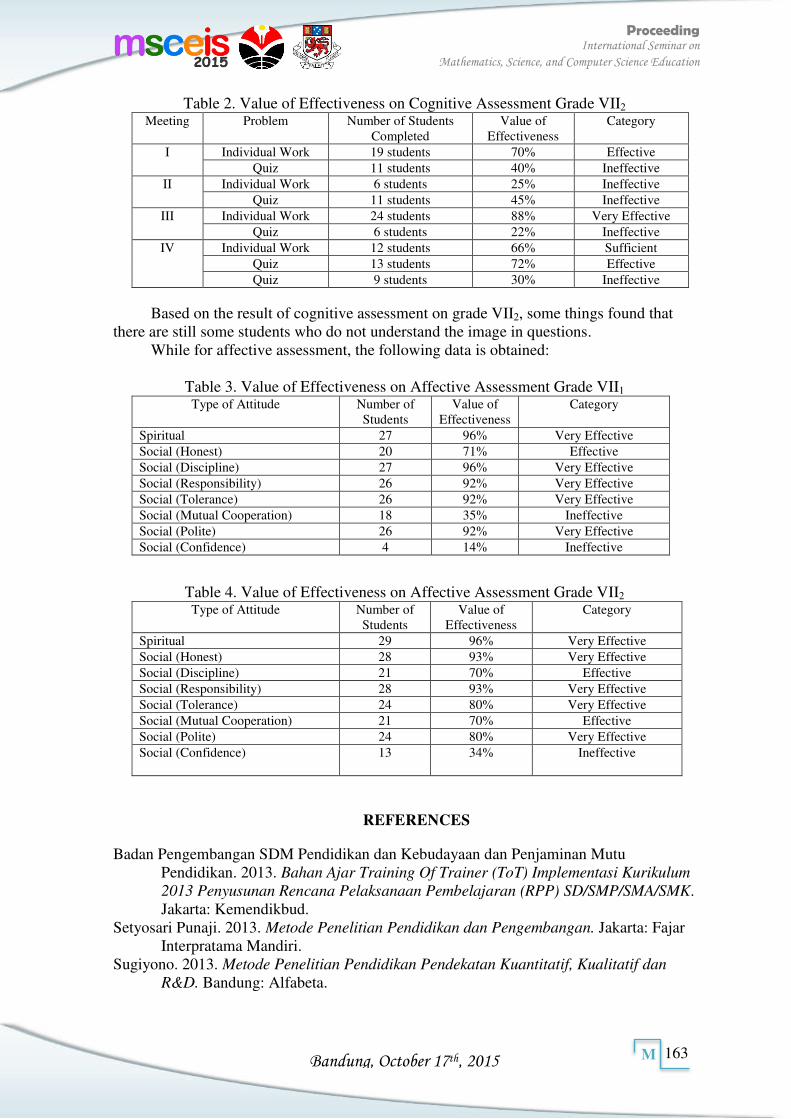
Bandung, October 17th, 2015
Proceeding International Seminar on
Mathematics, Science, and Computer Science Education
163
M
Table 2. Value of Effectiveness on Cognitive Assessment Grade VII2
Meeting
Problem Number of Students Completed
Value of Effectiveness
Category
I Individual Work 19 students 70% Effective Quiz 11 students 40% Ineffective
II Individual Work 6 students 25% Ineffective Quiz 11 students 45% Ineffective
III Individual Work 24 students 88% Very Effective Quiz 6 students 22% Ineffective
IV Individual Work 12 students 66% Sufficient Quiz 13 students 72% Effective Quiz 9 students 30% Ineffective
Based on the result of cognitive assessment on grade VII2, some things found that there are still some students who do not understand the image in questions.
While for affective assessment, the following data is obtained:
Table 3. Value of Effectiveness on Affective Assessment Grade VII1
Type of Attitude Number of Students
Value of Effectiveness
Category
Spiritual 27 96% Very Effective Social (Honest) 20 71% Effective Social (Discipline) 27 96% Very Effective Social (Responsibility) 26 92% Very Effective Social (Tolerance) 26 92% Very Effective Social (Mutual Cooperation) 18 35% Ineffective Social (Polite) 26 92% Very Effective Social (Confidence) 4 14% Ineffective
Table 4. Value of Effectiveness on Affective Assessment Grade VII2 Type of Attitude Number of
Students Value of
Effectiveness Category
Spiritual 29 96% Very Effective Social (Honest) 28 93% Very Effective Social (Discipline) 21 70% Effective Social (Responsibility) 28 93% Very Effective Social (Tolerance) 24 80% Very Effective Social (Mutual Cooperation) 21 70% Effective Social (Polite) 24 80% Very Effective Social (Confidence) 13
34% Ineffective
REFERENCES
Badan Pengembangan SDM Pendidikan dan Kebudayaan dan Penjaminan Mutu Pendidikan. 2013. Bahan Ajar Training Of Trainer (ToT) Implementasi Kurikulum
2013 Penyusunan Rencana Pelaksanaan Pembelajaran (RPP) SD/SMP/SMA/SMK. Jakarta: Kemendikbud.
Setyosari Punaji. 2013. Metode Penelitian Pendidikan dan Pengembangan. Jakarta: Fajar Interpratama Mandiri.
Sugiyono. 2013. Metode Penelitian Pendidikan Pendekatan Kuantitatif, Kualitatif dan
R&D. Bandung: Alfabeta.
Bandung, October 17th, 2015
Proceeding International Seminar on
Mathematics, Science, and Computer Science Education
164
M
MATH-07476
Examine the Interaction Between Learning and KKM Students to Increase Communications and Problem Solving Mathematics Ability In Junior High School with Applying REACT Strategy
Sari Herlina
Departement of Mathematic Education, Islamic University of Riau, Jl. Kaharuddin Nasution No. 113,
Marpoyan Pekanbaru Riau, Indonesian
Article info Abstract
Keywords:
This research aims to look at the interaction between learning and category of mathematics ability (KKM) students to increase communication and problem solving mathematics ability of students after applying the REACT strategy. This type of research is a quasi-experimental design with non-equivalent control group. The population around the junior high school students in Pekanbaru. The sampling method used purposive sampling, in order to obtain samples in this study were junior high school students of class IX. The instrument used was a test of mathematical communication and problem solving mathematics ability test. The analysis of data utilized Two Way Anova test. The results showed that there was interaction between learning and KKM students to increase students' mathematical communication ability, while the increase in students' mathematical problem solving ability is obtained that there was no interaction between learning and KKM students to increase student’s problem solving mathematics ability.
Corresponding Author:
INTRODUCTION
A survey organization (TIMSS) assesses the skills of fourth grade students of elementary school and eighth grade students of junior high school for math and science. TIMSS classifies four levels of students in the survey conducted, namely: low, medium, high and advanced. The results of the survey report Trends in International Mathematics and Science Study (TIMSS) in 2007, published December 9, 2008 for eighth grade students in math, Indonesian students are in 36th position with an average value of 397. Based on the results, there are only 48% of Indonesian students who reached the low level, 19% of the students achieving levels of moderate and 4% of the students reached high levels, while the advanced level is statistically negligible (Muchlish, 2009: 30).
In addition to the TIMSS survey institution, survey organization Programme for
International Student Assessment (PISA) assesses the ability of reading, math, and science field. PISA survey organization does not only measure the student ability in solving mathematical problems or operating technique. The survey assesses the students' skills in problem solving, which includes identifying and analyzing problems, formulating reasons and communicating their ideas to others. The results of the PISA survey report in 2006, Indonesia was at 52nd rank of 57 participating countries in mathematics.
Problem solving mathematics abilitty and communication mathematics ability need to be developed because it can help people to solve problems, to anticipate the development of science, daily life problems and communicating their ideas to others. It is as stated by
Bandung, October 17th, 2015
Proceeding International Seminar on
Mathematics, Science, and Computer Science Education
165
M
Ruseffendi (2006) that the problem-solving abilities are essential for the students who involves not one field of study but involves other lessons beyond the school lessons, stimulating students to use all their capabilities. It is important for students in the face of life now and later.
There are some factors of the students going on the field that led to failure to achieve the expected curriculum competencies, namely: (1) students have trouble remembering when the subject matter of the material presented in words (verbal) occurs in a conventional classroom; (2) The majority of children are able to remember very well when they handle or experience it directly; (3) the student's own learning difficult because need his friend for sharing; (4) students do not have awareness of the importance of the matter and not knowing its application in everyday life.
Overcoming the gap between expectations and reality as pointed out above, it is needed appropriate strategies, models, approaches or methods to train students' mathematical problem solving abilities, and engage the students actively in learning. The termed learning as Teaching and Learning Activities is a concrete measures of student learning activities in order to acquire, actualize or enhance the desired competencies (Muslich 2011: 71).The effective learning model in mathematics such as: having relevance value to the power of mathematical achievement and providing an opportunity for the rise of the teacher creativity. Then, it has the potential to develop independent learning atmosphere as well as to attract the attention and interest of the students. It could be achieved through a form of alternative learning model which is designed in such a way the students actively reflect their visibility through REACT strategy (Relating, Experiencing, Applying,
Cooperating, and Transferring). This strategy is a learning strategy and contextual approach.
Hull's and Sounder (Komalasari, 2010) says in a contextual learning, the students discover meaningful relationships between abstract ideas and practical application in the real world context. Students integrate the concepts through discovery, reinforcement, and connectedness. Contextual learning requires team work and increase student performance. Furthermore, Cord (1999) said that the reference to relating is a learning that begins with linking between new concepts that are being studied and the concepts they have learned; Experiencing is a learning making the students learn by doing mathematical activities (doing the math) through exploration, search, and discovery; Applying is a learning to make students learn to apply the concepts; Cooperating is a learning to condition the students to learn together, share, and communicate with each other to respond to his friends; and Transferring is learning which encourages the students to learn using the knowledge they have learned in the classroom based on understanding. Learning math like this then we call the learning of mathematics with REACT strategy.
In this study, in addition to the learning factor (REACT strategy and conventional), there are allegedly other factors that affect or contribute to the improvement of communication and mathematical problem solving ability. The factor is the category of mathematical ability (KKM) the students of high, medium and low. Galton (Ruseffendi, 2006) says that of the group of students who were not selected specifically (any), will always be encountered the students capable of high, medium and low. According to Piaget (Nur, 1998) says that most of the the student’s cognitive development is determined by the students' active manipulation and interaction with the environment.
Based on description above, it appears that communication and problems solving mathematics ability can help the success of learning mathematics and improve the learning achievement. The learning with REACT strategy is a bridge in the mathematics learning process which aims to improve the students' mathematical problem solving ability, in addition to the strategy is also expected to accommodate heterogeneous the students
Bandung, October 17th, 2015
Proceeding International Seminar on
Mathematics, Science, and Computer Science Education
166
M
ability. This research aims to look at the interaction between learning and mathematical abilities category (KKM) students to increase communication and problem solving mathematics ability of students after applying the REACT strategy.
RESEARCH METHOD
The research design used in this research is a type of quasi-experimental design with non-equivalent control group (Ruseffendi, 2003: 52). The reason of using this design because the researcher does not select the students for the experimental group and the control group, but the researcher used an existing class. Target population is State Junior high School (SMP Negeri 23) Pekanbaru on odd semester in academic year 2011/2012 which is located on Jalan HR. Subrantas Simpang Baru, Riau Province. The sample selection was done by purposive sampling because of certain considerations (Sugiyono, 2010). The instrument used was a test of mathematical communication and problem solving mathematics ability test. The analysis of data utilized Two Way Anova test.
RESULT AND DISCUSSION
1. Interaction Between Learning and Category of Mathematics Ability on Increased Communication Mathematics Ability
To know interaction between learning and category of mathematics ability on increased communication mathematics ability for students used Two Way Anova test.The hypothesis proposed is as follows: Hypothesis 1: “There is interaction between learning (REACT strategy and conventional) and mathematical abilities category (high, medium and low) to increase the ability of mathematical communications”. Test criteria: If value Sig. > = , then H0 accepted, otherwise it is rejected.
Before doing Two Anova test, should be normality test and homogeneity test,but because the data in this research is greater than 30, then the early mathematics abilities assumed normal distribution. It is based on the Central Limit Theorem, which states: (1) when a normally distributed population, then made the distribution of the sample is then for any sample size, sample distribution is normally; (2) if a population is not normally distributed, then made the distribution of the sample, then to a large sample size distribution of the sample was approximately normally distributed. According to Stevenson (Ruseffendi, 1993) a sample size it was at least thirty. The results of the homogeneity test calculations show that in the population variance of the data an increase communication mathematics ability and learning mathematical is homogeneous. Therefore, to determine the presence or absence of interaction between learning and category of mathematical ability (KKM) used Two Way Anova test. Results of Two Way Anova test presented in table following.
Table 1. Two Way Anova Test An Increase Communication Mathematics Ability Based Category of Mathematics
Ability and Learning
Source Sum of Dk Mean F Sig.
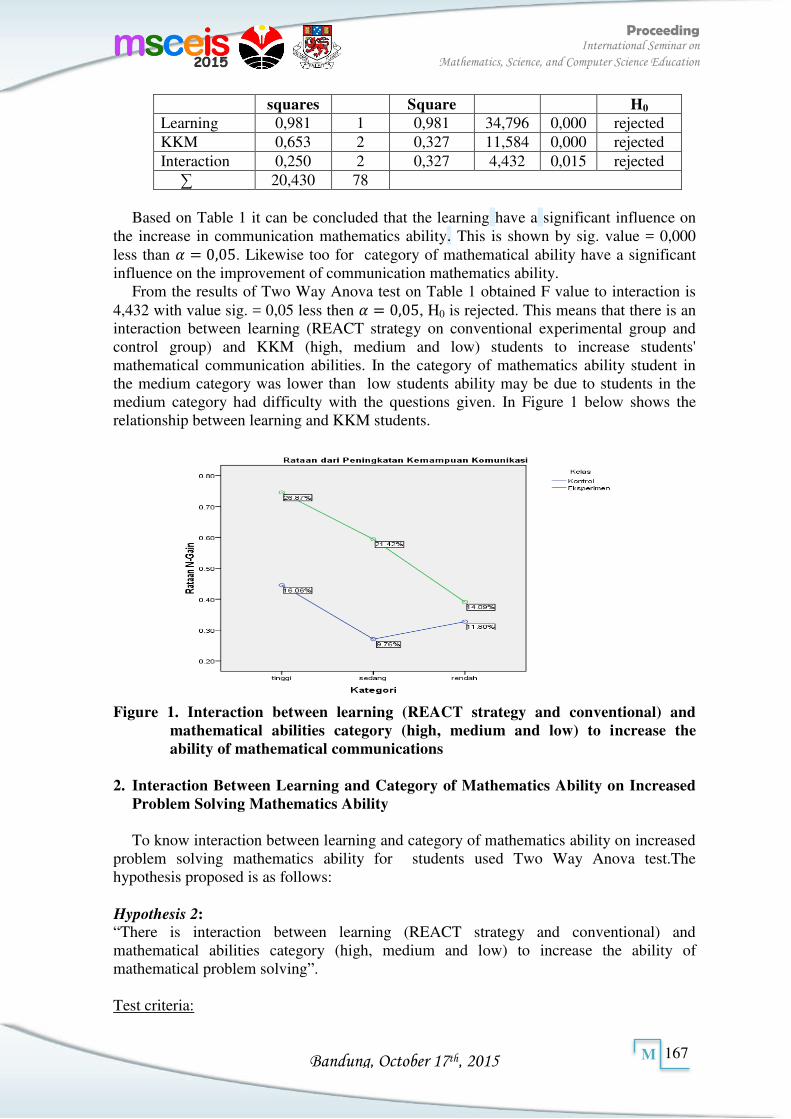
Bandung, October 17th, 2015
Proceeding International Seminar on
Mathematics, Science, and Computer Science Education
167
M
squares Square H0
Learning 0,981 1 0,981 34,796 0,000 rejected KKM 0,653 2 0,327 11,584 0,000 rejected Interaction 0,250 2 0,327 4,432 0,015 rejected ∑ 20,430 78
Based on Table 1 it can be concluded that the learning have a significant influence on
the increase in communication mathematics ability. This is shown by sig. value = 0,000 less than = , . Likewise too for category of mathematical ability have a significant influence on the improvement of communication mathematics ability.
From the results of Two Way Anova test on Table 1 obtained F value to interaction is 4,432 with value sig. = 0,05 less then = , , H0 is rejected. This means that there is an interaction between learning (REACT strategy on conventional experimental group and control group) and KKM (high, medium and low) students to increase students' mathematical communication abilities. In the category of mathematics ability student in the medium category was lower than low students ability may be due to students in the medium category had difficulty with the questions given. In Figure 1 below shows the relationship between learning and KKM students.
Figure 1. Interaction between learning (REACT strategy and conventional) and
mathematical abilities category (high, medium and low) to increase the ability of mathematical communications
2. Interaction Between Learning and Category of Mathematics Ability on Increased
Problem Solving Mathematics Ability
To know interaction between learning and category of mathematics ability on increased problem solving mathematics ability for students used Two Way Anova test.The hypothesis proposed is as follows:
Hypothesis 2: “There is interaction between learning (REACT strategy and conventional) and mathematical abilities category (high, medium and low) to increase the ability of mathematical problem solving”.
Test criteria:
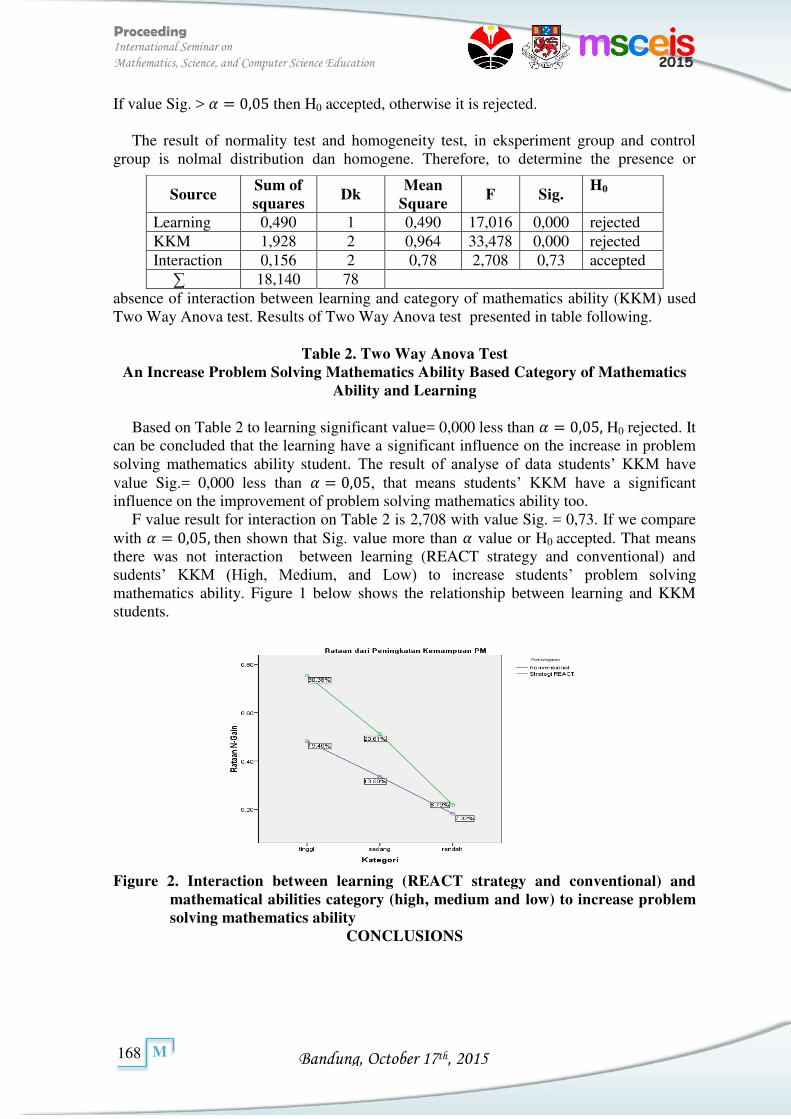
Bandung, October 17th, 2015
Proceeding International Seminar on
Mathematics, Science, and Computer Science Education
168
M
If value Sig. > = , then H0 accepted, otherwise it is rejected.
The result of normality test and homogeneity test, in eksperiment group and control group is nolmal distribution dan homogene. Therefore, to determine the presence or
absence of interaction between learning and category of mathematics ability (KKM) used Two Way Anova test. Results of Two Way Anova test presented in table following.
Table 2. Two Way Anova Test An Increase Problem Solving Mathematics Ability Based Category of Mathematics
Ability and Learning
Based on Table 2 to learning significant value= 0,000 less than = , , H0 rejected. It can be concluded that the learning have a significant influence on the increase in problem solving mathematics ability student. The result of analyse of data students’ KKM have value Sig.= 0,000 less than = , , that means students’ KKM have a significant influence on the improvement of problem solving mathematics ability too.
F value result for interaction on Table 2 is 2,708 with value Sig. = 0,73. If we compare with = , , then shown that Sig. value more than value or H0 accepted. That means there was not interaction between learning (REACT strategy and conventional) and sudents’ KKM (High, Medium, and Low) to increase students’ problem solving mathematics ability. Figure 1 below shows the relationship between learning and KKM students.
Figure 2. Interaction between learning (REACT strategy and conventional) and
mathematical abilities category (high, medium and low) to increase problem solving mathematics ability
CONCLUSIONS
Source Sum of squares
Dk Mean
Square F Sig.
H0
Learning 0,490 1 0,490 17,016 0,000 rejected KKM 1,928 2 0,964 33,478 0,000 rejected Interaction 0,156 2 0,78 2,708 0,73 accepted ∑ 18,140 78
Bandung, October 17th, 2015
Proceeding International Seminar on
Mathematics, Science, and Computer Science Education
169
M
The results showed that there was interaction between learning and KKM students to increase students’ mathematical communication ability, while the increase in students' mathematical problem solving ability is obtained that there was not interaction between learning and KKM students to increase students' problem solving mathematics ability.
REFERENCES Komalasari, K. (2010). Pembelajaran Kontekstual: Konsep dan Aplikasi. Bandung :
Refika Aditama. Muchlish, A. (2009). Belajar dari TIMMS 2007. Artikel pada Pikiran Rakyat halaman 30,
2 Mei 2009. Muclish, M. (2011). KTSP Pembelajaran Berbasis Kompetensi dan Kontekstual. Jakarta :
Bumi Aksara. Nur, M dan Budayasa, I.K. (1998). Teori pembelajaran Sosial dan Teori Perilaku.
Surabaya: PSMS Program Pascasarjana IKIP Surabaya. Ruseffendi, E.T. (1993). Statistik Dasar untuk Penelitian. Bandung: Depertemen
Pendidikan dan Kebudayaan Direktorat Jendral pendidikan Tinggi. Ruseffendi, E.T. (2006). Pengantar kepada Membantu Guru Mengembangkan
Kompetensinya dalam pembelajaran matematika untuk meningkatkan CBSA. Bandung : Tarsito.
Sugiyono. (2010). Metode Penelitian Pendidikan, Pendekatan Kuantitatif, Kualitatif dan
R&D. Bandung: Alfabeta.
Bandung, October 17th, 2015
Proceeding International Seminar on
Mathematics, Science, and Computer Science Education
170
M
MATH-07477
Development of Mathematical Problem-Solving Teaching Materials for Islamic Primary School Teacher Prospective
Students the Program of Enhancing the Graduate Qualification
Rahayu Kariadinata
Mathematics Education Study Program, State Islamic Universiy (UIN) Bandung-Indonesia
Article info Abstract
Keywords:
Corresponding Author: [email protected]
INTRODUCTION
Government Regulation No.19/2005 Article 29 (2) requires a teacher to have minimum educational qualification of undergraduate degree (S-1) or Diploma IV (D-IV) and profession certificate. In reality, however, based on the data from Islamic Education Directorate of the Ministry of Religious Affairs (MORA), many teachers of Islamic educational institutions (madrasah) are still under-qualified or do not have S-1 or D-IV certificate. Therefore, innovative and efficient efforts are needed to give educational improvement services without disturbing their duties as teachers.
Since 2009, Islamic Education Directorate of the Ministry of Religious Affairs (MORA) has developed one alternative system of teaching and learning which is suitable with the teachers’ condition, namely the Program of Enhancing Teachers’ Qualification into S-1 for madrasah teachers (Qualification Program). This program is expected to provide efficient, effective and accountable education for madrasah teachers and to offer access to wider educational services without ignoring their quality.
One of the subjects offered in this program is Mathematical Problem-Solving. In this subject, students are taught strategies to solve mathematical problems in the daily life. Mathematical problem solving is a process in which one is given a concept, skill and process to solve a problem. This requires planning and application of several steps to achieve the goals based on the given situation.
Mathematical Problem-Solving is part of Math Curriculum which is very important because through problem solving activities, students can have the experiences of using the knowledge and skill they have to be applied in non-routine math problems.
According to Baroody dan Niskayuna (1993), problem solving approach is divided into three different meanings: (1) teaching via problem solving, in which math problem solving focuses more on how to teach math content and materials, (2) teaching about problem solving, involving teaching and learning strategy by using general math problem solving approach, (3) teaching for problem solving, a way to give as many opportunities as possible to students to solve math problems they face.
Generally the students of this program (madrasah teachers) find it difficult in solving math problem by using problem solving strategy. To overcome this problem, facilities in
Bandung, October 17th, 2015
Proceeding International Seminar on
Mathematics, Science, and Computer Science Education
171
M
the form of teaching materials are needed. By using teaching materials, these students can increase their knowledge and develop their skills.
Teaching material is all materials used by teachers or instructors to help them in teaching and learning activities in the class. This material can be written or unwritten material (National Center for Vocational Education Research Ltd/National Center for
Competency Based Training in Depdiknas, 2008). The teaching materials often consist of abstract, complex and strange materials. If the
material is abstract, then the teaching material should be able to help students describe that abstract material, for example by using pictures, photos, chart and scheme. Similarly, the complex material should be able to be explained in a simple way based on the students’ thinking level and therefore it can be easily understood (Depdiknas, 2008:9).
Based on the above explanation, it is needed to develop teaching materials on the subject of Mathematical Problem-Solving for the students at the Qualification Program. The development of the teaching materials in this research uses Four-D model adapted from Thiagarajan et. al (1974) which consists of 4 phases: 1) to define; 2) to design; 3) to develop; and 4) to disseminate. The problem of this research is as follows:
1) Do the teaching materials developed by using Four-D model meet the standard to achieve students’ competencies on the subject of Mathematical Problem-Solving?
2) Can the teaching materials on the subject of Mathematical Problem-Solving developed by using Four-D model make the teaching learning process easier?
3) Can the teaching materials on the subject of Mathematical Problem-Solving developed by using Four-D model motivate students?
4) How does the teaching quality of Mathematical Problem-Solving by using these teaching materials?
RESEARCH METHODOLOGY
This research is one of the examples of research and development which consist of three main components (Depdiknas, 2007): (1) Development Model, (2) Development Procedure, and (3) Product Trials. The development of the teaching materials in this research uses Four-D model (define, design, develop and disseminate) suggested by Sivasailam Thiagarajan, Dorothy S. Semmel and Melvyn I. Semmel (1974). Research Subject
This research is conducted among students of the Department of Islamic Primary School Teacher Education at the Qualification Program, Faculty of Education and Teacher Training, State Islamic University (UIN), Class of 2011, Semester VI. The Development of Teaching Material Procedure The development procedure is procedural steps to produce specific products.
a) Definition Phase (to define) This phase is to study the competency standard, basic competency, content
standard, literature study and the evaluation of Mathematical Problem-Solving subject. After this, this phase is to study learning concept and theory. The learning theory used in this Program is andragogy, a learning theory for adult. b) Design Phase (to design)
This phase is to design the prototype or the model of the teaching material. This design uses compilation or wrap around text method, by compiling all of the teaching materials derived from text books, academic journal, article and other sources (Tiarani, 2011). c) Development Phase (to develop)
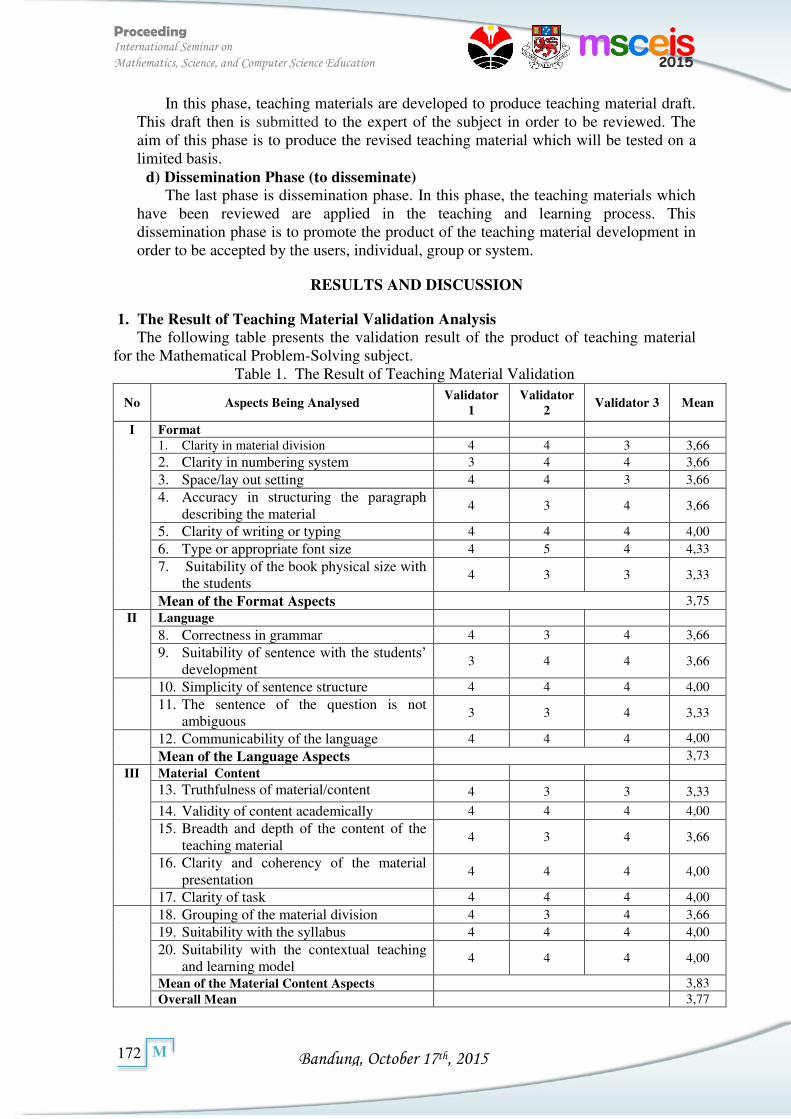
Bandung, October 17th, 2015
Proceeding International Seminar on
Mathematics, Science, and Computer Science Education
172
M
In this phase, teaching materials are developed to produce teaching material draft. This draft then is submitted to the expert of the subject in order to be reviewed. The aim of this phase is to produce the revised teaching material which will be tested on a limited basis.
d) Dissemination Phase (to disseminate) The last phase is dissemination phase. In this phase, the teaching materials which
have been reviewed are applied in the teaching and learning process. This dissemination phase is to promote the product of the teaching material development in order to be accepted by the users, individual, group or system.
RESULTS AND DISCUSSION
1. The Result of Teaching Material Validation Analysis The following table presents the validation result of the product of teaching material
for the Mathematical Problem-Solving subject. Table 1. The Result of Teaching Material Validation
No Aspects Being Analysed Validator
1 Validator
2 Validator 3 Mean
I Format 1. Clarity in material division 4 4 3 3,66 2. Clarity in numbering system 3 4 4 3,66
3. Space/lay out setting 4 4 3 3,66
4. Accuracy in structuring the paragraph describing the material
4 3 4 3,66
5. Clarity of writing or typing 4 4 4 4,00
6. Type or appropriate font size 4 5 4 4,33
7. Suitability of the book physical size with the students
4 3 3 3,33
Mean of the Format Aspects 3,75 II Language
8. Correctness in grammar 4 3 4 3,66
9. Suitability of sentence with the students’ development
3 4 4 3,66
10. Simplicity of sentence structure 4 4 4 4,00
11. The sentence of the question is not ambiguous
3 3 4 3,33
12. Communicability of the language 4 4 4 4,00
Mean of the Language Aspects 3,73
III Material Content 13. Truthfulness of material/content 4 3 3 3,33
14. Validity of content academically 4 4 4 4,00
15. Breadth and depth of the content of the teaching material
4 3 4 3,66
16. Clarity and coherency of the material presentation
4 4 4 4,00
17. Clarity of task 4 4 4 4,00 18. Grouping of the material division 4 3 4 3,66
19. Suitability with the syllabus 4 4 4 4,00
20. Suitability with the contextual teaching and learning model
4 4 4 4,00
Mean of the Material Content Aspects 3,83 Overall Mean 3,77
Bandung, October 17th, 2015
Proceeding International Seminar on
Mathematics, Science, and Computer Science Education
173
M
No Aspects Being Analysed Validator
1 Validator
2 Validator 3 Mean
Total Score 83 86 85 Percentage 83% 86% 85% Percentage Mean 84,66%
The above Tabel 1 shows that the mean of format aspect is 3,75 (good), the mean of
language aspects is 3,73 (good) and the mean of material content is 3,83 (good), the overall mean is 3,77, and the validation percentage of the product of Mathematical Problem-Solving teaching material is 84,66%. These results are in good qualification (80% - 89%) according to the standardized suitability/worthiness table and therefore this teaching material can be used in the teaching process without needing any revision. There are suggestions from the validator in order to increase the number of exercises in problem solving and to relate the test questions with the daily life. 2. The Analysis Result of the Limited Trials
After adding parts suggested by the validator, the teaching materials are then being tested into a limited number of 10 students. The result of this trial on a limited basis is as follows: the presentation aspect is 3,64 (good), readability aspect is 3,725 (good) and expediency aspect is 4,07 (good), while the percentage of the result of the trials of usage of Mathematical Problem-Solving teaching material is 75,499%. This result, according to the standardized suitability/worthiness table is in quite good qualification (70%-79%), therefore this teaching material can be used by adding several parts which need further addition and considering certain aspects as well as that the addition is not too much and not fundamental.
The final phase of this development is dissemination. Dissemination is undertaken in other classes other than the class of the research subject with the aim to know the effectiveness of the usage of the teaching material. 3. Analysis Result of the Students’ Responses to the Questioners
Based on the analysis of the students’ responses to the questioners, it is found that 80% of students state that the teaching material can make the teaching and learning process easier for them; 76% of students state that the problems presented in the teaching material are help ful in increasing their understanding; 73% of students state that material presentation in each unit of the book is very clear; 82% of students state that the explanation of the material presented in the teaching material can be easily understood. 4. The Quality of the Teaching and Learning Process of the Mathematical Problem-Solving Subject by Using the Developed Teaching Materials
The quality of the teaching and learning Mathematical Problem-Solving can be seen from the achievement of the students’ learning result in one semester. The students’ learning result is gained from the grades of the assignment, exercises, mid test, final examination and presentation. Based on the analysis, the mean of the students’ grades is 74,18 with standard deviation of 10,16. If this grade mean is converted into the scale, it is in the good category (B). Therefore, it can be concluded that the quality of teaching and learning process in the Mathematical Problem-Solving subject is categorized as good.
CONCLUSIONS
Based on the research result and discussion, it can be concluded that: 1. The teaching material developed by Four-D model has fulfilled the standard to achieve
students’ competency at the Mathematical Problem-Solving subject. This can be seen from the validation result of the expert and the result of the trials on a limited basis.
Bandung, October 17th, 2015
Proceeding International Seminar on
Mathematics, Science, and Computer Science Education
174
M
2. The teaching material at the Mathematical Problem-Solving subject developed by Four-D model can make the teaching and learning process easier. This is based on the result of the students’ responses to the questionnaires which show that the pictures and illustration in the teaching material help them to understand the material and that the clarity of material presentation in each unit of the book and the material presentation at the teaching material can be easily understood.
3. The teaching material at the Mathematical Problem-Solving subject developed by Four-D model can motivate students. This is based on the result of the students’ responses to the questionnaires.
4. The quality of the teaching and learning at the Mathematical Problem-Solving subject by using the developed teaching material is categorized as good. This is based on the result of the students grades with the mean of 74,18, which is categorized as good (B).
REFERENCES
[1]. Baroody, A.J. & Niskayuna, R. T. C.. Problem Solving, Reason and Communicating,
K-8. Helping Children Think Mathematically. (New York: Merril, an imprint of Macmillan Publishing Company. 1993)
[2]. Depag. Pedoman Penyelenggaraan Program Peningkatan Kualifikasi S-1 Guru
Madrasah Ibtida’iyah dan Pendidikan Agama Islam Pada Sekolah. (Ditjen Pendidikan Islam. 2009)
[3]. Depdiknas. Metode Penelitian Pengembangan. (Badan Penelitian dan Pengembangan Depdiknas : Tim Puslitjaknov. 2007)
[4]. Depdiknas . Panduan Pengembangan Bahan Ajar. (Ditjen Manajemen Pendidikan Dasar dan Menengah. 2008)
[5]. Thiagarajan, S., Semmel, D. S & Semmel, M. I. Instructional Development for
Training Teachers of Expectional Children. (Minneapolis, Minnesota: Leadership Training Institute/Special Education, University of Minnesota. 1974).
Bandung, October 17th, 2015
Proceeding International Seminar on
Mathematics, Science, and Computer Science Education
175
M
MATH-07503
Situaton-Based Learning for Enhancing Students’ Mathematical Creative Problem Solving Ability in Elementary
School
Isrok’atun1,a) and Tiurlina2, b)
1Indonesia University of Education, Jl. Dr. Setiabudi No. 229, Bandung, Jawa Barat, 40154, Indonesia. 2Indonesia University of Education, Jl. Dr. Setiabudi No. 229, Bandung, Jawa Barat, 40154, Indonesia.
Article info Abstract
Keywords:
This research is focused on students’ mathematical Creative Problem Solving (CPS) ability in Elementary School. This weakness is due to the teaching and learning process which does not enhance thinking ability. One of strategies for enhancing mathematical CPS ability is Situation-Based Learning (SBL). The purpose of this research is to comprehensively describe the enhancement of students’ mathematical CPS ability as a result of SBL. This research is a quasi-experimental study that applies two learning models: SBL and conventional learning. Population of this research is all Elemen School students in Banten Province. Sampling used by stratified purposive random sampling, SD N 9 Serang City represents high level school and SD N 3 Serang City represents medium level school. Research instruments is CPS test. Data analysis applies t-test, Mann-Whitney test, and Kruskal-Wallis test. Data analysis is based on the whole students and school level. Based on the research result, it can be concluded that the enhancement of students’ mathematical CPS ability who were taught under SBL learning is higher than those who were taught under conventional learning at the whole students and school level.
Corresponding Author: a)[email protected] b)[email protected]
INTRODUCTION
During teaching-learning activities in the classroom, however, teacher frequently asks his/her students too many questions with low level. Learning method used commonly emphasizes on answering instead of presenting problems. So, the method is not proper to develop the students’ awareness on problem and competence on problem solving. Therefore, Creative Problem Solving (CPS) competence needs to be developed in learning mathematics. In this case, mathematical CPS ability consists of: 1) objective finding; 2) fact finding; 3) problem finding; 4) idea finding; 5) solution finding; and 6) acceptance finding. For every aspect of competence, students start their learning by divergent thinking activities and end by convergent ones [1]; [2]; [3]; [4].
In order to develop the competence, learning mathematics has to explore the students’ competence on presenting and solving the problems creatively proposed by the students themselves. One of learning methods used to overcome the problems is Situation-Based Learning (SBL). SBL learning process can be applied through a set of designing materials based on situation-based learning so that the students are able to develop their creativity and thinking productivity further. Teacher’s roles here are merely as motivator and facilitator. Research Question
The research question: what is the enhancement of students’ mathematical CPS ability who were taught under SBL learning is higher than those who were taught under conventional learning at the whole students and school level (high and medium)?
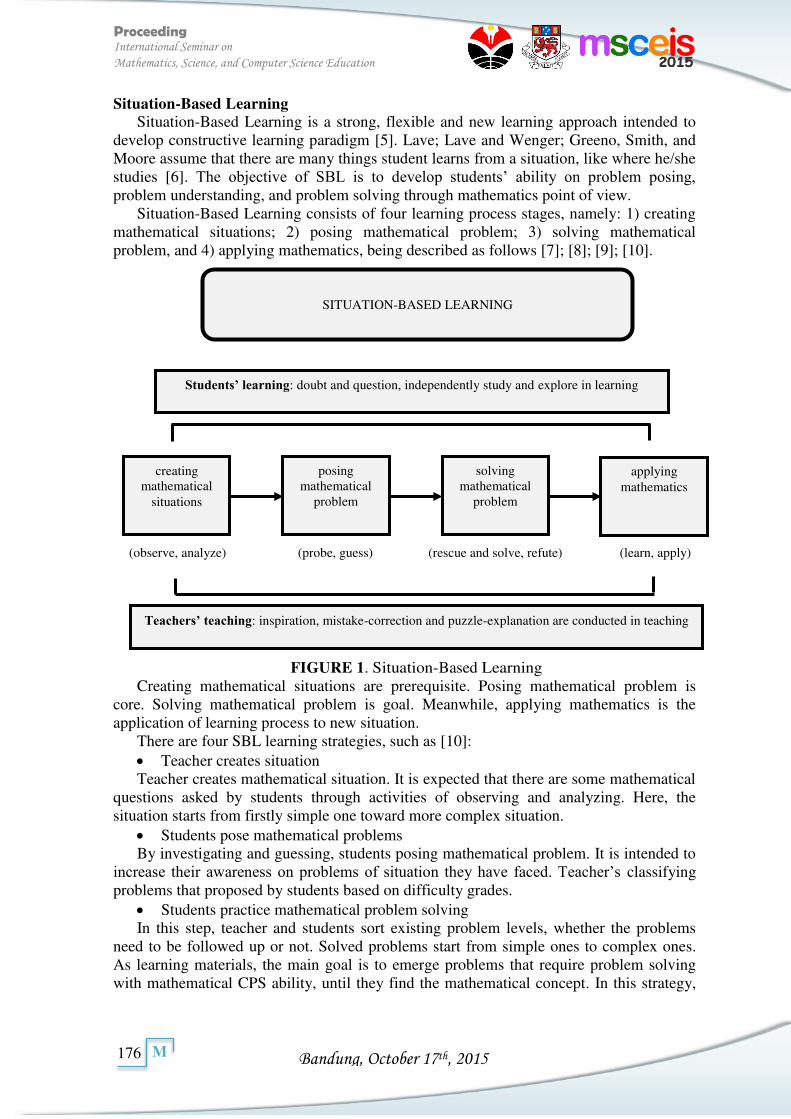
Bandung, October 17th, 2015
Proceeding International Seminar on
Mathematics, Science, and Computer Science Education
176
M
Situation-Based Learning Situation-Based Learning is a strong, flexible and new learning approach intended to
develop constructive learning paradigm [5]. Lave; Lave and Wenger; Greeno, Smith, and Moore assume that there are many things student learns from a situation, like where he/she studies [6]. The objective of SBL is to develop students’ ability on problem posing, problem understanding, and problem solving through mathematics point of view.
Situation-Based Learning consists of four learning process stages, namely: 1) creating mathematical situations; 2) posing mathematical problem; 3) solving mathematical problem, and 4) applying mathematics, being described as follows [7]; [8]; [9]; [10].
FIGURE 1. Situation-Based Learning Creating mathematical situations are prerequisite. Posing mathematical problem is
core. Solving mathematical problem is goal. Meanwhile, applying mathematics is the application of learning process to new situation.
There are four SBL learning strategies, such as [10]: Teacher creates situation Teacher creates mathematical situation. It is expected that there are some mathematical
questions asked by students through activities of observing and analyzing. Here, the situation starts from firstly simple one toward more complex situation.
Students pose mathematical problems By investigating and guessing, students posing mathematical problem. It is intended to
increase their awareness on problems of situation they have faced. Teacher’s classifying problems that proposed by students based on difficulty grades.
Students practice mathematical problem solving In this step, teacher and students sort existing problem levels, whether the problems
need to be followed up or not. Solved problems start from simple ones to complex ones. As learning materials, the main goal is to emerge problems that require problem solving with mathematical CPS ability, until they find the mathematical concept. In this strategy,
SITUATION-BASED LEARNING
creating mathematical
situations
posing mathematical
problem
solving mathematical
problem
applying mathematics
Students’ learning: doubt and question, independently study and explore in learning
(observe, analyze) (probe, guess) (rescue and solve, refute) (learn, apply)
Teachers’ teaching: inspiration, mistake-correction and puzzle-explanation are conducted in teaching
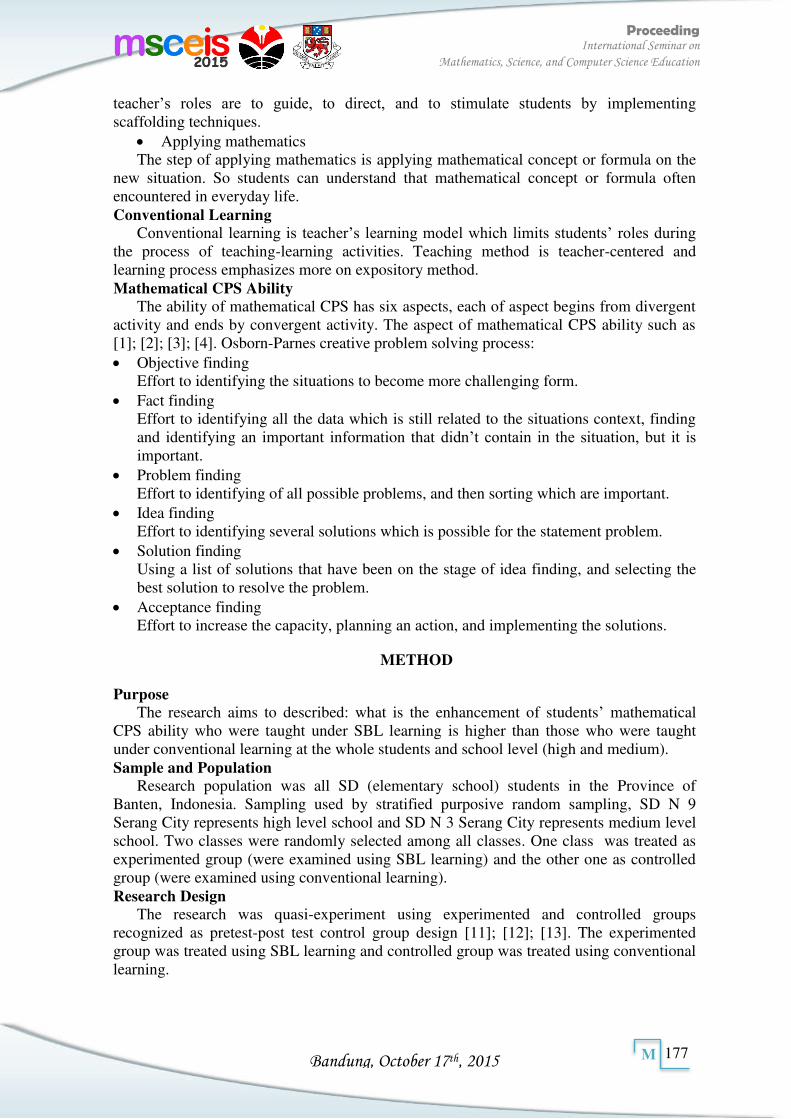
Bandung, October 17th, 2015
Proceeding International Seminar on
Mathematics, Science, and Computer Science Education
177
M
teacher’s roles are to guide, to direct, and to stimulate students by implementing scaffolding techniques.
Applying mathematics The step of applying mathematics is applying mathematical concept or formula on the
new situation. So students can understand that mathematical concept or formula often encountered in everyday life. Conventional Learning
Conventional learning is teacher’s learning model which limits students’ roles during the process of teaching-learning activities. Teaching method is teacher-centered and learning process emphasizes more on expository method. Mathematical CPS Ability
The ability of mathematical CPS has six aspects, each of aspect begins from divergent activity and ends by convergent activity. The aspect of mathematical CPS ability such as [1]; [2]; [3]; [4]. Osborn-Parnes creative problem solving process: Objective finding
Effort to identifying the situations to become more challenging form. Fact finding
Effort to identifying all the data which is still related to the situations context, finding and identifying an important information that didn’t contain in the situation, but it is important.
Problem finding Effort to identifying of all possible problems, and then sorting which are important.
Idea finding Effort to identifying several solutions which is possible for the statement problem.
Solution finding Using a list of solutions that have been on the stage of idea finding, and selecting the best solution to resolve the problem.
Acceptance finding Effort to increase the capacity, planning an action, and implementing the solutions.
METHOD
Purpose The research aims to described: what is the enhancement of students’ mathematical
CPS ability who were taught under SBL learning is higher than those who were taught under conventional learning at the whole students and school level (high and medium). Sample and Population
Research population was all SD (elementary school) students in the Province of Banten, Indonesia. Sampling used by stratified purposive random sampling, SD N 9 Serang City represents high level school and SD N 3 Serang City represents medium level school. Two classes were randomly selected among all classes. One class was treated as experimented group (were examined using SBL learning) and the other one as controlled group (were examined using conventional learning). Research Design
The research was quasi-experiment using experimented and controlled groups recognized as pretest-post test control group design [11]; [12]; [13]. The experimented group was treated using SBL learning and controlled group was treated using conventional learning.
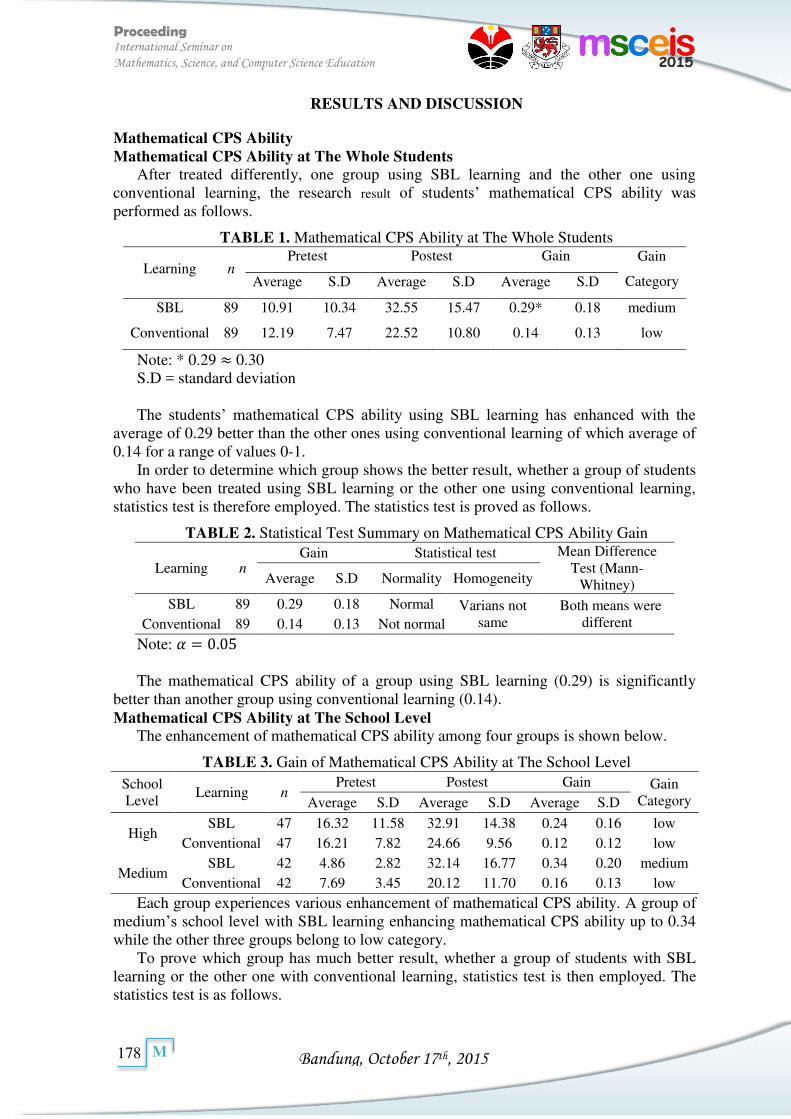
Bandung, October 17th, 2015
Proceeding International Seminar on
Mathematics, Science, and Computer Science Education
178
M
RESULTS AND DISCUSSION
Mathematical CPS Ability Mathematical CPS Ability at The Whole Students
After treated differently, one group using SBL learning and the other one using conventional learning, the research result of students’ mathematical CPS ability was performed as follows.
TABLE 1. Mathematical CPS Ability at The Whole Students
Learning n Pretest Postest Gain Gain
Category Average S.D Average S.D Average S.D
SBL 89 10.91 10.34 32.55 15.47 0.29* 0.18 medium
Conventional 89 12.19 7.47 22.52 10.80 0.14 0.13 low
Note: * 0.29 ≈ 0.30 S.D = standard deviation The students’ mathematical CPS ability using SBL learning has enhanced with the
average of 0.29 better than the other ones using conventional learning of which average of 0.14 for a range of values 0-1.
In order to determine which group shows the better result, whether a group of students who have been treated using SBL learning or the other one using conventional learning, statistics test is therefore employed. The statistics test is proved as follows.
TABLE 2. Statistical Test Summary on Mathematical CPS Ability Gain
Learning n Gain Statistical test Mean Difference
Test (Mann-Whitney) Average S.D Normality Homogeneity
SBL 89 0.29 0.18 Normal Varians not same
Both means were different Conventional 89 0.14 0.13 Not normal
Note: = . The mathematical CPS ability of a group using SBL learning (0.29) is significantly
better than another group using conventional learning (0.14). Mathematical CPS Ability at The School Level
The enhancement of mathematical CPS ability among four groups is shown below.
TABLE 3. Gain of Mathematical CPS Ability at The School Level
School Level
Learning n Pretest Postest Gain Gain
Category Average S.D Average S.D Average S.D
High SBL 47 16.32 11.58 32.91 14.38 0.24 0.16 low
Conventional 47 16.21 7.82 24.66 9.56 0.12 0.12 low
Medium SBL 42 4.86 2.82 32.14 16.77 0.34 0.20 medium
Conventional 42 7.69 3.45 20.12 11.70 0.16 0.13 low
Each group experiences various enhancement of mathematical CPS ability. A group of medium’s school level with SBL learning enhancing mathematical CPS ability up to 0.34 while the other three groups belong to low category.
To prove which group has much better result, whether a group of students with SBL learning or the other one with conventional learning, statistics test is then employed. The statistics test is as follows.
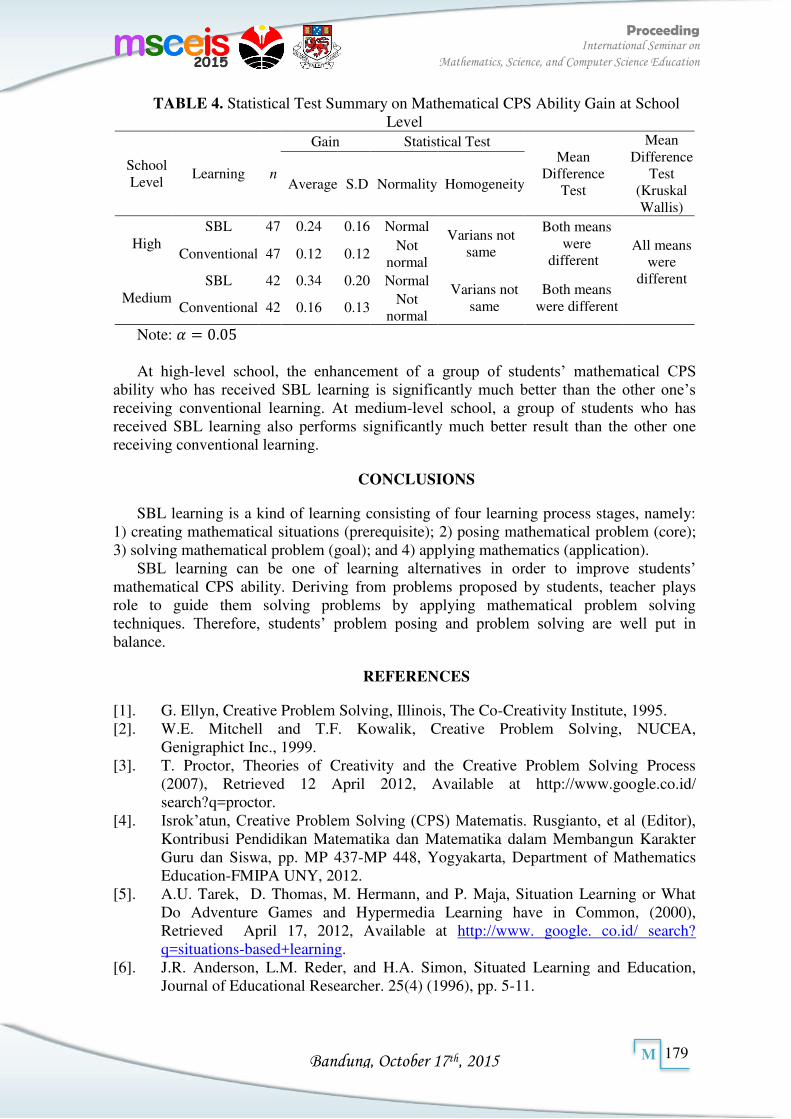
Bandung, October 17th, 2015
Proceeding International Seminar on
Mathematics, Science, and Computer Science Education
179
M
TABLE 4. Statistical Test Summary on Mathematical CPS Ability Gain at School Level
School Level
Learning n
Gain Statistical Test Mean
Difference Test
Mean Difference
Test (Kruskal Wallis)
Average S.D Normality Homogeneity
High SBL 47 0.24 0.16 Normal
Varians not same
Both means were
different All means
were different
Conventional 47 0.12 0.12 Not
normal
Medium SBL 42 0.34 0.20 Normal
Varians not same
Both means were different Conventional 42 0.16 0.13
Not normal
Note: = . At high-level school, the enhancement of a group of students’ mathematical CPS
ability who has received SBL learning is significantly much better than the other one’s receiving conventional learning. At medium-level school, a group of students who has received SBL learning also performs significantly much better result than the other one receiving conventional learning.
CONCLUSIONS
SBL learning is a kind of learning consisting of four learning process stages, namely: 1) creating mathematical situations (prerequisite); 2) posing mathematical problem (core); 3) solving mathematical problem (goal); and 4) applying mathematics (application).
SBL learning can be one of learning alternatives in order to improve students’ mathematical CPS ability. Deriving from problems proposed by students, teacher plays role to guide them solving problems by applying mathematical problem solving techniques. Therefore, students’ problem posing and problem solving are well put in balance.
REFERENCES
[1]. G. Ellyn, Creative Problem Solving, Illinois, The Co-Creativity Institute, 1995. [2]. W.E. Mitchell and T.F. Kowalik, Creative Problem Solving, NUCEA,
Genigraphict Inc., 1999. [3]. T. Proctor, Theories of Creativity and the Creative Problem Solving Process
(2007), Retrieved 12 April 2012, Available at http://www.google.co.id/ search?q=proctor.
[4]. Isrok’atun, Creative Problem Solving (CPS) Matematis. Rusgianto, et al (Editor), Kontribusi Pendidikan Matematika dan Matematika dalam Membangun Karakter Guru dan Siswa, pp. MP 437-MP 448, Yogyakarta, Department of Mathematics Education-FMIPA UNY, 2012.
[5]. A.U. Tarek, D. Thomas, M. Hermann, and P. Maja, Situation Learning or What Do Adventure Games and Hypermedia Learning have in Common, (2000), Retrieved April 17, 2012, Available at http://www. google. co.id/ search? q=situations-based+learning.
[6]. J.R. Anderson, L.M. Reder, and H.A. Simon, Situated Learning and Education, Journal of Educational Researcher. 25(4) (1996), pp. 5-11.
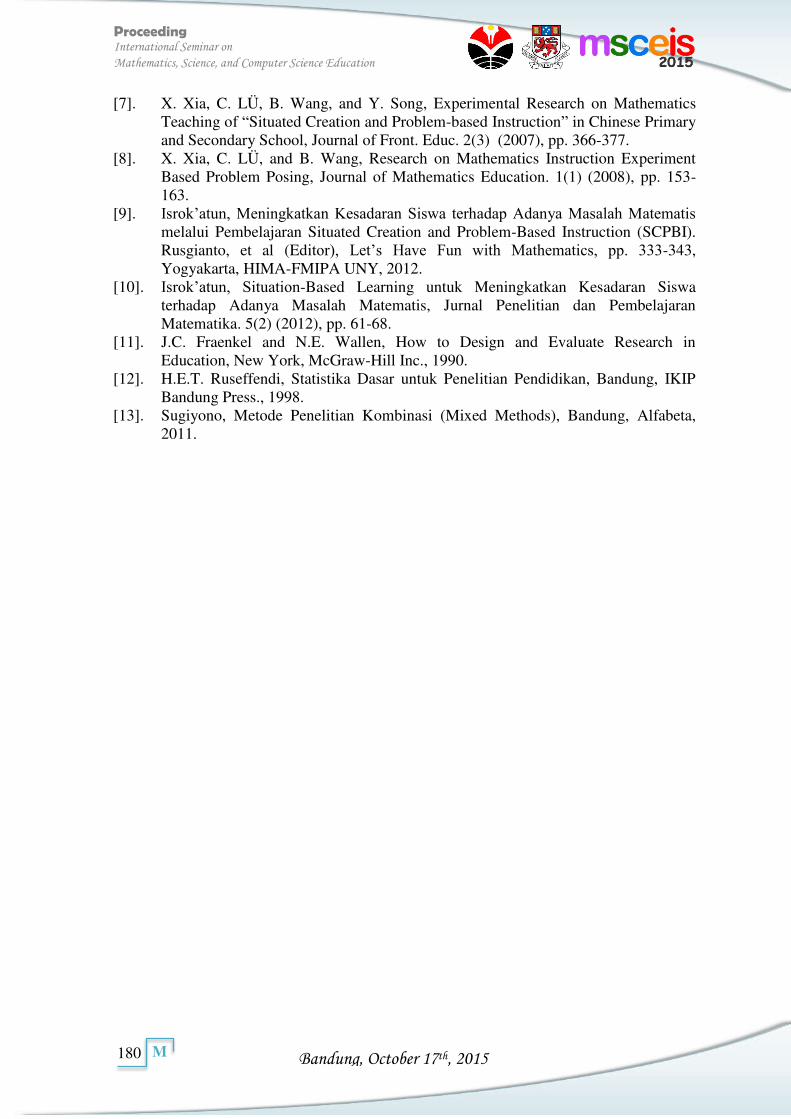
Bandung, October 17th, 2015
Proceeding International Seminar on
Mathematics, Science, and Computer Science Education
180
M
[7]. X. Xia, C. LÜ, B. Wang, and Y. Song, Experimental Research on Mathematics Teaching of “Situated Creation and Problem-based Instruction” in Chinese Primary and Secondary School, Journal of Front. Educ. 2(3) (2007), pp. 366-377.
[8]. X. Xia, C. LÜ, and B. Wang, Research on Mathematics Instruction Experiment Based Problem Posing, Journal of Mathematics Education. 1(1) (2008), pp. 153-163.
[9]. Isrok’atun, Meningkatkan Kesadaran Siswa terhadap Adanya Masalah Matematis melalui Pembelajaran Situated Creation and Problem-Based Instruction (SCPBI). Rusgianto, et al (Editor), Let’s Have Fun with Mathematics, pp. 333-343, Yogyakarta, HIMA-FMIPA UNY, 2012.
[10]. Isrok’atun, Situation-Based Learning untuk Meningkatkan Kesadaran Siswa terhadap Adanya Masalah Matematis, Jurnal Penelitian dan Pembelajaran Matematika. 5(2) (2012), pp. 61-68.
[11]. J.C. Fraenkel and N.E. Wallen, How to Design and Evaluate Research in Education, New York, McGraw-Hill Inc., 1990.
[12]. H.E.T. Ruseffendi, Statistika Dasar untuk Penelitian Pendidikan, Bandung, IKIP Bandung Press., 1998.
[13]. Sugiyono, Metode Penelitian Kombinasi (Mixed Methods), Bandung, Alfabeta, 2011.
Bandung, October 17th, 2015
Proceeding International Seminar on
Mathematics, Science, and Computer Science Education
181
M
MATH-08026
Bootstrapped Durbin–Watson Test of Autocorrelation for Small Samples
Dewi Rachmatin
Department of Mathematics Education Faculty of Mathematics Education and Science Eduation
Indonesia of Education University
Article info Abstract
Keywords: Bootstrap Procedure, Durbin-Watson Test, Bootstrapped Durbin-Watson Test.
Autocorrelation problem arises in time series data. If we used in usual testing procedure despite autocorrelation whatever conclusion may be mislead. Thus, it is necessary to detect the existence of autocorrelation in a given series at the initial stage. The Durbin-Watson (DW) test is the most widely used test for autocorrelation in regression model. Durbin-Watson (DW) test is not applicable for small samples. In a case of small sample, DW test cannot be applied and in such a situation bootstrap procedure may be a solution to this problem. Monte-Carlo study shows that the bootstrapped DW test performs better than the usual DW test (Akter, 2014). We simplifed an algorithm of bootstrapped DW test (BDW test) for small samples that was proposed by Akter (2014), and we have made a program with R program for our algorithm. The result of this program for simulation data samples show mean of d
* (BDW statistic) will significant to one number if we do a large enough replications (replications of bootstrap) and standard deviation of d
* become smaller for larger replications of bootstrap, this is happened when residuals autocorrelated. But if we have a large residuals (a least-squares residuals), this can cause a large BDW statistic. We recommended our algorithm for futher research if we have a small sample.
Corresponding Author: [email protected]
INTRODUCTION
In processing the data, researchers have been interested in determining the relationship between two or more variables. The relationship may be strained as in association or maybe too closely. On the one hand, two variables may be independent of each other. In the study, people used to work using a model, a functional relationship between the variables. With that model we are trying to understand, explain, control and predict the behavior of the system then studied. The model discussed here will always be shaped function and regression is a powerful tool in its formation (Sembiring, 2003).
Let us, consider the following regression model : = + (1)
where, Y and u are × 1 , is (n×k), β is (� × 1) and n denotes the number of observations. The disturbance vector (error) : u is normally distributed with ( ) = 0 and E( ′) = Ω, Ω is positive definite. We assume that the disturbance term follows a stationary AR(1) process of the form (Akter, 2014; Montgomery, 2008) : = −1 + t , t ~ (0, �2) (2)
where | | < 1 and � ~ (0, � ). In many cases, correlated with each other, called autocorrelations.
When we deal with time-series data in the form of testing is needed to determine that the data are not correlated. The most commonly used test for this purpose is the Durbin-
Bandung, October 17th, 2015
Proceeding International Seminar on
Mathematics, Science, and Computer Science Education
182
M
Watson statistic. Because in most cases a positive correlation time series analysis, then test the hypothesis is formulated as follows : H0 : ρ = 0 against H1 : ρ > 0 , test statistics for this test is :
= ∑ − −�= ∑�= (3)
where = − error for observations to i (Durbin and Watson, 1950). Durbin-Watson (DW) test is not applicable for small samples. In a case of small
sample, DW test cannot be applied and in such a situation bootstrap procedure may be a solution to this problem, and many research work have been conducted considering bootstrapped based solution of the problem of autocorrelation, such as Jeong and Chung (2001). Jeong and Chung (2001) applied bootstrap test procedures on the DW statistic. Davidson and Mackinnon (2002) applied a recursive bootstrap procedure to test of autocorrelation in the presence of lagged dependent variables, their simulation results show that the bootstrap would be a useful tool for autocorrelation tests. Monte-Carlo study shows that the bootstrapped DW test (BDW test) performs better than the usual DW test (Akter, 2014).
Because of the lack of Durbin-Watson test (DW) can not be applied to small samples of data, in the case of small sample data, the bootstrap method can be applied to small-sized data by resampling at each data sample and give probability 1/n. So the data can be obtained with bootstrap method’s in sizes large enough for the purposes of further research. Therefore we are interested in creating a program for BDW test, which the algorithm was proposed by Akter (2014) with the help of software R, so everyone can easely apply our program for their studies or their researchs.
BASIC THEORIES
1. BOOTSTRAP METHOD The bootstrap method introduced in Efron (1979) is a very general resampling
procedure for estimating the distributions of statistics based on independent observations. The bootstrap method is shown to be successful in many situations, which is being accepted as an alternative to the asymptotic methods.
Consider we have the observations , , … , as realizations of independent random variables with common distribution function F, and suppose we will estimate � (function of the random variables , , … , . Then we generate many samples, say B in number, of size n from F; from each sample we calculate the value of �∗, �∗, … , �∗ , by give them probability 1/n to each observed value , , … , . The empirical distribution of the resulting values �∗, �∗, … , �∗ is an approximation to the distribution function of �, which is good if B is very large. If we wish to know the standard deviation of �, we can find a good approximation to it by calculating the standard deviation of the collection of values �∗, �∗, … , �∗ . We can make these approximations arbitrarily accurate by taking B to
be arbitrarily large (Efron, 1992). Then the mean of � is then estimated by * =∑ �∗�= and
the standard deviation of � is then estimated by *s = √ ∑ �∗ − �∗= are produced
from B sample of size n from the collection , , … , . 2. DURBIN-WATSON STATISTIC
The Durbin–Watson statistic is a test statistic used to detect the presence of autocorrelation (a relationship between values separated from each other by a given time lag) in the residuals (prediction errors) from a regression analysis, which the hyphothesis is
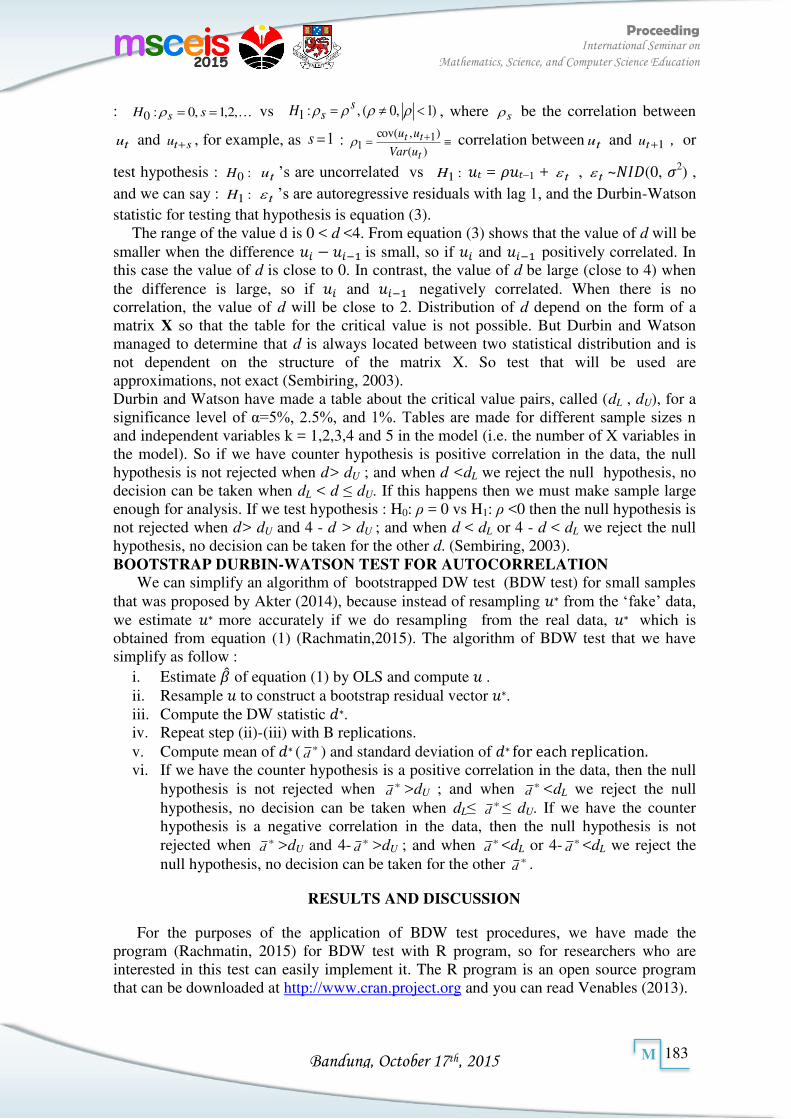
Bandung, October 17th, 2015
Proceeding International Seminar on
Mathematics, Science, and Computer Science Education
183
M
: ,2,1 ,0 :0 sH s vs )1 ,0( , :1 ssH , where s be the correlation between
tu and stu , for example, as 1s : )(
),cov( 11
t
tt
uVar
uu correlation between tu and 1tu , or
test hypothesis : :0H tu ’s are uncorrelated vs :1H = −1 + t , t ~ (0, �2) ,
and we can say : :1H t ’s are autoregressive residuals with lag 1, and the Durbin-Watson
statistic for testing that hypothesis is equation (3). The range of the value d is 0 < d <4. From equation (3) shows that the value of d will be
smaller when the difference − − is small, so if and − positively correlated. In this case the value of d is close to 0. In contrast, the value of d be large (close to 4) when the difference is large, so if and − negatively correlated. When there is no correlation, the value of d will be close to 2. Distribution of d depend on the form of a matrix X so that the table for the critical value is not possible. But Durbin and Watson managed to determine that d is always located between two statistical distribution and is not dependent on the structure of the matrix X. So test that will be used are approximations, not exact (Sembiring, 2003). Durbin and Watson have made a table about the critical value pairs, called (dL , dU), for a significance level of α=5%, 2.5%, and 1%. Tables are made for different sample sizes n and independent variables k = 1,2,3,4 and 5 in the model (i.e. the number of X variables in the model). So if we have counter hypothesis is positive correlation in the data, the null hypothesis is not rejected when d> dU ; and when d <dL we reject the null hypothesis, no decision can be taken when dL < d ≤ dU. If this happens then we must make sample large enough for analysis. If we test hypothesis : H0: ρ = 0 vs H1: ρ <0 then the null hypothesis is not rejected when d> dU and 4 - d > dU ; and when d < dL or 4 - d < dL we reject the null hypothesis, no decision can be taken for the other d. (Sembiring, 2003). BOOTSTRAP DURBIN-WATSON TEST FOR AUTOCORRELATION
We can simplify an algorithm of bootstrapped DW test (BDW test) for small samples that was proposed by Akter (2014), because instead of resampling ∗ from the ‘fake’ data, we estimate ∗ more accurately if we do resampling from the real data, ∗ which is obtained from equation (1) (Rachmatin,2015). The algorithm of BDW test that we have simplify as follow :
i. Estimate of equation (1) by OLS and compute . ii. Resample to construct a bootstrap residual vector ∗. iii. Compute the DW statistic ∗. iv. Repeat step (ii)-(iii) with B replications. v. Compute mean of ∗ ( *
d ) and standard deviation of ∗ for each replication. vi. If we have the counter hypothesis is a positive correlation in the data, then the null
hypothesis is not rejected when *d >dU ; and when *
d <dL we reject the null hypothesis, no decision can be taken when dL≤ *
d ≤ dU. If we have the counter hypothesis is a negative correlation in the data, then the null hypothesis is not rejected when *
d >dU and 4- *d >dU ; and when *
d <dL or 4- *d <dL we reject the
null hypothesis, no decision can be taken for the other *d .
RESULTS AND DISCUSSION
For the purposes of the application of BDW test procedures, we have made the program (Rachmatin, 2015) for BDW test with R program, so for researchers who are interested in this test can easily implement it. The R program is an open source program that can be downloaded at http://www.cran.project.org and you can read Venables (2013).
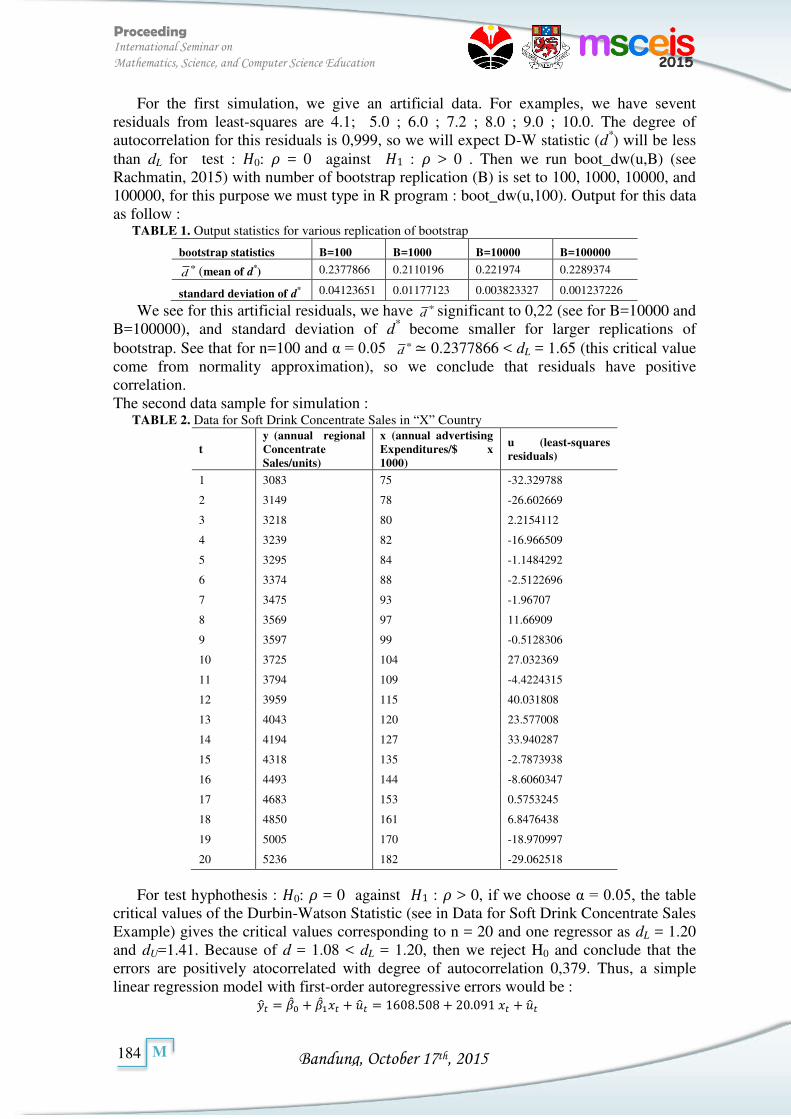
Bandung, October 17th, 2015
Proceeding International Seminar on
Mathematics, Science, and Computer Science Education
184
M
For the first simulation, we give an artificial data. For examples, we have sevent residuals from least-squares are 4.1; 5.0 ; 6.0 ; 7.2 ; 8.0 ; 9.0 ; 10.0. The degree of autocorrelation for this residuals is 0,999, so we will expect D-W statistic (d*) will be less than dL for test : 0: = 0 against 1 : > 0 . Then we run boot_dw(u,B) (see Rachmatin, 2015) with number of bootstrap replication (B) is set to 100, 1000, 10000, and 100000, for this purpose we must type in R program : boot_dw(u,100). Output for this data as follow :
TABLE 1. Output statistics for various replication of bootstrap
bootstrap statistics B=100 B=1000 B=10000 B=100000
*d (mean of d*) 0.2377866 0.2110196 0.221974 0.2289374
standard deviation of d* 0.04123651 0.01177123 0.003823327 0.001237226
We see for this artificial residuals, we have *d significant to 0,22 (see for B=10000 and
B=100000), and standard deviation of d* become smaller for larger replications of
bootstrap. See that for n=100 and α = 0.05 *d ≃ 0.2377866 < dL = 1.65 (this critical value
come from normality approximation), so we conclude that residuals have positive correlation. The second data sample for simulation :
TABLE 2. Data for Soft Drink Concentrate Sales in “X” Country
t y (annual regional Concentrate Sales/units)
x (annual advertising Expenditures/$ x 1000)
u (least-squares residuals)
1 3083 75 -32.329788
2 3149 78 -26.602669
3 3218 80 2.2154112
4 3239 82 -16.966509
5 3295 84 -1.1484292
6 3374 88 -2.5122696
7 3475 93 -1.96707
8 3569 97 11.66909
9 3597 99 -0.5128306
10 3725 104 27.032369
11 3794 109 -4.4224315
12 3959 115 40.031808
13 4043 120 23.577008
14 4194 127 33.940287
15 4318 135 -2.7873938
16 4493 144 -8.6060347
17 4683 153 0.5753245
18 4850 161 6.8476438
19 5005 170 -18.970997
20 5236 182 -29.062518
For test hyphothesis : 0: = 0 against 1 : > 0, if we choose α = 0.05, the table critical values of the Durbin-Watson Statistic (see in Data for Soft Drink Concentrate Sales Example) gives the critical values corresponding to n = 20 and one regressor as dL = 1.20 and dU=1.41. Because of d = 1.08 < dL = 1.20, then we reject H0 and conclude that the errors are positively atocorrelated with degree of autocorrelation 0,379. Thus, a simple linear regression model with first-order autoregressive errors would be :
= + + = . + . +
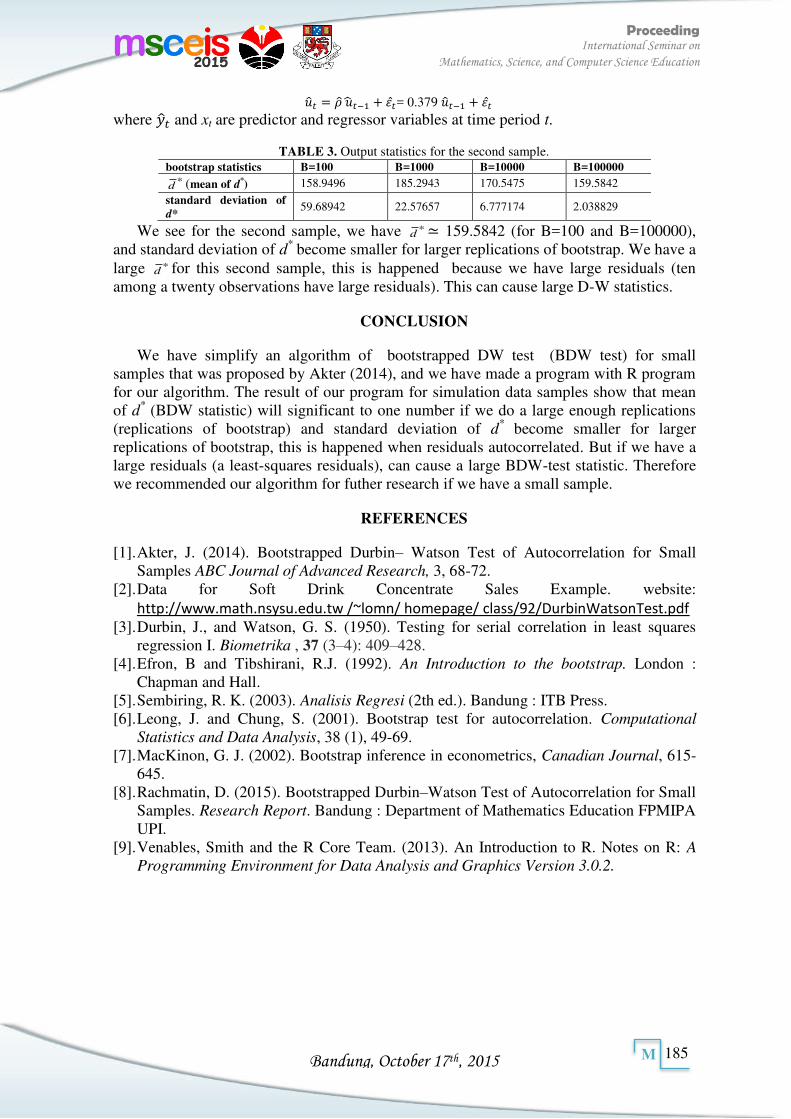
Bandung, October 17th, 2015
Proceeding International Seminar on
Mathematics, Science, and Computer Science Education
185
M
= − + � = 0.37 − + � where and xt are predictor and regressor variables at time period t.
TABLE 3. Output statistics for the second sample. bootstrap statistics B=100 B=1000 B=10000 B=100000
*d (mean of d*) 158.9496 185.2943 170.5475 159.5842
standard deviation of d*
59.68942 22.57657 6.777174 2.038829
We see for the second sample, we have *d ≃ 159.5842 (for B=100 and B=100000),
and standard deviation of d* become smaller for larger replications of bootstrap. We have a large *
d for this second sample, this is happened because we have large residuals (ten among a twenty observations have large residuals). This can cause large D-W statistics.
CONCLUSION
We have simplify an algorithm of bootstrapped DW test (BDW test) for small samples that was proposed by Akter (2014), and we have made a program with R program for our algorithm. The result of our program for simulation data samples show that mean of d* (BDW statistic) will significant to one number if we do a large enough replications (replications of bootstrap) and standard deviation of d
* become smaller for larger replications of bootstrap, this is happened when residuals autocorrelated. But if we have a large residuals (a least-squares residuals), can cause a large BDW-test statistic. Therefore we recommended our algorithm for futher research if we have a small sample.
REFERENCES
[1]. Akter, J. (2014). Bootstrapped Durbin– Watson Test of Autocorrelation for Small Samples ABC Journal of Advanced Research, 3, 68-72.
[2]. Data for Soft Drink Concentrate Sales Example. website: http://www.math.nsysu.edu.tw /~lomn/ homepage/ class/92/DurbinWatsonTest.pdf
[3]. Durbin, J., and Watson, G. S. (1950). Testing for serial correlation in least squares regression I. Biometrika , 37 (3–4): 409–428.
[4]. Efron, B and Tibshirani, R.J. (1992). An Introduction to the bootstrap. London : Chapman and Hall.
[5]. Sembiring, R. K. (2003). Analisis Regresi (2th ed.). Bandung : ITB Press. [6]. Leong, J. and Chung, S. (2001). Bootstrap test for autocorrelation. Computational
Statistics and Data Analysis, 38 (1), 49-69. [7]. MacKinon, G. J. (2002). Bootstrap inference in econometrics, Canadian Journal, 615-
645. [8]. Rachmatin, D. (2015). Bootstrapped Durbin–Watson Test of Autocorrelation for Small
Samples. Research Report. Bandung : Department of Mathematics Education FPMIPA UPI.
[9]. Venables, Smith and the R Core Team. (2013). An Introduction to R. Notes on R: A
Programming Environment for Data Analysis and Graphics Version 3.0.2.

Bandung, October 17th, 2015
Proceeding International Seminar on
Mathematics, Science, and Computer Science Education
186
M
MATH-08085
Manipulatives and Non-manipulatives : A Survey
M.A. Shulhany1
1 Graduate School of Mathematics Education, School of Postgraduate Studies, Indonesia University of Education, Jl. Dr Setiabudi No. 229, West Java, Indonesia
Article info Abstract
Keywords: Manipulatives, non-manipulatives, research trend, case study research.
This study aims to look at trend of mathematics education research in Indonesia on manipulatives and non-manipulatives. This study is a case study research. The subject of this research is 584 papers contained journal archive published in Indonesia in 2012 until the beginning of 2015. The results showed that mathematics education research in Indonesia more use of non-manipulatives. This type of research is the most widely used is quantitative research with a experimental design.
Corresponding Author: Ahmad Shulhany M. [email protected]
INTRODUCTION
Mathematics studies abstract objects, whereas the way of thinking of students in general are more accustomed to thinking with real objects. There is a gap between mathematics and the way of thinking of students. These conditions make mathematics must not be taught just like learning in general, but the teacher should facilitate students into abstraction process, in which students carry out the screening process for the phenomena in the real world can be formulated and formed into concepts or schemes [4]. One solution to overcome this gap is by using manipulatives.
Manipulatives is any object, picture, or drawing that represents a concept or onto which the relationship for that concept can be imposed. Manipulatives are physical objects that students and teachers can use to illustrate and discover mathematical concepts, whether made specifically for mathematics or for other purposes [5]. Manipulatives provide a strong and balanced foundation for students mastering the following mathematical concepts [2]. Manipulatives there are two kinds, namely concrete manipulatives dan virtual manipulatives. Concrete manipulatives is physical manipulatives [1], and virtual manipulatives is computerized versions of familiar physical manipulatives [6].
Mathematics education research on manipulatives very diverse and created a trend in a certain time period. Previous research on mathematics education research trend has been done by Jozua Sabandar[3]. The study examines the trend of mathematics education research in Indonesia in2003-2008.
METHOD
The subject of this research is 584 papers contained journal archive published Indonesiain 2012 until beginning of 2015. This study is a case study research. The procedure of this study is collecting data, classifying the data, analyze the data, and writing research reports. Data collection of mathematics education research papers from journal archive of journals published in website garuda DIKTI according types of manipulatives as many as 584 papers. Classifying the data according to the type of research related
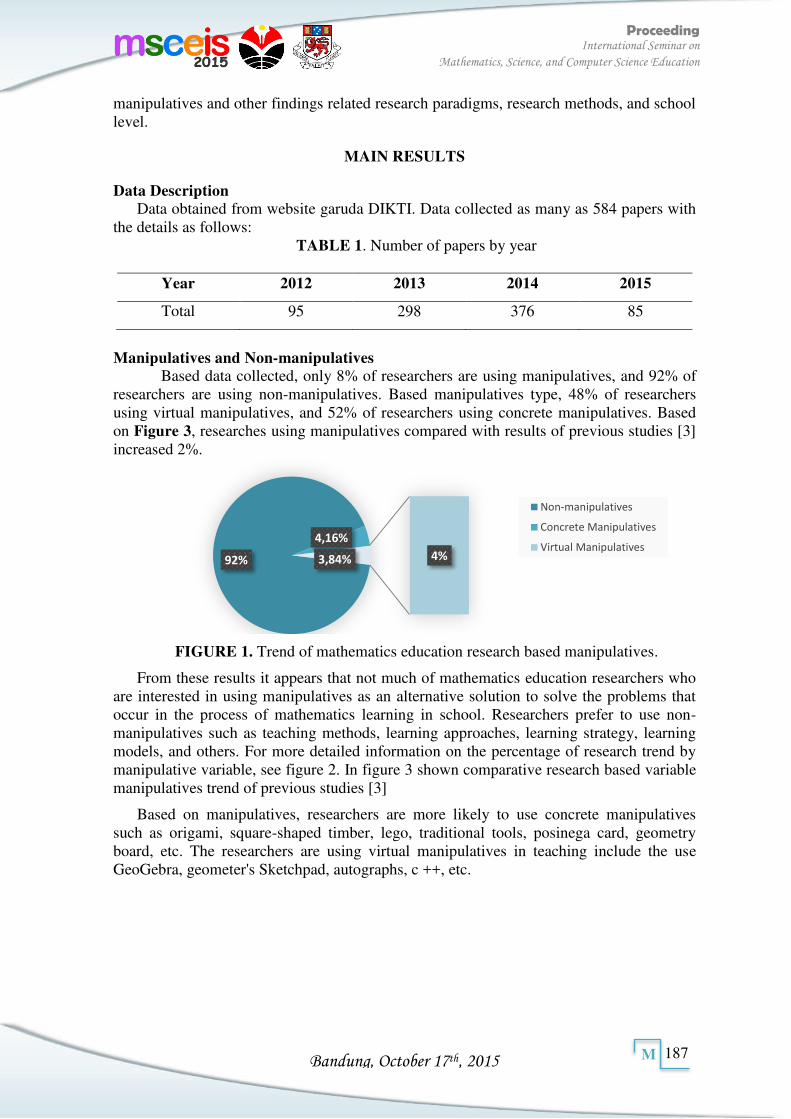
Bandung, October 17th, 2015
Proceeding International Seminar on
Mathematics, Science, and Computer Science Education
187
M
manipulatives and other findings related research paradigms, research methods, and school level.
MAIN RESULTS
Data Description Data obtained from website garuda DIKTI. Data collected as many as 584 papers with
the details as follows: TABLE 1. Number of papers by year
Year 2012 2013 2014 2015
Total 95 298 376 85
Manipulatives and Non-manipulatives
Based data collected, only 8% of researchers are using manipulatives, and 92% of researchers are using non-manipulatives. Based manipulatives type, 48% of researchers using virtual manipulatives, and 52% of researchers using concrete manipulatives. Based on Figure 3, researches using manipulatives compared with results of previous studies [3] increased 2%.
FIGURE 1. Trend of mathematics education research based manipulatives.
From these results it appears that not much of mathematics education researchers who are interested in using manipulatives as an alternative solution to solve the problems that occur in the process of mathematics learning in school. Researchers prefer to use non-manipulatives such as teaching methods, learning approaches, learning strategy, learning models, and others. For more detailed information on the percentage of research trend by manipulative variable, see figure 2. In figure 3 shown comparative research based variable manipulatives trend of previous studies [3]
Based on manipulatives, researchers are more likely to use concrete manipulatives such as origami, square-shaped timber, lego, traditional tools, posinega card, geometry board, etc. The researchers are using virtual manipulatives in teaching include the use GeoGebra, geometer's Sketchpad, autographs, c ++, etc.
92%
4,16%
4% 3,84%
Non-manipulatives
Concrete Manipulatives
Virtual Manipulatives
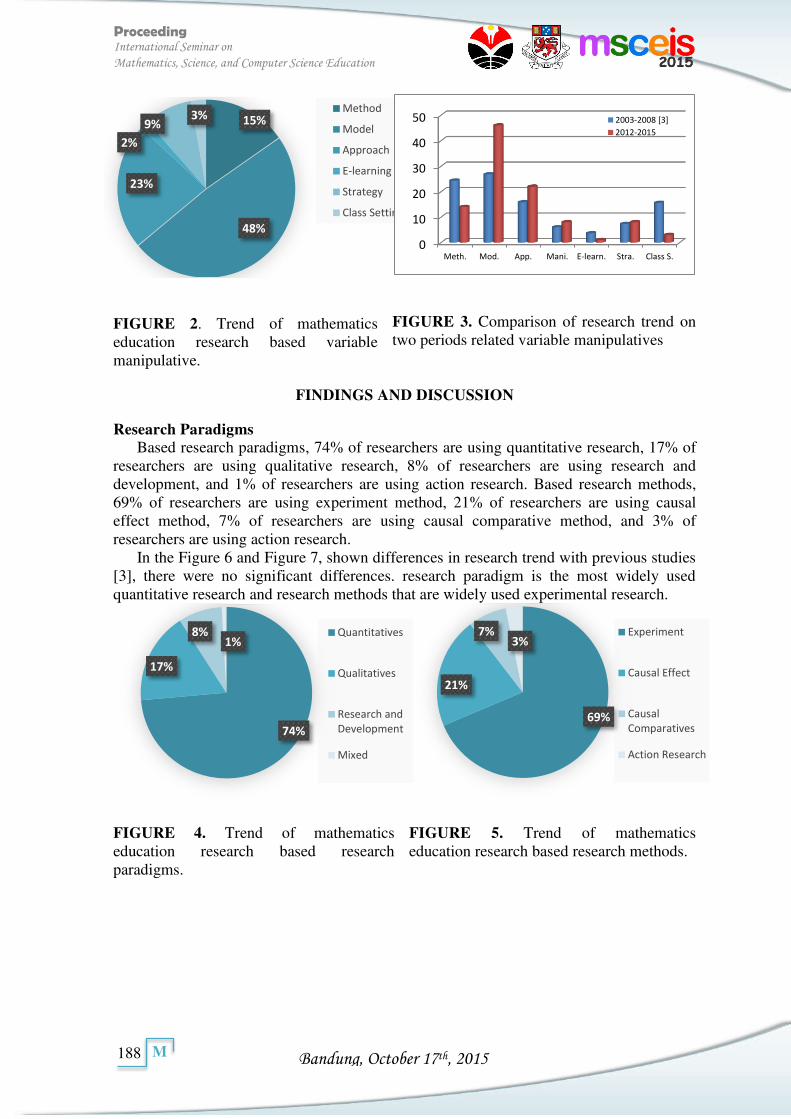
Bandung, October 17th, 2015
Proceeding International Seminar on
Mathematics, Science, and Computer Science Education
188
M
74%
17%
8% 1%
Quantitatives
Qualitatives
Research and
Development
Mixed
69%
21%
7% 3%
Experiment
Causal Effect
Causal
Comparatives
Action Research
15%
48%
23%
2%
9% 3%
Method
Model
Approach
E-learning
Strategy
Class Setting
FIGURE 2. Trend of mathematics education research based variable manipulative.
FIGURE 3. Comparison of research trend on two periods related variable manipulatives
FINDINGS AND DISCUSSION
Research Paradigms Based research paradigms, 74% of researchers are using quantitative research, 17% of
researchers are using qualitative research, 8% of researchers are using research and development, and 1% of researchers are using action research. Based research methods, 69% of researchers are using experiment method, 21% of researchers are using causal effect method, 7% of researchers are using causal comparative method, and 3% of researchers are using action research.
In the Figure 6 and Figure 7, shown differences in research trend with previous studies [3], there were no significant differences. research paradigm is the most widely used quantitative research and research methods that are widely used experimental research. FIGURE 4. Trend of mathematics education research based research paradigms.
FIGURE 5. Trend of mathematics education research based research methods.
0
10
20
30
40
50
Meth. Mod. App. Mani. E-learn. Stra. Class S.
2003-2008 [3]
2012-2015
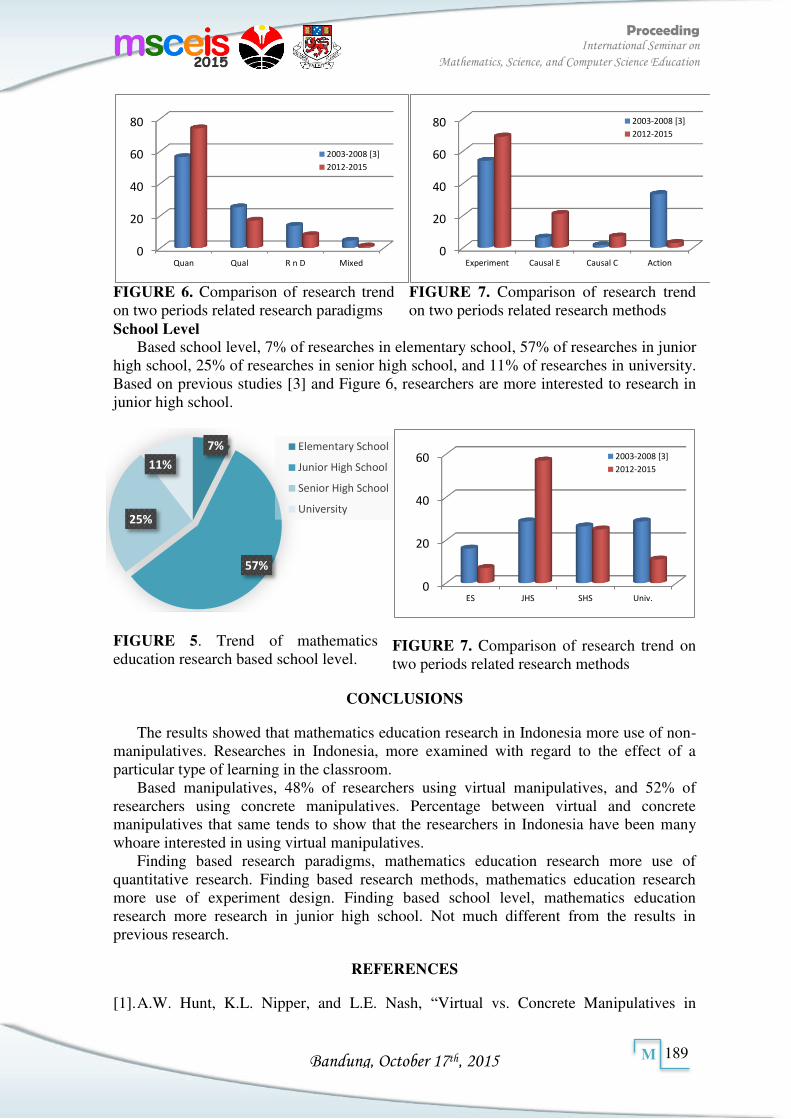
Bandung, October 17th, 2015
Proceeding International Seminar on
Mathematics, Science, and Computer Science Education
189
M
7%
57%
25%
11%
Elementary School
Junior High School
Senior High School
University
FIGURE 6. Comparison of research trend on two periods related research paradigms
FIGURE 7. Comparison of research trend on two periods related research methods
School Level Based school level, 7% of researches in elementary school, 57% of researches in junior
high school, 25% of researches in senior high school, and 11% of researches in university. Based on previous studies [3] and Figure 6, researchers are more interested to research in junior high school.
FIGURE 5. Trend of mathematics education research based school level.
FIGURE 7. Comparison of research trend on two periods related research methods
CONCLUSIONS
The results showed that mathematics education research in Indonesia more use of non-manipulatives. Researches in Indonesia, more examined with regard to the effect of a particular type of learning in the classroom.
Based manipulatives, 48% of researchers using virtual manipulatives, and 52% of researchers using concrete manipulatives. Percentage between virtual and concrete manipulatives that same tends to show that the researchers in Indonesia have been many whoare interested in using virtual manipulatives.
Finding based research paradigms, mathematics education research more use of quantitative research. Finding based research methods, mathematics education research more use of experiment design. Finding based school level, mathematics education research more research in junior high school. Not much different from the results in previous research.
REFERENCES
[1]. A.W. Hunt, K.L. Nipper, and L.E. Nash, “Virtual vs. Concrete Manipulatives in
0
20
40
60
80
Quan Qual R n D Mixed
2003-2008 [3]
2012-2015
0
20
40
60
80
Experiment Causal E Causal C Action
2003-2008 [3]
2012-2015
0
20
40
60
ES JHS SHS Univ.
2003-2008 [3]
2012-2015

Bandung, October 17th, 2015
Proceeding International Seminar on
Mathematics, Science, and Computer Science Education
190
M
Mathematics Teacher EducationIs One Type More Effective Than the Other?”, Current Issues in Middle Level Education 16(2), pp. 1-6 (2011).
[2]. S, O’Connell, and J. SanGiovanni, Mastering the Basic Math Facts in Multiplication and Division, (Heinemann, Portsmouth, 2011), pp. 5.
[3]. J. Sabandar, “Tren Penelitian Pendidikan Matematika di Indonesia”, (2009). Retrieved froms http://dokumen.tips
[4]. M.A. Shulhany, Sukirwan, and Syamsuri, “Abstraksi Siswa pada Materi Dimensi tiga dengan Bantuan Geogebra”, Jurnal Penelitian dan Pembelajaran Matematika (JPPM) Untirta 7(2), pp. 31-42 (2014).
[5]. J.A. Van de Walle, K.S. Karp, and J.M.B. Williams, Elementary and middle
school mathematics: Teaching developmentally 8, (Pearson, Boston, 2013), pp. 24.
[6]. L. West, Using Physical and Virtual Manipulatives with Eighth Grade Geometry Students, (University of Nebraska, Bellevue, 2011), pp. 12.
Bandung, October 17th, 2015
Proceeding International Seminar on
Mathematics, Science, and Computer Science Education
191
M
MATH-08126
Zimmermann Development Method Solutions to Solve the Problem Optimal Fuzzy Linear Programming
Lukman1, Entit Puspita1, Fitriani Agustina1
1DepartemenPendidikan Matematika, Universitas Pendidikan Indonesia, Jl. Dr. Setiabudi no 229, Bandung40154, Indonesia
Article info Abstract
Keywords:
Fuzzy Linear Programming,
Zimmerman Method, Ranking
Thorani.
There are several methods of problems solving Fuzzy Linear Programming (FLP) proposed by the researchers. One of the most commonly method used to resolve the problems FLP is Zimmermann method. In the Zimmermann method, the main objective function cx is added to the constraints as a fuzzy goal to maximize the objective function (z*) the newly, further define the optimal solution alternative (AOS) from the new Linear Programming. Zimmermann method has shortcomings that is Zimmerman method may not always present the “best” solution in the case of FLP unbounded, but Zimmermann method has a solution bounded as the optimal solution. To overcome these shortcomings we propose an alternative method to resolve FLP by using a rankingThorani et al and software program to complete the FLP.
Corresponding Author:
INTRODUCTION Study about fuzzy linear programming with its solving has been suggested by many
researchers, such as: R.E.Bellman and L.A. Zadeh in "Decision Making in a Fuzzy Environment"9, Tanaka, Okada, andAsaiin "On Fuzzy Mathematical Programming"4, and Zimmermann was the first scientist who introduced the fuzzy linear programming using to transform these problems nonlinear programming crips3. Maleki, Safi, and Zaemazad tested the Zimmermann method8, Kumar used fuzzy linear programming approach to solvefuzzy transportation problems1, Kumar and Bhatia examined the sensitivity analysis of fuzzy linear programming model using interval-valued fuzzy definition2,5. Lukman and Sufyani added step to the Kumar and Bhatia’s assessment using the revised simplex method and the solution using Lindo software6.
Based on the results of previous studies, obtained information that Zimmerman method will produce an excellent solution for the case of fuzzy linear programming with abounded solution area, but will result in the completion of the less well in the case of fuzzy linear programming with unbounded local solutions. Furthermore, this study will develop Zimmermann method using definition of ranking formulated by Thorani, Phani, and Rafi and it is named by us as the Zimmermann development method (PZM method)10.The next process, testing the optimization of this Zimmermann development method using the same method used by Maleki.Then comparing Zimmermann development method with fuzzy assignment models formulated by Kumar.
DefinitionandArithmetic Operations ofTrapezoidFuzzyNumber
Definition 1 (Generalized Trapezoid Fuzzy Number). = , , , ; is calledthegeneralizedfuzzy numberswhere ∈ [ , ] and membership function,
= { −− , ,−− ,
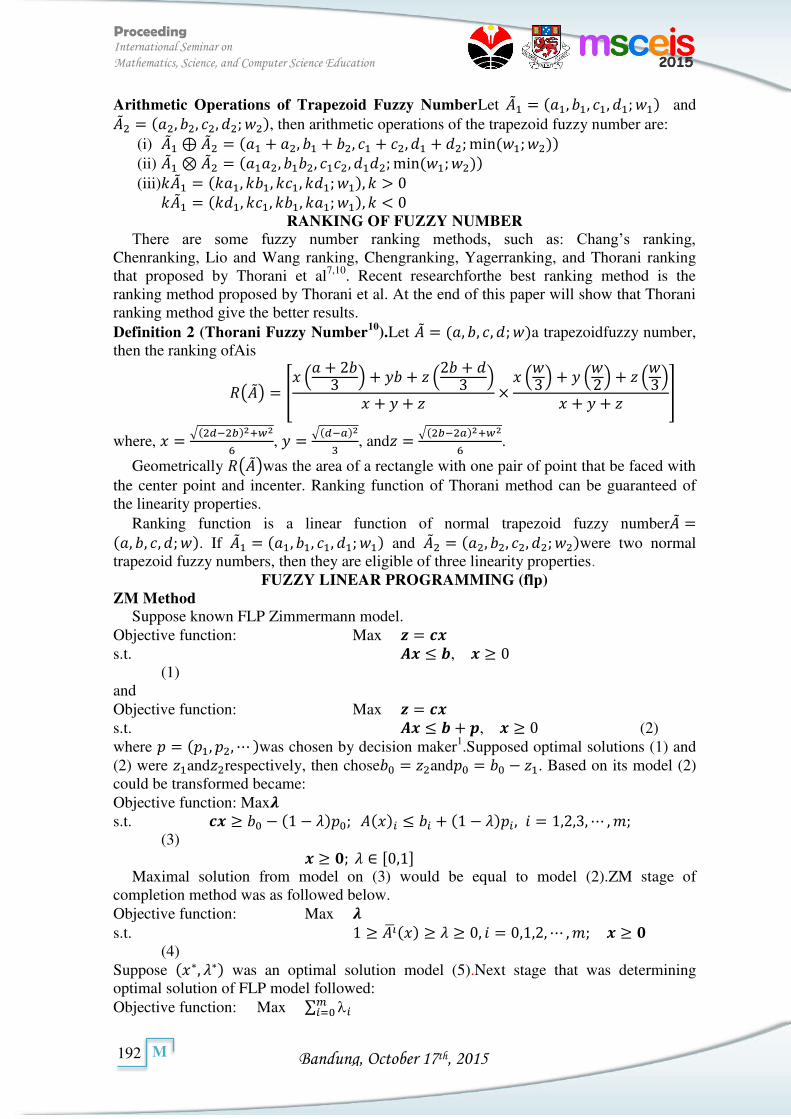
Bandung, October 17th, 2015
Proceeding International Seminar on
Mathematics, Science, and Computer Science Education
192
M
Arithmetic Operations of Trapezoid Fuzzy NumberLet = , , , ; and = , , , ; , then arithmetic operations of the trapezoid fuzzy number are: (i) ⊕ = + , + , + , + ;min ; (ii) ⊗ = , , , ; min ; (iii)� = � , � , � , � ; , � >
� = � , � , � , � ; , � < RANKING OF FUZZY NUMBER
There are some fuzzy number ranking methods, such as: Chang’s ranking, Chenranking, Lio and Wang ranking, Chengranking, Yagerranking, and Thorani ranking that proposed by Thorani et al7,10. Recent researchforthe best ranking method is the ranking method proposed by Thorani et al. At the end of this paper will show that Thorani ranking method give the better results. Definition 2 (Thorani Fuzzy Number10).Let = , , , ; a trapezoidfuzzy number, then the ranking ofAis ( ) = [ + + + ++ + × + ++ + ] where, = √ − +
, = √ −, and = √ − +
.
Geometrically ( )was the area of a rectangle with one pair of point that be faced with the center point and incenter. Ranking function of Thorani method can be guaranteed of the linearity properties.
Ranking function is a linear function of normal trapezoid fuzzy number =, , , ; . If = , , , ; and = , , , ; were two normal trapezoid fuzzy numbers, then they are eligible of three linearity properties.
FUZZY LINEAR PROGRAMMING (flp) ZM Method
Suppose known FLP Zimmermann model. Objective function: Max � = � s.t. �� , � (1) and Objective function: Max � = � s.t. �� + , � (2) where � = � , � , was chosen by decision maker1.Supposed optimal solutions (1) and (2) were and respectively, then chose = and� = − . Based on its model (2) could be transformed became: Objective function: Max� s.t. � − − � ; + − � , � = , , , , ; (3) � �; ∈ [ , ]
Maximal solution from model on (3) would be equal to model (2).ZM stage of completion method was as followed below. Objective function: Max � s.t. � , � = , , , , ; � � (4) Suppose ∗, ∗ was an optimal solution model (5).Next stage that was determining optimal solution of FLP model followed: Objective function: Max ∑ =
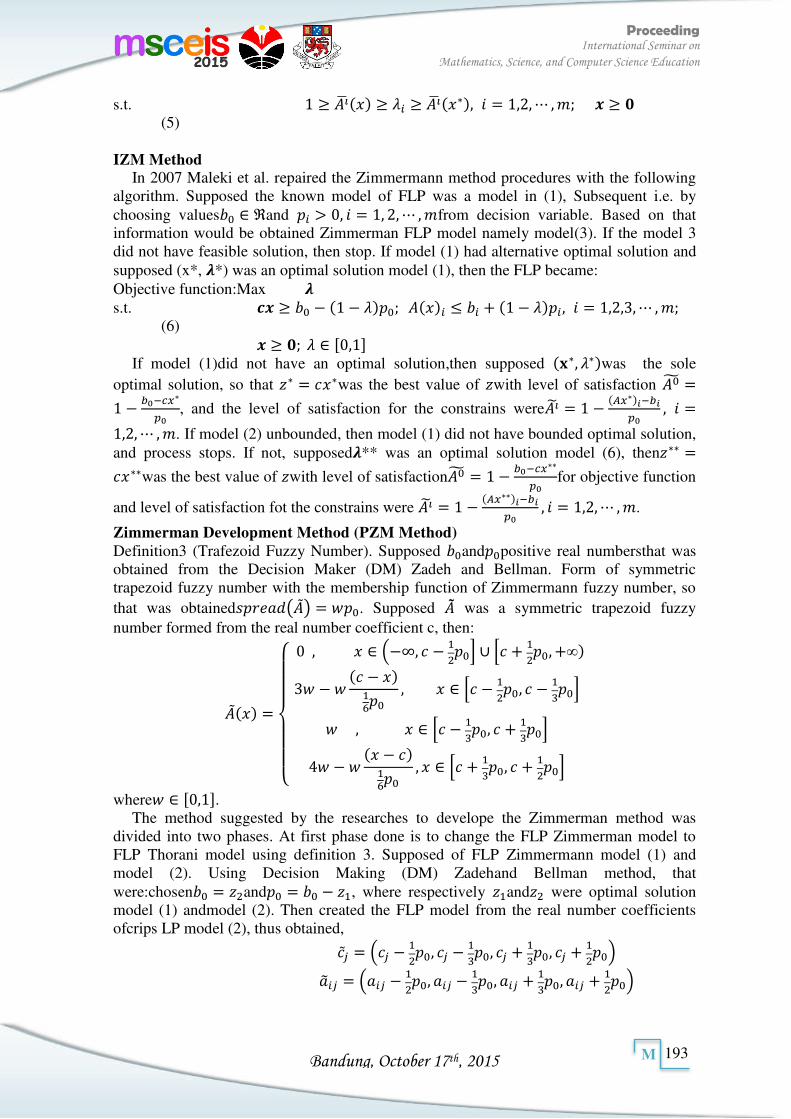
Bandung, October 17th, 2015
Proceeding International Seminar on
Mathematics, Science, and Computer Science Education
193
M
s.t. � � ∗ , � = , , , ; � � (5) IZM Method
In 2007 Maleki et al. repaired the Zimmermann method procedures with the following algorithm. Supposed the known model of FLP was a model in (1), Subsequent i.e. by choosing values ∈ ℜand � > , � = , , , from decision variable. Based on that information would be obtained Zimmerman FLP model namely model(3). If the model 3 did not have feasible solution, then stop. If model (1) had alternative optimal solution and supposed (x*, �*) was an optimal solution model (1), then the FLP became: Objective function:Max � s.t. � − − � ; + − � , � = , , , , ; (6) � �; ∈ [ , ]
If model (1)did not have an optimal solution,then supposed �∗, ∗ was the sole
optimal solution, so that ∗ = ∗was the best value of with level of satisfaction =− − ∗, and the level of satisfaction for the constrains were � = − ∗ − , � =, , , . If model (2) unbounded, then model (1) did not have bounded optimal solution,
and process stops. If not, supposed�** was an optimal solution model (6), then ∗∗ =∗∗was the best value of with level of satisfaction = − − ∗∗for objective function
and level of satisfaction fot the constrains were � = − ∗∗ − , � = , , , .
Zimmerman Development Method (PZM Method) Definition3 (Trafezoid Fuzzy Number). Supposed and� positive real numbersthat was obtained from the Decision Maker (DM) Zadeh and Bellman. Form of symmetric trapezoid fuzzy number with the membership function of Zimmermann fuzzy number, so that was obtained � ( ) = � . Supposed was a symmetric trapezoid fuzzy number formed from the real number coefficient c, then:
={ , ∈ −∞, − � ] [ + � ,+∞− −� , ∈ [ − � , − � ] , ∈ [ − � , + � ]− −� , ∈ [ + � , + � ]
where ∈ [ , ]. The method suggested by the researches to develope the Zimmerman method was
divided into two phases. At first phase done is to change the FLP Zimmerman model to FLP Thorani model using definition 3. Supposed of FLP Zimmermann model (1) and model (2). Using Decision Making (DM) Zadehand Bellman method, that were:chosen = and� = − , where respectively and were optimal solution model (1) andmodel (2). Then created the FLP model from the real number coefficients ofcrips LP model (2), thus obtained, = − � , − � , + � , + � = − � , − � , + � , + �
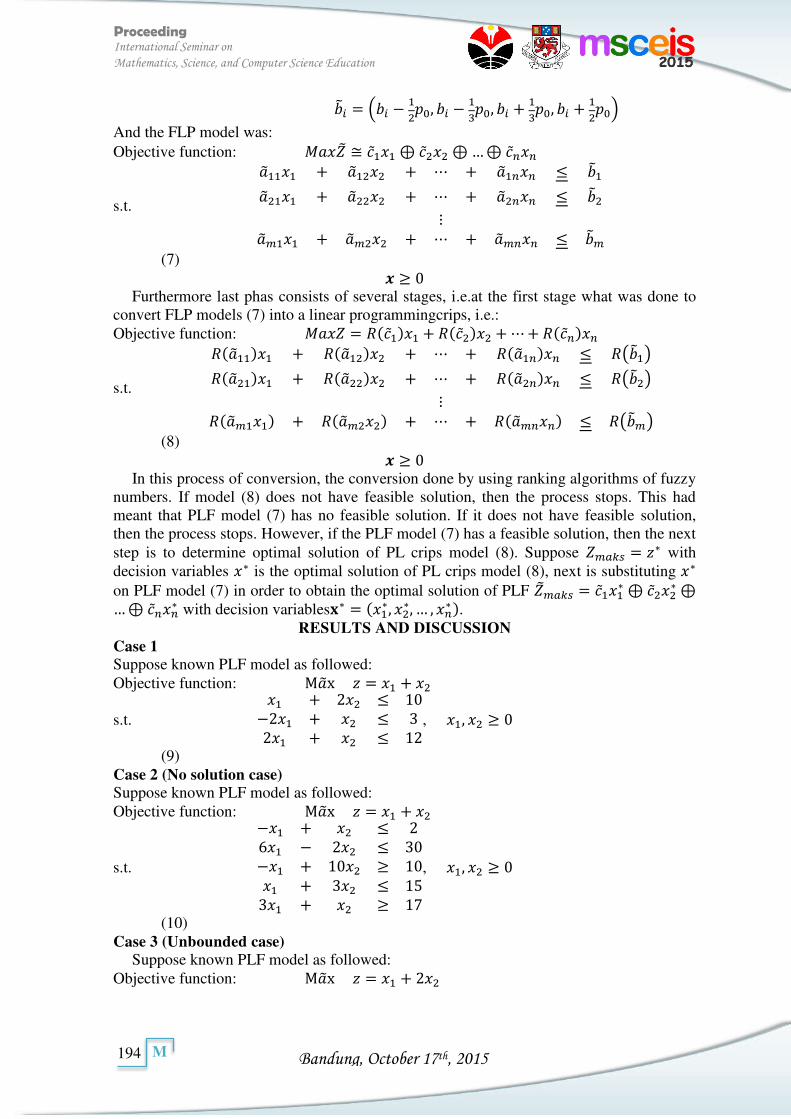
Bandung, October 17th, 2015
Proceeding International Seminar on
Mathematics, Science, and Computer Science Education
194
M
= − � , − � , + � , + �
And the FLP model was: Objective function: ≅ ⊕ ⊕ …⊕
s.t.
+ + + + + + + + +
(7) � Furthermore last phas consists of several stages, i.e.at the first stage what was done to
convert FLP models (7) into a linear programmingcrips, i.e.: Objective function: = + + +
s.t.
+ + + ( ) + + + ( ) + + + ( ) (8) �
In this process of conversion, the conversion done by using ranking algorithms of fuzzy numbers. If model (8) does not have feasible solution, then the process stops. This had meant that PLF model (7) has no feasible solution. If it does not have feasible solution, then the process stops. However, if the PLF model (7) has a feasible solution, then the next step is to determine optimal solution of PL crips model (8). Suppose = ∗ with decision variables ∗ is the optimal solution of PL crips model (8), next is substituting ∗ on PLF model (7) in order to obtain the optimal solution of PLF = ∗⊕ ∗⊕…⊕ ∗ with decision variables�∗ = ∗, ∗, … , ∗ .
RESULTS AND DISCUSSION Case 1 Suppose known PLF model as followed: Objective function: Mx = +
s.t. +− ++ , ,
(9) Case 2 (No solution case) Suppose known PLF model as followed: Objective function: Mx = +
s.t.
− +−− +++ , ,
(10) Case 3 (Unbounded case)
Suppose known PLF model as followed: Objective function: Mx = +
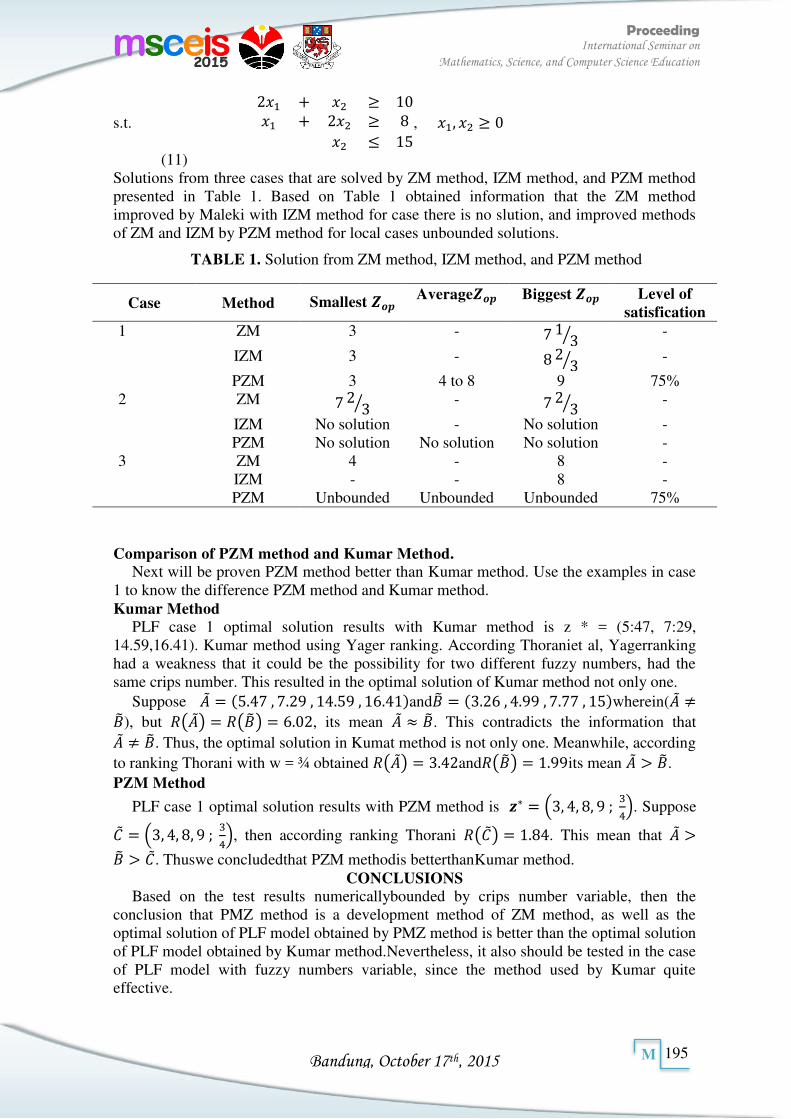
Bandung, October 17th, 2015
Proceeding International Seminar on
Mathematics, Science, and Computer Science Education
195
M
s.t. ++ , ,
(11) Solutions from three cases that are solved by ZM method, IZM method, and PZM method presented in Table 1. Based on Table 1 obtained information that the ZM method improved by Maleki with IZM method for case there is no slution, and improved methods of ZM and IZM by PZM method for local cases unbounded solutions.
TABLE 1. Solution from ZM method, IZM method, and PZM method
Case Method Smallest Average Biggest Level of
satisfication 1 ZM 3 - ⁄ -
IZM 3 - ⁄ -
PZM 3 4 to 8 9 75% 2 ZM ⁄ - ⁄ -
IZM No solution - No solution - PZM No solution No solution No solution -
3 ZM 4 - 8 - IZM - - 8 - PZM Unbounded Unbounded Unbounded 75%
Comparison of PZM method and Kumar Method.
Next will be proven PZM method better than Kumar method. Use the examples in case 1 to know the difference PZM method and Kumar method. Kumar Method
PLF case 1 optimal solution results with Kumar method is z * = (5:47, 7:29, 14.59,16.41). Kumar method using Yager ranking. According Thoraniet al, Yagerranking had a weakness that it could be the possibility for two different fuzzy numbers, had the same crips number. This resulted in the optimal solution of Kumar method not only one.
Suppose = . , . , . , . and = . , . , . , wherein( ≠), but ( ) = ( ) = . , its mean ≈ . This contradicts the information that ≠ . Thus, the optimal solution in Kumat method is not only one. Meanwhile, according to ranking Thorani with w = ¾ obtained ( ) = . and ( ) = . its mean > . PZM Method
PLF case 1 optimal solution results with PZM method is �∗ = , , , ; . Suppose = , , , ; , then according ranking Thorani ( ) = . . This mean that > > . Thuswe concludedthat PZM methodis betterthanKumar method. CONCLUSIONS
Based on the test results numericallybounded by crips number variable, then the conclusion that PMZ method is a development method of ZM method, as well as the optimal solution of PLF model obtained by PMZ method is better than the optimal solution of PLF model obtained by Kumar method.Nevertheless, it also should be tested in the case of PLF model with fuzzy numbers variable, since the method used by Kumar quite effective.
Bandung, October 17th, 2015
Proceeding International Seminar on
Mathematics, Science, and Computer Science Education
196
M
ACKNOWLEDGE We acknowledged to Kementrian Riset, Teknologi dan Pendidikan Tinggi (Grant:
Hibah Bersaing).
References A. Kumar and N. Bhatia, a New Method for Solving Sensitivity Analysis for Fuzzy Linear
Programming Problems. (International Journal of Applied Science and Engineering, vol. 9, Taiwan, 2011), pp. 169-176.
A. Kumar and N. Bhatia,Sensitivity Analysis for Interval-Valued Fully Fuzzy Linear
Programming Problems, (Journal of Applied and Technology, vol. 10, Mexico, 2012), pp. 871-883.
H. J. Zimmermann, Fuzzy Programming and Linear Programming with Several Objective
Functions (Fuzzy Sets and Systems, vol. 1, 1978), pp. 45-55. H. Tanaka, T. Okuda, and K. Asai, On Fuzzy Mathematical Programming, (Journal of
Cybernetics, vol.3, 1974), pp. 37 – 46. J. Shieh-Su, Fuzzy Programming Based on Interval-Valued Fuzzy Numbers and Ranking,
(Int. J. Contemp. Math Science, vol. 2, Bulgaria, 2007), pp. 393 – 410. Lukman, and Sufyani P., Sensitivity Analysis Of Linear Programming Model With
Parameter Coefficients Of The Objective Function In The Form Of Triangular Fuzzy
Numbers, in MSCEIS 2013 Proceeding, edited by Hertien, et.al. (Faculty of Mathematics and Science Education, Bandung, 2013), pp 45 – 50.
L. Campus, and Verdagay, Linear Programming Problem and Ranking of Fuzzy Number (Fuzzy Sets and Systems, Vol. 32, 1989). pp. 1-11.
M. R. Safi, H. R. Maleki, and E. Zaemazad, A Note on The Zimmermann Method for
Solving Fuzzy Linear Programming Problems, (Iranian Journal of Fuzzy Systems, vol. 4,Zahedan, 2007), pp. 31-45.
R. E., Bellman and L. A., Zadeh, Decision Making in a Fuzzy Environment, (Management
Science, vol. 17, New York City, 1970), pp. 141-164. Thorani Y.I.P., Phani, and Ravi S., Ordering Generalized Trapezoidal Fuzzy Number, (Int.
Math Sciences, vol.7, no 12, , 2012), pp. 555-573. Thorani Y.I.P., and Ravi S., Fuzzy Assignment Problem with Generalized Fuzzy Numbers,
(Applied Mathematical Sciences, vol.7, no 71, 2013), pp. 3511-3537.
Bandung, October 17th, 2015
Proceeding International Seminar on
Mathematics, Science, and Computer Science Education
197
M
MATH-08204
Using Geometers’ Sketchpad Software to Present Fractal Geometry
Ali Shodikin
Mathematics Education Department, Universitas Islam Darul Ulum, Jl. Airlangga 3 Sukodadi Lamongan, Indonesia
Article info Abstract
Keywords:
Geometer”s Sketchpad, fractal
geometry, aesthetics.
Geometry is one of the oldest branches of mathematics. The development of this branch of science has been very rapid and has many utilities. Dynamic geometry, for instance, which elicits aesthetics aspects in mathematics is called fractal geometry. Some software has been utilized to facilitate this branch of geometry, including Geometers‟ Sketchpad (GSP). In Indonesia, experts who are interested in studying the development of fractal geometry are still very few. This article aims to display some examples of Geometer‟s Sketchpad software usage in presenting fractal geometry. There are three utilization stages done in using the GSP, namely generator making, iteration designing and plan implementation.
Corresponding Author:
INTRODUCTION When you go to a grocery store and buy a cauliflower, try to cut the tip of it into two
and observe the structure of it (see Figure 1(a)). It will shows you that generally the geometry shape of each part of a cauliflower is a repetition of the overall shape with smaller size on-branching ramifications. Each smaller part looks like, unvarying (similar) to the larger part. Since every part of cauliflower is congruent (similar) to the overall shape of cauliflower, then the cauliflower is said “self-similar”. Can you specify other vegetables which are self-similar? What about the other objects in the world which are also self-similar?
(a) (b)
FIGURE 1. (a) The tip of cauliflower, (b) The self-similar triangles
Figure 2 shows the example of geometry which is also self-similar, in which the smaller parts are similar to the overall shape of the model. The object that is composed of smaller models of theirself is called self-similar.
LITERATURE REVIEW Fractal Geometry
The self-similar objects as shown in Figure 2, has been used since hundreds of years ago as the application of mathematics in decoration. In contrast to traditional mathematics,
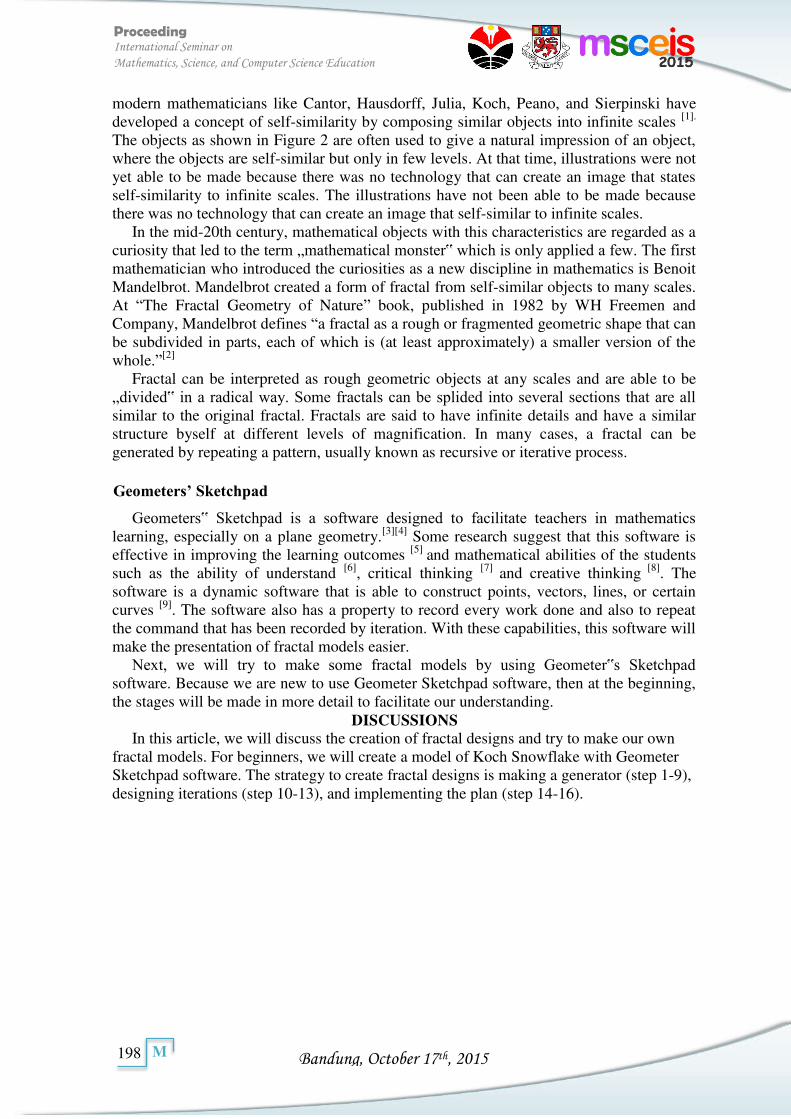
Bandung, October 17th, 2015
Proceeding International Seminar on
Mathematics, Science, and Computer Science Education
198
M
modern mathematicians like Cantor, Hausdorff, Julia, Koch, Peano, and Sierpinski have developed a concept of self-similarity by composing similar objects into infinite scales [1].
The objects as shown in Figure 2 are often used to give a natural impression of an object, where the objects are self-similar but only in few levels. At that time, illustrations were not yet able to be made because there was no technology that can create an image that states self-similarity to infinite scales. The illustrations have not been able to be made because there was no technology that can create an image that self-similar to infinite scales.
In the mid-20th century, mathematical objects with this characteristics are regarded as a curiosity that led to the term „mathematical monster‟ which is only applied a few. The first mathematician who introduced the curiosities as a new discipline in mathematics is Benoit Mandelbrot. Mandelbrot created a form of fractal from self-similar objects to many scales. At “The Fractal Geometry of Nature” book, published in 1982 by WH Freemen and Company, Mandelbrot defines “a fractal as a rough or fragmented geometric shape that can be subdivided in parts, each of which is (at least approximately) a smaller version of the whole.”[2]
Fractal can be interpreted as rough geometric objects at any scales and are able to be „divided‟ in a radical way. Some fractals can be splided into several sections that are all similar to the original fractal. Fractals are said to have infinite details and have a similar structure byself at different levels of magnification. In many cases, a fractal can be generated by repeating a pattern, usually known as recursive or iterative process.
Geometers’ Sketchpad
Geometers‟ Sketchpad is a software designed to facilitate teachers in mathematics learning, especially on a plane geometry.[3][4] Some research suggest that this software is effective in improving the learning outcomes [5] and mathematical abilities of the students such as the ability of understand [6], critical thinking [7] and creative thinking [8]. The software is a dynamic software that is able to construct points, vectors, lines, or certain curves [9]. The software also has a property to record every work done and also to repeat the command that has been recorded by iteration. With these capabilities, this software will make the presentation of fractal models easier.
Next, we will try to make some fractal models by using Geometer‟s Sketchpad software. Because we are new to use Geometer Sketchpad software, then at the beginning, the stages will be made in more detail to facilitate our understanding.
DISCUSSIONS In this article, we will discuss the creation of fractal designs and try to make our own
fractal models. For beginners, we will create a model of Koch Snowflake with Geometer Sketchpad software. The strategy to create fractal designs is making a generator (step 1-9), designing iterations (step 10-13), and implementing the plan (step 14-16).
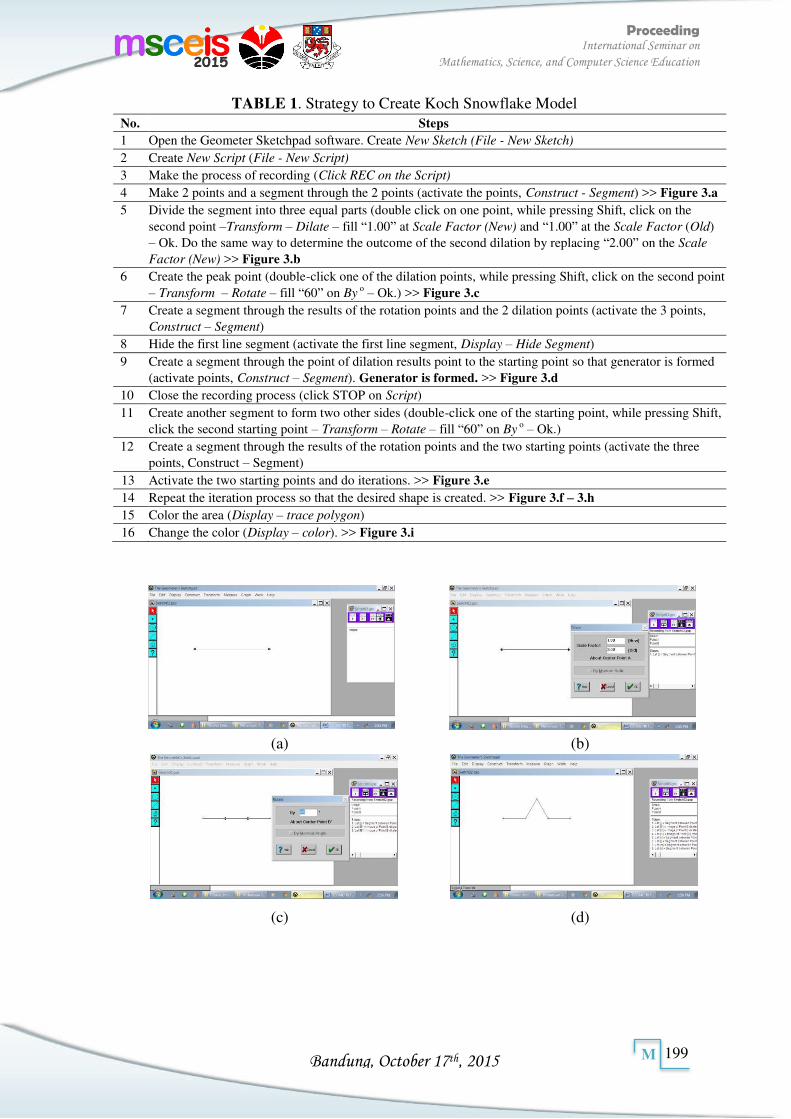
Bandung, October 17th, 2015
Proceeding International Seminar on
Mathematics, Science, and Computer Science Education
199
M
TABLE 1. Strategy to Create Koch Snowflake Model No. Steps 1 Open the Geometer Sketchpad software. Create New Sketch (File - New Sketch)
2 Create New Script (File - New Script) 3 Make the process of recording (Click REC on the Script) 4 Make 2 points and a segment through the 2 points (activate the points, Construct - Segment) >> Figure 3.a 5 Divide the segment into three equal parts (double click on one point, while pressing Shift, click on the
second point –Transform – Dilate – fill “1.00” at Scale Factor (New) and “1.00” at the Scale Factor (Old) – Ok. Do the same way to determine the outcome of the second dilation by replacing “2.00” on the Scale
Factor (New) >> Figure 3.b 6 Create the peak point (double-click one of the dilation points, while pressing Shift, click on the second point
– Transform – Rotate – fill “60” on By o – Ok.) >> Figure 3.c
7 Create a segment through the results of the rotation points and the 2 dilation points (activate the 3 points, Construct – Segment)
8 Hide the first line segment (activate the first line segment, Display – Hide Segment)
9 Create a segment through the point of dilation results point to the starting point so that generator is formed (activate points, Construct – Segment). Generator is formed. >> Figure 3.d
10 Close the recording process (click STOP on Script)
11 Create another segment to form two other sides (double-click one of the starting point, while pressing Shift, click the second starting point – Transform – Rotate – fill “60” on By
o – Ok.)
12 Create a segment through the results of the rotation points and the two starting points (activate the three points, Construct – Segment)
13 Activate the two starting points and do iterations. >> Figure 3.e 14 Repeat the iteration process so that the desired shape is created. >> Figure 3.f – 3.h 15 Color the area (Display – trace polygon) 16 Change the color (Display – color). >> Figure 3.i
(a) (b)
(c) (d)
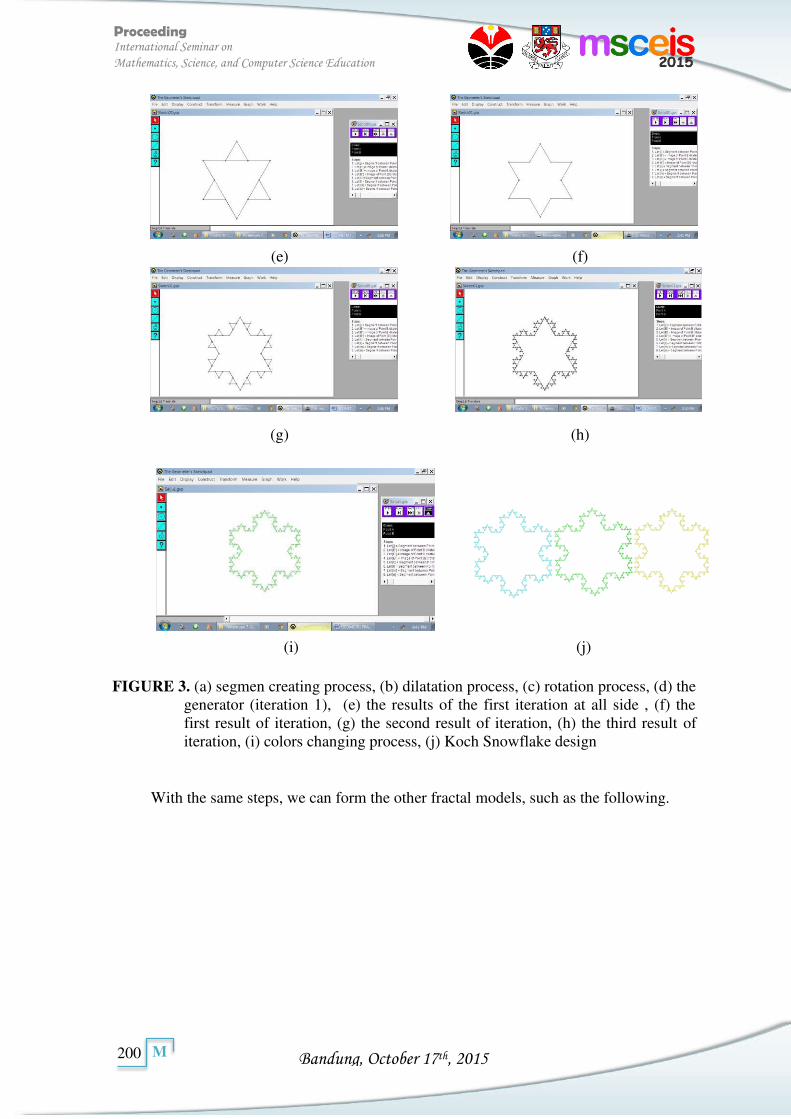
Bandung, October 17th, 2015
Proceeding International Seminar on
Mathematics, Science, and Computer Science Education
200
M
(e) (f)
(g) (h)
(i) (j)
FIGURE 3. (a) segmen creating process, (b) dilatation process, (c) rotation process, (d) the
generator (iteration 1), (e) the results of the first iteration at all side , (f) the first result of iteration, (g) the second result of iteration, (h) the third result of iteration, (i) colors changing process, (j) Koch Snowflake design
With the same steps, we can form the other fractal models, such as the following.
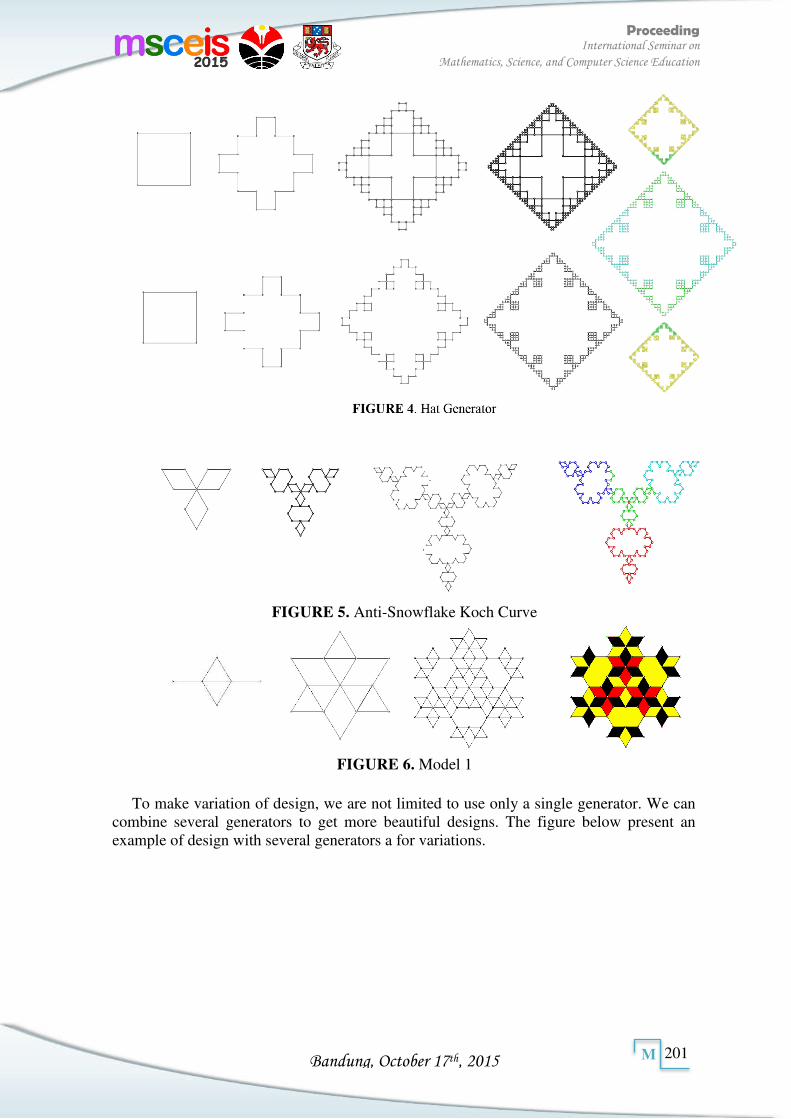
Bandung, October 17th, 2015
Proceeding International Seminar on
Mathematics, Science, and Computer Science Education
201
M
FIGURE 5. Anti-Snowflake Koch Curve
FIGURE 6. Model 1
To make variation of design, we are not limited to use only a single generator. We can
combine several generators to get more beautiful designs. The figure below present an example of design with several generators a for variations.
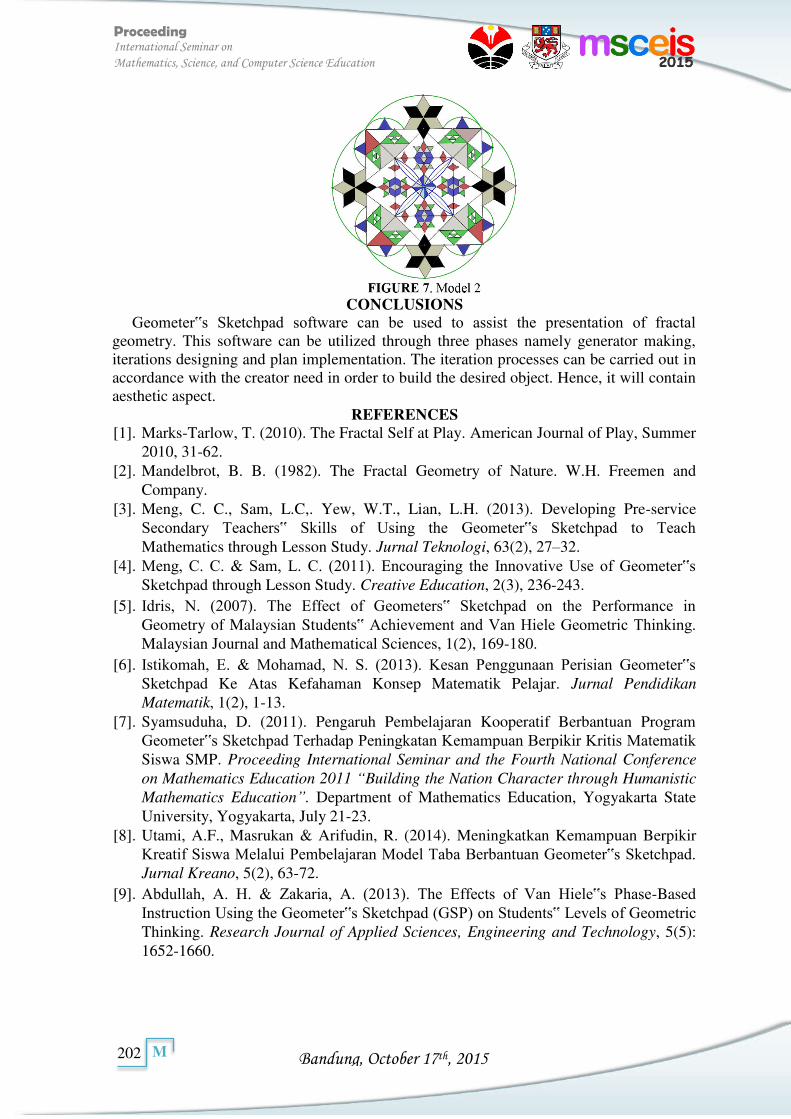
Bandung, October 17th, 2015
Proceeding International Seminar on
Mathematics, Science, and Computer Science Education
202
M
CONCLUSIONS
Geometer‟s Sketchpad software can be used to assist the presentation of fractal geometry. This software can be utilized through three phases namely generator making, iterations designing and plan implementation. The iteration processes can be carried out in accordance with the creator need in order to build the desired object. Hence, it will contain aesthetic aspect.
REFERENCES [1]. Marks-Tarlow, T. (2010). The Fractal Self at Play. American Journal of Play, Summer
2010, 31-62. [2]. Mandelbrot, B. B. (1982). The Fractal Geometry of Nature. W.H. Freemen and
Company. [3]. Meng, C. C., Sam, L.C,. Yew, W.T., Lian, L.H. (2013). Developing Pre-service
Secondary Teachers‟ Skills of Using the Geometer‟s Sketchpad to Teach Mathematics through Lesson Study. Jurnal Teknologi, 63(2), 27–32.
[4]. Meng, C. C. & Sam, L. C. (2011). Encouraging the Innovative Use of Geometer‟s Sketchpad through Lesson Study. Creative Education, 2(3), 236-243.
[5]. Idris, N. (2007). The Effect of Geometers‟ Sketchpad on the Performance in Geometry of Malaysian Students‟ Achievement and Van Hiele Geometric Thinking. Malaysian Journal and Mathematical Sciences, 1(2), 169-180.
[6]. Istikomah, E. & Mohamad, N. S. (2013). Kesan Penggunaan Perisian Geometer‟s Sketchpad Ke Atas Kefahaman Konsep Matematik Pelajar. Jurnal Pendidikan
Matematik, 1(2), 1-13. [7]. Syamsuduha, D. (2011). Pengaruh Pembelajaran Kooperatif Berbantuan Program
Geometer‟s Sketchpad Terhadap Peningkatan Kemampuan Berpikir Kritis Matematik Siswa SMP. Proceeding International Seminar and the Fourth National Conference
on Mathematics Education 2011 “Building the Nation Character through Humanistic
Mathematics Education”. Department of Mathematics Education, Yogyakarta State University, Yogyakarta, July 21-23.
[8]. Utami, A.F., Masrukan & Arifudin, R. (2014). Meningkatkan Kemampuan Berpikir Kreatif Siswa Melalui Pembelajaran Model Taba Berbantuan Geometer‟s Sketchpad. Jurnal Kreano, 5(2), 63-72.
[9]. Abdullah, A. H. & Zakaria, A. (2013). The Effects of Van Hiele‟s Phase-Based Instruction Using the Geometer‟s Sketchpad (GSP) on Students‟ Levels of Geometric Thinking. Research Journal of Applied Sciences, Engineering and Technology, 5(5): 1652-1660.
Bandung, October 17th, 2015
Proceeding International Seminar on
Mathematics, Science, and Computer Science Education
203
M
MATH-07314
The Project-Based Learning Approach Using Geogebra to Develop Creativity in University Students
Hedi Budiman
Mathematics Education, University of Suryakancana
Article info Abstract
Keywords: Project-Based Learning, Geogebra, Creativity
Project-Based Learning (PBL) is an innovative approach to learning that teaches a multitude of strategies critical for success in the twenty-first century. Undergraduate Students drive their own learning through inquiry, as well as work collaboratively to research and create projects that reflect their knowledge. Using Geogebra as technology application in learning encouraging students to develop creativity. For the teacher, using technology in learning can help students to understand the concepts and to improve teaching mathematics in classroom. The study aim to investigate the effects of project-based learning on undergraduate students‘ creativity by creating teaching material for Junior and Secondary school using Geogebra. Totally 66 undergraduate students participated in the study. The research used quantitative descriptive techniques. The teacher in school appropriated the materials involved to evaluate students’ project. The results showed that project-based learning was more effective to develop students’ creativity that useful in the future as a teacher. Students more respect and good attitude toward the subject.
Corresponding Author: [email protected]
INTRODUCTION Creating projects is a long-standing tradition in education history21. The idea of
assigning projects to students and the benefits of learning by practice have long been touted13, the roots of the idea go back to John Dewey12. Project-based learning is an authentic learning model or strategy in which students plan, implement, and evaluate projects that have real-world applications beyond the classroom17. Thomas 13 defined five PBL criteria: (a) Projects are central, not peripheral to the curriculum; (b) projects are focused on questions or problems that drive students to encounter (and struggle with) the central concepts and principals of the discipline; (c) projects involve students in a constructive investigation; (d) projects are student-driven to some significant degree; and (e) projects are realistic, not school-like. Collaboration is also included as a sixth criterion of PBL. Project-based learning has been defined in many ways. For this reason there exists no single definition. In the given definitions, project-based learning has been referred to as a model, approach or a technique, or as learning or teaching. The genesis of a project is an inquiry. Students develop a question and are guided through research under the teacher’s supervision. Discoveries are illustrated by creating a project to share with a select audience. Student choice is a key element of this approach. Teachers oversee each step of the process and approve each choice before the student embarks in a direction. Children with similar inquiries may elect to work cooperatively, thereby nurturing twenty-first -century collaboration and communication skills and honoring students’ individual learning styles or preferences. PBL is not a supplementary activity to support learning. It is the basis of the curriculum18.
Instead of using a rigid lesson plan that directs a learner down a specific path of learning outcomes or objectives, project-based learning allows in depth investigation of a

Bandung, October 17th, 2015
Proceeding International Seminar on
Mathematics, Science, and Computer Science Education
204
M
topic worth learning more about (Harris and Katz, 2001), and engages students in gaining knowledge and skills through an extended inquiry process structured around complex, authentic questions and carefully designed products and tasks13. Project-based learning increases the motivation of students. Project-based learning is still in the developmental stage. Project-based learning is an instructional method centre on the learner. Students develop a question and are guided through research under the teacher‘s supervision18.
Based on evidence gathered over the past years, project-based learning appears to be effective model for producing gains in academic achievement11 and attitudes8. PBL has several positive effects on student content knowledge. Compared to traditional classes, students in PBL classes performed better on assessments of content knowledge23. PBL had a positive effect on specific groups of students. Students with average to low verbal ability and students with little previous content knowledge learned more in PBL classes than in traditional classes13. Students also enjoyed PBL because it gave them opportunities to interact with their friends and make new friends through cooperative projects5. Students were able to demonstrate specific content area skills after taking part in PBL8.
PBL has been shown to benefit a variety of students in developing collaborative skills. For example, through PBL, elementary students learned to understand multiple perspectives and conflict resolution skills14; special education students developed social skills such as patience and empathy5; and low-ability students demonstrated initiative, management, teamwork, and conscientiousness as they worked in groups6. Students also enjoyed PBL because it gave them opportunities to interact with their friends and make new friends through cooperative projects19. PBL also has resulted in high levels of student engagement20. PBL had a positive effect on student motivation to learn3. Students who participated in PBL also benefitted from improved critical thinking and problem-solving skills13. In particular, one study of PBL showed a positive effect on low-ability students, who increased their use of critical-thinking skills including synthesizing, evaluating, predicting, and reflecting while high-ability students improved more6. Furthermore, during PBL, students showed initiative by utilizing resources and revising work, behaviors that were uncharacteristic of them before they engaged in PBL4. PBL encourages student creativity. The aspect of creativity has been claimed as moderation in all things. For instance, autonomy is good for creativity and its development, but too much autonomy, and there may be no direction, no focus15. The same can be said about competition, challenges, constraints, attention, experience, and many other potential influences on creativity15. Moderation is also applicable to creative behavior. For example, creative ideas often result from divergent thinking, but too much divergence leads to irrelevant ideas that are not creative in the sense of being both original and useful. Moderation also plays a role in the tactic usually summarized as “shift your perspective,” which can contribute to original insights. Changes in perspective can be useful, but not if they are so extreme that ideas and solutions have no connection to the problem at hand.
Project-Based Learning (PBL) challenges students to collaborate in a team in order to solve a real world problem independent from the teacher. Unlike traditional methods of instruction this student-centered pedagogy provides participants with an opportunity to learn from doing. The collaboration in a team need creativity to solve the challenge. Reid and Petocz2 stated that creativity is viewed in different ways in different disciplines: in education it is called “innovation” and in mathematics it is sometimes equated with “problem-solving”.
A creative product in different domains is measured against the norms of that domain, its own rules, approaches and conceptions of creativity2. The World Conference on Higher Education claimed creativity as an innovative educational approach2. Cannatella9 stated
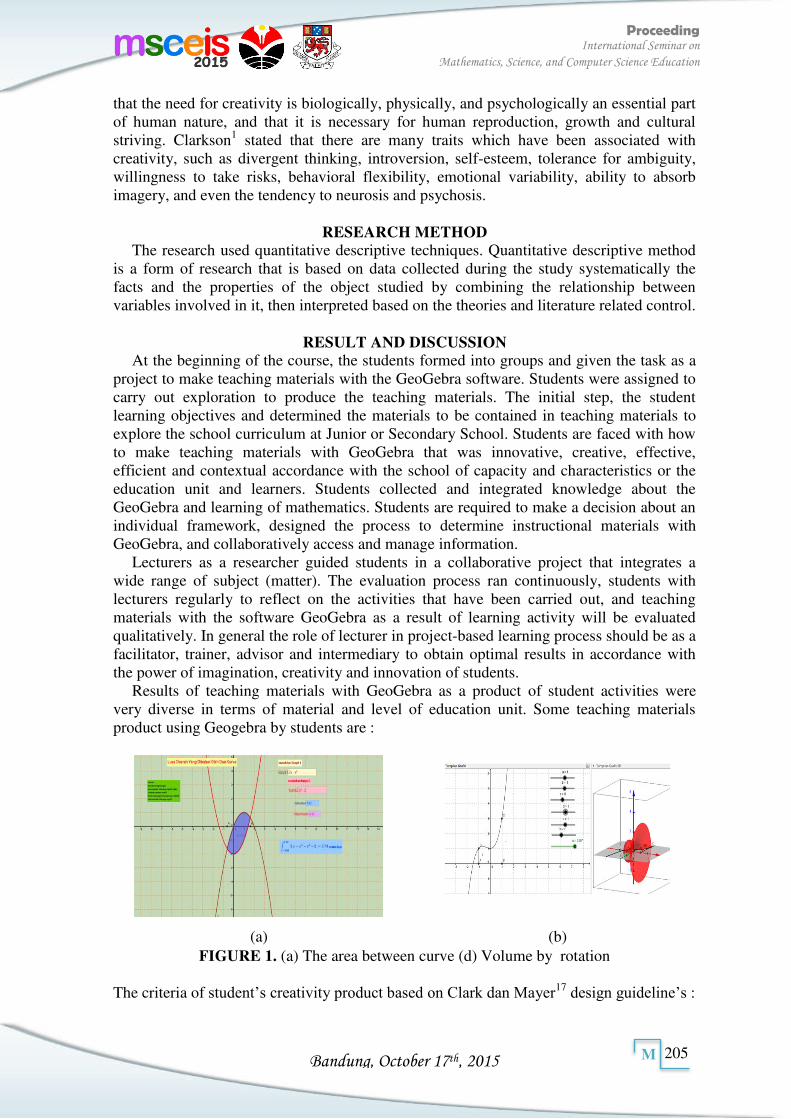
Bandung, October 17th, 2015
Proceeding International Seminar on
Mathematics, Science, and Computer Science Education
205
M
that the need for creativity is biologically, physically, and psychologically an essential part of human nature, and that it is necessary for human reproduction, growth and cultural striving. Clarkson1 stated that there are many traits which have been associated with creativity, such as divergent thinking, introversion, self-esteem, tolerance for ambiguity, willingness to take risks, behavioral flexibility, emotional variability, ability to absorb imagery, and even the tendency to neurosis and psychosis.
RESEARCH METHOD
The research used quantitative descriptive techniques. Quantitative descriptive method is a form of research that is based on data collected during the study systematically the facts and the properties of the object studied by combining the relationship between variables involved in it, then interpreted based on the theories and literature related control.
RESULT AND DISCUSSION
At the beginning of the course, the students formed into groups and given the task as a project to make teaching materials with the GeoGebra software. Students were assigned to carry out exploration to produce the teaching materials. The initial step, the student learning objectives and determined the materials to be contained in teaching materials to explore the school curriculum at Junior or Secondary School. Students are faced with how to make teaching materials with GeoGebra that was innovative, creative, effective, efficient and contextual accordance with the school of capacity and characteristics or the education unit and learners. Students collected and integrated knowledge about the GeoGebra and learning of mathematics. Students are required to make a decision about an individual framework, designed the process to determine instructional materials with GeoGebra, and collaboratively access and manage information.
Lecturers as a researcher guided students in a collaborative project that integrates a wide range of subject (matter). The evaluation process ran continuously, students with lecturers regularly to reflect on the activities that have been carried out, and teaching materials with the software GeoGebra as a result of learning activity will be evaluated qualitatively. In general the role of lecturer in project-based learning process should be as a facilitator, trainer, advisor and intermediary to obtain optimal results in accordance with the power of imagination, creativity and innovation of students.
Results of teaching materials with GeoGebra as a product of student activities were very diverse in terms of material and level of education unit. Some teaching materials product using Geogebra by students are :
(a) (b) FIGURE 1. (a) The area between curve (d) Volume by rotation
The criteria of student’s creativity product based on Clark dan Mayer17 design guideline’s :
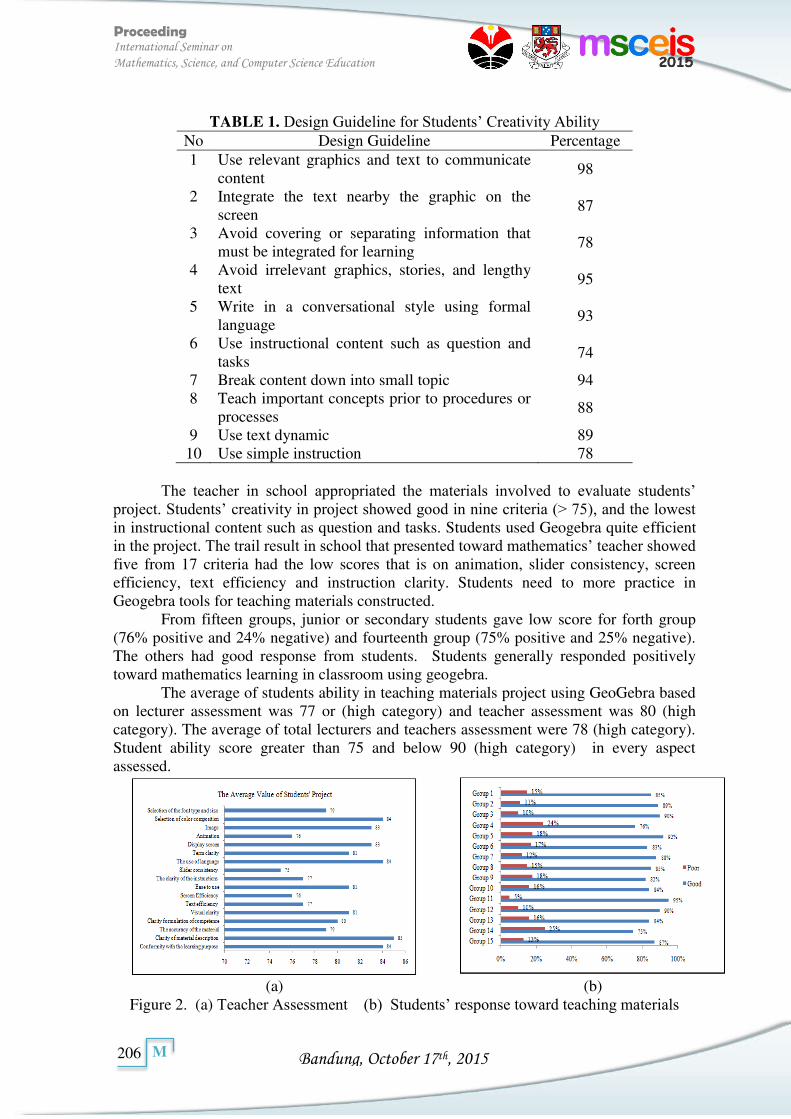
Bandung, October 17th, 2015
Proceeding International Seminar on
Mathematics, Science, and Computer Science Education
206
M
TABLE 1. Design Guideline for Students’ Creativity Ability
No Design Guideline Percentage 1 Use relevant graphics and text to communicate
content 98
2 Integrate the text nearby the graphic on the screen
87
3 Avoid covering or separating information that must be integrated for learning
78
4 Avoid irrelevant graphics, stories, and lengthy text
95
5 Write in a conversational style using formal language
93
6 Use instructional content such as question and tasks
74
7 Break content down into small topic 94 8 Teach important concepts prior to procedures or
processes 88
9 Use text dynamic 89 10 Use simple instruction 78
The teacher in school appropriated the materials involved to evaluate students’
project. Students’ creativity in project showed good in nine criteria (> 75), and the lowest in instructional content such as question and tasks. Students used Geogebra quite efficient in the project. The trail result in school that presented toward mathematics’ teacher showed five from 17 criteria had the low scores that is on animation, slider consistency, screen efficiency, text efficiency and instruction clarity. Students need to more practice in Geogebra tools for teaching materials constructed.
From fifteen groups, junior or secondary students gave low score for forth group (76% positive and 24% negative) and fourteenth group (75% positive and 25% negative). The others had good response from students. Students generally responded positively toward mathematics learning in classroom using geogebra.
The average of students ability in teaching materials project using GeoGebra based on lecturer assessment was 77 or (high category) and teacher assessment was 80 (high category). The average of total lecturers and teachers assessment were 78 (high category). Student ability score greater than 75 and below 90 (high category) in every aspect assessed.
(a) (b)
Figure 2. (a) Teacher Assessment (b) Students’ response toward teaching materials
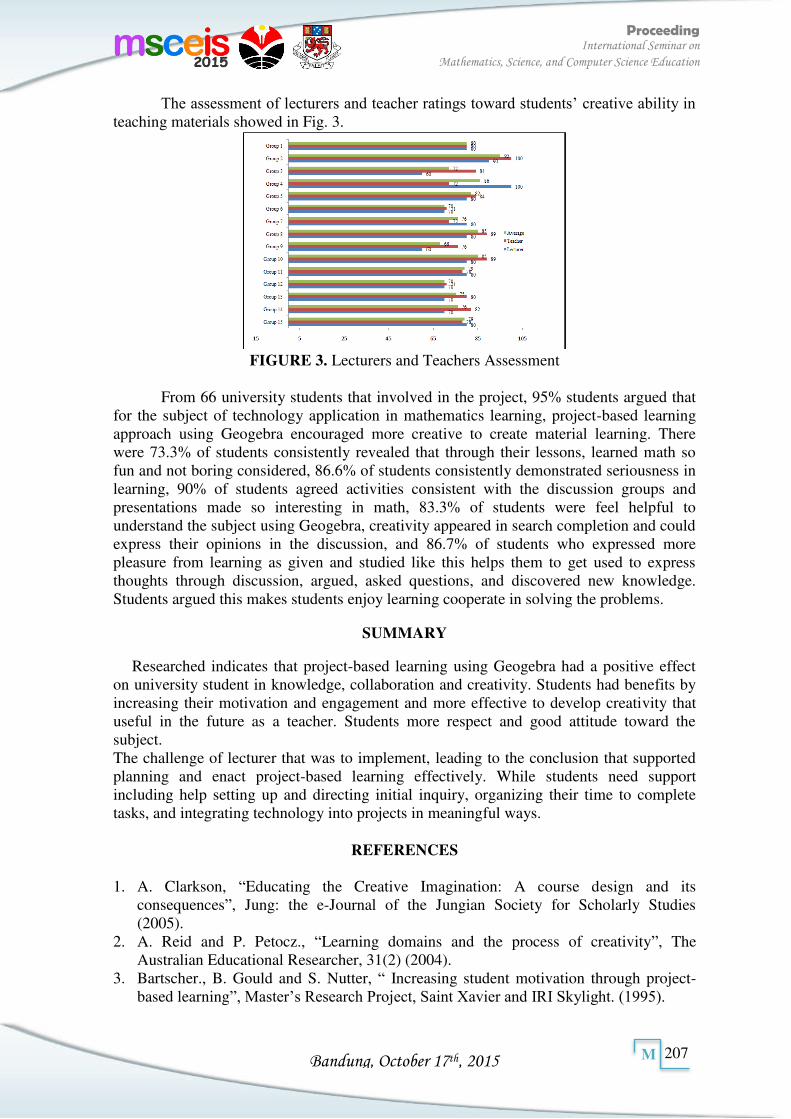
Bandung, October 17th, 2015
Proceeding International Seminar on
Mathematics, Science, and Computer Science Education
207
M
The assessment of lecturers and teacher ratings toward students’ creative ability in teaching materials showed in Fig. 3.
FIGURE 3. Lecturers and Teachers Assessment
From 66 university students that involved in the project, 95% students argued that
for the subject of technology application in mathematics learning, project-based learning approach using Geogebra encouraged more creative to create material learning. There were 73.3% of students consistently revealed that through their lessons, learned math so fun and not boring considered, 86.6% of students consistently demonstrated seriousness in learning, 90% of students agreed activities consistent with the discussion groups and presentations made so interesting in math, 83.3% of students were feel helpful to understand the subject using Geogebra, creativity appeared in search completion and could express their opinions in the discussion, and 86.7% of students who expressed more pleasure from learning as given and studied like this helps them to get used to express thoughts through discussion, argued, asked questions, and discovered new knowledge. Students argued this makes students enjoy learning cooperate in solving the problems.
SUMMARY
Researched indicates that project-based learning using Geogebra had a positive effect on university student in knowledge, collaboration and creativity. Students had benefits by increasing their motivation and engagement and more effective to develop creativity that useful in the future as a teacher. Students more respect and good attitude toward the subject. The challenge of lecturer that was to implement, leading to the conclusion that supported planning and enact project-based learning effectively. While students need support including help setting up and directing initial inquiry, organizing their time to complete tasks, and integrating technology into projects in meaningful ways.
REFERENCES
1. A. Clarkson, “Educating the Creative Imagination: A course design and its
consequences”, Jung: the e-Journal of the Jungian Society for Scholarly Studies (2005).
2. A. Reid and P. Petocz., “Learning domains and the process of creativity”, The Australian Educational Researcher, 31(2) (2004).
3. Bartscher., B. Gould and S. Nutter, “ Increasing student motivation through project-based learning”, Master’s Research Project, Saint Xavier and IRI Skylight. (1995).
Bandung, October 17th, 2015
Proceeding International Seminar on
Mathematics, Science, and Computer Science Education
208
M
4. B. J. S. Barron., D. L. Schwartz., N. J. Vye., A. Moore., A. Petrosino., L. Zech., J. D. Bransford, “ Doing with understanding: Lessons from research on problem- and project-based learning”, The Journal of the Learning Sciences, 7, 271-311(1998).
5. B. R. Belland., P. A. Ertmer. & K. D. Simons, ”Perceptions of the value of problem-based learning among students with special needs and their teachers”, The Interdisciplinary Journal of Problem-based Learing, 1(2), 1-18 (2006).
6. C. Horan., C. Lavaroni., and P. Beldon, “Observation of the Tinker Tech Program students for critical thinking and social participation behaviors”. Novato, CA: Buck Institute for Education (1996).
7. D. K. Meyer, “Challenge in a mathematics classroom: Students‘ motivation and strategies in project based learning”, The Elementary School Journal, 97(5), 501-521 (1997).
8. D. Mioduser and N. Betzer, “The contribution of Project-based learning to high-achievers’ acquisition of technological knowledge and skills”, International Journal of Technology and Design Education, 18, 59-77 (2003
9. H. Cannatella, “Embedding Creativity in Teaching and Learning”, Journal of Aesthetic Education, 38(4). (2004)
10. H. L. Chen, “Projects to think with and projects to talk with: How adult learners experience project-based learning in an online course”, Unpublished doctoral dissertation. KSU College of Education, Manhattan (2006)
11. J. D. Foshay, “Project-based multimedia instruction”, Bloomington, IN: Phi Delta Kappan International (1999)
12. J. R. Mergendoller., N. L. Maxwell, & Y. Bellisimo, “The effectiveness of problem-based instruction: A comparative study of instructional methods and student characteristics”, The Interdisciplinary Journal of Problem-based Learing, 1(2), 49-69 (2006).
13. J. W. Thomas, ” A review of research on project-based learning”, Retrieved from http://www.bie.org/ index.php (2000).
14. L. J. ChanLin, “ Technology integration applied to project-based learning in science”, Innovations in Education and Teaching International, 45, 55-65. (2008).
15. M. A. Runco, “Creativity”, In S. T. Fiske, D. L. Schacter, & C. Zahn-Waxler (Eds.), Annual Review of Psychology (pp. 657 – 687). Palo Alto: CA, Annual Reviews (2004).
16. P. Westwood, ”What teachers need to know about teaching methods” Camberwell, Victoria: Acer Press. (2008)
17. R. C. Clark and R. E. Mayer, ” E-Learning and the Science of Instruction : Proven Guidelines for Consumers and Designers of Multimedia Learning” 2nd Edition (John Wiley & Sons Inc., San Francisco, 2008)
18. S. Bell, “Project-Based Learning for the 21st Century: Skills for the Future,” The Clearing House, 83 (2) : 39–43 (2010).
19. S. Lightner., M. J. Bober and C. Willi, “ Team-based activities to promote engaged learning, College Teaching, 55, 5-18 (2007).
20. T. Brush, T., and J. Saye, “The effects of multimedia-supported problem-based inquiry on student engagement, empathy, and assumptions about history”, The Interdisciplinary Journal of Problem-based Learing, 2(1), 21-56 (2008).
21. T. Merkham., J. Mergendooler., J. Learmer., and J. Ravitz, “Project Based Learning Handbook”. Hong Kong: Quinn Essentials Books and Printing, Inc. (2003).
22. W. R. Penuel & B. Means, “ Designing a performance assessment to measure students’ communication skills in multi-media-supported, project-based learning” (2000).
Bandung, October 17th, 2015
Proceeding International Seminar on
Mathematics, Science, and Computer Science Education
209
M