Embed Size (px)
Citation preview
J. theor. Biol. (1971) 33, 279-297
Mathematical Analysis and Digital Simulation of the Control of Erythropoiesis
KENNETH C. MYLREA~ AND PETER H. ABBRECHT
Department of Physiology and Bioengineering Program, University of Michigan, School of Medicine,
Ann Arbor, Mich. 48104, U.S.A.
(Received 9 March 1970, and in revised form 16 October 1970)
A mathematical model is presented which represents the control system for erythropoiesis. In the model, it is postulated that the rate of erythropoiesis is controlled by a hormone, erythropoietin, which is released from the kidney in response to reduced renal oxygen supply. Equations are developed which relate erythropoietin release to arterial oxyhemoglobin concentration, and hemoglobin production to plasma erythropoietin concentration, with appropriate time delays. Effects of changes in plasma volume during hypoxia are included. The model is used with a digital computer to simulate the dynamic response of the erythropoietic system to a step decrease in the po2 of inspired air. The response of the model compares favorably with experimental data obtained from mice subjected to different degrees of hypoxia.
1. Introduction
The total circulating red cell mass in mammals is at least partially controlled by a feedback system involving a hormone (erythropoietin) which is released from the kidney. It has been shown that this hormonal system has the necessary characteristics to provide regulatory control over red blood cell production (Erslev, 1960; Jacobson, Gurney & Goldwasser, 1960). A mathematical model of the complete erythropoietic control system should be useful in achieving better understanding of the response of the system to different stimuli. A number of models describing the erythropoietic system have been proposed. These can be divided into two main groups: (i) those dealing with the movement of iron throughout the body as it is trans- ferred from one organ to another (Garby, Schneider, Sundquist & Vuille, 1963; Nooney, 1966; Pollycove & Mortimer, 1961; Sharney, Wasserman, Schwartz & Tendler, 1963), and (ii) those describing the behavior of the stem
? Present address: University of Wisconsin, Instrumentation Systems Center, Engineering Research Building, Madison, Wise. 53706, U.S.A.
279
280 K. C. MYLREA AND P. H. ABBRECHT
cell population as it applies to the differentiation of cells into the erythroid series (Kretchmar, 1966; Lajtha & Oliver, 1960; Newton & Gurney 1965). In addition, two models have been proposed which include to some extent both red blood cell and bone marrow stem cell kinetics (Gall & Meno, 1968; Kirk, Orr & Hope, 1968). Most of these models describe only parts of the erythropoietic control system and none encompasses the entire system with sufficient detail to allow a quantitative appraisal of how the different components interact to yield a specific response.
The model presented herein is a detailed, non-linear representation of the control system for erythropoiesis. The model was designed to simulate the dynamic response of the erythropoietic system to a step decrease in the po2 of inspired air. Respiratory and plasma volume changes are included. Although only the response to hypoxia is considered herein, the model can also be used to predict the behavior of the system in response to other stresses or pathological states. Parameters for the system have been estimated for the mouse because of the relative ease of obtaining test data for that animal. However, the conclusions derived from model analysis should be applicable to other animals.
2. Description of the System
The following description is given to provide a basic understanding of the system. A more detailed discussion of the various relationships and parameters in the model is given in section 3, Parameter Estimation.
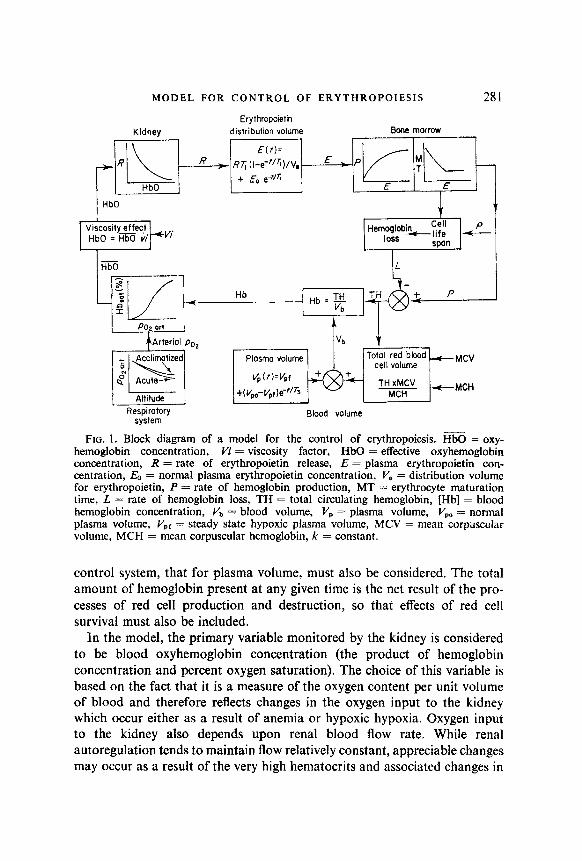
A block diagram showing some of the major components of the erythro- poietic control system is given in Fig. I. Erythropoietin is released from the kidney in response to an imbalance between available oxygen and tissue oxygen requirements (Abbrecht & Malvin, 1966; Jacobson, Goldwasser & Gurney, 1959). Erythropoietin acts on the bone marrow to increase the production of erythrocytes. The increased number of red blood cells thus produced augments the oxygen-carrying capacity of the blood and tends to restore adequate oxygenation of renal tissue.
This control system in itself appears to be relatively simple. However, in order to produce a model which can describe the behavior of the system under physiological conditions, other factors must be included. Since the amount of oxygen carried per unit amount of hemoglobin depends on the state of oxygenation of the blood, the lungs must be included as an auxiliary system, as well as the relationship between arterial po2 and the percentage oxygen saturation of the hemoglobin (the oxyhemoglobin dissociation curve). The oxygen-carrying ability of 1 ml of blood is proportional to hemoglobin concentration. Therefore, the effects of another independent
MODEL FOR CONTROL OF ERYTHROPOIESIS
Erythropoietin
281
Respiratory Blood volume
FIG. 1. Block diagram of a model for the control of erythropoiesis. HbO = oxy- hemoglobin concentration, Vi = viscosity factor, HbO = effective oxyhemoglobin concentration, R = rate of erythropoietin release, E = plasma erythropoietin con- centration, E. = normal plasma erythropoietin concentration, V, = distribution volume for erythropoietin, P = rate of hemoglobin production, MT = erythrocyte maturation time, L = rate of hemoglobin loss, TH = total circulating hemoglobin, [Hb] = blood hemoglobin concentration, Va = blood voiume, VP = plasma volume, VP0 = normal plasma volume, Vpr = steady state hypoxic plasma volume, MCV = mean corpuscular volume, MCH = mean corpuscular hemoglobin, k = constant.
control system, that for plasma volume, must also be considered. The total amount of hemoglobin present at any given time is the net result of the pro- cesses of red cell production and destruction, so that effects of red cell survival must also be included.
In the model, the primary variable monitored by the kidney is considered to be blood oxyhemoglobin concentration (the product of hemoglobin concentration and percent oxygen saturation). The choice of this variable is based on the fact that it is a measure of the oxygen content per unit volume of blood and therefore reflects changes in the oxygen input to the kidney which occur either as a result of anemia or hypoxic hypoxia. Oxygen input to the kidney also depends upon renal blood flow rate. While renal autoregulation tends to maintain flow relatively constant, appreciable changes may occur as a result of the very high hematocrits and associated changes in
282 K. C. MYLREA AND P. H. ABBRECHT
blood viscosity which occur after prolonged exposure to severe hypoxia. In the model, a multiplicative factor (Vi) operating upon oxyhemoglobin concentration is used to represent the effects of viscosity changes on renal blood flow and tissue oxygenation. Hereafter, the term oxyhemoglobin concentration HbO will refer to the actual concentration HbO multiplied by the viscosity correction factor (Vi).
Renal release of erythropoietin is considered to be inversely related to oxyhemoglobin concentration. Plasma erythropoietin concentration then depends upon the rates of release by the kidney and of clearance from the plasma of the hormone. Erythropoietin causes differentiation of stem cells into erythroid cells (Alpen & Cranmore, 1959; Orlic, Gordon & Rhodin, 1968), and may also regulate the rate of hemoglobin synthesis (Stohlman, Ebbe, Morse, Howard & Donovan, 1968). Therefore, the rate of hemoglobin synthesis in the model is a function of plasma erythropoietin concentration. Because of the time required for erythrocyte maturation, the amount of hemoglobin being released into the circulation at any given time depends upon the number of precursor cells differentiated into red cells at some previous time. This effect is accounted for by the use of a variable time delay for erythrocyte maturation.
The rate of change in total circulating hemoglobin at any given time is the difference between the amount being added to the circulation in new cells and the amount being lost due to removal of senescent cells from the circulation. Hemoglobin concentration is obtained by dividing total hemo- globin mass by the sum of erythrocyte volume and plasma volume. Erythrocyte volume is calculated from the value of total hemoglobin and the red blood cell indices. Plasma volume is incorporated in the model using an empirically derived equation.
3. Parameter Estimation
Because of the relative ease of obtaining data on the response of the mouse’s erythropoietic system to hypoxic stress, data for testing the model were obtained from that animal (Mylrea & Abbrecht, 1970). However, in estimating values for the various parameters for computer simulation, it was necessary to utilize data from several species.
(A) ERYTHROPOIETIN RELEASE AND PLASMA ERYTHROPOIETIN
CONCENTRATION
Because of the low sensitivity of currently available assay methods for erythropoietin, it is not usually possible to measure renal arteriovenous differences in erythropoietin concentration and renal erythropoietin release
MODEL FOR CONTROL OF ERYTHROPOIESIS 283
(Abbrecht & Malvin, 1966). Thus it was necessary to derive a relationship for erythropoietin release from data on plasma erythropoietin concentra- tions in hypoxic animals.
Erythropoietin concentration in the plasma is a function of its rate of release by the kidney, rate of clearance from the plasma, and its volume of distribution. The half-life of disappearance of erythropoietin from plasma has been reported as one to five hours for rats (Keighley, 1962; Reissman, Diederich, Ito & Schmaus, 1965; Stohlman & Howard, 1962), and 7.3 hr for dogs (Bozzini, 1966). Since smaller animals appear to have a shorter plasma erythropoietin half life, a value of approximately two hours was estimated for mice and used in the model. A distribution space for erythropoietin of approximately two times the plasma volume has been reported for the rat (Reissman et al., 1965) and was used in the model. With the assumptions that (i) the rate of release of erythropoietin and the distribu- tion space are constant during the short time being considered, and (ii) the rate of disappearance of erythropoietin from the plasma is proportional to the plasma erythropoietin concentration, the following equation can be written for plasma erythropoietin concentration :
J?(t) = 57 (1 -ee-‘iTl)+Eo emtlT1, (1) e
where E(t) = plasma erythropoietin concentration at time t, E, = initial plasma erythropoietin concentration, R = rate of erythropoietin release, V, = volume of distribution of erythropoietin (taken to be twice plasma volume), r, = time constant for erythropoietin disappearance, t = time.
It is postulated that the rate of erythropoietin release is a function of the oxyhemoglobin concentration. A quantitative relationship between these two variables was obtained from plasma erythropoietin concentrations measured in rats after 8 hr of continuous hypoxic exposure (Reissman et al., 1965). It was assumed that during the eight-hour exposure period, both arterial po2 and the rate of erythropoietin release were constant, and that erythropoietin concentration had reached 92% of the steady state value (T, = 0.130 days). Distribution space was assumed to be 13.3 ml. (Reissman et al., 1965). The rate of erythropoietin release was then calculated from the steady state form of equation (1),
R = I/,E/T,. (2) The normal plasma erythropoietin concentration of the rat, which is too low to be detectable with the polycythemic mouse assay (Reissman et al., 1965), was taken to be approximately one-half the minimum amount detectable with the mouse assay. Oxyhemoglobin concentration was determined from data obtained in the rat relating percent saturation to altitude (Altland,
284 K. C. MYLREA AND P. H. ABBRECHT
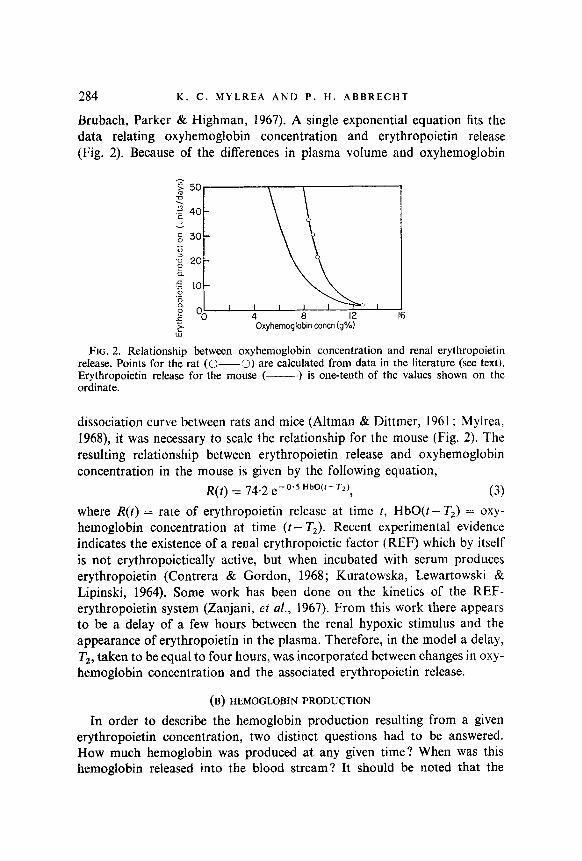
Brubach, Parker & Highman, 1967). A single exponential equation fits the data relating oxyhemoglobin concentration and erythropoietin release (Fig. 2). Because of the differences in plasma vohtme and oxyhemoglobin
El 0 o. ’ ’ ’ ’ ’ s 4 8 12 I6
6 Oxyhemoglobin concn (9%)
FIG. 2. Relationship between oxyhemoglobin concentration and renal erythropoietin release. Points for the rat (&---0) are calculated from data in the literature (see text). Erythropoietin release for the mouse (-- ) is one-tenth of the values shown on the ordinate.
dissociation curve between rats and mice (Altman & Dittmer, 1961; Mylrea, 1968), it was necessary to scale the relationship for the mouse (Fig. 2). The resulting relationship between erythropoietin release and oxyhemoglobin concentration in the mouse is given by the following equation,
R(t) = 74.2 e-O.sHbW-T~f, (3) where R(t) = rate of erythropoietin release at time t, HbO(t - T2) = oxy- hemoglobin concentration at time (t- T2). Recent experimental evidence indicates the existence of a renal erythropoietic factor (REF) which by itself is not erythropoietically active, but when incubated with serum produces erythropoietin (Contrera & Gordon, 1968; Kuratowska, Lewartowski & Lipinski, 1964). Some work has been done on the kinetics of the REF- erythropoietin system (Zanjani, et al., 1967). From this work there appears to be a delay of a few hours between the renal hypoxic stimulus and the appearance of erythropoietin in the plasma. Therefore, in the model a delay, T2, taken to be equal to four hours, was incorporated between changes in oxy- hemoglobin concentration and the associated erythropoietin release.
(B) HEMOGLOBIN PRODUCTION
In order to describe the hemoglobin production resulting from a given erythropoietin concentration, two distinct questions had to be answered. How much hemoglobin was produced at any given time ? When was this hemoglobin released into the blood stream? It should be noted that the

MODEL FOR CONTROL OF ERYTHROPOIESIS 285
model predicts the kinetics of hemoglobin production instead of erythrocyte production in response to erythropoietin concentration changes. However, since the experimental data which were obtained for testing the model show little change in mean corpuscular hemoglobin levels during the period of ex- posure (Mylrea & Abbrecht, 1970) the kinetics of hemoglobin production and erythrocyte production would be similar.
It was postulated that the rate of hemoglobin production is related to plasma erythropoietin concentration by the following equation,
P(t) = Pm(l-e-klE(‘))+PO, (4)
where p(t) = rate of hemoglobin production at time t, P,,, = maximum rate of hemoglobin production, E(t) = plasma erythropoietin concentration at time t, ki = a constant, P, = a basal rate of hemoglobin production.
The exponential relationship between hemoglobin production and erythropoietin concentration was assumed on the basis of data relating the increase in total red cell volume to the amount of erythropoietin injected daily into rats (Van Dyke & Pollycove, 1962). Equation (4) indicates that hemoglobin production rate asymptotically approaches a maximum value P, as erythropoietin concentration increases. For an erythrocyte life span of 20 days, the normal hemoglobin production rate in the mouse would be approximately 0.01 g/day (Mylrea & Abbretch, 1970). Maximum hemo- globin production in several species has been reported to be five to seven times the normal (Crosby & Akeroyd, 1952; Neuberger & Niven, 1951) suggesting a value of about O-05 g/day for P,,, in the mouse. The inclusion of PO in equation (4) allows some basal hemoglobin production as has been suggested by (Nathan, Schupak, Stohlman & Merrill, 1964). The constant k, was calculated assuming a basal hemoglobin production of 0.005 g/day when erythropoietin concentration is zero.
In the model, the rate of hemoglobin production determines the amount of hemoglobin which will be available for release into the bloodstream at some future time. This time delay between the differentiation of the stem cell and release of the resulting erythrocytes (the maturation time) may be a function of plasma erythropoietin concentration (Stohlman et al., 1968). The normal maturation time for erythrocytes is approximately four days (Harris, 1963). With an increased stimulus for erythropoiesis, the rate of hemoglobin synthesis may be increased and the maturation time cor- respondingly shortened (Stohlman et al., 1968). In the model, the maturation time for cells undergoing the normal number of divisions is varied from 2.5 to 4 days, depending upon erythropoietin concentration, with normal plasma erythropoietin concentration producing a maturation time of 3.75 days.
286 K. C. MYLREA AND P. H. ABBRECHT
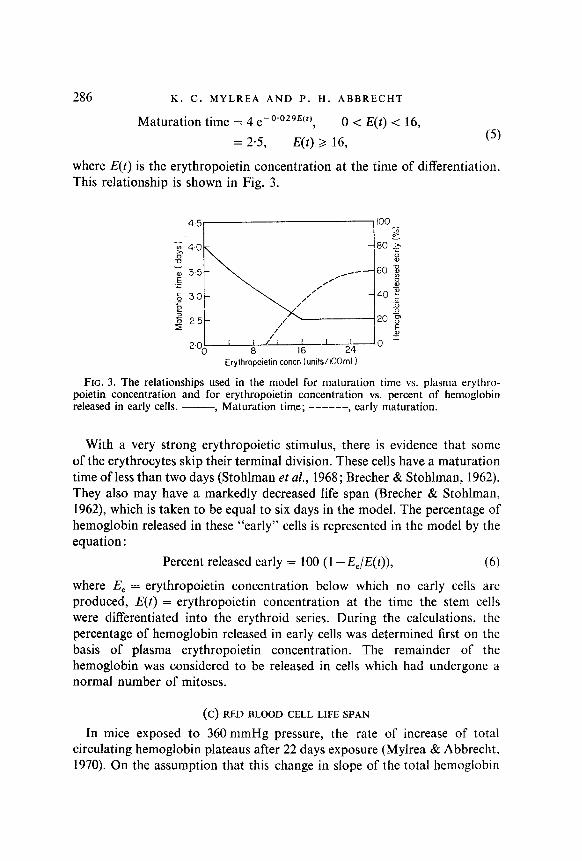
Maturation time = 4 e-0’02gE(t), 0 < E(t) < 16, = 2.5, E(t) > 16, (5)
where E(t) is the erythropoietin concentration at the time of differentiation. This relationship is shown in Fig. 3.
45 100 7
(: 40 :
-80;
aJ
-G 35- 5
.s 30 ~~~~~~~-.;I
0 6 16 Eryihropoiehn concn (units/i00ml )
FIG. 3. The relationships used in the model for maturation time vs. plasma erythro- poietin concentration and for erythropoietin concentration vs. percent of hemoglobin released in early cells. -, Maturation time; ------, early maturation.
With a very strong erythropoietic stimulus, there is evidence that some of the erythrocytes skip their terminal division. These cells have a maturation time of less than two days (Stohlman et al., 1968; Brecher & Stohlman, 1962). They also may have a markedly decreased life span (Brecher & Stohlman, 1962) which is taken to be equal to six days in the model. The percentage of hemoglobin released in these “early” cells is represented in the model by the equation :
Percent released early = 100 (1 --&,/E(I)), (6)
where E, = erythropoietin concentration below which no early cells are produced, E(t) = erythropoietin concentration at the time the stem cells were differentiated into the erythroid series. During the calculations, the percentage of hemoglobin released in early cells was determined first on the basis of plasma erythropoietin concentration. The remainder of the hemoglobin was considered to be released in cells which had undergone a normal number of mitoses.
(C) RED BLOOD CELL LIFE SPAN
In mice exposed to 360 mmHg pressure, the rate of increase of total circulating hemoglobin plateaus after 22 days exposure (Mylrea & Abbrecht. 1970). On the assumption that this change in slope of the total hemoglobin
MODEL FOR CONTROL OF ERYTHROPOIESIS 287
curve was caused by the death of the first group of extra cells produced in response to hypoxia, a life span of 20 days was selected. The selection of 20 days as the normal red blood cell life span does not greatly affect the dynamic response of the model except after 20 days exposure when the additional cells begin to leave the circulation. To account for the normal variability in cell life span (Berlin, 1964), the death of cells produced at any given time was distributed in a normal manner about a mean of 20 days, with a one day standard deviation.
(D) BLOOD VOLUME
Total circulating red blood cell volume was calculated from the total circulating hemoglobin and experimentally determined values for mean corpuscular hemoglobin (MCH) and mean corpuscular volume (MCV) (Mylrea & Abbrecht, 1970). Total blood volume and hematocrit were then determined from the values of plasma volume and total red cell volume.
Mean corpuscular hemoglobin, which changes very little in mice subjected to hypoxia (Mylrea & Abbrecht, 1970), is assumed to remain constant in the model at a value of 15.9 pg/cell. However, mean corpuscular volume increases during the first few days of hypoxic exposure (Mylrea & Abbrecht, 1970). The model assumes a linear change in MCV from the control value to a new steady state value during the first five days of hypoxia. The experimentally determined control and steady state values for MCV in hypoxic mice (Mylrea & Abbrecht, 1970) were 47.7, 48-8, 50.4 and 52.1 um3/cell at 740, 510, 440 and 360 mmHg total air pressure, respectively.
In the model hematocrit was calculated from the relationship
hematocrit = 1 /[l + (MCH)(V,)/(TH)(MCV)], (7)
where V, = plasma volume, TH = total circulating hemoglobin. Since MCV = Hct/erythrocyte count, the calculated values of hematocrit depend upon the average measured steady state values for hematocrit from all runs at a given altitude.
Plasma volume changes were represented by an exponential equation fitted to the experimental data (Figs 4 to 6). A steady state value for plasma volume was determined for each pressure from the percent decrease found in the experimental data (Mylrea & Abbrecht, 1970). The control plasma volume was 0,626 ml. Steady state plasma volumes for 510, 440 and 360 mmHg were 0.600, 0.530 and 0.500 ml, respectively. With the representation used, upon exposure to decreased pressure the plasma volume decreases from the control value to the new steady state value in an exponential manner with a time constant of I.5 days.
288 K. C. MYLREA AND P. H. ABBRECHT
Total blood volume
Total red cell volume
Total plasma volume
I I I I I I I J
0 5 IO 15 20 25 30 35 Time at 510 mmlig (days )
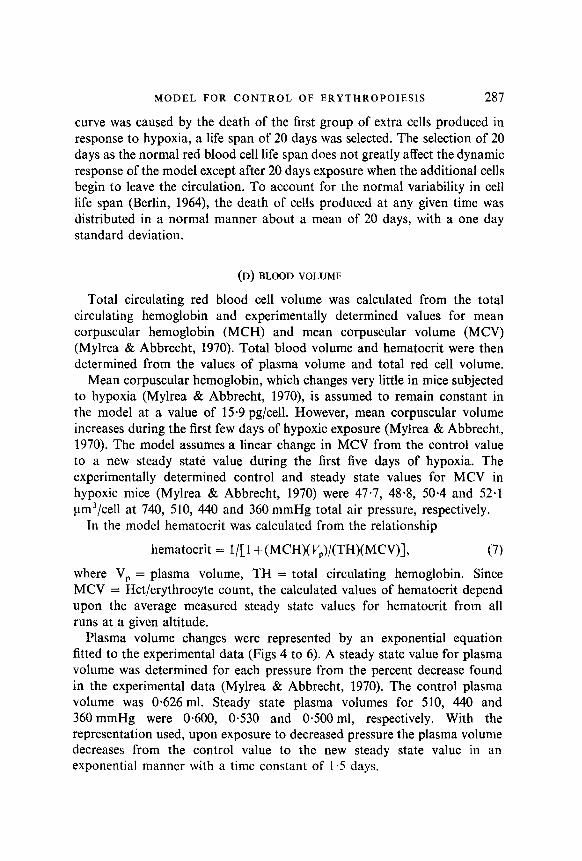
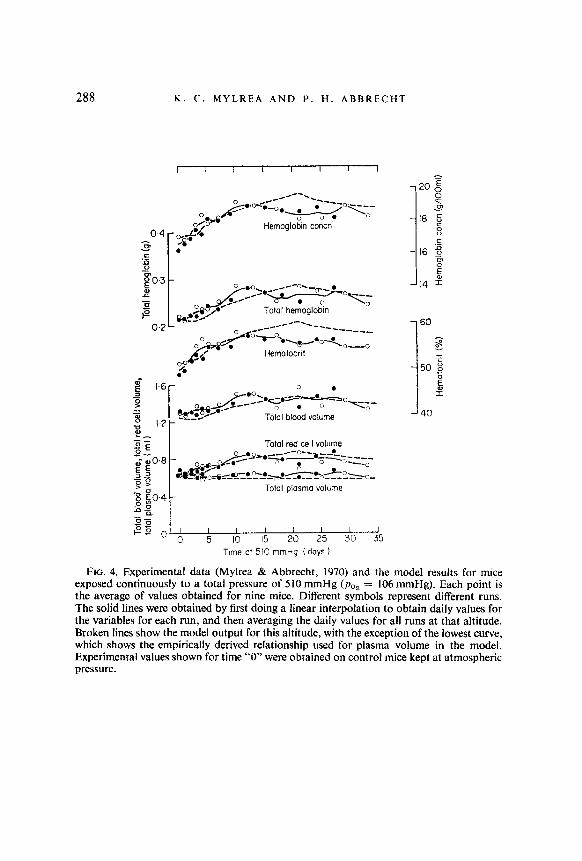
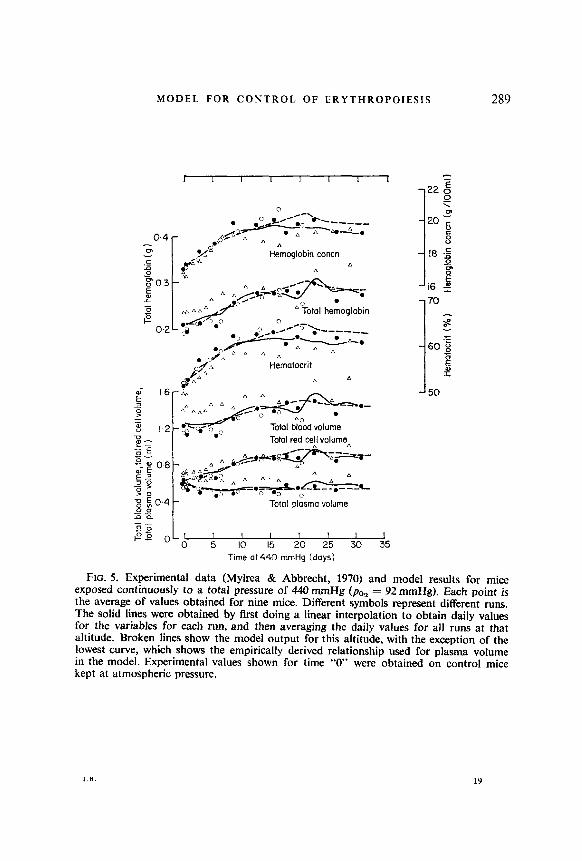
FIG. 4. Experimental data (Mylrea & Abbrecht, 1970) and the model results for mice exposed continuously to a total pressure of 510 mmHg (poz = 106 mmHg). Each point is the average of values obtained for nine mice. Different symbols represent different runs. The solid lines were obtained by first doing a linear interpolation to obtain daily values for the variables for each run, and then averaging the daily values for all runs at that altitude. Broken lines show the model output for this altitude, with the exception of the lowest curve, which shows the empirically derived relationship used for plasma volume in the model. Experimental values shown for time “0” were obtained on control mice kept at atmospheric pressure.
3 q
Tota
l blo
od
volum
e,tota
l red
ce
ilvolum
e, tot
al pla
sma
volum
e (m
l 1
0 0
0 0
cb
iu a,
I I
I I
1
Tota
l he
moglo
bin
(g 1
0
0 0
ti l---+
-G
-I 8 0”
0”
s iii
0”
N”
He
mato
crit
(%)
Hemo
globin
co
ncn
(g /
lOOm
I 1
290 K. C. MYLREA AND P. H. ABBRECHT
- 50
Total plasma volume
Time at 360 mmHg (days)
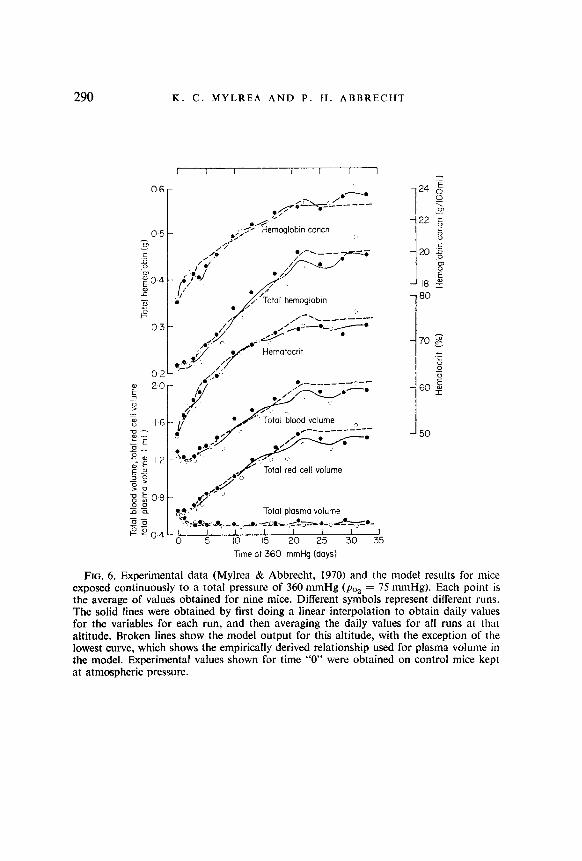
FIG. 6. Experimental data (Mylrea & Abbrecht, 1970) and the model results for mice exposed continuously to a total pressure of 360 mmHg (pO, = 75 mmHg). Each point is the average of values obtained for nine mice. Different symbols represent different runs. The solid lines were obtained by first doing a linear interpolation to obtain daily values for the variables for each run, and then averaging the daily values for all runs at that altitude. Broken lines show the model output for this altitude, with the exception of the lowest curve, which shows the empirically derived relationship used for plasma volume in the model. Experimental values shown for time “0” were obtained on control mice kept at atmospheric pressure.
MODEL FOR CONTROL OF ERYTHROPOIESIS 291
(E) OXYHEMOGLOBIN CONCENTRATION
Oxyhemoglobin concentration was calculated in the model by multiplying hemoglobin concentration by the percent of hemoglobin saturated with oxygen (percent hemoglobin saturation). Hemoglobin concentration was determined by dividing total circulating hemoglobin by total blood volume. Percent hemoglobin saturation was obtained as described below.
The amount of oxygen being carried to the erythropoietin producing tissues is directly proportional to arterial oxyhemoglobin concentration only if blood flow is constant. The high hematocrits which occur during prolonged severe hypoxia increase blood viscosity (Crowell & Smith, 1967). This may tend to reduce blood flow to the tissues and thereby to decrease tissue oxygenation. This effect of viscosity was incorporated in the model via the correction factor Vi, obtained from the relationship
v1 = 1-l -09012 e4’4 Hct 3 (8) where Hct = hematocrit = total red cell volume/total blood volume. The actual oxyhemoglobin concentration HbO was multiplied by Vi to obtain the “effective” oxyhemoglobin concentration HbO. It is recognized that the oxygen available to the tissues depends upon the percent extraction as well as upon the amount entering in arterial blood. However, percent extraction was not included in the model because of inadequate data.
(F) PERCENT HEMOGLOBIN SATURATION
The percent of hemoglobin saturated with oxygen (percent hemoglobin saturation) was determined from the oxyhemoglobin dissociation curve and the value for arterial po,. The oxyhemoglobin dissociation curve for blood of the strain of mice used in the hypoxic experiments was determined experimentally (Mylrea, 1968). The curve can be described by the following equations :
percent saturation = 100 - 264 e-0’028/po,, 60 mmHg < arterial pal < 80 mmHg, (9)
percent saturation = 1.33 poZ - 30, 30 mmHg < arterial poZ < 60 mmHg. (10)
No data on alveolar or arterial po2 were available for mice. In man, the respiratory response to hypoxia is characterized by an acute decrease in arterial poZ which is followed by a gradual rise to a new steady state or acclimatized value, that is attained after about three days exposure (Rahn & Fenn, 1955). In the model arterial oxygen tensions for different degrees of acute exposure were estimated from data obtained on rats (Altland et al., 1967; Altman & Dittmer, 1961) and are shown as the lower curve in the
292 K. C. MYLREA AND P. H. ABBRECHT
respiratory system portion of Fig. 1. The assumption that the difference between the acute and acclimatized po2 value is the same for mice as that reported for humans (Rahn & Fenn, 1955) yields the upper (acclimatized) curve for the po,-altitude relationship in Fig. 1. It was postulated that arterial poz at a given altitude changed from the acute value to the acclimatized value in an exponential manner with a time constant of two days. The acute and acclimatized values for arterial par which were used in the model are given in Table 1.
TABLE 1 Values for acute and acclimatized arterial poZ used in the model
Total pressure (mmHg) Arterial poz (mmHg) Acute Acclimatized
510 65 68 2 56 63 61 67
The normal arterial poZ for the mouse was taken to be 78 mmHg.
4. Computer Simulation
The simulation was performed on a high-speed digital computer (IBM 7094). From the values of the parameters listed in Table 2, values for each of the variables were calculated beginning with percent hemoglobin
TABLE 2
Parameter values used in the model
Normal erythrocyte life span (days) 20 Erythropoietin threshold, E. (“A” units/ml) 0.100 Normal plasma erythropoietin concentration (‘A” units/ml) 0.0225 Normal blood hemoglobin concentration (g/100 ml) 16.8 Normal total blood volume (ml) I .26 kI (ml plasma/unit erythropoietin) 5.88 Tl (days) 0.130 TZ (days) 0.167 Ta (days) 1.5
saturation and continuing around the loop (see Fig. 1). A dynamic simulation was obtained by recalculating the values for each of the variables for I-hr intervals. Decreasing the length of time between calculated points to less than
MODEL FOR CONTROL OF ERYTHROPOIESIS 293
an hour did not appreciably change the results. Therefore, we believe that the digital approximation yields results which would compare favorably with a continuous model.
5. Results and Discussion
Experimentally determined values for three different air pressures (Mylrea & Abbrecht, 1970) are compared with the model predictions (broken curves) in Figs 4 to 6. In general, the model simulates the experimental responses quite well for all three simulated altitudes.
The increase in hemoglobin concentration found in man and other animals during the first few days of hypoxia is thought to be caused by a hemo- concentration and possibly the release of stored red blood cells (Van Liere & Stickney, 1963). The model results show clearly that hemoconcentration can produce an early increase in hematocrit and hemoglobin concentration similar to that found experimentally (Figs 4 to 6). This is particularly evident at the lower pressures where there were larger changes in plasma volume.
The model output for total hemoglobin increased until about 22 days exposure, and then dropped slightly at all altitudes. The greatest drop occurred at the 360 mmHg pressure, where the experimental data also clearly demonstrated a decrease in total hemoglobin beginning at about 22 days. At that time there occurs a shift from death of prehypoxic erythrocytes to those formed in the early post-hypoxic period, at which time hemoglobin production rate is greatest. The loss of the early cells exceeds the nearly steady state production rate at 22 days, and results in a net decrease in total hemoglobin. The changes in total hemoglobin at 22 days resulted in parallel changes in hemoglobin concentration, hematocrit, total red cell volume, and blood volume.
For 360 mmHg there were some significant differences between the hemo- globin concentrations predicted by the model and those obtained experi- mentally (Fig. 6). The model did not predict as great an increase in hemo- globin concentration during the first three days of exposure as was found experimentally. This discrepancy may be due to splenic release of erythro- cytes, a factor which was not included in the model. The representation for plasma volume used in the model (a single exponential) does not produce the increase in plasma volume which occurred in the experimental animals on the fourth day of exposure to 360 mmHg. Thus the model did not reproduce the decrease in measured hemoglobin concentration which occurred at that time.
Early erythrocytes with a shortened life span (6 days) are produced in the model during the first four days of hypoxic exposure. However, the
294 K. C. MYLREA AND P. H. ABBRECHT
amount of hemoglobin released in “early” cells does not constitute a very large portion of the initial hemoglobin production. Therefore, it is unlikely that short-lived macrocytes of the type found in response to phenylhydrazine- induced anemia (Brecher & Stohlman, 1962) were produced in significant numbers in mice exposed to even the highest simulated altitude.
Plasma erythropoietin concentrations during sustained hypoxia have been reported for man (Siri et al., 1966), the rat (Stohlman, 1959), and the rabbit (Prentice & Mirand, 1961). The results of these studies are difficult to com- pare, since different assay methods were used and values were not reported in terms of a standard unit. However, the studies all show a similar temporal pattern consisting of a prompt rise in plasma erythropoietic stimulating activity with the onset of hypoxia, and a return to near baseline levels within a few days despite continued hypoxic exposure.
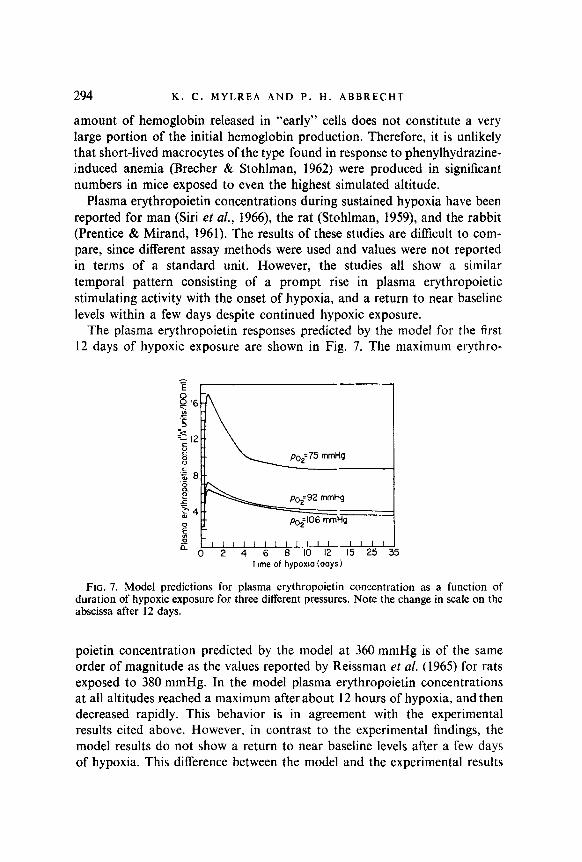
The pIasma erythropoietin responses predicted by the model for the first 12 days of hypoxic exposure are shown in Fig. 7. The maximum erythro-
Time of hypoxm (days)
FIG. 7. Model predictions for plasma erythropoietin concentration as a function of duration of hypoxic exposure for three different pressures. Note the change in scale on the abscissa after 12 days.
poietin concentration predicted by the model at 360 mmHg is of the same order of magnitude as the values reported by Reissman et al. (1965) for rats exposed to 380 mmHg. In the model plasma erythropoietin concentrations at all altitudes reached a maximum after about 12 hours of hypoxia, and then decreased rapidly. This behavior is in agreement with the experimental results cited above. However. in contrast to the experimental findings, the model results do not show a return to near baseline levels after a few days of hypoxia. This difference between the model and the experimental results
MODEL FOR CONTROL OF ERYTHROPOIESIS 295
reflects a major deficiency in the understanding of the control of erythro- poiesis during prolonged hypoxia. While the initial increase in erythro- poiesis appears to be strongly dependent upon an elevation in plasma erythropoietin concentration, the increased rate of erythropoiesis during prolonged hypoxia occurs in the absence of significantly increased plasma erythropoietin concentration.
These findings imply a change in characteristics of either the controller (the kidney) or the plant (the bone marrow) or both of these with time. Siri (Siri et al., 1966) has suggested that diminished erythropoietin release during prolonged hypoxia might be due to a reduction in “functional” hypoxia resulting from adaptive changes in cardiovascular function. Improved oxygen delivery to the bone marrow resulting from a rightward shift in the oxyhemoglobin curve (Lenfant, Ways, Aucutt & Cruz, 1969) might increase the effect of erythropoietin on red blood cell production and thus allow increased erythropoiesis to continue without large increases in erythropoietin concentration.
In the model, changes in the effective oxyhemoglobin concentration accomplished through the action of the “viscosity” correction result in a good representation of the experimentally determined erythropoietic response at various altitudes. Simulation without the viscosity correction results in substantially lower steady state blood hemoglobin concentrations at 360 mmHg than were found experimentally. While the viscosity correction allows the model to simulate the overall systems response, it results in unrealistically high steady state values for plasma erythropoietin con- centration. The viscosity correction may be viewed as an attempt to represent the adaptive changes in tissue oxygenation which occur during extended hypoxia. However, it is apparent that the use of this correction is an oversimplification which does not truly represent the adaptive mechanisms which are involved. The complete specification of the time variance in the kidney-erythropoietin-marrow relationship must await more precise methods of measuring erythropoietin concentration and tissue oxygenation.
A major use of models such as the one presented herein should be in defining the type of information which is required for more complete understanding of the system and in planning the experiments to obtain that information. At present there are not sufficient physiologic data available (nor the means of obtaining it) to allow a quantitative investigation of the individual parameters used in the model. However, evaluation of the differences and similarities between model output and physiological data from mice and other mammals can suggest various types of experiments which will provide meaningful insights into the behavior of the individual com- ponents and the system as a whole.
296 K. C. MYLREA AND P. H. ABBRECHT
This work was supported in part by Grant GB 5874 from the National Science Foundation, U.S. Public Health Service Grants AM 10395 and 521 GM 01289 and Research Career Development Award 1 K04 GM 19289 from the National Institute of General Medical Sciences.
REFERENCES
ABBRECHT, P. H. & MALVIN, R. L. (1966). Am. J. Physiol. 210, 237. ALPEN, E. L. & CRANMORE, II. (1959). Ann. N. Y. Acad. Sci. 77, 753. ALTLAND, P. D., BRUBACH, H. F., PARKER, M. G. & HIGHMAN, B. (1967). Am. J. Physiol.
212, 142. ALTMAN, P. L. & DIMMER, D. S. (Eds.) (1961). Blood and Other Body Fluids, p. 153.
Washington, D. C., Federation of American Societies for Experimental Biology. BERLIN, N. I. (1964). J. Am. med. Ass, 188, 375. BOZZINI, C. D. (1966). Nature, Lund. 209, 1140. BRECHER, G. & STOHLMAN, F., JR. (1962). In Erythropoiesis. (L. 0. Jacobson & M. Doyle,
eds.) p. 216. New York: Grune & Stratton. CONTRERA, J. F. & GORDON, A. S. (1968). Ann. N. Y. Acad. Sci. 149, 114. CROSBY, W. H. & AKEROYD, J. H. (1952). Am. J. Med. 13, 273. CROWELL, J. W. & SMITH, E. E. (1967). J. appl. Physiol. 22, 501. ERSLEV, A. J. (1960). A. Rev. Med. 11, 315. GALL, D. A. & MENO, F. (1968). Proc. a. ConJ Engng Med. Biol. 10, 32. GARBY, L., SCHNEIDER, W., SUNDQUST, 0. & VUILLE, J. (1963). Aeta. physial. stand. 29,
Suppl. 216. HARRIS, J. W. (1963). The Red Cell, p. 125. Cambridge, Mass.: Harvard University Press. JACOBXIN, L. O., GOLDWASSER, E. & GURNEY, C. W. (1959). The Kinetics of Cellular Pro-
liferation. (F. Stohlman, ed.). New York: Grune & Stratton. JACOBSEN, L. O., GURNEY, C. W. 8~ GOLDWASSER, E. (1960). Adv. intern. Med. 10, 297. KEIGHLEY, G. (1962). In Erythrapoiesis. (L. 0. Jacobson & M. Doyle, eds.) p. 106. New
York: Grune & Stratton. KIRK, J., ORR, J. S. & HOPE, C. S. (1968). Br. J. Haematol. 15, 35. KRETCHMAR, A. L. (1966). Science, N. Y. 152, 367. KURATOWSKA, Z., LEWARTOWSKI, B. & LIPINSKI, B. (1964). J. Lab. clin. Med. 64, 226. LAJTHA, L. G. & OLIVER, R. (1960). In Ciba Foundation Sytnposian~ on Haemopoiesis.
(G. E. W. Wolstenholme & M. O’Connor, eds.) p. 289. London: Churchill. LENFANT, C., WAYS, P., AUCUT-~, C. & CRUZ, J. (1969). Resp. Physiol. 7, 7. MYLREA, K. C. (1968). Ph. D. Dissertation. Ann. Arbor, Michigan, University of
Michigan. MYLREA, K. C. & ABBRECHT, P. H. (1970). Am. J. Physiol. 218, 1145. NATHAN, D. G., SCHUPAK, E., STOHLMAN, F., JR. 2% MERRILL, J. P. (1964). J. clin. Invest.
43, 2158. NEUBERGER, A. & NIVEN, J. S. F. (1951). J. Physiol., Land. 112, 292. NEWWN, C. M. & GURNEY, C. W. (1965). Biophys. J. 5, 134. NOONEY, G. C. (1966). Biophys. J. 6, 601, ORLIC, D., GORDON, A. S. & RHODIN. J. A. R. (1968). Ann. N. Y. Acad. Sci. 149, 198. POLLYCOVE, M. & MORTIMER, R. (1961). J. clin. Invest. 40, 753. PRENTICE, T. C. & MIRAND, A. E. (1961). Proc. Sot. exp. Biol. Med. 106, 501. RAHN, H. & FENN, W. 0. (1955). A Graphical Analysis of Respiratory Gas Exchange.
Washington, D.C. : The American Physiological Society. REISSMAN, K. R., DIEDERICH, D. A., ITO, K. & SCHMAUS. J. W. (1965). J. Lab. clin. Med.
65, 967. SHARNEY, L., WASSERMAN, L. R.. SCHWARTZ, L. & TENDLER, D. (1963). Ann. N. Y. Acad.
Sci. 108, 230.
MODEL FOR CONTROL OF ERYTHROPOlESIS 297
SIRI, W. E., VAN DYKE, D. C., WINCHELL, H. S., POLLYCOVE, M., PARKER, H. G. & CLEVELAND, A. S. (1966). J. appl. Physiol. 21, 73.
STOHLMAN, F., JR. (1959). Ann. N. Y. Acad. Sci. 77, 7 10. STOHLMAN, F., JR., EBBE, S., MORSE, B., HOWARD, D. & DONOVAN, J. (1968). Ann.
N. Y. Acad. Sci. 149, 156. STOHLMAN, F., JR. & HOWARD, D. (1962). In Erythropoiesis. (L. 0. Jacobson & M. Doyle,
eds.) p. 120. New York: Grune & Stratton. VAN DYKE, D. C. & POLLYCOVE, M. (1962). In Evythropoiesis. (L. 0. Jacobson & M. Doyle,
eds.) p. 340. New York: Grune & Stratton. VAN LIERE, E. J. & STICKNEY, J. C. (1963). Hypoxia, p. 37. Chicago: University of
Chicago. ZANJANI, E. D., CONTRERA, J. F., GORWN, A. S., COOPER, G. W.. WONG, K. K. & KATZ. R.
(1967). Proc. Sot. exp. Biol. Med. 125, 505.