Embed Size (px)
Citation preview
Louisiana State UniversityLSU Digital Commons
LSU Doctoral Dissertations Graduate School
2013
Mathematical and Computer-Based Models forOptimizing Microwave Heating Processes ofFrozen OystersJie ZhangLouisiana State University and Agricultural and Mechanical College
Follow this and additional works at: https://digitalcommons.lsu.edu/gradschool_dissertations
Part of the Life Sciences Commons
This Dissertation is brought to you for free and open access by the Graduate School at LSU Digital Commons. It has been accepted for inclusion inLSU Doctoral Dissertations by an authorized graduate school editor of LSU Digital Commons. For more information, please [email protected].
Recommended CitationZhang, Jie, "Mathematical and Computer-Based Models for Optimizing Microwave Heating Processes of Frozen Oysters" (2013). LSUDoctoral Dissertations. 1966.https://digitalcommons.lsu.edu/gradschool_dissertations/1966
MATHEMATICAL AND COMPUTER-BASED MODELS FOROPTIMIZING MICROWAVE HEATING PROCESSES OF FROZEN
OYSTERS
A Dissertation
Submitted to the Graduate Faculty ofthe Louisiana State University and
Agricultural and Mechanical Collegein partial fulfillment of the
requirements for the degree ofDoctor of Philosophy
in
The School of Nutrition and Food Sciences
byJie Zhang
B.S., Sichuan University, 2006M.S., Sichuan University, 2009
May 2014
ii
ACKNOWLEDGMENTS
It is my great pleasure to express my sincere gratitude and respect to my Ph. D
graduate study advisor and committee chair, Dr. Subramaniam Sathivel, for his
valuable advice and mentorship, for his patience, motivation, and enthusiasm. I would
like to thank my committee members, Dr. David Bankston, Dr. Joan King, Dr. Steven
Hall, and Dr. Ingmar Schoegl for their continuous support and guidance.
In addition, I would like to thank Mr. John Scalzo for his assistance in dielectric
properties measurement. I would like to thank my fellow lab mates: Dr. Huaixia Yin, Dr.
Luis Espinoza-Rodezno, Arranee Chotiko, Juan Li, Kevin Mis Solval, Luis Alfaro Sanabria,
Jose Luis Brandao, Cristhiam Gurdian Curran, Alexander Chouljenko, Fathima Mohideen,
Jose Daniel Estrada, Ahalya Kosal Ram and Srijanani Sundararajan for their kind help and
support. I want to thank all the Department of Food Science faculty, staff members and
graduate students for their encouragement, friendship and support.
Last but not least, to my parents, thank you for your endless love, encouragement
and support. You were all parts of this journey.
iii
TABLE OF CONTENTS
ACKNOWLEDGMENTS .............................................................................................ii
LIST OF TABLES........................................................................................................iv
LIST OF FIGURES .......................................................................................................v
ABSTRACT.................................................................................................................vii
CHAPTER 1 INTRODUCTION ...................................................................................1
CHAPTER 2 LITERATURE REVIEW ........................................................................5
CHAPTER 3 DEVELOPMENT OF THE MATHEMATICAL AND COMPUTER-BASED MODELS FOR MICROWAVE HEATING..........................64
CHAPTER 4 APPLICATION OF MATHEMATICAL AND COMPUTER-BASEDMODELS TO OYSTER MEAT ..........................................................81
CHAPTER 5 APPLICATION OF MATHEMATICAL AND COMPUTER-BASEDMODELS TO OYSTER MEAT-BASED MEAL..............................101
CHAPTER 6 SUMMARY AND CONCLUSIONS...................................................117
APPENDIX: THERMAL PROPERTIES FOR MAJOR COMPONENT OF FOODINGREDIENTS…………………………………….……..…….…. 118
VITA……………………………….……………………………………………….119
iv
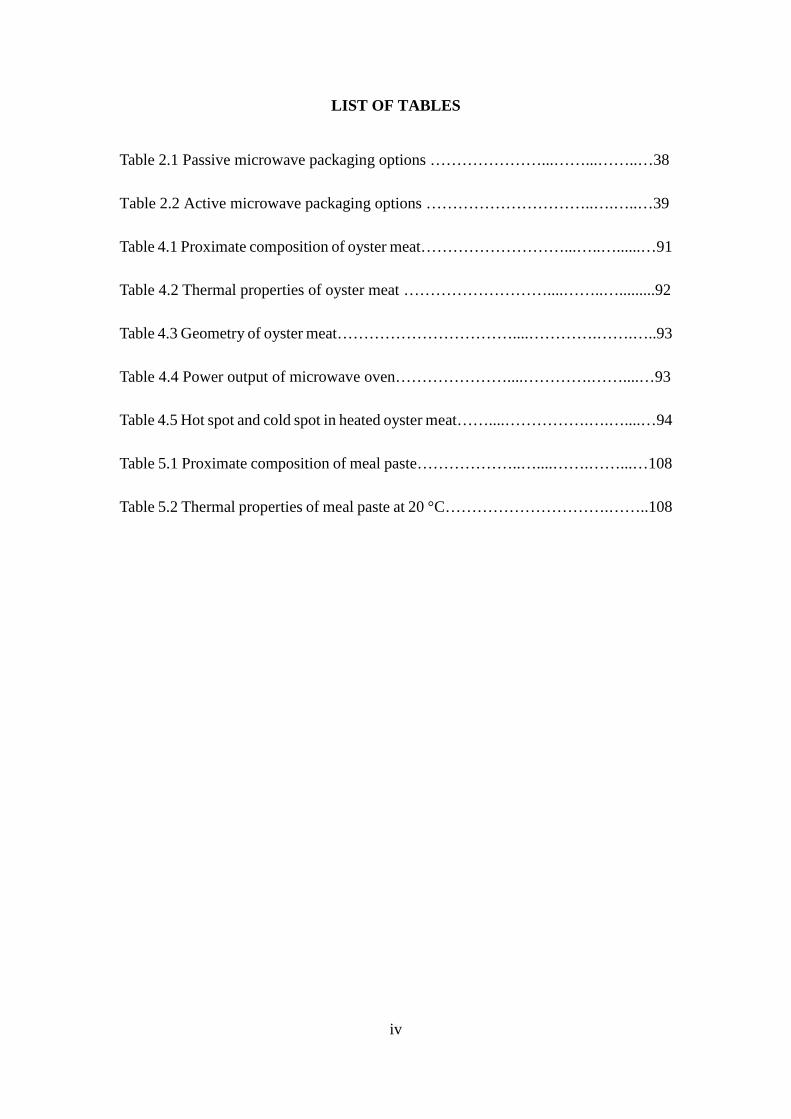
LIST OF TABLES
Table 2.1 Passive microwave packaging options …………………...……...……..…38
Table 2.2 Active microwave packaging options …………………………..….…..…39
Table 4.1 Proximate composition of oyster meat………………………...…..…......…91
Table 4.2 Thermal properties of oyster meat ………………………....……..….........92
Table 4.3 Geometry of oyster meat……………………………....………….…….…..93
Table 4.4 Power output of microwave oven…………………....………….……....…93
Table 4.5 Hot spot and cold spot in heated oyster meat……....…………….….…....…94
Table 5.1 Proximate composition of meal paste………………..…....…….……...…108
Table 5.2 Thermal properties of meal paste at 20 °C………………………….……..108
v
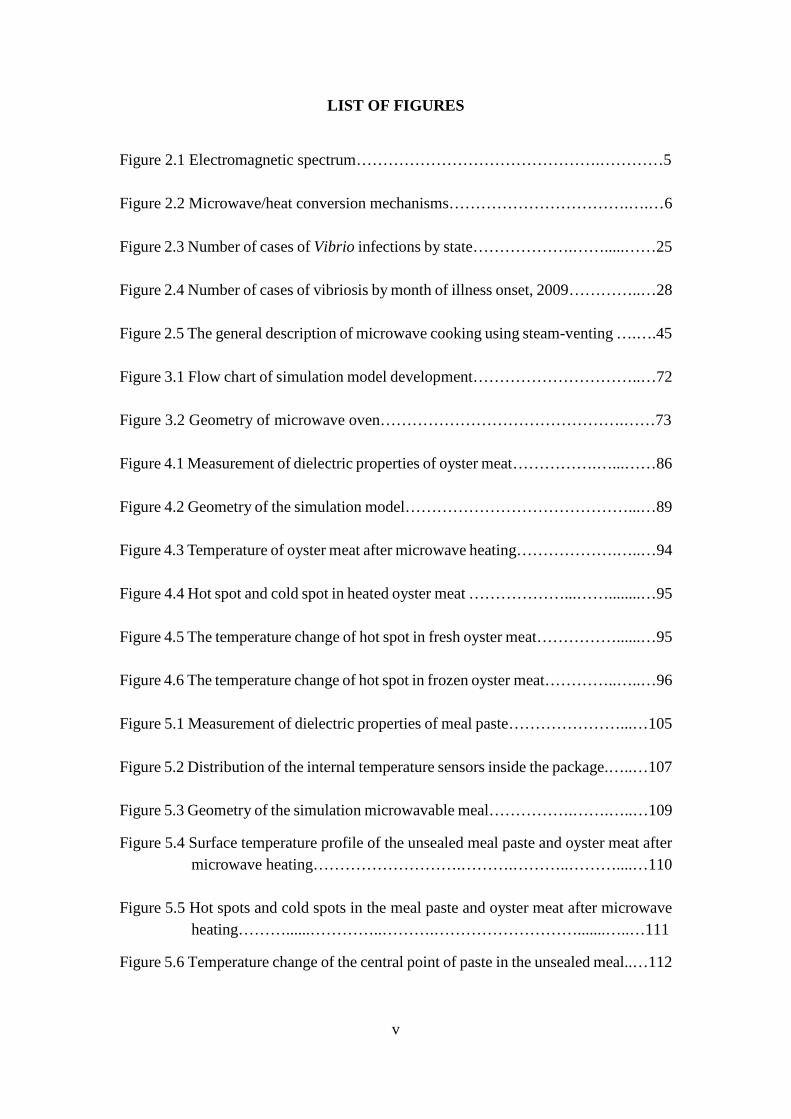
LIST OF FIGURES
Figure 2.1 Electromagnetic spectrum……………………………………….…………5
Figure 2.2 Microwave/heat conversion mechanisms…………………………….….…6
Figure 2.3 Number of cases of Vibrio infections by state……………….…….....……25
Figure 2.4 Number of cases of vibriosis by month of illness onset, 2009…………..…28
Figure 2.5 The general description of microwave cooking using steam-venting ….….45
Figure 3.1 Flow chart of simulation model development…………………………..…72
Figure 3.2 Geometry of microwave oven……………………………………….……73
Figure 4.1 Measurement of dielectric properties of oyster meat…………….…...……86
Figure 4.2 Geometry of the simulation model……………………………………...…89
Figure 4.3 Temperature of oyster meat after microwave heating……………….…..…94
Figure 4.4 Hot spot and cold spot in heated oyster meat ………………...……........…95
Figure 4.5 The temperature change of hot spot in fresh oyster meat……………......…95
Figure 4.6 The temperature change of hot spot in frozen oyster meat…………..…..…96
Figure 5.1 Measurement of dielectric properties of meal paste…………………...…105
Figure 5.2 Distribution of the internal temperature sensors inside the package.…..…107
Figure 5.3 Geometry of the simulation microwavable meal…………….…….…..…109
Figure 5.4 Surface temperature profile of the unsealed meal paste and oyster meat aftermicrowave heating……………………….……….………..………....…110
Figure 5.5 Hot spots and cold spots in the meal paste and oyster meat after microwaveheating………......…………..……….……………………….......…..…111
Figure 5.6 Temperature change of the central point of paste in the unsealed meal..…112
vi
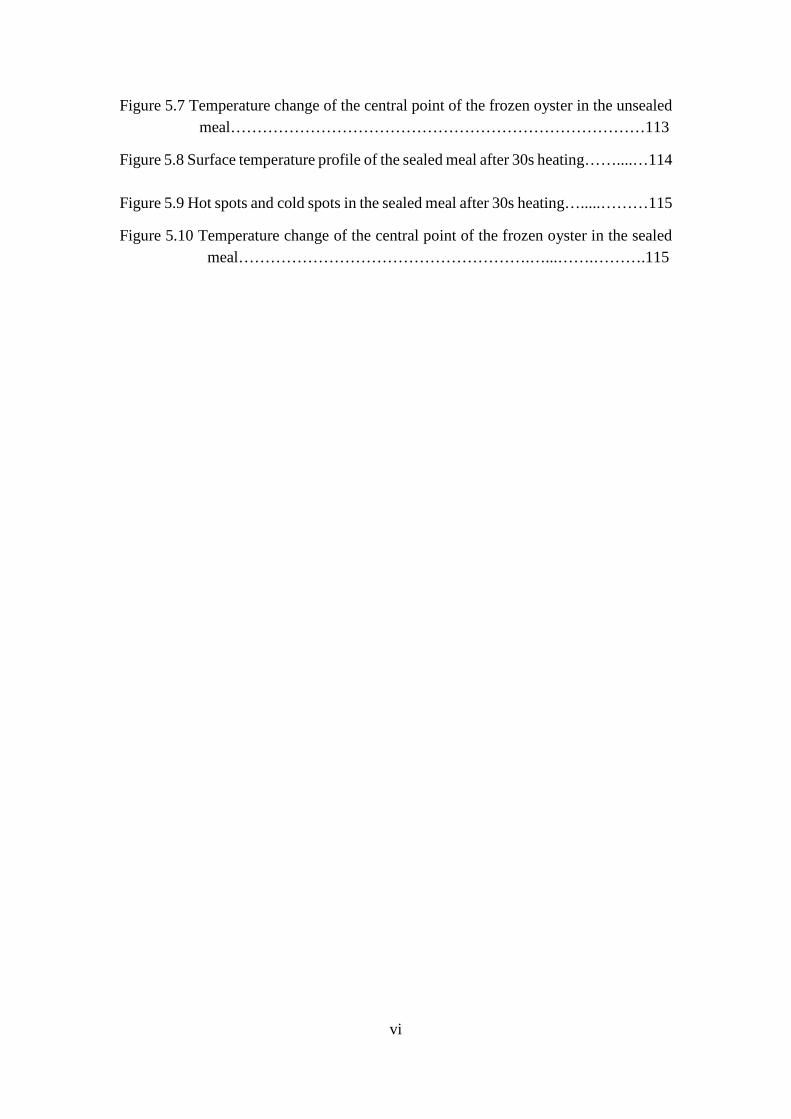
Figure 5.7 Temperature change of the central point of the frozen oyster in the unsealedmeal……………………………………………………………………113
Figure 5.8 Surface temperature profile of the sealed meal after 30s heating……....…114
Figure 5.9 Hot spots and cold spots in the sealed meal after 30s heating….....………115
Figure 5.10 Temperature change of the central point of the frozen oyster in the sealedmeal……………………………………………….…...…….……….115
vii
ABSTRACT
Consumers with full-time jobs prefer microwavable-frozen-meals for
convenience when lack time to cook. Microwaves do not require a medium for heat
transfer and provide quick heating even in low thermal conductivity foods, which does
not occur in conventional heating. The main problem in utilizing microwave-heating
for cooking is the non-uniform temperature distribution in foods which may result in
insufficient lethality of microorganisms in some part. This non-uniformity can be due
to a number of factors including composition and geometry of food. The objectives of
this study were to develop a mathematical-model based on Maxwell’s equations for
predicting the temperature distribution in frozen oyster- meats undergoing microwave-
heating and to solve the mathematical-model of the microwave heating process for
frozen-oysters with finite-element-software.
Oyster meats were analyzed for proximate analysis. The thermal properties of
oyster were determined by Choi and Okos’s equation. The dielectric properties of oyster
meat were measured by transmission line method. Oyster meats were frozen
cryogenically at -20°C and weight, shape, and dimensions of the frozen-meats were
measured. The frozen samples were placed in a laboratory Microwave-Workstation
with a maximum power of 1200 W at the operational frequency of 2450MHz.
Temperature sensors with fiber optic leads were used to minimize interactions with
microwaves. The sensors were connected to a computer with a FISO commander direct
acquisition system. Temperature profiles were plotted in real-time during microwave
viii
heating. A model based on the Maxwell’s equations was developed and used to model
the heat generation during microwave-heating.
The model predicted hot spots and cold spots in the oysters. Fresh oysters were
heated to 100°C within 12 sec with the microwave heating. Frozen oysters reached
100°C after 20 sec of microwave-heating. The temperatures of oysters immediately
after microwave-cooking ranged from 85.9 to 100.3°C, which evidenced that
microwave cooking creates non-uniform-heating. The root-mean-square-error of the
predicted-temperature vs. actual experimental values at hot spots ranged from 0.23 to
5.47 ˚C. This is decent agreement, and thus provides confidence in the model’s ability
to predict temperature-profiles of frozen-oyster-meats during microwave-cooking. The
models were also employed to predict the temperature distribution for oyster meat-
contained microwavable instant meals.
1
CHAPTER 1 INTRODUCTION
As an alternative to conventional heating methods, microwave heating is widely
used in the food industry and household to process foodstuff in past decades. The most
important characteristic of microwave heating is volumetric heat generation, which
means that materials can absorb microwave energy internally and convert it into heat
rapidly (Yam and Lai, 2006). Therefore, microwave heating becomes a popular way to
cook, thaw, bake and roast food conveniently for consumers. Nowadays, there are
millions of microwave ovens all over the United States.
The main problem associated with microwave heating is non-uniform
temperature distribution in microwave-heated foods. Both the electromagnetic fields
and the properties of the food can affect the temperature distribution during microwave
heating (Zhang and others, 2001). Due to non-uniform temperature distribution, some
areas of the material get heated very rapidly, whereas the remaining regions get heated
to a lesser extent, which will lead to hot spots and cold spots in food (Ryynanen and
others, 1996). The hot spots can cause quality change or loss in food, but the more
serious concern is the cold spots which can lead to the incomplete kill of
microorganisms.
Due to the interference of measuring devices with the electromagnetic field, the
experimental measurements of temperature in the microwave is limited (Salvi and
others, 2011). Numerical methods can be used to understand the process of microwave
heating. The distribution of the electric and magnetic fields in microwave ovens with
2
or without any load has been described by Maxwell’s equations (Dibben and Metaxas,
1994; Verboven and others, 2003; Rattanadecho, 2006). Coupled mass and energy
balances must be solved taking into account the absorption of electromagnetic energy.
Solution of Maxwell’s equations for electromagnetics coupled with heat transfer in the
oven cavity can be obtained by using different numerical methods. Accurate modeling
of the microwave heating process requires effective methods for solving both
electromagnetic and thermodynamic problems (Kopyt and Celuch, 2006). The
computer simulation is introduced into this field to solve the mathematic models and
predict the temperature distribution during microwave heating.
Oysters are one of the most popular types of seafood in the USA. Louisiana leads
the oyster production in the nation. Approximately 14.0 million pounds of eastern
oysters (Crassostrea virginica) were harvested in Louisiana in 2009 (Louisiana
Department of Wildlife and Fisheries, 2012). As a natural filter feeder, oysters can
concentrate microbes from surrounding waters. The accumulation for pathogens in
oyster tissue will cause serious health risk. The main concern associated with oyster
consumption is Vibrio species (especially V. parahaemolyticus and V. vulnificus) (CDC,
2013; Richards and others, 2010). Rapid freezing is an efficient post-harvest technique
to eliminate the health risk in the oyster industry (Muth and others, 2011; Parker and
others, 1994; Mestey, 2003). The combination of rapid freezing and packaging
technique can provide a better oyster product to consumers with longer shelf life and
less health risk. In the LSU Food Engineering Lab, a novel microwavable instant meal
3
had been developed to provide consumers an oyster based, safe, frozen and ready-to-
eat meal product and help oyster processors to expand their market. Therefore, a better
understanding of the microwave heating of frozen oysters and the microwavable meal
is necessary.
The overall goal of this study was to develop a mathematical model to predict the
heating behavior of frozen oyster product and simulate the microwave heating
processing using a computer-based model. The mathematical model was developed
initially, and then employed to build a simulation of the microwave oven heating
process in a commercial software. The temperature distribution was given by the model
to locate hot spots and cold spots and heating time.
References
CDC. (2013). Surveillance for foodborne disease outbreaks — United States, 2009–2010. Morbidity and Mortality Weekly Report (MMWR), 62(3), 41-47.
Dibben, D. C., Metaxas, A. C. (1994). Finite-Element Time Domain Analysis ofMultimode Application Using Edge Elements. Journal of Microwave Power &Electromagnetic Energy. 29 (4), 242-51
Kopyt, P. and M. Celuch. 2006. Towards a multiphysics simulation system formicrowave power phenomena. In Microwave Conference Proceedings, 2005.APMC 2005. Asia-Pacific Conference Proceedings, 4. IEEE.
Louisiana Department of Wildlife and Fisheries. (2012). 2011 Oyster Stock AssessmentReport. Retrieved September 30, 2013, fromhttp://www.wlf.louisiana.gov/sites/default/files/pdf/page_fishing/32695-Oyster%20Program/2011_oyster_stock_assessment.pdf
4
Mestey, D., & Rodrick, G. (2003). A Comparison of cryogenic freezing techniques andtheir usefulness in reduction of Vibrio vulnificus in retail oysters. MolluscanShellfish Safety. Santiago de Compostela, Spain: Consellería de Pesca e AsuntosMarítimos da Xunta de Galicia and Intergovernmental Oceanographic Commissionof UNESCO. p, 467-474.
Muth, M. K., Arsenault, J. E., Cajka, J. C., Cates, S. C., Coglaiti, M. C., Karns, S. A.,O'Neil, A. M., & Viator, C. (2011) Analysis of how post-harvest processingtechnologies for controlling Vibrio vulnificus can be implemented. Project No.0211460.008): Research Triangle International.
Parker, R. W., Maurer, E. M., Childers, A. B., & Lewis, D. H. (1994). Effect of frozenstorage and vacuum-packaging on survival of Vibrio vulnificus in gulf coastoysters (crassostrea virginica). Journal of Food Protection, 57(7), 604-606.
Rattanadecho, P. (2006). "The simulation of microwave heating of wood using arectangular wave guide: Influence of frequency and sample size." ChemicalEngineering Science 61(14): 4798-4811.
Richards, G., McLeod, C., Le Guyader, F. S. (2010). Processing strategies to inactivateenteric viruses in shellfish. Food and Environmental Virology, 2(3), 183-193.
Ryynanen, S., T. Ohlsson. (1996). Microwave heating uniformity of ready meals asaffected by placement, composition, and geometry. Journal of Food Science, 61 (3)(1996), pp. 620–624
Salvi, D. D., Boldor, D. D., Aita, G. M., & Sabliov, C. M. (2011). COMSOLMultiphysics model for continuous flow microwave heating of liquids. Journal ofFood Engineering, 104(3), 422-429. doi:10.1016/j.jfoodeng.2011.01.005
Verboven, P., et al. (2003). Computation of airflow effects on heat and mass transfer ina microwave oven. Journal of Food Engineering 59(2–3): 181-190.
Yam, K. L. & Lai, C. C. (2006). Microwavable Frozen Food or Meals. In Hui (Ed.),Handbook of Food Science, Technology and Engineering, Volume 3 (pp. 113-1 –113-9). Boca Raton, FL: CRC Press.
Zhang, H., & Datta, A. K. (2001). Electromagnetics of microwave heating: magnitudeand uniformity of energy absorption in an oven. In Ashim K. Datta andRamaswamy C. Anantheswaran (Ed.), Handbook of Microwave Technology forFood Application. New York: Marcel Dekker, Inc.
5
CHAPTER 2 LITERATURE REVIEW
2.1 Microwave Heating2.1.1 Microwave
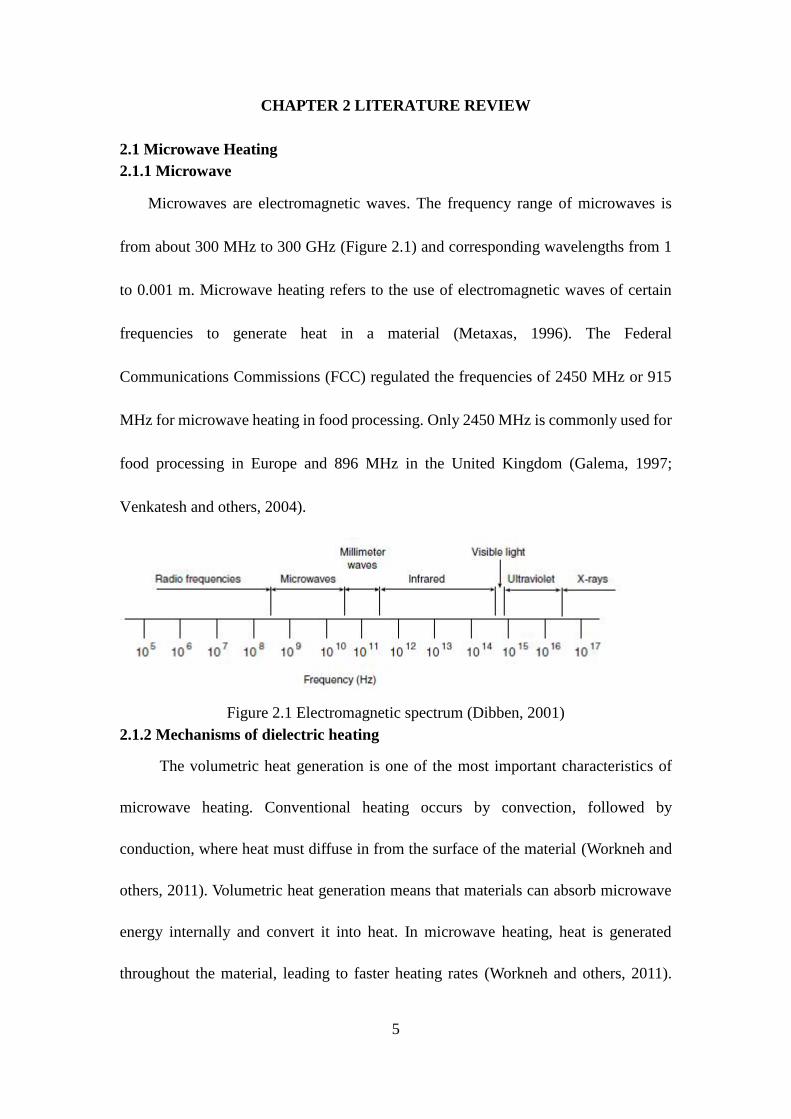
Microwaves are electromagnetic waves. The frequency range of microwaves is
from about 300 MHz to 300 GHz (Figure 2.1) and corresponding wavelengths from 1
to 0.001 m. Microwave heating refers to the use of electromagnetic waves of certain
frequencies to generate heat in a material (Metaxas, 1996). The Federal
Communications Commissions (FCC) regulated the frequencies of 2450 MHz or 915
MHz for microwave heating in food processing. Only 2450 MHz is commonly used for
food processing in Europe and 896 MHz in the United Kingdom (Galema, 1997;
Venkatesh and others, 2004).
Figure 2.1 Electromagnetic spectrum (Dibben, 2001)2.1.2 Mechanisms of dielectric heating
The volumetric heat generation is one of the most important characteristics of
microwave heating. Conventional heating occurs by convection, followed by
conduction, where heat must diffuse in from the surface of the material (Workneh and
others, 2011). Volumetric heat generation means that materials can absorb microwave
energy internally and convert it into heat. In microwave heating, heat is generated
throughout the material, leading to faster heating rates (Workneh and others, 2011).
6
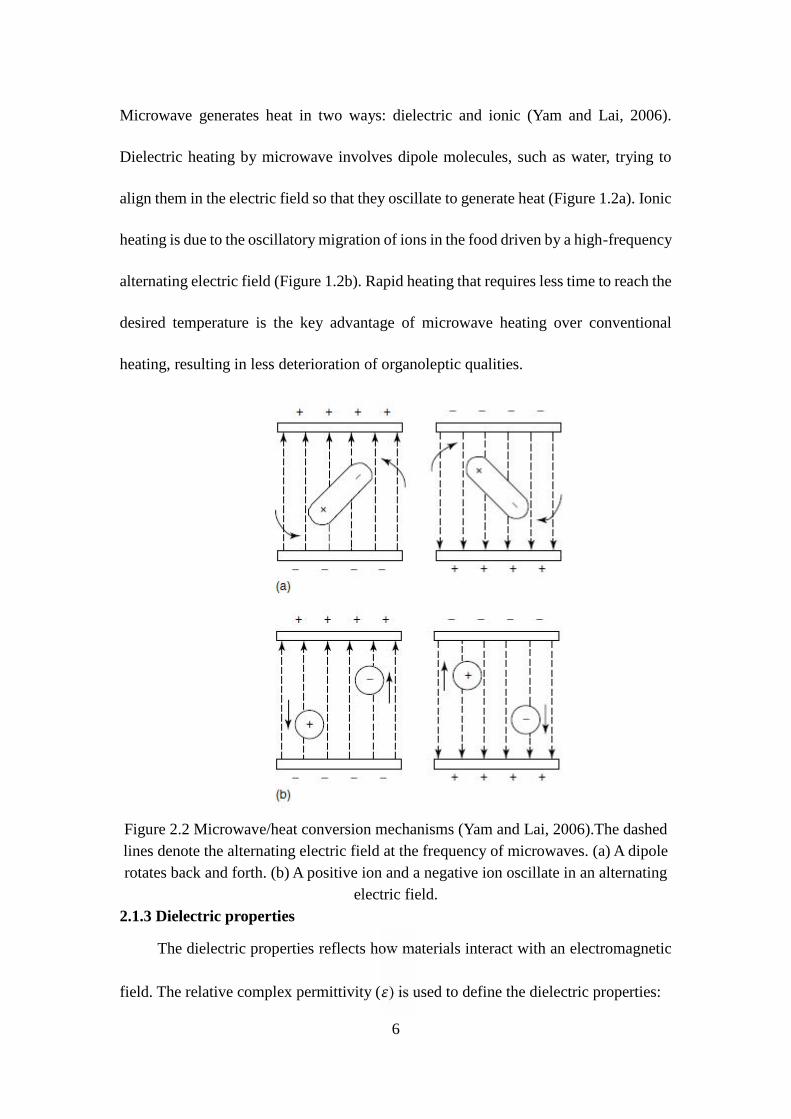
Microwave generates heat in two ways: dielectric and ionic (Yam and Lai, 2006).
Dielectric heating by microwave involves dipole molecules, such as water, trying to
align them in the electric field so that they oscillate to generate heat (Figure 1.2a). Ionic
heating is due to the oscillatory migration of ions in the food driven by a high-frequency
alternating electric field (Figure 1.2b). Rapid heating that requires less time to reach the
desired temperature is the key advantage of microwave heating over conventional
heating, resulting in less deterioration of organoleptic qualities.
Figure 2.2 Microwave/heat conversion mechanisms (Yam and Lai, 2006).The dashedlines denote the alternating electric field at the frequency of microwaves. (a) A dipolerotates back and forth. (b) A positive ion and a negative ion oscillate in an alternating
electric field.2.1.3 Dielectric properties
The dielectric properties reflects how materials interact with an electromagnetic
field. The relative complex permittivity ( ) is used to define the dielectric properties:
7
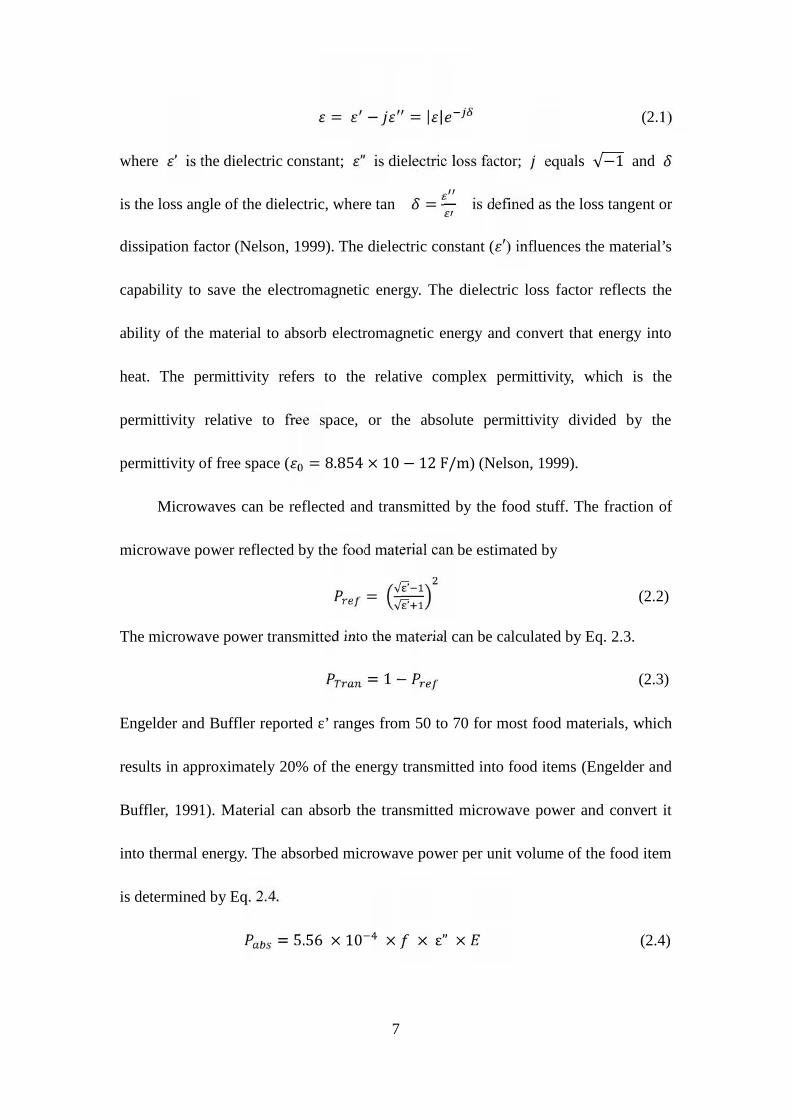
= − = | | (2.1)
where ’ is the dielectric constant; ” is dielectric loss factor; equals √−1 and
is the loss angle of the dielectric, where tan = is defined as the loss tangent or
dissipation factor (Nelson, 1999). The dielectric constant ( ′) influences the material’s
capability to save the electromagnetic energy. The dielectric loss factor reflects the
ability of the material to absorb electromagnetic energy and convert that energy into
heat. The permittivity refers to the relative complex permittivity, which is the
permittivity relative to free space, or the absolute permittivity divided by the
permittivity of free space ( = 8.854 × 10 − 12 F/m) (Nelson, 1999).
Microwaves can be reflected and transmitted by the food stuff. The fraction of
microwave power reflected by the food material can be estimated by
= √ ’√ ’ (2.2)
The microwave power transmitted into the material can be calculated by Eq. 2.3.= 1 − (2.3)
Engelder and Buffler reported ε’ ranges from 50 to 70 for most food materials, which
results in approximately 20% of the energy transmitted into food items (Engelder and
Buffler, 1991). Material can absorb the transmitted microwave power and convert it
into thermal energy. The absorbed microwave power per unit volume of the food item
is determined by Eq. 2.4.= 5.56 × 10 × × ε” × (2.4)
8
where is the absorbed microwave power (W/cm3), is the microwave frequency
(GHz), ” is the dielectric loss factor of food material, E is the electric field intensity of
given volume (V/m3). The absorbed microwave power is associated with the
microwave frequency, dielectric loss factor and the electric field intensity. The
dielectric constant has an effect on heat generation by affecting the electric field
intensity. On the other hand, the real heat generation also relied on thermal parameters,
such as specific heat. However, the actual temperature increase caused by the
microwave power also relies on thermal parameters, such as specific heat (Nelson,
1999).
Dielectric properties are related to many factors, including microwave frequency,
temperature, density, moisture content, and salt content. There are three methods mostly
used for the dielectric properties measurement: open-ended coaxial probe method,
transmission line method, and resonant cavity method (Engelder and Buffler, 1991).
These measurement methods have the same principle, including the generation of a
radiation signal at a range of frequencies, the direction of the signal through the testing
sample, the measurement of the changes in the signal caused by the material and the
computation of ε from those detected changes by computer program. A microwave
network analyzer is usually used to detect the signal changes (Engelder and Buffler,
1991).
As the fundamental effect on microwave heating, dielectric properties have
gathered researchers’ attention during recent decades. A number of studies have been
9
completed to measure the dielectric properties of different food products. Nelson and
Bartley (2001) measured dielectric properties for whey protein gel, ground whole wheat
flour, and apple juice. Many fruits and vegetables were measured by Wang and others
(2003) and Venkatesh and others (2004). Almonds and walnuts were determined by
Wang and others (2003). Wang and others (2009) studied the effects of cooking on
dielectric properties of liquid whole eggs and liquid egg whites in relation to radio
frequency and microwave heating processes to prepare shelf-stable products. Lyng and
others (2005) published a survey on the dielectric properties of meats (chicken, lamb,
beef, pork and turkey). Wang and others (2008) measured the dielectric properties for
anterior, middle, tail, and belly portions of Alaska pink salmon (Oncornynchus
gorbuscha) fillets at frequencies between 27 and 1800 MHz from 20 to 120 °C.
Dielectric properties of oysters were determined by Hu and Mallikarjunan (2005)
between 300 MHz and 3 GHz to describe the temperature effects on thermal and
dielectric properties of oysters. At microwave frequencies of 915 and 2450 MHz, the
dielectric constant of oyster decreased (64.02-50.89 and 59.10-47.67, respectively),
while the loss factor increased (13.84-20.14) at 915 MHz as temperature increased from
1 to 55 °C (Hu and Mallikarjunan, 2005).
2.1.4 Factors affecting microwaving heating
There are three aspects that can influence microwave heating significantly:
microwave equipment, the properties of food, and operating conditions. Microwave
equipment determined the generation of microwaves. The design of the microwave
equipment, such as the size, the geometry of the cavity, and the direction of the
10
magnetron, can affect the magnitude and spatial variation of the power absorption in
the product (Zhang and others, 2001). For food stuff, the geometry, mass, composition,
thermal properties and dielectric properties are all critical parameters to determine the
energy absorption and the energy spatial distribution (Zhang and others, 2001). They
also have great effect on corner and edge overheating, focusing and resonance (Datta
and Davidson, 2000). The operating conditions, including the input power, cycling
pattern, operating frequency, air-circulation, location of the food in the cavity, and the
heat equilibrium after microwave heating, can cause different heating rates and lead to
uneven temperature distribution.
2.1.5 Non-uniform temperature distribution in microwave ovens
The main problem associated with microwave heating is the non-uniform
temperature distribution in microwave-heated foods. Metal surfaces can reflect
microwaves (Bih, 2003). In microwave ovens, microwaves continue bouncing around
in the metal chamber until they are randomly absorbed by the product (Bloomfield,
2013). Thus, the distribution of electromagnetic field is uneven around different parts
of the food. On the other hand, the geometry, composition, thermal properties and
dielectric properties will affect both the absorption of microwave energy and heat
transfer (Zhang and others, 2001; Manickavasagan and others, 2006; Ryynanen and
others, 1996; Sosa-Morales and others, 2010; Vadivambal and others, 2010). Due to
non-uniform temperature distribution, some areas of the material get heated very
rapidly, whereas the remaining region gets heated to a lesser extent, which will lead to
hot spots and cold spots in food (Ryynanen and others, 1996). The hot spots can cause
11
quality changes in food, including color, texture, and flavor or odor. The serious
concern of the cold spots is the incomplete kill of microorganisms in cold spots.
Several studies have focused on the uneven temperature distribution in
microwave heating (Fakhouri and others, 1993; Geedipalli and others, 2007;
Manickavasagan and others, 2006; Ryynanen and others, 1996; Gunasekaran and Yang,
2007; Sosa-Morales and others, 2010; Vadivambal and Jayas, 2010; Liu and others,
2013 Fan and others, 2013). The solutions proposed to improve the non-uniform
temperature distribution during microwave heating includes: combining conventional
and microwave heating, controlling the food geometry, providing a shielding using
metallic bands at suitable spacing and orientation, providing suitable microwave oven
design, manipulating the heating cycle, and heating with reduced microwave power for
a longer duration (Ryynanen and others, 1996; Vadivambal and Jayas, 2010).
2.1.6 Application of microwave heating
As an alternative to conventional heating methods, microwave heating has been
widely applied in both the consumer and industrial areas during the past century.
The first commercial microwave oven, “Radarange®,” was built in 1947 by
Raytheon (Bih, 2003). The first home-use oven was introduced in 1955 by Tappan (Bih,
2003). However, the wide use of the household microwave oven in America did not
appear until the late 1970s. Since then, manufacturers have improved the microwave
ovens by employing more sensors to regulate temperature and automatic features.
Nowadays, there are millions of microwave ovens all over the United States. The rapid
microwave heating helps consumers to cook, thaw, bake and roast food conveniently.
12
As an alternative heating source, microwave heating can be applied in many food
processing areas, such as drying, thawing, pasteurization and sterilization. Numerous
studies were focused on the application of microwave drying for plants, such as wood,
fruits, and vegetables (Safeena and Patil, 2013; Marcela and others, 2013; Arballo and
others, 2012; Nair and others, 2011; Mahmoud and Taha, 2013; Chandrasekaran and
others, 2013; Liu and others, 2012; Min and others, 2010). Microwave pasteurization
was developed and employed in meat, eggs, juice, fruit, vegetables and packaged food
(Koskiniemi and others, 2013; Dehghan and others, 2012; Cinquanta and others, 2010;
Zhang and others, 2013; Huang and Sites, 2007). Many studies focused on using
microwaves to inactivate food pathogens, including Bacillus cereus, Bacillus subtilis,
Clostridium perfringens, Escherichia coli O157:H7, Listeria monocytogenes,
Staphylococcus aureus and Salmonella spp. in vegetables, beef, fish, pork, and eggs
(Fouladkhah and others, 2013; Sheen and others, 2012; Ortega and Jyeyin, 2006;
Rodriguez-Marval and others, 2009; Lianou and Koutsoumais, 2009). However,
microorganisms treated by microwave heating still have greater chance to survive
compared to conventional methods (Schiffmann, 1992).
2.2 Temperature measurement during microwave heating
Temperature is a critical factor for final product quality in microwave heating. It
is important to know the temperature distribution for avoiding the survival of
microorganisms during the food processing and storage. For reheating or cooking food,
temperature can significantly affect the color, flavor, texture, and nutritional aspects of
the food. In traditional heating methods, heat transfer is mostly limited by heat
13
conduction, and it is easy to identify the slowest heating location (Knoerzer and others,
2005). In microwave heating, as a volumetric heating method, the temperature
distribution is uneven and hard to identify the over-heated area or insufficient heated
area. Therefore, understanding the temperature distribution during microwave heating
will be helpful for building a better heating pattern. There are several methods
established for determining the temperature during microwave heating, such as
thermocouples, fiber optic probes, infrared (IR) thermography, the use of model
substances, and the use of magnetic resonance imaging (MRI) (Knoerzer and others,
2009).
2.2.1 Thermocouples
A thermocouple consists of two different electrical metallic conductors that
contact each other at one or more spots. A voltage will be generated when the
temperature of one of the spots differs from the reference temperature at other parts of
the circuit (Wikipedia, 2013). Thermocouples are widely used in science and industry
for temperature measurement. Unfortunately, thermocouples cannot be used in
microwave devices because of the interaction between the electromagnetic fields and
the metal components. Heat will generate to disturb the temperature probes, and the
metallic components will cause a disturbance of the field, leading to overheating and
possible arcing and destruction of the device, as well as damage to the product
(Knoerzer and others, 2005).
14
2.2.2 Fiber Optic Probes
The fiber optic temperature probes consist of a gallium arsenide (GaAs)
semiconductor crystal that is mounted on the end of an optical fiber (Wikipedia, 2013).
The probe is complete non-metallic, so it is immune to microwave radiation. The GaAs
crystal fixed on the tip of the fiber will be transparent at a wavelength above 850nm.
The position of the band edge is temperature dependent and is shifted about
0.4nm/Kelvin. The light is directed via the optical fiber to the crystal, where it is
absorbed and partially reflected back into the fiber. A miniature spectrometer provides
a spectrum with the position of the band edge, from which the temperature is calculated
(Wikipedia, 2013). Fiber optic probes have been used in microwave studies for
analyzing the temperature distribution, assisting organic synthesis and validating the
heating model (Cerón-Camacho and others, 2012; Pithcai and others, 2012; Nott and
Hall, 2005; Salvi and others, 2009; Mochizuki and Wada 2011; Geedipalli and others,
2007).
2.2.3 Infrared Thermography
Since infrared radiation is emitted by all objects above absolute zero, it is possible
to record the variations of temperature by a thermographic camera. The thermographic
scanning system can measure and view temperature distribution based on IR radiations
emitted from a heated surface of an object without physical contact between the
measuring equipment and surface investigated, at the time of the test. As a result, a
thermal two-dimensional image of the object is obtained, in different shades of colors
or a gray scale (Pleşu and others, 2012). Infrared thermography provides very good
15
local resolutions and is established for measuring surface temperatures. However,
infrared sensors are metallic and cannot be placed inside the electromagnetic fields of
a microwave heating assembly. Therefore, most measurements have to be done through
a shield window because the sensitive electronics inside the infrared sensors require
extensive electromagnetic shielding to allow accurate measurements in the presence of
electromagnetic fields. Thus, the efficiency and accuracy of the temperature
measurement, which in any case represents only the surface temperature of one part of
the heated product, are reduced (Knoerzer and others, 2005).
2.2.4 Model Substance
A different approach to determine temperature distributions in microwave
devices is the use of model substances that change their properties (e.g. color, pH value,
and structure) after reaching a certain temperature (Knoerzer and others, 2005). Model
substances with certain properties are used to represent certain foods. For microwave
heating scenarios, it is sometimes sufficient that only the dielectric properties are
representative for those of the food, in a certain temperature interval and at a frequency
of 2.45 GHz (Risman and others, 1993). But often (especially at lower microwave
powers or longer heating times) it is also indispensable that the thermal conductivity
and the heat capacity of the model food also fit the values of real foodstuff. Model
substances are widely used in microwave heating research. Pithchai and others (2012)
used 1% gellan gel to study microwave heating in domestic ovens. Sakai and others
(2005) conducted a study of model foods for use with microwave heating by using Agar
gel as the base, and sucrose and sodium chloride to adjust the dielectric properties. Cong
16
and others (2012) used whey protein and gellan gel to simulate sea cucumbers
(Stichopus japonicus) in microwave heating. Different ratios of whey protein gels with
d-ribose were used as a model food to study dielectric heating properties of salmon
(Oncorhynchus gorbuscha) fillets by Wang and others (2009).
2.2.5 Magnetic Resonance Imaging (MRI)
Imaging methods based on the resonant absorption and emission of
electromagnetic energy by hydrogen nuclei placed in strong magnetic fields (magnetic
resonance imaging, MRI) are well known for their wide spread clinical applications.
The fundamental relation of nuclear magnetic resonance (NMR) is the proportionality
between the angular resonance frequency ω and the magnetic-flux density B, ω = −γB,
where γ is the gyromagnetic ratio. Temperature mapping using MRI is possible, as a
temperature shift leads to a very small shift in resonance frequency and angular velocity
for hydrogen nuclei in water (Knoerzer and others, 2009). However, the high
investment costs for equipment leads to limitations for employing this technique for
microwave heating research.
2.3 Numerical Methods for Microwave Heating
Experimental measurement of temperature in the microwave is limited due to
interference of measuring devices with the electromagnetic field (Salvi and others,
2011). Numerical methods have been used to understand and optimize the process of
microwave heating. In order to characterize temperature distribution during food
heating, coupled mass and energy balances must be solved taking into account the
absorption of electromagnetic energy. The distribution of the electric and magnetic
17
fields in microwave ovens with or without any load has been described by Maxwell’s
equations (Dibben and Metaxas, 1994; Verboven and others, 2003; Rattanadecho,
2006). Currently, two ways have been followed to solve the electromagnetic energy
distribution inside the foods: to solve Maxwell’s equations (Ayappa, 1997; Oliveira and
Franca, 2002; Basak and Kumaran, 2005; Zhu and others, 2007; Hossan and others,
2010; Campañone and others, 2012) or to apply Lambert’s approximate law which deals
with an exponential energy decay inside the product (Tong and Lund, 1993; Lin and
others. 1995; Chamchong and Datta, 1999; Liu and others, 2005).
2.3.1 Maxwell’s Equations
James Clerk Maxwell (13 June 1831 – 5 November 1879) was a Scottish
mathematical physicist, who published a set of equations to describe the interaction
between electric and magnetic fields between 1861 and 1862. Those equations were
named Maxwell’s equations. The equations have two major variants, including the
"microscopic" and the "macroscopic". The microscopic variant of Maxwell's equation
expresses the electric field E and the magnetic field B in terms of the total charge and
total current present. The macroscopic variant of Maxwell's equations defines two new
auxiliary fields (magnetic field H and electric displacement D) that describe large-scale
behavior, but requires parameters characterizing the electromagnetic properties of the
relevant materials. The macroscopic variant of Maxwell's equations, which is widely
used in microwave heating calculations (Dibben and Metaxas, 1994; Verboven and
others, 2003; Rattanadecho, 2006; Zhu and others, 2007; Geedipalli and others, 2007;
Hossan and others, 2010; Campañone and others, 2012), was given by:
18
× = − (2.5a)× = + (2.5b)∙ = 0 (2.5c)∙ = (2.5d)
where × is the curl operator, E is the electric field, ∙ is the divergence operator,
is the magnetic field, is magnetic induction field, is electric displacement,
is the current density, and is charge density. All of these properties depend on the
frequency of radiation.
2.3.2 Lambert's law
Lambert’s law, also known as the Beer-Lambert law, or Beer’s law, relates the
absorption of light to the properties of the material which the light travels through. The
average temperature increases in a material during microwave heating time depends
on the total microwave energy absorbed by the material (Padua, 1993; Barringer and
others, 1995; Yang and Gunasekaran, 2001). The energy balance is given by Eq. 2.6
(Yang and Gunasekaran, 2004): ∆ = (2.6)
where, ∆ is average temperature rise (°C), is total power absorbed (W), is
heating time (s) and is sample volume (m3), is sample density kg/m3, is
sample specific heat capacity (kJ kg-1 °C-1).
Lambert’s law predicts an exponentially decaying absorption of energy as a
function of depth into the sample. When one-dimensional analysis is considered and
the incident radiation is assumed to be normal to the surface, the power absorption can
19
be given by the exponentially decaying of the incident power along that direction
(Barringer and others, 1995; Yang and Gunasekaran, 2004). The power term (Eq. 2.7)
was derived by Von Hippel (1954) and is often referred to as the Lambert’s law:( ) = (2.7)
where, is the depth or distance from the surface along the radial axis (m), ( ) is
power dissipated at the depth (Walts), is incident power or power at the surface
(Walts), and is the attenuation constant (m-1) which is a function of frequency of
radiation, (Hz); velocity of radiation, (m/s); dielectric constant, ε’ ; and loss
tangent, . However, some studies reported that Lambert’s law may cause errors
by predicting small size material due to the assumption that all transmitted energy is
absorbed (Barringer and others, 1995; Budd and Hill, 2011). Yang and Gunasekaran
(2004) reported that the power formulation based on Maxwell’s equations is more
accurate than that based on Lambert’s, especially at the outer boundary of the sample;
and the temperature at 3-cm for the 3.5-cm radius (smaller) sample was overestimated
due to ignoring the standing wave effect in Lambert’s law’s prediction.
2.3.3 Modeling for Microwave Heating
Due to the lack of computing ability to solve the necessary equations, there was
little research focused on numerical modeling of microwave heating before the late
1980s (Dibben, 2001). With the growth of computing technology, as well as significant
advances in simulation techniques, the modeling for microwave heating received more
attention in the past decades. The finite element method (FEM) and finite different time
domain method (FDTD) are two popular methods for simulating microwave heating
20
(Dibben, 2001; Liu and others, 2013; Oliveira and Silva, 2010; Romano and others,
2005; Dev and others, 2012; Pandit and others, 2003; George and others, 2005; Chen
and others, 2008; Torres and Jecko, 1997). Modeling is a useful tool to study how food
properties and oven parameters influence the microwave heating and to predict the
temperature distribution during the heating process. Both electromagnetic and
thermodynamic problems need to be taken into consideration for accurate modeling of
the microwave heating process (Kopyt and Celuch, 2006). Accounting to the lack of
understanding of non-uniform heating, complicated interactions of microwaves with
food and heat and mass transfer, the microwave heating modeling has been performed
by trial-and-error procedures (Knoerzer and others, 2006).
2.4 Oysters2.4.1 Oyster Biology
Oysters are bivalve mollusks, which lives in marine or brackish habitats. Oysters
are one of the most popular types of seafood in the USA. During last five years, the
average oyster landing in the US was over 165 thousand metric tons and the value
exceeded $1,185 million at total (National Marine Fisheries Service, 2013). There are
two main species of oysters in the USA, which are pacific oyster (Crassostrea gigas)
and eastern oyster (Crassostrea virginica). The eastern oyster occupies 75% of the total
commercialized oyster market share in the USA (Prapaiwong, 2009). Louisiana leads
the nation in the production of oysters. An average of 35% of the nation’s oyster
landings was produced in Louisiana over the 1999 – 2009 time period (Louisiana
Department of Wildlife and Fisheries, 2012). Approximately 14.0 million pounds of
21
eastern oysters (Crassostrea virginica) were harvested in Louisiana in 2009 (Louisiana
Department of Wildlife and Fisheries, 2012).
Oysters are natural marine filters. They can obtain nutrition by filtering
surrounding waters. In ideal conditions, an oyster can pump 5 gallons of water within
1 h (Perkins, 1995). Therefore, both food particles and microorganisms can be
concentrated in the oyster tissue, resulting in contaminated oysters if the water is not
clean.
2.4.2 Properties of Oysters2.4.2.1 Chemical composition of oyster meat
Depending on sex, maturity, harvest seasons, food supply, stress and other
environmental parameters, 100 g of raw oyster meat contains 75-95 g moisture, 5-10
g protein, 2-5 g carbohydrate, 0.7-2.4 g total fat, 0.7-2.9 g ash, 35-60 mg cholesterol
and about 75 calories (Sidwell and others 1974; Hu, 2004).
2.4.2.2 Thermal properties
Thermal properties of oyster meat, such as thermal conductivity and specific heat,
are important for calculation and modeling in thermal processing of oysters. The
thermal properties of the oysters may vary with the chemical composition, physical
structure, state of the substance, and temperature.
Thermal conductivity (k) is the property of a material to conduct heat. Fourier’s
law (Eq. 2.8) is used to describe the heat conduction. It states that the time rate of heat
transfer through a material is proportional to the negative gradient in the temperature
and to the area, at right angles to that gradient, through which the heat is flowing.
22
= − (2.8)
where is the heat (W), is the thermal conductivity (W·m−1·K−1), is area (m2),
and is the temperature (K). The most commonly used method to measure thermal
conductivity is line heat source method, which applies transient state heat transfer,
which is to apply a steady heat flux through a sample and measure the temperature rise
at some point resulting from an applied heat flux. A modification of this technique was
the development of the thermal conductivity probe. The theory of the line heat source
is to assume a line heat source of constant strength in an infinite homogeneous body at
uniform temperatures. Under these conditions, the temperature at any point of the body
will be a function of several variables including time and thermal conductivity (Hu,
2004). Thermal conductivity was closely related to the product’s bulk density
(Shrivastava and Datta, 1999). It is reported that thermal conductivity was reduced
when the bulk density decreases, which is due to the air being a poor heat conductor.
Thermal conductivity of unfrozen foods or biological materials having high moisture
content has a value close to water, which is 0.597 W/m°C at 20 °C (Hu, 2004). Hu and
Mallikarjunan (2005) reported the thermal conductivity of oyster meat increased from
0.578 W/m°C to 0.677 W/m°C as temperature increased from 0°C to 50°C.
Specific heat, also called heat capacity, or thermal capacity, is defined as the
amount of heat energy required to change the temperature of an object or body by a
given amount. The method of mixtures and the differential scanning calorimeter
method are used to measure the specific heat. The method of mixtures is placing a
specimen with known mass and temperature into a calorimeter of known specific heat
and water of known mass and temperature (Rahman, 1993). The principle of the
23
differential scanning calorimeter (DSC) is to heat a sample and a reference at a known
rate in a controlled environment. The increase in sample and reference temperature will
be about the same (depending on specific heat differences), unless a heat-related change
takes place in the sample, where the sample either releases or absorbs heat (Hu, 2004).
In DSC, the temperature difference between sample and reference from such a heat
change is directly related to the differential heat flow (Hu, 2004). It was reported that
the specific heat above freezing and below freezing was 3.77 and 1.93 kJ/ (kg °C),
respectively, for oyster meat and 3.52 and 1.84 kJ/ (kg °C) for oysters in shells. The
latent heat of fusion for both oyster products was reported as 290 and 267 J/g,
respectively (Ashrae, 1977). A study reported the specific heat of oyster meat increased
from 3.795 kJ/kg°C to 4.047 kJ/kg°C when the temperature increased from 10°C to
50°C (Hu and others, 2005).
2.4.3 Foodborne diseases related to oyster consumption2.4.3.1 Foodborne diseases
Foodborne illness refers to any illness resulting from the consumption of
pathogenic bacteria-, viruses-, or parasites-contaminated food. Foodborne diseases
spread through food or beverages are a serious and worldwide problem for people. The
Centers for Disease Control and Prevention (CDC) estimates that 31 identified
pathogens cause 48 million episodes of foodborne illnesses, 128,000 hospitalizations,
and 3,000 deaths each year (Scharff, 2012). During 2009–2010, a total of 1,527
foodborne disease outbreaks (675 in 2009 and 852 in 2010) were reported, resulting in
29,444 cases of illness, 1,184 hospitalizations, and 23 deaths (CDC, 2013). Foodborne
24
disease is extremely costly. Health experts estimate that the yearly cost of all foodborne
diseases in the United States is 5 to 6 billion dollars in direct medical expenses and lost
productivity (Nation Institute of Allergy and Infectious Diseases, 2012).
Seafood is a leading cause of foodborne disease with known etiology, responsible
for 10-20% of outbreaks (two or more cases caused by the same source) among all food
types and about 5% of all individual illnesses (Ralston and others, 2011). Many of the
detailed investigations of foodborne illnesses were focused on oysters, since they are
often prepared raw or mildly cooked (Iwamoto and others, 2010).
2.4.2.3 Health Risk Associated with Consumption of Oysters
Oysters are natural filter feeders that can filter and concentrate microbes from
their surroundings. The accumulation of pathogens in oyster causes serious health risks.
The main concern associated with the oyster is the Vibrio species, which are
characterized as Gram-negative, rod-shaped, or curved rod-shaped, halophilic bacteria.
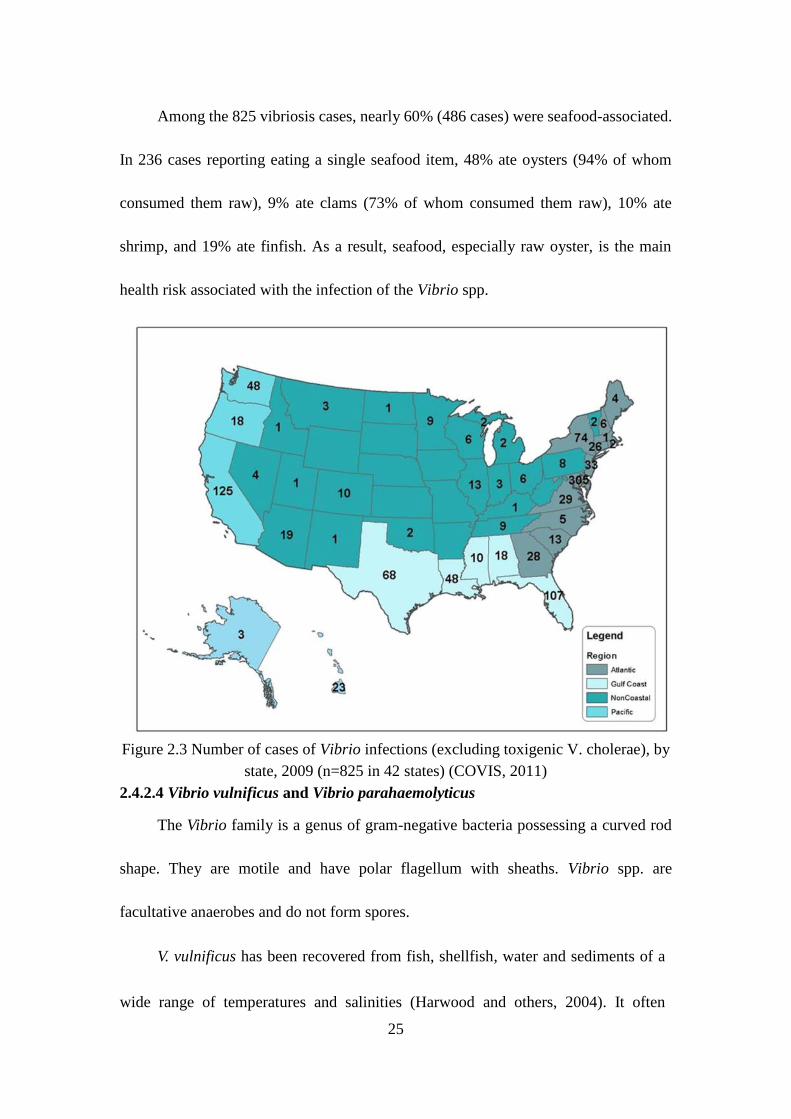
The Vibrio spp. are widespread in marine and estuarine environments. According to the
Cholera and Other Vibrio Illness Surveillance (COVIS) system built by the CDC, 825
cases of vibriosis (excluding toxigenic V. cholerae) were reported in 42 states in 2009
(COVIS, 2011). Of these cases, 217 (26%) were from Pacific Coast states, 256 (31%)
from Atlantic Coast states, and 101 (12%) from non-coastal states (Figure 2.3). In Gulf
Coast states, the most frequently reported Vibrio species were V. vulnificus (27%) and
V. parahaemolyticus (21%), followed by V. alginolyticus (19%), and non-toxigenic V.
cholera (13%). In non-Gulf Coast States V. parahaemolyticus (58%) exceeded V.
alginolyticus (14%), V. vulnificus (7%), and non-toxigenic V. cholerae (7%).
25
Among the 825 vibriosis cases, nearly 60% (486 cases) were seafood-associated.
In 236 cases reporting eating a single seafood item, 48% ate oysters (94% of whom
consumed them raw), 9% ate clams (73% of whom consumed them raw), 10% ate
shrimp, and 19% ate finfish. As a result, seafood, especially raw oyster, is the main
health risk associated with the infection of the Vibrio spp.
Figure 2.3 Number of cases of Vibrio infections (excluding toxigenic V. cholerae), bystate, 2009 (n=825 in 42 states) (COVIS, 2011)
2.4.2.4 Vibrio vulnificus and Vibrio parahaemolyticus
The Vibrio family is a genus of gram-negative bacteria possessing a curved rod
shape. They are motile and have polar flagellum with sheaths. Vibrio spp. are
facultative anaerobes and do not form spores.
V. vulnificus has been recovered from fish, shellfish, water and sediments of a
wide range of temperatures and salinities (Harwood and others, 2004). It often
26
flourishes in warm water with a salinity of 5-25 ppt (Oliver, 2005). Optimal
temperature for its growth is higher than 20 °C (Mahmud and others, 2008). It was
reported that as the salinity increases, V. vulnificus is found only at higher temperatures
(Randa and others, 2004). The growth of V. vulnificus was significantly suppressed
when the temperature lower than 8.5 °C or above 35 °C (Kaspar and Tamplin, 1993).
V. vulnificus has the highest mortality ratio of any foodborne pathogen, which is
approximately 50% (FAO, 2005). It was reported V. vulnificus had a D value of 3.7
min at 47 °C and 1.15 min at 50 °C (Drake and others, 2003). V. vulnificus is
particularly virulent. Persons at risk for severe V. vulnificus disease are those with
preexisting liver disease, alcoholism, diabetes, hemochromatosis, or an
immunocompromising condition (Vugia and others, 2013). Symptoms of V. vulnificus
infections include vomiting, diarrhea, abdominal pain, and a blistering dermatitis. The
infection exhibits two main clinical manifestations, including primary septicemia and
primary wound infections, which can progress rapidly and become lethal even to an
otherwise healthy person (Chien-Han and others, 2013). The case fatality rate is about
50% for bloodstream infections and 25% for wound infections (Iwamoto and others,
2010).
V. parahaemolyticus can be found in seafood, such as crabs, shrimps, prawns,
scallops, oysters and clams (Far and others, 2013; Lim Mui and others, 2013; Parveen
and others, 2008; Hayat Mahmud and others, 2006). The occurrence of V.
27
parahaemolyticus in the marine environment is correlated with water temperature; with
strains readily isolated when environmental temperatures exceed 15°C (Powell and
others, 2013). It grows readily at temperatures from 22-42 °C but does not grow below
4 °C or above 45 °C. The D value at 50 °C varied from 2.95 min to 4.26 min depending
on the location and time of the isolation (Wong and others, 2000). The V.
parahaemolyticus infection will cause watery diarrhea, abdominal cramps, nausea, and
vomiting. Wound infections and septicemia occur less commonly (Painter and others,
2013; Scallan and others, 2011). An estimated 35,000 cases of foodborne gastroenteritis
are related the consumption of contaminated seafood with V. parahaemolyticus in the
United States each year (Scallan and others, 2011), and most reported cases are caused
by oysters. Although V. parahaemolyticus is recognized as a major cause of seafood-
borne gastroenteritis, most strains of this species are not pathogenic to humans
(Iwamoto and others, 2010).
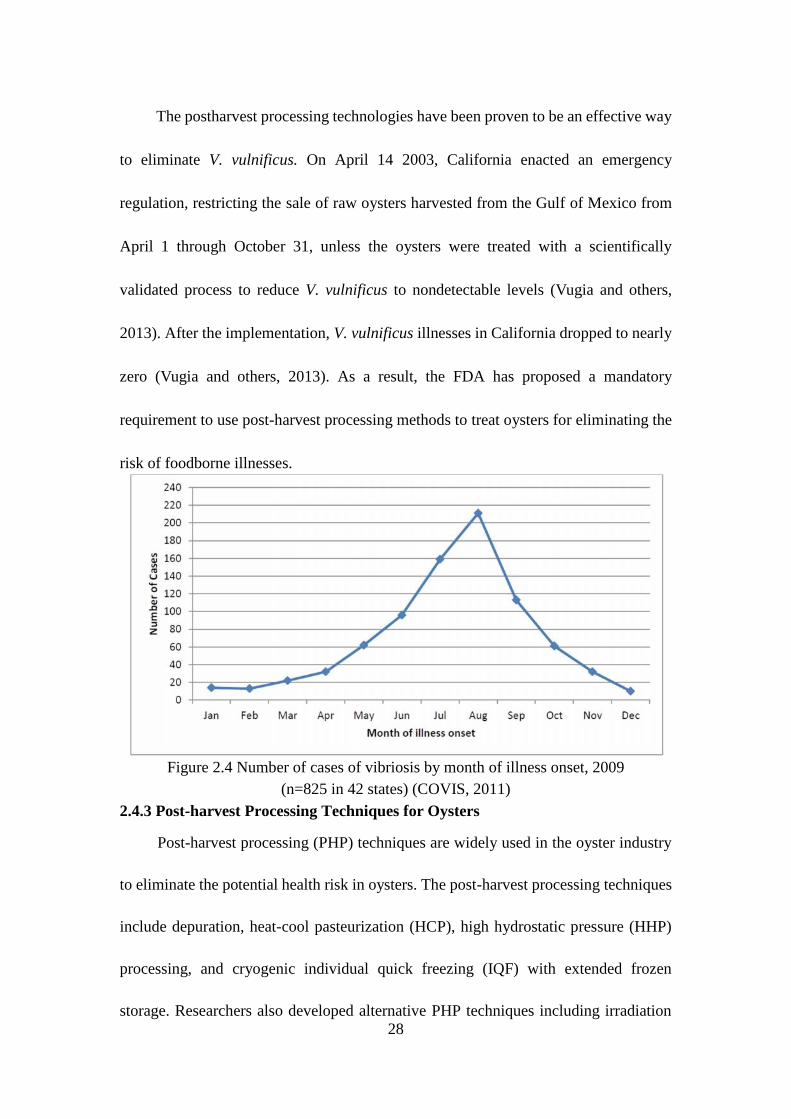
During the summer months, oysters may concentrate V. spp. in warmer waters
(Corcoran, 1998). Cases of vibriosis had a definite peak during the summer months
(Figure 2.4). Most cases (78%) occurred from May to September, with the greatest
number in August (COVIS, 2011).
Heating is an efficient way to eliminate Vibrio spp. A proper way to kill Vibrio
vulnificus is to boil shucked oysters at least 3 minutes (CDC, 2009). By heating oyster
meat at 50˚C for 5 min, 99.9% V. vulnificus and 100% V. parahaemolyticus were
eliminated in the shell-stock oysters (Andrews and others, 2000).
28
The postharvest processing technologies have been proven to be an effective way
to eliminate V. vulnificus. On April 14 2003, California enacted an emergency
regulation, restricting the sale of raw oysters harvested from the Gulf of Mexico from
April 1 through October 31, unless the oysters were treated with a scientifically
validated process to reduce V. vulnificus to nondetectable levels (Vugia and others,
2013). After the implementation, V. vulnificus illnesses in California dropped to nearly
zero (Vugia and others, 2013). As a result, the FDA has proposed a mandatory
requirement to use post-harvest processing methods to treat oysters for eliminating the
risk of foodborne illnesses.
Figure 2.4 Number of cases of vibriosis by month of illness onset, 2009(n=825 in 42 states) (COVIS, 2011)
2.4.3 Post-harvest Processing Techniques for Oysters
Post-harvest processing (PHP) techniques are widely used in the oyster industry
to eliminate the potential health risk in oysters. The post-harvest processing techniques
include depuration, heat-cool pasteurization (HCP), high hydrostatic pressure (HHP)
processing, and cryogenic individual quick freezing (IQF) with extended frozen
storage. Researchers also developed alternative PHP techniques including irradiation
29
(electric beam irradtiation, X-ray and microwave technology) (Jakabi and others, 2003;
Mahmoud, 2009) and high salinity treatment (Larsen and others, 2013). The Food and
Drug Administration (FDA) required the applicable PHP methods should be able to
reduce Vibrio vulnificus and Vibrio parahaemolyticus, by >3.52 log and by > 4 log
respectively, to nondetectable levels (<30 MPN/gram) (FDA, 2009).
2.4.3.1 Depuration
Depuration is a process involving that immersion of oysters in tanks of clean
seawater to allow sewage contaminants to be purged. The depuration is always
associated with the ultraviolet irradiation to sterilize seawater. The temperature and
salinity are two main factors which can affect the reduction of Vibrios. It is reported
that depuration of oysters at 2 or 3 °C had no effect on reducing V. parahaemolyticus.
Depuration at 7–15 °C for 5 days reduced V. parahaemolyticus populations in oysters
by >3.0 log MPN/g (Phuvasate and others, 2012). Higher salinity will lead to greater
reduction of Vibrio. Holding oysters in water with a salinity of 10 ppt for 5 days resulted
in about 2 log MPN/g reductions of V. parahaemolyticus, which were significantly
smaller than those (>3.0 log10 MPN/g) observed in water with higher salinities (20–30
ppt) (Phuvasate and Su, 2013). Using a salinity of 35 Practical Salinity Unit (PSU) it
was possible to eliminate this V. vulnificus to non-detectable levels (Larsen and others,
2013).
2.4.3.2 Heat-Cool Pasteurization
The heat-cool pasteurization was developed and patented in 1995 by AmeriPure
in Franklin, Louisiana (Horst and others, 2011). This process involves submerging the
30
raw product into warm water followed by immediate cold water immersion. The
internal temperature of the oysters will be increased to high enough to reduce the loads
of Vibrio spp. to non-detectable level without cooking the oyster meat during the
exposure. In this process, oysters are washed, graded, sorted, and individually banded
in order to avoid extreme loss of internal juices, arranged in racks, and then submerged
in water at 52°C (127°F) for 24 minutes. Then the racks are lifted out and placed in 4°C
water for 15 minutes. Temperature and time have been validated through several studies
showing reduction of bacterial loads with minimal cooking of the meat and increasing
of yields of higher moisture content compared to untreated oysters (Andrews and others,
2000; Muth and others, 2000). Chen and others (1996) found that the HCP process
yielded oysters comparable in flavor, texture and smell to untreated oysters, but a slight
lightening of color was observed.
2.4.3.3 High Hydrostatic Pressure
High pressure processing (HPP), also called pascalization, is a method to process
food for preservation and sterilization by inactivating certain microorganisms and
enzymes in the food under very high pressure. The operation pressure range can be 100
to 800 MPa, and the operation temperature can be below 0°C or over 100°C. In normal
operation, food products are sealed and placed into a steel compartment, which contains
liquid, often water, and pumps are used to create pressure.
The use of HPP on oysters was developed and patented by Motivatit Seafoods in
Houma, LA in 1999. It has been suggested that susceptibility to high pressure (HP) of
Gram-negative compared to Gram-positive bacteria is due to the complexity of Gram-
31
negative cell membranes (Shigehisa and others, 1991). As a typical Gram-negative
bacteria, Vibrio spp. are more sensitive to pressure than other most of other bacteria.
HP disrupts membrane function and causes leakage through the inner and outer
membranes, lead to increased sensitivity to sodium chloride and bile salts, uptake of
propidium iodide and ethidium bromide, and leakage of ATP (Murchie and others,
2005). Membrane perturbation is attributed to the promotion of phase transitions in the
phospholipid bilayer from liquid to more tightly packed gel phases (Murchie and others,
2005). HP can also denature or displace membrane-bound enzymes. Berlin and others
(1999) showed that pathogenic Vibrio spp. are susceptible to HPP treatment at pressure
levels between 200 and 300 MPa. It was also reported that HPP can inactivate viruses
accumulated in oysters (Black and others, 2010; Kingsley, 2009; Kingsley, 2007; Grove,
2009; Li, 2009; Grove, 2008). HPP starts with cleaning, washing, sorting and grading
oysters. Then oysters are banded and containerized (placed in a stainless steel cylinder)
in preparation for the high-hydrostatic pressure, which may last 4-6 minutes. After
pressurization, the oysters are shucked for half shell or packaged as banded oysters.
After the HPP treatment, the safe-to-eat oysters retain the appearance, flavor, texture
and nutritional qualities similar to untreated fresh oysters (Murchie and others, 2005)
with a shelf-life of almost 30 days (He and others, 2002) under refrigerated conditions.
The adductor muscle of oyster is not removed from the shell in HPP, which can help
oysters keep good shape and appearance, and also obtain a higher retention of moisture,
providing shucking yields of 25–50% (Murchie and others, 2005).
32
2.4.3.4 Cryogenic Individual Quick Freezing
Individual quick freezing (IQF) involves cryogenically freezing of half shell
oysters on trays, then adding a thin glaze of ice to seal in the natural juices before storing
them frozen. Employing IQF to oysters for extending shelf life was first developed in
1989 and rapidly popularized in Australia, Canada, New Zealand, and the United States.
IQF processing of oysters is applied by companies in California, Florida, Louisiana and
Texas. It has the biggest market share of the post-harvest processed raw oyster market.
In IQF processing, oysters are cleaned and shucked, then placed on specially designed
trays and loaded into a tunnel freezer, where they are cryogenic frozen by liquid carbon
dioxide or liquid nitrogen. After freezing, water is used to form a glaze of ice on the top
of oysters on contact. Then oysters will be stored in wax-coated corrugated boxes and
placed in a walk-in freezer for a period of time sufficient to achieve non-detectable
levels of Vibrio spp. (Muth and others, 2011). The cryogenically quick freezing
technique can give the frozen oysters longer shelf-life than any other post-harvest
process technology and keep most of the flavor and appeal of non-processed oysters
between six and twelve months under frozen storage (Songsaeng and others, 2010).
The formation of intracellular and extracellular ice crystals during freezing can
affect microorganisms significantly, which will cause cellular damage, solute
concentration in both intracellular and extracellular sides, and lead to death. The rapid
decreasing of temperature can disrupt membrane transport mechanisms, which are
intricate due to complexity of the membrane’s structure, altering functional metabolic
and enzymatic processes (Archer, 2004). Freezing is an efficient way to reduce the
33
number of these pathogens in oyster and oyster meat. Parker and others (1994) reported
significant reductions of three to four logs in Vibrio vulnificus in oysters injected with
106 CFU/g and then frozen at -20ºC in an air blast freezer. In the first seven days, most
reductions occurred and continued with the time. Mestey (2003) and others observed
there was a lower number of recoverable V. vulnificus when CO2 was used for
cryogenic freezing of half shell oysters. For whole oysters, bacterial levels were
undetectable after 14 days for CO2 (-67ºC) and after 21 days, in most cases, for liquid
nitrogen (-91ºC). Muntada-Garriga and others (1995) reported that viable cells of V.
parahaemolyticus (105-7CFU/g) in oyster homogenates were completely inactivated by
freezing at -18 and -24°C for 15 to 28 weeks depending on initial populations of the
microorganism and freezing temperatures. Liu and others (2009) investigated the
effects of cryogenic freezing on V. parahaemolyticus by liquid nitrogen (-95.5ºC) in
Pacific oysters. Half shell Oysters were frozen through a cryogenic tunnel with a
retention time of 12 minutes. After the freezing process, the population of bacteria in
the oysters declined by 0.22 log MPN/g. Followed by frozen storage studies, oysters
stored at -10 had more rapid decrease of the V. parahaemolyticus population than at -
23 or -30°C. There was greater than 3-log (MPN/g) V. parahaemolyticus, which started
at 105 MPN/g in oysters, stored at -10°C for three months or at -23°C for four months.
However, studies also showed that both V. vulnificus and V. parahaemolyticus
have tolerance to cold temperatures. V. vulnificus can have better tolerance to colder
temperatures if it has been exposed at an intermediate temperature, such as being placed
at 15°C before final storage at 6°C (Bryan and others, 1999; Johnston and others, 2002;
34
Oliver, 2005). This tolerance may be due to formation of cold-adaptive protein during
the freezing processing. V. parahaemolyticus has the same characteristic as V.
vulnificus. The survival of V. parahaemolyticus would even be increased when stored
at low temperatures (-18ºC) (Johnston and others, 2002; Lin and others, 2004). The
reason for this increase may be the morphological changes of V. parahaemolyticus
under cold and starvation stresses (Chen and others, 2009).
2.5 Microwavable packaging
The functions of food packages include protection for food integrity and quality,
assisting the consumer in the use of the product and attracting consumers to purchase
and use the product (Bohrer and Brown, 2001). If the package is used to hold the food
during microwave heating, the interactions between microwaves and the package must
also be considered. Since the package can transmit, reflect, or absorb microwaves, it
can also greatly influence the microwave heating behavior. The microwavable package
acts in two different ways: passive and active. The passive packages are made of
materials that do not appreciably react to the microwave field of the oven or appreciably
modify the power distribution in the oven (Guillard and others, 2010). The active
packages are packages that can act in reflecting and absorbing microwaves in such a
manner that the power distribution of the microwaves and the surface temperature of
package are modified (Yam and Lai, 2006). Though there are numerous different
microwave packaging formats used, round or oval shapes with vertical sides and round
edges are the common characteristics of them. These shapes help to minimize corner
and edge overheating during microwave heating, which is the major problem due to the
35
concentration of high intensity electromagnetic fields in these areas (Knoerzer and
others, 2009; Risman and others, 1987; Zhang and others, 2001).
2.5.1 Passive packages
Passive packages do not interact with the electromagnetic fields, which means
they are considered as microwave transparent. During cooking, they only act as the
containers to keep the product, prevent spilling or leakage, and facilitate removal of the
cooked product from the oven. The temperature stability required of a passive package
for microwave use is dependent on the formulation of the food to be heated, as the
temperature that the package reaches can be no higher than that reached by the hottest
part of the food. In foods with high moisture contents, temperatures rise to the vicinity
of 100°C, and then plateau in that range until substantial dehydration occurs (Yam and
Lai, 2006). While dehydration will allow higher temperatures to be reached, continued
microwave heating after that point will cause overheating of certain parts of the product,
where are the hot spots existed, and lead to the quality loss.
The most common microwave transparent materials are plastic packages (mono-
or multi-layer polymers), plastic-coated cardboard or fiber trays, and glass packages
(Risch, 2009). Yam and Lai (2006) summarized several popular packages and materials.
Plastic-coated paperboard trays are widely used for microwavable frozen meals due the
low cost. The trays combine the rigidity of the paperboard and the chemical resistance
of the plastic. The inside of the trays is either extrusion coated with a resin or adhesive
laminated with a plastic film. Molded pulp trays are another common paper product
and can carry more load than the paperboard containers. Thermoformed plastic trays
36
are also common heating containers for microwavable foods. Low-density polyethylene
(LDPE) trays are suitable for light microwave heating because the trays tend to distort
at temperatures as low as 75°C. Polypropylene (PP) trays have a distortion temperature
of about 110°C. Polyethylene terephthalate (PET) trays can be used because of the high
temperature stability (up to about 200°C). Crystallized polyethylene terephthalate
(CPET) trays are the most widely used plastic trays for microwavable frozen meals.
The CPET trays are functional in the temperature range from -40 to 220°C. Thus, the
trays can be able to handle not only the low temperatures in distribution and handling
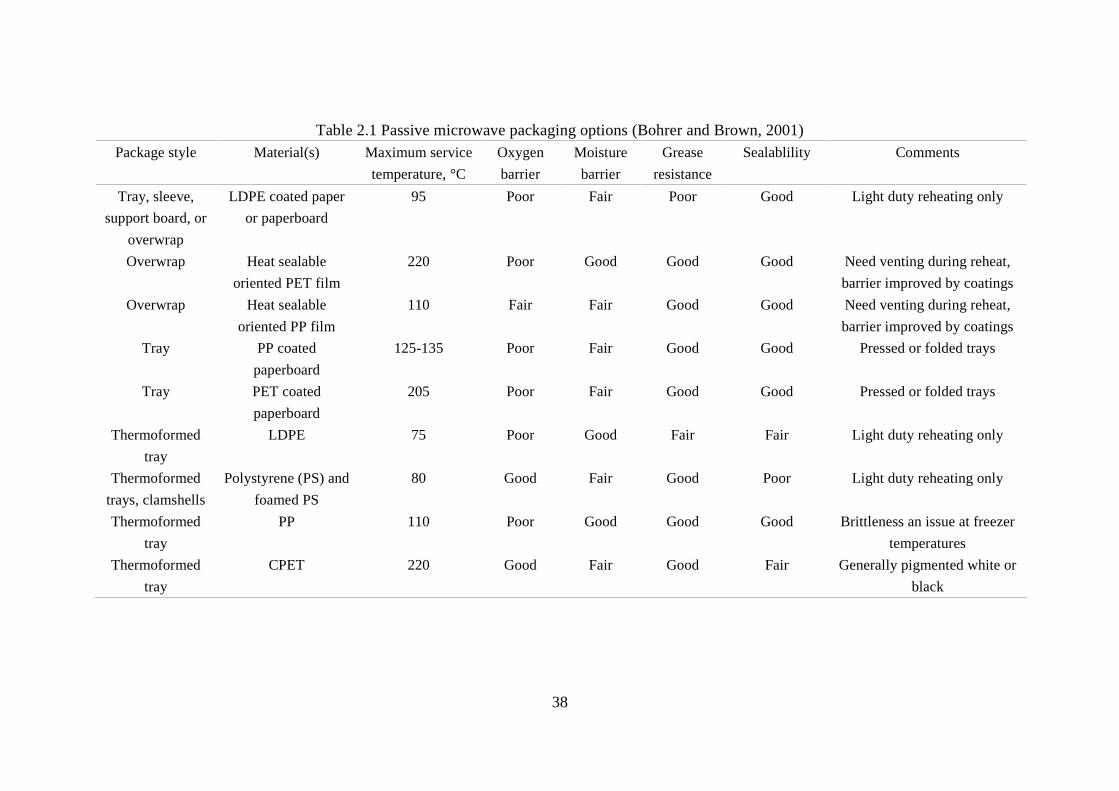
end, but also the temperatures in cooking or thermal processing end. Bohrer and Brown
(2001) summarized the performance characteristics of a selection of commonly used
options for passive packages for microwave heating, which is shown in Table 2.1.
2.5.2 Active packages
Active packaging means that the package is designed to perform functions during
the heating process. An active package augments the cooking process by either adding
capability not normally present in microwave heating or by overcoming inherent
deficiencies in the way microwaves interact with the food being heated. Two objectives
of the active package design for improved microwave cooking include application of
surface heating and power distribution modification (Bohrer and Brown, 2001).
Materials used in active packages should balance three interactions with microwaves:
reflection, absorption, and transmission. Aluminum foil, aluminum/plastic laminate,
and aluminum/plastic/paperboard laminate are the most common microwave reflective
materials (Yam and Lai, 2006). Since these materials do not allow the transmission of
37
microwaves, they are also known as microwave shielding materials. Aluminum is often
used to selectively shield microwaves from certain areas of a food so that the entire
food stuff or meal will be heated more evenly. However, precautions are necessary to
prevent arcing for the use of aluminum in microwave heating. Microwave absorbent
materials, which are also called susceptors, are used to generate surface heating to
mimic the browning and crisping ability of the conventional oven. The only
commercially available type is the metalized film susceptor (Yam and Lai, 2006). This
type of susceptor consists of a metalized polyethylene terephthalate film laminated to a
thin paperboard. The metal layer is a very thin (less than 100 angstroms), discontinuous
layer of aluminum, which is responsible for generating localized resistance heating
when exposed to microwaves. Heating can cause the susceptor to reach surface
temperatures over 200°C within seconds. Susceptors are available in the forms of flat
pads, sleeves, and pouches for different food types. However, due to the high
temperature that will be reached in the susceptor, there is a public concern of migration
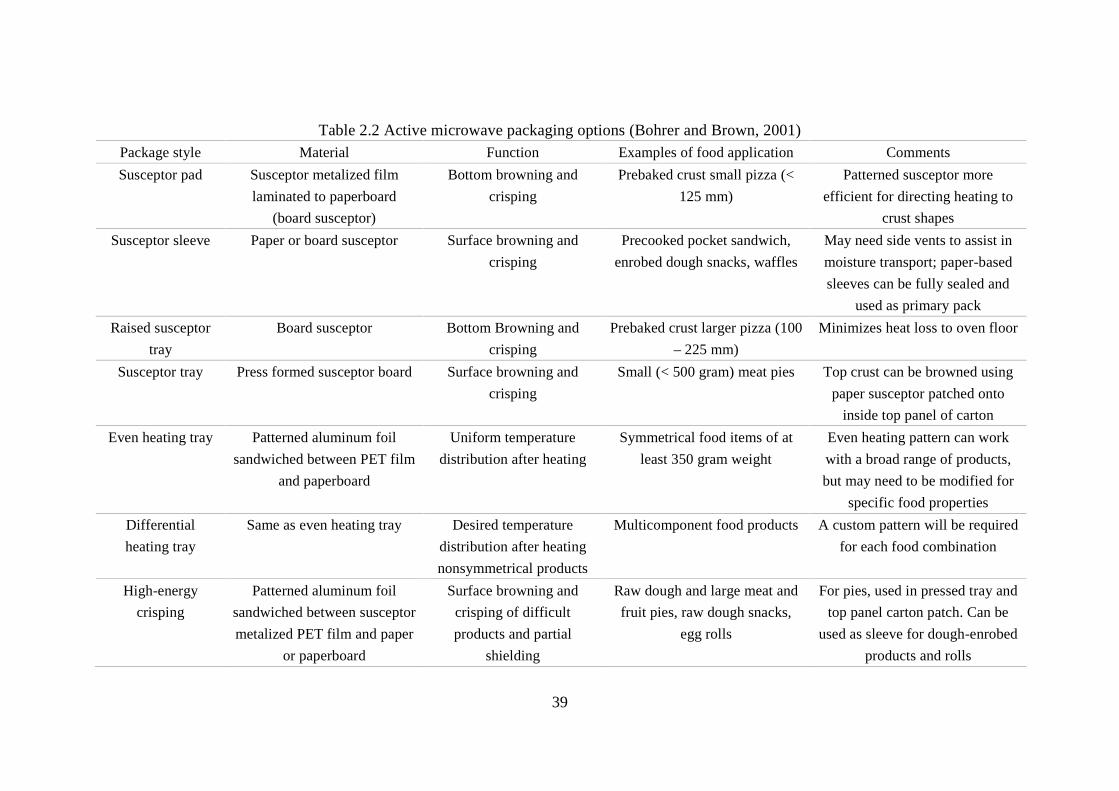
of mobile compounds from the susceptor to the food. Bohrer and Brown (2001)
summarized the commonly used active microwave packages (Table 2.2).
2.6 Microwavable instant meal
With the widespread use of microwave ovens, microwave instant meals have become
more and more popular in recent decades (Mejia and others, 2011). Microwaveable
meals are composed of raw and semi-cooked ingredients, which are frozen and packed
in a microwavable container. The meal can be conveniently cooked in minutes by a
microwave oven before serving. These products are developed by employing modified
38
Table 2.1 Passive microwave packaging options (Bohrer and Brown, 2001)Package style Material(s) Maximum service
temperature, °C
Oxygen
barrier
Moisture
barrier
Grease
resistance
Sealablility Comments
Tray, sleeve,
support board, or
overwrap
LDPE coated paper
or paperboard
95 Poor Fair Poor Good Light duty reheating only
Overwrap Heat sealable
oriented PET film
220 Poor Good Good Good Need venting during reheat,
barrier improved by coatings
Overwrap Heat sealable
oriented PP film
110 Fair Fair Good Good Need venting during reheat,
barrier improved by coatings
Tray PP coated
paperboard
125-135 Poor Fair Good Good Pressed or folded trays
Tray PET coated
paperboard
205 Poor Fair Good Good Pressed or folded trays
Thermoformed
tray
LDPE 75 Poor Good Fair Fair Light duty reheating only
Thermoformed
trays, clamshells
Polystyrene (PS) and
foamed PS
80 Good Fair Good Poor Light duty reheating only
Thermoformed
tray
PP 110 Poor Good Good Good Brittleness an issue at freezer
temperatures
Thermoformed
tray
CPET 220 Good Fair Good Fair Generally pigmented white or
black
39
Table 2.2 Active microwave packaging options (Bohrer and Brown, 2001)Package style Material Function Examples of food application Comments
Susceptor pad Susceptor metalized film
laminated to paperboard
(board susceptor)
Bottom browning and
crisping
Prebaked crust small pizza (<
125 mm)
Patterned susceptor more
efficient for directing heating to
crust shapes
Susceptor sleeve Paper or board susceptor Surface browning and
crisping
Precooked pocket sandwich,
enrobed dough snacks, waffles
May need side vents to assist in
moisture transport; paper-based
sleeves can be fully sealed and
used as primary pack
Raised susceptor
tray
Board susceptor Bottom Browning and
crisping
Prebaked crust larger pizza (100
– 225 mm)
Minimizes heat loss to oven floor
Susceptor tray Press formed susceptor board Surface browning and
crisping
Small (< 500 gram) meat pies Top crust can be browned using
paper susceptor patched onto
inside top panel of carton
Even heating tray Patterned aluminum foil
sandwiched between PET film
and paperboard
Uniform temperature
distribution after heating
Symmetrical food items of at
least 350 gram weight
Even heating pattern can work
with a broad range of products,
but may need to be modified for
specific food properties
Differential
heating tray
Same as even heating tray Desired temperature
distribution after heating
nonsymmetrical products
Multicomponent food products A custom pattern will be required
for each food combination
High-energy
crisping
Patterned aluminum foil
sandwiched between susceptor
metalized PET film and paper
or paperboard
Surface browning and
crisping of difficult
products and partial
shielding
Raw dough and large meat and
fruit pies, raw dough snacks,
egg rolls
For pies, used in pressed tray and
top panel carton patch. Can be
used as sleeve for dough-enrobed
products and rolls
40
atmosphere packaging to extend shelf life, and steam-venting technology to provide
better final product quality.
2.6 Microwavable instant meal
With the widespread use of microwave ovens, microwave instant meals have
become more and more popular in recent decades (Mejia and others, 2011).
Microwaveable meals are composed of raw and semi-cooked ingredients, which are
frozen and packed in a microwavable container. The meal can be conveniently cooked
in minutes by a microwave oven before serving. These products are developed by
employing modified atmosphere packaging to extend shelf life, and steam-venting
technology to provide better final product quality.
2.6.1 Modified atmosphere packaging
Modified atmosphere packaging (MAP) is any package that contains a gas
composition deviant from atmospheric air. The modified atmosphere creates a
controllable environment to inhibit the spoilage organisms or pathogens for extending
the shelf life of food. Normally modified atmosphere is achieved by varying the
amounts of oxygen, carbon dioxide, and nitrogen in the package (Yam and Lai, 2006).
Most of the time a known concentration of gas mixtures is added to a high barrier plastic
film in order to achieve a preservation effect. Another way to manipulate the
atmosphere of a package is to employ the use of different types of plastics for
packaging. After closing the packaging, the headspace composition may change during
storage, since there is no additional manipulation of the internal environment. This is
the critical difference when compared to controlled atmosphere (CA) systems, where
continuous monitoring of the environment is necessary to maintain a stable gas
atmosphere and other conditions (Del Nobile and others, 2012). MAP offers protection
41
to the product against deteriorative effects for food, including color change, off-flavor
and off-odor development, nutrient loss, and texture change. However, the predominant
concern is bacterial growth, which is most often the leading factor of shelf life.
The optimum MAP condition depends on different aspects, including product
characteristics, respiring surface area, storage conditions, and package barrier
properties (Rodriguez-Aguilera and others, 2011, 2009). Furthermore, different gas
selections need to be used when working with respiring or non-respiring foods. Carbon
dioxide is the predominant gas in the headspace composition in non-respiring food for
antimicrobial purposes (Arvanitoyannis and others, 2012). Addition of nitrogen is
commonly practiced to avoid package collapse due to the high solubility of carbon
dioxide (Conte and others, 2013). Pure nitrogen is usually employed in food with low
water activity and relatively high lipid content, in order to prevent the lipid oxidation.
However, enzymatic and chemical reactions can still occur and results in deterioration
in these products when the microbial spoilage is inhibited (Klensporf-Pawlik and
others, 2009). Since the respiration of food will significantly affect the gas composition
in the head space, the MAP for respiring food is complex. The applications of the usage
of MAP in respiring foods are to develop the desired headspace associated with the
product’s respiration (passive MAP) (Costa and others, 2011; Kudachikar and others,
2011). Under passive MAP conditions, the respiration of the product and the gas
permeability of the film are the two factors that influence the change in gas composition
of the headspace in the product (Conte and others, 2013).
Conte and others (2013) concluded the advantages and disadvantages for
consumers. The main advantages include increased shelf life allowing less frequent
42
loading of retail display shelves; hygienic stackable pack, sealed and free from product
drip and odor; reduction in production and storage costs due to better utilization of
labor, space and equipment; increased distribution area and reduced transport costs due
to less frequent deliveries; and little or no need of chemical preservatives. The
disadvantages include capital cost of the packaging machine; cost of gases and
packaging materials; cost of quality control equipment; increase of pack volume which
will adversely affect transport costs and retail display space; and loss of the benefits of
MAP once the pack is opened or leaks.
2.6.2 Applications of MAP on frozen seafood
Due to the higher moisture content and free amino acid content along with a lower
amount of connective tissue, seafood has a more rapid spoilage rate compared to other
foods; and spoilage in fish and shellfish depends on species and chemical components
(Masniyom, 2011). MAP are widely used to extend shelf life of seafood products during
refrigerated storage. There is significant extension of shelf life observed by employing
MAP in seafood products. By employing CO2 or the mixtures of oxygen, carbon dioxide,
and nitrogen in headspace, the shelf life of seafood can be doubled or tripled (Hudecova
and others, 2010; Lauzon and others, 2009; Hansen and others, 2009; Provincial and
others, 2013; Yilmaz and others, 2009; Kamadia and others, 2013; Qian and others,
2013; Arvanitoyannis and others, 2011; Ulusoy and others, 2011).
The combination of MAP and freezing can provide conveniently packaged
seafood products with longer shelf life and better quality (Bak and others, 1999; Bono
and others, 2012). Bak and others (1999) reported overall better quality in relation to
color stability, lipid oxidation and shrimp meat toughening was achieved in boiled
43
shrimp packed in a nitrogen atmosphere and stored at -17ºC for 12 months. In MAP
package, the effects of photooxidation in astaxanthin (red color in shrimp) and lipid
oxidation were minimized. The exclusion of oxygen in the package helped eliminate
chemical reactions for degradation of astaxanthin and fatty acid oxidation by
photooxidation, which extended the shelf life by 50%. Combined MAP and freezing on
deep-water rose shrimp (Parapenaeus longirostris) can completely inhibit lipid
oxidation during storage and maintain natural color for up to six months (Bono and
others, 2012).
2.6.3 Steam-venting technology
Steam meals are composed of raw and semi-cooked ingredients, and packed in a
sealed plastic container in a gas mixture. Consumers cook the meals by microwave oven
easily before consumption.
The main concern of steam meals is the content of raw and semi-cooked
ingredient may cause food borne illness due to the cold spots caused by non-uniform
temperature distribution during microwave heating (Ryynanen and others, 1996;
Vadivambal and others, 2010; MacDougall and others, 2004; Smith and others, 2008).
For consumers, microwave heating is the only protective step against pathogenic
microorganisms in raw or semi-cooked ingredients, so microwave heating has a
significant effect on food safety.
Self-venting technology uses specially designed package materials and
containers in microwave heating for building up vapor pressure in the container until
the self-venting happens. This technology utilizes the pressurized steam to cook inside
sealed plastic pouches or containers, which have a self-venting release adaptation
44
(Mast, 2000). The most common types of self-venting packages are pouches, flow
packs and lidded trays (Fowle and others, 2005).
During microwave cooking, the rapid heat generation can turn the water in food
into steam quickly. Vapor pressure is accumulated in the package resulting in reduced
cooking time and evenly distributed heat. The package distends with the increase of the
internal pressure and provides a visual indication that cooking is occurring while
maintaining a temperature between 100ºC to about 105ºC (Mast, 2000). The general
description of microwave cooking using steam-venting technology is shown in Figure
2.5 (Espinoza-Rodezno; 2013).
The functional ability of the system relies on one (or a combination of) partial or
complete de-lamination, rupturing, peeling or a strategically placed hole or series of
holes (Fowle and others, 2005). In each case there is a build-up of pressure inside the
pack to start the process. Steam-venting occurs as the laminating adhesive dissolves
when exposed to steam, preventing the pack from bursting while maintaining a constant
pressure during cooking (Espinoza-Rodezno, 2013). This mechanism can be
incorporated into roll-stock, lidding or pre-made pouches.
2.6.4 Product development of microwavable oyster meat-based meals
Food product development for the microwave oven is quite different from that
for a conventional oven. Some characteristic features of microwave heating are unique,
such as heating characteristics of food ingredients and food composites, volume and
geometry of food, rapid rate of heating, and the electric field distribution on differential
temperature profile within the food load. The composition of foods, in terms of
microwave reactive and interactive components, limits the highest possible temperature
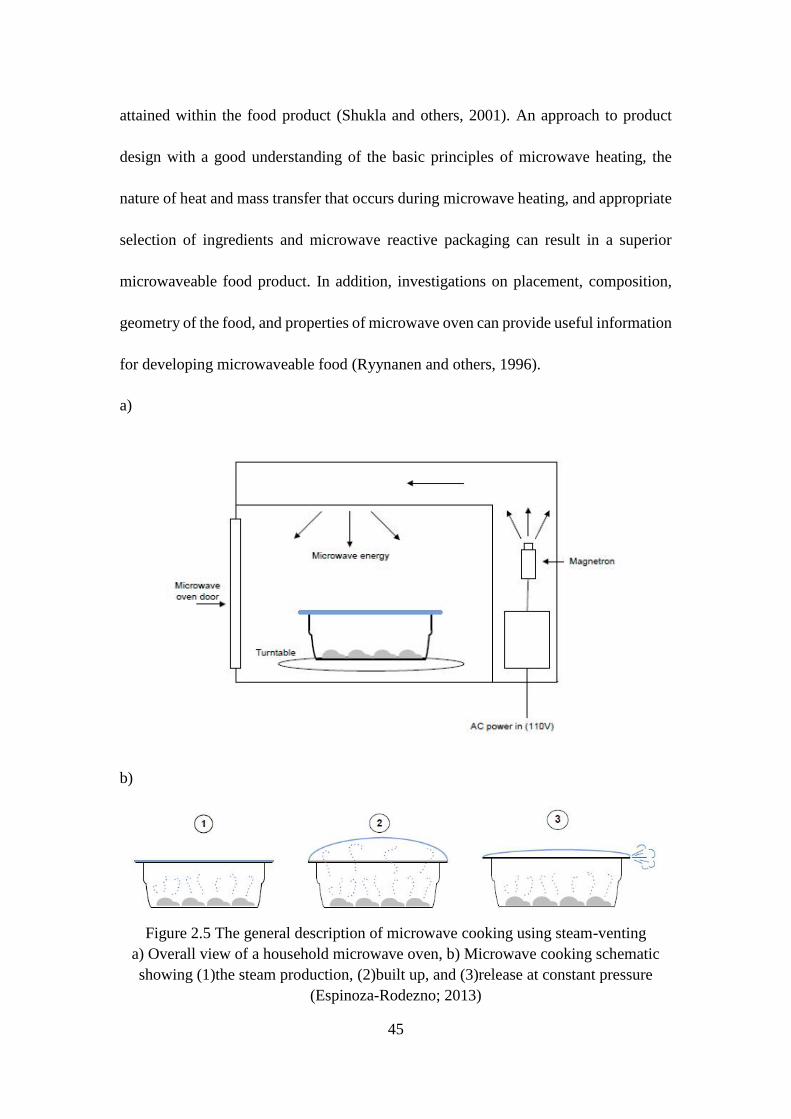
45
attained within the food product (Shukla and others, 2001). An approach to product
design with a good understanding of the basic principles of microwave heating, the
nature of heat and mass transfer that occurs during microwave heating, and appropriate
selection of ingredients and microwave reactive packaging can result in a superior
microwaveable food product. In addition, investigations on placement, composition,
geometry of the food, and properties of microwave oven can provide useful information
for developing microwaveable food (Ryynanen and others, 1996).
a)
b)
Figure 2.5 The general description of microwave cooking using steam-ventinga) Overall view of a household microwave oven, b) Microwave cooking schematicshowing (1)the steam production, (2)built up, and (3)release at constant pressure
(Espinoza-Rodezno; 2013)
46
Combining microwave cooking and steam venting technology can provide a
wonderful meal with better final product quality and less the health threat. During
microwave cooking using steam-venting technology, the temperature is maintained
between 100ºC and 105ºC throughout the entire cooking period (Mast, 2000). This can
be considered to be enough to produce a safe product based on section 3-401.12 of the
2009 edition of the FDA Food Code which requires that raw animal foods, including
seafood, heated via microwave energy must attain an internal temperature of at least
73.8ºC (165ºF) (USFDA, 2009).
Be employing steam-venting technology in microwave heating, a convenient
microwavable oyster meat-based meal has been developed in the Food Engineering
Laboratory, LSU (Espinoza-Rodezno, 2013). However, the information for microwave
heating of this meal is insufficient. Uneven temperature distribution occurred during
the heating process, and caused quality change and potential health risks. Therefore,
development of a mathematical model to describe the heating behavior is necessary for
further improvement of the meal.
References
Andrews, L. S., DeBlanc, S., Veal, C. D., & Park, D. L. (2003). Response of Vibrioparahaemolyticus 03 : K6 to a hot water/cold shock pasteurization process. FoodAdditives and Contaminants, 20(4), 331-334.
Andrews, L. S., Park, D. L., & Chen, Y. P. (2000). Low temperature pasteurizationto reduce the risk of vibrio infections from raw shell-stock oysters. FoodAdditives & Contaminants, 17(9), 787-791. doi:10.1080/026520300415336
47
Arballo, J. R., Campañone, L. A., & Mascheroni, R. H. (2012). Modeling ofMicrowave Drying of Fruits. Part II: Effect of Osmotic Pretreatment on theMicrowave Dehydration Process. Drying Technology, 30(4), 404-415.doi:10.1080/07373937.2011.645100
Arvanitoyannis, I. S., & Stratakos, A. C. (2012). Application of modified atmospherepackaging and active/smart technologies to red meat and poultry: A review. Foodand Bioprocess Technology, 5(5), 1423-1446.
Arvanitoyannis, I. S., Vasiliki, K., Bouletis, A. D., & Papaloucas, C. (2011). Studyof changes in physicochemical and microbiological characteristics of shrimps(Melicertus kerathurus) stored under modified atmosphere packaging.Anaerobe, 17(6), 292-294.
Ashrae. 1977. Handbook and Product Directory: Applications. American Society ofHeating, New York: Refrigerating and Air-conditioning Engineers.
Ayappa, K. G. (1997). Modeling transport processes during microwave heating: Areview. Rev. Chem. Eng. 13(21), 1-68.
Bak, L. S., Andersen, A. B., Andersen, E. M., & Bertelsen, G. (1999). Effect ofmodified atmosphere packaging on oxidative changes in frozen stored coldwater shrimp (Pandalus borealis. Journal of Food Chemistry, 64(2), 169-175.
Barringer, S. A., Davis, E. A., Gordon J., Ayppa K.G., Davis H. T.. (1995).Microwave-heating temperature profiles for thin slabs compared to Maxwell andLambert law predictions. J Food Sci 60(5):1137-1142.
Basak, T., & Kumaran, S. S. (2005). A generalized analysis on material invariantcharacteristics for microwave heating of slabs. Chemical Engineering Science,60(20), 5480-5498. doi:10.1016/j.ces.2005.04.072
Berlin, D.L., Herson, D.S., Hicks, D.T., Hoover, D.G. (1999). Response ofpathogenic Vibrio species to high hydro- static pressure. Appl EnvironMicrobiol 65(6):2776-2780.
Bih, J. Z. (2003) The microwave technology. Microwave and TelecommunicationTechnology, 2003. CriMiCo 2003. 13th International Crimean Conference, (pp.15-21).
Black, E. P., Cascarino, J. J., Guan, D. D., Kniel, K. E., Hicks, D. T., Pivarnik, L. F.,& Hoover, D. G. (2010). Coliphage as pressure surrogates for enteric viruses infoods. Innovative Food Science & Emerging Technologies, 11(2), 239-244.doi:10.1016/j.ifset.2009.07.004
48
Bloomfield, L. (2013). Microwave ovens. In How things work: the physics ofeveryday life 5th ed., pp. 405-414: Wiley.
Bohrer, T. H. & Brown, R. K. (2001). Packaging Techniques for MicrowaveableFoods. In Ashim K. Datta and Ramaswamy C. Anantheswaran (Ed.), Handbookof Microwave Technology for Food Application). New York: Marcel Dekker,Inc.
Bono, G., Badalucco, C. V., Cusumano, S., & Palmegiano, G. B. (2012). Towardshrimp without chemical additives: A combined freezing-MAP approach. Lwt-Food Science and Technology, 46(1), 274-279.
Budd, C. J. and A. D. C. Hill (2011). "A comparison of models and methods forsimulating the microwave heating of moist foodstuffs." International Journal ofHeat and Mass Transfer 54(4): 807-817.
Bryan, P. J., Steffan, R. J., DePaola, A., Foster, J. W., & Bej, A. K. (1999). Adaptiveresponse to cold temperatures in Vibrio vulnificus. Current Microbiology, 38(3),168-175.
Campañone, L. A., Paola, C. A., & Mascheroni, R. H. (2012). Modeling andsimulation of microwave heating of foods under different process schedules.Food and Bioprocess Technology, 5(2), 738-749. doi:10.1007/s11947-010-0378-5
Centers for Disease Control and Prevention (CDC). (2009). Vibrio vulnificus HealthEducation Kit. Retrieved September 20, 2013, fromhttp://www.fda.gov/Food/ResourcesForYou/HealthEducators/ucm085365.htm
Centers for Disease Control and Prevention (CDC). (2009). COVIS AnnualSummary. Atlanta, Georgia: US Department of Health and Human Services,CDC, 2011.
Cerón-Camacho, R., Aburto, J. A., Montiel, L. E., & Martínez-Palou, R. (2013).Microwave-assisted organic synthesis versus conventional heating. Acomparative study for Fisher glycosidation of monosaccharides. ComptesRendus Chimie, 16(5), 427-432. doi:10.1016/j.crci.2012.12.011
Chamchong, M., & Datta, A. K. (1999). Thawing of foods in a microwave oven: I.Effect of power levels and power cycling. Journal of Microwave Power andElectromagnetic Energy, 34(1), 8-21.
Chandrasekaran, S., Raanathan, S., Basak, Tanmay. (2013). Microwave foodprocessing—A review. Food Research International, 52(1), 243-261.
49
Chen, H. H., Tang, J. J., & Liu, F. F. (2008). Simulation model for moving foodpackages in microwave heating processes using conformal FDTD method.Journal of Food Engineering, 88(3), 294-305.doi:10.1016/j.jfoodeng.2008.02.020
Chen, S.-Y., Jane, W.-N., Chen, Y.-S., & Wong, H.-c. (2009). Morphological changesof Vibrio parahaemolyticus under cold and starvation stresses. InternationalJournal of Food Microbiology, 129(2), 157-165.
Chien-Han, T., Chun-Chieh, C., Shih-Jei, T., Chi-Rong, L., Wai-Nang, C., Khee-Siang, C., & ... Bell, W. R. (2013). Seasonality, clinical types and prognosticfactors of Vibrio vulnificus infection. Journal Of Infection In DevelopingCountries, 7(7), 533-540. doi:10.3855/jidc.3008
Chen, Y.P., Park, D.L., Andrews, L.S., Grodner, R.M. (1996). Reduction of Vibriovulnificus in Gulf Coast oysters by mild heat treatment [abstract]. In: IFT AnnualMeeting Book of Abstracts; 1996 June 22-26; New Orleans, La. Chicago, III. :Institute of Food Technologist. p.134.
CINQUANTA, L. L., ALBANESE, D. D., CUCCURULLO, G. G., & DIMATTEO,M. M. (2010). Effect on Orange Juice of Batch Pasteurization in an ImprovedPilot-Scale Microwave Oven. Journal Of Food Science, 75(1), E46-E50.doi:10.1111/j.1750-3841.2009.01412.x
Cong, H., et al. (2012). "Dielectric properties of sea cucumbers (Stichopus japonicus)and model foods at 915;MHz." Journal of Food Engineering 109(3): 635-639.
Conte, A., Angiolillo, L., Mastromatteo, M., & Del Nobile, M. A. (2013).Technological options of packaging to control food quality. In Muzzalupo, I.(Ed), Food Industry. Chapter 6:355-378.
Corcoran, L. (1998). Raw Oysters: Deadly Delicacy. Nutrition Action Health Letter,October 7–8.
Costa, C., Lucera, A., Conte, A., Mastromatteo, M., Speranza, B., Antonacci, A., &Del Nobile, M. (2011). Effects of passive and active modified atmospherepackaging conditions on ready-to-eat table grape. Journal of Food Engineering,102(2), 115-121.
Datta, A. K., & Davidson, P. M. (2000). Microwave and radio frequency processing.Journal of Food Science, 65(s8), 32-41.
50
Dehghan, A., Jamalian, J., Farahnaky, A., Mesbahi, G., & Moosavi-Nasab, M. (2012).The Effect of Microwave Pasteurization on Some Physical and ChemicalCharacteristics of Milk. International Journal Of Food Engineering, 8(1), 1-12.doi:10.1515/1556-3758.2423
Del Nobile, M., Conte, A., Mastromatteo, M., & Mastromatteo, M. (2012). Modifiedatmosphere packaging. In Decontamination of Fresh and Minimally ProcessedProduce, (pp. 453-467). Hoboken, NJ, USA: Wiley-Blackwell.
Dev, S. S., Gariépy, Y., Orsat, V., & Raghavan, G. (2012). Finite element modelingfor optimization of microwave heating of in-shell eggs and experimentalvalidation. International Journal Of Numerical Modeling, 25(3), 275-287.doi:10.1002/jnm.831
Dibben, D. (2001). Electromagnetics: Fundamental. Aspects and NumericalModeling. In Ashim K. Datta and Ramaswamy C. Anantheswaran (Ed.),Handbook of Microwave Technology for Food Application. New York: MarcelDekker, Inc.
Dibben, D. C., Metaxas, A. C. (1994). Finite-Element Time Domain Analysis ofMultimode Application Using Edge Elements. Journal of Microwave Power &Electromagnetic Energy. 29 (4), 242-51
Drake, S. L., Bang, W., Jaykus, L. A., Drak,e M.A., Green, D.P., Elhanafi, E. (2003).Evaluation of growth and survival characteristics of Vibrio vulnificus expressinggreen florescent protein [abstract]. In: IFT Annual Meeting Book of Abstracts;2003 July 13-16; Chicago, IL. Chicago, III.: Institute of Food Technologist.
Engelder DS, Buffler CR. 1991. Measuring dielectric properties of food products atmicrowave frequencies. Microwave World. 12(2):6-15.
Espinoza-Rodezno, L. A. (2013). DEVELOPMENT OF SAFE AND READY TOEAT FROZEN OYSTER PRODUCTS USING MICROWAVE STEAM-VENTING TECHNOLOGY (Doctoral dissertation). Louisiana StateUniversity, Baton Rouge, LA.
Fakhouri, M. O., & Ramaswamy, H. S. (1993). Temperature uniformity ofmicrowave heated foods as influenced by product type and composition. FoodResearch International, 26(2), 89-95.
Far, H., Saad, C. B., Daud, H., Kamarudin, M., & Ramezani-Fard, E. (2013).Isolation and Identification of Bacteria Micro Flora of White Shrimp,Litopenaeus vannamei, with Antagonistic Properties Against Vibrio Species.Asian Journal Of Animal & Veterinary Advances, 8(2), 293-300.
51
Fan, D., Li, C., Ma, W., Zhao, J., Zhang, H., & Chen, W. (2012). A study of the powerabsorption and temperature distribution during microwave reheating of instantrice. International Journal Of Food Science & Technology, 47(3), 640-647.doi:10.1111/j.1365-2621.2011.02888.x
FDA. (2009). National shellfish sanitation program guide for the control ofmolluscan shellfish 2009 revision. Retrieved September 25, 2013, fromhttp://www.fda.gov/downloads/Food/GuidanceRegulation/FederalStateFoodPrograms/UCM350004.pdf
Fiber optical thermometer. In Wikipedia. Retrieved September 20, 2013, fromhttp://en.wikipedia.org/wiki/Fiber_optical_thermometer
Fouladkhah, A., Geornaras, I., Nychas, G., & Sofos, J. N. (2013). AntilisterialProperties of Marinades during Refrigerated Storage and Microwave OvenReheating against Post-Cooking Inoculated Chicken Breast Meat. Journal OfFood Science, 78(2), M285-M289. doi:10.1111/1750-3841.12009
Fowle, J., & International, P. (2005). Developments in microwaveable packaging:Pira International.
Galema, S. A. (1997). Microwave chemistry. Chem. Soc. Rev., 26(3), 233-238.
Geedipalli, S. R., Rakesh, V. V., & Datta, A. K. (2007). Modeling the heatinguniformity contributed by a rotating turntable in microwave ovens. Journal ofFood Engineering, 82(3), 359-368. doi:10.1016/j.jfoodeng.2007.02.050
George, J., Muktoyuk, M., & Bergman, R. (2005). Enhancements to the FDTDmethod for steady-state power-deposition analysis in microwave-heatingcavities. Microwave & Optical Technology Letters, 47(6), 530-534.doi:10.1002/mop.2122
Grove, S. F., Forsyth, S., Wan, J., Coventry, J., Cole, M., Stewart, C. M., & ... Lee,A. (2008). Inactivation of hepatitis A virus, poliovirus and a norovirus surrogateby high pressure processing. Innovative Food Science & Emerging Technologies,9(2), 206-210. doi:10.1016/j.ifset.2007.07.006
GROVE, S. F., LEE, A., STEWART, C. M., & ROSS, T. (2009). Development of aHigh Pressure Processing Inactivation Model for Hepatitis A Virus. Journal OfFood Protection, 72(7), 1434-1442.
Guillard, V., Mauricio-Iglesias, M., & Gontard, N. (2010). Effect of novel foodprocessing methods on packaging: structure, composition, and migrationproperties. Critical Reviews in Food Science and Nutrition, 50(10), 969-988.
52
Gunasekaran, S., & Yang, H. (2007). Effect of experimental parameters ontemperature distribution during continuous and pulsed microwave heating.Journal of Food Engineering, 78(4), 1452–1456.doi:10.1016/j.jfoodeng.2006.01.017.
Gunasekaran, A., Jayas, D. S., & White, N. D. G. (2006). Non-uniformity of surfacetemperatures of grain after microwave treatment in an industrial microwavedryer. Drying Technology, 24(12), 1559–1567. doi:10.1080/07373930601030796.
Hansen, A. A., Morkore, T., Rudi, K., Rodbotten, M., Bjerke, F., & Eie, T. (2009).Quality changes of prerigor filleted atlantic salmon (Salmo salar L.) packagedin modified atmosphere using CO2 emitter, traditional MAP, and vacuum.Journal of Food Science, 74(6), M242-M249.
Harwood, V.J., Gandhi, J.P., Wright, A.C. (2004). Methods for isolation andconfirmation of Vibrio vulnificus from oysters and environmental sources: areview. J Microbiol Methods, 59, pp. 301–316
Hayat Mahmud, Z., et al. (2006). "Isolation and molecular characterization oftoxigenic Vibrio parahaemolyticus from the Kii Channel, Japan."Microbiological Research 161(1): 25-37.
He, H. H., Adams, R. M., Farkas, D. F., & Morrissey, M. T. (2002). Use of High-pressure Processing for Oyster Shucking and Shelf-life Extension. Journal OfFood Science, 67(2), 640-645. doi:10.1111/j.1365-2621.2002.tb10652.x
Horst, J., & Horst, G. (2011). The Louisiana seafood bible : oysters / Jerald andGlenda Horst: Gretna, La. : Pelican Pub. Co., 2011.
Hossan, M. R., et al. (2010). "Analysis of microwave heating for cylindrical shapedobjects." International Journal of Heat and Mass Transfer 53(23–24): 5129-5138.
Hu, X. (2004). Application of Alternative Technologies to Eliminate Vibrios spp. inRaw Oysters (Doctoral dissertation). Virginia Polytechnic Institute and StateUniversity. Blacksburg, VA.
Hu, X., & Mallikarjunan, P. (2005). Thermal and dielectric properties of shuckedoysters. LWT - Food Science & Technology, 38(5), 489-494.doi:10.1016/j.lwt.2004.07.016
Huang, L. and J. Sites (2007). "Automatic control of a microwave heating processfor in-package pasteurization of beef frankfurters." Journal of Food Engineering80(1): 226-233.
53
Hudecova, K., Buchtova, H., & Steinhauserova, I. (2010). The Effects of modifiedatmosphere packaging on the microbiological properties of fresh common carp(Cyprinus carpio L.). Acta Veterinaria Brno, 79, S93-S100.
Iwamoto, M., Ayers, T., Mahon, B. E., & Swerdlow, D. L. (2010). Epidemiology ofseafood-associated infections in the United States. Clinical microbiologyreviews, 23(2), 399-411.
Jakabi, M., Gelli, D. S., Torre, J. C., Rodas, M. A., Franco, B. D., Destro, M. T., &Landgrafi, M. (2003). Inactivation by ionizing radiation of Salmonellaenteritidis, Salmonella infantis, and Vibrio parahaemolyticus in oysters(Crassostrea brasiliana). Journal of Food Protection, 66(6), 1025-1029.
Johnston, M. D., & Brown, M. H. (2002). An investigation into the changedphysiological state of Vibrio bacteria as a survival mechanism in response tocold temperatures and studies on their sensitivity to heating and freezing. Journalof Applied Microbiology, 92(6), 1066-1077.
Kaspar, C. W., Tamplin, M. L. (1993). Effects of temperature and salinity on thesurvival of Vibrios vulnificus in seawater and shellfish. Appl. Environ. Microbiol.59:2425-2429.
Kamadia, V. V., Schilling, M. W., & Marshall, D. L. (2013). Cooking and packagingmethods affect consumer acceptability and shelf life of ready-to-eat gulf brownshrimp. Journal of Aquatic Food Product Technology, 22(2), 146-159.
Kingsley, D. H., & Chen, H. (2009). Influence of pH, salt, and temperature onpressure inactivation of hepatitis A virus. International Journal Of FoodMicrobiology, 130(1), 61-64. doi:10.1016/j.ijfoodmicro.2009.01.004
Kingsley, D. H., Holliman, D. R., Calci, K. R., Haiqiang, C., & Flick, G. J. (2007).Inactivation of a Norovirus by High-Pressure Processing. Applied &Environmental Microbiology, 73(2), 581-585. doi:10.1128/AEM.02117-06
Klensporf-Pawlik, D., & Jeleń, H. H. (2009). Nitrogen atmosphere and naturalantioxidants effect on muesli oxidation during long-time storage. Acta Sci. Pol.,Technol. Aliment, 8(1), 5-15.
Knoerzer, K., et al. (2009). Simultaneous microwave heating and three-dimensionalMRI temperature mapping. Innovative Food Science & Emerging Technologies10(4): 537-544.
54
Knoerzer, K., Regier, M., & Schubert, H. (2005). Measuring temperaturedistributions during microwave processing. In H. Schubert & M. Regier (Eds.),The microwave processing of foods. Cambridge: Woodhead Publishing Limited.
Kopyt, P. and M. Celuch. 2006. Towards a multiphysics simulation system formicrowave power phenomena. In Microwave Conference Proceedings, 2005.APMC 2005. Asia-Pacific Conference Proceedings, 4. IEEE.
Koskiniemi, C. B., Truong, V. D., McFeeters, R. F., & Simunovic, J. (2013). Effectsof Acid, Salt, and Soaking Time on the Dielectric Properties of AcidifiedVegetables. International Journal of Food Properties, 16(4), 917-927.
Kudachikar, V., Kulkarni, S., & Prakash, M. K. (2011). Effect of modifiedatmosphere packaging on quality and shelf life of ‘Robusta’ banana (Musa sp.)stored at low temperature. Journal of Food Science and Technology, 48(3), 319-324.
Larsen, A. M., Rikard, F. S., Walton, W. C., & Arias, C. R. (2013). Effectivereduction of Vibrio vulnificus in the Eastern oyster (Crassostrea virginica) usinghigh salinity depuration. Food Microbiology, 34(1), 118-122.
Lauzon, H. L., Magnusson, H., Sveinsdottir, K., Gudjonsdottir, M., & Martinsdottir,E. (2009). Effect of brining, modified atmosphere packaging, and superchillingon the shelf life of cod (Gadus morhua) loins. Journal of Food Science, 74(6),M258-M267.
Li, D., Tang, Q., Wang, J., Wang, Y., Zhao, Q., & Xue, C. (2009). Effects of high-pressure processing on murine norovirus-1 in oysters (Crassostrea gigas) in situ.Food Control, 20(11), 992-996. doi:10.1016/j.foodcont.2008.11.012
Lianou, A. and K. P. Koutsoumanis (2009). "Evaluation of the effect of defrostingpractices of ground beef on the heat tolerance of Listeria monocytogenes andSalmonella Enteritidis." Meat Science 82(4): 461-468.
Lin, C., Yu, R.-C., & Chou, C.-C. (2004). Susceptibility of Vibrio parahaemolyticusto various environmental stresses after cold shock treatment. InternationalJournal of Food Microbiology, 92(2), 207-215.
Lin, Y.E., Anantheswaran, R.C., Puri, V.M. (1995). Finite Element Analysis ofMicrowave Heating of Solid Foods. J of Food Eng 25(1):85-112.
Lim Mui, H., & Apun, K. (2013). Antimicrobial Susceptibilities of Vibrioparahaemolyticus Isolates from Tiger Shrimps (Penaeus monodon) Aquaculturein Kuching, Sarawak. Research Journal of Microbiology, 8(1), 55-62.
55
Liu, C., Lu, J., & Su, Y.-C. (2009). Effects of flash freezing, followed by frozenstorage, on reducing Vibrio parahaemolyticus in pacific raw oysters (Crassostreagigas). Journal of Food Protection®, 72(1), 174-177.
Liu, C. M., Q. Z. Wang and N. Sakai. 2005. Power and temperature distributionduring microwave thawing, simulated by using Maxwell's equations andLambert's law. International Journal of Food Science & Technology 40(1): 9-21.
Liu, P., Zhang, M., & Mujumdar, A. S. (2012). Comparison of three microwave-assisted drying methods on the physiochemical, nutritional and sensory qualitiesof re-structured purple-fleshed sweet potato granules. International Journal ofFood Science & Technology, 47(1), 141-147.
Liu, S., Fukuoka, M., & Sakai, N. (2013). A finite element model for simulatingtemperature distributions in rotating food during microwave heating. Journal OfFood Engineering, 115(1), 49-62. doi:10.1016/j.jfoodeng.2012.09.019
Louisiana Department of Wildlife and Fisheries. (2012). 2011 Oyster StockAssessment Report. Retrieved September 30, 2013, fromhttp://www.wlf.louisiana.gov/sites/default/files/pdf/page_fishing/32695-Oyster%20Program/2011_oyster_stock_assessment.pdf
Lyng, J., Zhang, L., & Brunton, N. (2005). A survey of the dielectric properties ofmeats and ingredients used in meat product manufacture. Meat Science, 69, 589-602.
Marcela, L., Teodor, L., Livia, B., Mircea, P., & Simina, C. (2013). Analysing theVariance of Heating/Drying Parameters in a Microwave Field for Oak Planks.Journal of Electrical & Electronics Engineering, 6(1), 55-58.
MacDougall, L., Fyfe, M., McIntyre, L., Paccagnella, A., Cordner, K., Kerr, A., &Aramini, J. (2004). Frozen chicken nuggets and strips-A newly identified riskfactor for Salmonella Heidelberg infection in British Columbia, Canada. Journalof Food Protection®, 67(6), 1111-1115.
Mahmoud, B. S. M. (2009). Reduction of Vibrio vulnificus in pure culture, half shelland whole shell oysters (Crassostrea virginica) by X-ray. International Journalof Food Microbiology, 130(2), 135-139.
Mahmoud, S. M., & Taha, R. H. (2013). Application of Microwaves for Silkworm,Bombyx mori L. Cocoon Drying. Australian Journal of Basic & AppliedSciences, 7(1), 494-497.
56
Mahmud, Z.H., Neogi, S.B., Kassu, A., Mai Huong, B.T., Jahid, I.K., Islam M.S.(2008). Occurrence, seasonality and genetic diversity of Vibrio vulnificus incoastal seaweeds and water along the Kii Channel, Japan. FEMS Microbiol Ecol,64, pp. 209–218.
Manickavasagan, A., Jayas, D. S., & White, N. D. G. (2006). Non-uniformity ofsurface temperatures of grain after microwave treatment in an industrialmicrowave dryer. Drying Technology, 24(12), 1559-1567.
Masniyom, P. (2011). Deterioration and shelf-life extension of fish and fisheryproducts by modified atmosphere packaging. Sonklanakarin Journal of Scienceand Technology, 33(2), 181.
Mast, R. L. (2000) Microwave retaining package for microwave cooking.). UnitedStates of America: Patent No. 6054698.
Mejia, Z. S., Beumer, R. R., & Zwietering, M. H. (2011). Risk evaluation andmanagement to reaching a suggested FSO in a steam meal. Food Microbiology,28(4), 631-638.
Mestey, D., & Rodrick, G. (2003). A Comparison of cryogenic freezing techniquesand their usefulness in reduction of Vibrio vulnificus in retail oysters. MolluscanShellfish Safety. Santiago de Compostela, Spain: Consellería de Pesca e AsuntosMarítimos da Xunta de Galicia and Intergovernmental OceanographicCommission of UNESCO. p, 467-474.
Metaxas R. 1996. Foundations of electro-heat: a unified approach. Chichester UK:John Wiley & Sons.
Min, Z., Hao, J., & Rui-Xin, L. (2010). Recent Developments in Microwave-AssistedDrying of Vegetables, Fruits, and Aquatic Products-Drying Kinetics and QualityConsiderations. Drying Technology, 28(11), 1307-1316.doi:10.1080/07373937.2010.524591
Mochizuki, D., & Wada, Y. (2011). Measurements of Accurate Temperatures in theMicrowave Reactors. Mini-Reviews in Organic Chemistry, 8(3), 294-298.
Muntada-Garriga, J. M., Rodriguezjerez, J. J., Lopezsabater, E. I., & Moraventura,M. T. (1995). Effect of chill and freezing temperatures on survival of VibrioParahaemolyticus inoculated in homogenates of oyster meat. Letters in AppliedMicrobiology, 20(4), 225-227.
57
Murchie, L. W., et al. (2005). "High pressure processing of shellfish: A review ofmicrobiological and other quality aspects." Innovative Food Science &Emerging Technologies 6(3): 257-270.
Muth, M. K., Anderson, D. W., Karns, S. A. & Domanico, J. L. (2000) Economicimpact of requiring post-harvest treatment of oysters. vol. RTI Project (No.7466.000): Research Triangle Institute.
Nair, G., Li, Z., Gariepy, Y., & Raghavan, V. (2011). Microwave Drying of Corn (Zeamays L. ssp.) for the Seed Industry. Drying Technology, 29(11), 1291-1296.doi:10.1080/07373937.2011.591715
Nation Institute of Allergy and Infectious Diseases. (2012). Foodborne Diseases.Retrieved September 23, 2013, fromhttp://www.niaid.nih.gov/topics/foodborne/Pages/Default.aspx
National Marine Fisheries Service, N.O.A.A. Commercial Fisheries: AnnualCommercial Landing Stastistics, 2013. Retrieved September 20, 2013, fromhttp://www.st.nmfs.noaa.gov/commercial-fisheries/commercial-landings/annual-landings/index.
Nelson SO. 1999. Dielectric properties measurement techniques and applications.Trans. ASAE. 42(2):523-529.
Nelson S, Bartley PG. 2001. Frequency and temperature dependence of the dielectricproperties of some food materials. In: 2001 ASAE Annual International Meeting;2001 July 30-August 1, Sacramento, California; Paper number 01-6144.
Nott, K. P., & Hall, L. D. (2005). Validation and cross-comparison of MRItemperature mapping against fibre optic thermometry for microwave heating offoods. International Journal Of Food Science & Technology, 40(7), 723-730.
Oliver, J. D. (2005). The viable but nonculturable state in bacteria. J Microbiol, 43(1),93-100.
Oliver, J. D. (2005) Wound infections caused by Vibrio vulnificus and other marinebacteria. Epidemiol Infect 133: 383-391.
Oliveira, M. C., & Franca, A. S. (2002). Microwave heating of foodstuffs. JournalOf Food Engineering, 53(4), 347.
Oliveira, D. B., & Silva, E. J. (2010). Hybrid Analytical-FEM Method forMicrowave Heating Analysis in a Single Mode Cavity. IEEE Transactions OnMagnetics, 48(8), 2767-2770. doi:10.1109/TMAG.2010.2044152
58
Ortega, Y. R., & Jyeyin, L. (2006). Microwave Inactivation of Cyclosporacayetanensis Sporulation and Viability of Cryptosporidium parvum Oocysts.Journal Of Food Protection, 69(8), 1957-1960.
Padua, GW. (1993). Microwave heating of agar gels containing sucrose. J Food Sci58(60):1426-1428.
Painter, John A., R. M. H., Tracy Ayers, Robert V. Tauxe, Christopher R.Braden,Frederick J. Angulo, and Patricia M. Griffin. (2013). Attribution offoodborne illnesses, hospitalizations, and deaths to food commodities by usingoutbreak data, United States, 1998–2008. Emerging Infectious Diseases.www.cdc.gov/eid, 19(3), 407-415.
Pandit, R. B., & Prasad, S. (2003). Finite element analysis of microwave heating ofpotato––transient temperature profiles. Journal Of Food Engineering, 60(2), 193.doi:10.1016/S0260-8774(03)00040-2
Parker, R. W., Maurer, E. M., Childers, A. B., & Lewis, D. H. (1994). Effect of frozenstorage and vacuum-packaging on survival of Vibrio vulnificus in gulf coastoysters (crassostrea virginica). Journal of Food Protection, 57(7), 604-606.
Parveen, S., et al. (2008). "Seasonal distribution of total and pathogenic Vibrioparahaemolyticus in Chesapeake Bay oysters and waters." International Journalof Food Microbiology 128(2): 354-361.
Phuvasate, S., et al. (2012). "Reductions of Vibrio parahaemolyticus in Pacificoysters (Crassostrea gigas) by depuration at various temperatures." FoodMicrobiology 31(1): 51-56.
Phuvasate, S. and Y.-C. Su (2013). "Impact of water salinity and types of oysters ondepuration for reducing Vibrio parahaemolyticus in Pacific oysters (Crassostreagigas)." Food Control 32(2): 569-573.
Pitchai, K., et al. (2012). "Coupled electromagnetic and heat transfer model formicrowave heating in domestic ovens." Journal of Food Engineering 112(1–2):100-111.
Pleşu, R., Teodoriu, G., & Ţăranu, G. (2012). Infrared Thermography Applicationsfor Building Investigation. Bulletin of The Polytechnic Institute of Iasi -Construction & Architecture Section, 62(1), 157-168.
Powell, A., Baker-Austin, C., Wagley, S., Bayley, A., & Hartnell, R. (2013). Isolationof Pandemic Vibrio parahaemolyticus from UK Water and Shellfish Produce.Microbial Ecology, 65(4), 924-927. doi:10.1007/s00248-013-0201-8
59
Prapaiwong, N., Wallace, R. K., Arias., C. R. (2009). Bacterial loads and microbialcomposition in high pressure treated oysters during storage. InternationalJournal of Food Microbiology 131, 145–150.
Provincial, L., Guillen, E., Gil, M., Alonso, V., Roncales, P., & Beltran, J. A. (2013).Survival of Listeria monocytogenes and Salmonella Enteritidis in sea bream(Sparus aurata) fillets packaged under enriched CO2 modified atmospheres.International Journal of Food Microbiology, 162(3), 213-219.
Qian, Y.-F., Xie, J., Yang, S.-P., & Wu, W.-H. (2013). Study of the quality changesand myofibrillar proteins of white shrimp (Litopenaeus vannamei) undermodified atmosphere packaging with varying CO2 levels. European FoodResearch and Technology, 236(4), 629-635.
Rahman MS, Potluri RL. 1991. Thermal conductivity of fresh and dried squid meatby line source thermal conductivity probe. J Food Sci. 56(2):582-583.
Ralston, E. P., Kite-Powell, H., & Beet, A. (2011). An estimate of the cost of acutehealth effects from food-and water-borne marine pathogens and toxins in theUSA. Journal of Water & Health, 9(4), 680-694. doi:10.2166/wh.2011.157
Randa, M.A., Polz, M.F., Lim E. (2004). Effects of temperature and salinity on Vibriovulnificus population dynamics as assessed by quantitative PCR Appl EnvironMicrobiol, 70, pp. 5469–5476
Rattanadecho, P. (2006). "The simulation of microwave heating of wood using arectangular wave guide: Influence of frequency and sample size." ChemicalEngineering Science 61(14): 4798-4811.
Risch, S. J. (2009). Food packaging history and innovations. Journal of agriculturaland food chemistry, 57(18), 8089-8092.
RISMAN, P.O., OHLSSON, T. and LINGNERT, H. (1993). Model substances andtheir use inmicrowave heating studies, SIK Report, 588, 1-10.
Risman, P. O., Ohlsson, T., & Wass, B. (1987). Principles and models of power-density distribution in microwave-oven loads. Journal of Microwave Power andElectromagnetic Energy, 22(4), 193-198.
Rodriguez-Aguilera, R., Oliveira, J. C., Montanez, J. C., & Mahajan, P. V. (2011).Effect of modified atmosphere packaging on quality factors and shelf-life ofmould surface-ripened cheese: Part II varying storage temperature. LWT - FoodScience and Technology, 44(1), 337-342.
60
Rodriguez-Aguilera, R., Oliveira, J. C., Montanez, J. C., & Mahajan, P. V. (2009).Mathematical modeling of the effect of gas composition and storage temperatureon the gas exchange rate of soft cheese. Journal of Food Engineering, 95(1), 82-89.
RODRÍGUEZ-MARVAL, M., GEORNARAS, I., KENDALL, P. A., SCANGA, J.A., BELK, K. E., & SOFOS, J. N. (2009). Microwave Oven Heating forInactivation of Listeria Monocytogenes on Frankfurters before Consumption.Journal Of Food Science, 74(8), M453-M460.
Romano, V., Marra, F., & Tammaro, U. (2005). Modeling of microwave heating offoodstuff: study on the influence of sample dimensions with a FEM approach.Journal of Food Engineering, 71(3), 233-241.
Ryynanen, S., T. Ohlsson. (1996). Microwave heating uniformity of ready meals asaffected by placement, composition, and geometry. Journal of Food Science, 61(3) (1996), pp. 620–624
Safeena, S. A., & Patil, V. S. (2013). Effect of Hot Air Oven and Microwave OvenDrying on Production of Quality Dry Flowers of Dutch Roses. Journal OfAgricultural Science (1916-9752), 5(4), 179-189. doi:10.5539/jas.v5n4p179
Sakai, N., et al. (2005). "A method for developing model food system in microwaveheating studies." Journal of Food Engineering 66(4): 525-531.
Salvi, D., et al. (2009). "Experimental study of the effect of dielectric and physicalproperties on temperature distribution in fluids during continuous flowmicrowave heating." Journal of Food Engineering 93(2): 149-157.
Salvi, D. D., Boldor, D. D., Aita, G. M., & Sabliov, C. M. (2011). COMSOLMultiphysics model for continuous flow microwave heating of liquids. Journalof Food Engineering, 104(3), 422-429. doi:10.1016/j.jfoodeng.2011.01.005
Scallan, E., Hoekstra, R. M., Angulo, F. J., Tauxe, R. V., Widdowson, M. A., Roy,S. L., Jones, J. L., & Griffin, P. M. (2011). Foodborne illness acquired in theUnited States--major pathogens. Emerging infectious diseases, 17(1), 7-15.
Scharff, R. L. (2012). Economic burden from health losses due to foodborne illnessin the United States. Journal of Food Protection®, 75(1), 123-131.
Schiffmann, R. F. 1992. Major problems in heating foods in microwave ovens.Microwave World, 13(1):21-23, 35.
61
Sheen, S., Huang, L., & Sommers, C. (2012). Survival of Listeria monocytogenes,Escherichia coli O157:H7, and Salmonella spp. on Catfish Fillets Exposed toMicrowave Heating in a Continuous Mode. Journal Of Food Science, 77(8),E209-E214. doi:10.1111/j.1750-3841.2012.02817.x
Shrivastava M, Datta AL. 1999. Determination of specific heat and thermalconductivity of mushrooms (Pleruotus floida). J Food Eng. 39:255-250.
Shigehisa, T., Ohmori,T. A., Saito, S., Taji, R. (1991). Hayashi. Effects of highpressure on the characteristics of pork slurries and inactivation ofmicroorganisms associated with meat and meat products. International Journalof Food Microbiology, 12, pp. 207–216
Shukla, T., & Anantheswaran, R. C. (2001). Ingredient Interactions and ProductDevelopment for Microwave Heating. In Ashim K. Datta and Ramaswamy C.Anantheswaran (Ed.), Handbook of Microwave Technology for FoodApplication). New York: Marcel Dekker, Inc.
Sidwell V, Foncannon PR, Moore NS, Bonnet JC. 1974. Composition of the edibleportion of raw (fresh or frozen) crustaceans, finfish and mollusks. Part I. Protein,fat, moisture, ash, carbohydrate, energy value and cholesterol. Mar. Fish. Rev.36(3):21-35.
Silaghi, M. A., & Rohde, U. L. (2009). About Some Applications of MicrowaveEnergy. Journal Of Electrical & Electronics Engineering, 2(1), 91-95.
Smith, K. E., Medus, C., Meyer, S. D., Boxrud, D. J., Leano, F., Hedberg, C. W.,Elfering, K., Braymen, C., Bender, J. B., & Danila, R. N. (2008). Outbreaks ofsalmonellosis in Minnesota (1998 through 2006) associated with frozen,microwaveable, breaded, stuffed chicken products. Journal of Food Protection,71(10), 2153-2160.
Songsaeng, S., Sophanodora, P., Kaewsrithong, J., & Ohshima, T. (2010). Qualitychanges in oyster (Crassostrea belcheri) during frozen storage as affected byfreezing and antioxidant. Food Chemistry, 123(2), 286-290.
Sosa-Morales, M. E., Valerio-Junco, L., Lopez-Malo, A., & Garcia, H. S. (2010).Dielectric properties of foods: Reported data in the 21st Century and theirpotential applications. Lwt-Food Science and Technology, 43(8), 1169-1179.
Thermocouple. In Wikipedia. Retrieved September 20, 2013, fromhttp://en.wikipedia.org/wiki/Thermocouples
62
Tong, C. H., & Lund, D. B. (1993). Microwave heating of baked dough products withsimultaneous heat and moisture transfer. Journal of Food Engineering, 19(4),319-339.
Torres, F., & Jecko, B. (1997). Complete FDTD analysis of microwave heatingprocesses in IEEE Transactions On Microwave Theory & Techniques, 45(1),108.
Ulusoy, S., & Ozden, O. (2011). Preservation of stuffed mussels at 4 degrees C inmodified atmosphere packaging. Journal of Aquatic Food Product Technology,20(3), 319-330.
USFDA. (2009) Food Code 2009. US Public Healt Service - Department of Healthand Human Services (Ed.)).
Vadivambal, R. R., Jayas, D. S. (2010). Non-uniform Temperature DistributionDuring Microwave Heating of Food Materials--A Review. Food & BioprocessTechnology, 3(2), 161-171. doi:10.1007/s11947-008-0136-0
Venkatesh,M.S., Raghavan, G. S. V. (2004).An overview of microwaveprocessingand dielectric properties of agri-food materials. BiosystemsEngineering, 88(1), 1-18.
Verboven, P., et al. (2003). Computation of airflow effects on heat and mass transferin a microwave oven. Journal of Food Engineering 59(2–3): 181-190.
Von Hippel, A. R., & Hippel, A. R. (1954). Dielectrics and waves. Artech House.
Vugia, D. J., Tabnak, F., Newton, A. E., Hernandez, M., & Griffin, P. M. (2013).Impact of 2003 State Regulation on Raw Oyster--associated Vibrio vulnificusIllnesses and Deaths, California, USA. Emerging Infectious Diseases, 19(8),1276-1280. doi:10.3201/eid1908.121861
Wang, Y., et al. (2009). "Using whey protein gel as a model food to study dielectricheating properties of salmon (Oncorhynchus gorbuscha) fillets." LWT - FoodScience and Technology 42(6): 1174-1178.
Wang, S., Tang, J., Johnson, J. A., Mitcham, E., Hansen, J. D., Hallman, G., et al.(2003). Dielectric properties of fruits and insect pests as related to radiofrequency and microwave treatments. Biosystems Engineering, 85(2), 201e-212.
Wang, J., Tang, J.,Wang, Y., & Swanson, B. (2009). Dielectric properties of eggwhites and whole eggs as influenced by thermal treatments. LWT e Food Scienceand Technology, 42, 1204-1212.
63
Wang, Y., Tang, J., Rasco, B., Kong, F., & Wang, S. (2008). Dielectric properties ofsalmon fillets as a function of temperature and composition. Journal of FoodEngineering, 87(2), 236-246.
Wong, H.C., Liu, S.H., Wang, T.K., Lee, C.L., Chiou, C.S., Liu, D.P., Nishibuchi, M,Lee, B.K. (2000). Characteristics of Vibrio parahaemolyticus O3:K6 from Asia.Appl. Environ. Microbiol. 66(9):3981-3986.
Workneh, T.S., Rariepy, V. and Gariepy, Y. (2011). Microwave Assisted Hot AirVentilation Drying of Tomato Slices. Paper presented at 2011 InternationalConference on Food Engineering and Biotechnology. IPCBEE vol.9. IACSITPress, Singapoore
Yam, K. L. & Lai, C. C. (2006). Microwavable Frozen Food or Meals. In Hui (Ed.),Handbook of Food Science, Technology and Engineering, Volume 3 (pp. 113-1– 113-9). Boca Raton, FL: CRC Press.
Yang, H. W. and S. Gunasekaran. (2001). Temperature Profiles in a CylindricalModel Food During Pulsed Microwave Heating. J Food Sci 66(7): 998-1004.
Yang, H. W. and S. Gunasekaran (2004). Comparison of temperature distribution inmodel food cylinders based on Maxwell's equations and Lambert's law duringpulsed microwave heating. Journal of Food Engineering 64(4): 445-453.
Yilmaz, M., Ceylan, Z. G., Kocaman, M., Kaya, M., & Yilmaz, H. (2009). The effectof vacuum amd modified atmosphere packaging on growth of Listeria inrainbow trout (oncorhynchus mykiss) fillets. Journal of Muscle Foods, 20(4),465-477.
Zhang, H., & Datta, A. K. (2001). Electromagnetics of microwave heating:magnitude and uniformity of energy absorption in an oven. In Ashim K. Dattaand Ramaswamy C. Anantheswaran (Ed.), Handbook of Microwave Technologyfor Food Application. New York: Marcel Dekker, Inc.
Zhang, W., et al. (2013). "Physical properties of egg whites and whole eggs relevantto microwave pasteurization." Journal of Food Engineering 118(1): 62-69.
Zhu, J. J., Kuznetsov, A. V., & Sandeep, K. P. (2007). Numerical Modeling of aMoving Particle in a Continuous Flow Subjected to Microwave Heating.Numerical Heat Transfer: Part A -- Applications, 52(5), 417-439.
64
CHAPTER 3 DEVELOPMENT OF THE MATHEMATICAL ANDCOMPUTER-BASED MODELS FOR MICROWAVE HEATING
3.1 Introduction
For conventional heating by convection and radiation, heat only diffuses in the
surface of the material at the beginning of heating, and then conducts into inside of the
material. Since conduction is a diffusion process, the highest temperature during
heating is always located on the surface. To avoid overheating, the temperature of the
heating source cannot exceed the desired final temperature , thus the overall heating
rate is restricted by the heating source. The diffusion process can also affect the heating
rate. Although the temperature distribution on surface can response to the heating
source quickly, the bulk temperature of the material is mainly limited by the coefficient
of thermal diffusivity , which is defined as= (3.1)
where , , and are the density, specific heat, and thermal conductivity of the
material, respectively (Wu, 2002). In conventional heating, it is easy to identify the
slowest heating location (Knoerzer and others, 2005). If the diffusion time is infinite,
the uniform final temperature can be achieved.
For microwave heating, the internal heat is generated by the interaction between
the material and electromagnetic field, so the maximum temperature is always inside
the material rather than on the surface if the microwave is the only heating source. As
a result, microwave heating will lead to non-uniform heating, which will cause
overheating (hot spots) and insufficient heating (cold spots) in food stuff (Ryynanen
and others, 1996). The hot spots can cause quality change or loss in food, including
65
color, texture, and flavor or odor. The more serious concern of the cold spots is the
incomplete kill of microorganisms, which may cause food borne illness.
As the critical factor for the final product, the temperature profile of a product is
important for microwave heating. Experimental measurement of temperature in the
microwave is limited due to interference of measuring devices with the electromagnetic
field (Salvi and others, 2011). So numerical methods have been used to understand and
optimize the process of microwave heating. In order to characterize temperature
distribution during food heating, coupled mass and energy balances must be solved
taking into account the absorption of electromagnetic energy.
The earliest efforts in modeling microwave heating were primarily analytical
(Shou-Zheng and Han-Kui, 1988; Watanabe and Ohkawa, 1978). However, with the
availability of extensive computing facilities, solution of Maxwell’s equations for
electromagnetics coupled with heat transfer in the oven cavity can be obtained using
different numerical methods. Maxwell’s equations and Lambert’s law are widely used
to solve the electromagnetic energy distribution for microwave heating (Yang and
Gunasekaran 2004; Ayappa, 1997; Hossan and others, 2010; Campañone and others,
2012; Chamchong and Datta 1999; Liu et al. 2005). However, the power formulation
based on Maxwell’s equations is more accurate than that based on Lambert’s (Yang and
Gunasekaran 2004). It is also reported that Lambert’s law may cause errors in predicting
small size material due to the assumption that all transmitted energy is absorbed
(Barringer and others, 1995; Budd and Hill, 2011). With the availability of extensive
computing facilities, solution of Maxwell’s equations for electromagnetics coupled
66
with heat transfer in the oven cavity can be obtained by different numerical methods
such as finite difference time domain (FDTD) method (Dincov and others, 2004;
George and others, 2005; Dibben, 2001; Chen and others, 2008; Torres and Jecko, 1997;
Ma and others, 1995) and finite element method (FEM) (Romano and others, 2005; Liu
and others, 2013; Dev and others, 2012; Zhang and Datta, 2000). However, the FDTD
method is difficult to apply for complex geometry and can require long computational
time (Geedipalli and others, 2007).
Due to the complexity of factors affecting microwave heating, it is hard to apply
mathematic models to actual food stuff. The dielectric properties of food determine how
materials interact with an electromagnetic field. The dielectric constant ( ′) of food
decides the level of a material to store electromagnetic energy, while the dielectric loss
factor associates with the ability of the material to absorb the electromagnetic energy
and convert that energy into thermal energy. The geometry, mass, composition, and
thermal properties are also critical parameters to determine the energy absorption and
the energy spatial distribution (Zhang and others, 2001). Therefore, computer-based
modeling is introduced into the field to solve the mathematic models and used to
simulate the microwave heating process. In this chapter, a mathematical model was
developed to compute the energy absorption from microwaves, and a computer-based
model was built to simulate the heating process and predict the temperature distribution.
3.2 Material and methods3.2.1 Electromagnetic field equations
The microwave heating is governed by Maxwell’s equations. Differential form
for time harmonic electric fields and magnetic field flux were given as Eq. 3.1a and Eq.
67
3.1b. In order to completely specify the electric and magnetic fields, Gauss’s laws were
employed as Eq. 3.1c and Eq. 3.1d.× = − (3.1a)× = = (3.1b)∙ = 0 (3.1c)∙ = 0 (3.1d)
where E and H represent the time-harmonic electric and magnetic fields, respectively;× is the curl operator that describes rotation of a vector field in 3-dimensional space;∙ was the divergence operator that measures magnitude of a field at given point;
is the angular frequency (rads/s); is the free space permittivity (8.854×10⁻¹² F/m),
is the complex dielectric permittivity, and is the permeability (H/m).
The complex relative permittivity is defined as:= ’ − ” = | | (3.2)
where ’ is the dielectric constant; ” is dielectric loss factor; and is the loss angle of
the dielectric material, where tan = ”/ ’ is defined as the loss tangent or
dissipation factor (Nelson, 1999). The dielectric constant ( ’) decides the level of a
material to store electromagnetic energy, while the dielectric loss factor is associated
with the ability of the material to absorb the electromagnetic energy and convert that
energy into thermal energy.
At the inner wall of the waveguide and cavity, a perfect conduction condition is
utilized. Therefore, normal components of the magnetic field ( ) and tangential
68
components of the electric field ( ) vanish at these walls, where the boundary
condition is applied as: = 0 = 0 (3.3)
3.2.2 Wave equations
The coupling between the electric field and the magnetic field produced by the
displacement current (Eq. 3.1a) and magnetic induction (Eq. 3.1b) provides a complete
description of the propagation of electromagnetic waves. By combining the two
equations to eliminate the magnetic field strength H, the wave equation (Eq. 3.4) can
be obtained (Dibben, 2001): × × + = 0 (3.4)
In a homogeneous source free medium we can use Eq. 3.1c to simplify the wave
equation (Eq. 3.4): + = 0 (3.5)
Restricting the situation to consider only a plane wave propagating in the z
direction, Eq. 3.5 can be further simplified to:= − (3.5)
Where Ex is the electric field parallel to the x axis. This equation has a solution:( ) = + (3.6)
where the constants and correspond to the magnitude of the waves propagating
in the +z and -z directions, respectively; γ = √ is known as the propagation
constant. It can be given as: = + (3.7)
69
where is the attenuation coefficient and is the phase constant. They are related to
the material properties by the following equations:
= [ 1 + ( ) − 1 (3.8)
= [ 1 + ( ) + 1 (3.9)
The linkage between the electric and magnetic fields implies that the electric field
of the propagating wave will be accompanied by a normal magnetic field. When the
medium in which the wave is traveling is “lossy”, which means the medium will cause
dissipation of electrical energy, the magnitude of the wave decays exponentially with
distance.
3.2.3 Absorption of microwave energy
The microwave power absorbed in a food material is related to the dielectric
conductivity and electric field strength (Decareau, 1992). An electromagnetic wave
loses its energy when travelling through a lossy material. The electromagnetic energy
is converted into thermal energy within the material. The amount of power that can be
absorbed by a material or the conversion of microwave energy to heat is expressed by
the following equation (Decareau, 1992): = (3.10)
where is power absorbed (W/m3), is dielectric conductivity and E is electric
field strength (V/m). The dielectric conductivity is proportional to the permittivity
of free space (8.854×10⁻¹² F/m), the relative dielectric loss factor of the material ”,and the frequency of energy source (Hz). The dielectric conductivity was calculated
by:
70
= 2 ′′ (3.11)
So the equation of absorption power was converted into:= 2 ′′ (3.12)
3.2.4 Heat transfer equations
The temperature distributions in the particle and carrier liquid was obtained by
the solution of the following energy equations (Eq. 3.13) with a source term which
accounts for internal energy generation due to the absorption of the microwave energy.= ∙ ( ) + (3.13)
Where is the density (kg/m3), is the specific heat capacity at constant pressure
(kJ/kg°C), is the thermal conductivity (W/m °C), and is the temperature (°C) at
time .
The heat transfer between the food surface and surrounding (other ingredients or
surrounding air) was expressed as following convention equation (Geedipalli and others,
2007): − = h ( − ) (3.14)
where represents the direction towards the surface, ℎ is the heat transfer coefficient
(W/ (m2 °C)), is the surface temperature, and is the surrounding temperature (°
C). The heat transfer coefficient of value 10 W/ (m2°C) was used in natural convective
heat transfer in air to calculate the heat loss to the air from the load (Tong and Lund,
1993). The surfaces in front of the air will have higher heat transfer coefficient than the
surfaces opposite to it when the air flow goes into the cavity (Verboven et al., 2003). To
insure the natural convection was taking place at the air-material interface, the air flow
inside the cavity was blocked in the simulation and the validation.
71
3.2.5 Assumptions
For simplicity, the microwaves were assumed to be transverse electromagnetic or
uniform plane waves. Although a uniform plane waves could not be formed in a real
system, the electric field distribution obtained from this simplified model could
approximate the actual electric field in the system (Hossan and others, 2010). The other
assumptions used to simplify the problem were:
1) Food systems obey linear material constitutive laws, which means the
components in food system are linear constitutive.
2) Electroneutrality condition is satisfied within the system.
3) The magnetic permeability can be approximated by its value in free space.
4) Dielectric properties are temperature independent.
5) Material properties, such as thermal conductivity and specific heat, are
temperature independent.
3.2.6 Simulation model development
In the differential form of the electromagnetic equations, the electric field (E)
distribution equations inside the cavity with irregular objects and wave equations could
not be solved merely by analytical methods. Therefore, numerical methods needed to
be used to solve the dynamically varying electromagnetic fields inside the cavity.
Several numerical techniques were used to solve the Maxwell’s equations. The finite
element method (FEM) and finite different time domain method (FDTD) are the two
most popular methods for simulating microwave heating (Dibben, 2001; Liu and others,
2013; Oliveira and Silva, 2010; Romano and others, 2005; Dev and others, 2012; Pandit
and others, 2003; George and others, 2005; Chen and others, 2008; Torres and Jecko,
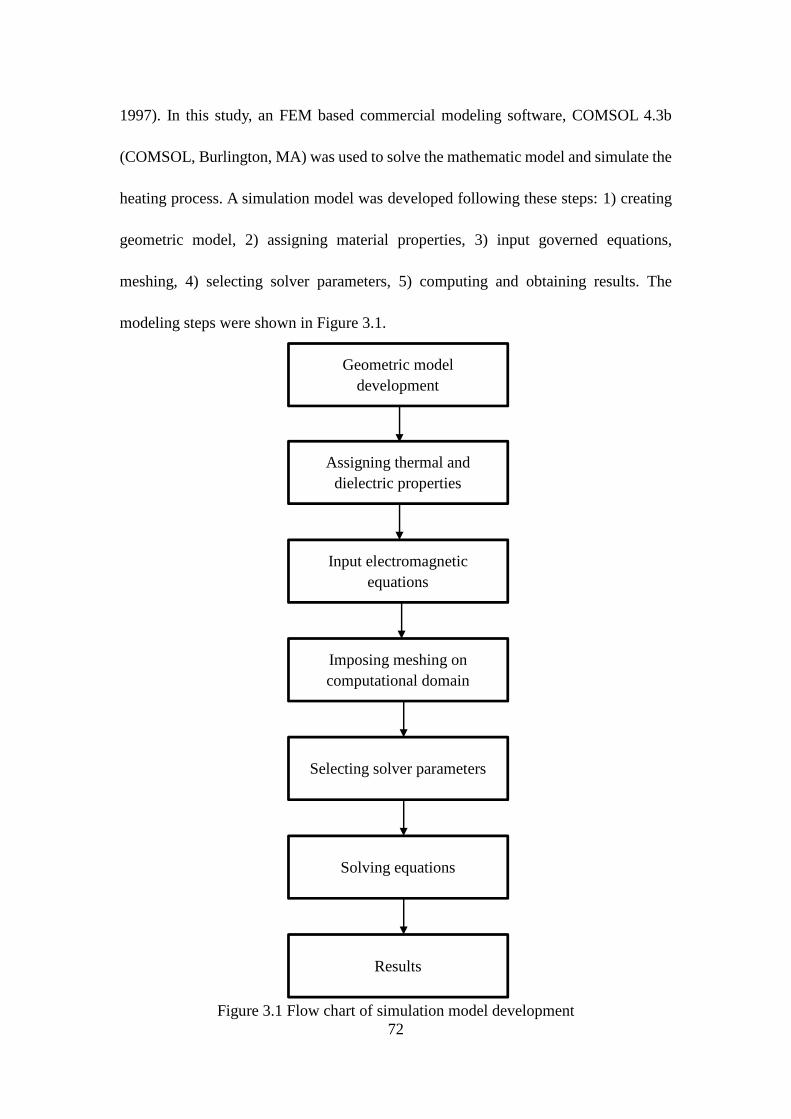
72
1997). In this study, an FEM based commercial modeling software, COMSOL 4.3b
(COMSOL, Burlington, MA) was used to solve the mathematic model and simulate the
heating process. A simulation model was developed following these steps: 1) creating
geometric model, 2) assigning material properties, 3) input governed equations,
meshing, 4) selecting solver parameters, 5) computing and obtaining results. The
modeling steps were shown in Figure 3.1.
Figure 3.1 Flow chart of simulation model development
Geometric modeldevelopment
Assigning thermal anddielectric properties
Input electromagneticequations
Imposing meshing oncomputational domain
Selecting solver parameters
Solving equations
Results
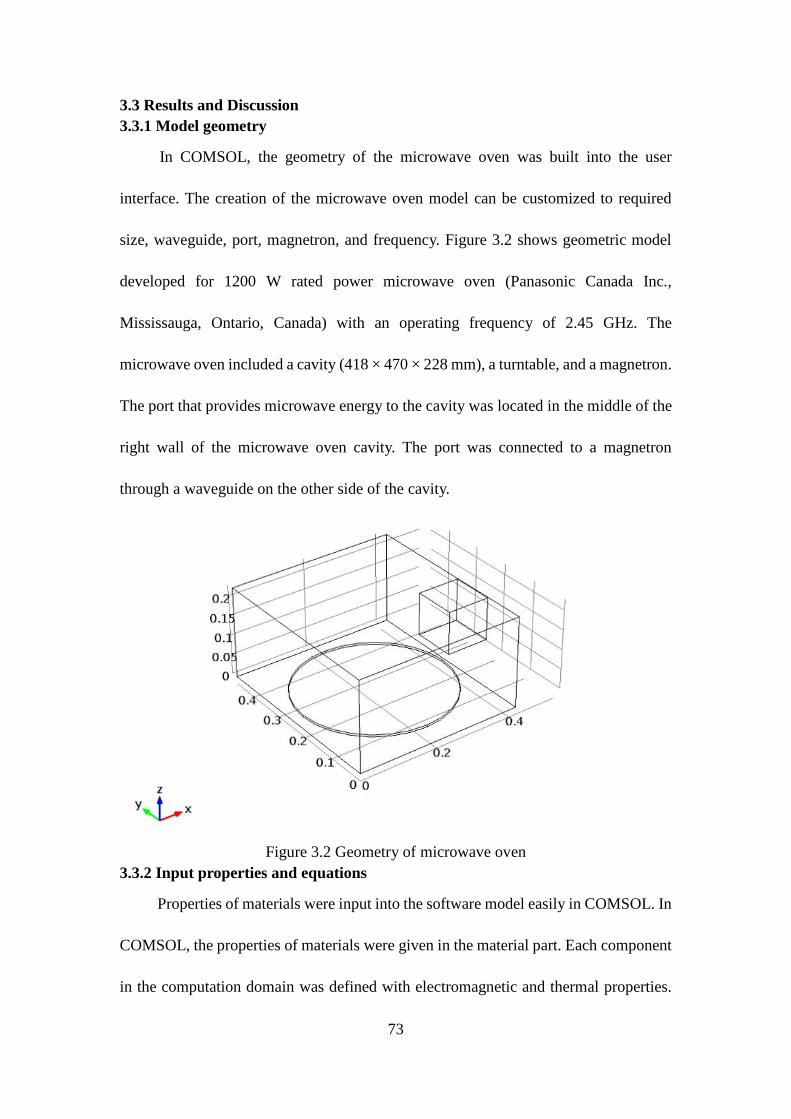
73
3.3 Results and Discussion3.3.1 Model geometry
In COMSOL, the geometry of the microwave oven was built into the user
interface. The creation of the microwave oven model can be customized to required
size, waveguide, port, magnetron, and frequency. Figure 3.2 shows geometric model
developed for 1200 W rated power microwave oven (Panasonic Canada Inc.,
Mississauga, Ontario, Canada) with an operating frequency of 2.45 GHz. The
microwave oven included a cavity (418 × 470 × 228 mm), a turntable, and a magnetron.
The port that provides microwave energy to the cavity was located in the middle of the
right wall of the microwave oven cavity. The port was connected to a magnetron
through a waveguide on the other side of the cavity.
Figure 3.2 Geometry of microwave oven3.3.2 Input properties and equations
Properties of materials were input into the software model easily in COMSOL. In
COMSOL, the properties of materials were given in the material part. Each component
in the computation domain was defined with electromagnetic and thermal properties.
74
Both independent variable and dependent function were used in the properties.
Equations were input in COMSOL.
The real power output of microwave oven was measured by the protocol from
The International Electrotechnical Commission (IEC). The protocol uses 1,000 g water
load heated in the microwave oven to measure the temperature rise and then the
microwave power output was determined. The water temperature was initially below
ambient temperature and was raised to approximately ambient temperature by heating
in the microwave oven. This procedure ensured that the heat losses and the heat capacity
of the container have a minimum effect. A cylindrical container of borosilicate glass
was used for the test. At the start of the test, the oven and the empty container were at
ambient temperature. Water having an initial temperature of 10 °C ± 1 ° C was used for
the test. The water temperature was measured immediately before it is poured into the
container. The oven was operated and the time for the water temperature to attain 20 °C
± 2 ° C was measured. The oven was then switched off and the final water temperature
was measured within 60 s. The microwave power output was calculated from the
following formula (IEC 2006):= . ( ) . ( )(3.15)
where is the power output (W), 4.187 is the specific heat of water (J/g °C), is
the mass of water (g), 0.55 is the specific heat of the glass container (J/g °C), is
the mass of container (g), is the ambient temperature (°C), is the initial
temperature of water (°C), is the final temperature of water (°C), and is the
heating time (s). The microwave power output was rounded off to the nearest 50 W.
75
Solving dominated equations for electromagnetic and heat transfer requires
iterative computational techniques to perform the simulation. Maxwell’s equations
were used to calculate each grid of the computation domain for electric field strength
based on properties assigned for that grid and adjacent grids. The solution of
electromagnetic equations required a large number of iterations to reach a steady state
at each time step. The calculated electric field strength (E) was applied as an input to
determine the dissipated power density (W/m3). Heat transfer equations were applied
on the materials placed inside the cavity. The heat change of the small grid was obtained
by adding the new absorbed power into the old enthalpy field. The temperature was
given by the result of the heat change in each grid. For temperature dependent functions,
thermal properties of the medium were updated with the change of the temperature field
at each time stop. As a sequence, new dielectric properties were calculated based on the
new temperature field and used to calculate new electromagnetic fields and microwave
power source term.
3.3.3 Iterations for electromagnetic steady state
Solving electromagnetic field equations typically requires a large number of
iterations to obtain steady state electromagnetic field strength values, which do not
change with subsequent iterations (Pitchai, 2011). It is an important parameter for
accurate prediction of temperature (Kopyt and Celuch, 2003). The electric field will
stabilize with increasing iterations and therefore the temperature at any point in the
domain will stabilize. The relationship of electromagnetic periods ( ) to the number
of iterations (Np) was described in the following relation (Pitchai, 2011):× = × (3.16)
76
where is the number of iterations needed for reaching a steady state, and is the
electromagnetic time step (ns).
3.3.4 Meshing
Mesh generation is one of the most critical aspects of simulation. The mesh
settings determine the resolution of the finite element mesh used to discretize the model.
The finite element method divides the model into small elements of geometrically
simple shapes, in this case tetrahedrons. In each tetrahedron, a set of polynomial
functions was used to approximate the structural displacement field: how much the
object deforms in each of the three coordinate directions. In this study, the mesh was
created in COMSOL itself.
3.3.5 Validation of the model
After the development of the model and simulation of the model in the software,
the simulated temperature profile was compared with the experimental profiles. Model
parameters were input into the simulation model, and computed for the result. The fresh
and frozen oyster meats were used to valid the model. The validation of the model will
be discussed in Chapter 4.
3.4 Conclusions
In this chapter, mathematical and computer-based models were built to simulate
microwave heating. Maxwell’s equations were used to solve the electromagnetic energy
distribution. The microwave energy absorption equation was used to calculate the
power absorption. The temperature distributions in the food stuff can be obtained by
the solution of the heat transfer equations with a source term which accounts for internal
energy generation due to the absorption of the microwave energy. An FEM based
commercial software COMSOL was used to solve differential equations and simulate
77
the microwave heating. A microwave cavity was built in the software, and parameters
and dominated equations were input for the simulation.
References
Ayappa, K. G. (1997). Modelling transport processes during microwave heating: Areview. Rev. Chem. Eng. 13(21), 1-68.
Barringer, SA, Davis, EA, Gordon J, Ayppa KG, Davis HT. (1995). Microwave-heating temperature profiles for thin slabs compared to Maxwell and Lambertlaw predictions. J Food Sci 60(5):1137-1142.
Budd, C. J. and A. D. C. Hill (2011). "A comparison of models and methods forsimulating the microwave heating of moist foodstuffs." International Journal ofHeat and Mass Transfer 54(4): 807-817.
Campañone, L. A., Paola, C. A., & Mascheroni, R. H. (2012). Modeling andsimulation of microwave heating of foods under different process schedules.Food and Bioprocess Technology, 5(2), 738-749.
Chamchong, M., & Datta, A. K. (1999). Thawing of foods in a microwave oven: I.Effect of power levels and power cycling. Journal of Microwave Power andElectromagnetic Energy, 34(1), 8-21.
Chen, H. H., Tang, J. J., & Liu, F. F. (2008). Simulation model for moving foodpackages in microwave heating processes using conformal FDTD method.Journal of Food Engineering, 88(3), 294-305.doi:10.1016/j.jfoodeng.2008.02.020
Decareau, R. V. (1992). Microwave foods: New product development. Connecticut,USA: Food and Nutrition Press.
Dev, S. S., Gariépy, Y., Orsat, V., & Raghavan, G. (2012). Finite element modelingfor optimization of microwave heating of in-shell eggs and experimentalvalidation. International Journal Of Numerical Modelling, 25(3), 275-287.doi:10.1002/jnm.831
Dibben, D. (2001). Electromagnetics: Fundamental. Aspects and NumericalModeling. In Ashim K. Datta and Ramaswamy C. Anantheswaran (Ed.),Handbook of Microwave Technology for Food Application. New York: MarcelDekker, Inc.
78
Geedipalli, S. R., Rakesh, V. V., & Datta, A. K. (2007). Modeling the heatinguniformity contributed by a rotating turntable in microwave ovens. Journal ofFood Engineering, 82(3), 359-368. doi:10.1016/j.jfoodeng.2007.02.050
George, J., Muktoyuk, M., & Bergman, R. (2005). Enhancements to the FDTDmethod for steady-state power-deposition analysis in microwave-heatingcavities. Microwave & Optical Technology Letters, 47(6), 530-534.doi:10.1002/mop.2122
Hossan, M. R., et al. (2010). "Analysis of microwave heating for cylindrical shapedobjects." International Journal of Heat and Mass Transfer 53(23–24): 5129-5138.
International Electrotechnical Commission (IEC). (2006). CEI/IEC 60705: 1999 +a1:2004 + A2: 2006. Household microwave ovens – methods for measuringperformance. Geneva: International Electrotechnical Commission.
Knoerzer, K., Regier, M., & Schubert, H. (2005). Measuring temperaturedistributions during microwave processing. In H. Schubert & M. Regier (Eds.),The microwave processing of foods. Cambridge: Woodhead Publishing Limited.
Kopyt, P. and M. Celuch-Marcysiak. 2003. FDTD modelling and experimentalverification of electromagnetic power dissipated in domestic microwave ovens.Journal of Telecommunications and Information Technology 1:59–65.
Liu, C. M., Q. Z. Wang and N. Sakai. 2005. Power and temperature distributionduring microwave thawing, simulated by using Maxwell's equations andLambert's law. International Journal of Food Science & Technology 40(1): 9-21.
Liu, S., Fukuoka, M., & Sakai, N. (2013). A finite element model for simulatingtemperature distributions in rotating food during microwave heating. Journal OfFood Engineering, 115(1), 49-62. doi:10.1016/j.jfoodeng.2012.09.019
Ma, L. H., Paul, D. L., Pothecary, N., Railton, C., Bows, J., Barratt, L., et al. (1995).Experimental validation of a combined electromagnetic and thermal FDTDmodel of a microwave-heating process. IEEE Transactions on MicrowaveTheory and Techniques, 43(11), 2565–2572.
Nelson SO. 1999. Dielectric properties measurement techniques and applications.Trans. ASAE. 42(2):523-529.
Oliveira, D. B., & Silva, E. J. (2010). Hybrid Analytical-FEM Method forMicrowave Heating Analysis in a Single Mode Cavity. IEEE Transactions OnMagnetics, 48(8), 2767-2770. doi:10.1109/TMAG.2010.2044152
79
Pandit, R. B., & Prasad, S. (2003). Finite element analysis of microwave heating ofpotato––transient temperature profiles. Journal Of Food Engineering, 60(2), 193.doi:10.1016/S0260-8774(03)00040-2
Pitchai, K. Electromagnetic and Heat Transfer Modeling of Microwave Heating inDomestic Ovens (Master dissertation). University of Nebraska at Lincoln,Lincoln, Ne.
Romano, V., Marra, F., & Tammaro, U. (2005). Modelling of microwave heating offoodstuff: study on the influence of sample dimensions with a FEM approach.Journal of Food Engineering, 71(3), 233-241.doi:10.1016/j.jfoodeng.2004.11.036
Romano, V., Marra, F., & Tammaro, U. (2005). Modelling of microwave heating offoodstuff: study on the influence of sample dimensions with a FEM approach.Journal of Food Engineering, 71(3), 233-241.doi:10.1016/j.jfoodeng.2004.11.036
Ryynanen, S., T. Ohlsson. (1996). Microwave heating uniformity of ready meals asaffected by placement, composition, and geometry. Journal of Food Science, 61(3) (1996), pp. 620–624
Salvi, D. D., Boldor, D. D., Aita, G. M., & Sabliov, C. M. (2011). COMSOLMultiphysics model for continuous flow microwave heating of liquids. Journalof Food Engineering, 104(3), 422-429. doi:10.1016/j.jfoodeng.2011.01.005
Shou-Zheng, Z., & Han-Kui, C. (1988). Power distribution analysis in rectangularmicrowave heating applicator with stratified load. Journal of Microwave Powerand Electromagnetic Energy, 23(2), 139–143.
Tong, C. H., & Lund, D. B. (1993). Microwave heating of baked dough products withsimultaneous heat and moisture transfer. Journal of Food Engineering, 19(4),319-339.
Torres, F., & Jecko, B. (1997). Complete FDTD analysis of microwave heatingprocesses in. IEEE Transactions On Microwave Theory & Techniques, 45(1),108.
Verboven, P., et al. (2003). Computation of airflow effects on heat and mass transferin a microwave oven. Journal of Food Engineering 59(2–3): 181-190.
Watanabe, W., & Ohkawa, S. (1978). Analysis of power density distribution inmicrowave ovens. Journal of Microwave Power and Electromagnetic Energy,13(2), 173–182.
80
Wu, X. (2002). Experimental and Theoretical Study of Microwave Heating ofThermal Runaway Materials (Doctoral dissertation). Virginia PolytechnicInstitute and State University. Blacksburg, VA.
Yang, H. W. and S. Gunasekaran (2004). Comparison of temperature distribution inmodel food cylinders based on Maxwell's equations and Lambert's law duringpulsed microwave heating. Journal of Food Engineering 64(4): 445-453.
Zhang, H., & Datta, A. K. (2001). Electromagnetics of microwave heating:magnitude and uniformity of energy absorption in an oven. In Ashim K. Dattaand Ramaswamy C. Anantheswaran (Ed.), Handbook of Microwave Technologyfor Food Application. New York: Marcel Dekker, Inc.
81
CHAPTER 4 APPLICATION OF MATHEMATICAL AND COMPUTER-BASED MODELS TO OYSTER MEAT
4.1 Introduction
As one of the most popular types of seafood in the US, oysters have become a
leading cause of foodborne disease. The pathogens most associated with oyster
consumption are Vibrio specie, especially Vibrio parahaemolyticus (Vp) and V.
vulnificus (Vv) (CDC, 2013). Vibrio spp. are widespread and naturally present in marine
and estuarine environments. As a natural filter feeder, oysters may concentrate
microorganisms from the environment, which will lead to accumulation of pathogens.
During the summer months, oysters may concentrate V. spp. in warmer waters
(Corcoran, 1998). V. vulnificus has the highest mortality ratio of any foodborne
pathogen, which is approximately 50% (FAO, 2005). The case fatality rate caused by
V. vulnificus is about 50% for bloodstream infections and 25% for wound infections
(Iwamoto and others, 2010). The V. parahaemolyticus infection causes watery diarrhea,
abdominal cramps, nausea, and vomiting (Painter and others, 2013). An estimated
35,000 cases of foodborne gastroenteritis are related to the consumption of
contaminated seafood with V. parahaemolyticus in the United States each year (Scallan
and others, 2011) and most reported cases are caused by oysters.
Thermal processing can be used to kill the Vibrio spp. The CDC (2009)
recommends boiling shucked oysters at least 3 minutes to kill Vibrio vulnificus. By
heating oyster meat at 50˚C for 5 min, 99.9% V. vulnificus and 100% V.
parahaemolyticus were eliminated in the shell-stock oysters (Andrews and others,
2000). Cryogenic individual quick freezing has been proven to be an effective post-
82
harvest processing technique for eliminating the pathogen in oysters (Muth and others,
2011).
Volumetric heat generated by microwave can heat food quickly. Food absorbs
microwave energy internally and then it is converted into heat. The main problem
associated with microwave heating is the non-uniform temperature distribution in
microwave-heated foods. The non-uniform temperature distribution causes hot spots
and cold spots on food during microwave heating and lead to quality issues and health
risks (Ryynanen and others, 1996). Some pathogenic microorganisms may survive in
cold spots after microwave heating. In oyster products, pathogen survival in cold spots
can cause serious health risk to consumer.
Temperature is a critical factor for final product quality in microwave heating.
However, the characteristic of microwave heating limits the experimental measurement
of temperature. The interference of measuring devices with the electromagnetic field
can disturb microwave heating in heating devices (Salvi and others, 2011), so numerical
methods can be introduced into the determination of temperature distribution in
microwave heating. The distribution of the electric and magnetic fields in microwave
heating can be described by Maxwell’s equations (Rattanadecho, 2006). The dielectric
properties determine how materials interact with an electromagnetic field. Coupled
mass and energy balances need to be solved taking into account the absorption of
electromagnetic energy to determine the temperature distribution. Accurate modeling
of the microwave heating process requires effective methods for solving both
electromagnetic and thermodynamic problems (Kopyt and Celuch, 2006). Computer
83
technology and simulation technology can be employed in solving microwave heating
problems. The finite element method (FEM) is widely used for simulating of the
microwave heating (Liu and others, 2013; Oliveira and Silva, 2010). Due to the
variation in properties of foods, modeling consists of solving specific and limited
problems in microwave heating.
This study was conducted to employ a mathematical model to predict the
temperature distribution during microwave heating for oysters, and used simulation
software to solve the mathematical model and simulate the microwave heating.
Evaluation of the non-uniform temperature distribution of oysters during microwave
heating will help to locate the hot spots and cold spots during heating, and provide
information to predict the temperature change in oyster.
4.2 Materials and methods4.2.1 Shucked oysters
Fresh gulf oysters (Crassostrea virginica) were purchased from a local seafood
market in Baton Rouge, Louisiana. The oyster meat was cryogenically frozen by a
cabinet-type cryogenic freezer (Air Liquide, Houston, Texas), which employed liquid
nitrogen with an operation temperature of -123.3ºC Freezing was carried out until the
geometrical center reached -20ºC. The temperature was monitored at one second
interval and recorded using a temperature data logger and type K thermocouples
(Comark®, Comark Limited, Stevenage, Herts, UK). After freezing, oyster meat
samples were stored in a walk-in freezer at -20ºC.
4.2.2 Proximate analysis of oyster meat
Moisture, protein, lipid, and ash were analyzed for the fresh shucked oyster meat.
The oyster meat was analyzed for moisture and ash contents by using the AOAC
84
standard methods 930.15 and 942.05, respectively (AOAC International, 2005) in
triplicate. Three batches of oyster meat obtained from 15 oysters were collected and
homogenized separately in a Waring® commercial laboratory blender for 60 s at high
speed. Approximately 5 g samples were dried at 105°C for 24 h in a draft oven for
moisture content determination. The weight loss was used to calculate the moisture
content of samples. About 1 g of freeze dried sample was incinerated at 550°C for 24 h
for determining ash content. The lipid content was measured in triplicate using AOAC
standard methods 948.15 (AOAC International, 2005). About 5 g freeze dried oyster
meat was placed in a sohxlet extractor to extract the fat content at 60°C for 3 hours.
Petroleum ether was used as extraction solvent. To measure protein, the nitrogen
content was first determined in triplicate by the Dumas combustion method using a
Leco TruSpec® Nitrogen Analyzer (LECO Corporation, St. Joseph, MI). The protein
content was then calculated as percent nitrogen times 6.25.
4.2.3 Thermal properties of oyster meat
The thermal conductivity of oyster meat was estimated by Choi and Okos’s
equation (1986).
The thermal conductivity (K) for oyster meat with n components was estimated
using equation 4.1. = ∑ (4.1)
where is the volume fraction of the ith component, which was calculated by equation
4.2.
= ∑ (4.2)
85
where is the mass fraction of the ith component, and is the density of the ith
component.
The specific heat (Cp) of oyster meat was estimated by equation 4.3.= ∑ (4.3)
where Cpi is the specific heat of the ith component.
Similarly, the thermal diffusivity α of oyster meat was estimated by equation 4.4.= ∑ (4.4)
where is the specific heat of the ith component.
The thermal properties are functions related to temperature. But to simplify the
calculation and simulation, values at room temperature (20°C) were used to
development the simulation model.
Latent heat (L) was calculated as:= ′ (4.5)
where L’ was the latent heat of fusion of water (333.6 kJ/ kg) and was the weight
fraction of ice, which was given by = ( − )( )), where equaled the
weight fraction of water, equaled the weight fraction of solute, was bound water/kg
solute, which was calculated by − , where and were the molecular weight
of water and solutes, and b was the constant. The constant = 0.32 was reported for fish
(de Reinick, 1996). The molecular weight of solutes was calculated as =18.02( ( )( ) ), and was the mole fraction of water of the oyster meat. was
calculated by l ( ) = −18.02( ( )), where R was the ideal gas constant = 8.314 J/
mol K and temperature was expressed in K. The latent heat for cryogenically frozen
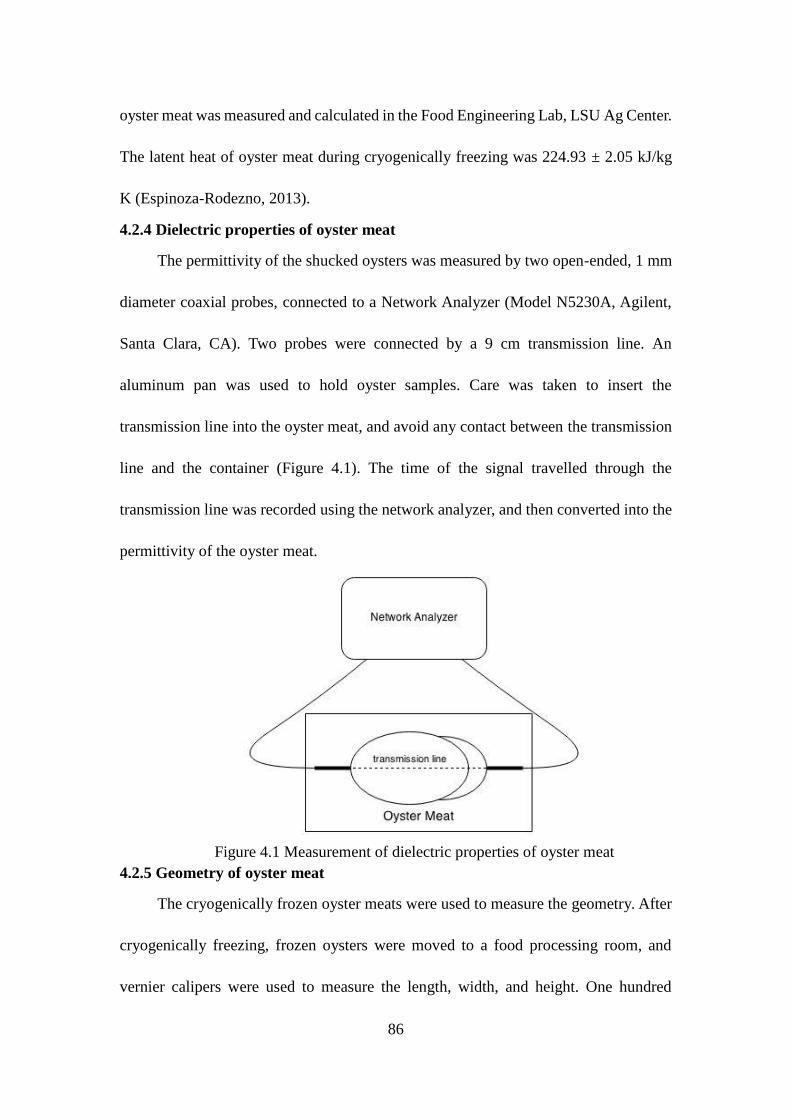
86
oyster meat was measured and calculated in the Food Engineering Lab, LSU Ag Center.
The latent heat of oyster meat during cryogenically freezing was 224.93 ± 2.05 kJ/kg
K (Espinoza-Rodezno, 2013).
4.2.4 Dielectric properties of oyster meat
The permittivity of the shucked oysters was measured by two open-ended, 1 mm
diameter coaxial probes, connected to a Network Analyzer (Model N5230A, Agilent,
Santa Clara, CA). Two probes were connected by a 9 cm transmission line. An
aluminum pan was used to hold oyster samples. Care was taken to insert the
transmission line into the oyster meat, and avoid any contact between the transmission
line and the container (Figure 4.1). The time of the signal travelled through the
transmission line was recorded using the network analyzer, and then converted into the
permittivity of the oyster meat.
Figure 4.1 Measurement of dielectric properties of oyster meat4.2.5 Geometry of oyster meat
The cryogenically frozen oyster meats were used to measure the geometry. After
cryogenically freezing, frozen oysters were moved to a food processing room, and
vernier calipers were used to measure the length, width, and height. One hundred
87
oysters from different batches were used to determine the average length, width, and
height of oysters.
4.2.6 Model development4.2.6.1 Mathematical equations
The main equations of mathematical models include:
The Maxwell’s equations: × = − (3.1a)× = = (3.1b)∙ = 0 (3.1c)∙ = 0 (3.1d)
Absorption of microwave energy equations:= 2 ′′ (3.12)
Heat transfer equations: = ∙ ( ) + (3.13)
The energy balance and mass balance were estimated by following equations:= + + + (4.5)= + (4.6)
where is the energy input, is the absorbed energy, is unabsorbed
energy, is the energy loss from the heated material; is the mass of food,
is the mass of heated food, is the mass loss of the heated food. During
microwave heating, moisture content in the oyster meat was evaporated and left the
food. The evaporation of moisture takes away some absorbed energy and causes energy
loss. This dynamic process is difficult to predict, and affects the temperature
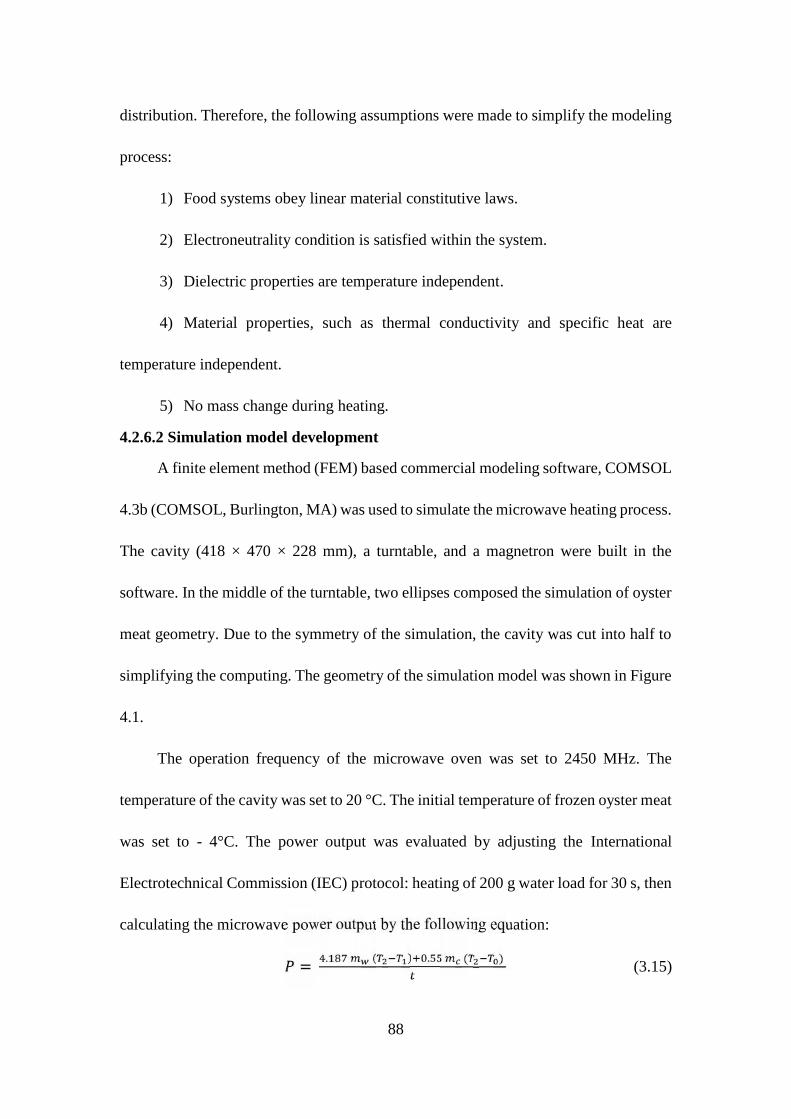
88
distribution. Therefore, the following assumptions were made to simplify the modeling
process:
1) Food systems obey linear material constitutive laws.
2) Electroneutrality condition is satisfied within the system.
3) Dielectric properties are temperature independent.
4) Material properties, such as thermal conductivity and specific heat are
temperature independent.
5) No mass change during heating.
4.2.6.2 Simulation model development
A finite element method (FEM) based commercial modeling software, COMSOL
4.3b (COMSOL, Burlington, MA) was used to simulate the microwave heating process.
The cavity (418 × 470 × 228 mm), a turntable, and a magnetron were built in the
software. In the middle of the turntable, two ellipses composed the simulation of oyster
meat geometry. Due to the symmetry of the simulation, the cavity was cut into half to
simplifying the computing. The geometry of the simulation model was shown in Figure
4.1.
The operation frequency of the microwave oven was set to 2450 MHz. The
temperature of the cavity was set to 20 °C. The initial temperature of frozen oyster meat
was set to - 4°C. The power output was evaluated by adjusting the International
Electrotechnical Commission (IEC) protocol: heating of 200 g water load for 30 s, then
calculating the microwave power output by the following equation:= . ( ) . ( )(3.15)
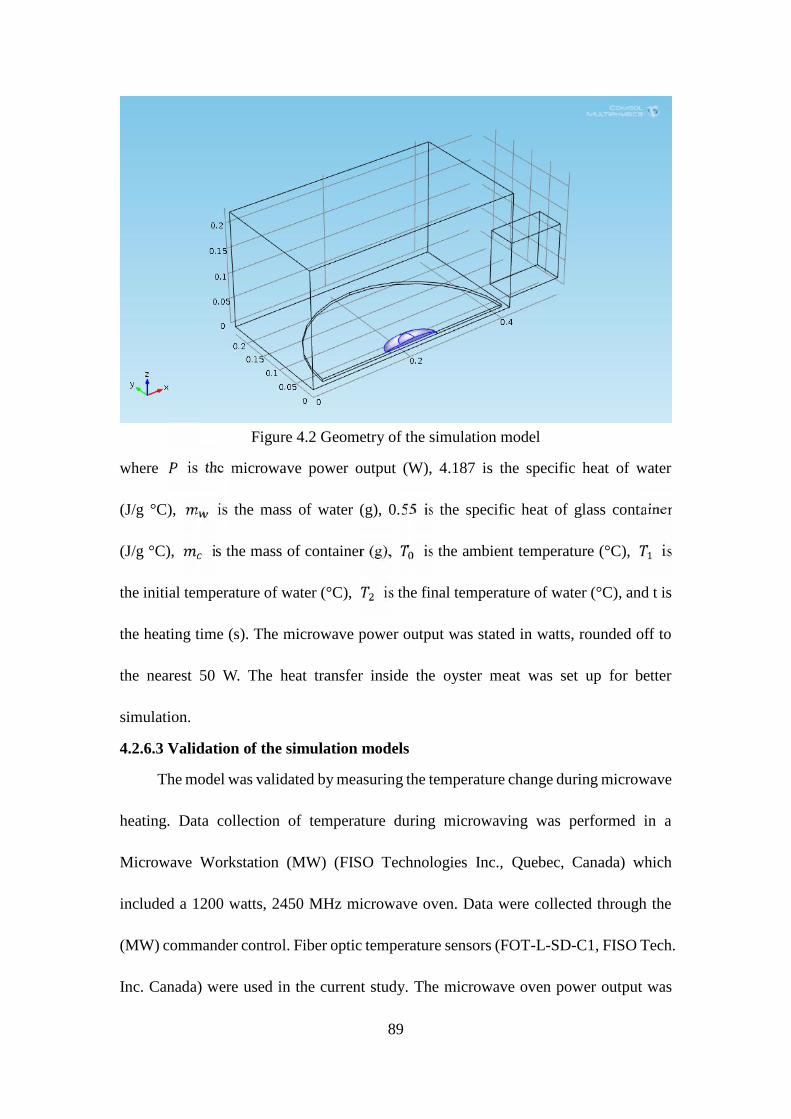
89
Figure 4.2 Geometry of the simulation model
where is the microwave power output (W), 4.187 is the specific heat of water
(J/g °C), is the mass of water (g), 0.55 is the specific heat of glass container
(J/g °C), is the mass of container (g), is the ambient temperature (°C), is
the initial temperature of water (°C), is the final temperature of water (°C), and t is
the heating time (s). The microwave power output was stated in watts, rounded off to
the nearest 50 W. The heat transfer inside the oyster meat was set up for better
simulation.
4.2.6.3 Validation of the simulation models
The model was validated by measuring the temperature change during microwave
heating. Data collection of temperature during microwaving was performed in a
Microwave Workstation (MW) (FISO Technologies Inc., Quebec, Canada) which
included a 1200 watts, 2450 MHz microwave oven. Data were collected through the
(MW) commander control. Fiber optic temperature sensors (FOT-L-SD-C1, FISO Tech.
Inc. Canada) were used in the current study. The microwave oven power output was
90
calculated by measuring the temperature difference of 200 g water for 25 s before
heating and after the heating. The output energy can be calculated by using the thermal
properties of water and the temperature increasing in water and. Temperature sensors
were used for measuring the internal temperature in oyster meat. The sensor was
inserted into the oyster meat during microwave heating to collect the temperature data.
The hot spot was picked to monitor the temperature change. The hot spot was
identified by running the simulation model. The location of potential hot spot of oyster
meat was found and used to measure the temperature change. For frozen oyster meat,
it was carefully perforated with a 2 mm stainless steel drill before placing the sample
into the microwave oven. For internal temperature measurement, the tip of the sensors
was introduced into the drilled holes of the frozen oyster meat. The collected data were
compared to the temperature result from the simulation model. The simulated
temperature profile ( ) was compared with the experimental temperature profile ( )
and the root mean square error was calculated by ∑ ( − ) (Pitchai and
others, 2012).
Due to the property difference between ice and water, the simulated temperature
for frozen oyster meat was divided into two parts: below the freezing point and beyond
freezing point. When the temperature was below freezing point, the thermal properties
calculated from the properties of ice were used, and the latent heat needed to be taken
into account.
4.2.9 Statistical analysis
The collected data were analyzed using SAS version 9.2 (SAS, Version 92, SAS
Institute Inc., Cary, NC., USA). One-way analysis of variance (ANOVA) was used to
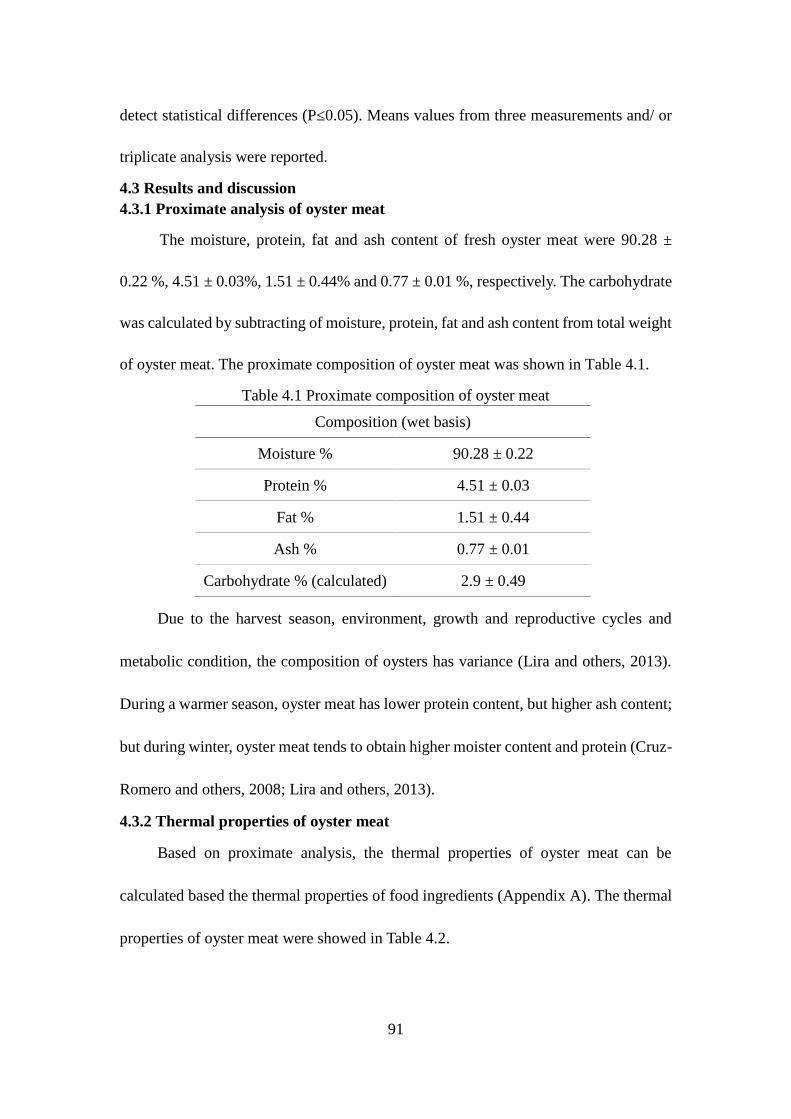
91
detect statistical differences (P≤0.05). Means values from three measurements and/ or
triplicate analysis were reported.
4.3 Results and discussion4.3.1 Proximate analysis of oyster meat
The moisture, protein, fat and ash content of fresh oyster meat were 90.28 ±
0.22 %, 4.51 ± 0.03%, 1.51 ± 0.44% and 0.77 ± 0.01 %, respectively. The carbohydrate
was calculated by subtracting of moisture, protein, fat and ash content from total weight
of oyster meat. The proximate composition of oyster meat was shown in Table 4.1.
Table 4.1 Proximate composition of oyster meat
Composition (wet basis)
Moisture % 90.28 ± 0.22
Protein % 4.51 ± 0.03
Fat % 1.51 ± 0.44
Ash % 0.77 ± 0.01
Carbohydrate % (calculated) 2.9 ± 0.49
Due to the harvest season, environment, growth and reproductive cycles and
metabolic condition, the composition of oysters has variance (Lira and others, 2013).
During a warmer season, oyster meat has lower protein content, but higher ash content;
but during winter, oyster meat tends to obtain higher moister content and protein (Cruz-
Romero and others, 2008; Lira and others, 2013).
4.3.2 Thermal properties of oyster meat
Based on proximate analysis, the thermal properties of oyster meat can be
calculated based the thermal properties of food ingredients (Appendix A). The thermal
properties of oyster meat were showed in Table 4.2.
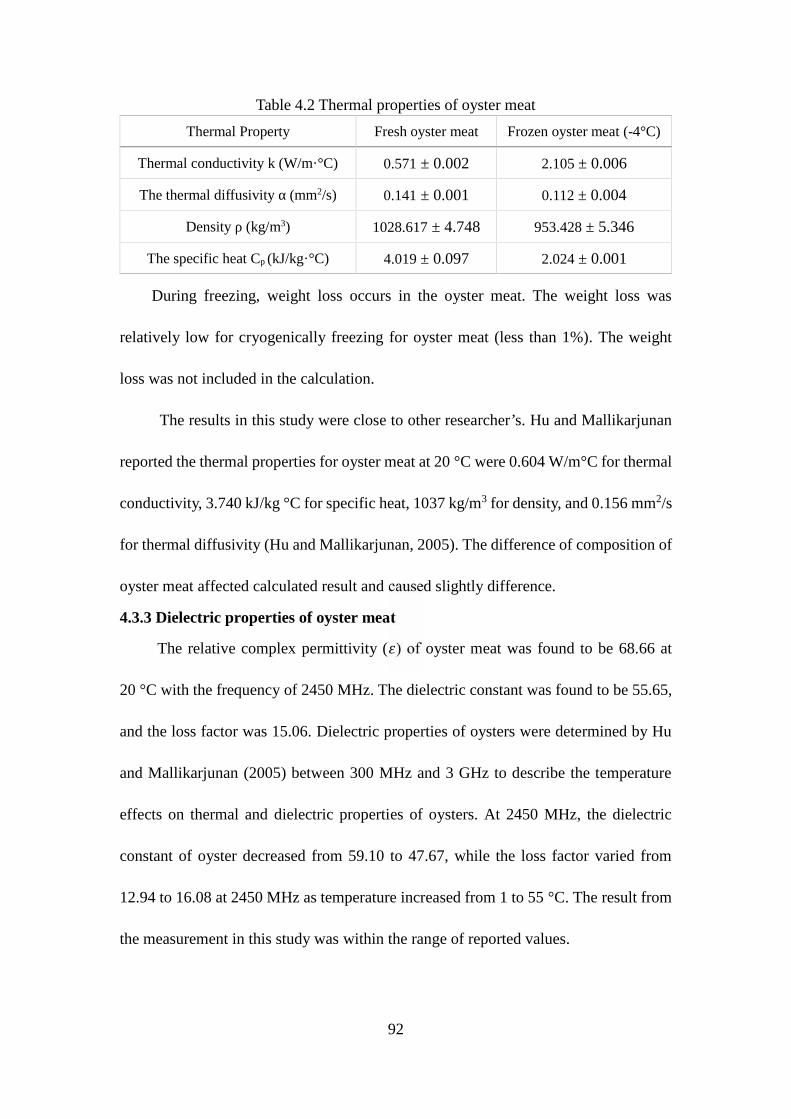
92
Table 4.2 Thermal properties of oyster meat
During freezing, weight loss occurs in the oyster meat. The weight loss was
relatively low for cryogenically freezing for oyster meat (less than 1%). The weight
loss was not included in the calculation.
The results in this study were close to other researcher’s. Hu and Mallikarjunan
reported the thermal properties for oyster meat at 20 °C were 0.604 W/m°C for thermal
conductivity, 3.740 kJ/kg °C for specific heat, 1037 kg/m3 for density, and 0.156 mm2/s
for thermal diffusivity (Hu and Mallikarjunan, 2005). The difference of composition of
oyster meat affected calculated result and caused slightly difference.
4.3.3 Dielectric properties of oyster meat
The relative complex permittivity ( ) of oyster meat was found to be 68.66 at
20 °C with the frequency of 2450 MHz. The dielectric constant was found to be 55.65,
and the loss factor was 15.06. Dielectric properties of oysters were determined by Hu
and Mallikarjunan (2005) between 300 MHz and 3 GHz to describe the temperature
effects on thermal and dielectric properties of oysters. At 2450 MHz, the dielectric
constant of oyster decreased from 59.10 to 47.67, while the loss factor varied from
12.94 to 16.08 at 2450 MHz as temperature increased from 1 to 55 °C. The result from
the measurement in this study was within the range of reported values.
Thermal Property Fresh oyster meat Frozen oyster meat (-4°C)
Thermal conductivity k (W/m·°C) 0.571 ± 0.002 2.105 ± 0.006
The thermal diffusivity α (mm2/s) 0.141 ± 0.001 0.112 ± 0.004
Density ρ (kg/m3) 1028.617 ± 4.748 953.428 ± 5.346
The specific heat Cp (kJ/kg·°C) 4.019 ± 0.097 2.024 ± 0.001
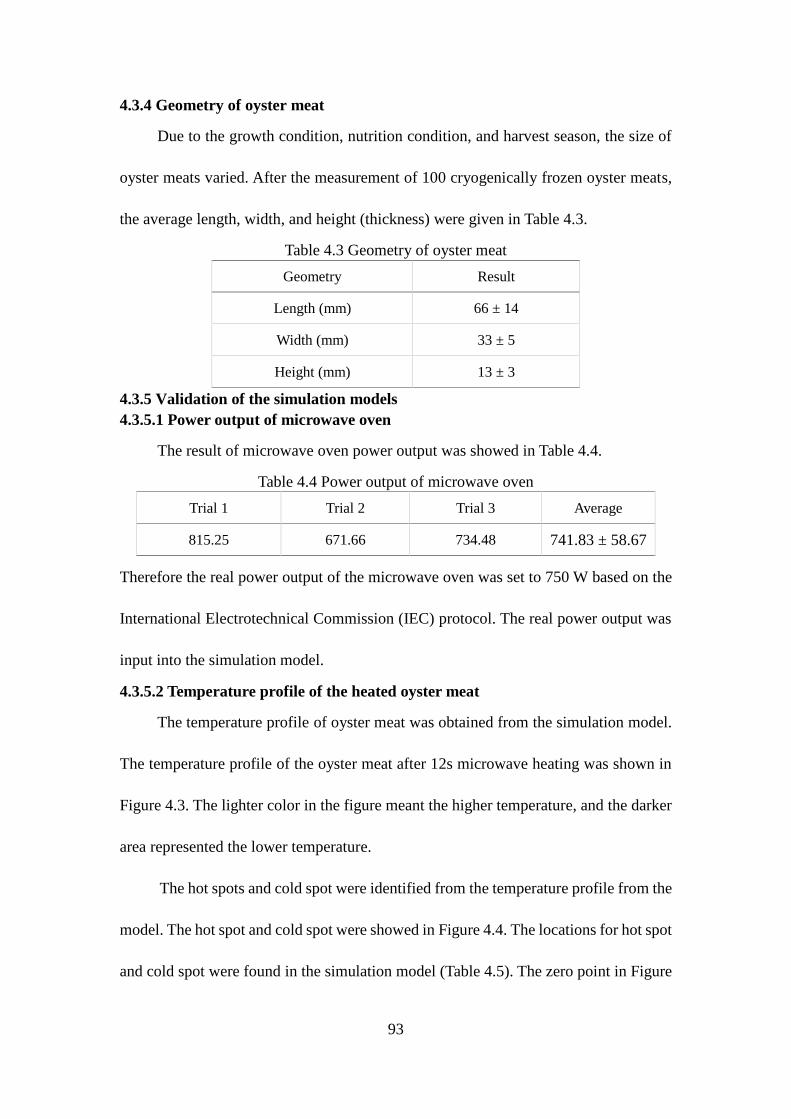
93
4.3.4 Geometry of oyster meat
Due to the growth condition, nutrition condition, and harvest season, the size of
oyster meats varied. After the measurement of 100 cryogenically frozen oyster meats,
the average length, width, and height (thickness) were given in Table 4.3.
Table 4.3 Geometry of oyster meat
Geometry Result
Length (mm) 66 ± 14
Width (mm) 33 ± 5
Height (mm) 13 ± 3
4.3.5 Validation of the simulation models4.3.5.1 Power output of microwave oven
The result of microwave oven power output was showed in Table 4.4.
Table 4.4 Power output of microwave oven
Trial 1 Trial 2 Trial 3 Average
815.25 671.66 734.48 741.83 ± 58.67
Therefore the real power output of the microwave oven was set to 750 W based on the
International Electrotechnical Commission (IEC) protocol. The real power output was
input into the simulation model.
4.3.5.2 Temperature profile of the heated oyster meat
The temperature profile of oyster meat was obtained from the simulation model.
The temperature profile of the oyster meat after 12s microwave heating was shown in
Figure 4.3. The lighter color in the figure meant the higher temperature, and the darker
area represented the lower temperature.
The hot spots and cold spot were identified from the temperature profile from the
model. The hot spot and cold spot were showed in Figure 4.4. The locations for hot spot
and cold spot were found in the simulation model (Table 4.5). The zero point in Figure
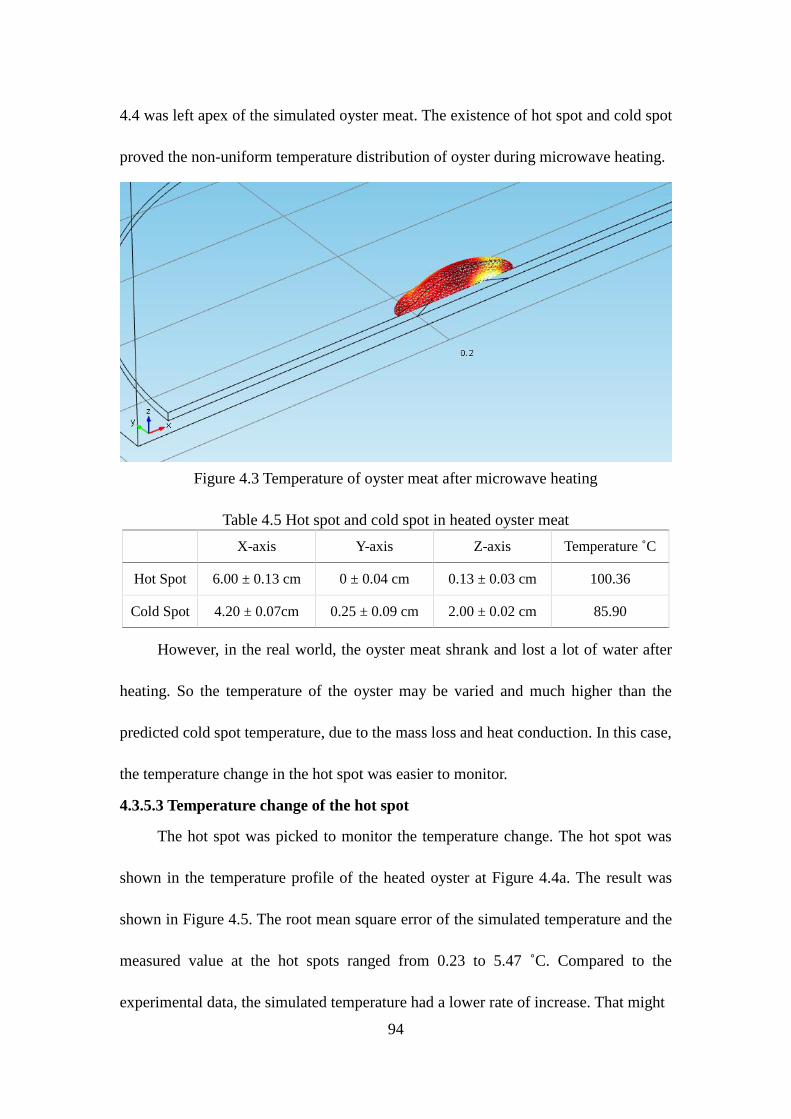
94
4.4 was left apex of the simulated oyster meat. The existence of hot spot and cold spot
proved the non-uniform temperature distribution of oyster during microwave heating.
Figure 4.3 Temperature of oyster meat after microwave heating
Table 4.5 Hot spot and cold spot in heated oyster meat
X-axis Y-axis Z-axis Temperature ˚C
Hot Spot 6.00 ± 0.13 cm 0 ± 0.04 cm 0.13 ± 0.03 cm 100.36
Cold Spot 4.20 ± 0.07cm 0.25 ± 0.09 cm 2.00 ± 0.02 cm 85.90
However, in the real world, the oyster meat shrank and lost a lot of water after
heating. So the temperature of the oyster may be varied and much higher than the
predicted cold spot temperature, due to the mass loss and heat conduction. In this case,
the temperature change in the hot spot was easier to monitor.
4.3.5.3 Temperature change of the hot spot
The hot spot was picked to monitor the temperature change. The hot spot was
shown in the temperature profile of the heated oyster at Figure 4.4a. The result was
shown in Figure 4.5. The root mean square error of the simulated temperature and the
measured value at the hot spots ranged from 0.23 to 5.47 ˚C. Compared to the
experimental data, the simulated temperature had a lower rate of increase. That might
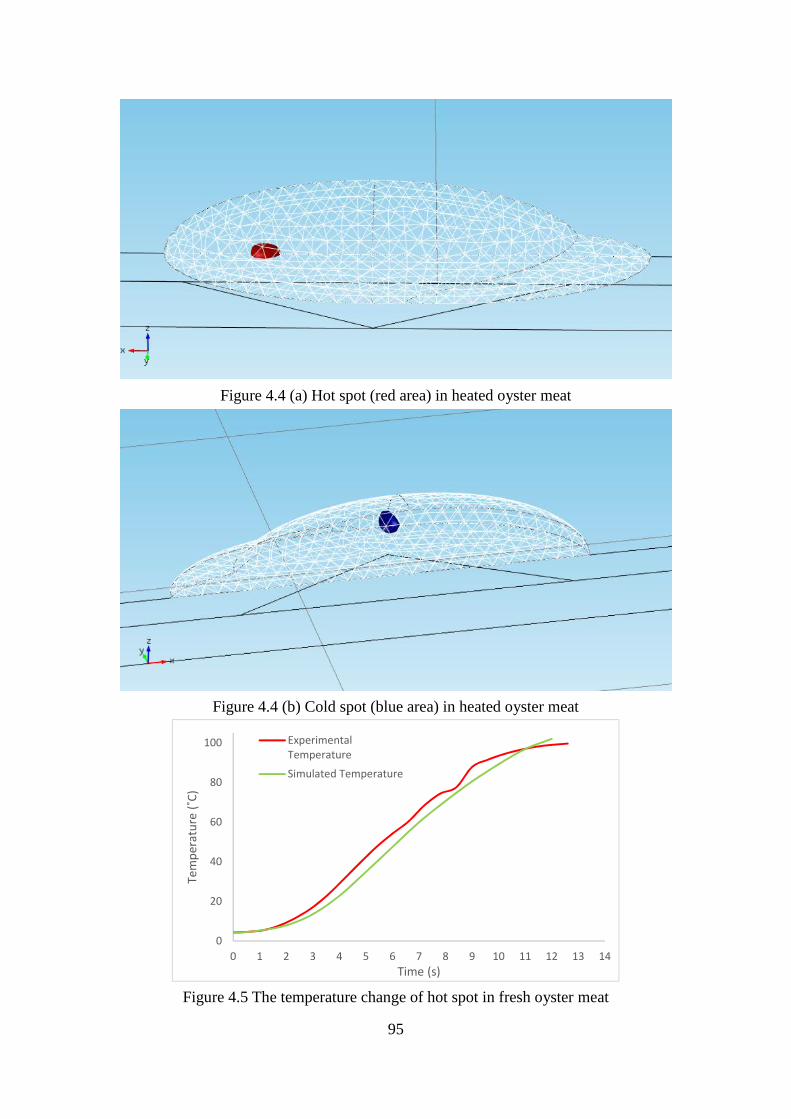
95
Figure 4.4 (a) Hot spot (red area) in heated oyster meat
Figure 4.4 (b) Cold spot (blue area) in heated oyster meat
Figure 4.5 The temperature change of hot spot in fresh oyster meat
0
20
40
60
80
100
0 1 2 3 4 5 6 7 8 9 10 11 12 13 14
Tem
pera
ture
(˚C)
Time (s)
ExperimentalTemperatureSimulated Temperature
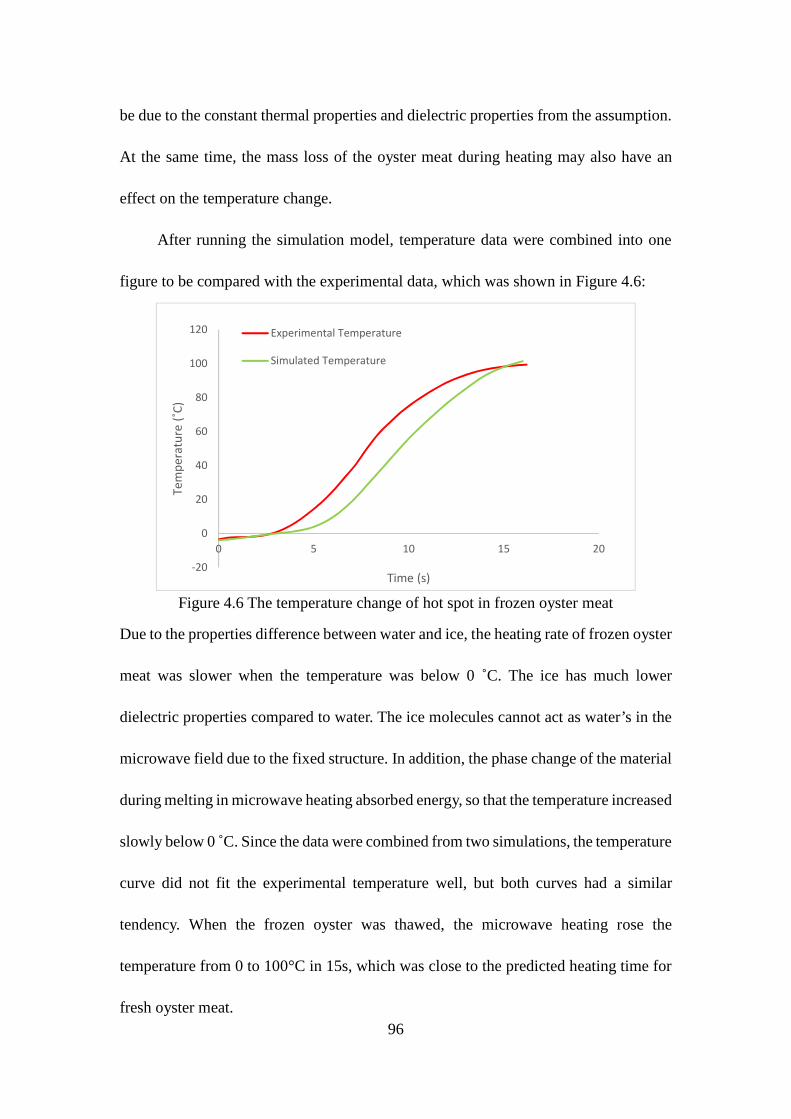
96
be due to the constant thermal properties and dielectric properties from the assumption.
At the same time, the mass loss of the oyster meat during heating may also have an
effect on the temperature change.
After running the simulation model, temperature data were combined into one
figure to be compared with the experimental data, which was shown in Figure 4.6:
Figure 4.6 The temperature change of hot spot in frozen oyster meat
Due to the properties difference between water and ice, the heating rate of frozen oyster
meat was slower when the temperature was below 0 ˚C. The ice has much lower
dielectric properties compared to water. The ice molecules cannot act as water’s in the
microwave field due to the fixed structure. In addition, the phase change of the material
during melting in microwave heating absorbed energy, so that the temperature increased
slowly below 0 ˚C. Since the data were combined from two simulations, the temperature
curve did not fit the experimental temperature well, but both curves had a similar
tendency. When the frozen oyster was thawed, the microwave heating rose the
temperature from 0 to 100°C in 15s, which was close to the predicted heating time for
fresh oyster meat.
-20
0
20
40
60
80
100
120
0 5 10 15 20
Tem
pera
ture
(˚C)
Time (s)
Experimental Temperature
Simulated Temperature
97
4.4 Conclusion
A simulation model using coupled electromagnetic and heat transfer equations
was used to predict the temperature profile of oyster in this study. The FEM based
commercial software was used to solve the electromagnetic Maxwell‘s equations and
Fourier heat transfer equations and simulate the microwave heating processing.
Oyster meat was used for approximate analysis. The oyster meat contained 90.28%
moisture, 4.51% protein, 1.51% fat, 0.77% ash, and 2.9% carbohydrate. Based on the
composition of oyster meat, the Choi and Okos’s equation was used to calculate the
thermal properties of oyster meat. The dielectric properties of oyster meat were
measured by the transmission line method. The geometry of oyster meat was
determined by measuring 100 frozen oysters.
In this simulation model, the geometry of microwave oven and oyster were built
into the simulation model. The temperature profile of oyster after heating was obtained
by the model. Hot spot and cold spot were identified. The model predicted temperature
change in hot spot agreed well with the experimental one; the fresh oyster can be heated
from 4°C to about 100°C in 12s. The root mean square error of the simulated
temperature and the experimental value at the hot spots ranged from 0.23 to 5.47 ˚C.
The frozen oyster cannot be heated quickly below the freezing point. But when the
temperature rose beyond the freezing point, the temperature increased quickly.
References
Andrews, L. S., Park, D. L., & Chen, Y. P. (2000). Low temperature pasteurization toreduce the risk of vibrio infections from raw shell-stock oysters. Food Additives &Contaminants, 17(9), 787-791. doi:10.1080/026520300415336
98
AOAC International. (2005). Official methods of analysis of AOAC International (18thed.). Arlington, VA.: AOAC International.
CDC. (2013). Surveillance for Foodborne Disease Outbreaks — United States, 2009–2010. Morbidity and Mortality Weekly Report (MMWR), 62(3), 41-47.
Choi Y, Okos M. 1986. Effects of temperature and composition on the thermalproperties of foods. In: Lemaguer M, Jelen P. Food Engineering and ProcessApplications. Vol.1. Elsevier Applied Science Publishers.
Corcoran, L. (1998). Raw Oysters: Deadly Delicacy. Nutrition Action Health Letter,October 7–8.
Cruz-Romero, M., Kerry, J. P., & Kelly, A. L. (2008). Changes in the microbiologicaland physicochemical quality of high-pressure-treated oysters (Crassostrea gigas)during chilled storage. Food Control, 19(12), 1139-1147.
de Reinick, A. C. R. (1996). Average and center temperature vs time evaluation forfreezing and thawing rectangular foods. Journal of Food Engineering, 30(3–4), 299-311.
Espinoza-Rodezno, L. A. (2013). DEVELOPMENT OF SAFE AND READY TOEAT FROZEN OYSTER PRODUCTS USING MICROWAVE STEAM-VENTING TECHNOLOGY (Doctoral dissertation). Louisiana State University,Baton Rouge, LA.
Food and Agricultural Organization of the United Nations (FAO). 2005. RiskAssessment of Vibrio vulnificus in Raw Oysters: Interpretive Summary andTechnical Report. Microbiological Assessment Series No. 8. Rome, Italy: FAO.
Hu, X., & Mallikarjunan, P. (2005). Thermal and dielectric properties of shuckedoysters. LWT - Food Science & Technology, 38(5), 489-494.doi:10.1016/j.lwt.2004.07.016
Iwamoto, M., Ayers, T., Mahon, B. E., & Swerdlow, D. L. (2010). Epidemiology ofseafood-associated infections in the United States. Clinical microbiology reviews,23(2), 399-411.
Kopyt, P. and M. Celuch. 2006. Towards a multiphysics simulation system formicrowave power phenomena. In Microwave Conference Proceedings, 2005.APMC 2005. Asia-Pacific Conference Proceedings, 4. IEEE.
99
Lira, G. M., Pascoal, J. C. M., Torres, E. A. F. S., Soares, R. A. M., Mendonca, S.,Sampaio, G. R., Correia, M. S., Cabral, C. C. V. Q., Cabral Junior, C. R., & Lopez,A. M. Q. (2013). Influence of seasonality on the chemical composition of oysters(Crassostrea rhizophorae). Food Chemistry, 138(2-3), 786-790.
Liu, S., Fukuoka, M., & Sakai, N. (2013). A finite element model for simulatingtemperature distributions in rotating food during microwave heating. Journal OfFood Engineering, 115(1), 49-62. doi:10.1016/j.jfoodeng.2012.09.019
Muth, M. K., Anderson, D. W., Karns, S. A. & Domanico, J. L. (2000) Economicimpact of requiring post-harvest treatment of oysters. vol. RTI Project (No.7466.000): Research Triangle Institute.
Oliveira, D. B., & Silva, E. J. (2010). Hybrid Analytical-FEM Method for MicrowaveHeating Analysis in a Single Mode Cavity. IEEE Transactions On Magnetics, 48(8),2767-2770. doi:10.1109/TMAG.2010.2044152
Painter, John A., R. M. H., Tracy Ayers, Robert V. Tauxe, Christopher R.Braden,Frederick J. Angulo, and Patricia M. Griffin. (2013). Attribution offoodborne illnesses, hospitalizations, and deaths to food commodities by usingoutbreak data, United States, 1998–2008. Emerging Infectious Diseases.www.cdc.gov/eid, 19(3), 407-415.
Rattanadecho, P. (2006). "The simulation of microwave heating of wood using arectangular wave guide: Influence of frequency and sample size." ChemicalEngineering Science 61(14): 4798-4811.
Pitchai, K., et al. (2012). "Coupled electromagnetic and heat transfer model formicrowave heating in domestic ovens." Journal of Food Engineering 112(1–2):100-111.
Ryynanen, S., T. Ohlsson. (1996). Microwave heating uniformity of ready meals asaffected by placement, composition, and geometry. Journal of Food Science, 61 (3)(1996), pp. 620–624
Salvi, D. D., Boldor, D. D., Aita, G. M., & Sabliov, C. M. (2011). COMSOLMultiphysics model for continuous flow microwave heating of liquids. Journal ofFood Engineering, 104(3), 422-429. doi:10.1016/j.jfoodeng.2011.01.005
Scallan, E., Hoekstra, R. M., Angulo, F. J., Tauxe, R. V., Widdowson, M. A., Roy, S.L., Jones, J. L., & Griffin, P. M. (2011). Foodborne illness acquired in the UnitedStates--major pathogens. Emerging infectious diseases, 17(1), 7-15.

100
Sidwell V, Foncannon PR, Moore NS, Bonnet JC. 1974. Composition of the edibleportion of raw (fresh or frozen) crustaceans, finfish and mollusks. Part I. Protein,fat, moisture, ash, carbohydrate, energy value and cholesterol. Mar. Fish. Rev.36(3):21-35.
Singh, P. (2007). Heating and Cooling Processes for Foods. In Heldman and Lund (Ed),Handbook of Food Engineering Second Edition. (pp 402). Boca Raton, FL: CRCPress.
101
CHAPTER 5 APPLICATION OF MATHEMATICAL AND COMPUTER-BASED MODELS TO OYSTER MEAT-BASED MEAL
5.1 Introduction
Microwavable meals are a group of prepackaged, frozen, and ready-to-cook
convenient instant products. Consumers can cook these meals in minutes in a
microwave oven before serving. Microwaveable meals are composed of raw and semi-
cooked ingredients, which are frozen and packed in a microwavable container.
Therefore, the temperature is a critical factor for heating microwavable meals. The non-
uniform heat distribution during microwave heating is the main concern related to
microbiological risk and quality in food. In the food industry, food safety is often
achieved by heating foodstuff to eliminate microbiological threats and thus if the food
product is not adequately heated pathogenic microorganisms may survive. At the same
time, microwave heating may cause texture damage, due to over-heating, poor yield
due to moisture loss, and poor appearance (Mizrahi, 2012).
Self-venting technology has rapidly spread in food industry for microwave
cooking. The steam builds up with time during the cooking process due to the special
designed package. During microwave cooking, the rapid heat generation can turn the
water content in food into steam quickly. Vapor pressure is accumulated in the package
and resulting in reduced cooking time and evenly distributed heat. The package distends
with the increase of the internal pressure and provides a visual indication that cooking
is occurring while maintaining a temperature between 100ºC to about 105ºC (Mast,
2000). The pressurized steam inside sealed plastic pouches or containers will have a
self-venting release adaptation (Mast, 2000). Steam-venting technology for microwave
102
cooking has been engineered to improve the final product quality through controlled
package expansion in conjunction with proprietary self-venting mechanisms (Fowle
and others, 2005). Steaming is a gentle, fat-free cooking method that retains the natural
moisture of foods. This feature makes it an excellent choice for preparing seafood meals,
which contains high moisture content ingredients.
Combining the microwave cooking and steam venting technology can provide a
wonderful meal with better final product quality and less health threat. However, the
information for microwave heating of this meal is insufficient. The uneven temperature
distribution occurred during the heating process, and might result in quality change and
potential health risk. So the employment of mathematic and simulation models to
describe the heating behavior for this meal during microwave heating is necessary.
5.2 Materials and methods5.2.1 Ingredients
Fresh shucked gulf oysters (Crassostrea virginica) were purchased from a local
seafood market in Baton Rouge, Louisiana, and processed in the Food Processing Pilot
Plant, Louisiana State University Agricultural Center. The oyster meat was drained and
placed on aluminum trays that were previously covered in aluminum foil. Freezing
paper then was used to cover the oyster meat. To cryogenically freeze the oyster meat,
a cabinet-type cryogenic freezer (Air Liquide, Houston, Texas) employing liquid
nitrogen with an operation temperature of -123.3ºC was used. Freezing was carried out
until the geometrical center reached -20ºC. The temperature was monitored at one
second intervals and recorded using a temperature data logger and type K
thermocouples (Comark®, Comark Limited, Stevenage, Herts, UK). After freezing,
103
oyster meat samples were stored in a walk-in freezer at -20ºC. Spaghetti (Great Value)
was purchased from a local supermarket. Spaghetti was cooked in boiling water for 10
minutes, then the water was drained and the pasta was cooled right before further
processing. Great Value Traditional Pasta Sauce was purchased from a local
supermarket.
5.2.2 Preparation of microwavable meals
Based on former work conducted in the Food Engineering Lab, Louisiana State
University Agricultural Center, one microwavable meal (PS) contained about 40g
frozen oyster meat (2 average oysters), 43g Traditional Pasta Sauce and 157g cooked
spaghetti.
Due to the difficulty to simulate the geometry of the meal and the measurement
of the temperature change during heating, pasta sauce and spaghetti were ground by a
Waring® commercial laboratory blender for 60 s at high speed. After the blending,
paste was collected for further processing. PS paste then were transferred into plastic
trays, and made into an 18cm × 13cm × 0.5cm (L×W×H) rectangular mass. All prepared
trays were cryogenically frozen by a cabinet-type cryogenic freezer (Air Liquide,
Houston, Texas) employing liquid nitrogen with an operation temperature of -123.3ºC.
Freezing was carried out until the geometrical center reached -20ºC. Two frozen oysters
were placed on the top of the paste. The trays then sealed in a Multivac T-200 tray sealer
(Multivac Inc, Kansas, MO) using nitrogen as headspace gas. The trays were stored at -
20ºC.
104
5.2.3 Proximate analysis of ingredients
Moisture, protein, lipid, and ash were analyzed for the paste of the instant meal.
The paste were analyzed for moisture and ash contents by using the AOAC standard
methods 930.15 and 942.05, respectively (AOAC International, 2005) in triplicate.
Approximately 5 g samples were dried at 105°C for 24 h in a draft oven for moisture
content determination. The weight loss was used to calculate the moisture content of
the sample. About 1 g of freeze dried sample was incinerated at 550°C for 24 h for the
ash content determination. The lipid content was measured in triplicate using AOAC
standard methods 945.16 (AOAC International, 2005). About 5 g freeze dried paste was
placed in a sohxlet extractor to extract the fat content at 60°C for 3 hours. Petroleum
ether was used as extraction solvent. To measure protein, the nitrogen content was first
determined in triplicate by the Dumas combustion method using a Leco TruSpec®
Nitrogen Analyzer (LECO Corporation, St. Joseph, MI). The protein content was then
calculated as percent nitrogen times 6.25.
5.2.4 Thermal properties of oyster meat
The thermal conductivity, specific heat and thermal diffusivity of each principle
component with respect to the changes of temperature can be estimated using Choi
and Okos’s equation (1986).
The thermal conductivity ( ) for meal paste with n components was estimated
using equation 4.1. = ∑ (4.1)
where is the volume fraction of the ith component.
The specific heat ( ) of meal paste was estimated by equation 4.3.
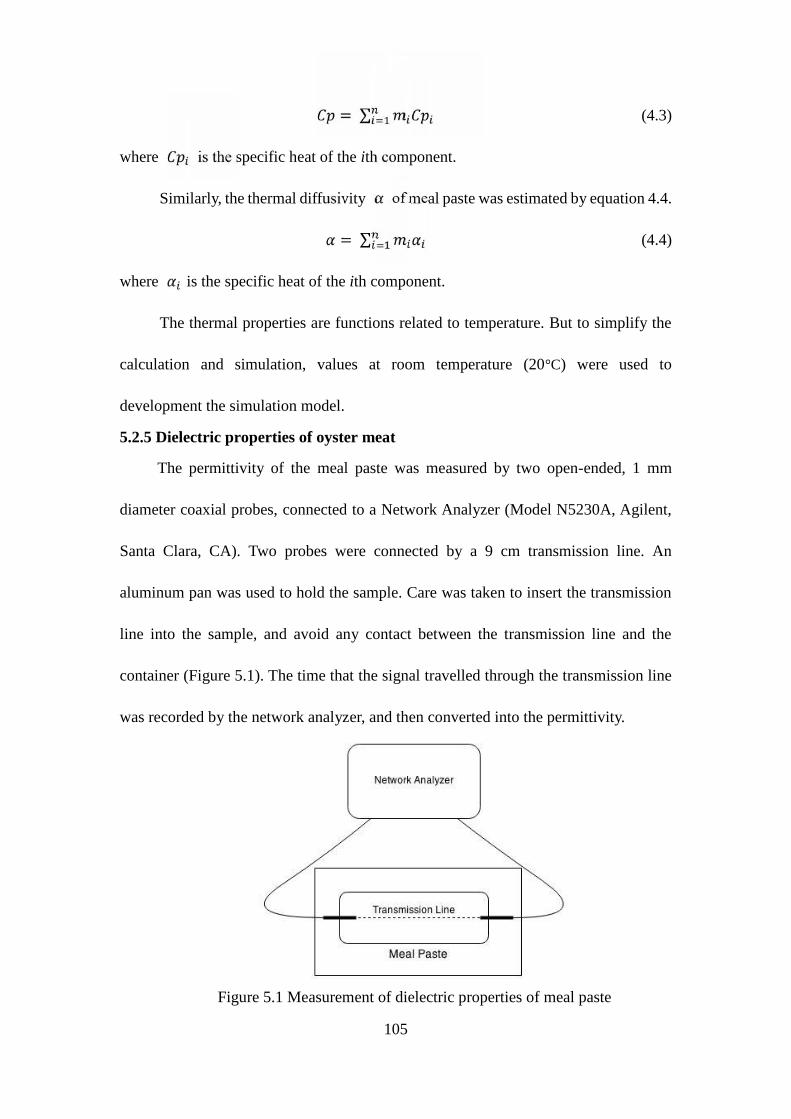
105
= ∑ (4.3)
where is the specific heat of the ith component.
Similarly, the thermal diffusivity of meal paste was estimated by equation 4.4.= ∑ (4.4)
where is the specific heat of the ith component.
The thermal properties are functions related to temperature. But to simplify the
calculation and simulation, values at room temperature (20°C) were used to
development the simulation model.
5.2.5 Dielectric properties of oyster meat
The permittivity of the meal paste was measured by two open-ended, 1 mm
diameter coaxial probes, connected to a Network Analyzer (Model N5230A, Agilent,
Santa Clara, CA). Two probes were connected by a 9 cm transmission line. An
aluminum pan was used to hold the sample. Care was taken to insert the transmission
line into the sample, and avoid any contact between the transmission line and the
container (Figure 5.1). The time that the signal travelled through the transmission line
was recorded by the network analyzer, and then converted into the permittivity.
Figure 5.1 Measurement of dielectric properties of meal paste
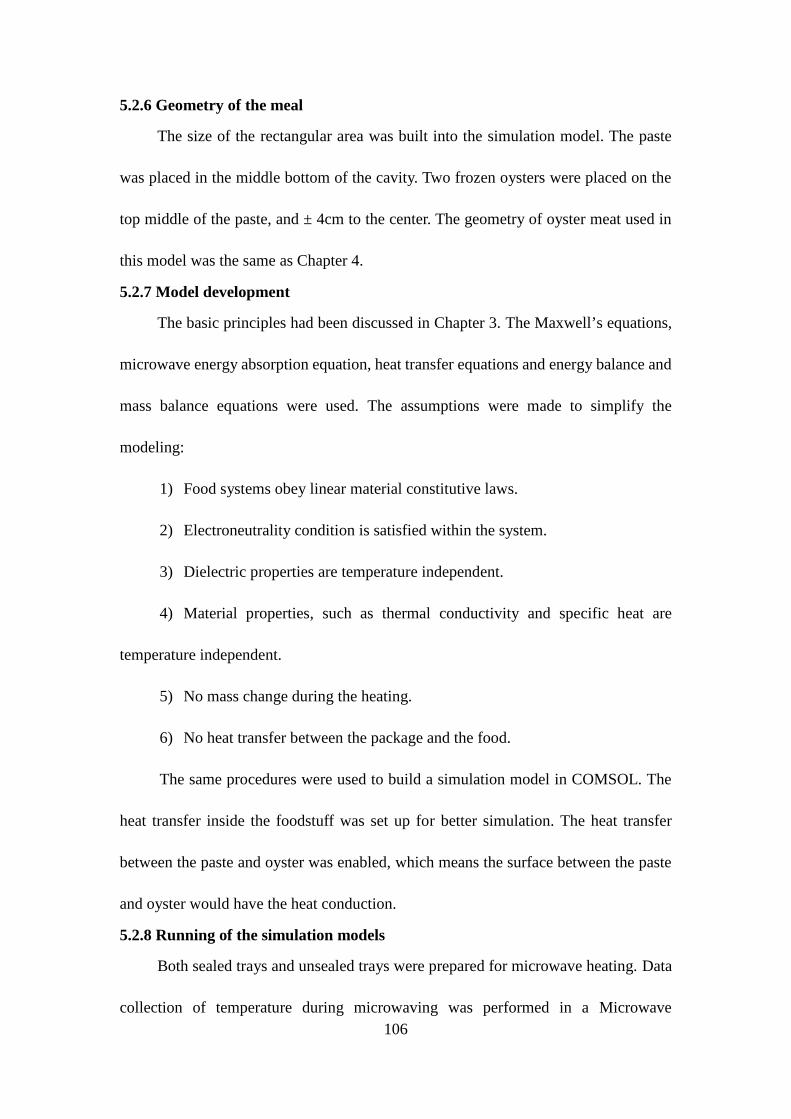
106
5.2.6 Geometry of the meal
The size of the rectangular area was built into the simulation model. The paste
was placed in the middle bottom of the cavity. Two frozen oysters were placed on the
top middle of the paste, and ± 4cm to the center. The geometry of oyster meat used in
this model was the same as Chapter 4.
5.2.7 Model development
The basic principles had been discussed in Chapter 3. The Maxwell’s equations,
microwave energy absorption equation, heat transfer equations and energy balance and
mass balance equations were used. The assumptions were made to simplify the
modeling:
1) Food systems obey linear material constitutive laws.
2) Electroneutrality condition is satisfied within the system.
3) Dielectric properties are temperature independent.
4) Material properties, such as thermal conductivity and specific heat are
temperature independent.
5) No mass change during the heating.
6) No heat transfer between the package and the food.
The same procedures were used to build a simulation model in COMSOL. The
heat transfer inside the foodstuff was set up for better simulation. The heat transfer
between the paste and oyster was enabled, which means the surface between the paste
and oyster would have the heat conduction.
5.2.8 Running of the simulation models
Both sealed trays and unsealed trays were prepared for microwave heating. Data
collection of temperature during microwaving was performed in a Microwave
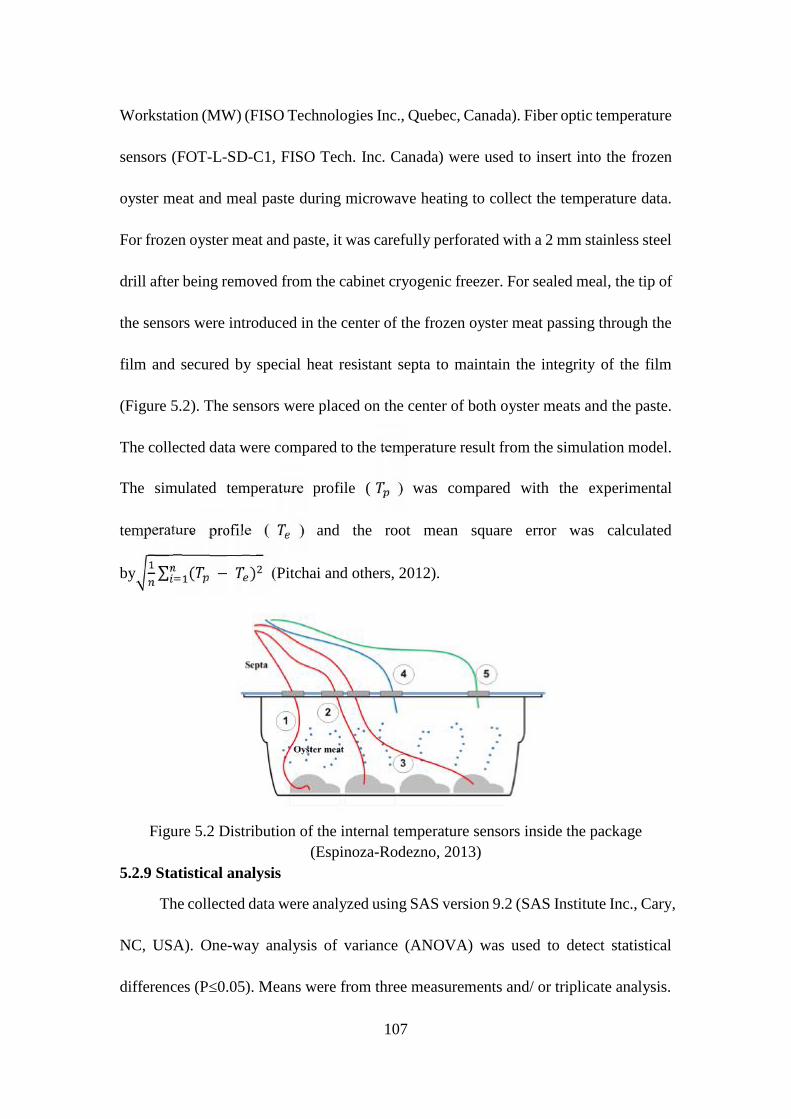
107
Workstation (MW) (FISO Technologies Inc., Quebec, Canada). Fiber optic temperature
sensors (FOT-L-SD-C1, FISO Tech. Inc. Canada) were used to insert into the frozen
oyster meat and meal paste during microwave heating to collect the temperature data.
For frozen oyster meat and paste, it was carefully perforated with a 2 mm stainless steel
drill after being removed from the cabinet cryogenic freezer. For sealed meal, the tip of
the sensors were introduced in the center of the frozen oyster meat passing through the
film and secured by special heat resistant septa to maintain the integrity of the film
(Figure 5.2). The sensors were placed on the center of both oyster meats and the paste.
The collected data were compared to the temperature result from the simulation model.
The simulated temperature profile ( ) was compared with the experimental
temperature profile ( ) and the root mean square error was calculated
by ∑ ( − ) (Pitchai and others, 2012).
Figure 5.2 Distribution of the internal temperature sensors inside the package(Espinoza-Rodezno, 2013)
5.2.9 Statistical analysis
The collected data were analyzed using SAS version 9.2 (SAS Institute Inc., Cary,
NC, USA). One-way analysis of variance (ANOVA) was used to detect statistical
differences (P≤0.05). Means were from three measurements and/ or triplicate analysis.
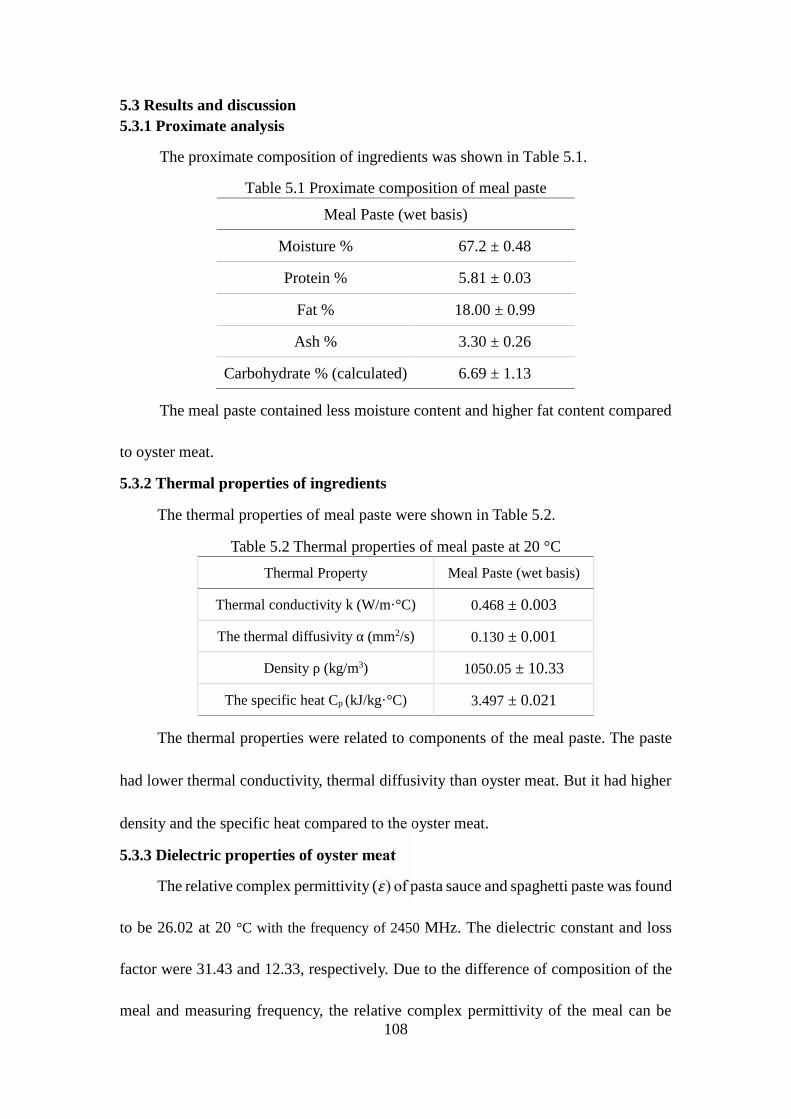
108
5.3 Results and discussion5.3.1 Proximate analysis
The proximate composition of ingredients was shown in Table 5.1.
Table 5.1 Proximate composition of meal paste
Meal Paste (wet basis)
Moisture % 67.2 ± 0.48
Protein % 5.81 ± 0.03
Fat % 18.00 ± 0.99
Ash % 3.30 ± 0.26
Carbohydrate % (calculated) 6.69 ± 1.13
The meal paste contained less moisture content and higher fat content compared
to oyster meat.
5.3.2 Thermal properties of ingredients
The thermal properties of meal paste were shown in Table 5.2.
Table 5.2 Thermal properties of meal paste at 20 °C
Thermal Property Meal Paste (wet basis)
Thermal conductivity k (W/m·°C) 0.468 ± 0.003
The thermal diffusivity α (mm2/s) 0.130 ± 0.001
Density ρ (kg/m3) 1050.05 ± 10.33
The specific heat Cp (kJ/kg·°C) 3.497 ± 0.021
The thermal properties were related to components of the meal paste. The paste
had lower thermal conductivity, thermal diffusivity than oyster meat. But it had higher
density and the specific heat compared to the oyster meat.
5.3.3 Dielectric properties of oyster meat
The relative complex permittivity ( ) of pasta sauce and spaghetti paste was found
to be 26.02 at 20 °C with the frequency of 2450 MHz. The dielectric constant and loss
factor were 31.43 and 12.33, respectively. Due to the difference of composition of the
meal and measuring frequency, the relative complex permittivity of the meal can be
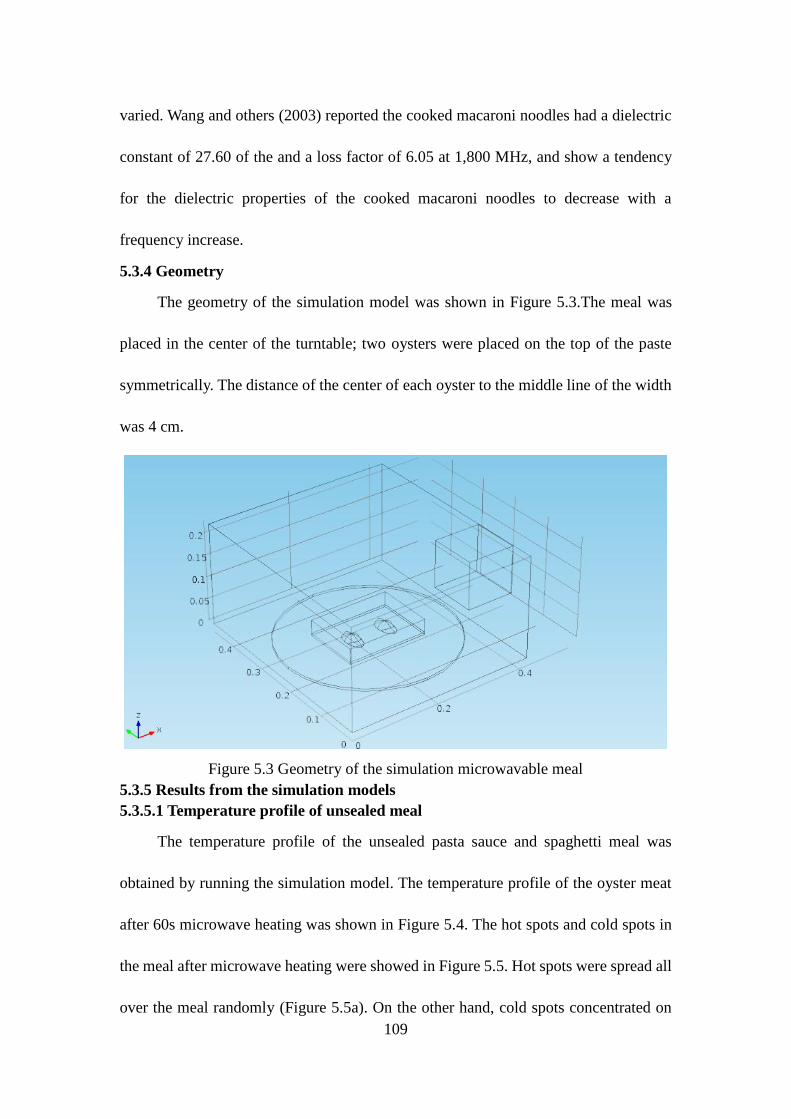
109
varied. Wang and others (2003) reported the cooked macaroni noodles had a dielectric
constant of 27.60 of the and a loss factor of 6.05 at 1,800 MHz, and show a tendency
for the dielectric properties of the cooked macaroni noodles to decrease with a
frequency increase.
5.3.4 Geometry
The geometry of the simulation model was shown in Figure 5.3.The meal was
placed in the center of the turntable; two oysters were placed on the top of the paste
symmetrically. The distance of the center of each oyster to the middle line of the width
was 4 cm.
Figure 5.3 Geometry of the simulation microwavable meal5.3.5 Results from the simulation models5.3.5.1 Temperature profile of unsealed meal
The temperature profile of the unsealed pasta sauce and spaghetti meal was
obtained by running the simulation model. The temperature profile of the oyster meat
after 60s microwave heating was shown in Figure 5.4. The hot spots and cold spots in
the meal after microwave heating were showed in Figure 5.5. Hot spots were spread all
over the meal randomly (Figure 5.5a). On the other hand, cold spots concentrated on
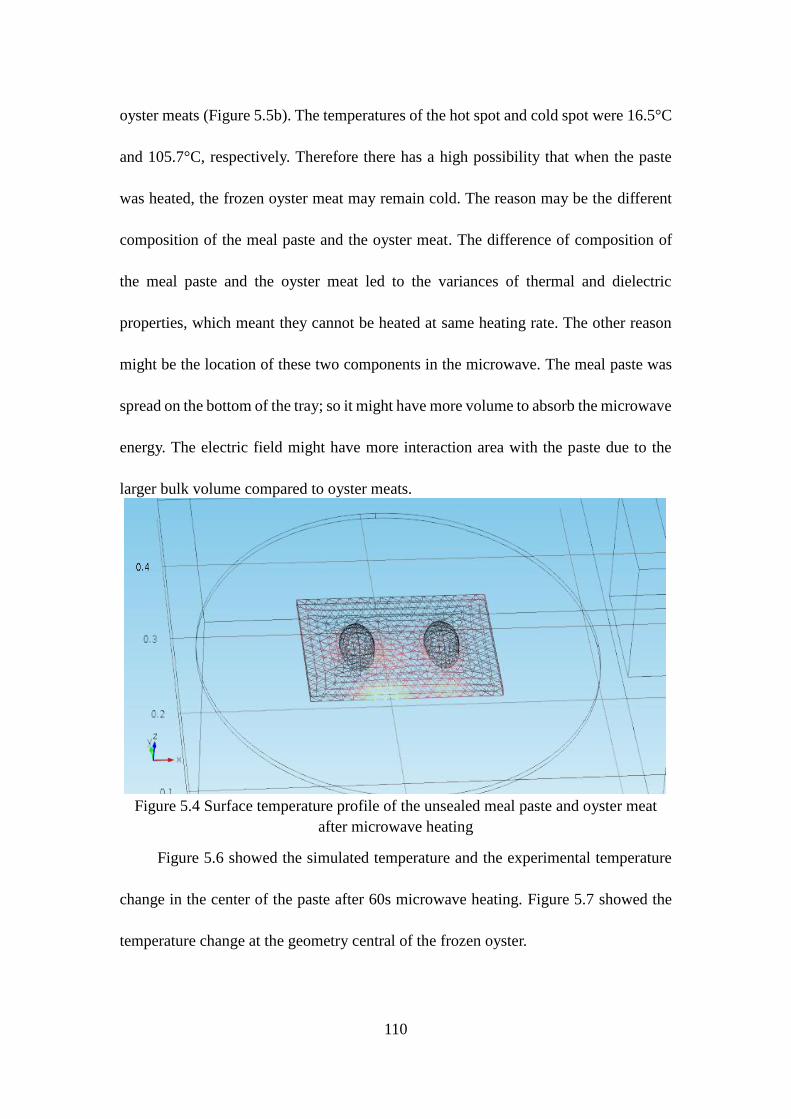
110
oyster meats (Figure 5.5b). The temperatures of the hot spot and cold spot were 16.5°C
and 105.7°C, respectively. Therefore there has a high possibility that when the paste
was heated, the frozen oyster meat may remain cold. The reason may be the different
composition of the meal paste and the oyster meat. The difference of composition of
the meal paste and the oyster meat led to the variances of thermal and dielectric
properties, which meant they cannot be heated at same heating rate. The other reason
might be the location of these two components in the microwave. The meal paste was
spread on the bottom of the tray; so it might have more volume to absorb the microwave
energy. The electric field might have more interaction area with the paste due to the
larger bulk volume compared to oyster meats.
Figure 5.4 Surface temperature profile of the unsealed meal paste and oyster meatafter microwave heating
Figure 5.6 showed the simulated temperature and the experimental temperature
change in the center of the paste after 60s microwave heating. Figure 5.7 showed the
temperature change at the geometry central of the frozen oyster.
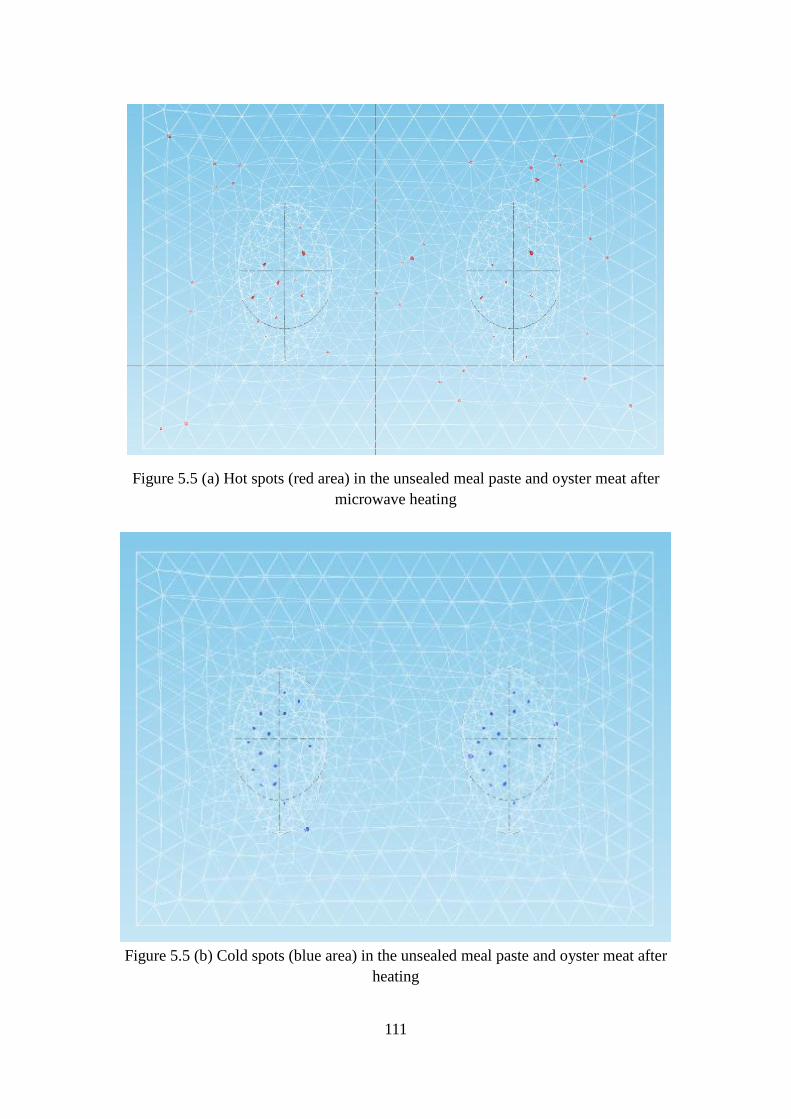
111
Figure 5.5 (a) Hot spots (red area) in the unsealed meal paste and oyster meat aftermicrowave heating
Figure 5.5 (b) Cold spots (blue area) in the unsealed meal paste and oyster meat afterheating
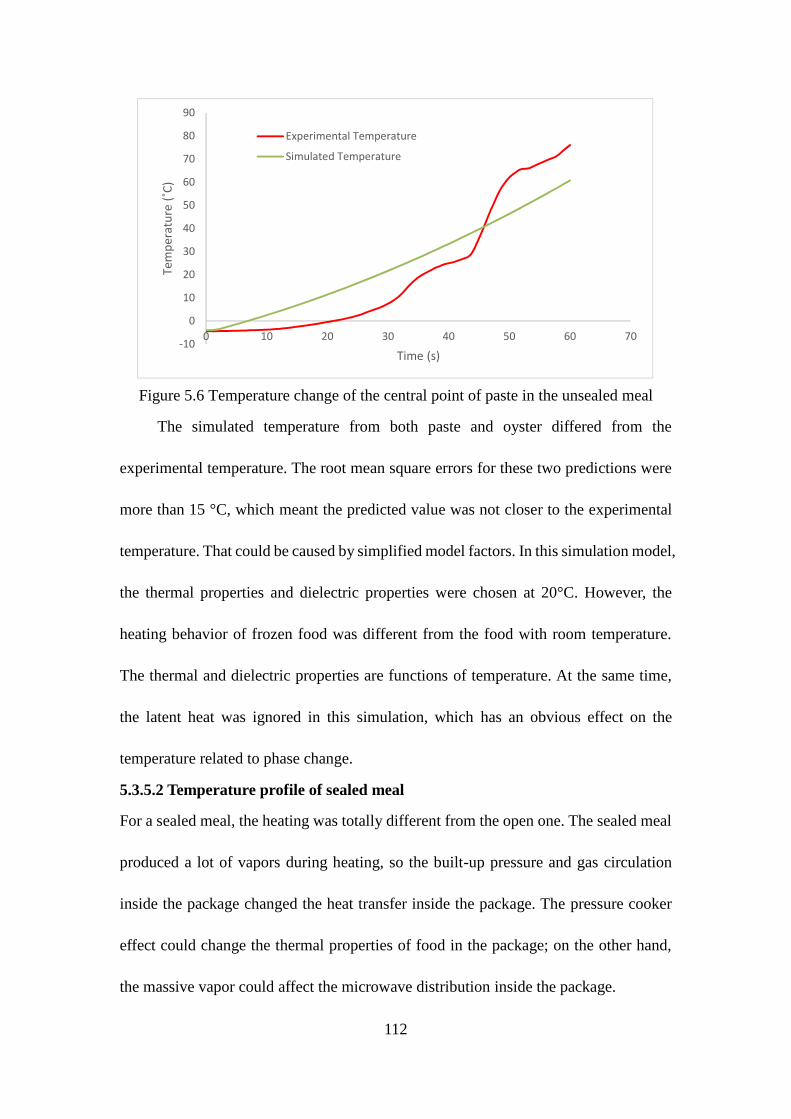
112
Figure 5.6 Temperature change of the central point of paste in the unsealed meal
The simulated temperature from both paste and oyster differed from the
experimental temperature. The root mean square errors for these two predictions were
more than 15 °C, which meant the predicted value was not closer to the experimental
temperature. That could be caused by simplified model factors. In this simulation model,
the thermal properties and dielectric properties were chosen at 20°C. However, the
heating behavior of frozen food was different from the food with room temperature.
The thermal and dielectric properties are functions of temperature. At the same time,
the latent heat was ignored in this simulation, which has an obvious effect on the
temperature related to phase change.
5.3.5.2 Temperature profile of sealed meal
For a sealed meal, the heating was totally different from the open one. The sealed meal
produced a lot of vapors during heating, so the built-up pressure and gas circulation
inside the package changed the heat transfer inside the package. The pressure cooker
effect could change the thermal properties of food in the package; on the other hand,
the massive vapor could affect the microwave distribution inside the package.
-10
0
10
20
30
40
50
60
70
80
90
0 10 20 30 40 50 60 70
Tem
pera
ture
(˚C)
Time (s)
Experimental Temperature
Simulated Temperature
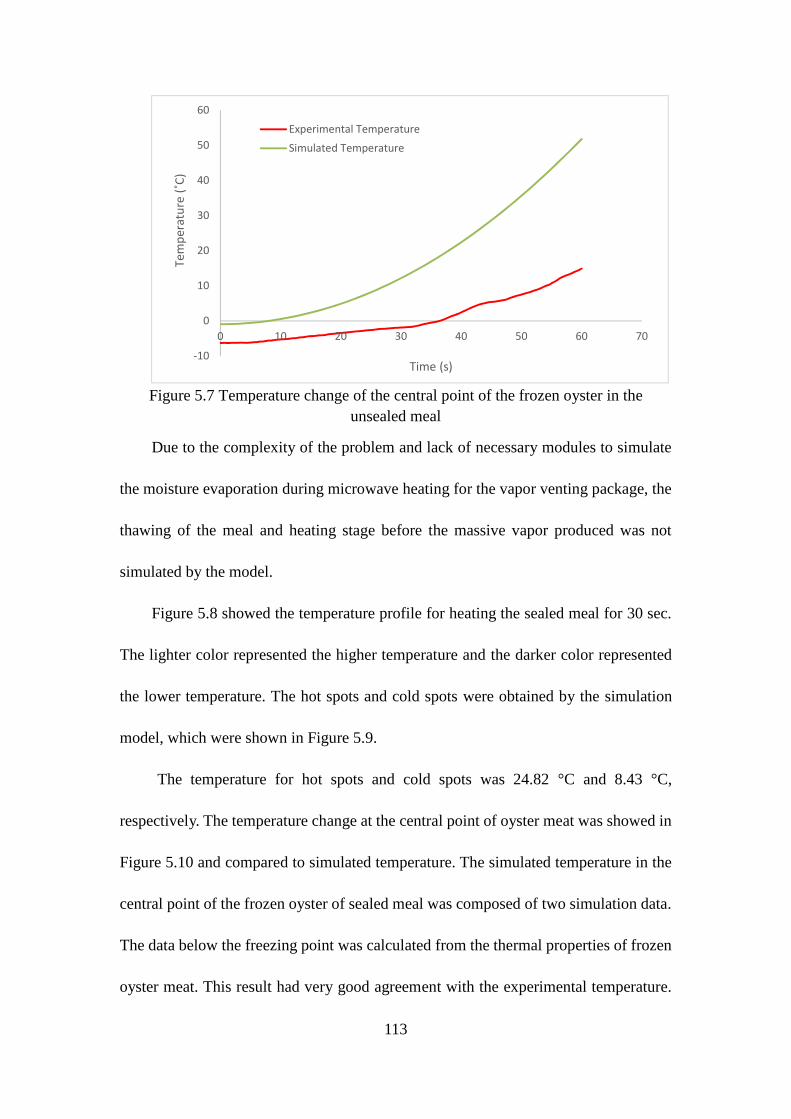
113
Figure 5.7 Temperature change of the central point of the frozen oyster in theunsealed meal
Due to the complexity of the problem and lack of necessary modules to simulate
the moisture evaporation during microwave heating for the vapor venting package, the
thawing of the meal and heating stage before the massive vapor produced was not
simulated by the model.
Figure 5.8 showed the temperature profile for heating the sealed meal for 30 sec.
The lighter color represented the higher temperature and the darker color represented
the lower temperature. The hot spots and cold spots were obtained by the simulation
model, which were shown in Figure 5.9.
The temperature for hot spots and cold spots was 24.82 °C and 8.43 °C,
respectively. The temperature change at the central point of oyster meat was showed in
Figure 5.10 and compared to simulated temperature. The simulated temperature in the
central point of the frozen oyster of sealed meal was composed of two simulation data.
The data below the freezing point was calculated from the thermal properties of frozen
oyster meat. This result had very good agreement with the experimental temperature.
-10
0
10
20
30
40
50
60
0 10 20 30 40 50 60 70
Tem
pera
ture
(˚C)
Time (s)
Experimental TemperatureSimulated Temperature
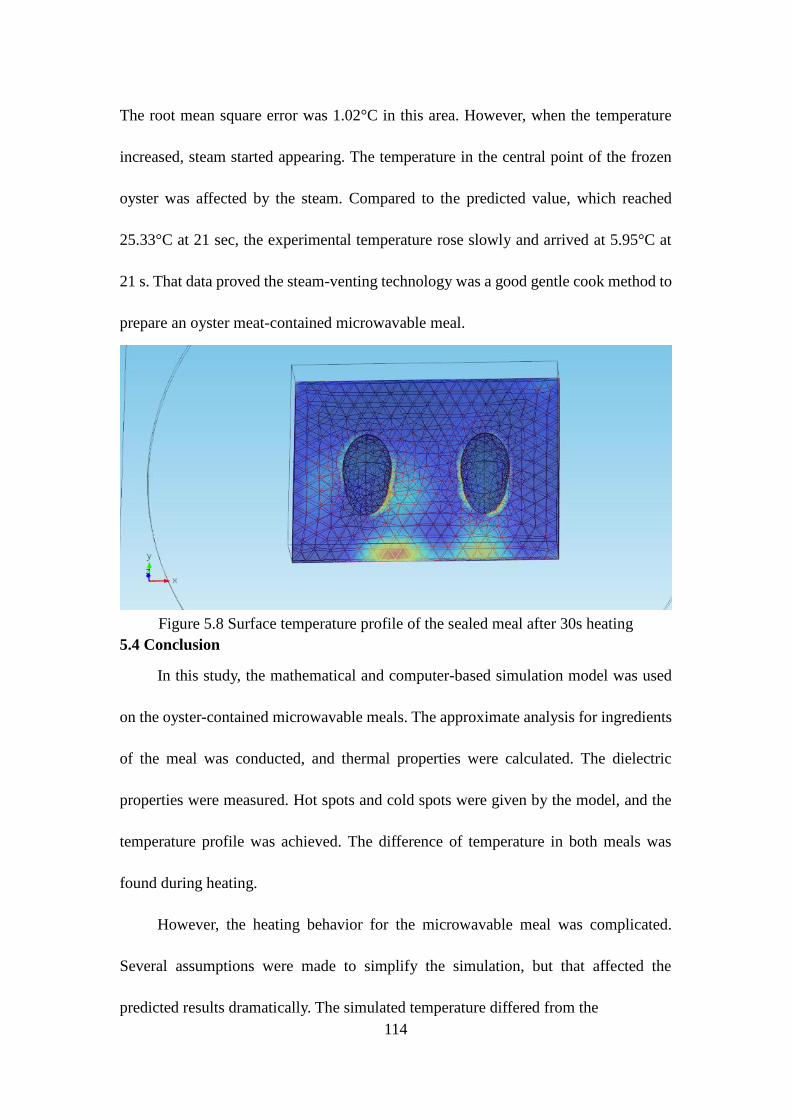
114
The root mean square error was 1.02°C in this area. However, when the temperature
increased, steam started appearing. The temperature in the central point of the frozen
oyster was affected by the steam. Compared to the predicted value, which reached
25.33°C at 21 sec, the experimental temperature rose slowly and arrived at 5.95°C at
21 s. That data proved the steam-venting technology was a good gentle cook method to
prepare an oyster meat-contained microwavable meal.
Figure 5.8 Surface temperature profile of the sealed meal after 30s heating5.4 Conclusion
In this study, the mathematical and computer-based simulation model was used
on the oyster-contained microwavable meals. The approximate analysis for ingredients
of the meal was conducted, and thermal properties were calculated. The dielectric
properties were measured. Hot spots and cold spots were given by the model, and the
temperature profile was achieved. The difference of temperature in both meals was
found during heating.
However, the heating behavior for the microwavable meal was complicated.
Several assumptions were made to simplify the simulation, but that affected the
predicted results dramatically. The simulated temperature differed from the
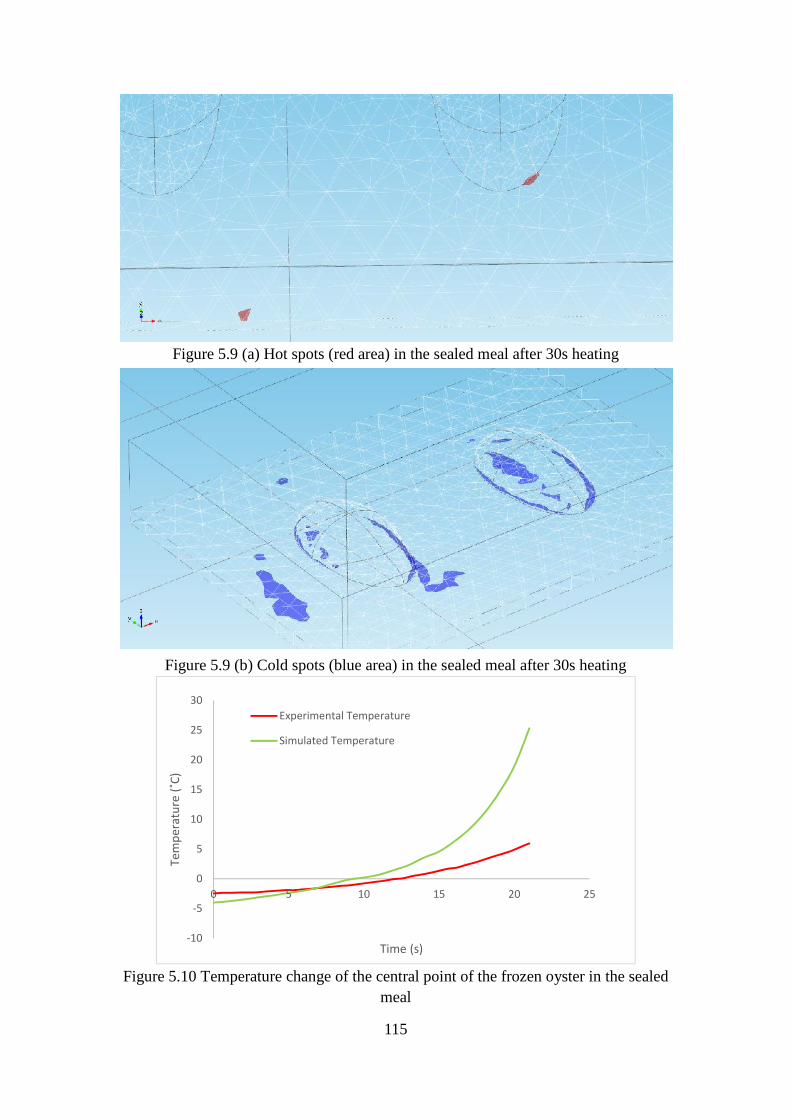
115
Figure 5.9 (a) Hot spots (red area) in the sealed meal after 30s heating
Figure 5.9 (b) Cold spots (blue area) in the sealed meal after 30s heating
Figure 5.10 Temperature change of the central point of the frozen oyster in the sealedmeal
-10
-5
0
5
10
15
20
25
30
0 5 10 15 20 25
Tem
pera
ture
(˚C)
Time (s)
Experimental Temperature
Simulated Temperature
116
experimental temperature in both meal heating studies. Comparing the simulated data
to the experimental data demonstrated the steam-venting technology could help to
improve the heating of microwavable meal and improve the final product quality.
References
AOAC International. (2005). Official methods of analysis of AOAC International (18thed.). Arlington, VA.: AOAC International.
Choi Y, Okos M. 1986. Effects of temperature and composition on the thermalproperties of foods. In: Lemaguer M, Jelen P. Food Engineering and ProcessApplications. Vol.1. Elsevier Applied Science Publishers.
Espinoza-Rodezno, L. A. (2013). DEVELOPMENT OF SAFE AND READY TO EATFROZEN OYSTER PRODUCTS USING MICROWAVE STEAM-VENTINGTECHNOLOGY (Doctoral dissertation). Louisiana State University, Baton Rouge,LA.
Fowle, J., & International, P. (2005). Developments in microwaveable packaging: PiraInternational.
Pitchai, K., et al. (2012). "Coupled electromagnetic and heat transfer model formicrowave heating in domestic ovens." Journal of Food Engineering 112(1–2):100-111.
Mast, R. L. (2000). Microwave retaining package for microwave cooking. United Statesof America: Patent No. 6054698.
Mizrahi, S. (2012). Mechanisms of objectionable textural changes by microwavereheating of foods: A review. Journal of Food Science, 77(1), R57-R62.
Wang, Y., Wig, T.D., Tang, J., Hallberg, L.M. (2003). Dielectric properties of foodsrelevant to RF and microwave pasteurization and sterilization. Journal of FoodEngineering 57 (2003) 257–268
Yam, K. L. & Lai, C. C. (2006). Microwavable Frozen Food or Meals. In Hui (Ed.),Handbook of Food Science, Technology and Engineering, Volume 3 (pp. 113-1 –113-9). Boca Raton, FL: CRC Press.
117
CHAPTER 6 SUMMARY AND CONCLUSIONS
In this study, coupled electromagnetic and heat transfer equations were employed
to develop a mathematical model to predict the temperature distribution. A finite
element method based on commercial software was used to develop a simulation model
for a microwave oven and microwave heating. The simulation result can be used to
profile the temperature distribution during microwave heating.
As one of the most popular types of seafood in the USA, oysters are gathering
people’s attention not only because of their flavor, but also the potential health risks
associated with them. Freezing is an efficient way to eliminate the pathogen in the
oyster. A combination of freezing and microwave heating can provide consumers with
a novel oyster product with better quality and more safety.
The main concern for microwave heating is non-uniform heating. Due to the
unique characteristics of microwave heating, common methods cannot be used to obtain
the temperature information during microwave heating. The numerical method can be
a good tool to understanding the temperature distribution during the heating process.
This study developed a numerical method and computer-based simulation model
to help obtain a better understanding of the heating behavior of oysters and oyster
products in a microwave oven. By employing models, hot spots, cold spots and
temperature distribution of oysters and oyster products can be known easily, and it can
also be used to develop better microwavable products.
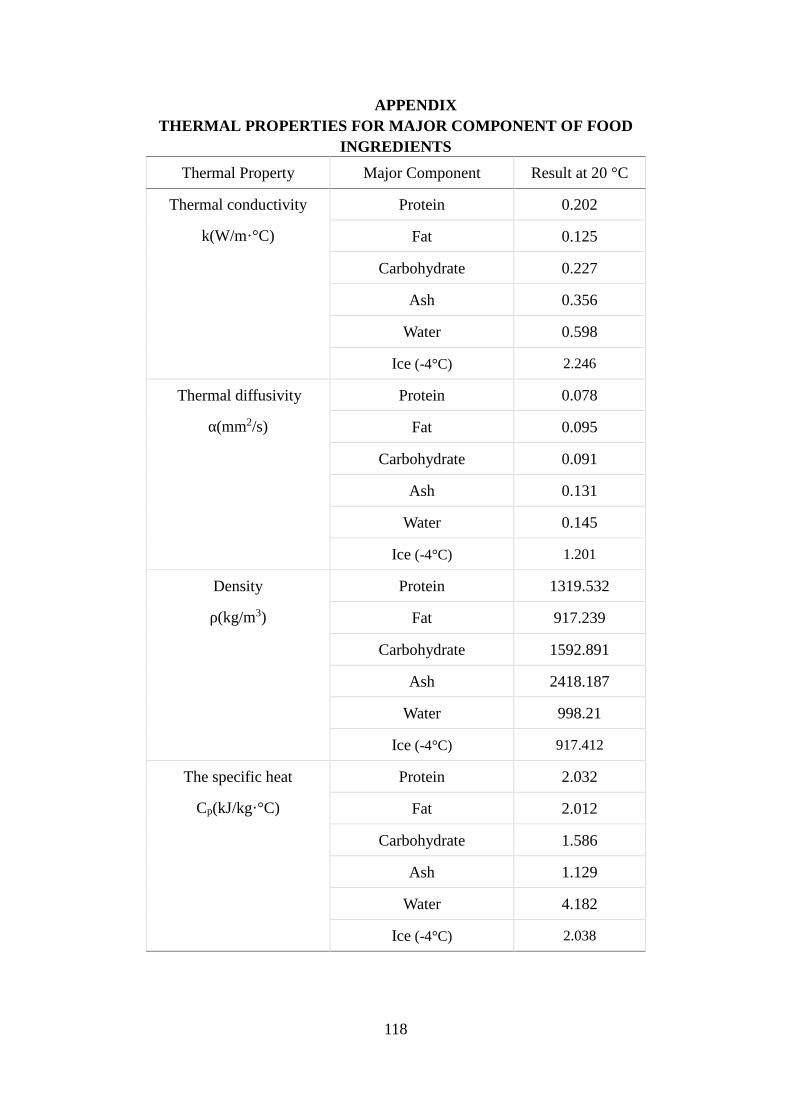
118
APPENDIXTHERMAL PROPERTIES FOR MAJOR COMPONENT OF FOOD
INGREDIENTS
Thermal Property Major Component Result at 20 °C
Thermal conductivity
k(W/m·°C)
Protein 0.202
Fat 0.125
Carbohydrate 0.227
Ash 0.356
Water 0.598
Ice (-4°C) 2.246
Thermal diffusivity
α(mm2/s)
Protein 0.078
Fat 0.095
Carbohydrate 0.091
Ash 0.131
Water 0.145
Ice (-4°C) 1.201
Density
ρ(kg/m3)
Protein 1319.532
Fat 917.239
Carbohydrate 1592.891
Ash 2418.187
Water 998.21
Ice (-4°C) 917.412
The specific heat
Cp(kJ/kg·°C)
Protein 2.032
Fat 2.012
Carbohydrate 1.586
Ash 1.129
Water 4.182
Ice (-4°C) 2.038
119
VITA
Jie Zhang graduated from Sichuan University in Chengdu, China, with a
Bachelor of Science degree in Food Science and Technology in June 2006. He earned
his Master of Science in Food Engineering from Sichuan University, Chengdu, China,
in June 2009. He joined the Department of Food Science at Louisiana State University
as a Ph.D. student under the direction of Dr. Subramaniam Sathivel in August 2010.
He will receive his degree in Food Science in May, 2014. Jie published three refereed
articles and 3 abstracts. Jie was awarded second place and $750 at the 2013 IFT-
Refrigerated and Frozen Foods division graduate student paper competition for
presenting a paper entitled “Mathematical and Computer-based Models for Optimizing
Microwave Heating Process of Frozen Oysters”. Jie won the IFT Gulf Coast Section
scholarship for presenting a paper entitled “Sonication-assisted Fish Oil Extraction with
Application to Fish Processing Byproducts” on the IFT Gulf Coast Section meeting in
April 2012.


![Mathematical Models in Biology - Bio · PDF fileMathematical Models in Biology ... J.D., Mathematical Biology, Springer, 1989, [19] Edelstein-Keshet, Leah, Mathematical models in biology,](https://img.pdfslide.net/doc/110x75/5ab3fe3b7f8b9a7c5b8b587a/mathematical-models-in-biology-bio-models-in-biology-jd-mathematical-biology.jpg)