Embed Size (px)
Citation preview

Mathematical Definitions and Experimentally Verification of the
Torsion Characteristics of Perforated Steel Beams
MARTIN HORÁČEK, JINDŘICH MELCHER Department of Metal and Timber Structures
Brno University of Technology, Faculty of Civil Engineering Veveří 331/95, 602 00 Brno
CZECH REPUBLIC [email protected]; [email protected]; www.fce.vutbr.cz
Abstract: - This paper deals with the problems of analysis and design of perforated thin-walled steel Sigma beams used in the storage systems and expedient flooring structures, in general. The verification of the torsion stiffness is a partial step to determine the ultimate and design strength of beams with respect to lateral torsion buckling. Both types of torsion stiffness (St. Venant and warping torsion stiffness) were examined. First the mathematical definitions for St. Venant torsion parameter It and warping constant Iw are being established. Then both torsion characteristics are verified by tests executed on three different lengths of beams (2, 3, 4 m).
Key-Words: beam, torsion stiffness, web holes, torsion moment, warping, St. Venant torsion parameter,
warping constant, load
1 Introduction The St. Venant torsion constant It and warping constant Iw can be derived according to procedure for the castellated beams from the parameters of the full cross-section and from the cross-section weakened by hole. Based on weighted average of those values the substitute St. Venant torsion constant and warping constant for the whole beam are being established. The calculated pure torsion parameters are verified by tests executed on three different lengths of beams (2, 3 and 4 meters). Totally 30 tests were performed (10 tests per each beam length) in order to verify the pure torsion constant, furthermore 15 tests were performed (5 tests per each beam length) in order to verify the warping constant. The experiments were evaluated and the results are compared with the theoretically calculated values for the substitute cross-section.
2 General
2.1 Sigma beams The Sigma beams (Fig.1) are the mono-symmetric profiles loaded in the plane perpendicular to the axis of symmetry. The application of the Sigma beams is in the built-in floors in warehouses as the floor girders. In the structure the floor girders are bolted through the truss plate to the columns, which support the floor. The floor structure is covered by
the steel grids which are not connected with the floor girders (the beams are not restrained to lateral torsional buckling) or by the chipboards connected to the floor girders with screws (lateral torsional buckling effect is eliminated).
Fig. 1 The arrangement and cross-section of Sigma
beam
3 Theoretical calculation Insomuch that the solution of the pure torsion constant and warping constant for the beams weakened by holes is not verified, the procedure for the castellated beams was used. First, the pure torsion stiffness for the full cross-section (Fig. 2 section A-A) according to Eq. (1) and for the weakened cross-section (Fig.2 section B-B) was determined and subsequently the warping constant for the full cross-section and for weakened cross-section according to Eq. (2) has been calculated:
Advances in Mathematical and Computational Methods
ISBN: 978-1-61804-117-3 91

3
3
1iit tbI ⋅= ∑
dAI
A
w ∫= 2ω
Fig. 2 Designated sections on Sigma beam
In consequence the pure torsion stiffness and warping constant were established for the substitute cross-section based on weighted average of the pure torsion parameter and warping constant for the full cross-section and for the weakened cross
ba
IbIaI
At
theorsubt +
⋅+⋅= ,
,,
ba
bIaI
Aw
theorsubw +
⋅+⋅= ,
,,
where It,A, It,B are St. Venant torsion parameters calculated for the sections A-A and B
Iw,A, Iw,B are warping constants calculated for the sections A-A and B-B;
a,b are dimensions according to Fig. 3
Fig. 3 Web holes configuration
65135
1550652003135I theor,sub,t =
+
⋅+⋅=
9
65135
5736510863135 ,,I theor,sub,w +
⋅+⋅⋅=
4 Experimental verification
4.1 Experiment description Experimental verification of the St. Venant torsion constant and warping constant was executed on the special test equipment (Fig. 4) [1].
)1(
)2(
Designated sections on Sigma beam
In consequence the pure torsion stiffness and warping constant were established for the substitute
section based on weighted average of the pure torsion parameter and warping constant for the full
section and for the weakened cross-section:
I Bt ,
)3(
I Bw,
)4(
are St. Venant torsion parameters
A and B-B; are warping constants calculated for
are dimensions according to Fig. 3
Web holes configuration
41856 mm=
699
1077310
mm, ⋅=⋅
Experimental verification
Experimental verification of the St. Venant torsion constant and warping constant was executed on the
Fig. 4 The test equipment scheme Examined profiles were vertically hanged on the console. In relation to torsion the specimen is supported as a cantilever beam. The top end of the specimen was inserted in between the couple of angle profiles. The attachment of the top beam end to the console was realized by mea8mm), on which the examined profile was hanged (Fig.5). The bottom end is free and it is loaded with the torque which originates from simple couple acting on arm of 600 mm (Fig. 6).
Fig. 5 The specimen hanged on the console
The test equipment scheme
vertically hanged on the console. In relation to torsion the specimen is supported as a cantilever beam. The top end of the specimen was inserted in between the couple of angle profiles. The attachment of the top beam end to the console was realized by means of pin (Ø 8mm), on which the examined profile was hanged (Fig.5). The bottom end is free and it is loaded with the torque which originates from simple couple acting on arm of 600 mm (Fig. 6).
The specimen hanged on the console
Advances in Mathematical and Computational Methods
ISBN: 978-1-61804-117-3 92
The force couple was realized by the calibrated set of 1kg weights hanging on steel cable attached to the rotating loading disc (Fig. 7).
Fig. 6 Load scheme – twisting force couple
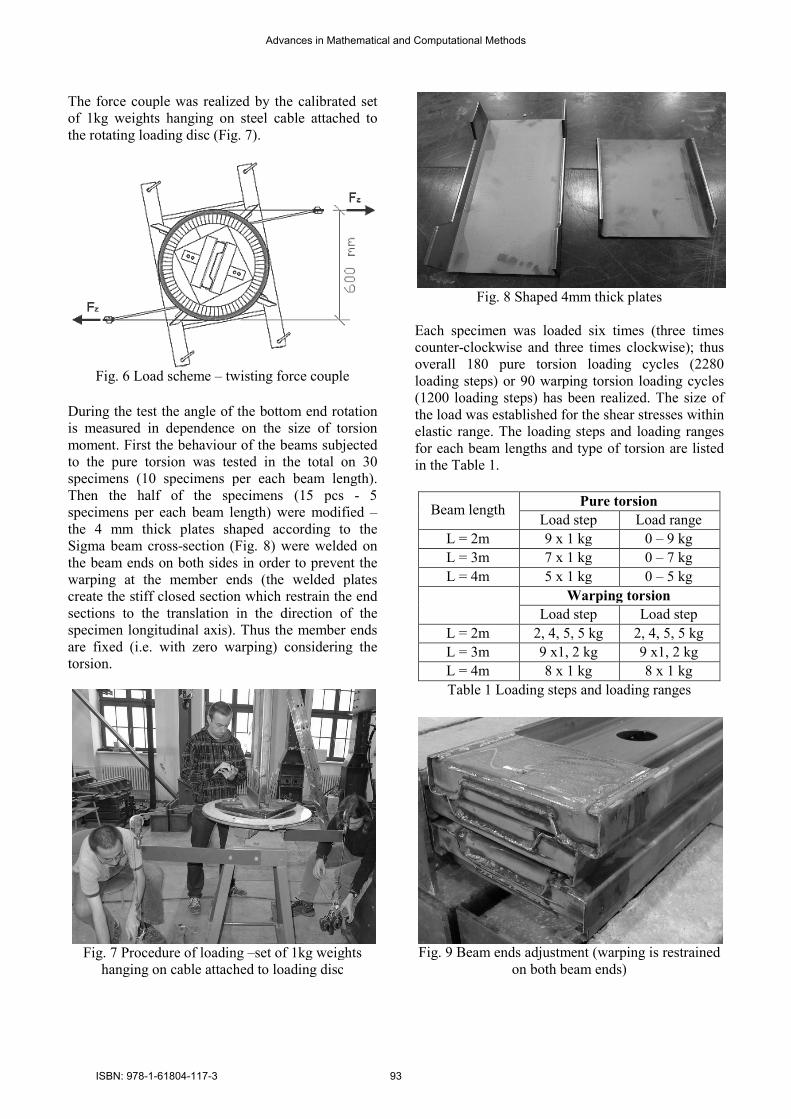
During the test the angle of the bottom end rotation is measured in dependence on the size of torsion moment. First the behaviour of the beams subjected to the pure torsion was tested in the total on 30 specimens (10 specimens per each beam length). Then the half of the specimens (15 pcs specimens per each beam length) were modified the 4 mm thick plates shaped according to the Sigma beam cross-section (Fig. 8) were welded on the beam ends on both sides in order to prevent the warping at the member ends (the welded plates create the stiff closed section which restrain the end sections to the translation in the direction of the specimen longitudinal axis). Thus the member ends are fixed (i.e. with zero warping) considering the torsion.
Fig. 7 Procedure of loading –set of 1kg weights hanging on cable attached to loading disc
was realized by the calibrated set of 1kg weights hanging on steel cable attached to
twisting force couple
During the test the angle of the bottom end rotation is measured in dependence on the size of torsion moment. First the behaviour of the beams subjected to the pure torsion was tested in the total on 30 specimens (10 specimens per each beam length).
he half of the specimens (15 pcs - 5 specimens per each beam length) were modified – the 4 mm thick plates shaped according to the
section (Fig. 8) were welded on the beam ends on both sides in order to prevent the
ds (the welded plates create the stiff closed section which restrain the end sections to the translation in the direction of the specimen longitudinal axis). Thus the member ends are fixed (i.e. with zero warping) considering the
set of 1kg weights
hanging on cable attached to loading disc
Fig. 8 Shaped 4mm thick plates
Each specimen was loaded six times (three times counter-clockwise and three times clockwise); thus overall 180 pure torsion loading cycles loading steps) or 90 warping torsion loading cycles (1200 loading steps) has been realized. The size of the load was established for the shear stresses within elastic range. The loading steps and loading ranges for each beam lengths and type of torsiin the Table 1.
Beam length Load step
L = 2m 9 x 1 kgL = 3m 7 x 1 kgL = 4m 5 x 1 kg
Warping torsion
Load stepL = 2m 2, 4, 5, 5 kgL = 3m 9 x1, 2 kg L = 4m 8 x 1 kgTable 1 Loading steps and loading ranges
Fig. 9 Beam ends adjustment (warping is restrained on both beam ends)
Shaped 4mm thick plates
Each specimen was loaded six times (three times
clockwise and three times clockwise); thus overall 180 pure torsion loading cycles (2280 loading steps) or 90 warping torsion loading cycles (1200 loading steps) has been realized. The size of the load was established for the shear stresses within elastic range. The loading steps and loading ranges for each beam lengths and type of torsion are listed
Pure torsion
Load step Load range 9 x 1 kg 0 – 9 kg 7 x 1 kg 0 – 7 kg 5 x 1 kg 0 – 5 kg Warping torsion
Load step Load step 2, 4, 5, 5 kg 2, 4, 5, 5 kg 9 x1, 2 kg 9 x1, 2 kg 8 x 1 kg 8 x 1 kg
Loading steps and loading ranges
Beam ends adjustment (warping is restrained
on both beam ends)
Advances in Mathematical and Computational Methods
ISBN: 978-1-61804-117-3 93

4.2 Evaluation of the pure torsion
experiments The process of the loading is recorded in chart as a dependence of the force Fz [N] on the angle of rotation φz [ °] (rotation of the bottom beam end related to the top end). In the Fig. 10 the loading process of the beams is displayed for beam lengths 2, 3 and 4 meters. In the chart are also drawn in the lines representing the theoretical St. Venant torsion constant values for the substitute cross-section.
Fig. 10 The recorded loading processes of the beams
during pure torsion experiments The St. Venant torsion parameter is calculated according to the Eq. (5). The principle of St. Venant torsion parameter calculation on the basis of the performed experiments is described in [2, 3, 4, 5].
it
iiZ
IG
lMrad
,, ][
⋅
⋅∆=∆ϕ
)5(
In the Table 2 the resulting St. Venant torsion parameters calculated from the loading processes of the individual specimens are displayed.
Beams L = 2m
It [mm4]
Beams L = 3m
It [mm4]
Beams L = 4m
It [mm4]
T-T1-2 2101 T-T1-3 2141 T-T1-4 2147
T-T2-2 2153 T-T2-3 2151 T-T2-4 2250
T-T3-2 2095 T-T3-3 2088 T-T3-4 2308
T-T4-2 2100 T-T4-3 2152 T-T4-4 2264
T-T5-2 2057 T-T5-3 2141 T-T5-4 2258
T-T6-2 2104 T-T6-3 2113 T-T6-4 2302
T-T7-2 2047 T-T7-3 2100 T-T7-4 2293
T-T8-2 2101 T-T8-3 2111 T-T8-4 2206
T-T9-2 2082 T-T9-3 2096 T-T9-4 2242
T-T10-2 2070 T-T10-3 2125 T-T10-4 2258
Average 2091 2122 2253
Table 2 Overview of resulting St. Venant torsion constants
The bottom ranges of the loading processes (Fz between 10 and 30 N) were taken into the account only (the pure torsion constant is derived for the smaller angles of rotation which are more corresponding to the angles of rotation achieved during the warping torsion experiments). The comparison of the average values derived from the tests for each beam length with the theoretically calculated value for the substitute cross-section is mentioned in the Fig. 11.
Fig. 11 Comparison of resulting St. Venant torsion
constants with the value for the substitute cross-section
4.3 Evaluation of the warping torsion
experiments In the Fig. 12 the loading processes recorded during the warping torsion experiments of specific specimens with different beam length are displayed. From the chart follows that the loading processes are linear.
Fig. 12 The recorded loading process of the specimens during the warping torsion tests
The differential equation describing the angle of rotation of the thin-walled beam during the warping torsion is mentioned in Eq. (6).
mIGIE IIT
IVw =⋅⋅−⋅⋅ ϕϕ )6(
2 091
(+13%)
2 122
(+14%)
2 253
(+21%)
1 856
0
500
1,000
1,500
2,000
2,500
It,L2,exp It,L3,exp It,L4,exp It,sub,theor
I t[m
m4]
Specimen L=4m (T8-4W)
Specimen L=3m (T6-3W)
Specimen L=2m (T6-2W)
0
20
40
60
80
100
120
140
160
180
0.0 2.0 4.0 6.0 8.0 10.0 12.0 14.0 16.0
FZ
[N
]
ϕZ [° ]
Advances in Mathematical and Computational Methods
ISBN: 978-1-61804-117-3 94

where m is intensity of torsion load. E is Young's modulus, G is shear modulus. Introducing torsion parameter k defined in Eq. (7)
w
t
IE
IGlk
⋅
⋅=
the differential equation (Eq.6) can be modified to:
w
IIIV
IE
m
l
k
⋅=⋅− ϕϕ
2
2
The Eq. (8) is the simple differential equation of fourth order with constant coefficientsof this differential equation for the thinmember of open cross-section with the fixed ends considering the torsion (zero end warping) under loading with the opposite torsion moment M (Fig. 13) leads to the Eq.(9) [6, 7], where therotation during the warping torsion is
−⋅
=cosh
sinh
k
lz
IG
M
t
zϕ
where M is torsion moment, G is shear modulus, It is St. Venant torsion constant, z is distance measured from the middle
of the span to the examined l is the beam length, k is a torsion parameter calculated
according to Eq. (7),
Fig. 13 Scheme of the beam loaded on both ends with opposite torsion moment
The angle of rotation in Eq. (9) is measured on the length corresponding to the half of the specimen length (Fig. 14A - in this specific case the angle of rotation is in the middle of the span zero). In our case the angle of rotation on the top end of the beam is zero and on the bottom end the angle rotation is double times higher than the angle in Eq. (14B).
is intensity of torsion load.
defined in Eq. (7),
)7(
can be modified to:
)8(
differential equation of fourth order with constant coefficients. The solution
equation for the thin-walled with the fixed ends
considering the torsion (zero end warping) under posite torsion moment M (Fig.
, where the angle of rotation during the warping torsion is calculated:
2cosh
k
zl
k
( )9
is St. Venant torsion constant, is distance measured from the middle of the span to the examined section,
is a torsion parameter calculated
Scheme of the beam loaded on both ends
with opposite torsion moment
) is measured on the of the specimen
in this specific case the angle of rotation is in the middle of the span zero). In our case the angle of rotation on the top end of the beam is zero and on the bottom end the angle rotation is
n the angle in Eq. (9) (Fig.
Fig. 14 The course of the angle rotatibeams
By substituting the Eq. (7) into the Eq. (one unknown variable in this equation is the warping constant Iw, which can be iteratively calculated - the warping constant is iteratively substituted into the Eq. (9) until the of rotation calculated according to this equation is matching the angle of rotation measured for the considered value of the torsion moment during the warping torsion experiments. The table 3 is summarizing the experimentally verified valuethe warping constants on the basis of performed tests. The comparison of the average values derived from the tests for each beam length with the theoretically calculated value for the substitute cross-section is mentioned in the Fig. 15figure follows that the warping constant is slightly decreasing with the increasing beam length.
Beams L = 2m
Iw x 109
[mm6] Beams L = 3m
T6-2W 4,364 T6-3W
T7-2W 4,454 T7-3W
T8-2W 4,365 T8-3W
T9-2W 4,552 T9-3W
T10-2W 4,528 T10-3W
Average 4,453
Table 3 Overview of resulting warping constants
Fig. 15 Comparison of resulting warping constants with the value for the substitute cross
4,453
(+18%)4,330
(+15%)
0.00
1.00
2.00
3.00
4.00
5.00
Iw,L2,exp Iw,L3,exp
I wx
10
9[m
m6]
The course of the angle rotation on the
beams
By substituting the Eq. (7) into the Eq. (9), the only one unknown variable in this equation is the
, which can be iteratively the warping constant is iteratively
) until the resulting angle of rotation calculated according to this equation is matching the angle of rotation measured for the considered value of the torsion moment during the warping torsion experiments. The table 3 is summarizing the experimentally verified values of the warping constants on the basis of performed tests. The comparison of the average values derived from the tests for each beam length with the theoretically calculated value for the substitute
tion is mentioned in the Fig. 15. From this ure follows that the warping constant is slightly
decreasing with the increasing beam length.
Iw x 109
[mm6] Beams L = 4m
Iw x 109
[mm6]
4,299 T6-4W 4,172
4,360 T7-4W 4,103
4,247 T8-4W 4,199
4,330 T9-4W 4,144
4,414 T10-4W 4,158
4,330 4,155
Overview of resulting warping constants
Comparison of resulting warping constants
with the value for the substitute cross-section
4,330
(+15%)4,155
(+10%)3.770
Iw,L3,exp Iw,L4,exp Iw,sub,theor
Advances in Mathematical and Computational Methods
ISBN: 978-1-61804-117-3 95

5 Conclusion In this paper the mathematical description and experimental examination of the thin-walled steel beams behaviour subjected to the pure and warping torsion are reported. The main conclusions of the research are:
1. The behaviour of the beams subjected to the pure torsion has a nonlinear character (the relationship between the angle of rotation and the torsion moment is considerably nonlinear). This nonlinearity is mainly caused by the excessive deformations of the beam and related diaphragm stresses.
2. In case of the beams subjected to the warping torsion (the ends of the beam are adjusted so that the warping is restrained on both member ends) the behaviour shows the linear progress (the relationship between the angle of rotation and the torsion moment is linear).
3. The St. Venant torsion parameters derived on the basis of performed pure torsion experiments are slightly increasing with the increasing beam length. The values of the St. Venant torsion parameters are approximately from 12% (L = 2m) up to 22% (L = 4m) higher in comparison with the theoretical value It,sub,theor calculated for the substitute cross-section.
4. The warping constants calculated on the basis of performed warping torsion tests are slightly decreasing with the increasing beam length. The values of the warping constants are approximately from 10% (L = 4m) up to 18% (L = 2m) higher in comparison with the theoretical value Iw,sub theor calculated for the substitute cross-section.
Acknowledgment:
This paper has been elaborated within the support of the Projects of MSMT No. FAST-J-11-5/1174, No. 1M0579 (CIDEAS Research center) and GACR reg. No. P105/12/0314.
References:
[1] Melcher J. Real Behaviour of the Centric
Compression Lattice Bars (Skutečné
působení členěných centricky tlačených
prutů), Final report of research project P-12-124-003-02/3.c, VUT Brno, Brno, 1975.
[2] Horáček M, Melcher J. “St. Venant Torsion Stiffness of Thin-walled Beams with Holes”, Proceedings of 6th European Conference on
Steel and Composite Structures held in
Budapest, Hungary, Vol. A, ECCS, Hungary, 141-146, 2011.
[3] Horáček M, Melcher J. Experimental
verification of pure torsion stiffness of thin-
walled beam with holes, Report 2.5.2.1.P12 of research centre CIDEAS, project 1M0579, VUT Brno, 2010.
[4] Horáček M, Melcher J. Torsion stiffness of
thin-walled steel beams, Report 2.5.2.1.P28 of research centre CIDEAS, project 1M0579, VUT Brno, 2011.
[5] Horáček M, Melcher J. “St. Venant Torsion Stiffness of Thin-walled Steel Beams with Web Holes”, Proceedings of the 5th WSEAS
International Conference on Engineering
Mechanics, Structures, Engineering Geology
(EMESEG'12) held in Cambridge, UK, WSEAS Press, Cambridge, 103-108, 2012.
[6] Vlasov V, Z. Thin-Walled Elastic Bars
(Tenkostěnné pružné pruty), SNTL, Prague, 1962.
[7] Svoboda M, Melcher J. Selected Topics of
Steel Structure Elements (Vybrané stati prvků
ocelových konstrukcí), VUT Brno, Brno, 1967.
[8] Březina V. Buckling Resistance of Metal Bars
and Beams (Vzpěrná únosnost kovových prutů
a nosníků), Czechoslovak Academy of Sciences Publishing, Prague, 1962.
[9] Panc V. Structural Analysis of Thin-Walled
beams and structures (Statika tenkostěnných
prutů a konstrukcí), Czechoslovak Academy of Sciences Publishing, Prague, 1959.
Advances in Mathematical and Computational Methods
ISBN: 978-1-61804-117-3 96