Embed Size (px)
Citation preview
1
MathematicalEpidemiology
ofInfectiousDiseases
David EarnMcMaster University
•Background•Describing epidemics•Modelling epidemics•Predicting epidemics•Manipulating epidemics
•Background•Describing epidemics•Modelling epidemics•Predicting epidemics•Manipulating epidemics
2
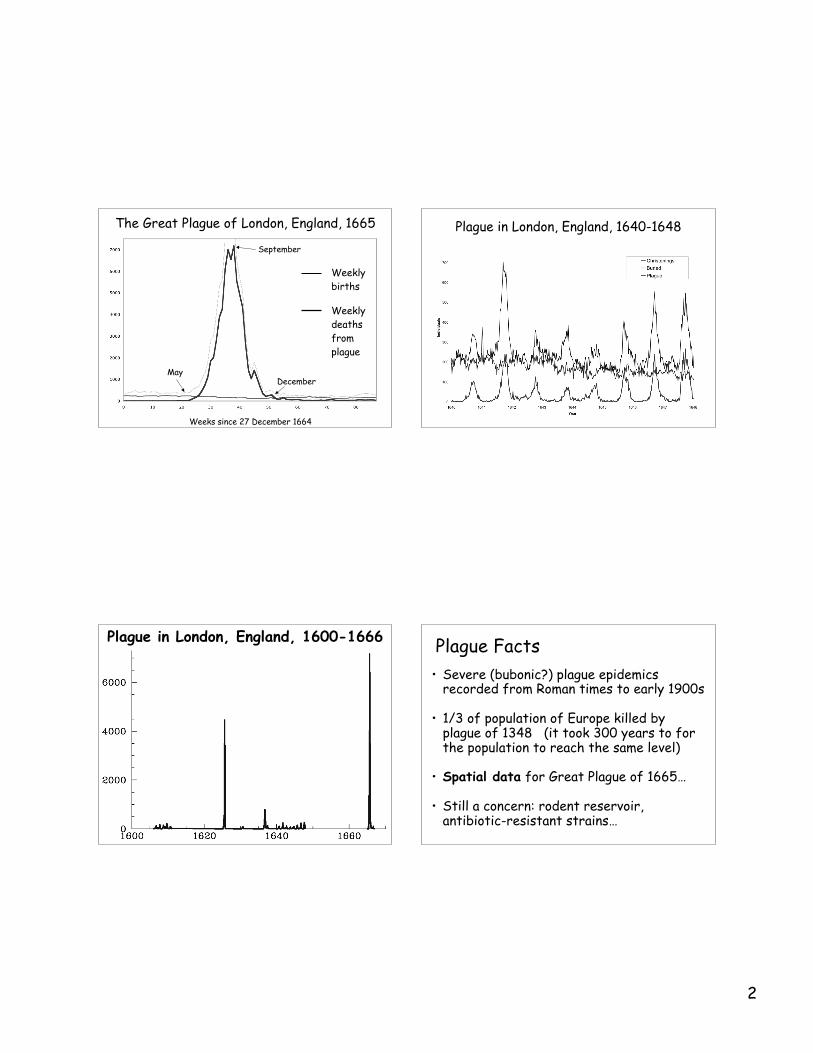
The Great Plague of London, England, 1665
Weeks since 27 December 1664
May
Weeklybirths
Weeklydeathsfromplague
December
September
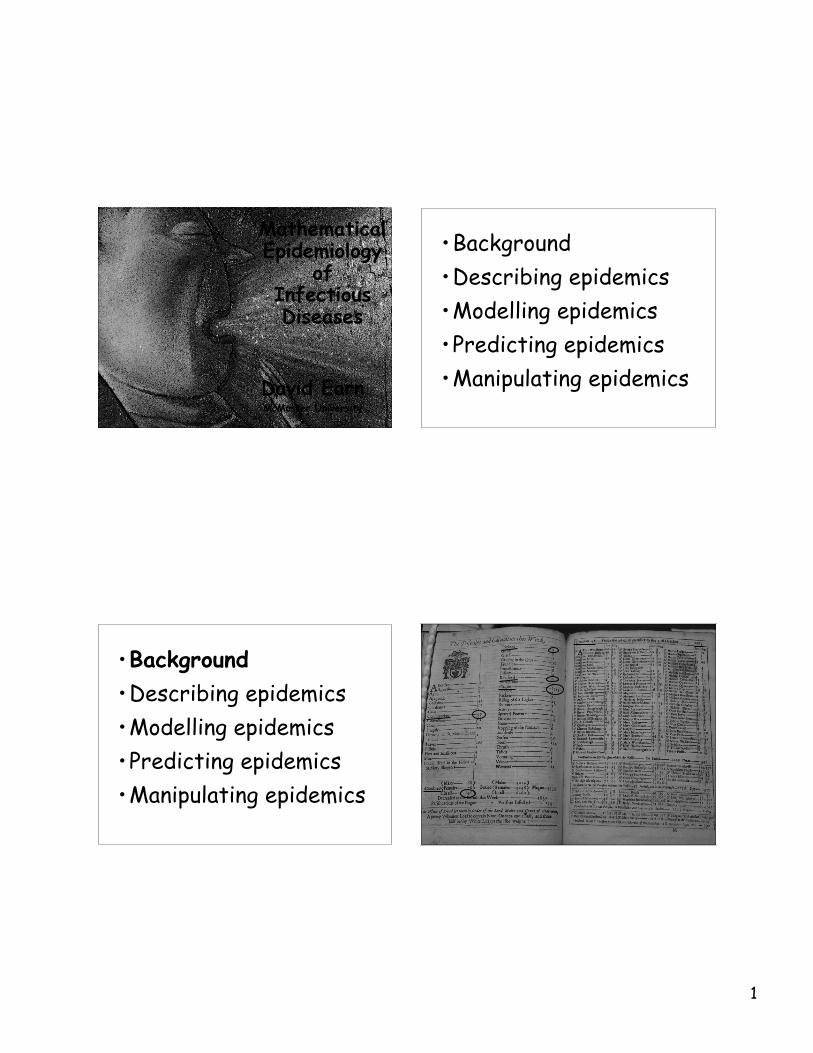
Plague in London, England, 1640-1648
Plague in London, England, 1600-1666 Plague Facts• Severe (bubonic?) plague epidemics
recorded from Roman times to early 1900s
• 1/3 of population of Europe killed byplague of 1348 (it took 300 years to forthe population to reach the same level)
• Spatial data for Great Plague of 1665…
• Still a concern: rodent reservoir,antibiotic-resistant strains…
3
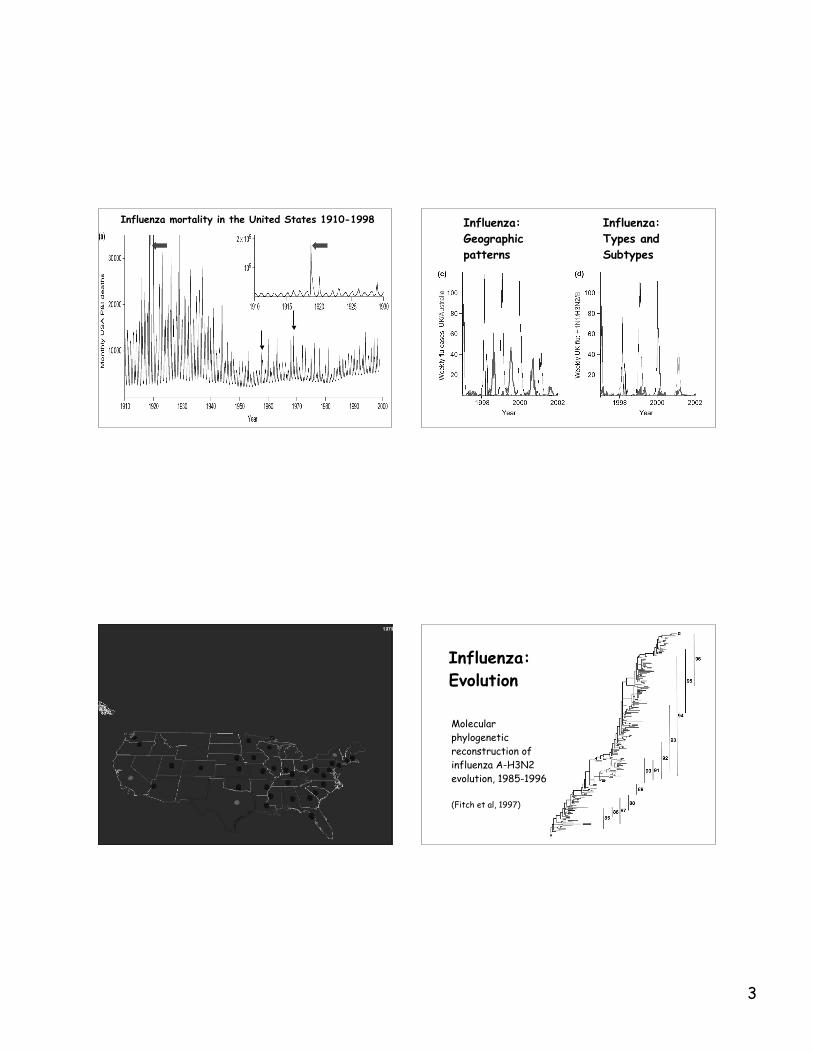
Influenza mortality in the United States 1910-1998 Influenza:Geographicpatterns
Influenza:Types andSubtypes
Influenza:Evolution
Molecularphylogeneticreconstruction ofinfluenza A-H3N2evolution, 1985-1996
(Fitch et al, 1997)
4
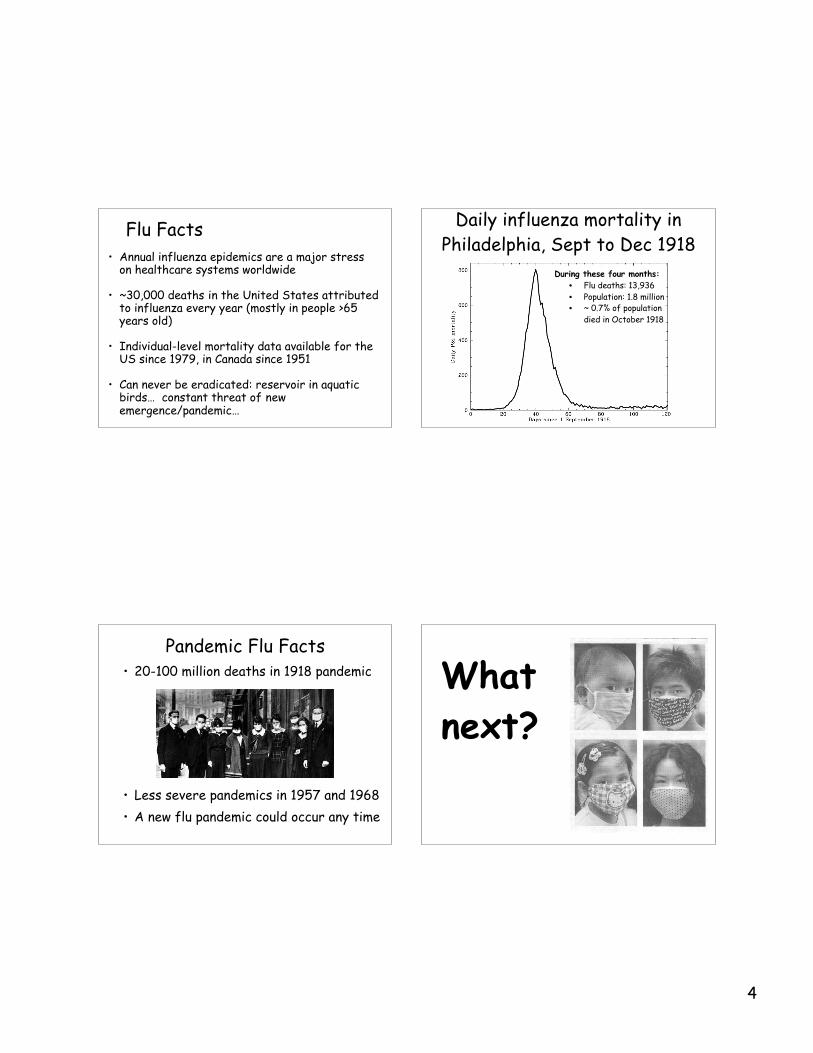
Flu Facts• Annual influenza epidemics are a major stress
on healthcare systems worldwide
• ~30,000 deaths in the United States attributedto influenza every year (mostly in people >65years old)
• Individual-level mortality data available for theUS since 1979, in Canada since 1951
• Can never be eradicated: reservoir in aquaticbirds… constant threat of newemergence/pandemic…
Daily influenza mortality inPhiladelphia, Sept to Dec 1918
During these four months:• Flu deaths: 13,936• Population: 1.8 million• ~ 0.7% of population
died in October 1918
Pandemic Flu Facts• 20-100 million deaths in 1918 pandemic
• Less severe pandemics in 1957 and 1968• A new flu pandemic could occur any time
http://www.glacombe.com/flu.html
Whatnext?
5
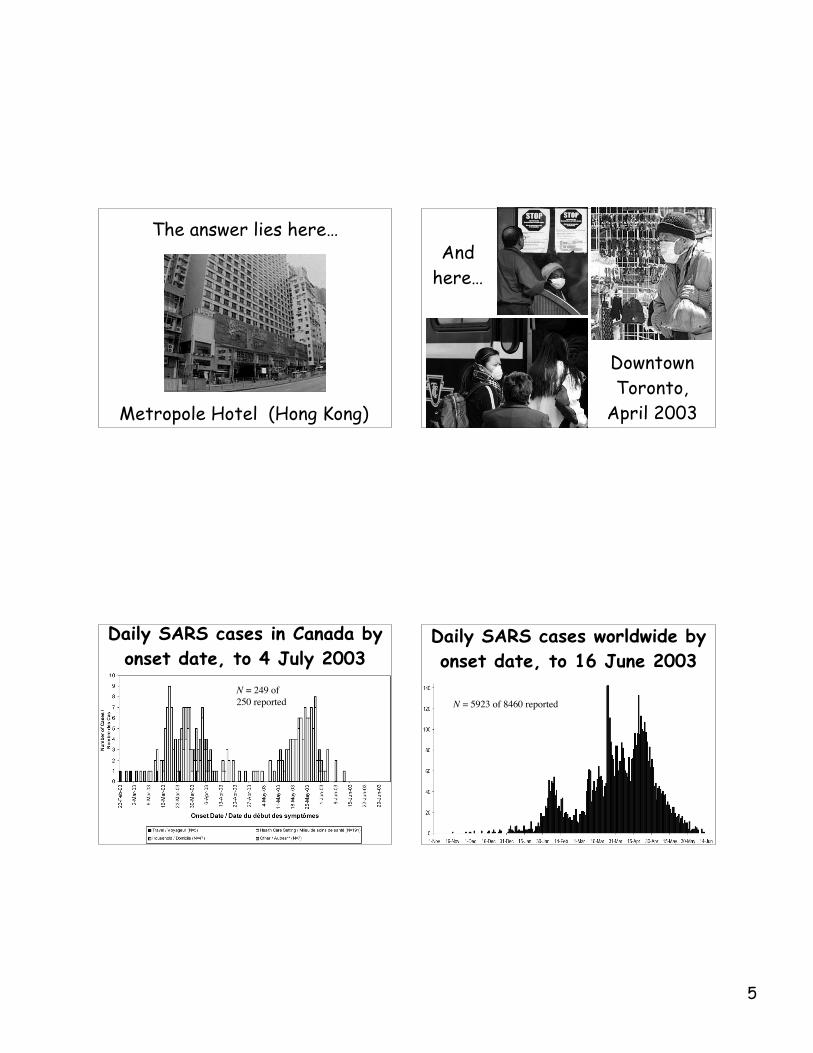
Metropole Hotel (Hong Kong)
The answer lies here…And
here…
DowntownToronto,
April 2003
Daily SARS cases in Canada byonset date, to 4 July 2003
N = 249 of 250 reported
Daily SARS cases worldwide byonset date, to 16 June 2003
N = 5923 of 8460 reported
6
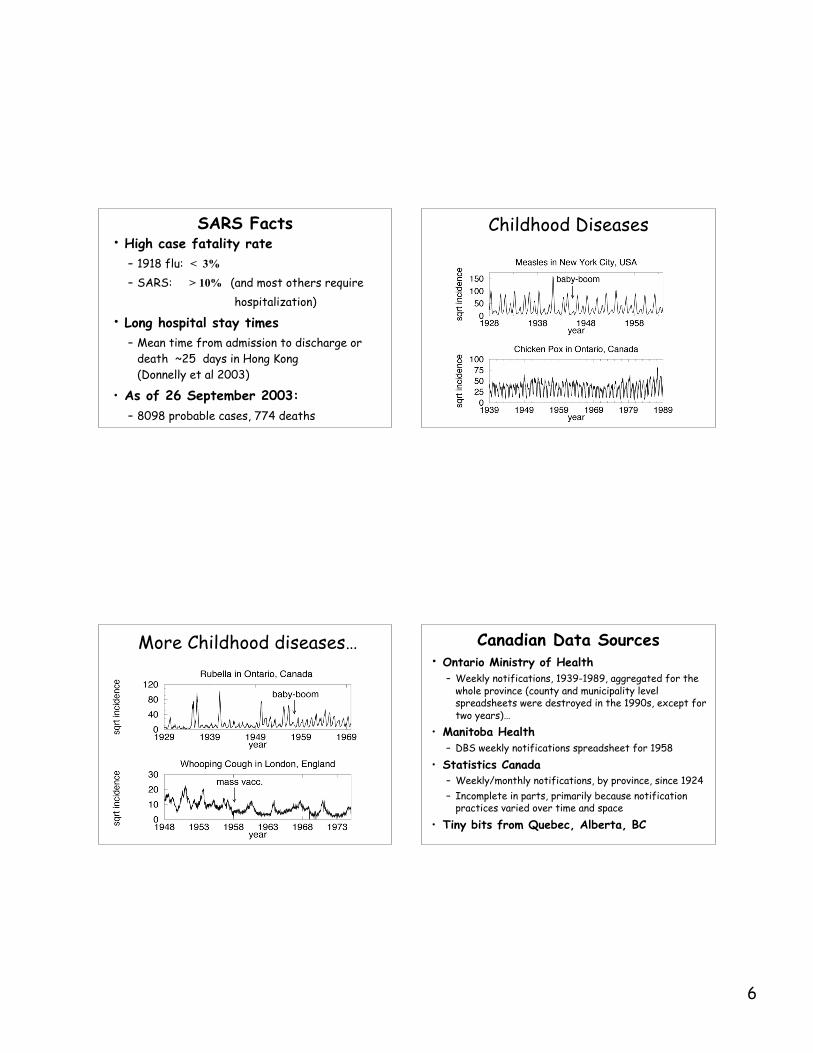
SARS Facts• High case fatality rate
– 1918 flu: < 3%
– SARS: > 10% (and most others require hospitalization)
• Long hospital stay times– Mean time from admission to discharge or
death ~25 days in Hong Kong(Donnelly et al 2003)
• As of 26 September 2003:– 8098 probable cases, 774 deaths
Childhood Diseases
More Childhood diseases… Canadian Data Sources• Ontario Ministry of Health
– Weekly notifications, 1939-1989, aggregated for thewhole province (county and municipality levelspreadsheets were destroyed in the 1990s, except fortwo years)…
• Manitoba Health– DBS weekly notifications spreadsheet for 1958
• Statistics Canada– Weekly/monthly notifications, by province, since 1924– Incomplete in parts, primarily because notification
practices varied over time and space• Tiny bits from Quebec, Alberta, BC
7
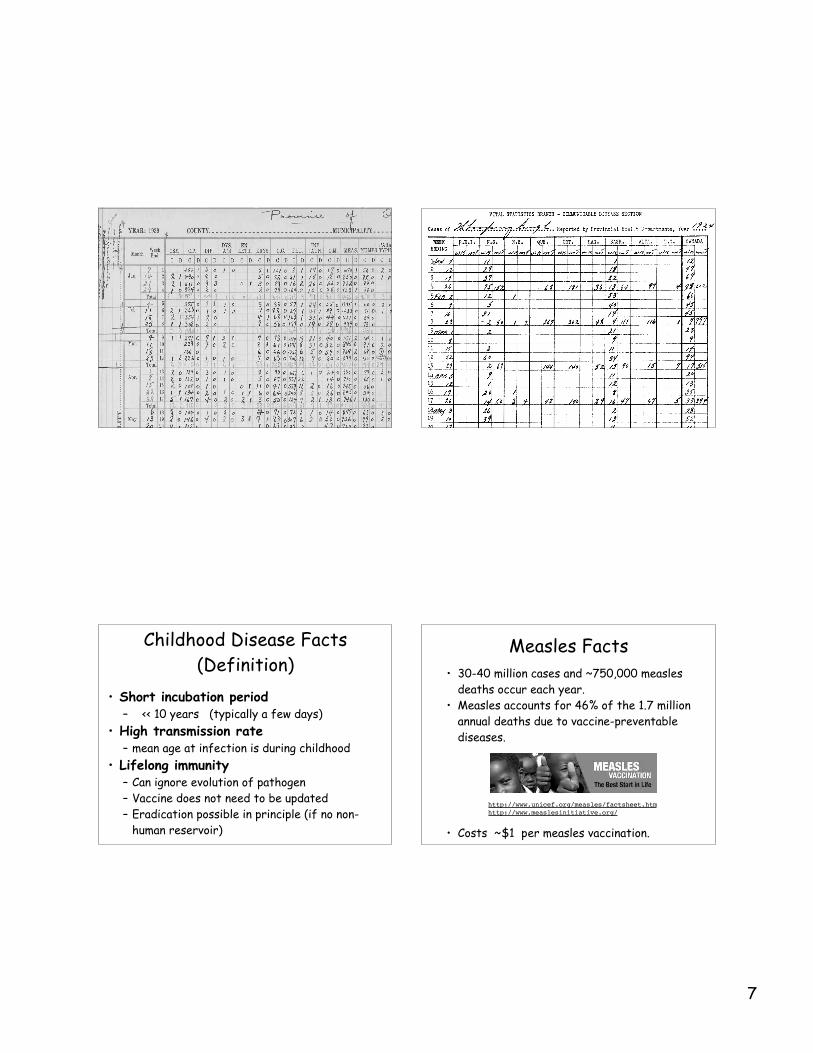
Childhood Disease Facts(Definition)
• Short incubation period– << 10 years (typically a few days)
• High transmission rate– mean age at infection is during childhood
• Lifelong immunity– Can ignore evolution of pathogen– Vaccine does not need to be updated– Eradication possible in principle (if no non-
human reservoir)
http://www.glacombe.com/flu.html
Measles Facts• 30-40 million cases and ~750,000 measles
deaths occur each year.• Measles accounts for 46% of the 1.7 million
annual deaths due to vaccine-preventablediseases.
• Costs ~$1 per measles vaccination.
Polio, tetanus,pertussis,diptheria, HiB, andyellow fevertogether accountfor the remainingvaccine-preventabledeaths.
http://www.unicef.org/measles/factsheet.htmhttp://www.measlesinitiative.org/
8
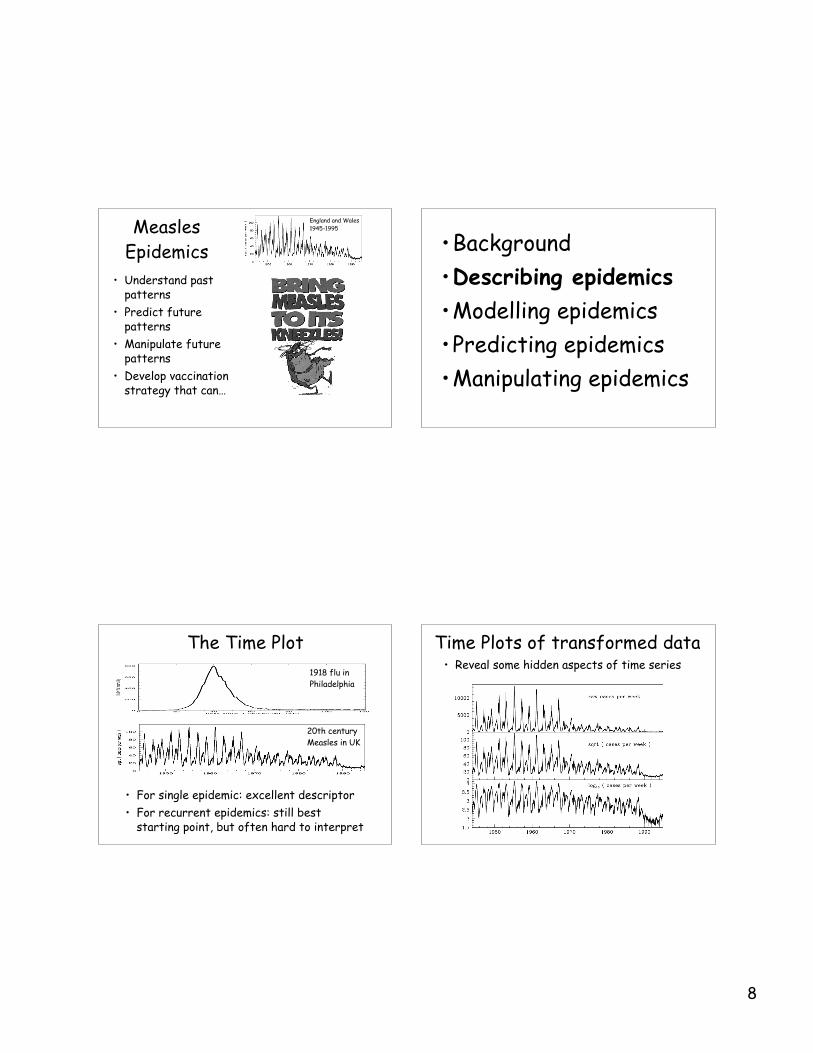
MeaslesEpidemics
• Understand pastpatterns
• Predict futurepatterns
• Manipulate futurepatterns
• Develop vaccinationstrategy that can…
England and Wales1945-1995
•Background•Describing epidemics•Modelling epidemics•Predicting epidemics•Manipulating epidemics
The Time Plot
• For single epidemic: excellent descriptor• For recurrent epidemics: still best
starting point, but often hard to interpret
1918 flu inPhiladelphia
20th centuryMeasles in UK
Time Plots of transformed data• Reveal some hidden aspects of time series
9
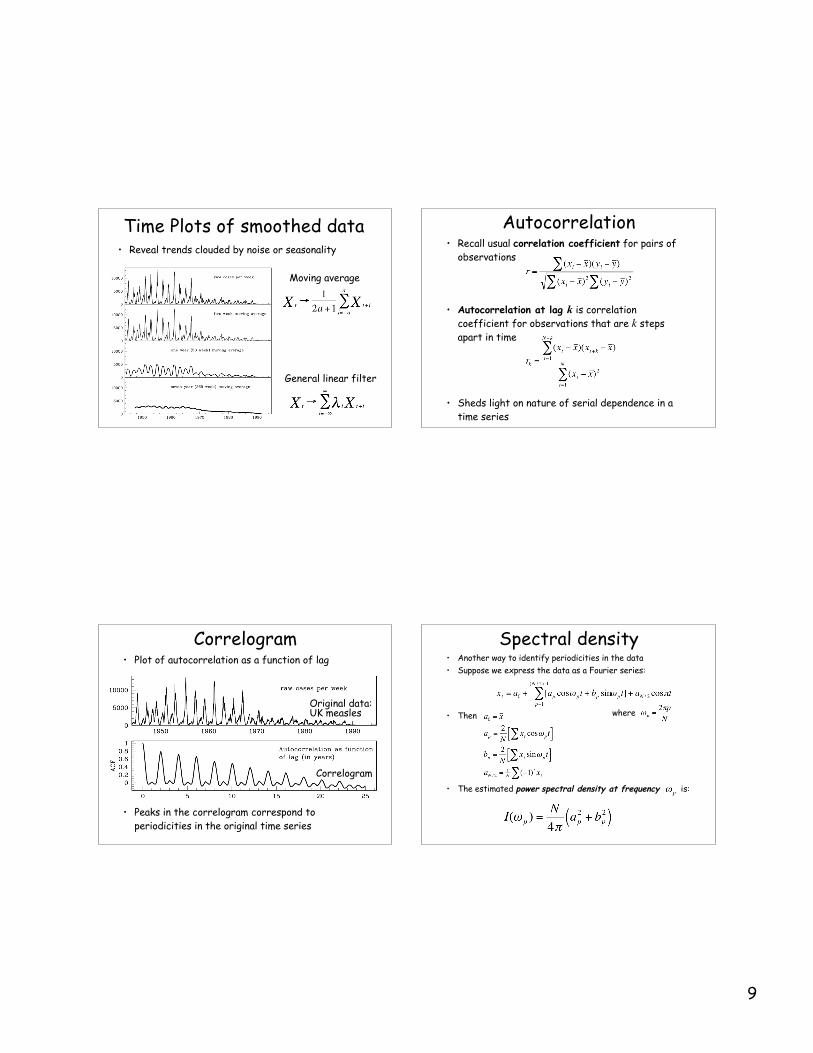
Time Plots of smoothed data• Reveal trends clouded by noise or seasonality
Moving average
General linear filter
Autocorrelation• Recall usual correlation coefficient for pairs of
observations
• Autocorrelation at lag k is correlationcoefficient for observations that are k stepsapart in time
• Sheds light on nature of serial dependence in atime series
Correlogram• Plot of autocorrelation as a function of lag
• Peaks in the correlogram correspond toperiodicities in the original time series
Original data:UK measles
Correlogram
Spectral density• Another way to identify periodicities in the data• Suppose we express the data as a Fourier series:
• Then where
• The estimated power spectral density at frequency is:
10
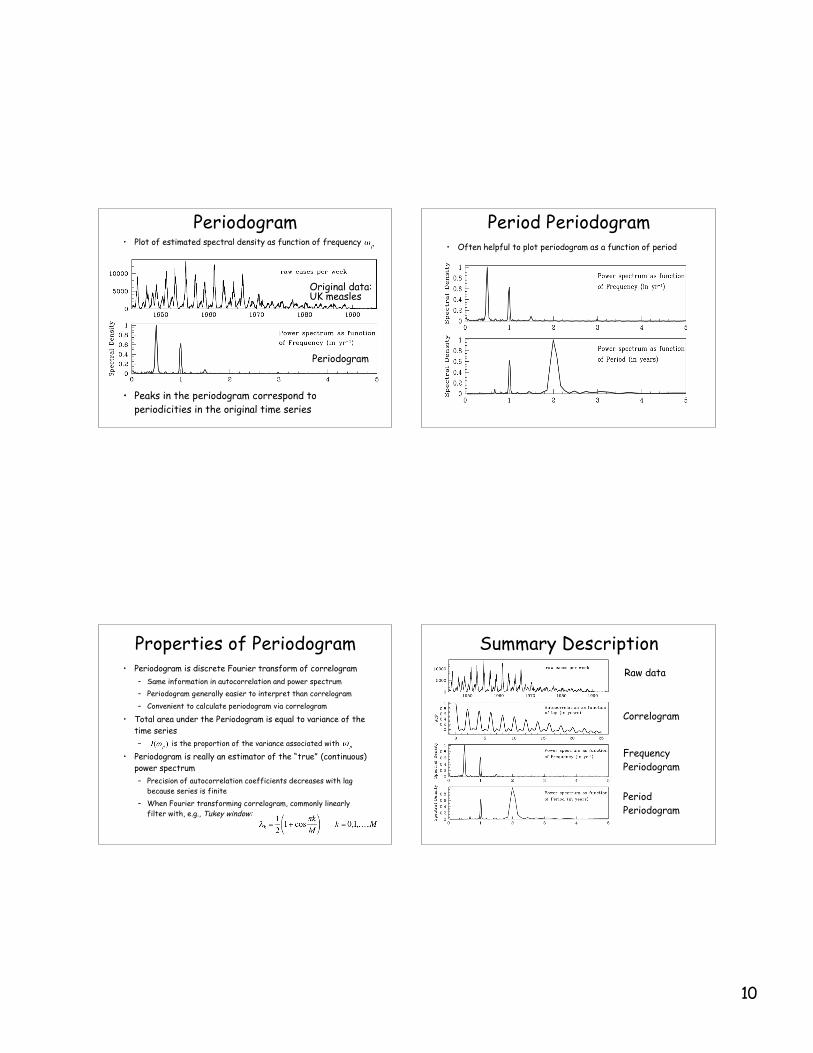
Periodogram• Plot of estimated spectral density as function of frequency
• Peaks in the periodogram correspond toperiodicities in the original time series
Original data:UK measles
Periodogram
Period Periodogram• Often helpful to plot periodogram as a function of period
Properties of Periodogram• Periodogram is discrete Fourier transform of correlogram
– Same information in autocorrelation and power spectrum– Periodogram generally easier to interpret than correlogram– Convenient to calculate periodogram via correlogram
• Total area under the Periodogram is equal to variance of thetime series– is the proportion of the variance associated with
• Periodogram is really an estimator of the “true” (continuous)power spectrum– Precision of autocorrelation coefficients decreases with lag
because series is finite– When Fourier transforming correlogram, commonly linearly
filter with, e.g., Tukey window:
Summary DescriptionRaw data
Correlogram
FrequencyPeriodogram
PeriodPeriodogram
11
Problem• Examine measles dynamics in New York City
(data file nycmeas.dat) via:– Time plots of raw and transformed data– Autocorrelation / correlogram– Power spectral density / periodogram
• Apply these methods to segments of the timeseries that look different by eye– Is there evidence for: Frequency components not
evident by eye? Changes in the frequencystructure over long time scales? If so, why mightthis have occurred?
• What if you remove trend and/or seasonality?
When you have time…
• More sophisticated spectral methods exist.• Wavelet analysis provides a method for
frequency decomposition that is local in time,so you can see changes in the spectrum overtime without having to identify distincttemporal segments yourself.
• If you’re ambitious… explore the New YorkCity measles time series using wavelet analysis,e.g., via the matlab wavelet toolbox.