Embed Size (px)
Citation preview
_____________________________________________________________________________ Page 1 of 14
MATHEMATICAL METHODS (CAS) Application Task 2011
Derivatives and rates Teachers may select questions from this document to develop a task for their students. Teachers may choose to increase or reduce the amount of “scaffolding” provided to make the task more or less open-ended or challenging. The task should have 3 components of increasing complexity.
Component 1: Constructing a graph of a function from properties of its derivative Consider ,x a x b= = and x c= , where { }, ,a b c R∈ and a b c< < . Also consider the polynomial function :f R R→ with properties that include, but are not limited to, the following:
• ( ) ( ) 0f a f c= = • ( ) ( ) 0f a f b′ ′= =
• ( ) 0f x′ > for x a< • the degree of the polynomial is less than 5
a. Consider a family of curves that satisfies these conditions.
i. On the same set of axes, sketch the graphs of three members of a family of curves that satisfy these properties.
ii. For this family of curves, write an equation for the rule of f in terms of one or more parameters, which may include, but need not be limited to, a, b and c.
iii. On a separate set of axes, sketch the graph of ( )y f x′= for this family of curves. b. Consider a different family of curves that satisfies the conditions.
i. For this alternative family of curves, write an equation for the rule of f in terms of one or more parameters, which may include, but need not be limited to, a, b and c.
ii. Sketch the graphs of three members of the alternative family. iii. On a separate set of axes, sketch the graph of ( )y f x′= for this alternative family of curves.
c. What additional information is needed to uniquely determine a particular family of curves? Explain your answer.
d. What additional information is needed to uniquely determine a particular member of one of your family of curves? Explain your answer.
e. Select one member of your family of curves from part (a) above. i. For your chosen curve, find k, the average rate of change of f in the interval [a, b].
ii. For your chosen curve, find a real number, q, such that ( )f q k′ = .
_____________________________________________________________________________ Page 2 of 14
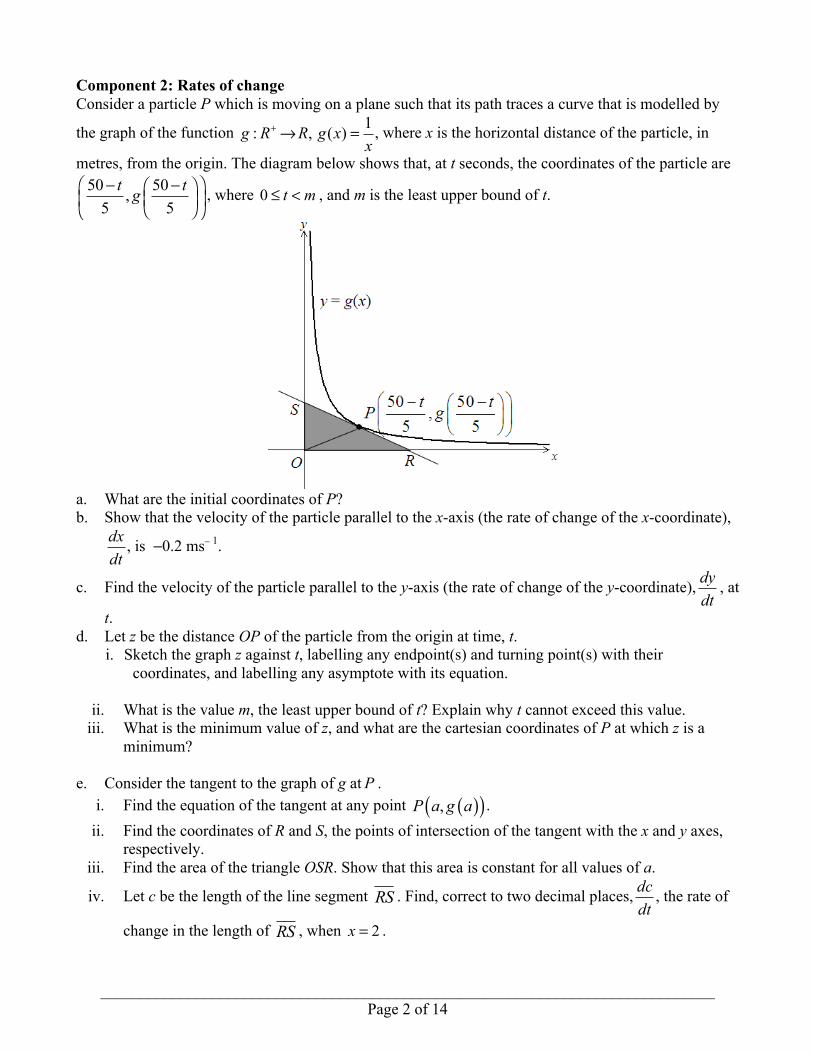
Component 2: Rates of change Consider a particle P which is moving on a plane such that its path traces a curve that is modelled by
the graph of the function 1: , ( )g R R g xx
+ → = , where x is the horizontal distance of the particle, in
metres, from the origin. The diagram below shows that, at t seconds, the coordinates of the particle are 50 50,5 5t tg⎛ ⎞− −⎛ ⎞
⎜ ⎟⎜ ⎟⎝ ⎠⎝ ⎠, where 0 t m≤ < , and m is the least upper bound of t.
a. What are the initial coordinates of P? b. Show that the velocity of the particle parallel to the x-axis (the rate of change of the x-coordinate),
dxdt
, is −0.2 ms− 1.
c. Find the velocity of the particle parallel to the y-axis (the rate of change of the y-coordinate), dydt
, at
t. d. Let z be the distance OP of the particle from the origin at time, t.
i. Sketch the graph z against t, labelling any endpoint(s) and turning point(s) with their coordinates, and labelling any asymptote with its equation.
ii. What is the value m, the least upper bound of t? Explain why t cannot exceed this value.
iii. What is the minimum value of z, and what are the cartesian coordinates of P at which z is a minimum?
e. Consider the tangent to the graph of g atP .
i. Find the equation of the tangent at any point ( )( ),P a g a . ii. Find the coordinates of R and S, the points of intersection of the tangent with the x and y axes,
respectively. iii. Find the area of the triangle OSR. Show that this area is constant for all values of a.
iv. Let c be the length of the line segment RS . Find, correct to two decimal places, dcdt
, the rate of
change in the length of RS , when 2x = .
_____________________________________________________________________________ Page 3 of 14
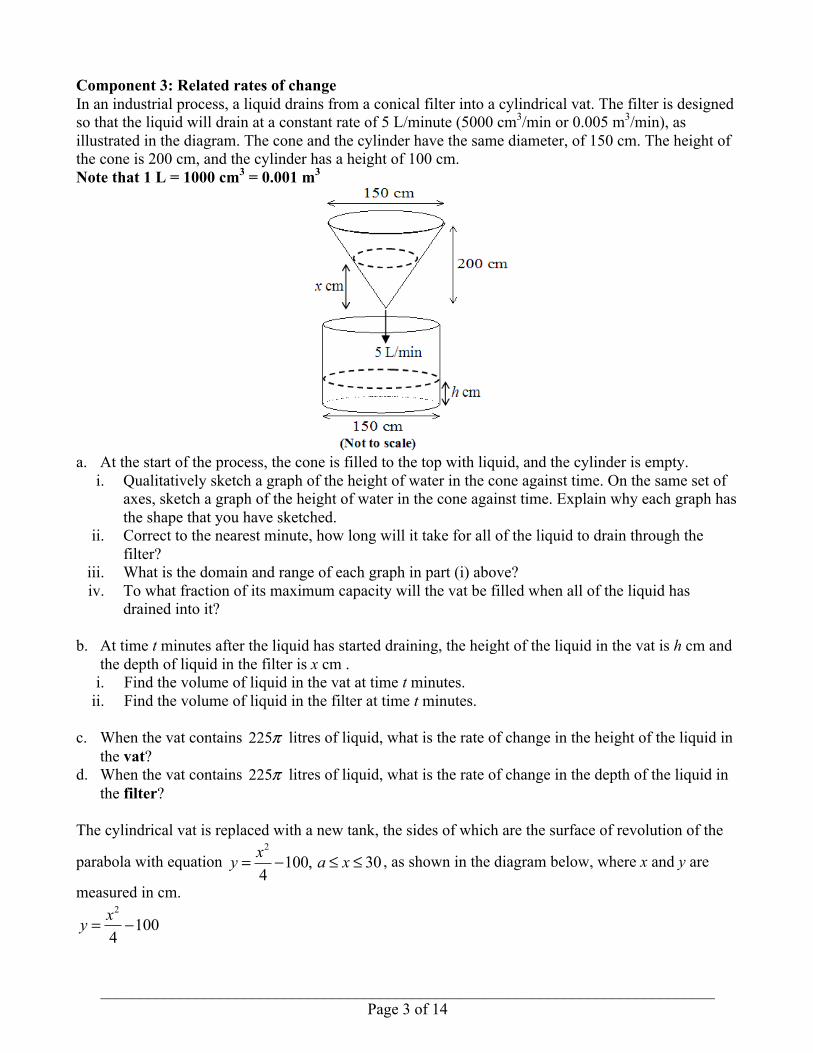
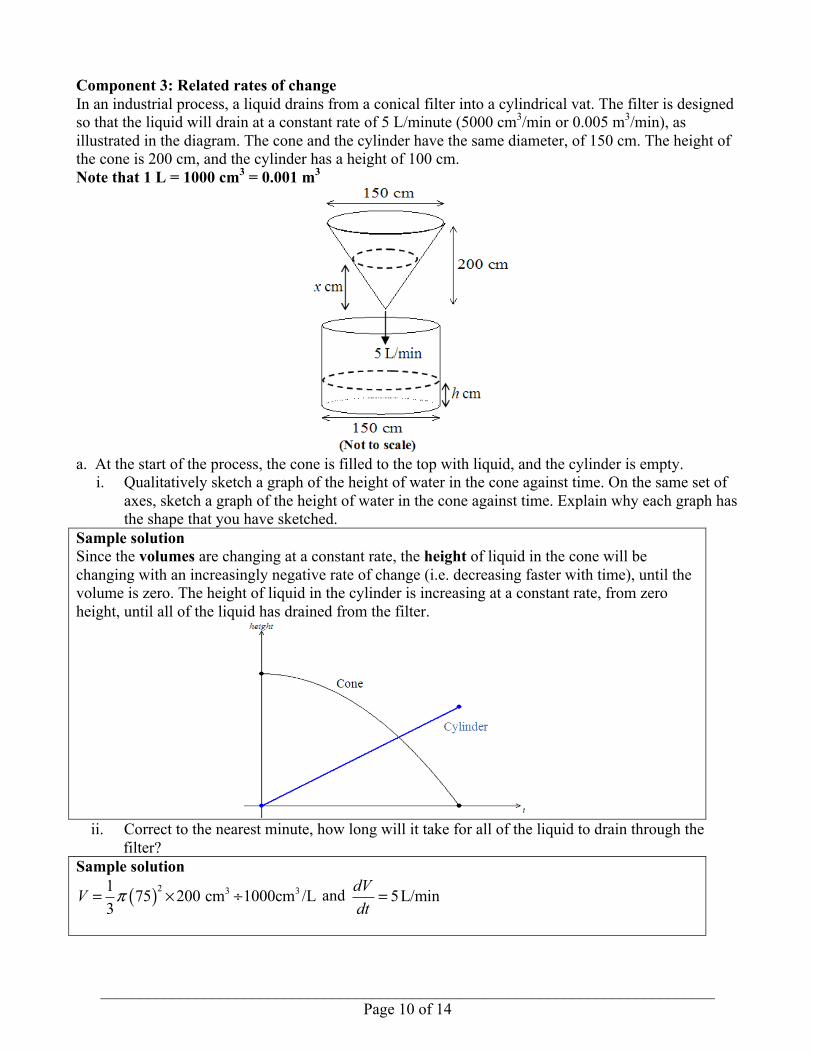
Component 3: Related rates of change In an industrial process, a liquid drains from a conical filter into a cylindrical vat. The filter is designed so that the liquid will drain at a constant rate of 5 L/minute (5000 cm3/min or 0.005 m3/min), as illustrated in the diagram. The cone and the cylinder have the same diameter, of 150 cm. The height of the cone is 200 cm, and the cylinder has a height of 100 cm. Note that 1 L = 1000 cm3 = 0.001 m3
a. At the start of the process, the cone is filled to the top with liquid, and the cylinder is empty.
i. Qualitatively sketch a graph of the height of water in the cone against time. On the same set of axes, sketch a graph of the height of water in the cone against time. Explain why each graph has the shape that you have sketched.
ii. Correct to the nearest minute, how long will it take for all of the liquid to drain through the filter?
iii. What is the domain and range of each graph in part (i) above? iv. To what fraction of its maximum capacity will the vat be filled when all of the liquid has
drained into it? b. At time t minutes after the liquid has started draining, the height of the liquid in the vat is h cm and
the depth of liquid in the filter is x cm . i. Find the volume of liquid in the vat at time t minutes.
ii. Find the volume of liquid in the filter at time t minutes.
c. When the vat contains 225π litres of liquid, what is the rate of change in the height of the liquid in the vat?
d. When the vat contains 225π litres of liquid, what is the rate of change in the depth of the liquid in the filter?
The cylindrical vat is replaced with a new tank, the sides of which are the surface of revolution of the
parabola with equation 2
100, 304xy a x= − ≤ ≤ , as shown in the diagram below, where x and y are
measured in cm. 2
1004xy = −
_____________________________________________________________________________ Page 4 of 14
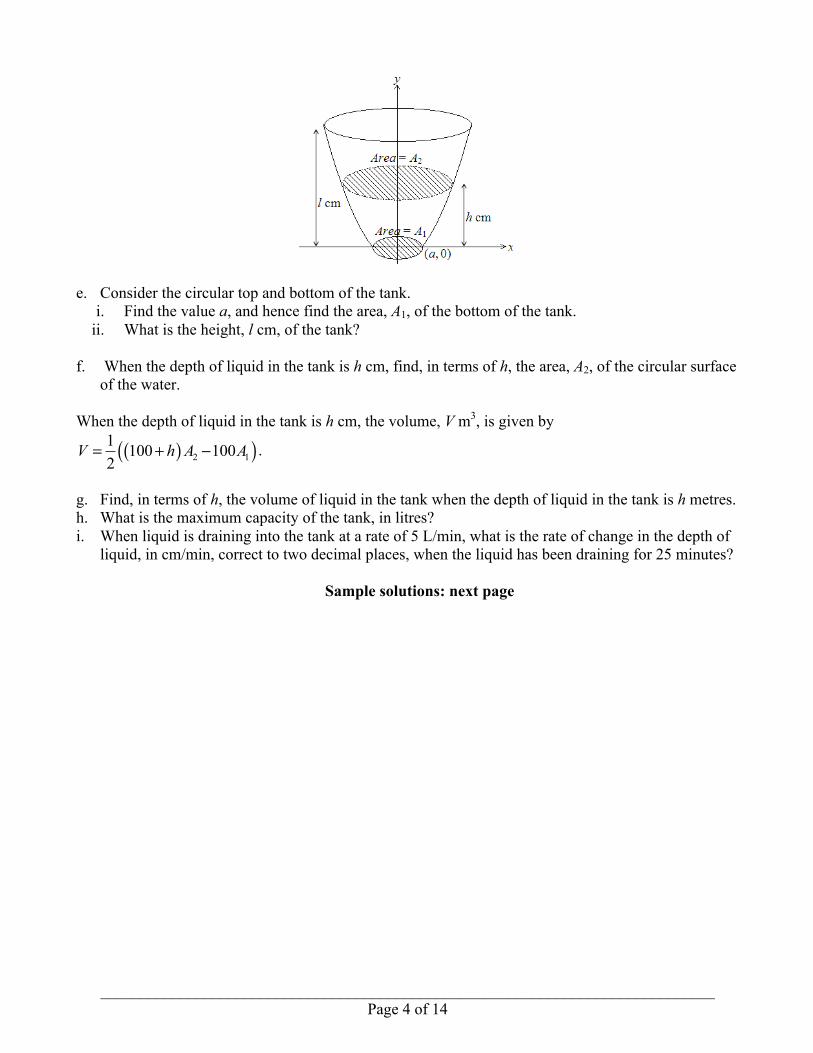
e. Consider the circular top and bottom of the tank.
i. Find the value a, and hence find the area, A1, of the bottom of the tank. ii. What is the height, l cm, of the tank?
f. When the depth of liquid in the tank is h cm, find, in terms of h, the area, A2, of the circular surface
of the water. When the depth of liquid in the tank is h cm, the volume, V m3, is given by
( )( )2 11 100 1002
V h A A= + − .
g. Find, in terms of h, the volume of liquid in the tank when the depth of liquid in the tank is h metres. h. What is the maximum capacity of the tank, in litres? i. When liquid is draining into the tank at a rate of 5 L/min, what is the rate of change in the depth of
liquid, in cm/min, correct to two decimal places, when the liquid has been draining for 25 minutes?
Sample solutions: next page
_____________________________________________________________________________ Page 5 of 14
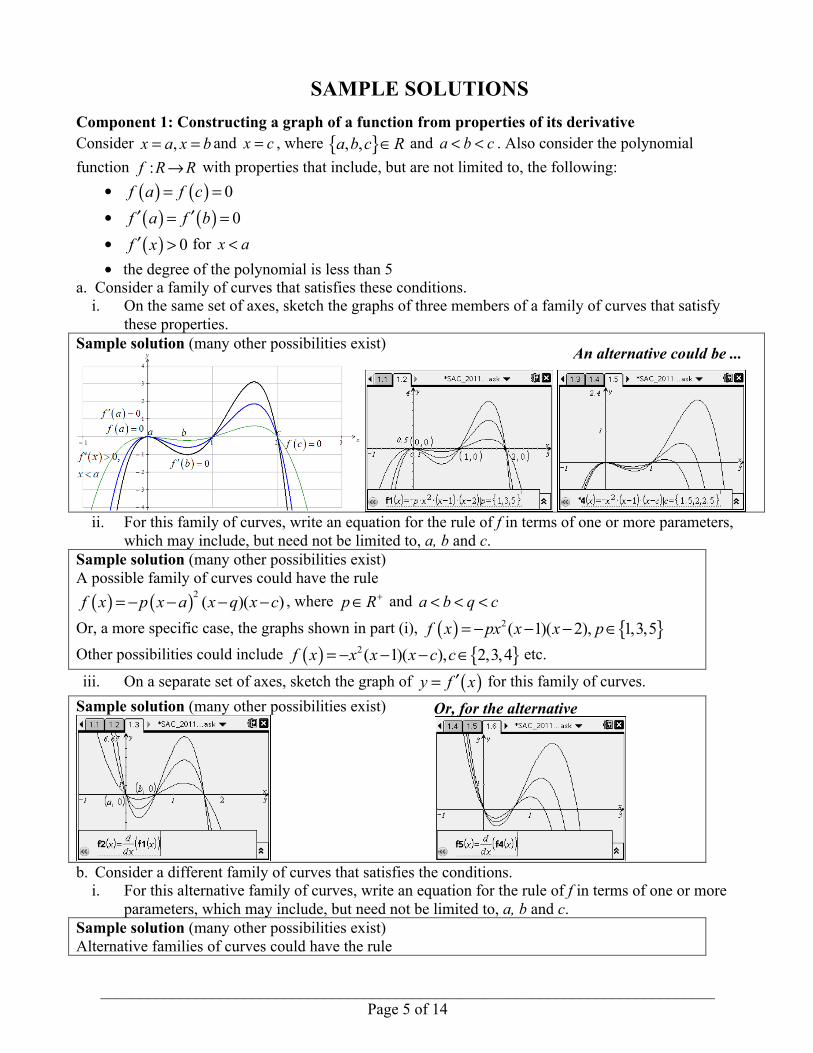
SAMPLE SOLUTIONS Component 1: Constructing a graph of a function from properties of its derivative Consider ,x a x b= = and x c= , where { }, ,a b c R∈ and a b c< < . Also consider the polynomial function :f R R→ with properties that include, but are not limited to, the following:
• ( ) ( ) 0f a f c= =
• ( ) ( ) 0f a f b′ ′= =
• ( ) 0f x′ > for x a< • the degree of the polynomial is less than 5
a. Consider a family of curves that satisfies these conditions. i. On the same set of axes, sketch the graphs of three members of a family of curves that satisfy
these properties. Sample solution (many other possibilities exist)
ii. For this family of curves, write an equation for the rule of f in terms of one or more parameters,
which may include, but need not be limited to, a, b and c. Sample solution (many other possibilities exist) A possible family of curves could have the rule ( ) ( )2 ( )( )f x p x a x q x c= − − − − , where p R+∈ and a b q c< < <
Or, a more specific case, the graphs shown in part (i), ( ) { }2( 1)( 2), 1,3,5f x px x x p= − − − ∈ Other possibilities could include ( ) { }2( 1)( ), 2,3,4f x x x x c c= − − − ∈ etc. iii. On a separate set of axes, sketch the graph of ( )y f x′= for this family of curves.
Sample solution (many other possibilities exist)
b. Consider a different family of curves that satisfies the conditions.
i. For this alternative family of curves, write an equation for the rule of f in terms of one or more parameters, which may include, but need not be limited to, a, b and c.
Sample solution (many other possibilities exist) Alternative families of curves could have the rule
An alternative could be ...
Or, for the alternative
_____________________________________________________________________________ Page 6 of 14
( ) ( )2 ( )( )f x p x a x q x c= − − − − , where p R+∈ and a b q c< < < ( ) ( )2 2( ) ( )f x p x a x q x c= − − − − etc.
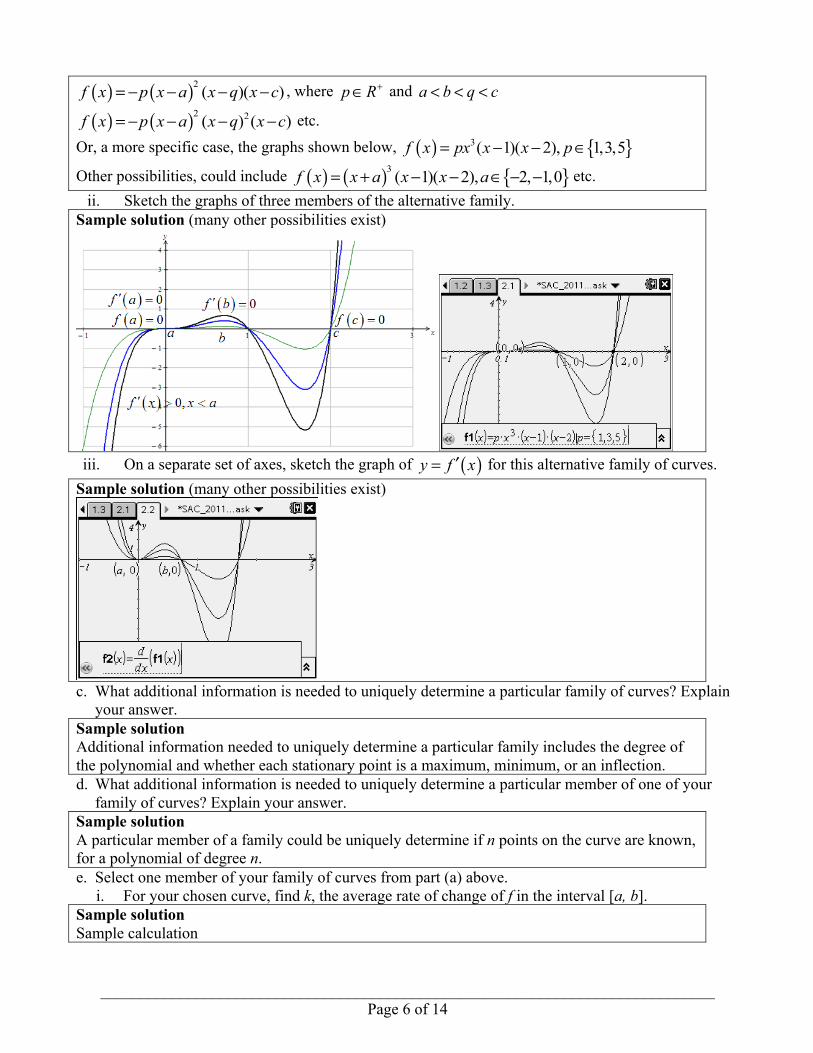
Or, a more specific case, the graphs shown below, ( ) { }3( 1)( 2), 1,3,5f x px x x p= − − ∈ Other possibilities, could include ( ) ( ) { }3 ( 1)( 2), 2, 1,0f x x a x x a= + − − ∈ − − etc.
ii. Sketch the graphs of three members of the alternative family. Sample solution (many other possibilities exist)
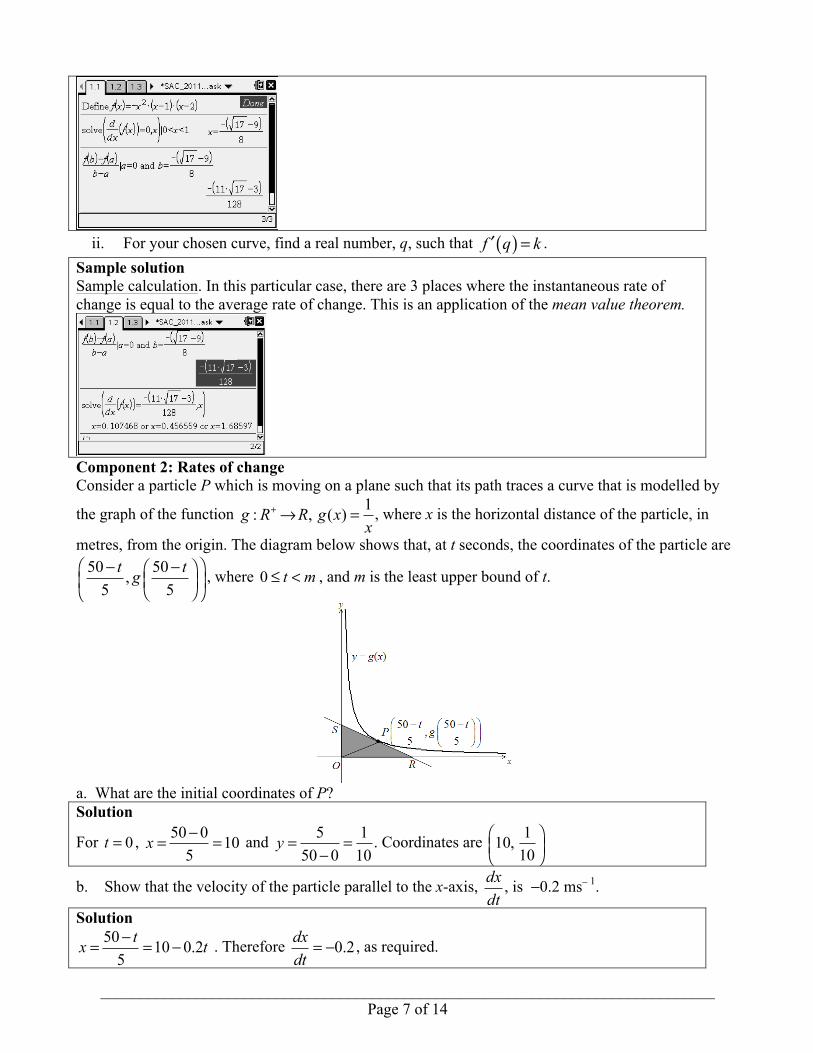
iii. On a separate set of axes, sketch the graph of ( )y f x′= for this alternative family of curves.
Sample solution (many other possibilities exist)
c. What additional information is needed to uniquely determine a particular family of curves? Explain
your answer. Sample solution Additional information needed to uniquely determine a particular family includes the degree of the polynomial and whether each stationary point is a maximum, minimum, or an inflection. d. What additional information is needed to uniquely determine a particular member of one of your
family of curves? Explain your answer. Sample solution A particular member of a family could be uniquely determine if n points on the curve are known, for a polynomial of degree n. e. Select one member of your family of curves from part (a) above.
i. For your chosen curve, find k, the average rate of change of f in the interval [a, b]. Sample solution Sample calculation
_____________________________________________________________________________ Page 7 of 14
ii. For your chosen curve, find a real number, q, such that ( )f q k′ = .
Sample solution Sample calculation. In this particular case, there are 3 places where the instantaneous rate of change is equal to the average rate of change. This is an application of the mean value theorem.
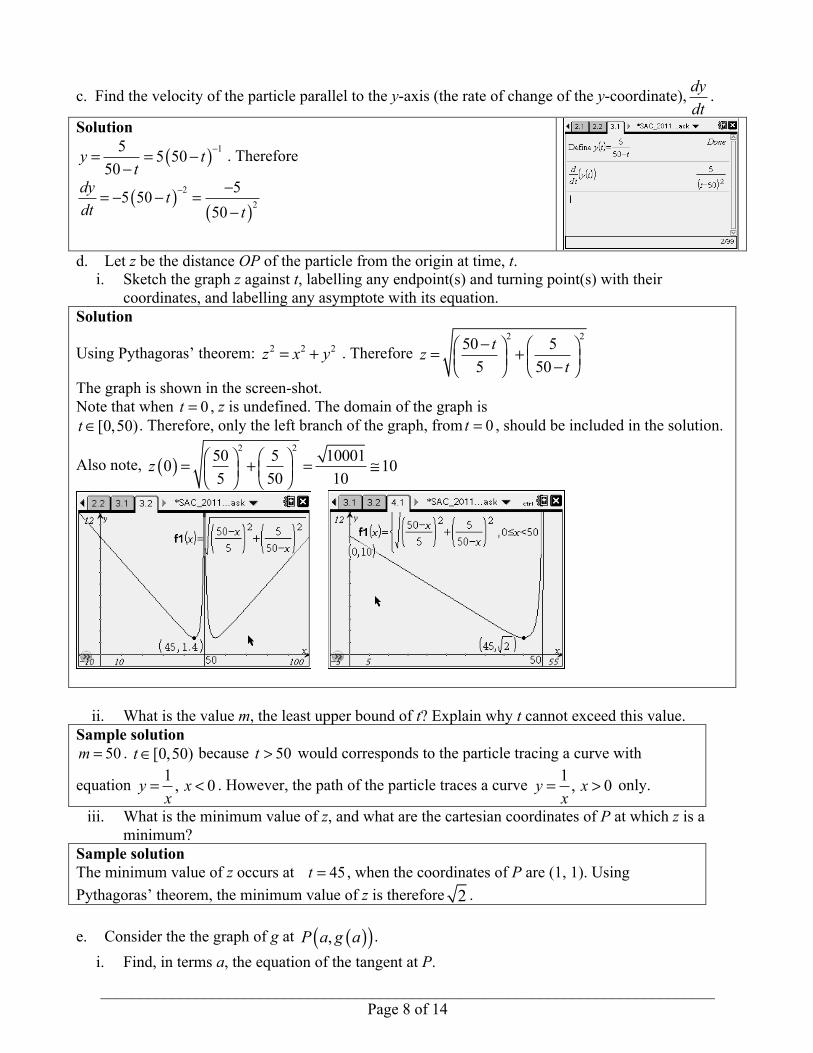
Component 2: Rates of change Consider a particle P which is moving on a plane such that its path traces a curve that is modelled by
the graph of the function 1: , ( )g R R g xx
+ → = , where x is the horizontal distance of the particle, in
metres, from the origin. The diagram below shows that, at t seconds, the coordinates of the particle are 50 50,5 5t tg⎛ ⎞− −⎛ ⎞
⎜ ⎟⎜ ⎟⎝ ⎠⎝ ⎠, where 0 t m≤ < , and m is the least upper bound of t.
a. What are the initial coordinates of P? Solution
For 0t = , 50 0 105
x −= = and 5 150 0 10
y = =−
. Coordinates are 110,10
⎛ ⎞⎜ ⎟⎝ ⎠
b. Show that the velocity of the particle parallel to the x-axis, dxdt
, is −0.2 ms− 1.
Solution 50 10 0.25tx t−= = − . Therefore 0.2dx
dt= − , as required.
_____________________________________________________________________________ Page 8 of 14
c. Find the velocity of the particle parallel to the y-axis (the rate of change of the y-coordinate), dydt
.
Solution
( ) 15 5 5050
y tt
−= = −−
. Therefore
( )( )
22
55 5050
dy tdt t
− −= − − =−
d. Let z be the distance OP of the particle from the origin at time, t.
i. Sketch the graph z against t, labelling any endpoint(s) and turning point(s) with their coordinates, and labelling any asymptote with its equation.
Solution
Using Pythagoras’ theorem: 2 2 2z x y= + . Therefore 2 250 5
5 50tz
t−⎛ ⎞ ⎛ ⎞= +⎜ ⎟ ⎜ ⎟−⎝ ⎠ ⎝ ⎠
The graph is shown in the screen-shot. Note that when 0t = , z is undefined. The domain of the graph is [0,50)t∈ . Therefore, only the left branch of the graph, from 0t = , should be included in the solution.
Also note, ( )2 250 5 100010 10
5 50 10z ⎛ ⎞ ⎛ ⎞= + = ≅⎜ ⎟ ⎜ ⎟⎝ ⎠ ⎝ ⎠
ii. What is the value m, the least upper bound of t? Explain why t cannot exceed this value.
Sample solution 50m = . [0,50)t∈
because 50t >
would corresponds to the particle tracing a curve with
equation 1 , 0y xx
= < . However, the path of the particle traces a curve 1 , 0y xx
= > only.
iii. What is the minimum value of z, and what are the cartesian coordinates of P at which z is a minimum?
Sample solution The minimum value of z occurs at
45t = , when the coordinates of P are (1, 1). Using
Pythagoras’ theorem, the minimum value of z is therefore 2 .
e. Consider the the graph of g at ( )( ),P a g a . i. Find, in terms a, the equation of the tangent at P.
_____________________________________________________________________________ Page 9 of 14
Sample solution
2
1dydx x
−=
At ( )( ),a g a , 2
1ma−=
Substitute into ( )1 1y y m x x− = −
( )2
1 1y x aa a
−− = −
2
1 2y xa a−= + , where 0 10a< ≤
ii. Find, in terms of a, the coordinates of R and S, the points of intersection of the tangent at P with the x and y axes, respectively.
Sample solution
2
1 20 xa a−= + , therefore coordinates of R are ( )2 ,0R a
2
1 2(0)ya a−= + , therefore coordinates of S are 20,S
a⎛ ⎞⎜ ⎟⎝ ⎠
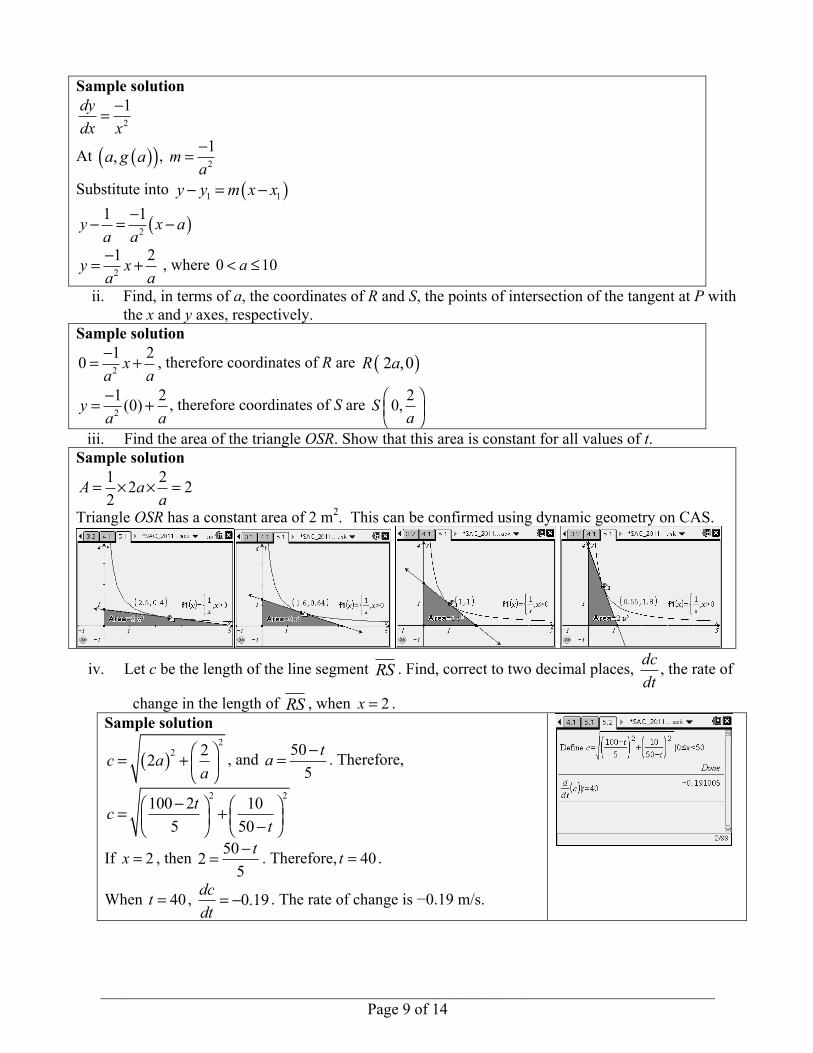
iii. Find the area of the triangle OSR. Show that this area is constant for all values of t. Sample solution
1 22 22
A aa
= × × =
Triangle OSR has a constant area of 2 m2. This can be confirmed using dynamic geometry on CAS.
iv. Let c be the length of the line segment RS . Find, correct to two decimal places, dc
dt, the rate of
change in the length of RS , when 2x = . Sample solution
( )2
2 22c aa
⎛ ⎞= + ⎜ ⎟⎝ ⎠, and 50
5ta −= . Therefore,
2 2100 2 105 50tc
t−⎛ ⎞ ⎛ ⎞= +⎜ ⎟ ⎜ ⎟−⎝ ⎠ ⎝ ⎠
If 2x = , then 5025t−= . Therefore, 40t = .
When 40t = , 0.19dcdt
= − . The rate of change is −0.19 m/s.
_____________________________________________________________________________ Page 10 of 14
Component 3: Related rates of change In an industrial process, a liquid drains from a conical filter into a cylindrical vat. The filter is designed so that the liquid will drain at a constant rate of 5 L/minute (5000 cm3/min or 0.005 m3/min), as illustrated in the diagram. The cone and the cylinder have the same diameter, of 150 cm. The height of the cone is 200 cm, and the cylinder has a height of 100 cm. Note that 1 L = 1000 cm3 = 0.001 m3
a. At the start of the process, the cone is filled to the top with liquid, and the cylinder is empty.
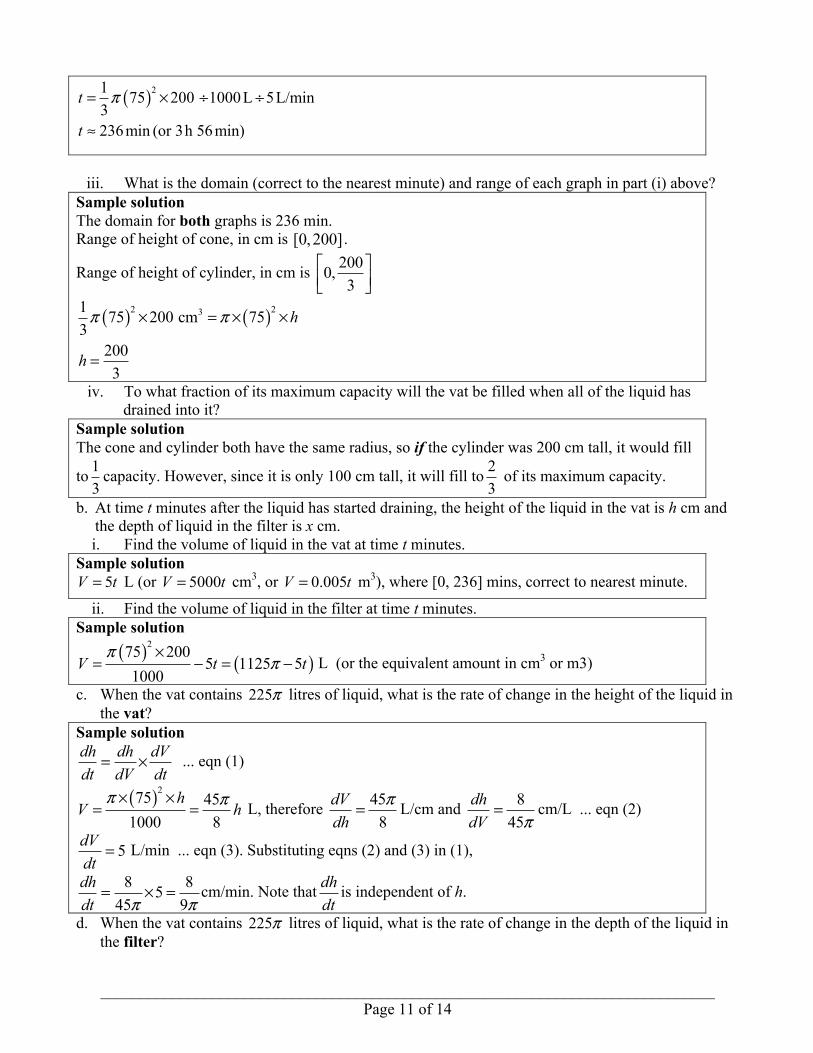
i. Qualitatively sketch a graph of the height of water in the cone against time. On the same set of axes, sketch a graph of the height of water in the cone against time. Explain why each graph has the shape that you have sketched.
Sample solution Since the volumes are changing at a constant rate, the height of liquid in the cone will be changing with an increasingly negative rate of change (i.e. decreasing faster with time), until the volume is zero. The height of liquid in the cylinder is increasing at a constant rate, from zero height, until all of the liquid has drained from the filter.
ii. Correct to the nearest minute, how long will it take for all of the liquid to drain through the
filter? Sample solution
( )2 3 31 75 200 cm 1000cm /L3
V π= × ÷ and 5L/mindVdt
=
_____________________________________________________________________________ Page 11 of 14
( )21 75 200 1000L 5L/min3236min (or 3h 56min)
t
t
π= × ÷ ÷
≈
iii. What is the domain (correct to the nearest minute) and range of each graph in part (i) above?
Sample solution The domain for both graphs is 236 min. Range of height of cone, in cm is [0,200] .
Range of height of cylinder, in cm is 2000,3
⎡ ⎤⎢ ⎥⎣ ⎦
( ) ( )2 231 75 200 cm 7532003
h
h
π π× = × ×
=
iv. To what fraction of its maximum capacity will the vat be filled when all of the liquid has drained into it?
Sample solution The cone and cylinder both have the same radius, so if the cylinder was 200 cm tall, it would fill
to 13
capacity. However, since it is only 100 cm tall, it will fill to 23 of its maximum capacity.
b. At time t minutes after the liquid has started draining, the height of the liquid in the vat is h cm and the depth of liquid in the filter is x cm. i. Find the volume of liquid in the vat at time t minutes.
Sample solution 5V t= L (or 5000V t= cm3, or 0.005V t= m
3), where [0, 236] mins, correct to nearest minute.
ii. Find the volume of liquid in the filter at time t minutes. Sample solution
( ) ( )275 200
5 1125 51000
V t tπ
π×
= − = − L (or the equivalent amount in cm3 or m3)
c. When the vat contains 225π litres of liquid, what is the rate of change in the height of the liquid in the vat?
Sample solution dh dh dVdt dV dt
= × ... eqn (1)
( )275 451000 8
hV h
π π× ×= = L, therefore 45
8dVdh
π= L/cm and 845
dhdV π
= cm/L ... eqn (2)
5dVdt
= L/min ... eqn (3). Substituting eqns (2) and (3) in (1),
8 8545 9
dhdt π π
= × = cm/min. Note that dhdt
is independent of h.
d. When the vat contains 225π litres of liquid, what is the rate of change in the depth of the liquid in the filter?
_____________________________________________________________________________ Page 12 of 14
Sample solution dx dx dVdt dV dt
= × ... eqn (1)
2
3 1000r xV π=
× L, and by similar triangles, 75 3200 8
rx= = L/cm, therefore
2 39 33 1000 64 64000
x x xV π π= × =× L , therefore
2964000
dV xdx
π= L/cm, and 2
640009
dxdV xπ
= ... eqn (2)
5dVdt
= L/min ... eqn (3). Substituting eqns (2) and (3) in (1),
8 8545 9
dhdt π π
= × = cm/min. Note that dhdt
is independent of h for a cylinder.
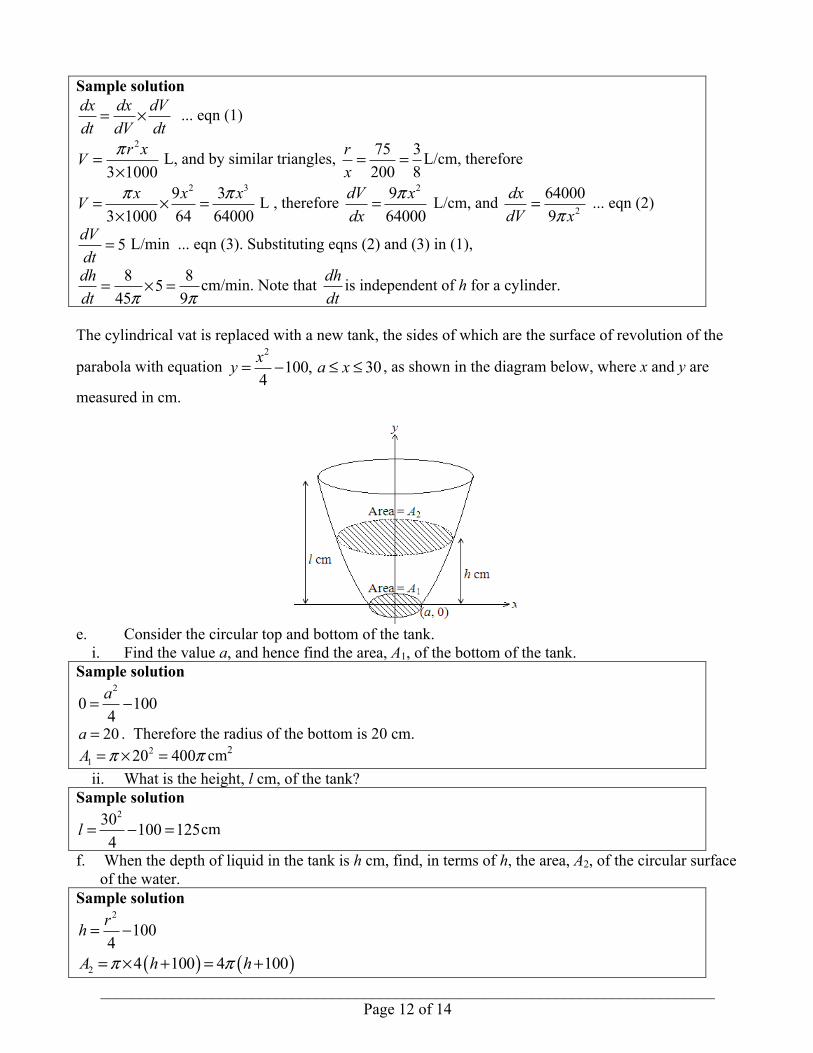
The cylindrical vat is replaced with a new tank, the sides of which are the surface of revolution of the
parabola with equation 2
100, 304xy a x= − ≤ ≤ , as shown in the diagram below, where x and y are
measured in cm.
e. Consider the circular top and bottom of the tank.
i. Find the value a, and hence find the area, A1, of the bottom of the tank. Sample solution
2
0 1004a= −
20a = . Therefore the radius of the bottom is 20 cm. 2
1 20 400A π π= × = cm2 ii. What is the height, l cm, of the tank?
Sample solution 230 100 1254
l = − = cm
f. When the depth of liquid in the tank is h cm, find, in terms of h, the area, A2, of the circular surface of the water.
Sample solution 2
1004rh = −
( ) ( )2 4 100 4 100A h hπ π= × + = +
_____________________________________________________________________________ Page 13 of 14
When the depth of liquid in the tank is h cm, the volume, V m3, is given by
( )( )2 11 100 1002
V h A A= + − .
g. Find, in terms of h, the volume of liquid in the tank when the depth of liquid in the tank is h metres. Sample solution
( ) ( )( )1 100 4 100 100 4002
V h hπ π= + × + − × cm3
or ( ) ( )( )1 100 4 100 100 400 10002
V h hπ π= + × + − × ÷ L
( )2 2002
V h hπ= +
h. What is the maximum capacity of the tank, in litres? Sample solution
Maximum capacity: ( )2 325125 200 1252 4
V π π= + × = L
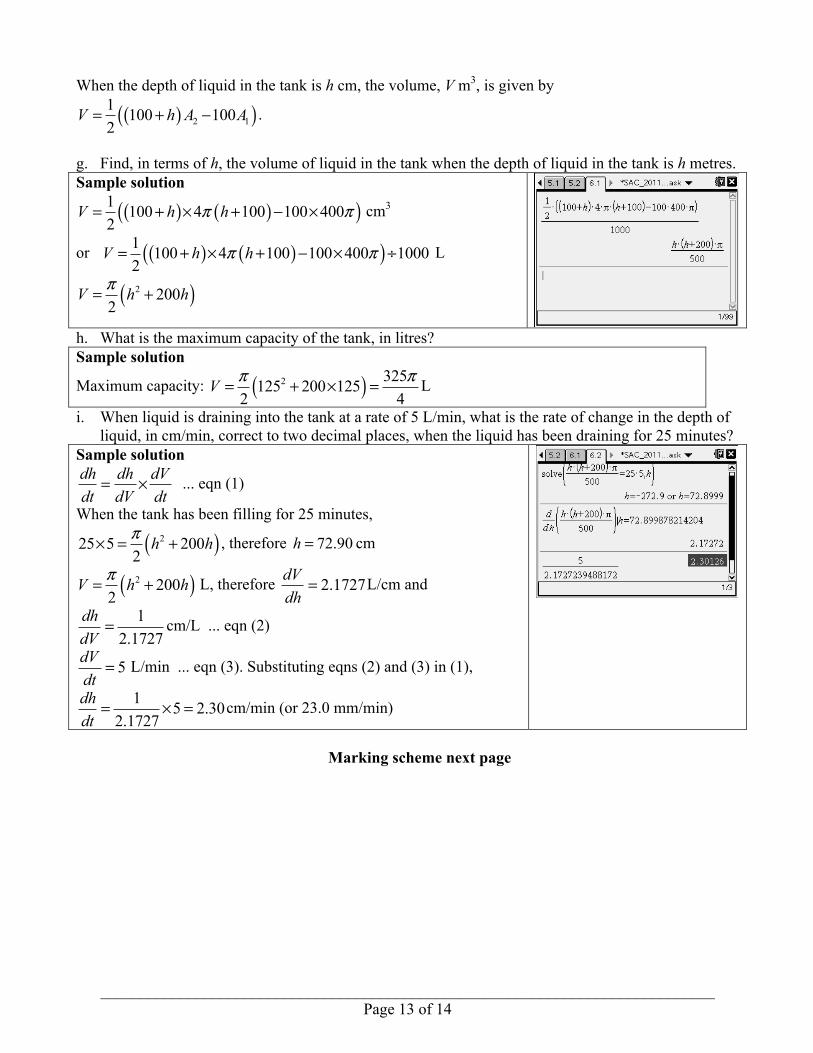
i. When liquid is draining into the tank at a rate of 5 L/min, what is the rate of change in the depth of liquid, in cm/min, correct to two decimal places, when the liquid has been draining for 25 minutes?
Sample solution dh dh dVdt dV dt
= × ... eqn (1)
When the tank has been filling for 25 minutes,
( )225 5 2002h hπ× = + , therefore 72.90h = cm
( )2 2002
V h hπ= + L, therefore 2.1727dVdh
= L/cm and
12.1727
dhdV
= cm/L ... eqn (2)
5dVdt
= L/min ... eqn (3). Substituting eqns (2) and (3) in (1),
1 5 2.302.1727
dhdt
= × = cm/min (or 23.0 mm/min)
Marking scheme next page
_____________________________________________________________________________ Page 14 of 14
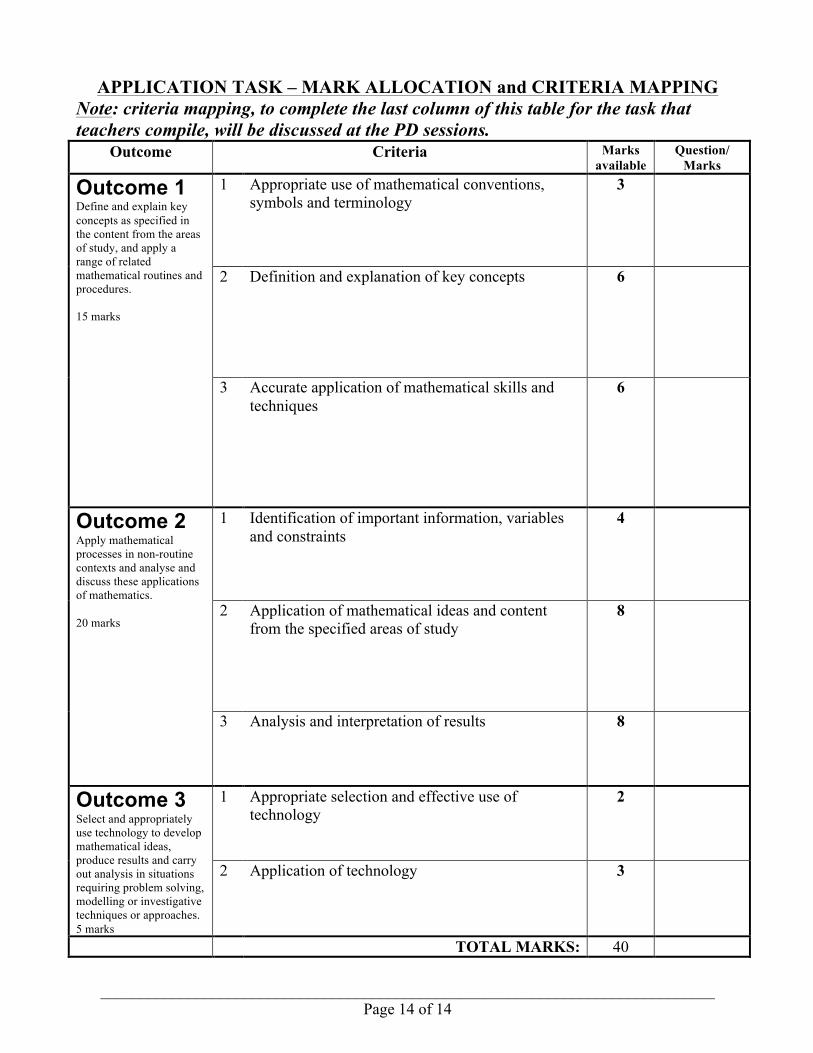
APPLICATION TASK – MARK ALLOCATION and CRITERIA MAPPING Note: criteria mapping, to complete the last column of this table for the task that teachers compile, will be discussed at the PD sessions.
Outcome Criteria Marks available
Question/ Marks
Outcome 1 Define and explain key concepts as specified in the content from the areas of study, and apply a range of related mathematical routines and procedures. 15 marks
1 Appropriate use of mathematical conventions, symbols and terminology
3
2 Definition and explanation of key concepts
6
3 Accurate application of mathematical skills and techniques
6
Outcome 2 Apply mathematical processes in non-routine contexts and analyse and discuss these applications of mathematics. 20 marks
1 Identification of important information, variables and constraints
4
2 Application of mathematical ideas and content from the specified areas of study
8
3 Analysis and interpretation of results
8
Outcome 3 Select and appropriately use technology to develop mathematical ideas, produce results and carry out analysis in situations requiring problem solving, modelling or investigative techniques or approaches. 5 marks
1 Appropriate selection and effective use of technology
2
2 Application of technology 3
TOTAL MARKS: 40