Embed Size (px)
Citation preview
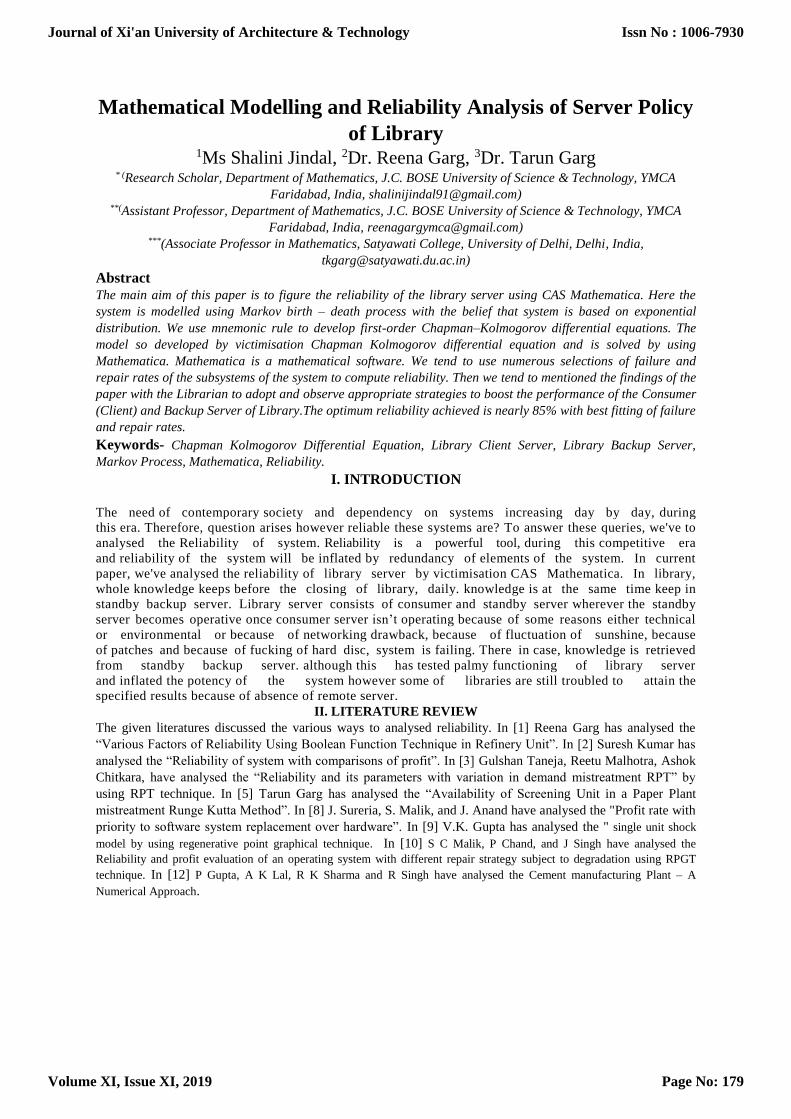
Mathematical Modelling and Reliability Analysis of Server Policy
of Library 1Ms Shalini Jindal, 2Dr. Reena Garg, 3Dr. Tarun Garg
* (Research Scholar, Department of Mathematics, J.C. BOSE University of Science & Technology, YMCA
Faridabad, India, [email protected]) **(Assistant Professor, Department of Mathematics, J.C. BOSE University of Science & Technology, YMCA
Faridabad, India, [email protected]) ***(Associate Professor in Mathematics, Satyawati College, University of Delhi, Delhi, India,
Abstract
The main aim of this paper is to figure the reliability of the library server using CAS Mathematica. Here the
system is modelled using Markov birth – death process with the belief that system is based on exponential
distribution. We use mnemonic rule to develop first-order Chapman–Kolmogorov differential equations. The
model so developed by victimisation Chapman Kolmogorov differential equation and is solved by using
Mathematica. Mathematica is a mathematical software. We tend to use numerous selections of failure and
repair rates of the subsystems of the system to compute reliability. Then we tend to mentioned the findings of the
paper with the Librarian to adopt and observe appropriate strategies to boost the performance of the Consumer
(Client) and Backup Server of Library.The optimum reliability achieved is nearly 85% with best fitting of failure
and repair rates.
Keywords- Chapman Kolmogorov Differential Equation, Library Client Server, Library Backup Server,
Markov Process, Mathematica, Reliability.
I. INTRODUCTION
The need of contemporary society and dependency on systems increasing day by day, during
this era. Therefore, question arises however reliable these systems are? To answer these queries, we've to
analysed the Reliability of system. Reliability is a powerful tool, during this competitive era
and reliability of the system will be inflated by redundancy of elements of the system. In current
paper, we've analysed the reliability of library server by victimisation CAS Mathematica. In library,
whole knowledge keeps before the closing of library, daily. knowledge is at the same time keep in
standby backup server. Library server consists of consumer and standby server wherever the standby
server becomes operative once consumer server isn’t operating because of some reasons either technical
or environmental or because of networking drawback, because of fluctuation of sunshine, because
of patches and because of fucking of hard disc, system is failing. There in case, knowledge is retrieved
from standby backup server. although this has tested palmy functioning of library server
and inflated the potency of the system however some of libraries are still troubled to attain the
specified results because of absence of remote server.
II. LITERATURE REVIEW
The given literatures discussed the various ways to analysed reliability. In [1] Reena Garg has analysed the
“Various Factors of Reliability Using Boolean Function Technique in Refinery Unit”. In [2] Suresh Kumar has
analysed the “Reliability of system with comparisons of profit”. In [3] Gulshan Taneja, Reetu Malhotra, Ashok
Chitkara, have analysed the “Reliability and its parameters with variation in demand mistreatment RPT” by
using RPT technique. In [5] Tarun Garg has analysed the “Availability of Screening Unit in a Paper Plant
mistreatment Runge Kutta Method”. In [8] J. Sureria, S. Malik, and J. Anand have analysed the "Profit rate with
priority to software system replacement over hardware”. In [9] V.K. Gupta has analysed the " single unit shock
model by using regenerative point graphical technique. In [10] S C Malik, P Chand, and J Singh have analysed the
Reliability and profit evaluation of an operating system with different repair strategy subject to degradation using RPGT
technique. In [12] P Gupta, A K Lal, R K Sharma and R Singh have analysed the Cement manufacturing Plant – A
Numerical Approach.
Journal of Xi'an University of Architecture & Technology
Volume XI, Issue XI, 2019
Issn No : 1006-7930
Page No: 179
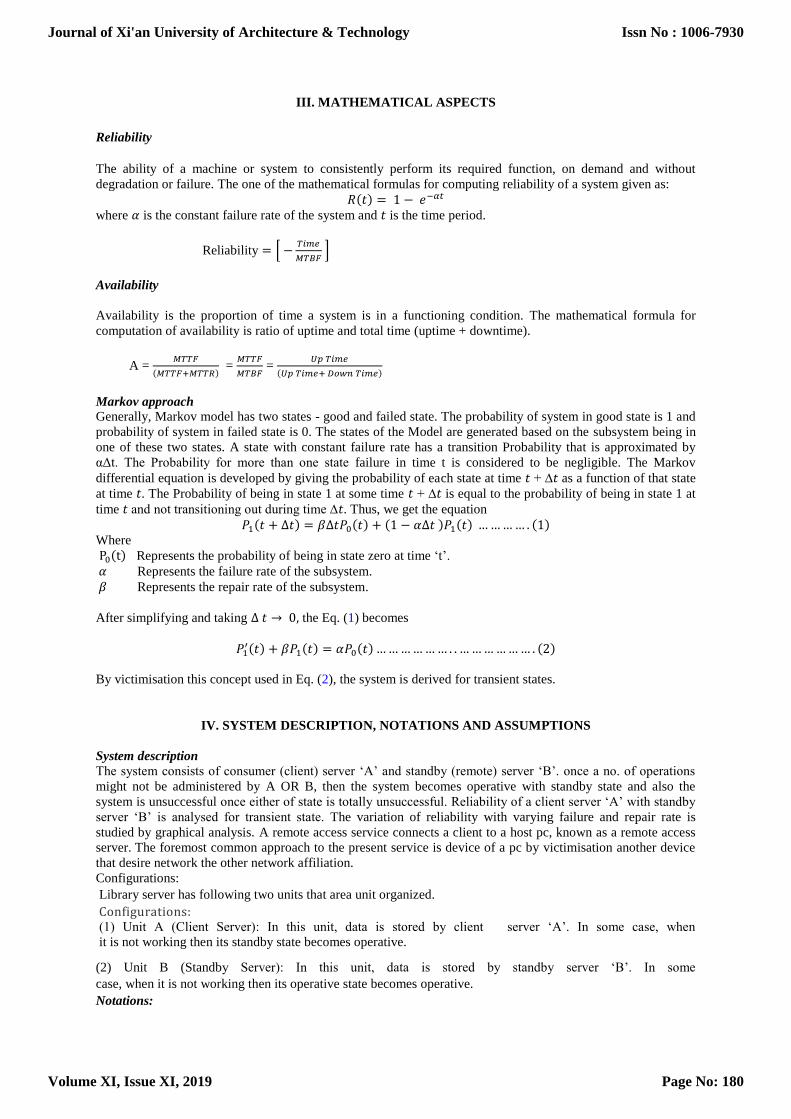
III. MATHEMATICAL ASPECTS
Reliability
The ability of a machine or system to consistently perform its required function, on demand and without
degradation or failure. The one of the mathematical formulas for computing reliability of a system given as:
𝑅(𝑡) = 1 − 𝑒−𝛼𝑡
where 𝛼 is the constant failure rate of the system and 𝑡 is the time period.
Reliability = [ −𝑇𝑖𝑚𝑒
𝑀𝑇𝐵𝐹 ]
Availability
Availability is the proportion of time a system is in a functioning condition. The mathematical formula for
computation of availability is ratio of uptime and total time (uptime + downtime).
A = 𝑀𝑇𝑇𝐹
(𝑀𝑇𝑇𝐹+𝑀𝑇𝑇𝑅) =
𝑀𝑇𝑇𝐹
𝑀𝑇𝐵𝐹 =
𝑈𝑝 𝑇𝑖𝑚𝑒
(𝑈𝑝 𝑇𝑖𝑚𝑒+ 𝐷𝑜𝑤𝑛 𝑇𝑖𝑚𝑒)
Markov approach
Generally, Markov model has two states - good and failed state. The probability of system in good state is 1 and
probability of system in failed state is 0. The states of the Model are generated based on the subsystem being in
one of these two states. A state with constant failure rate has a transition Probability that is approximated by
αΔt. The Probability for more than one state failure in time t is considered to be negligible. The Markov
differential equation is developed by giving the probability of each state at time 𝑡 + ∆𝑡 as a function of that state
at time 𝑡. The Probability of being in state 1 at some time 𝑡 + ∆𝑡 is equal to the probability of being in state 1 at
time 𝑡 and not transitioning out during time ∆𝑡. Thus, we get the equation
𝑃1(𝑡 + ∆𝑡) = 𝛽∆𝑡𝑃0(𝑡) + (1 − 𝛼∆𝑡 )𝑃1(𝑡) … … … … . (1)
Where
P0(t) Represents the probability of being in state zero at time ‘t’.
𝛼 Represents the failure rate of the subsystem.
𝛽 Represents the repair rate of the subsystem.
After simplifying and taking ∆ 𝑡 → 0, the Eq. (1) becomes
𝑃1′(𝑡) + 𝛽𝑃1(𝑡) = 𝛼𝑃0(𝑡) … … … … … … . . … … … … … … . (2)
By victimisation this concept used in Eq. (2), the system is derived for transient states.
IV. SYSTEM DESCRIPTION, NOTATIONS AND ASSUMPTIONS
System description
The system consists of consumer (client) server ‘A’ and standby (remote) server ‘B’. once a no. of operations
might not be administered by A OR B, then the system becomes operative with standby state and also the
system is unsuccessful once either of state is totally unsuccessful. Reliability of a client server ‘A’ with standby
server ‘B’ is analysed for transient state. The variation of reliability with varying failure and repair rate is
studied by graphical analysis. A remote access service connects a client to a host pc, known as a remote access
server. The foremost common approach to the present service is device of a pc by victimisation another device
that desire network the other network affiliation.
Configurations:
Library server has following two units that area unit organized.
Configurations: (1) Unit A (Client Server): In this unit, data is stored by client server ‘A’. In some case, when
it is not working then its standby state becomes operative.
(2) Unit B (Standby Server): In this unit, data is stored by standby server ‘B’. In some
case, when it is not working then its operative state becomes operative.
Notations:
Journal of Xi'an University of Architecture & Technology
Volume XI, Issue XI, 2019
Issn No : 1006-7930
Page No: 180
Full working state of the system.
The system is working in reduced capacity.
Failed state of the system.
A/�̅� /a = unit in full capacity state/reduced state/failed state.
𝑎1 = constant failure rate of server A from full working state to reduced state.
𝑎2 = constant failure rate of server A from reduced state to complete failure.
𝑎3 = constant failure rate of server B from full working state to reduced state.
𝑎4 = constant failure rate of server A from reduced state to complete failure.
𝑏1 = constant repair rates of server A from failed to full working state.
𝑏2 = constant repair rates of server A from reduced to full working state.
𝑏3 = constant repair rates of server B from failed to full working state.
𝑏4 = constant repair rates of server B from reduced to full working state.
𝑃𝑗(𝑡)(𝑗 = 1, 2, 3, … , 13) = Represents the probability that the system is in jth state at time t.
Pj′(t) = ′ Represents derivative with respect t.
Assumptions: We make following assumptions to find out the reliability of the system.
System is analysed for transient state.
System is made redundant to boost out its performance.
System is failed only when either of unit is completely failed.
Individual repairmen are available for repair of server.
Repaired unit is as good as new one.
Failure and repaired rates follow exponentially distribution and are independent of each other.
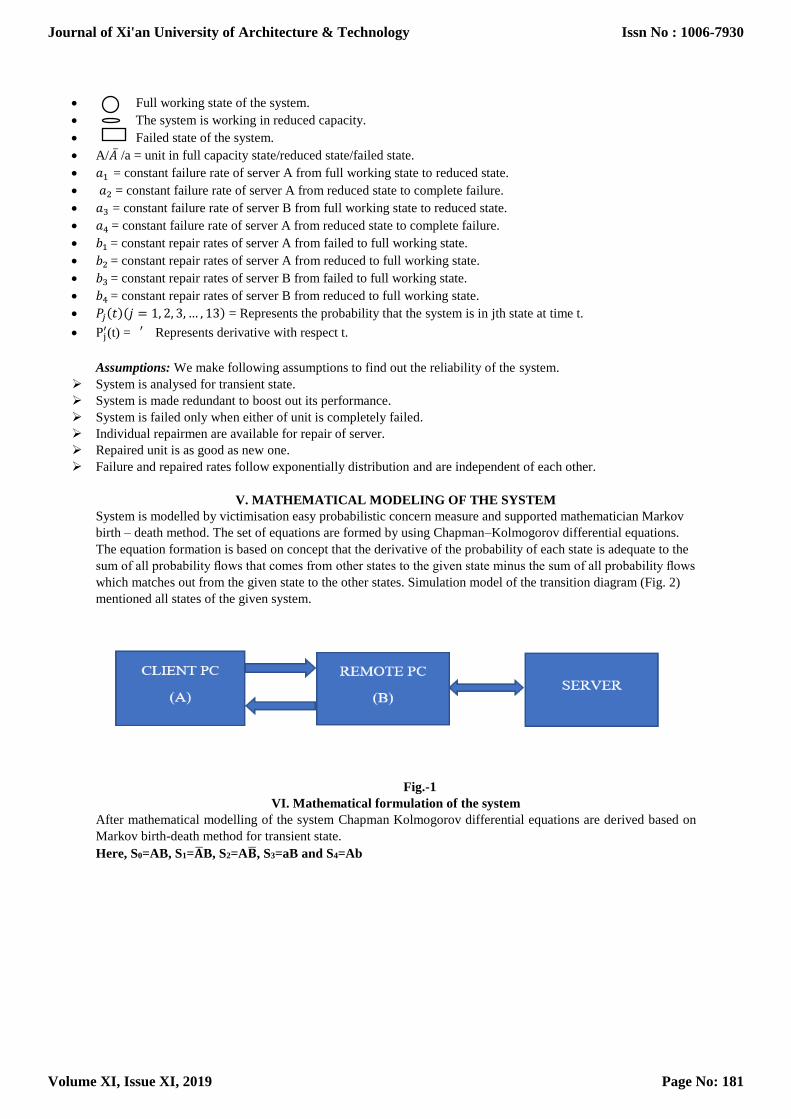
V. MATHEMATICAL MODELING OF THE SYSTEM
System is modelled by victimisation easy probabilistic concern measure and supported mathematician Markov
birth – death method. The set of equations are formed by using Chapman–Kolmogorov differential equations.
The equation formation is based on concept that the derivative of the probability of each state is adequate to the
sum of all probability flows that comes from other states to the given state minus the sum of all probability flows
which matches out from the given state to the other states. Simulation model of the transition diagram (Fig. 2)
mentioned all states of the given system.
Fig.-1
VI. Mathematical formulation of the system
After mathematical modelling of the system Chapman Kolmogorov differential equations are derived based on
Markov birth-death method for transient state.
Here, S0=AB, S1=�̅�B, S2=A�̅�, S3=aB and S4=Ab
Journal of Xi'an University of Architecture & Technology
Volume XI, Issue XI, 2019
Issn No : 1006-7930
Page No: 181
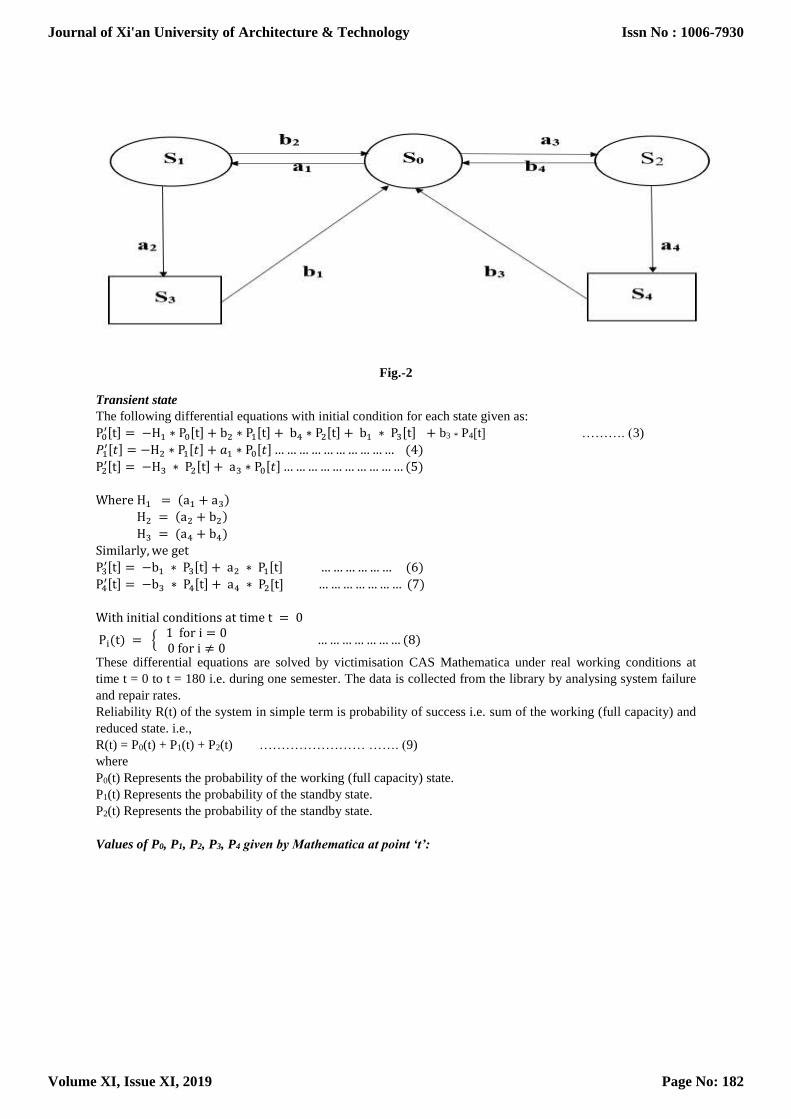
Fig.-2
Transient state
The following differential equations with initial condition for each state given as:
P0′[t] = −H1 ∗ P0[t] + b2 ∗ P1[t] + b4 ∗ P2[t] + b1 ∗ P3[t] + b3 * P4[t] ………. (3)
𝑃1′[𝑡] = −H2 ∗ P1[𝑡] + 𝑎1 ∗ P0[𝑡] … … … … … … … … … … (4)
P2′[t] = −H3 ∗ P2[t] + a3 ∗ P0[𝑡] … … … … … … … … … … (5)
Where H1 = (a1 + a3)
H2 = (a2 + b2)
H3 = (a4 + b4)
Similarly, we get
P3′[t] = −b1 ∗ P3[t] + a2 ∗ P1[t] … … … … … … (6)
P4′[t] = −b3 ∗ P4[t] + a4 ∗ P2[t] … … … … … … … (7)
With initial conditions at time t = 0
Pi(t) = { 1 for i = 00 for i ≠ 0
… … … … … … … (8)
These differential equations are solved by victimisation CAS Mathematica under real working conditions at
time t = 0 to t = 180 i.e. during one semester. The data is collected from the library by analysing system failure
and repair rates.
Reliability R(t) of the system in simple term is probability of success i.e. sum of the working (full capacity) and
reduced state. i.e.,
R(t) = P0(t) + P1(t) + P2(t) …………………… ……. (9)
where
P0(t) Represents the probability of the working (full capacity) state.
P1(t) Represents the probability of the standby state.
P2(t) Represents the probability of the standby state.
Values of P0, P1, P2, P3, P4 given by Mathematica at point ‘t’:
Journal of Xi'an University of Architecture & Technology
Volume XI, Issue XI, 2019
Issn No : 1006-7930
Page No: 182
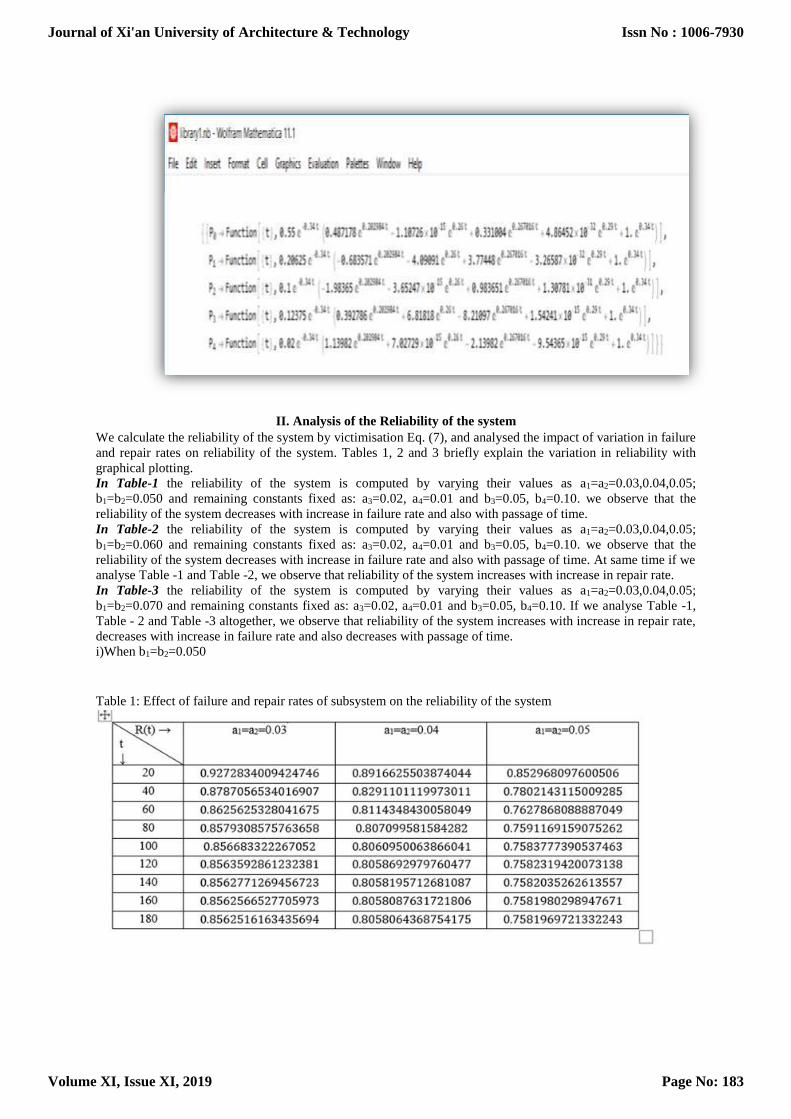
II. Analysis of the Reliability of the system
We calculate the reliability of the system by victimisation Eq. (7), and analysed the impact of variation in failure
and repair rates on reliability of the system. Tables 1, 2 and 3 briefly explain the variation in reliability with
graphical plotting.
In Table-1 the reliability of the system is computed by varying their values as a1=a2=0.03,0.04,0.05;
b1=b2=0.050 and remaining constants fixed as: a3=0.02, a4=0.01 and b3=0.05, b4=0.10. we observe that the
reliability of the system decreases with increase in failure rate and also with passage of time.
In Table-2 the reliability of the system is computed by varying their values as a1=a2=0.03,0.04,0.05;
b1=b2=0.060 and remaining constants fixed as: a3=0.02, a4=0.01 and b3=0.05, b4=0.10. we observe that the
reliability of the system decreases with increase in failure rate and also with passage of time. At same time if we
analyse Table -1 and Table -2, we observe that reliability of the system increases with increase in repair rate.
In Table-3 the reliability of the system is computed by varying their values as a1=a2=0.03,0.04,0.05;
b1=b2=0.070 and remaining constants fixed as: a3=0.02, a4=0.01 and b3=0.05, b4=0.10. If we analyse Table -1,
Table - 2 and Table -3 altogether, we observe that reliability of the system increases with increase in repair rate,
decreases with increase in failure rate and also decreases with passage of time.
i)When b1=b2=0.050
Table 1: Effect of failure and repair rates of subsystem on the reliability of the system
Journal of Xi'an University of Architecture & Technology
Volume XI, Issue XI, 2019
Issn No : 1006-7930
Page No: 183
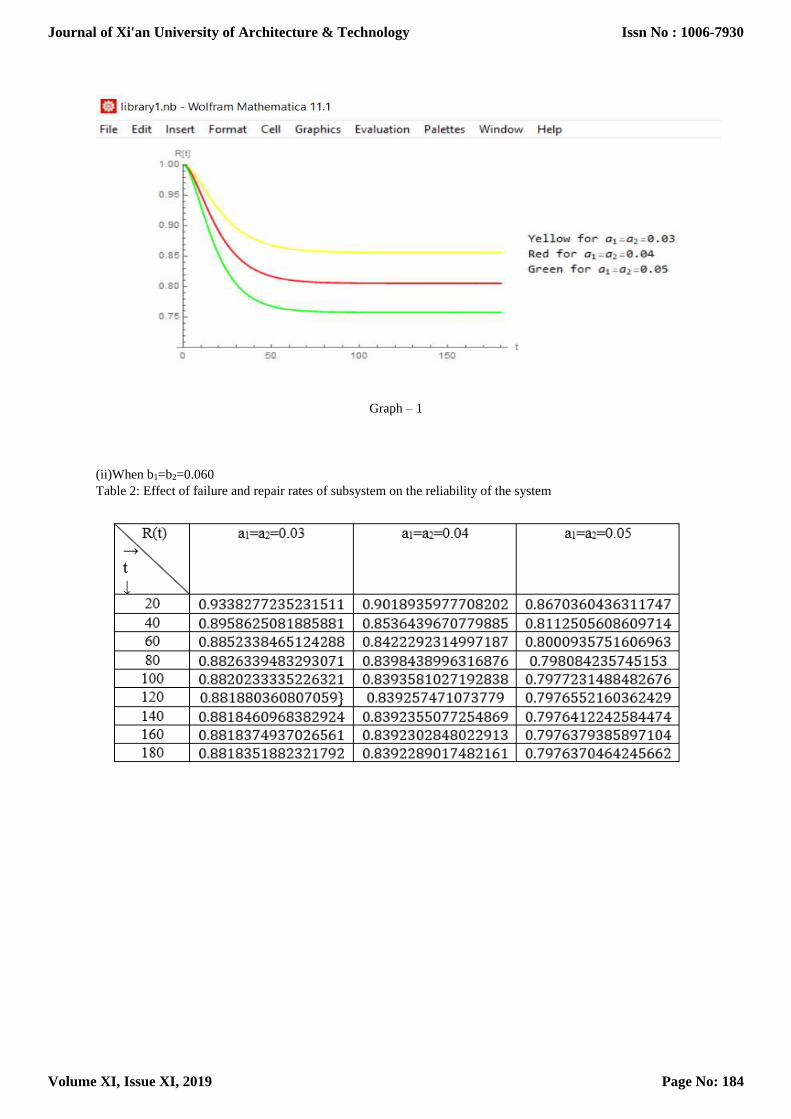
Graph – 1
(ii)When b1=b2=0.060
Table 2: Effect of failure and repair rates of subsystem on the reliability of the system
Journal of Xi'an University of Architecture & Technology
Volume XI, Issue XI, 2019
Issn No : 1006-7930
Page No: 184
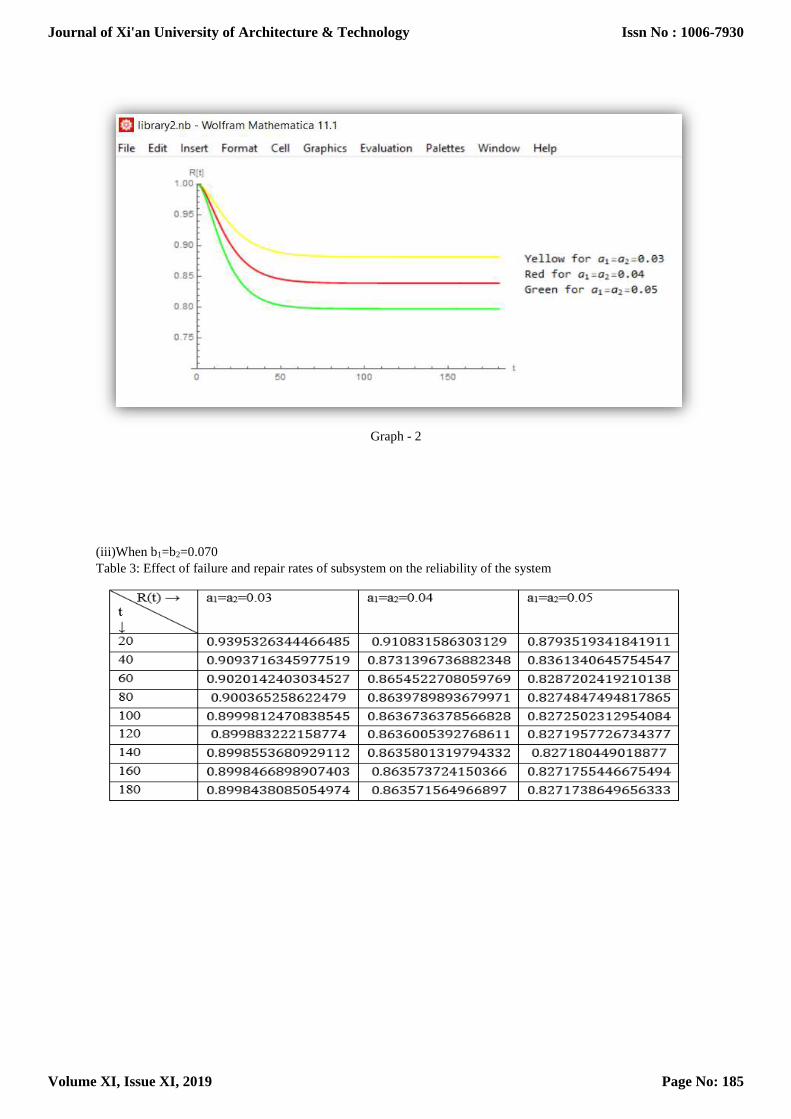
Graph - 2
(iii)When b1=b2=0.070
Table 3: Effect of failure and repair rates of subsystem on the reliability of the system
Journal of Xi'an University of Architecture & Technology
Volume XI, Issue XI, 2019
Issn No : 1006-7930
Page No: 185
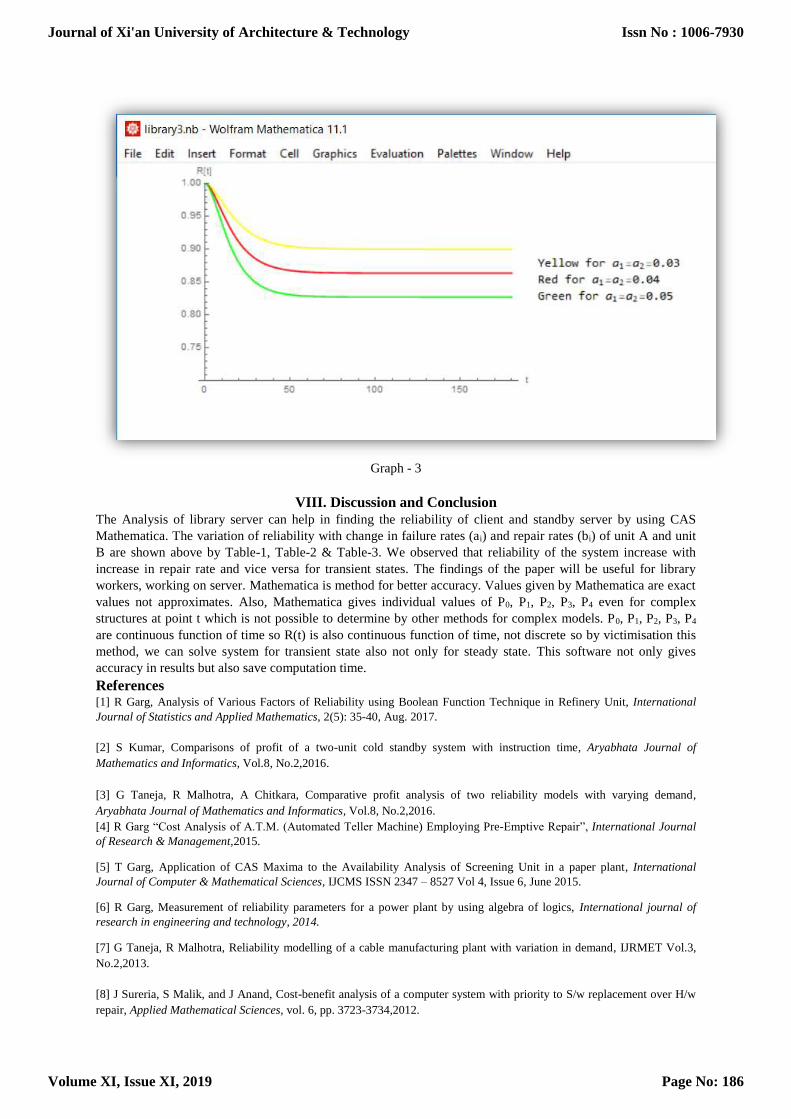
Graph - 3
VIII. Discussion and Conclusion
The Analysis of library server can help in finding the reliability of client and standby server by using CAS
Mathematica. The variation of reliability with change in failure rates (ai) and repair rates (bi) of unit A and unit
B are shown above by Table-1, Table-2 & Table-3. We observed that reliability of the system increase with
increase in repair rate and vice versa for transient states. The findings of the paper will be useful for library
workers, working on server. Mathematica is method for better accuracy. Values given by Mathematica are exact
values not approximates. Also, Mathematica gives individual values of P0, P1, P2, P3, P4 even for complex
structures at point t which is not possible to determine by other methods for complex models. P0, P1, P2, P3, P4
are continuous function of time so R(t) is also continuous function of time, not discrete so by victimisation this
method, we can solve system for transient state also not only for steady state. This software not only gives
accuracy in results but also save computation time.
References [1] R Garg, Analysis of Various Factors of Reliability using Boolean Function Technique in Refinery Unit, International
Journal of Statistics and Applied Mathematics, 2(5): 35-40, Aug. 2017.
[2] S Kumar, Comparisons of profit of a two-unit cold standby system with instruction time, Aryabhata Journal of
Mathematics and Informatics, Vol.8, No.2,2016.
[3] G Taneja, R Malhotra, A Chitkara, Comparative profit analysis of two reliability models with varying demand,
Aryabhata Journal of Mathematics and Informatics, Vol.8, No.2,2016.
[4] R Garg “Cost Analysis of A.T.M. (Automated Teller Machine) Employing Pre-Emptive Repair”, International Journal
of Research & Management,2015.
[5] T Garg, Application of CAS Maxima to the Availability Analysis of Screening Unit in a paper plant, International
Journal of Computer & Mathematical Sciences, IJCMS ISSN 2347 – 8527 Vol 4, Issue 6, June 2015.
[6] R Garg, Measurement of reliability parameters for a power plant by using algebra of logics, International journal of
research in engineering and technology, 2014.
[7] G Taneja, R Malhotra, Reliability modelling of a cable manufacturing plant with variation in demand, IJRMET Vol.3,
No.2,2013.
[8] J Sureria, S Malik, and J Anand, Cost-benefit analysis of a computer system with priority to S/w replacement over H/w
repair, Applied Mathematical Sciences, vol. 6, pp. 3723-3734,2012.
Journal of Xi'an University of Architecture & Technology
Volume XI, Issue XI, 2019
Issn No : 1006-7930
Page No: 186
[9] V.K.Gupta , Analysis of a single unit shock model by using regenerative point graphical technique,
IJCSMS,Vol.11,No.1,2011.
[10] S C Malik, P Chand, and J Singh, Reliability and profit evaluation of an operating system with different repair strategy
subject to degradation, JMASS, Vol.4, No.1,2008.
[11] S.C.Malik, & R.K. Bansal, Profit analysis of a single unit reliability models with repair at different failure modes,
International Conference on Reliability and Safety Engineering, IT Kharagpur(India),pp.577-588,2005.
[12] P Gupta, A K Lal, R K Sharma and R Singh, Behavioural Study of the Cement manufacturing Plant – A Numerical
Approach”, Journal of Mathematics and Systems Sciences, 1, pp.50-70,2005.
Journal of Xi'an University of Architecture & Technology
Volume XI, Issue XI, 2019
Issn No : 1006-7930
Page No: 187