Embed Size (px)
DESCRIPTION
Carrots, sticks, and engagement and assessment strategies (case study) Sean Ryan School of Physics, Astronomy and Mathematics. Mathematics culture Numerate, logical & methodical rich in concepts and their application Case module - PowerPoint PPT Presentation
Citation preview

Carrots, sticks, and engagement and assessment strategies
(case study)
Sean RyanSchool of Physics, Astronomy and Mathematics
Mathematics culture• Numerate, logical & methodical• rich in concepts and their application
Case module• 1st year, Sem. A. Module taken by all (~100) 1st year maths
students: “Financial and Actuarial Mathematics”• All materials on StudyNet
– so some students think they can “go solo”

The problem: persistent high failure rates
Impervious to style of teaching:• change of lecturer: DTB = 36%, SGR = 37% s.e.≈4%
no significant difference
• labs/no labs: labs = 37%, none = 37% s.e.≈3%(use class time “better”; move “lab” work to assignments)no significant difference; labs not a motivator
2
Academic year 2005/06 2006/07 2007/08 2008/09 2009/10 2010/11 2011/12
Post-resit failure rate (%)
30 39 32 41 41
Lecturer DTB SGR SGR DTB SGR
Labs held? labs labs N labs N
The problem: persistent high failure rates
Attendance important in PAM• Clear correlations between attendance and grade:
missing 1 class [e.g. out of 24] = lower grade by ~2-3%• Students with lower UCAS scores attend fewer classes• → PAM retention strategy focuses on achieving high
attendance and class contact
3
Building engagement, 2010/11
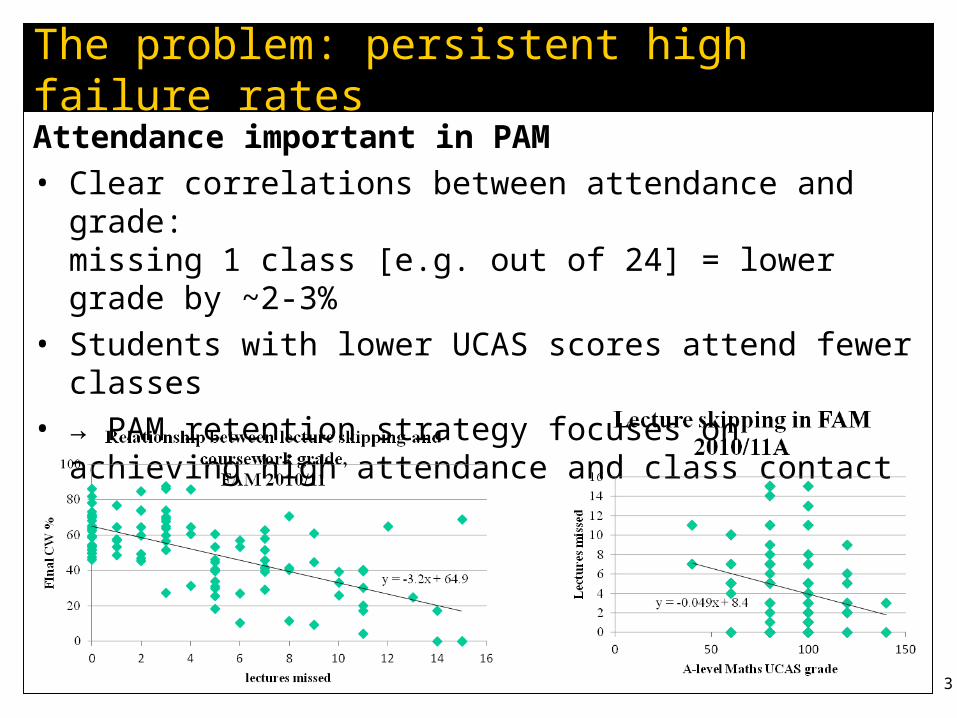
• 2005-09 = 37% (s.e.=2%), 2010 = 22%, • ? Regular low stakes marked homework w/feedback? –
exhausting!• ? Formative EVS?
• ? Role of improved UCAS score?4
Academic year 2005/06 2006/07 2007/08 2008/09 2009/10 2010/11 2011/12
Post-resit failure rate (%)
30 39 32 41 41 22
Lecturer DTB SGR SGR DTB SGR SGR
Labs held? labs labs N labs N N
Marked homewk N N N N N Y
EVS (formative) N N N N N Y
av. UCAS score 244 234 198 231 238 269
Building engagement, 2010/11
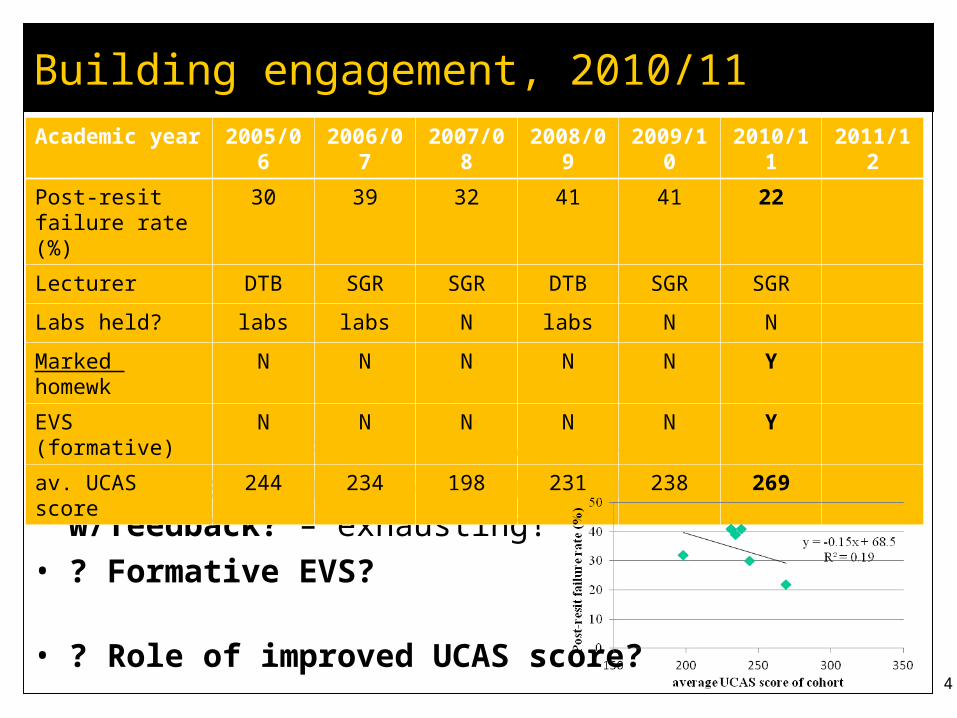
Formative EVS: a carrot for attendance & engagement?
Used for short reality checks during class:
for student: question own understanding;
for lecturer: discover what students have understood
Also:
promotes discussion that overcomes misunderstandings;
helps avoid monotony ?
creates interactive element presumed useful;
builds engagement ?
Look for evidence of attendance ...(mild proxy for engagement)
5
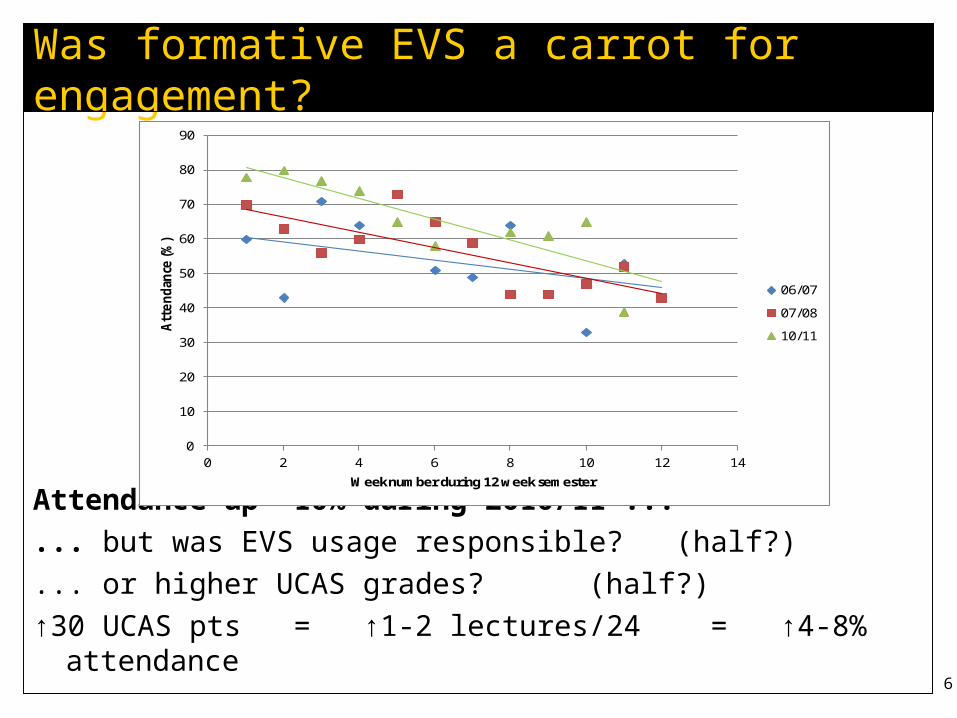
Was formative EVS a carrot for engagement?
Attendance up ~10% during 2010/11 ...
... but was EVS usage responsible? (half?)
... or higher UCAS grades? (half?)
↑30 UCAS pts = ↑1-2 lectures/24 = ↑4-8% attendance 6
0
10
20
30
40
50
60
70
80
90
0 2 4 6 8 10 12 14
Att
en
dan
ce (%
)
Week number during 12 week semester
06/07
07/08
10/11
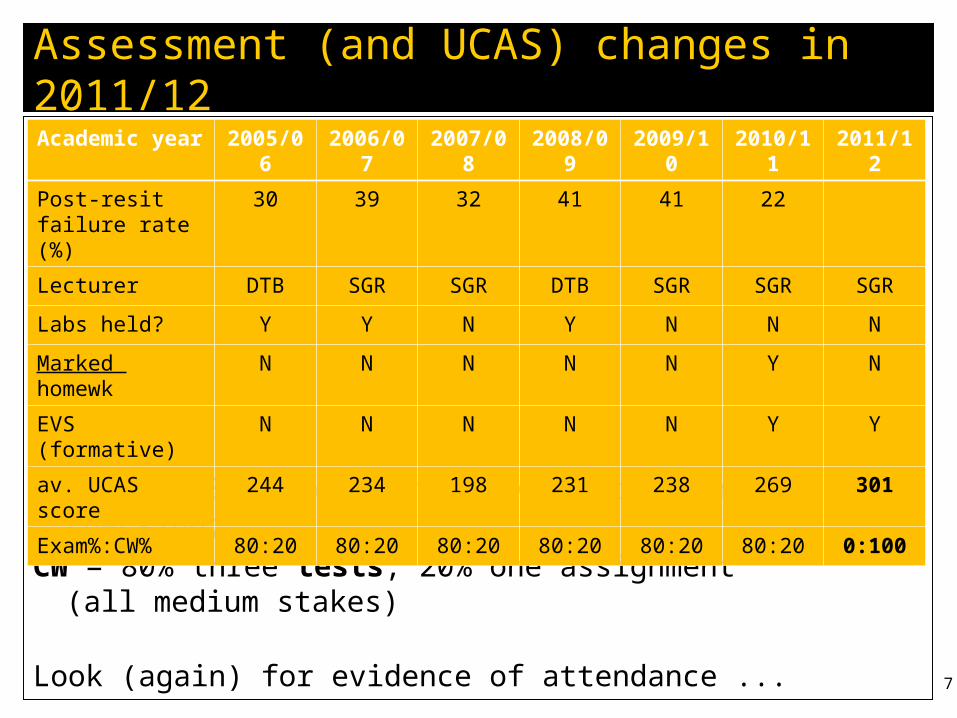
Assessment (and UCAS) changes in 2011/12
Formative EVS used for daily feedback and reality checking;
CW = 80% three tests, 20% one assignment (all medium stakes)
Look (again) for evidence of attendance ... 7
Academic year 2005/06 2006/07 2007/08 2008/09 2009/10 2010/11 2011/12
Post-resit failure rate (%)
30 39 32 41 41 22
Lecturer DTB SGR SGR DTB SGR SGR SGR
Labs held? Y Y N Y N N N
Marked homewk N N N N N Y N
EVS (formative) N N N N N Y Y
av. UCAS score 244 234 198 231 238 269 301
Exam%:CW% 80:20 80:20 80:20 80:20 80:20 80:20 0:100
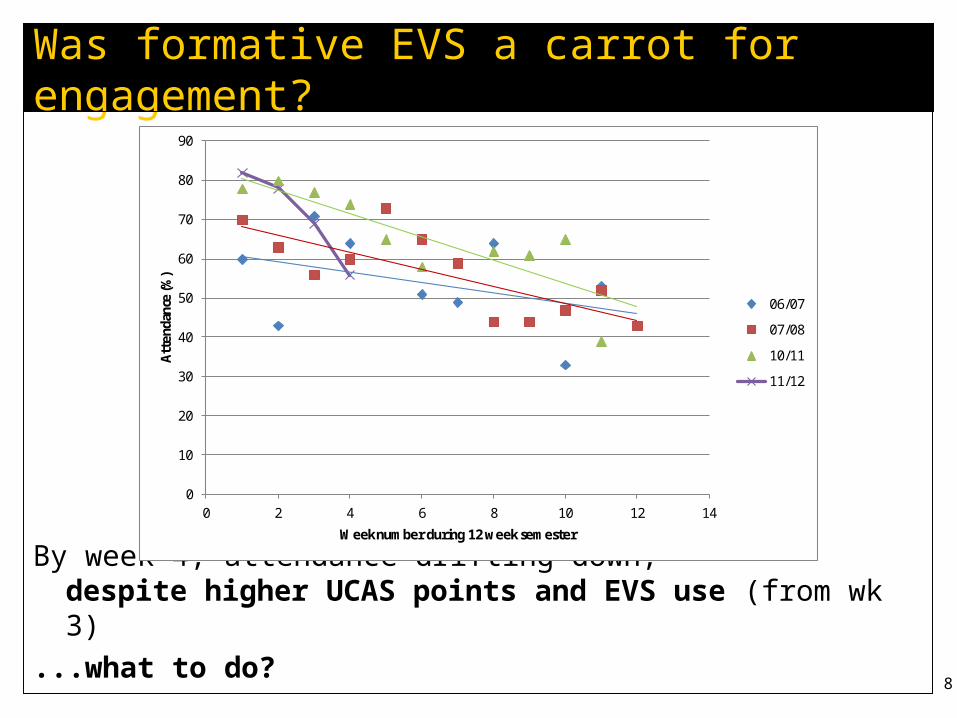
Was formative EVS a carrot for engagement?
By week 4, attendance drifting down, despite higher UCAS points and EVS use (from wk 3)
...what to do? 8
0
10
20
30
40
50
60
70
80
90
0 2 4 6 8 10 12 14
Att
enda
nce
(%)
Week number during 12 week semester
06/07
07/08
10/11
11/12
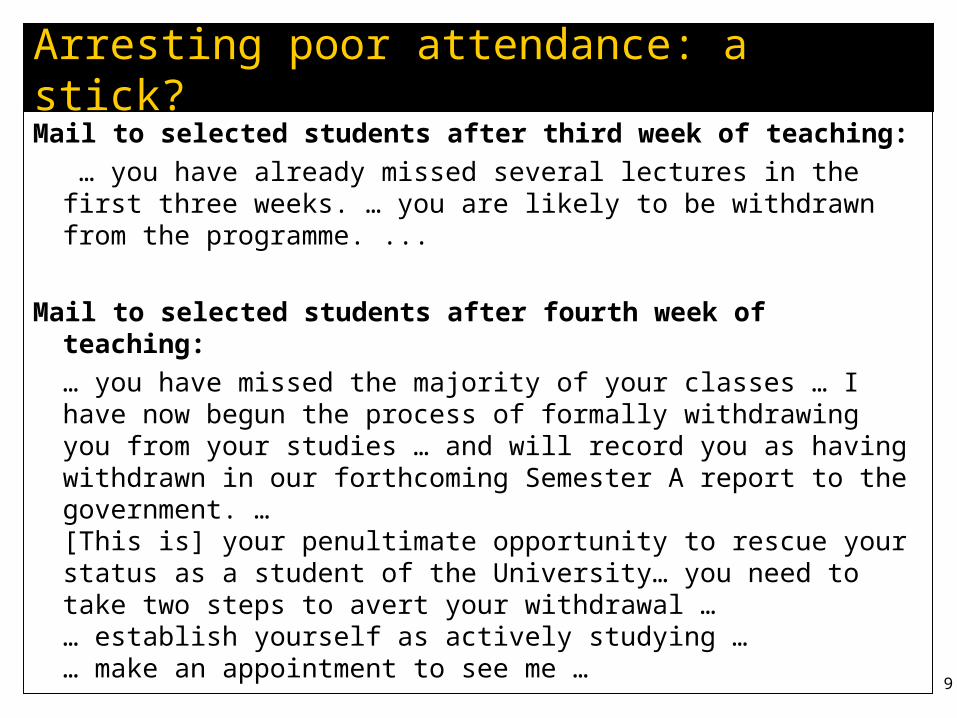
Arresting poor attendance: a stick?
Mail to selected students after third week of teaching:
… you have already missed several lectures in the first three weeks. … you are likely to be withdrawn from the programme. ...
Mail to selected students after fourth week of teaching:
… you have missed the majority of your classes … I have now begun the process of formally withdrawing you from your studies … and will record you as having withdrawn in our forthcoming Semester A report to the government. … [This is] your penultimate opportunity to rescue your status as a student of the University… you need to take two steps to avert your withdrawal …… establish yourself as actively studying … … make an appointment to see me …
9

Arresting poor attendance: a stick?
Probably, word spread.
By week 5, attendance rose 20% above previous year ... and stayed higher all semester – with no more emails.
10
0
10
20
30
40
50
60
70
80
90
100
0 2 4 6 8 10 12 14
Att
en
dan
ce (%
)
Week number during 12 week semester
06/07
07/08
10/11
11/12
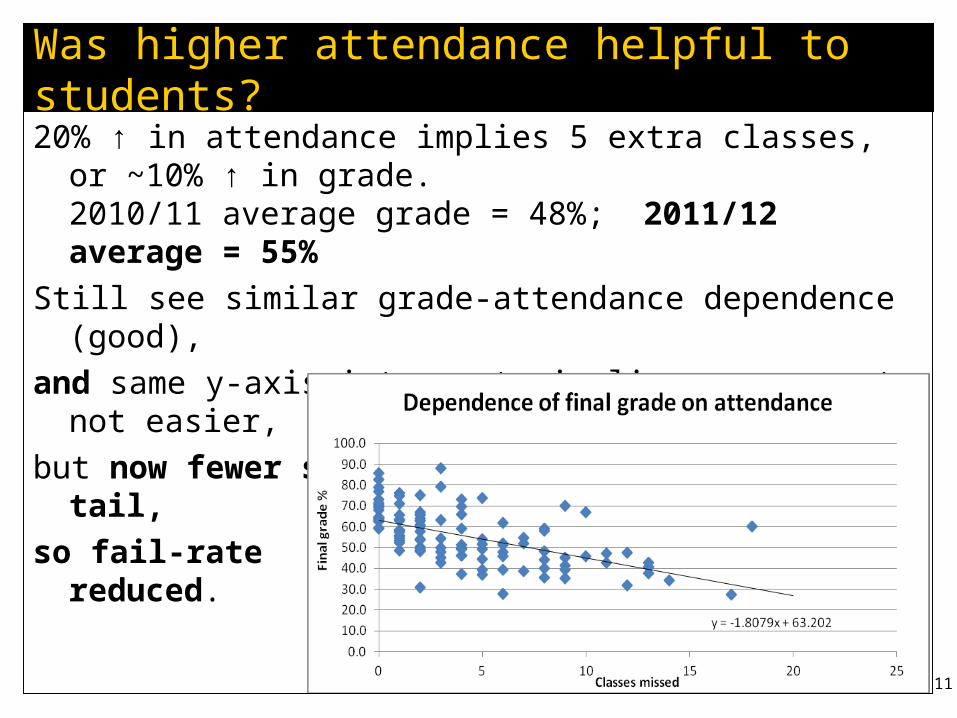
Was higher attendance helpful to students?
20% ↑ in attendance implies 5 extra classes, or ~10% ↑ in grade. 2010/11 average grade = 48%; 2011/12 average = 55%
Still see similar grade-attendance dependence (good),
and same y-axis intercept implies assessment not easier,
but now fewer students in poor-attendance tail,
so fail-rate reduced.
11
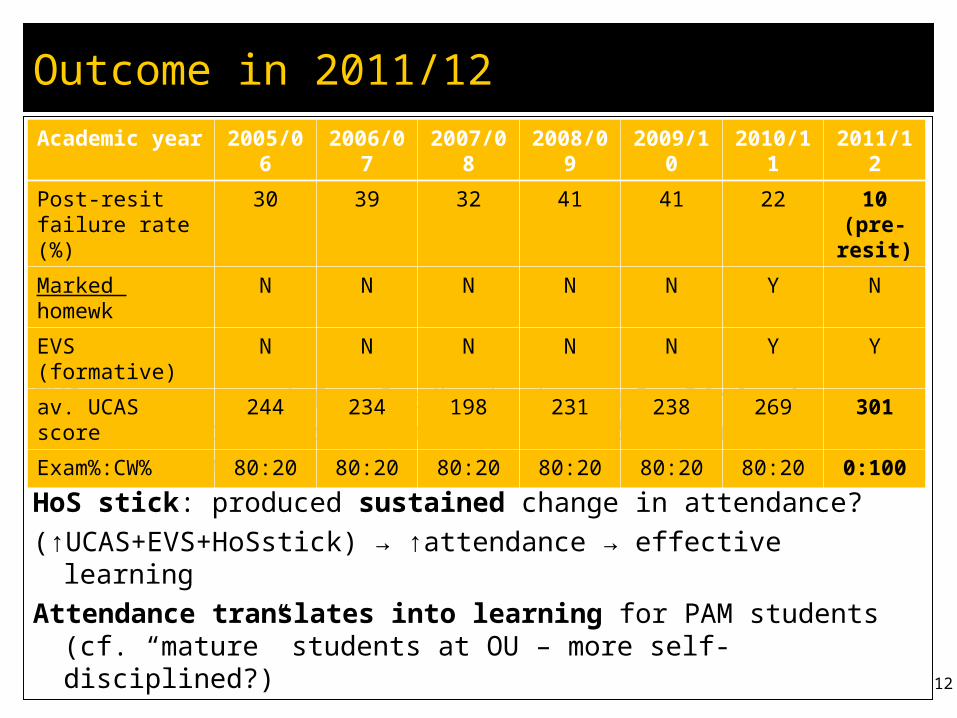
Outcome in 2011/12
Conclusions:
EVS carrot: good for feedback, but only limited evidence it improved attendance (↑5%?) or achievement
HoS stick: produced sustained change in attendance?
(↑UCAS+EVS+HoSstick) → ↑attendance → effective learning
Attendance translates into learning for PAM students(cf. “mature” students at OU – more self-disciplined?)
12
Academic year 2005/06 2006/07 2007/08 2008/09 2009/10 2010/11 2011/12
Post-resit failure rate (%)
30 39 32 41 41 22 10 (pre-resit)
Marked homewk N N N N N Y N
EVS (formative) N N N N N Y Y
av. UCAS score 244 234 198 231 238 269 301
Exam%:CW% 80:20 80:20 80:20 80:20 80:20 80:20 0:100