Embed Size (px)
Citation preview
Mathematics Curriculum: Grade Seven Pre-Algebra
Born On & Board Approved: July 25, 2017 Re-Adopted: January 2, 2019
The following maps outline the New Jersey Student Learning Standards for grade seven mathematics determined by the State Standards Initiative. Below is a list of assessment tools that are recommended for tracking student progress in these areas. In addition, resources that can be used in conjunction with instruction of these standards are provided but not limited to the list below. Assessment: Formative Assessment Class-Work Review Open-Ended Problems Project-Based Assessment Self-Assessment Teacher Observation End of Year Assessment Group & Cooperative Work Benchmark Assessment Math Software (ex. Study Island) Homework Review Summative Assessment Resources: _ Math Journals Center Games Tangrams Bar Models Ten Frame Geometric Shapes Math Word Wall Protractors Geo-Board Connecting Cubes Mini White Boards Textbooks Number Line Manipulatives Rulers Grid Paper Math Songs/Poems Three Dimensional Shapes Computer Software Calculators Wiki-Sticks Interactive White Board Fraction Tiles Pattern Blocks Compass Measurement Tools Websites: http://www.aplusmath.com www.wolframalpha.com www.interactmath.com www.illustrativemathematics.org http://www.studyisland.com www.kutasoftware.com www.number2.com www.buzzmath.com
http://www.funbrain.com www.illuminations.nctm.org www.khanacademy.org www.ixl.com
http://www.songsforteaching.com www.betterlesson.com www.howthestockmarketowrks.com www.purplemath.com References: http://www.state.nj.us/education/aps/cccs/math/
NJ Technology Standards: http://www.state.nj.us/education/cccs/2014/tech/8.pdf
NJ Career Ready Practices: http://www.state.nj.us/education/aps/cccs/career/
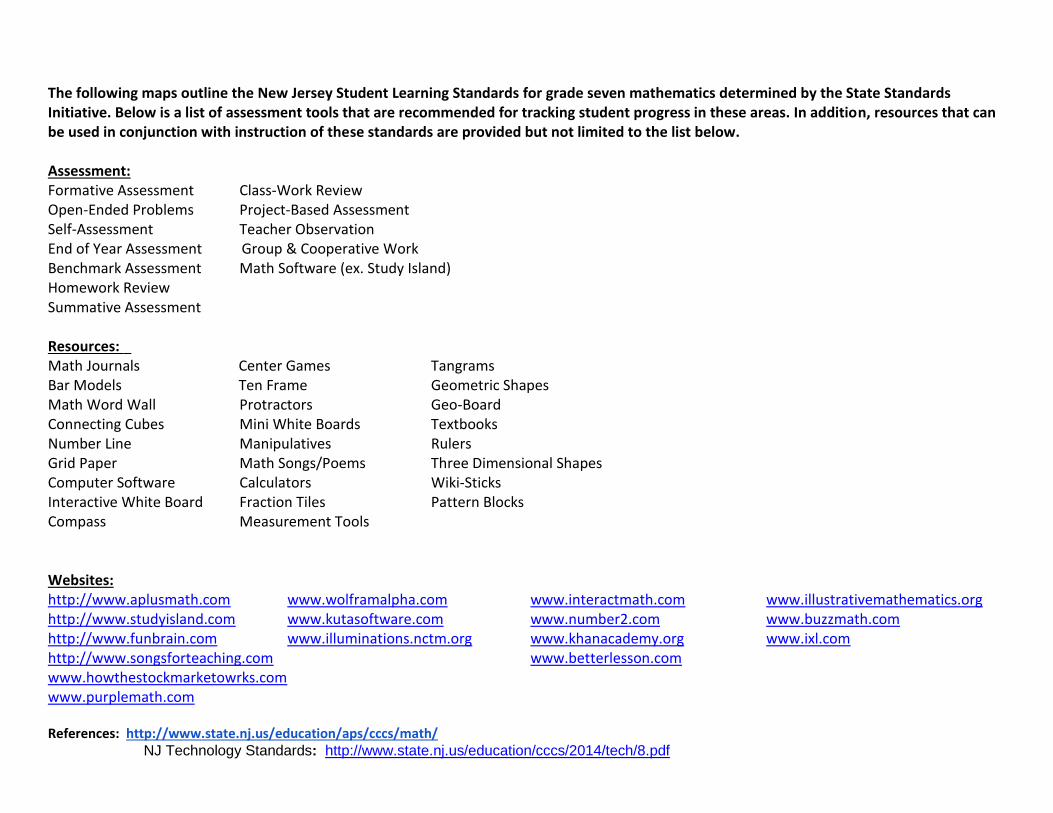
Standards for Mathematical Practice
MP. 1 - Make Sense of problems and persevere in solving them.
MP. 2 - Reason Abstractly and Quantitatively
Mp. 3 - Construct Viable Arguments and Critique the Reasoning of Others
MP. 4 - Model with Mathematics
MP. 5 - Use Appropriate Tools Strategically
MP. 6 - Attend to Precision
MP. 7 - Look for and make use of Structure
MP. 8 - Look for and Express Regularity in Repeated Reasoning
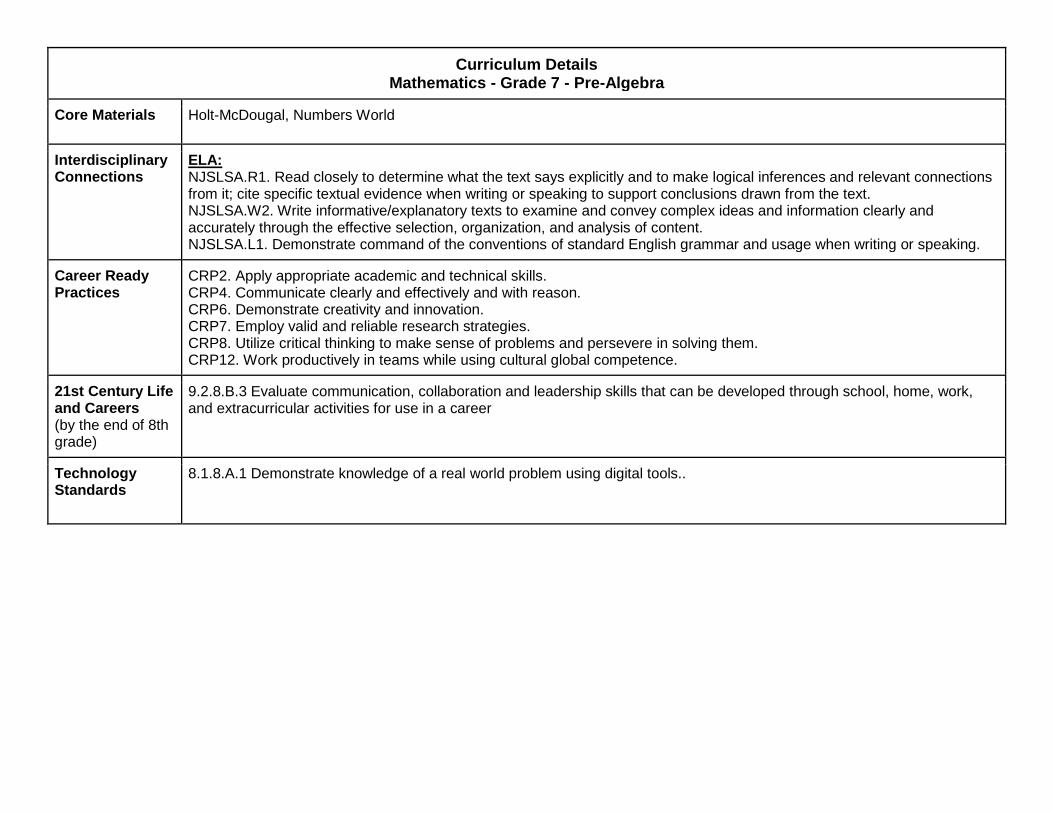
Curriculum Details Mathematics - Grade 7 - Pre-Algebra
Core Materials Holt-McDougal, Numbers World
Interdisciplinary Connections
ELA: NJSLSA.R1. Read closely to determine what the text says explicitly and to make logical inferences and relevant connections from it; cite specific textual evidence when writing or speaking to support conclusions drawn from the text. NJSLSA.W2. Write informative/explanatory texts to examine and convey complex ideas and information clearly and accurately through the effective selection, organization, and analysis of content. NJSLSA.L1. Demonstrate command of the conventions of standard English grammar and usage when writing or speaking.
Career Ready Practices
CRP2. Apply appropriate academic and technical skills. CRP4. Communicate clearly and effectively and with reason. CRP6. Demonstrate creativity and innovation. CRP7. Employ valid and reliable research strategies. CRP8. Utilize critical thinking to make sense of problems and persevere in solving them. CRP12. Work productively in teams while using cultural global competence.
21st Century Life and Careers (by the end of 8th grade)
9.2.8.B.3 Evaluate communication, collaboration and leadership skills that can be developed through school, home, work, and extracurricular activities for use in a career
Technology Standards
8.1.8.A.1 Demonstrate knowledge of a real world problem using digital tools..
Math Curriculum Grade Seven Pre-Algebra
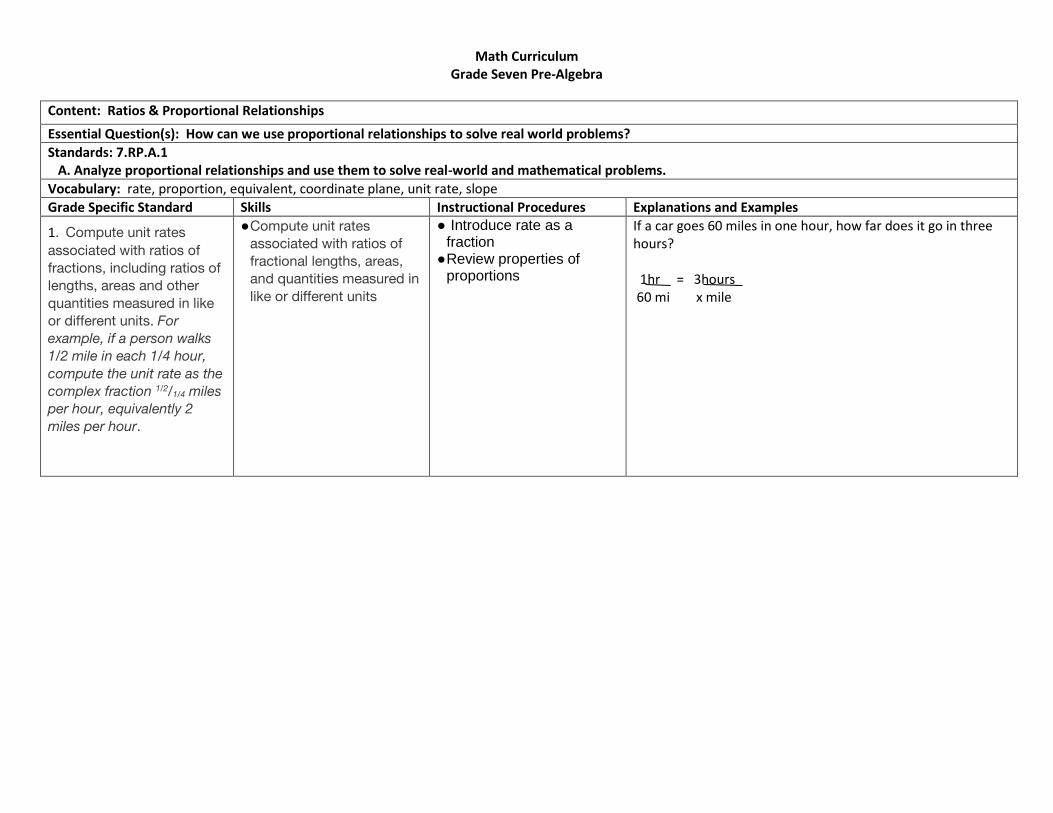
Content: Ratios & Proportional Relationships
Essential Question(s): How can we use proportional relationships to solve real world problems?
Standards: 7.RP.A.1 A. Analyze proportional relationships and use them to solve real-world and mathematical problems.
Vocabulary: rate, proportion, equivalent, coordinate plane, unit rate, slope
Grade Specific Standard Skills Instructional Procedures Explanations and Examples
1. Compute unit rates
associated with ratios of
fractions, including ratios of lengths, areas and other
quantities measured in like
or different units. For example, if a person walks
1/2 mile in each 1/4 hour,
compute the unit rate as the complex fraction 1/2/1/4 miles
per hour, equivalently 2 miles per hour.
● Compute unit rates associated with ratios of
fractional lengths, areas, and quantities measured in
like or different units
● Introduce rate as a fraction
● Review properties of proportions
If a car goes 60 miles in one hour, how far does it go in three hours? 1hr = 3hours 60 mi x mile
2. Recognize and represent
proportional relationships
between quantities.
2a: Decide whether two
quantities are in a
proportional relationship,
e.g., by testing for equivalent ratios in a table
or graphing on a coordinate
plane and observing whether the graph is a
straight line through the
origin.
2b: Identify the constant of proportionality (unit rate) in
tables, graphs, equations,
diagrams, and verbal
descriptions of proportional
relationships.
2c: Represent proportional relationships by equations.
For example, if total cost t is
proportional to the number
n of items purchased at a constant price p, the relationship between the
total cost and the number of
items can be expressed as t
= pn.
2d: Explain what a point (x, y) on the graph of a
proportional relationship
means in terms of the situation, with special
attention to the points (0, 0)
and (1, r) where r is the unit
rate.
● Determine whether two ratios are equivalent
● Decide whether two quantities are in a proportional relationship
● Identify the constant of proportionality (unit rate) in tables, graphs, equations, diagrams, and verbal descriptions of proportional relationships.
● Represent proportional relationships by equations.
● Explain what a point (x, y) on the graph of a proportional relationship means in terms of the situation.
● Demonstrate proportional relationships between quantities (ex. using cross multiplication)
● Demonstrate relationship between slope and proportion
● Demonstrate how to interpret a graph
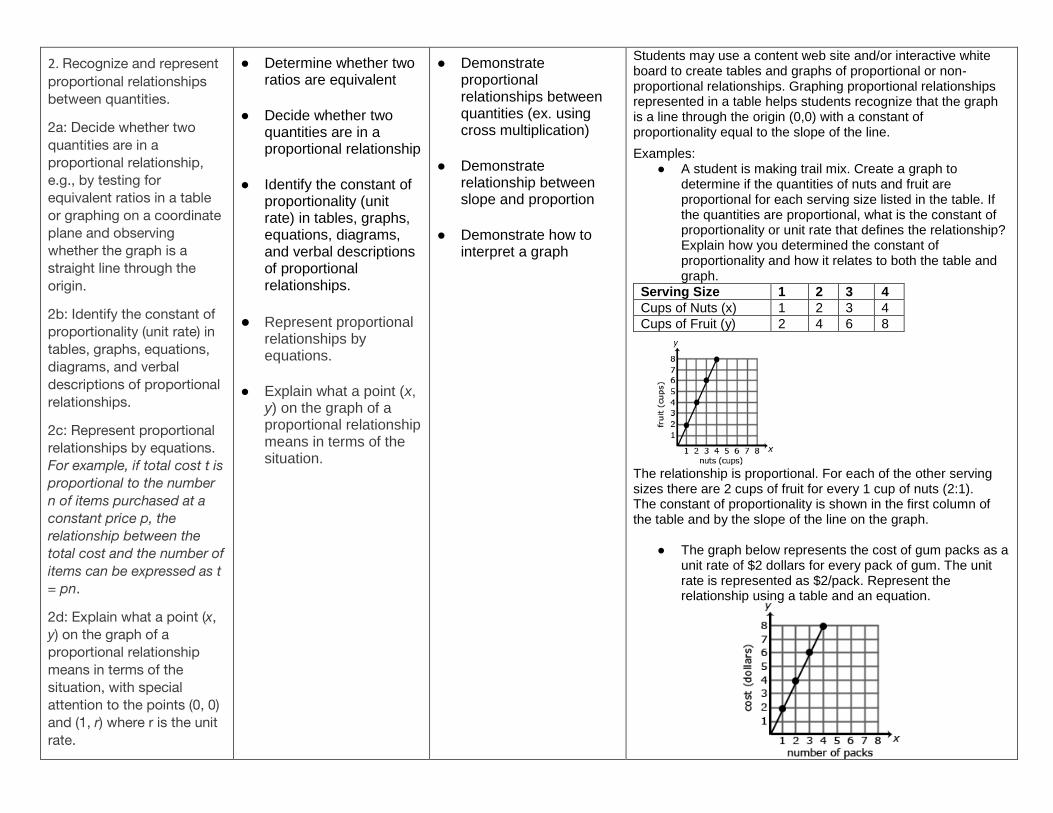
Students may use a content web site and/or interactive white board to create tables and graphs of proportional or non-proportional relationships. Graphing proportional relationships represented in a table helps students recognize that the graph is a line through the origin (0,0) with a constant of proportionality equal to the slope of the line.
Examples: ● A student is making trail mix. Create a graph to
determine if the quantities of nuts and fruit are proportional for each serving size listed in the table. If the quantities are proportional, what is the constant of proportionality or unit rate that defines the relationship? Explain how you determined the constant of proportionality and how it relates to both the table and graph.
Serving Size 1 2 3 4
Cups of Nuts (x) 1 2 3 4
Cups of Fruit (y) 2 4 6 8
The relationship is proportional. For each of the other serving sizes there are 2 cups of fruit for every 1 cup of nuts (2:1). The constant of proportionality is shown in the first column of the table and by the slope of the line on the graph.
● The graph below represents the cost of gum packs as a unit rate of $2 dollars for every pack of gum. The unit rate is represented as $2/pack. Represent the relationship using a table and an equation.
Table:
Number of Packs of Gum (g) Cost in Dollars (d)
0 0
1 2
2 4
3 6
4 8
Equation: 2g = d, where d is the cost in dollars and g is the packs of gum
A common error is to reverse the position of the variables when writing equations. Students may find it useful to use variables specifically related to the quantities rather than using x and y. Constructing verbal models can also be helpful. A student might describe the situation as “the number of packs of gum times the cost for each pack is the total cost in dollars.” They can use this verbal model to construct the equation. Students can check their equation by substituting values and comparing their results to the table. The checking process helps student revise and recheck their model as necessary. The number of packs of gum times the cost for each pack is the total cost (g x 2 = d).
3. Use proportional
relationships to solve multistep ratio and percent problems. Examples: simple
interest, tax, markups and
markdowns, gratuities and
commissions, fees, percent
increase and decrease, percent error
● Use proportional relationships to solve
multistep ratio problems
● Use proportional relationships to solve multistep percent
problems
● Review vocabulary (simple interest, tax,
markups and markdowns, gratuities and commissions, fees,
percent increase and
decrease, percent error)
Students should be able to explain or show their work using a representation (numbers, words, pictures, physical objects, or equations) and verify that their answer is reasonable. Models help students to identify the parts of the problem and how the values are related. For percent increase and decrease, students identify the starting value, determine the difference, and compare the difference in the two values to the starting value.
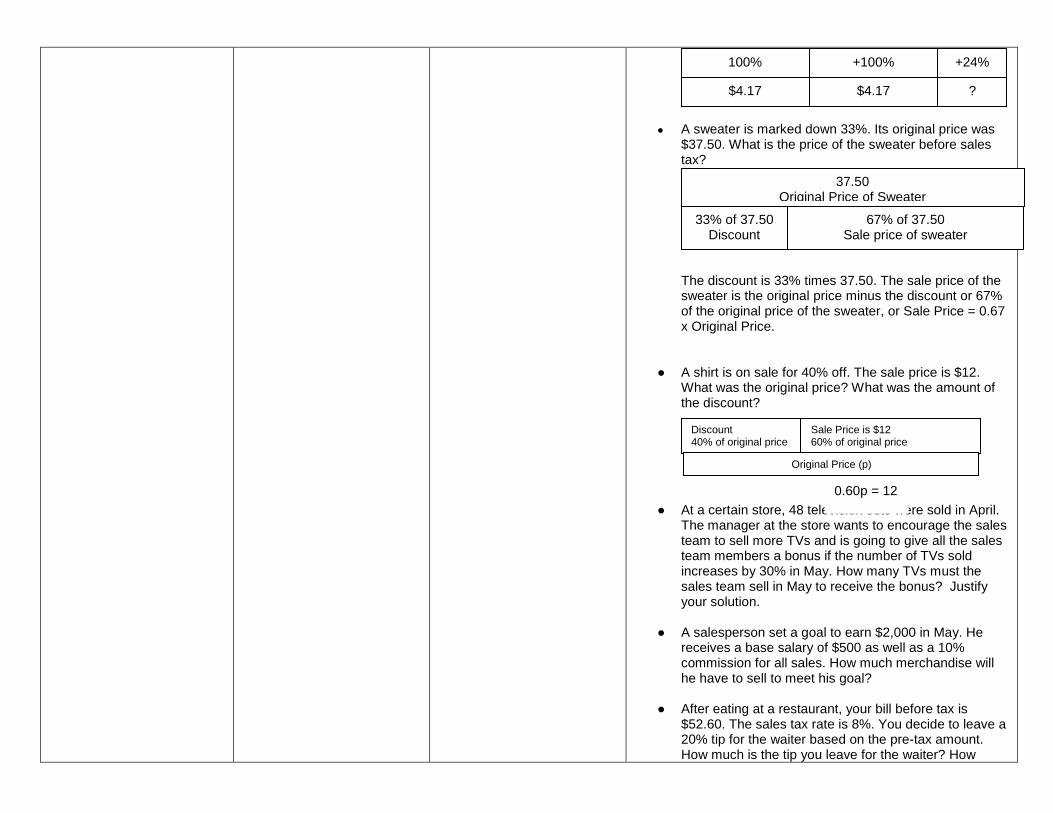
Examples: ● Gas prices are projected to increase 124% by April 2015. A gallon of gas currently costs $4.17. What is the projected cost of a gallon of gas for April 2015?
A student might say: “The original cost of a gallon of gas is $4.17. An increase of 100% means that the cost will double. I will also need to add another 24% to figure out the final projected cost of a gallon of gas. Since 25% of $4.17 is about $1.04, the projected cost of a gallon of gas should be around $9.40.”
$4.17 + 4.17 + (0.24 4.17) = 2.24 x 4.17
● A sweater is marked down 33%. Its original price was $37.50. What is the price of the sweater before sales tax?
The discount is 33% times 37.50. The sale price of the sweater is the original price minus the discount or 67% of the original price of the sweater, or Sale Price = 0.67 x Original Price.
● A shirt is on sale for 40% off. The sale price is $12. What was the original price? What was the amount of the discount?
● At a certain store, 48 television sets were sold in April. The manager at the store wants to encourage the sales team to sell more TVs and is going to give all the sales team members a bonus if the number of TVs sold increases by 30% in May. How many TVs must the sales team sell in May to receive the bonus? Justify your solution.
● A salesperson set a goal to earn $2,000 in May. He
receives a base salary of $500 as well as a 10% commission for all sales. How much merchandise will he have to sell to meet his goal?
● After eating at a restaurant, your bill before tax is $52.60. The sales tax rate is 8%. You decide to leave a 20% tip for the waiter based on the pre-tax amount. How much is the tip you leave for the waiter? How
100%
$4.17
+100%
$4.17
+24%
?
37.50 Original Price of Sweater
33% of 37.50 Discount
67% of 37.50 Sale price of sweater
Discount 40% of original price
Sale Price is $12 60% of original price
Original Price (p)
0.60p = 12
much will the total bill be, including tax and tip? Express your solution as a multiple of the bill. The amount paid = 0.20 x $52.50 + 0.08 x $52.50 = 0.28 x $52.50
● Students will find interest rates of various banks and
determine the balance of their accounts after certain amounts of times.
● Students will use the Stock Market Game to explore
investment options and track their gains and losses over time.
Differentiation/Accommodations/Modifications
Gifted and Talented English Language Learners Students with Disabilities Students at Risk of School Failure
● Students will create a written report on their stock market project.
● Students will create a brochure on how to use mental math to calculate percents quickly.
● Students can create a Black Friday Sales flyer using markdowns to demonstrate their understanding of percents.
● Video clips
● Graphic organizers
● Choose excerpt(s) from book to focus on vocabulary development, comprehension
● Read aloud
● Word Wall ● Build background knowledge
● Partner Work
● For more, see http://www.state.nj.us/education/modelcurriculum/ela/ellscaffolding/3u1.pdf
● Extended time
● Modified assignments
● Small group, alternate location
● Real world unit rate ● Modeling
● Graphic Organizer ● Read aloud problems
● Calculator ● Build background knowledge
● Oral/visual reminders
● Peer assistance
● Written steps for completion. ● Picture associations with
vocabulary
● Graph paper for organization of number placement
● Refer to each student’s IEP for
● RTI strategies including: reciprocal teaching, teacher modeling,
● Tier II and Tier III intervention
● More frequent STAR assessments
● Morning tutoring
● After school program
● Parental contact

more specific modifications
Math Curriculum
Grade Seven Pre-Algebra Content: The Number System
Essential Question(s): How do you apply integer rules to operations involving rational numbers? Why does one need rational numbers? When does one use decimal forms versus fractional forms of rational numbers? In what real world contexts would negative numbers be used?
Standards: 7.NS.A A. Apply and extend previous understandings of operations with fractions.
Vocabulary: additive inverse (opposite), absolute value, operations, terminating decimals, repeating decimal
Grade Specific Standards Skills
Instructional Procedures Explanations and Examples
1. Apply and extend previous
understandings of addition
and subtraction to add and subtract rational numbers;
represent addition and
subtraction on a horizontal or
vertical number line diagram.
1a: Describe situations in which opposite quantities
combine to make 0. For
example, In the first round of a
game, Maria scored 20 points. In the second round of the same game, she lost 20
points. What is her score at
the end of the second round?
1b: Understand p + q as the
number located a distance |q|
from p, in the positive or
negative direction depending
● Describe situations
in which opposite
quantities combine to make 0.
● Understand p + q as
the number located
a distance |q| from p, in the positive or
negative direction depending on
whether q is positive
or negative.
● Show that the
distance between two rational numbers on the
number line is the
absolute value of their difference
on whether q is positive or
negative. Show that a number
and its opposite have a sum of
0 (are additive inverses). Interpret sums of rational
numbers by describing real-
world contexts.
1c: Understand subtraction of
rational numbers as adding
the additive inverse, p – q = p + (–q). Show that the distance
between two rational numbers
on the number line is the absolute value of their
difference, and apply this
principle in real-world
contexts.
1d: Apply properties of
operations as strategies to
add and subtract rational
numbers
2. Apply and extend previous
understandings of
multiplication and division and
of fractions to multiply and
divide rational numbers.
2a: Understand that
multiplication is extended from fractions to rational numbers
by requiring that operations
continue to satisfy the properties of operations,
particularly the distributive
property, leading to products
such as (–1)(–1) = 1 and the
rules for multiplying signed
● Interpret quotients of rational numbers
● Multiply and divide rational numbers.
● Demonstrate how to construct a number line
● Demonstrate integer operations using a number line
● Demonstrate absolute value on a number line
● Demonstrate an additive inverse on a number line
Visual representations may be helpful as students begin this work; they become less necessary as students become more fluent with the operations. Examples:
● Use a number line to illustrate: o p - q
o p + (- q) o Is this equation true p – q = p + (-q)
● -3 and 3 are shown to be opposites on the number line
because they are equal distance from zero and therefore have the same absolute value and the sum of the number and its opposite is zero.
numbers. Interpret products of
rational numbers by describing
real-world contexts.
2b: Understand that integers can be divided, provided that
the divisor is not zero, and
every quotient of integers (with
non-zero divisor) is a rational
number. If p and q are
integers, then –(p/q) = (–p)/q = p/(–q). Interpret quotients of
rational numbers by describing
real-world contexts.
2c: Apply properties of operations as strategies to
multiply and divide rational
numbers.
2d: Convert a rational number
to a decimal using long
division; know that the decimal form of a rational number
terminates in 0s or eventually
repeats.
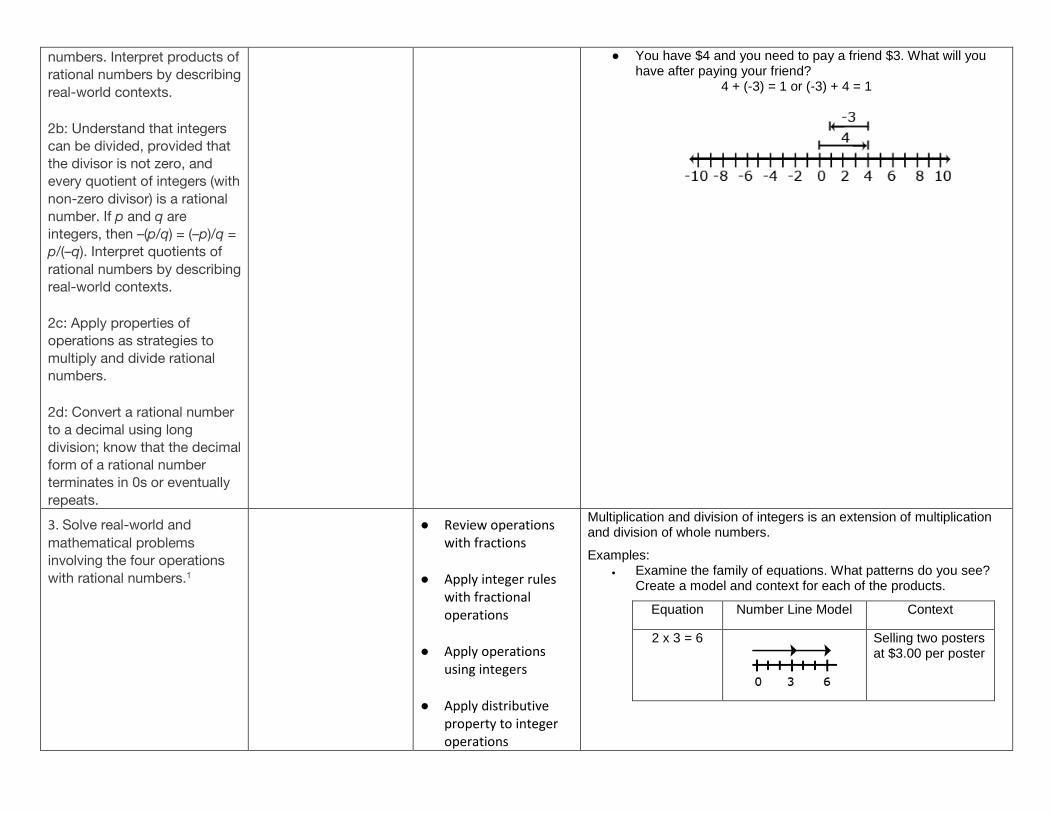
● You have $4 and you need to pay a friend $3. What will you have after paying your friend?
4 + (-3) = 1 or (-3) + 4 = 1
3. Solve real-world and
mathematical problems involving the four operations
with rational numbers.1
●
● Review operations with fractions
● Apply integer rules with fractional operations
● Apply operations using integers
● Apply distributive property to integer operations
Multiplication and division of integers is an extension of multiplication and division of whole numbers.
Examples: ● Examine the family of equations. What patterns do you see?
Create a model and context for each of the products.
Equation Number Line Model Context
2 x 3 = 6
Selling two posters at $3.00 per poster
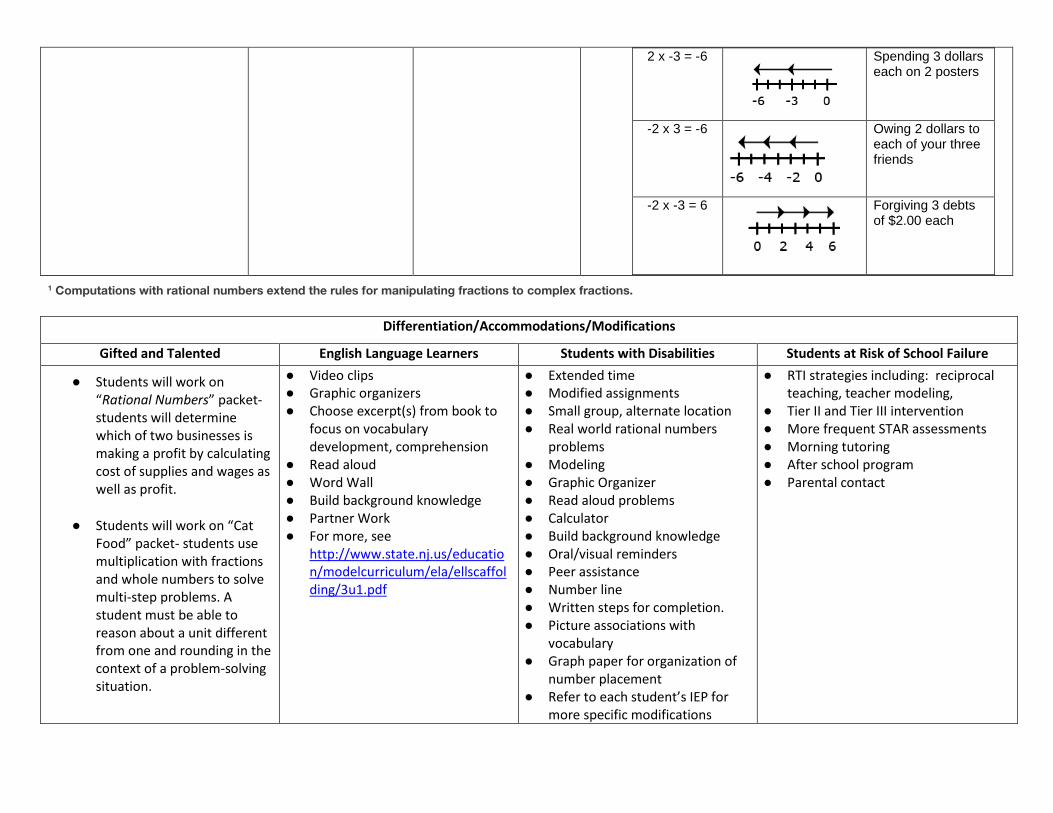
2 x -3 = -6
Spending 3 dollars each on 2 posters
-2 x 3 = -6
Owing 2 dollars to each of your three friends
-2 x -3 = 6
Forgiving 3 debts of $2.00 each
1 Computations with rational numbers extend the rules for manipulating fractions to complex fractions.
Differentiation/Accommodations/Modifications
Gifted and Talented English Language Learners Students with Disabilities Students at Risk of School Failure
● Students will work on “Rational Numbers” packet- students will determine which of two businesses is making a profit by calculating cost of supplies and wages as well as profit.
● Students will work on “Cat Food” packet- students use multiplication with fractions and whole numbers to solve multi-step problems. A student must be able to reason about a unit different from one and rounding in the context of a problem-solving situation.
● Video clips
● Graphic organizers
● Choose excerpt(s) from book to focus on vocabulary development, comprehension
● Read aloud
● Word Wall ● Build background knowledge
● Partner Work
● For more, see http://www.state.nj.us/education/modelcurriculum/ela/ellscaffolding/3u1.pdf
● Extended time
● Modified assignments
● Small group, alternate location
● Real world rational numbers problems
● Modeling
● Graphic Organizer ● Read aloud problems
● Calculator ● Build background knowledge
● Oral/visual reminders
● Peer assistance
● Number line
● Written steps for completion. ● Picture associations with
vocabulary
● Graph paper for organization of number placement
● Refer to each student’s IEP for more specific modifications
● RTI strategies including: reciprocal teaching, teacher modeling,
● Tier II and Tier III intervention
● More frequent STAR assessments
● Morning tutoring
● After school program
● Parental contact

Math Curriculum
Grade Seven Pre-Algebra
Content: Expressions and Equations
Essential Question(s): How can order of operations be used to simplify expressions? How can algebra be used to write expressions in equivalent forms?
Standards: 7.EE.A A. Use properties of operations to generate equivalent expressions.
Vocabulary: expression, equivalent, solution, simplify, evaluate, order of operations, factor, rational, equation, combine like terms, coefficient, variables, constant
Grade Specific Standards
Skills Instructional Procedures Explanations and Examples
1. Apply properties of operations as strategies to add, subtract, factor, and expand linear expressions with rational coefficients.
● Apply properties of operations as strategies to add and subtract expressions with rational coefficients.
● Apply properties of operations as strategies to factor linear expressions with rational coefficients.
● Apply properties of operations as strategies to expand linear expressions with rational coefficients.
● Review order of operations
● Review distributive property
● Review combining like terms
● Review perimeter ● Review GCF/LCM
Examples: ● Write an equivalent expression for
.
● Suzanne thinks the two expressions
and are equivalent. Is she correct? Explain why or why not?
● Write equivalent expressions for:
Possible solutions might include
factoring as in , or other
expressions such as .
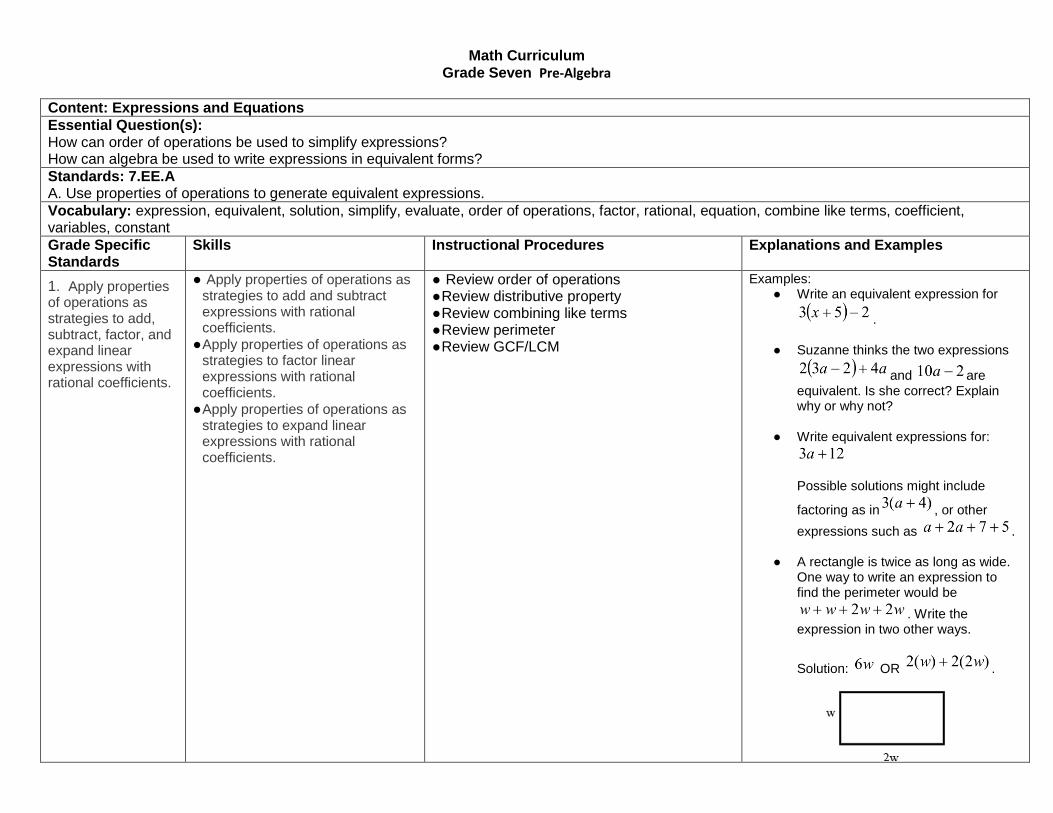
● A rectangle is twice as long as wide. One way to write an expression to find the perimeter would be
. Write the expression in two other ways.
Solution: OR .
● An equilateral triangle has a perimeter
of . What is the length of each of the sides of the triangle?
Solution: , therefore each
side is units long.
2. Understand that rewriting an expression in different forms in a problem context can shed light on the problem and how the quantities in it are related. For example, a + 0.05a = 1.05a means that “increase by 5%” is the same as “multiply by 1.05.”
● Relate percents to decimals
● Demonstrate how algebra can be used to write expressions in equivalent forms
● Demonstrate ability to communicate math in written form
Examples: ● Jamie and Ted both get paid an equal
hourly wage of $9 per hour. This week, Ted made an additional $27 dollars in overtime. Write an expression that represents the weekly wages of both if J = the number of hours that Jamie worked this week and T = the number of hours Ted worked this week? Can you write the expression in another way?
Students may create several different expressions depending upon how they group the quantities in the problem. One student might say: To find the total wage, I would first multiply the number of hours Jamie worked by 9. Then I would multiply the number of hours Ted worked by 9. I would add these two values with the $27 overtime to find the total wages for the week. The student
would write the expression . Another student might say: To find the total wages, I would add the number of hours that Ted and Jamie worked. I would multiply the total number of hours worked by 9. I would then add the overtime to that value to get the total wages for the week. The student would
write the expression A third student might say: To find the total wages, I would need to figure out how much Jamie made and add that to how much Ted made for the week. To figure out Jamie’s wages, I would multiply the number of hours she worked by 9. To figure out Ted’s wages, I
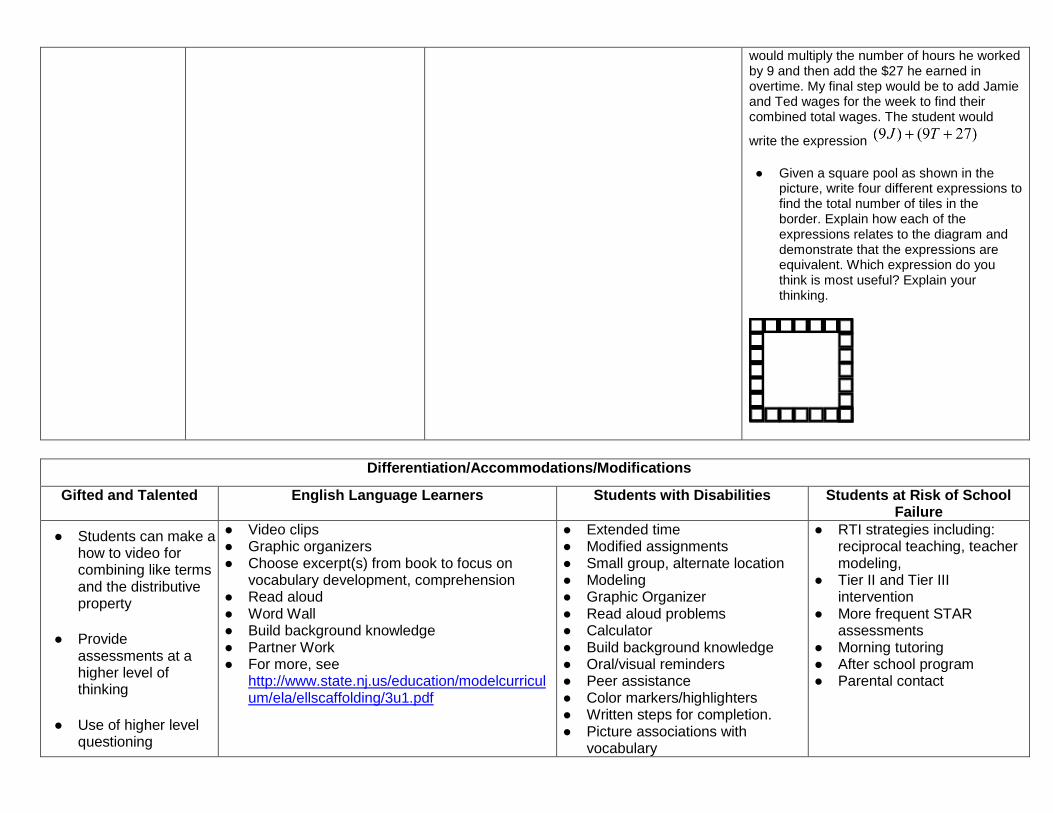
would multiply the number of hours he worked by 9 and then add the $27 he earned in overtime. My final step would be to add Jamie and Ted wages for the week to find their combined total wages. The student would
write the expression
● Given a square pool as shown in the
picture, write four different expressions to find the total number of tiles in the border. Explain how each of the expressions relates to the diagram and demonstrate that the expressions are equivalent. Which expression do you think is most useful? Explain your thinking.
Differentiation/Accommodations/Modifications
Gifted and Talented English Language Learners Students with Disabilities Students at Risk of School Failure
● Students can make a how to video for combining like terms and the distributive property
● Provide assessments at a higher level of thinking
● Use of higher level questioning
● Video clips
● Graphic organizers
● Choose excerpt(s) from book to focus on vocabulary development, comprehension
● Read aloud
● Word Wall ● Build background knowledge
● Partner Work
● For more, see http://www.state.nj.us/education/modelcurriculum/ela/ellscaffolding/3u1.pdf
● Extended time
● Modified assignments
● Small group, alternate location
● Modeling
● Graphic Organizer ● Read aloud problems
● Calculator ● Build background knowledge
● Oral/visual reminders
● Peer assistance
● Color markers/highlighters
● Written steps for completion. ● Picture associations with
vocabulary
● RTI strategies including: reciprocal teaching, teacher modeling,
● Tier II and Tier III intervention
● More frequent STAR assessments
● Morning tutoring
● After school program
● Parental contact
techniques
● Graph paper for organization of number placement
● Refer to each student’s IEP for more specific modifications
Math Curriculum
Grade Seven Pre-Algebra
Content: Expressions and Equations
Essential Question(s): How can real world mathematical problems be solved using both mental and computational strategies? What real world problems could be represented by equations? What real world problems could be represented by inequalities?
Standards: 7.EE. B. Solve real-life and mathematical problems using numerical and algebraic expressions and equations.
Vocabulary: estimations, integers, clustering, consecutive, inequality, interpret
Grade Specific Standards Skills Instructional Procedures
Explanations and Examples
3. Solve multi-step real-life and mathematical problems posed with positive and negative rational numbers in any form (whole numbers, fractions, and decimals), using tools strategically. Apply properties of operations to calculate with numbers in any form; convert between forms as appropriate; and assess the reasonableness of answers using mental computation and estimation strategies. For example: If a woman making $25 an hour gets a 10% raise, she will make an additional 1/10 of her salary an hour, or $2.50, for a new salary of $27.50. If you want to place a towel bar 9 3/4 inches long in the center of a door that is 27 1/2 inches wide, you will need to place the bar about 9 inches from each edge; this estimate can be used as a check on the exact computation.
● Solve multi-step real-life and mathematical problems posed with positive and negative rational numbers in any form
● Convert between forms of a number
● Assess the reasonableness of answers using mental computation and estimation strategies
● Review decimal, fraction, percent conversions
● Review estimation strategies
● Use numerical and algebraic expression to represent real world problems
● Use numerical and algebraic equations to solve real world problems
Estimation strategies for calculations with fractions and decimals extend from students’ work with whole number operations. Estimation strategies include, but are not limited to:
● front-end estimation with adjusting (using the highest place value and estimating from the front end making adjustments to the estimate by taking into account the remaining amounts),
● clustering around an average (when the values are close together an average value is selected and multiplied by the number of values to determine an estimate),
● rounding and adjusting (students round down or round up and then adjust their estimate depending on how much the rounding affected the original values),
● using friendly or compatible numbers such as factors (students seek to fit numbers together - i.e., rounding to factors and grouping numbers together that have round sums like 100 or 1000), and
● using benchmark numbers that are easy to compute (students select close whole numbers for fractions or decimals to determine an estimate).
Example:
● The youth group is going on a trip to the state fair. The trip costs $52. Included in that price is $11 for a concert ticket and the cost of 2 passes, one for the rides and one for the game booths. Each of the passes cost the same price. Write an equation representing the cost of the trip and determine the
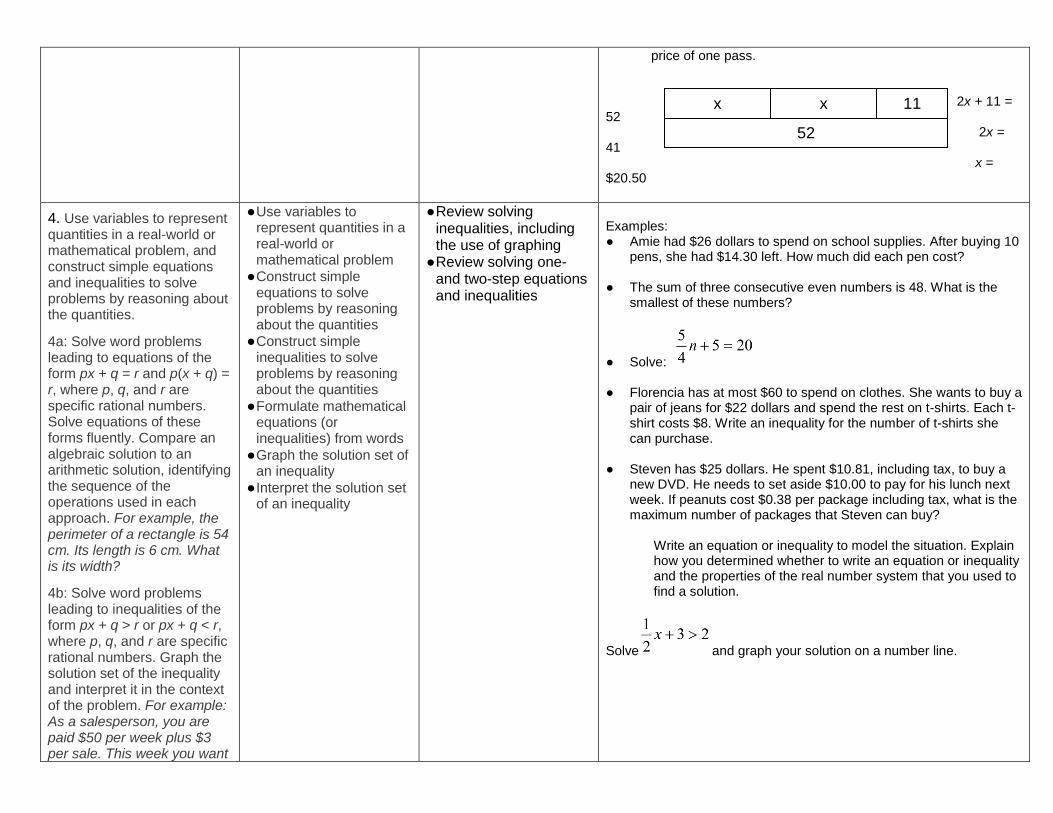
price of one pass. 2x + 11 = 52 2x = 41 x = $20.50
4. Use variables to represent quantities in a real-world or mathematical problem, and construct simple equations and inequalities to solve problems by reasoning about the quantities.
4a: Solve word problems leading to equations of the form px + q = r and p(x + q) = r, where p, q, and r are specific rational numbers. Solve equations of these forms fluently. Compare an algebraic solution to an arithmetic solution, identifying the sequence of the operations used in each approach. For example, the perimeter of a rectangle is 54 cm. Its length is 6 cm. What is its width?
4b: Solve word problems leading to inequalities of the form px + q > r or px + q < r, where p, q, and r are specific rational numbers. Graph the solution set of the inequality and interpret it in the context of the problem. For example: As a salesperson, you are paid $50 per week plus $3 per sale. This week you want
● Use variables to represent quantities in a real-world or mathematical problem
● Construct simple equations to solve problems by reasoning about the quantities
● Construct simple inequalities to solve problems by reasoning about the quantities
● Formulate mathematical equations (or inequalities) from words
● Graph the solution set of an inequality
● Interpret the solution set of an inequality
● Review solving inequalities, including the use of graphing
● Review solving one- and two-step equations and inequalities
Examples: ● Amie had $26 dollars to spend on school supplies. After buying 10
pens, she had $14.30 left. How much did each pen cost?
● The sum of three consecutive even numbers is 48. What is the smallest of these numbers?
● Solve:
● Florencia has at most $60 to spend on clothes. She wants to buy a pair of jeans for $22 dollars and spend the rest on t-shirts. Each t-shirt costs $8. Write an inequality for the number of t-shirts she can purchase.
● Steven has $25 dollars. He spent $10.81, including tax, to buy a
new DVD. He needs to set aside $10.00 to pay for his lunch next week. If peanuts cost $0.38 per package including tax, what is the maximum number of packages that Steven can buy?
Write an equation or inequality to model the situation. Explain how you determined whether to write an equation or inequality and the properties of the real number system that you used to find a solution.
Solve and graph your solution on a number line.
x
x
11
52
your pay to be at least $100. Write an inequality for the number of sales you need to make, and describe the solutions.
Differentiation/Accommodations/Modifications
Gifted and Talented English Language Learners Students with Disabilities Students at Risk of School Failure
● Students will work on “Toy Train” performance assessment task- This task challenges a student to use algebra to represent, analyze, and generalize a variety of functions including linear relationships. A student must be able to relate and compare different forms of representation for a relationship including words, tables, graphs, and writing an equation to describe a functional pattern. A student must be able to use rules of operations to
● Video clips
● Graphic organizers
● Choose excerpt(s) from book to focus on vocabulary development, comprehension
● Read aloud
● Word Wall ● Build background knowledge
● Partner Work
● For more, see http://www.state.nj.us/education/modelcurriculum/ela/ellscaffolding/3u1.pdf
● Extended time
● Modified assignments
● Small group, alternate location
● Modeling
● Graphic Organizer ● Number lines
● Read aloud problems
● Calculator ● Build background knowledge
● Oral/visual reminders
● Peer assistance
● Color markers/highlighters
● Written steps for completion. ● Picture associations with vocabulary
● Graph paper for organization of number placement
● Refer to each student’s IEP for more specific modifications
● RTI strategies including: reciprocal teaching, teacher modeling,
● Tier II and Tier III intervention
● More frequent STAR assessments
● Morning tutoring
● After school program
● Parental contact

extend a pattern and
use its inverse.
● Provide assessments at a higher level of thinking
● Use of higher level questioning techniques
Math Curriculum Grade Seven Pre-Algebra
Content: Geometry
Essential Question(s): How does geometry allow us to reason proportionally and reorganize relationships between figures? How do certain professions utilize scale drawings?
Standards: 7. G A. Draw, construct, and describe geometrical figures and describe the relationships between them.
Vocabulary: ratio, proportions, scale, factor, corresponding sides, corresponding angles, similar figures, cross section, right rectangular prism, right rectangle pyramid
Grade Specific Standards Skills Instructional Procedures Explanations and Examples
1. Solve problems
involving scale drawings of geometric figures,
including computing
actual lengths and areas from a scale drawing and
reproducing a scale drawing at a different
scale.
● Solve problems involving scale drawings of geometric figures
● Compute actual lengths from a scale drawing
● Compute actual areas from a scale drawing
● Reduce a scale drawing at a different scale
● Review ratio, proportion and percent
● Identify corresponding parts of geometric figures
● Calculate scale factor
● Enlarge and shrink two- dimensional figures
● Analyze scale factors between figures and conclude that between 0 and 1 reduces and greater than 1 enlarges
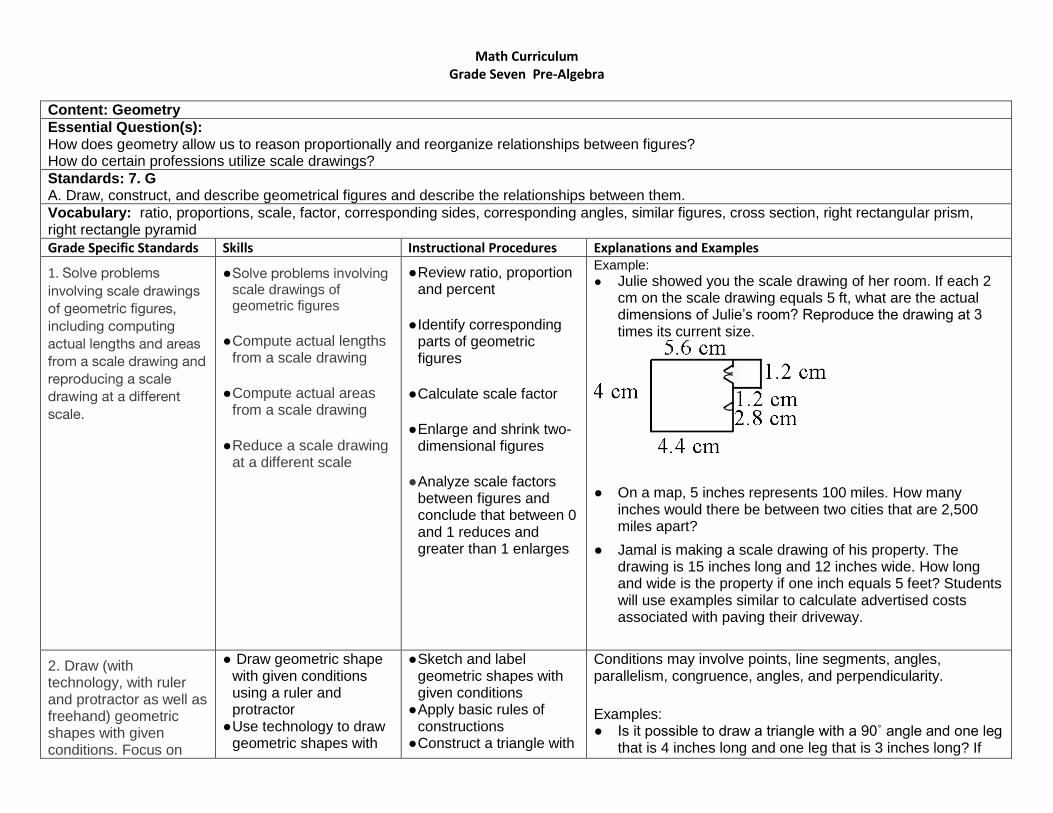
Example:
● Julie showed you the scale drawing of her room. If each 2 cm on the scale drawing equals 5 ft, what are the actual dimensions of Julie’s room? Reproduce the drawing at 3 times its current size.
● On a map, 5 inches represents 100 miles. How many inches would there be between two cities that are 2,500 miles apart?
● Jamal is making a scale drawing of his property. The drawing is 15 inches long and 12 inches wide. How long and wide is the property if one inch equals 5 feet? Students will use examples similar to calculate advertised costs associated with paving their driveway.
2. Draw (with technology, with ruler and protractor as well as freehand) geometric shapes with given conditions. Focus on
● Draw geometric shape with given conditions using a ruler and protractor
● Use technology to draw geometric shapes with
● Sketch and label geometric shapes with given conditions
● Apply basic rules of constructions
● Construct a triangle with
Conditions may involve points, line segments, angles, parallelism, congruence, angles, and perpendicularity. Examples: ● Is it possible to draw a triangle with a 90˚ angle and one leg
that is 4 inches long and one leg that is 3 inches long? If
constructing triangles from three measures of angles or sides, noticing when the conditions determine a unique triangle, more than one triangle, or no triangle.
given conditions. ● Construct triangles using
three measures of angles or sides.
● Identify the conditions that determine an unique triangle, more than one triangle, or no triangle.
given measurements
● Given conditions, determine whether you can construct a unique triangle, more than one triangle or no triangle. Explain
so, draw one. Is there more than one such triangle?
● Draw a triangle with angles that are 60 degrees. Is this a
unique triangle? Why or why not? ● Draw an isosceles triangle with only one 80 degree angle. Is
this the only possibility or can you draw another triangle that will also meet these conditions?
● Can you draw a triangle with sides that are 13 cm, 5 cm
and 6 cm?
● Draw a quadrilateral with one set of parallel sides and no right
angles.
3. Describe the two-
dimensional figures that
result from slicing three-dimensional figures, as in
plane sections of right rectangular prisms and
right rectangular
pyramids.
● Describe the two-dimensional figures that result from slicing three-dimensional figures, as in plane sections of right rectangular prisms and right rectangular pyramids.
● Recognize 3-dimensional figures
● Model a plane slicing a 3-dimensional figure
● Identify cross sections of 3-dimensional figures
Example: ● Using a model of a rectangular prism, describe the shapes
that are created when slicing the prism.
Differentiation/Accommodations/Modifications
Gifted and Talented English Language Learners Students with Disabilities Students at Risk of School Failure
● Students will make a scale drawing of your classroom and objects within it. They will choose a scale appropriate to produce a good drawing. Then they will complete a drawing.
● Provide assessments at a higher level of thinking
● Video clips
● Graphic organizers
● Read aloud
● Word Wall ● Native language translation
● Highlight key vocabulary
● Build background knowledge
● Partner Work
● For more, see http://www.state.nj.us/education/modelcurriculum/ela/ellscaffolding/3u1.pdf
● Extended time
● Modified assignments
● Small group, alternate location
● Modeling
● Read aloud problems
● Calculator ● Build background knowledge
● Oral/visual reminders
● Peer assistance
● Color markers/highlighters
● Written steps for completion. ● Picture associations with vocabulary
● Refer to each student’s IEP for more specific modifications
● RTI strategies including: reciprocal teaching, teacher modeling,
● Tier II and Tier III intervention
● More frequent STAR assessments
● Morning tutoring
● After school program
● Parental contact ● Repetition and practice ● Model skills/techniques
of skills to be mastered ● Oral reminders
● Use of higher level questioning techniques
Math Curriculum
Grade Seven Pre-Algebra Content: Geometry
Essential Question(s): How can we use strategies for finding area and volume to solve real-life problems? When would one want to find area of a figure? When would one want to find surface area of a figure? When would one want to find volume of a figure? How would changing the radius or diameter of a circle affect its circumference and area?
Standards: 7.G B. Solve real-life and mathematical problems involving angle measure, area, surface area, and volume.
Vocabulary: area, circumference, , supplementary, complementary, vertical adjacent, surface area, nets, volume
Grade Specific Standards
Skills Instructional Procedures Explanations and Examples
4. Know the formulas for the area and circumference of a circle and use them to solve problems; give an informal derivation of the relationship between the circumference and area
● Use the formula for area of a circle to solve problems.
● Use the formula for circumference of a circle to solve problems.
● Give an informal derivation of the relationship between the circumference and
● Review concepts of area and perimeter of polygons and relate them to area and circumference of circles
● Calculate the value of using C d
● Apply the formula to solve word problems
Examples: ● The seventh grade class is building a mini
golf game for the school carnival. The end of the putting green will be a circle. If the circle is 10 feet in diameter, how many square feet of grass carpet will they need to buy to cover the circle? How might you communicate this information to the
of a circle.
area of a circle.
salesperson to make sure you receive a piece of carpet that is the correct size?
● Students measure the circumference and
diameter of several circular objects in the room (clock, trash can, door knob, wheel, etc.). Students organize their information and discover the relationship between circumference and diameter by noticing the pattern in the ratio of the measures. Students write an expression that could be used to find the circumference of a circle with any diameter and check their expression on other circles.
● Students create a multi-layered circular
cake and find the area and circumference of each layer.
● Compare the ratio of
C d
● Students will use a circle as a model to
make several equal parts as you would in a pie model. The greater number of parts, the more accurate the representation will be. The pie pieces are laid out to form a shape similar to a parallelogram. Students will then write an expression for the area of the parallelogram related to the radius (note: the length of the base of the parallelogram is half the circumference, or π r, and the height is r, resulting in an area of π r2. Extension: If students are given the circumference of a circle, could they write a formula to determine the circle’s area or given the area of a circle, could they write the formula for the circumference?
5. Use facts about supplementary, complementary, vertical, and adjacent angles in a multi-step problem to write and solve simple equations for an unknown angle in a figure.
● Write a simple equation to write find an unknown angle.
● Solve a simple equation
● Review the definition of supplementary, complementary, vertical and adjacent angles
● Use properties about supplementary, complementary, vertical and adjacent angles to write an equation to find an unknown angle measure.
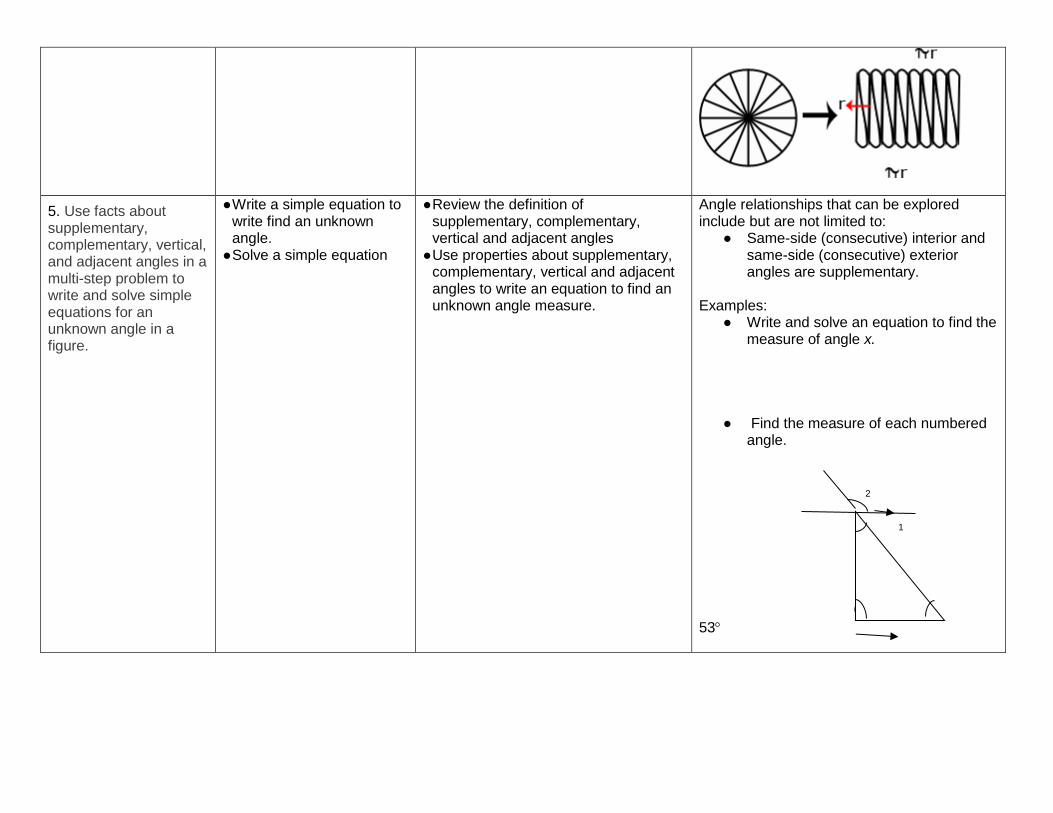
Angle relationships that can be explored include but are not limited to:
● Same-side (consecutive) interior and same-side (consecutive) exterior angles are supplementary.
Examples: ● Write and solve an equation to find the
measure of angle x.
● Find the measure of each numbered
angle.
2
1
67
53
6. Solve real-world and
mathematical problems
involving area, volume
and surface area of two-
and three-dimensional objects composed of
triangles, quadrilaterals,
polygons, cubes, and right prisms.
● Solve real-world and mathematical problems involving area of two-dimensional objects composed of triangles, quadrilaterals, and polygons.
● Solve real-world and mathematical problems involving volume and surface area of three-dimensional objects composed of cubes and right prisms.
● Review the relationship between nets and their solids
● Use this relationship to calculate surface area
● Compare and contrast area, surface area and volume
● Use these relationships to solve real- world problems
Students’ understanding of volume can be supported by focusing on the area of base times the height to calculate volume. Students’ understanding of surface area can be supported by focusing on the sum of the area of the faces. Nets can be used to evaluate surface area calculations. Examples:
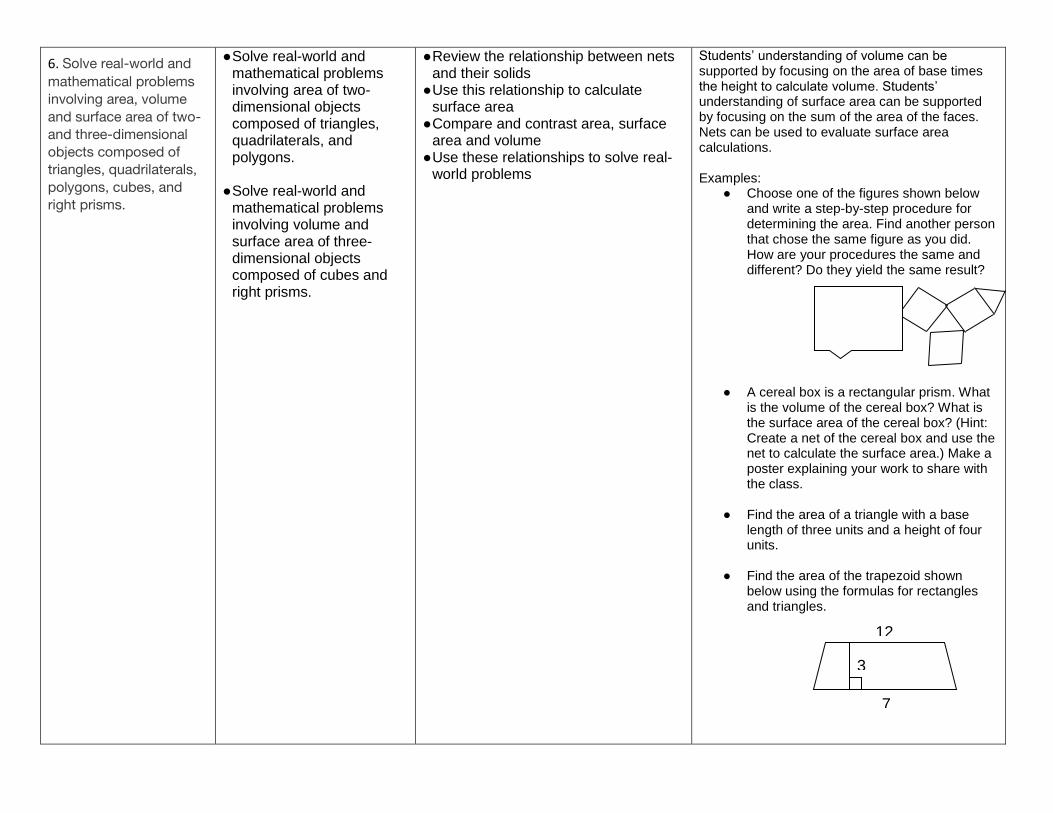
● Choose one of the figures shown below and write a step-by-step procedure for determining the area. Find another person that chose the same figure as you did. How are your procedures the same and different? Do they yield the same result?
● A cereal box is a rectangular prism. What is the volume of the cereal box? What is the surface area of the cereal box? (Hint: Create a net of the cereal box and use the net to calculate the surface area.) Make a poster explaining your work to share with the class.
● Find the area of a triangle with a base length of three units and a height of four units.
● Find the area of the trapezoid shown below using the formulas for rectangles and triangles.
12
7
3
Differentiation/Accommodations/Modifications
Gifted and Talented English Language Learners Students with Disabilities Students at Risk of School Failure
● Provide assessments at a higher level of thinking
● Use of higher level questioning techniques
● Find area of complex composite figures (Illustrative Mathematics 7.G Designs)
● Illustrative mathematics measuring area of a circle
● Video clips
● Graphic organizers
● Read aloud
● Word Wall ● Graphic organizers
● Native language translation
● Highlight key vocabulary
● Build background knowledge
● Partner Work
● For more, see http://www.state.nj.us/education/modelcurriculum/ela/ellscaffolding/3u1.pdf
● Extended time
● Modified assignments
● Small group, alternate location
● Modeling
● Graphic organizers
● Read aloud problems
● Calculator ● Formula sheet ● Build background knowledge
● Oral/visual reminders
● Peer assistance
● Color markers/highlighters
● Written steps for completion. ● Picture associations with
vocabulary
● Refer to each student’s IEP for more specific modifications
● RTI strategies including: reciprocal teaching, teacher modeling,
● Tier II and Tier III intervention
● More frequent STAR assessments
● Morning tutoring
● After school program
● Parental contact ● Repetition and practice ● Model skills/techniques of skills
to be mastered ● Oral reminders
Math Curriculum Grade Seven Pre-Algebra
Content: Statistics and Probability
Essential Question(s): How can outcomes be predicted based on a sample population? What is the relationship between a sample and a population?
Standards: 7.SP A. Use random sampling to draw inferences about a population.
Vocabulary: population, sample, validity, inference, probability, prediction
Grade Specific Standards Skills Instructional Procedures Explanations and Examples
1. Understand that statistics can be used to gain information about a population by examining a sample of the population; generalizations about a population from a sample are valid only if the sample is representative of that population. Understand that random sampling tends to produce representative samples and support valid inferences.
● Explain the relationship between sample and population
● Explain different types of sampling
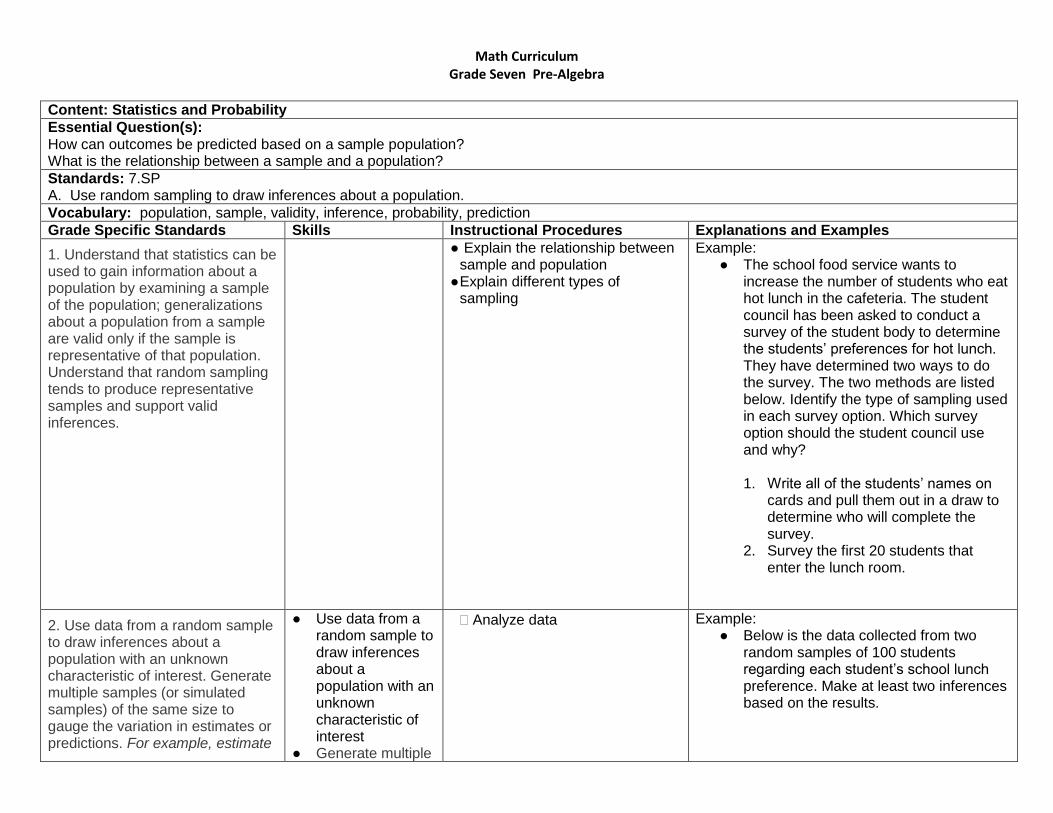
Example: ● The school food service wants to
increase the number of students who eat hot lunch in the cafeteria. The student council has been asked to conduct a survey of the student body to determine the students’ preferences for hot lunch. They have determined two ways to do the survey. The two methods are listed below. Identify the type of sampling used in each survey option. Which survey option should the student council use and why?
1. Write all of the students’ names on
cards and pull them out in a draw to determine who will complete the survey.
2. Survey the first 20 students that enter the lunch room.
2. Use data from a random sample to draw inferences about a population with an unknown characteristic of interest. Generate multiple samples (or simulated samples) of the same size to gauge the variation in estimates or predictions. For example, estimate
● Use data from a random sample to draw inferences about a population with an unknown characteristic of interest
● Generate multiple
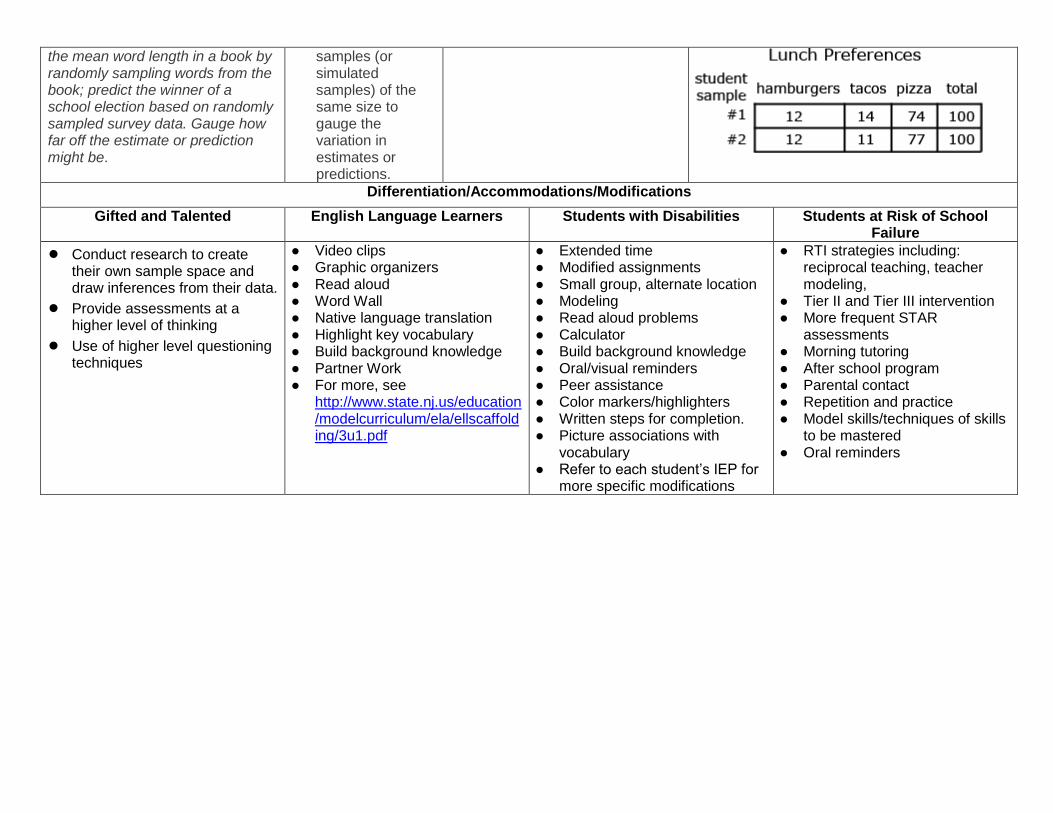
Analyze data Example: ● Below is the data collected from two
random samples of 100 students regarding each student’s school lunch preference. Make at least two inferences based on the results.
the mean word length in a book by randomly sampling words from the book; predict the winner of a school election based on randomly sampled survey data. Gauge how far off the estimate or prediction might be.
samples (or simulated samples) of the same size to gauge the variation in estimates or predictions.
Differentiation/Accommodations/Modifications
Gifted and Talented English Language Learners Students with Disabilities Students at Risk of School Failure
● Conduct research to create their own sample space and draw inferences from their data.
● Provide assessments at a higher level of thinking
● Use of higher level questioning techniques
● Video clips
● Graphic organizers
● Read aloud
● Word Wall ● Native language translation
● Highlight key vocabulary
● Build background knowledge
● Partner Work
● For more, see http://www.state.nj.us/education/modelcurriculum/ela/ellscaffolding/3u1.pdf
● Extended time
● Modified assignments
● Small group, alternate location
● Modeling
● Read aloud problems
● Calculator ● Build background knowledge
● Oral/visual reminders
● Peer assistance
● Color markers/highlighters
● Written steps for completion. ● Picture associations with
vocabulary
● Refer to each student’s IEP for more specific modifications
● RTI strategies including: reciprocal teaching, teacher modeling,
● Tier II and Tier III intervention
● More frequent STAR assessments
● Morning tutoring
● After school program
● Parental contact ● Repetition and practice ● Model skills/techniques of skills
to be mastered ● Oral reminders
Math Curriculum Grade Seven Pre-Algebra
Content: Statistics and Probability
Essential Question(s): How are statistics used to compare samples and populations? Why would one want to compare two populations? What does the shape of the data in a display tell one about the data?
Standards: 7.SP B. Draw informal comparative inferences about two populations.
Vocabulary: deviation, distribution, variability
Grade Specific Standards
Skills Instructional Procedures
Explanations and Examples
3. Informally assess the degree of visual overlap of two numerical data distributions with similar variabilities, measuring the difference between the centers by expressing it as a multiple of a measure of variability. For example, the mean height of players on the basketball team is 10 cm greater than the mean height of players on the soccer team, about twice the variability (mean absolute deviation) on either team; on a dot plot, the separation between the two distributions of heights is noticeable.
● Informally assess the degree of visual overlap of two numerical data distributions with similar variabilities
● Measuring the difference between the centers by expressing it as a multiple of a measure of variability.
● Review different types of data analysis (ex. types of graphs)
● Review measures of center
● Demonstrate how statistical information is represented on a graph
Students can readily find data as described in the example on sports team or college websites. Other sources for data include American Fact Finder (Census Bureau), Fed Stats, Ecology Explorers, USGS, or CIA World Factbook. Researching data sets provides opportunities to connect mathematics to their interests and other academic subjects. Students can utilize statistic functions in graphing calculators or spreadsheets for calculations with larger data sets or to check their computations. Students calculate mean absolute deviations in preparation for later work with standard deviations. Example: Jason wanted to compare the mean height of the players on his favorite basketball and soccer teams. He thinks the mean height of the players on the basketball team will be greater but doesn’t know how much greater. He also wonders if the variability of heights of the athletes is related to the sport they play. He thinks that there will be a greater variability in the heights of soccer players as compared to basketball players. He used the rosters and player statistics from the team websites to generate the following lists. Basketball Team – Height of Players in inches for 2010-2011 Season 75, 73, 76, 78, 79, 78, 79, 81, 80, 82, 81, 84, 82, 84, 80, 84 Soccer Team – Height of Players in inches for 2010 73, 73, 73, 72, 69, 76, 72, 73, 74, 70, 65, 71, 74, 76, 70, 72, 71, 74, 71, 74, 73, 67, 70, 72, 69, 78, 73, 76, 69
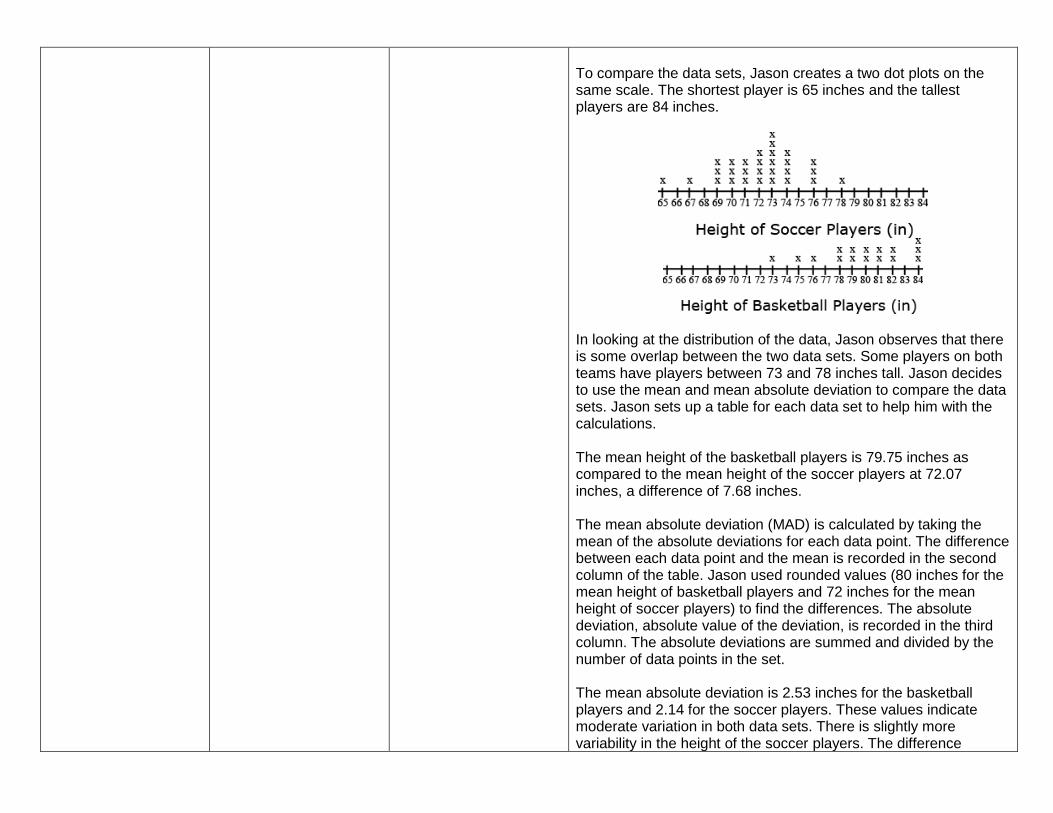
To compare the data sets, Jason creates a two dot plots on the same scale. The shortest player is 65 inches and the tallest players are 84 inches.
In looking at the distribution of the data, Jason observes that there is some overlap between the two data sets. Some players on both teams have players between 73 and 78 inches tall. Jason decides to use the mean and mean absolute deviation to compare the data sets. Jason sets up a table for each data set to help him with the calculations. The mean height of the basketball players is 79.75 inches as compared to the mean height of the soccer players at 72.07 inches, a difference of 7.68 inches. The mean absolute deviation (MAD) is calculated by taking the mean of the absolute deviations for each data point. The difference between each data point and the mean is recorded in the second column of the table. Jason used rounded values (80 inches for the mean height of basketball players and 72 inches for the mean height of soccer players) to find the differences. The absolute deviation, absolute value of the deviation, is recorded in the third column. The absolute deviations are summed and divided by the number of data points in the set. The mean absolute deviation is 2.53 inches for the basketball players and 2.14 for the soccer players. These values indicate moderate variation in both data sets. There is slightly more variability in the height of the soccer players. The difference
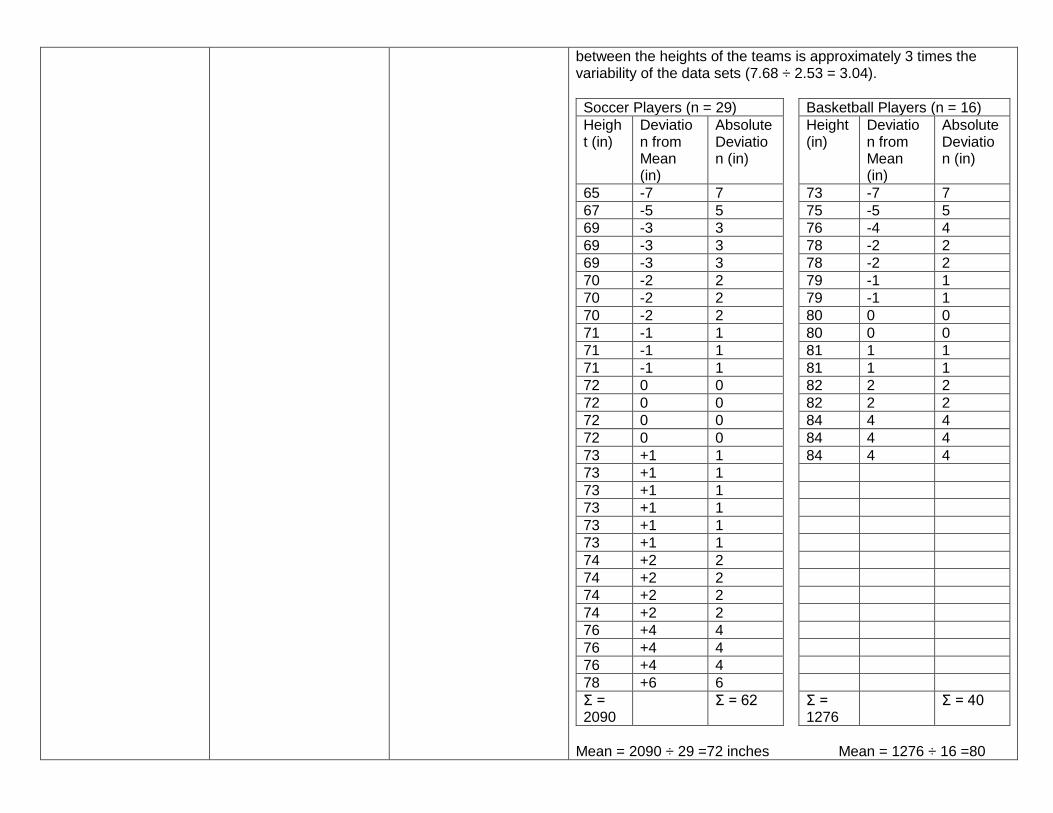
between the heights of the teams is approximately 3 times the variability of the data sets (7.68 ÷ 2.53 = 3.04).
Soccer Players (n = 29) Basketball Players (n = 16)
Height (in)
Deviation from Mean (in)
Absolute Deviation (in)
Height (in)
Deviation from Mean (in)
Absolute Deviation (in)
65 -7 7 73 -7 7
67 -5 5 75 -5 5
69 -3 3 76 -4 4
69 -3 3 78 -2 2
69 -3 3 78 -2 2
70 -2 2 79 -1 1
70 -2 2 79 -1 1
70 -2 2 80 0 0
71 -1 1 80 0 0
71 -1 1 81 1 1
71 -1 1 81 1 1
72 0 0 82 2 2
72 0 0 82 2 2
72 0 0 84 4 4
72 0 0 84 4 4
73 +1 1 84 4 4
73 +1 1
73 +1 1
73 +1 1
73 +1 1
73 +1 1
74 +2 2
74 +2 2
74 +2 2
74 +2 2
76 +4 4
76 +4 4
76 +4 4
78 +6 6
Σ = 2090
Σ = 62 Σ = 1276
Σ = 40
Mean = 2090 ÷ 29 =72 inches Mean = 1276 ÷ 16 =80
inches MAD = 62 ÷ 29 = 2.14 inches MAD = 40 ÷ 16 = 2.53 inches
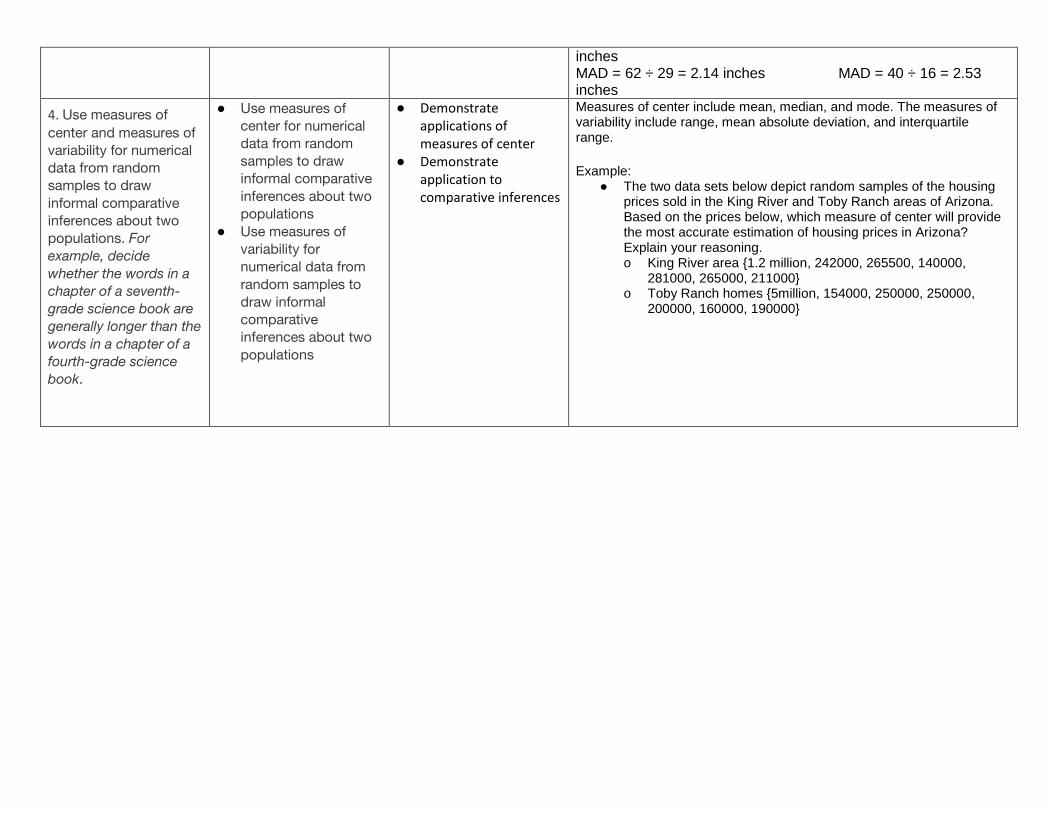
4. Use measures of
center and measures of
variability for numerical data from random
samples to draw
informal comparative inferences about two
populations. For
example, decide
whether the words in a
chapter of a seventh-grade science book are
generally longer than the
words in a chapter of a fourth-grade science
book.
● Use measures of
center for numerical data from random samples to draw
informal comparative
inferences about two populations
● Use measures of
variability for
numerical data from
random samples to
draw informal comparative
inferences about two
populations
● Demonstrate applications of measures of center
● Demonstrate application to comparative inferences
Measures of center include mean, median, and mode. The measures of variability include range, mean absolute deviation, and interquartile range.
Example:
● The two data sets below depict random samples of the housing prices sold in the King River and Toby Ranch areas of Arizona. Based on the prices below, which measure of center will provide the most accurate estimation of housing prices in Arizona? Explain your reasoning. o King River area {1.2 million, 242000, 265500, 140000,
281000, 265000, 211000} o Toby Ranch homes {5million, 154000, 250000, 250000,
200000, 160000, 190000}
Differentiation/Accommodations/Modifications
Gifted and Talented English Language Learners Students with Disabilities Students at Risk of School Failure
● Conduct research to create their own sample space and find the measures of central tendencies of their data.
● Students will graph their data in box plots.
● Provide assessments at a higher level of thinking
● Use of higher level questioning techniques
● Create a video on the measures of central tendencies. They will explain the differences between mean, median, mode, and range and how to find them.
● Video clips
● Graphic organizers
● Read aloud
● Word Wall ● Native language translation
● Highlight key vocabulary
● Build background knowledge
● Partner Work
● For more, see http://www.state.nj.us/education/modelcurriculum/ela/ellscaffolding/3u1.pdf
● Extended time
● Modified assignments
● Small group, alternate location
● Modeling
● Read aloud problems
● Calculator ● Graphic organizer ● Oral/visual reminders
● Peer assistance
● Color markers/highlighters
● Written steps for completion. ● Picture associations with
vocabulary
● Refer to each student’s IEP for more specific modifications
● RTI strategies including: reciprocal teaching, teacher modeling,
● Tier II and Tier III intervention
● More frequent STAR assessments
● Morning tutoring
● After school program
● Parental contact ● Repetition and practice ● Model skills/techniques of skills
to be mastered ● Oral reminders
Math Curriculum Grade Seven Pre-Algebra
Content: Statistics and Probability
Essential Question(s): How can various probability models be used to show experimental probability? What real-life applications would involve finding the probability of an event? What is the purpose of a simulation?
Standards: 7.SP C. Investigate chance processes and develop, use, and evaluate probability models.
Vocabulary: sample space, with replacement, without replacement, outcome, compound event, probability, frequency, likely, unlikely events, theoretical probability, experimental probability, impossible, unlikely, likely, or certain
Grade Specific Standards Skills Instructional Procedures Explanations and Examples
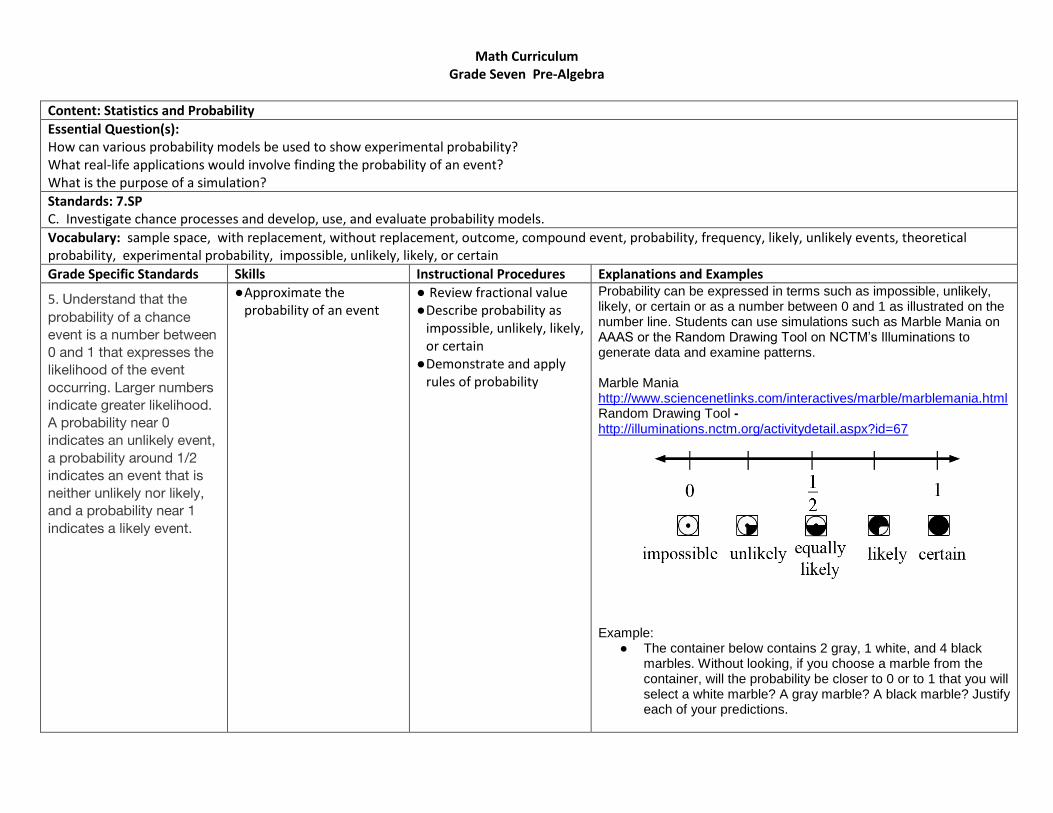
5. Understand that the
probability of a chance
event is a number between 0 and 1 that expresses the
likelihood of the event
occurring. Larger numbers
indicate greater likelihood.
A probability near 0
indicates an unlikely event,
a probability around 1/2
indicates an event that is
neither unlikely nor likely, and a probability near 1
indicates a likely event.
● Approximate the probability of an event
● Review fractional value
● Describe probability as impossible, unlikely, likely, or certain
● Demonstrate and apply rules of probability
Probability can be expressed in terms such as impossible, unlikely, likely, or certain or as a number between 0 and 1 as illustrated on the number line. Students can use simulations such as Marble Mania on AAAS or the Random Drawing Tool on NCTM’s Illuminations to generate data and examine patterns. Marble Mania http://www.sciencenetlinks.com/interactives/marble/marblemania.html Random Drawing Tool - http://illuminations.nctm.org/activitydetail.aspx?id=67
Example:
● The container below contains 2 gray, 1 white, and 4 black marbles. Without looking, if you choose a marble from the container, will the probability be closer to 0 or to 1 that you will select a white marble? A gray marble? A black marble? Justify each of your predictions.
6. Approximate the probability of a chance
event by collecting data on the chance process that
produces it and observing
its long-run relative
frequency, and predict the
approximate relative
frequency given the
probability. For example,
when rolling a number
cube 600 times, predict that a 3 or 6 would be
rolled roughly 200 times, but probably not exactly
200 times
● Observe an event’s long-run relative frequency.
● Predict the approximate relative frequency of an event given the probability.
● Review probability ● Use probability to make
predictions
Students can collect data using physical objects or graphing calculator or web-based simulations. Students can perform experiments multiple times, pool data with other groups, or increase the number of trials in a simulation to look at the long-run relative frequencies. Example: Each group receives a bag that contains 4 green marbles, 6 red marbles, and 10 blue marbles. Each group performs 50 pulls, recording the color of marble drawn and replacing the marble into the bag before the next draw. Students compile their data as a group and then as a class. They summarize their data as experimental probabilities and make conjectures about theoretical probabilities (How many green draws would you expect if you were to conduct 1000 pulls? 10,000 pulls?). Students create another scenario with a different ratio of marbles in the bag and make a conjecture about the outcome of 50 marble pulls with replacement. (An example would be 3 green marbles, 6 blue marbles, 3 blue marbles.) Students try the experiment and compare their predictions to the experimental outcomes to continue to explore and refine conjectures about theoretical probability.
7. Develop a probability model and use it to find
probabilities of events. Compare probabilities from
a model to observed
frequencies; if the agreement is not good,
explain possible sources of
the discrepancy.
7a: Develop a uniform
probability model by
assigning equal probability
to all outcomes, and use
● Develop a probability. ● Use a developed
probability model to find probabilities of events.
● Compare probabilities from a model to observed frequencies.
● If the agreement between the probability model and observed frequencies is not good, explain possible sources of the discrepancy.
● Define theoretical and experimental probabilities
● Demonstrate probability using several models
● Emphasize equal probabilities must have equal possible outcomes
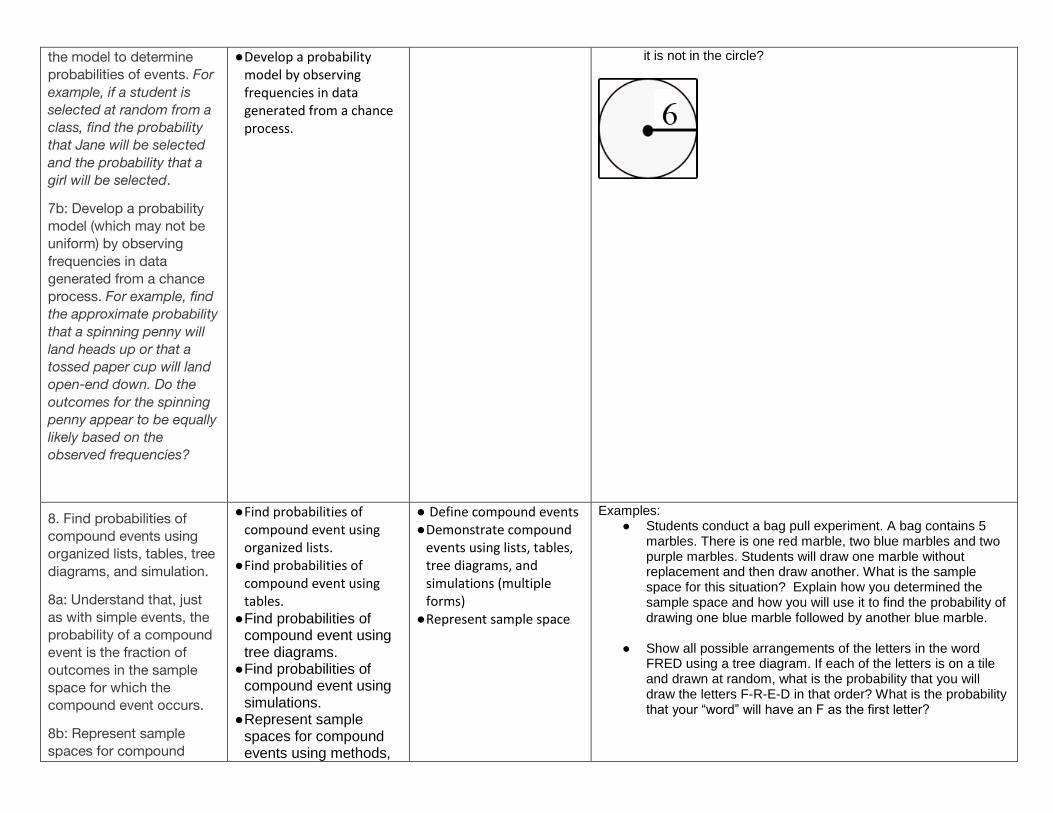
Students need multiple opportunities to perform probability experiments and compare these results to theoretical probabilities. Critical components of the experiment process are making predictions about the outcomes by applying the principles of theoretical probability, comparing the predictions to the outcomes of the experiments, and replicating the experiment to compare results. Experiments can be replicated by the same group or by compiling class data. Experiments can be conducted using various random generation devices including, but not limited to, bag pulls, spinners, number cubes, coin toss, and colored chips. Students can collect data using physical objects or graphing calculator or web-based simulations. Students can also develop models for geometric probability (i.e. a target). Example:
● If you choose a point in the square, what is the probability that
the model to determine
probabilities of events. For
example, if a student is
selected at random from a class, find the probability
that Jane will be selected
and the probability that a
girl will be selected.
7b: Develop a probability
model (which may not be uniform) by observing
frequencies in data
generated from a chance process. For example, find
the approximate probability
that a spinning penny will
land heads up or that a
tossed paper cup will land open-end down. Do the
outcomes for the spinning
penny appear to be equally
likely based on the observed frequencies?
● Develop a probability model by observing frequencies in data generated from a chance process.
it is not in the circle?
8. Find probabilities of
compound events using organized lists, tables, tree
diagrams, and simulation.
8a: Understand that, just
as with simple events, the probability of a compound
event is the fraction of
outcomes in the sample space for which the
compound event occurs.
8b: Represent sample
spaces for compound
● Find probabilities of compound event using organized lists.
● Find probabilities of compound event using tables.
● Find probabilities of compound event using tree diagrams.
● Find probabilities of compound event using simulations.
● Represent sample spaces for compound events using methods,
● Define compound events
● Demonstrate compound events using lists, tables, tree diagrams, and simulations (multiple forms)
● Represent sample space
Examples: ● Students conduct a bag pull experiment. A bag contains 5
marbles. There is one red marble, two blue marbles and two purple marbles. Students will draw one marble without replacement and then draw another. What is the sample space for this situation? Explain how you determined the sample space and how you will use it to find the probability of drawing one blue marble followed by another blue marble.
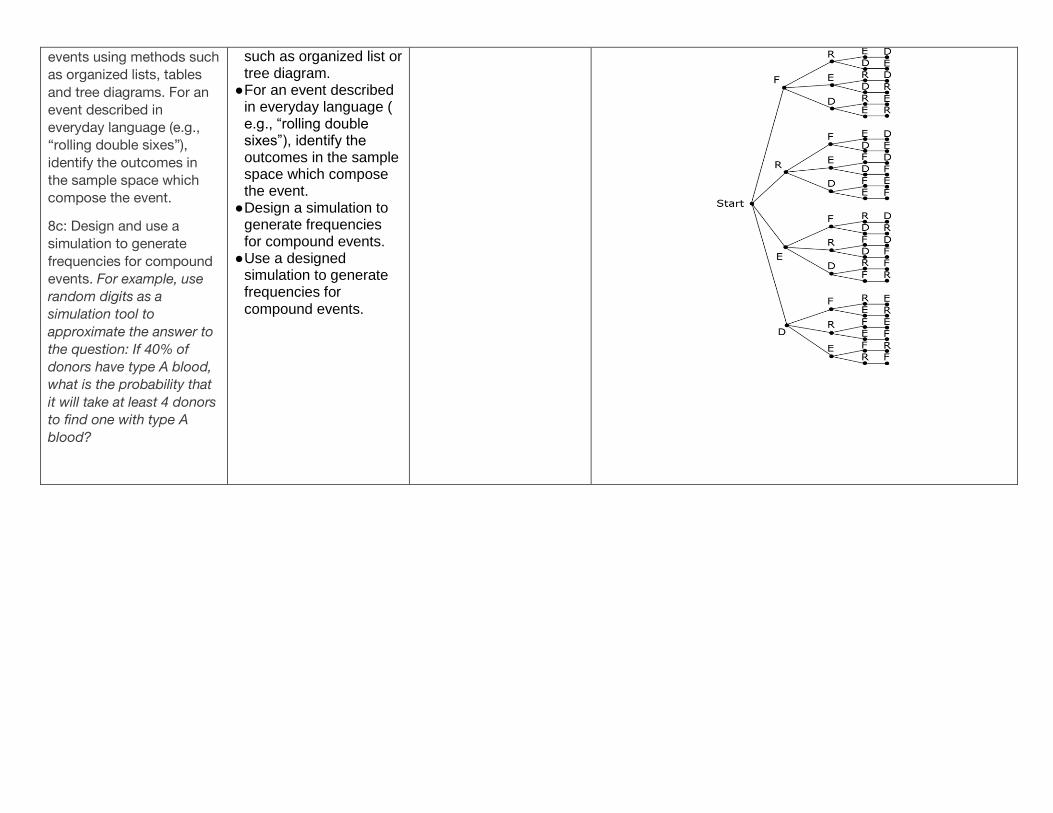
● Show all possible arrangements of the letters in the word FRED using a tree diagram. If each of the letters is on a tile and drawn at random, what is the probability that you will draw the letters F-R-E-D in that order? What is the probability that your “word” will have an F as the first letter?
events using methods such
as organized lists, tables
and tree diagrams. For an
event described in everyday language (e.g.,
“rolling double sixes”),
identify the outcomes in
the sample space which compose the event.
8c: Design and use a simulation to generate
frequencies for compound
events. For example, use random digits as a
simulation tool to
approximate the answer to
the question: If 40% of
donors have type A blood, what is the probability that
it will take at least 4 donors
to find one with type A
blood?
such as organized list or tree diagram.
● For an event described in everyday language ( e.g., “rolling double sixes”), identify the outcomes in the sample space which compose the event.
● Design a simulation to generate frequencies for compound events.
● Use a designed simulation to generate frequencies for compound events.

Differentiation/Accommodations/Modifications
Gifted and Talented English Language Learners Students with Disabilities Students at Risk of School Failure
● NAME TREE: Have students use the letters from their name to create a tree diagram. Students with long names may want to choose a nickname. Once they build their tree diagram. Have them pretend that the letters of their name are placed in a bag and selected at random. Ask students questions, such as: What is the probability that the first letter of their name is the first letter drawn? What is the probability that the letters in their name will be drawn in order? Extend: Challenge the students to develop three of their own questions to ask each other.
● Provide assessments at a higher level of thinking
● Use of higher level questioning techniques
● CARNIVAL GAME ACTIVITY/PROJECT: Have students calculate the probability of winning common carnival games. Have students research other carnival games, design a carnival game of their own, and prepare a detailed report. Have students create and play their game and record the results. Discuss how their game compares to similar carnival games. How much
● Video clips
● Graphic organizers
● Read aloud
● Word Wall ● Native language translation
● Highlight key vocabulary
● Build background knowledge
● Partner Work
● For more, see http://www.state.nj.us/education/modelcurriculum/ela/ellscaffolding/3u1.pdf
● Extended time
● Modified assignments
● Small group, alternate location
● Modeling
● Read aloud problems
● Calculator ● Graphic organizer ● Oral/visual reminders
● Peer assistance
● Color markers/highlighters
● Written steps for completion. ● Picture associations with
vocabulary
● Refer to each student’s IEP for more specific modifications
● RTI strategies including: reciprocal teaching, teacher modeling,
● Tier II and Tier III intervention
● More frequent STAR assessments
● Morning tutoring
● After school program
● Parental contact ● Repetition and practice ● Model skills/techniques of skills
to be mastered ● Oral reminders
should it cost to play? Will the game make money? Is the game too easy? Is it too hard and discouraging? What makes a good carnival game?
● MARCH MADNESS PROBABILITY ACTIVITY: Use real world data and apply probability to the world of sports. Have students analyze the probability of a particular seed winning the tournament based on historical data as well as determining theoretical probability. Allow students to select their own winners based on seed and watch how probability plays out in real life. Extend: Have students determine the probability of correctly picking the winners of every game in the tournament.


![Algebra [Graduate Texts in Mathematics]](https://img.pdfslide.net/doc/110x75/5477fec6b4af9fa2108b4aac/algebra-graduate-texts-in-mathematics.jpg)