Embed Size (px)
Citation preview
MATHEMATICS GRADE 8 HOUSTON ISD PLANNING GUIDE 4TH SIX-WEEKS
- English Language Proficiency Standards (ELPS) - Literacy Leads the Way Best Practices - Aligned to Upcoming State Readiness Standard
- State Process Standard Ⓡ - State Readiness Standard Ⓢ - State Supporting Standard Ⓣ - TAKS Tested Objective (only 11th grade)
© Houston ISD Curriculum 2012 – 2013 Page 1 of 8
Planning Guide User Information Unit 11: Geometric Transformations and Dimensional Changes Part 1: Geometric Transformations on the Coordinate Plane
Time Allocations
Unit Part 1 4 lessons (90-minutes each)
or 8 lessons (45-minutes each)
2 lessons (90-minutes each) or
4 lessons (45-minutes each) Unit Overview
Geometric Transformations and Dimensional Changes – Students investigate geometric transformations and their relationships, and the effects of dimensional changes on area and perimeter of two-dimensional geometric figures. Part 1: Geometric Transformations on the Coordinate Plane starts here. TEKS/SEs (district clarifications/elaborations in italics)
Ⓡ MATH.8.6A Generate similar figures using dilations including enlargements and reductions, describe the relationship
between the pre-image and the image using scale factor and magnitude, and apply scale factors in problem solving situations.
Ⓢ MATH.8.6B Graph dilations, reflections, and translations on a coordinate plane and describe the relationships
between the pre-image and the image. Ⓢ MATH.8.7B Use geometric concepts (including symmetry, similarity, congruence, and transformations) and
properties of two- and three-dimensional figures to solve problems in fields such as art and architecture. Ⓡ MATH.8.9B Use proportional relationships in similar two-dimensional figures or similar three-dimensional figures to find missing measurements.
MATH.8.14A Identify and apply mathematics to everyday experiences, to activities in and outside of school, with other disciplines, and with other mathematical topics. English Language Proficiency Standards
ELPS C.1a Use prior knowledge and experiences to understand meanings in English.
ELPS C.1g Demonstrate an increasing ability to distinguish between formal and informal English and an increasing knowledge of when to use each one commensurate with grade-level learning expectations.
ELPS C.3b Expand and internalize initial English vocabulary by learning and using high-frequency English words necessary for identifying and describing people, places, and objects, by retelling simple stories and basic information represented or supported by pictures, and by learning and using routine language needed for classroom communication.
ELPS C.4g Demonstrate comprehension of increasingly complex English by participating in shared reading, retelling or summarizing material, responding to questions, and taking notes commensurate with content area and grade level needs.
College and Career Readiness Standards
CCRS 3.A1 Identify and represent the features of plane and space figures.
CCRS 3.B1. Identify and apply transformations to figures.
CCRS 3.B2 Identify the symmetries of a plane figure.
CCRS 3.B3 Use congruence transformations and dilations to investigate congruence, similarity, and symmetries of plane figures.
CCRS 10.A2 Connect mathematics to the study of other disciplines.
CCRS 10.B1 Use multiple representations to demonstrate links between mathematical and real world situations.
Key Concepts
change geometric figures transformation Academic Vocabulary
graph rule
MATHEMATICS GRADE 8 HOUSTON ISD PLANNING GUIDE 4TH SIX-WEEKS
- English Language Proficiency Standards (ELPS) - Literacy Leads the Way Best Practices - Aligned to Upcoming State Readiness Standard
- State Process Standard Ⓡ - State Readiness Standard Ⓢ - State Supporting Standard Ⓣ - TAKS Tested Objective (only 11th grade)
© Houston ISD Curriculum 2012 – 2013 Page 2 of 8
Content-Specific Vocabulary
image magnitude
pre-image similar
Essential Understandings / Guiding Questions
Congruent figures and similar figures can undergo size and/or position changes while maintaining proportional relationships.
1. What is the difference between congruent and similar figures? 2. How are the corresponding parts of similar figures related? 3. How are dilations different from translations and reflections?
Geometric figures and their transformations can be represented on a coordinate plane. 1. What happens to a figure if it is translated? reflected? 2. How is the image of a transformed geometric figure related to its pre-image? 3. How can geometric figures and their transformations be represented on a coordinate plane?
Assessment Connections
Performance Expectation – Students will generate congruent and similar figures using transformations, graph those figures on a coordinate plane and analyze the relationships between the image and pre-image of those transformations.
Journal Writing – students create their own example of one type of transformation (dilation, reflection, or translation) and describe the relationship between the image and the pre-image.
Formative Assessment – Student Council President – utilizes the table feature of graphing calculators to assist students in their investigation of dilations.
SpringBoard® Course 1 – Embedded Assessment #2: “Graphic Geometry” – #1– 7 STAAR Sample Item – Item #7 (MATH.8.6A) and Item #8 (MATH.8.7B)
Texas English Language Proficiency Assessment System (TELPAS): End-of-year assessment in listening, speaking, reading, and writing for all students coded as LEP (ELL) and for students who are LEP but have parental denials for Language Support Programming (coded WH). For the Writing TELPAS, teachers provide five writing samples – one narrative about a past event, two academic (from science, social studies, or mathematics), and two others.
Instructional Considerations
Information in this section is provided to assist the teacher with the background knowledge needed to plan instruction that facilitates students to internalize the Key Concepts and Essential Understandings for this unit. It is recommended that teachers thoroughly read this section before implementing the strategies and activities in the Instructional Strategies section. Prerequisites and/or Background Knowledge for Students Students have worked with translations and reflections since fourth grade and graphed them on a coordinate plane in seventh grade. (Ⓡ MATH.7.7B, Ⓢ MATH.8.6B) Background Knowledge for Teacher Critical Content Explore and use reflections on a coordinate plane; Explore and use translations on a coordinate plane; and Explore and use dilations on a coordinate plane.
Introduction
MATH.8.6B is the students’ first experience with generating the algebraic rules involved in transforming figures on the coordinate plane in all four quadrants. The use of “movement arrows” on the plane showing the transformation from the pre-image to the image will help students visualize and generalize the rules involved in moving between the corresponding vertices of the figures.
MATHEMATICS GRADE 8 HOUSTON ISD PLANNING GUIDE 4TH SIX-WEEKS
- English Language Proficiency Standards (ELPS) - Literacy Leads the Way Best Practices - Aligned to Upcoming State Readiness Standard
- State Process Standard Ⓡ - State Readiness Standard Ⓢ - State Supporting Standard Ⓣ - TAKS Tested Objective (only 11th grade)
© Houston ISD Curriculum 2012 – 2013 Page 3 of 8
Instructional Considerations
Instructional Accommodations for Diverse Learners MATH.8.7B relates transformations to experiences that students have in the real world. This helps to make the concepts more concrete. For example, relate a translation to a dance step, a reflection to an image in a mirror, and a dilation to the use of a copy machine that enlarges and reduces the size of an original. C.1a Connections to other areas of mathematics: Proportionality is an underlying “big idea” that runs throughout middle school mathematics. Dilations and similar figures are a natural way to link geometric concepts to previously learned skills in proportionality such as setting up proportions and solving for the “unknown” in a proportional relationship. Applying these skills in a school-based situation such as creating signs for a student council election allows students to relate their prior knowledge to something that will be perceived as non-threatening and engaging and to enhance that knowledge with the use of graphing calculators.
Instructional Strategies / Activities
The strategies and activities in this section are designed to assist the teacher to provide learning experiences to ensure that all learners achieve mastery of the TEKS SEs for this unit. It is recommended that the strategies and activities in this section be taught in the order in which they appear. Identifying Similarities and Differences
KWL (Turn The Light On) The use of a KWL chart before beginning transformational geometry will help the teacher decide what kind of review
activities are necessary. Concrete activities such as the use of a geoboard helps students experience transformations before they move to the use of grid paper or graphing calculators.
Playing The Transformation Game is a fun, engaging, and non-threatening way for students to review and demonstrate their knowledge of the basic concepts of transformations. It should be noted that the vocabulary used in this game is informal (slide, flip, turn) and the students should be encouraged to “translate” this informal language into the more formal vocabulary appropriate for this grade level (translation, reflection, and rotation) – see Resources. (MATH.8.6A, MATH.8.6B) C.1g
Summarizing and Note-Taking
Two-Column Notes (Pen/cil To Paper) After students finish playing the game above, they should summarize their definitions and findings using two-column notes. Identifying Similarities and Differences When translating figures, students should compare and contrast the coordinates of the original figures and the coordinates of the transformed figures to establish patterns and generate rules (Activity: Translating Shapes – see Resources). (MATH.8.6B) Instructional Accommodations for Diverse Learners Nonlinguistic Representations
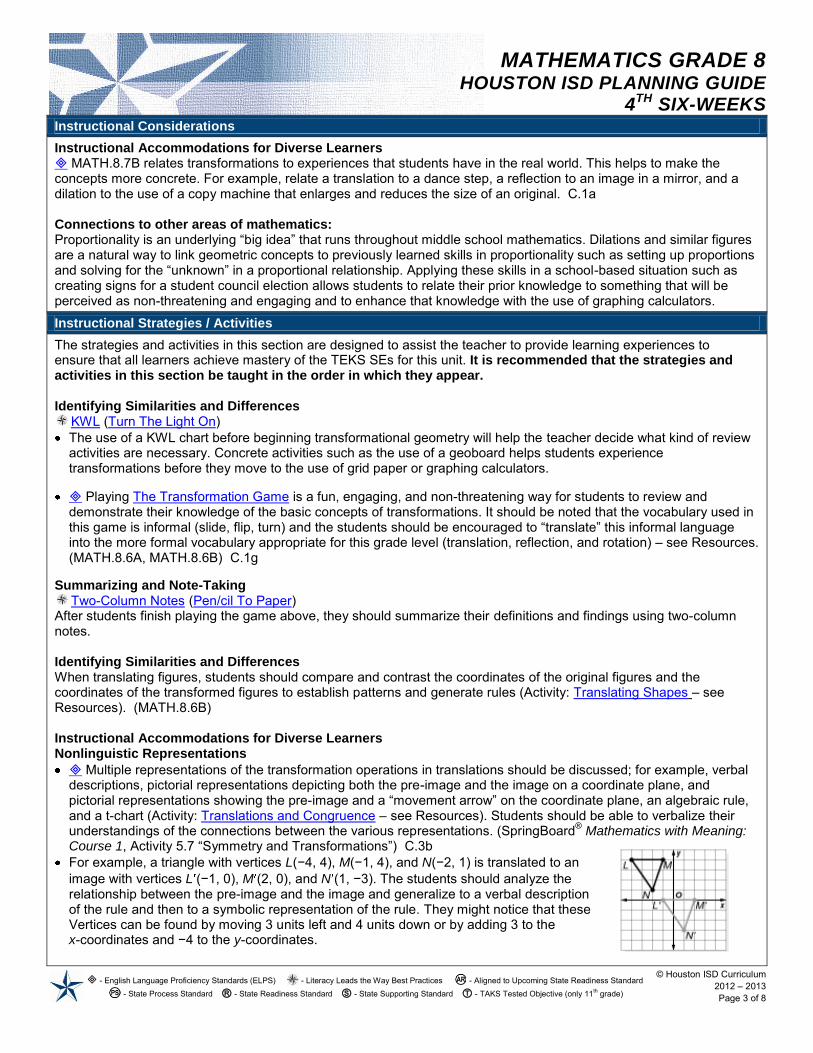
Multiple representations of the transformation operations in translations should be discussed; for example, verbal descriptions, pictorial representations depicting both the pre-image and the image on a coordinate plane, and pictorial representations showing the pre-image and a “movement arrow” on the coordinate plane, an algebraic rule, and a t-chart (Activity: Translations and Congruence – see Resources). Students should be able to verbalize their understandings of the connections between the various representations. (SpringBoard® Mathematics with Meaning: Course 1, Activity 5.7 “Symmetry and Transformations”) C.3b
For example, a triangle with vertices L(−4, 4), M(−1, 4), and N(−2, 1) is translated to an image with vertices L (−1, 0), M (2, 0), and N (1, −3). The students should analyze the relationship between the pre-image and the image and generalize to a verbal description of the rule and then to a symbolic representation of the rule. They might notice that these Vertices can be found by moving 3 units left and 4 units down or by adding 3 to the x-coordinates and −4 to the y-coordinates.
MATHEMATICS GRADE 8 HOUSTON ISD PLANNING GUIDE 4TH SIX-WEEKS
- English Language Proficiency Standards (ELPS) - Literacy Leads the Way Best Practices - Aligned to Upcoming State Readiness Standard
- State Process Standard Ⓡ - State Readiness Standard Ⓢ - State Supporting Standard Ⓣ - TAKS Tested Objective (only 11th grade)
© Houston ISD Curriculum 2012 – 2013 Page 4 of 8
Instructional Strategies / Activities
Symbolically this is represented: Original (Pre-image) Add (3, −4) Image becomes:
L(−4, 4) (−4 + 3, 4 + −4) L (−1, 0) The use of a line of reflection and its role in generating reflections is an important concept for student understanding.
Begin by using the x- and y-axis as lines of reflection. Students need to understand that the pre-image and image are equidistant from the line of reflection and that there are resulting relationships between the corresponding vertices of the figures (Activity: Reflections, Concepts in Motion: Reflections – see Resources).
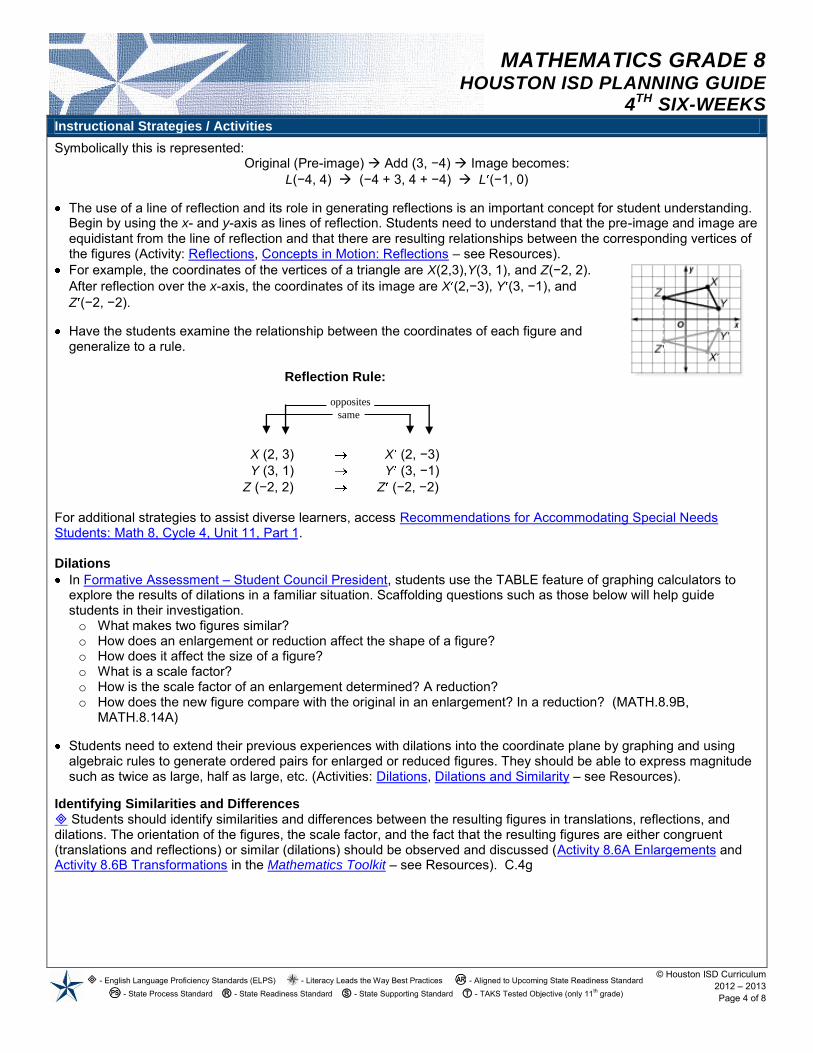
For example, the coordinates of the vertices of a triangle are X(2,3),Y(3, 1), and Z(−2, 2). After reflection over the x-axis, the coordinates of its image are X (2,−3), Y (3, −1), and Z (−2, −2).
Have the students examine the relationship between the coordinates of each figure and
generalize to a rule.
Reflection Rule:
X (2, 3) X (2, −3) Y (3, 1) Y (3, −1) Z (−2, 2) Z (−2, −2) For additional strategies to assist diverse learners, access Recommendations for Accommodating Special Needs Students: Math 8, Cycle 4, Unit 11, Part 1. Dilations
In Formative Assessment – Student Council President, students use the TABLE feature of graphing calculators to explore the results of dilations in a familiar situation. Scaffolding questions such as those below will help guide students in their investigation. o What makes two figures similar? o How does an enlargement or reduction affect the shape of a figure? o How does it affect the size of a figure? o What is a scale factor? o How is the scale factor of an enlargement determined? A reduction? o How does the new figure compare with the original in an enlargement? In a reduction? (MATH.8.9B,
MATH.8.14A) Students need to extend their previous experiences with dilations into the coordinate plane by graphing and using
algebraic rules to generate ordered pairs for enlarged or reduced figures. They should be able to express magnitude such as twice as large, half as large, etc. (Activities: Dilations, Dilations and Similarity – see Resources).
Identifying Similarities and Differences Students should identify similarities and differences between the resulting figures in translations, reflections, and dilations. The orientation of the figures, the scale factor, and the fact that the resulting figures are either congruent (translations and reflections) or similar (dilations) should be observed and discussed (Activity 8.6A Enlargements and Activity 8.6B Transformations in the Mathematics Toolkit – see Resources). C.4g
opposites
same
MATHEMATICS GRADE 8 HOUSTON ISD PLANNING GUIDE 4TH SIX-WEEKS
- English Language Proficiency Standards (ELPS) - Literacy Leads the Way Best Practices - Aligned to Upcoming State Readiness Standard
- State Process Standard Ⓡ - State Readiness Standard Ⓢ - State Supporting Standard Ⓣ - TAKS Tested Objective (only 11th grade)
© Houston ISD Curriculum 2012 – 2013 Page 5 of 8
Instructional Strategies / Activities
Extensions for Pre-AP
To meet the instructional needs of Pre-AP students, provide challenging problem-solving scenarios such as the one below: o Gary wanted two copies of his favorite 6-inch by 4-inch photo. One copy will be an enlargement for his girlfriend,
and the other will be a reduction for his mother. First, he had the photo enlarged by a scale factor of 1.5. Then he had the enlargement reduced by a scale factor of 0.75. What are the dimensions of the final reduced photo? Justify your answer. (MATH.8.6A, MATH.8.7B)
Resources
Adopted Instructional Materials SpringBoard®
Mathematics with Meaning: Middle School 1 5.7 “Symmetry and
Transformations”
Glencoe, Texas Mathematics, Course 3: TWE/SE, 6-6 & 6-7, pp. 330 – 339 Ch. 6 Resource Masters, pp. 37 –
42 Geometry Lab: Tessellations, pp.
340 – 341 Teaching Math with Manipulatives,
pp. 60, 63 – 65
Supporting Resources
The Transformation Game Translating Shapes Translations and Congruence Reflections Dilations Dilations and Similarity Activity 8.6A Enlargements Activity 8.6B Transformations Recommendations for
Accommodating Special Needs Students: Math 8, Cycle 4, Unit 11, Part 1
Online Resources
Concepts in Motion: Reflections Mathematics Toolkit – UT Dana
Center
The following websites include information and activities that highlight connections between mathematics and the fine arts.
What are Tessellations? Tessellations Tessellation Town Tessellate!
MATHEMATICS GRADE 8 HOUSTON ISD PLANNING GUIDE 4TH SIX-WEEKS
- English Language Proficiency Standards (ELPS) - Literacy Leads the Way Best Practices - Aligned to Upcoming State Readiness Standard
- State Process Standard Ⓡ - State Readiness Standard Ⓢ - State Supporting Standard Ⓣ - TAKS Tested Objective (only 11th grade)
© Houston ISD Curriculum 2012 – 2013 Page 6 of 8
Planning Guide User Information Unit 11: Geometric Transformations and Dimensional Changes Part 2: Dimensional Changes in Area and Perimeter of Similar Figures
Time Allocations
Unit Part 2 4 lessons (90-minutes each)
or 8 lessons (45-minutes each)
2 lessons (90-minutes each) or
4 lessons (45-minutes each) Unit Overview
Geometric Transformations and Dimensional Changes – Students investigate geometric transformations and their relationships, and the effects of dimensional changes on area and perimeter of two-dimensional geometric figures. Part 2: Dimensional Changes in Area and Perimeter of Similar Figures starts here. TEKS/SEs (district clarifications/elaborations in italics)
Ⓢ MATH.8.10A Using concrete or pictorial models as well as verbal or algebraic descriptions, describe the resulting effects on perimeter and area when dimensions of a figure are changed proportionally. English Language Proficiency Standards
ELPS C.1h Develop and expand repertoire of learning strategies such as reasoning inductively or deductively, looking for patterns in language, and analyzing sayings and expressions commensurate with grade-level learning expectations.
College and Career Readiness Standards
CCRS 3.A1 Identify and represent the features of plane and space figures.
CCRS 3.B1. Identify and apply transformations to figures.
CCRS 3.B2 Identify the symmetries of a plane figure.
CCRS 3.B3 Use congruence transformations and dilations to investigate congruence, similarity, and symmetries of plane figures.
CCRS 4.C1 Find the perimeter and area of two-dimensional figures.
CCRS 4.C3 Determine indirect measurements of figures using scale drawings, similar figures, the Pythagorean theorem, and basic trigonometry.
Key Concepts
change geometric figures
Academic Vocabulary
model proportional
Content-Specific Vocabulary
area dimensional change perimeter Essential Understandings / Guiding Questions
Two-dimensional geometric figures exhibit proportional relationships when they experience dimensional changes in area and perimeter.
1. How is the perimeter of a dilated figure related to the perimeter of its pre-image? 2. How is the area of a dilated figure related to the area of its pre-image?
Assessment Connections
Performance Expectation – Students will generate congruent and similar figures using transformations, graph those figures on a coordinate plane, and analyze the relationships between the image and pre-image of those transformations.
Expository Writing – Students explain what happens to the area and perimeter of a rectangle when the dimensions are doubled, and when the dimensions are cut in half.
Formative Assessment – By the Sea – involves creating reflections and dilations on the coordinate plane and changes in perimeter and area in the resulting figures.
STAAR Sample Item – Item #11 (MATH.8.10A)
MATHEMATICS GRADE 8 HOUSTON ISD PLANNING GUIDE 4TH SIX-WEEKS
- English Language Proficiency Standards (ELPS) - Literacy Leads the Way Best Practices - Aligned to Upcoming State Readiness Standard
- State Process Standard Ⓡ - State Readiness Standard Ⓢ - State Supporting Standard Ⓣ - TAKS Tested Objective (only 11th grade)
© Houston ISD Curriculum 2012 – 2013 Page 7 of 8
Assessment Connections
Texas English Language Proficiency Assessment System (TELPAS): End-of-year assessment in listening, speaking, reading, and writing for all students coded as LEP (ELL) and for students who are LEP but have parental denials for Language Support Programming (coded WH). For the Writing TELPAS, teachers provide five writing samples – one narrative about a past event, two academic (from science, social studies, or mathematics), and two others. Instructional Considerations
Information in this section is provided to assist the teacher with the background knowledge needed to plan instruction that facilitates students to internalize the Key Concepts and Essential Understandings for this unit. It is recommended that teachers thoroughly read this section before implementing the strategies and activities in the Instructional Strategies section. Prerequisites and/or Background Knowledge for Students Seventh-grade students determined missing measurements in similar figures. (Ⓡ MATH.7.6D) Background Knowledge for Teacher Critical Content Analyze dimensional changes in the area and perimeter of similar figures.
Instructional Accommodations for Diverse Learners Before beginning these investigations, it may be necessary to review the concrete applications of perimeter and area to help students visualize the concepts involved in dimensional changes. For example, build a rectangle with sides 2 units by 3 units and then build an enlarged figure of 4 units by 6 units. The students can easily make a connection between the doubled length and widths and the resulting perimeter and area changes. This concrete experience could serve as a warm-up activity for the measurement experiences referenced in Instructional Strategies. Perimeter and Area Students should discover that the perimeters of similar figures have a ratio that equals the scale factor and areas that equal the square of the scale factor.
Instructional Strategies / Activities
The strategies and activities in this section are designed to assist the teacher to provide learning experiences to ensure that all learners achieve mastery of the TEKS SEs for this unit. It is recommended that the strategies and activities in this section be taught in the order in which they appear. Cues, Questions, and Advance Organizers
Think-Pair-Share (Let’s Talk) Students work with a partner to discuss and model using centimeter grid paper:
o keeping the perimeter constant and changing the dimensions of a figure; o keeping the area constant and changing the dimensions of a figure; and o changing the dimensions of a figure proportionally and describe the resulting effects on both the perimeter and
the area of the figure. (SpringBoard® Mathematics with Meaning: Course 2, Activity 4.5 “Changing Dimensions”) The following activities investigate proportional changes in perimeter and area – see Resources:
o Perimeter and Area Changes o Proportional Changes – Area and Perimeter o Activity 8.10A Changing Dimensions in the Mathematics Toolkit.
MATHEMATICS GRADE 8 HOUSTON ISD PLANNING GUIDE 4TH SIX-WEEKS
- English Language Proficiency Standards (ELPS) - Literacy Leads the Way Best Practices - Aligned to Upcoming State Readiness Standard
- State Process Standard Ⓡ - State Readiness Standard Ⓢ - State Supporting Standard Ⓣ - TAKS Tested Objective (only 11th grade)
© Houston ISD Curriculum 2012 – 2013 Page 8 of 8
Instructional Strategies / Activities
Instructional Accommodations for Diverse Learners Cooperative Learning
In small groups, give students a set of figures with proportionally changed lengths and widths. The students measure each figure and find its area and perimeter.
They should then create wall charts with the figures pasted down and columns filled in with the data for the length, width, area, and perimeter.
The charts should be examined for patterns that describe the relationships observed in the measurements and those relationships should be recorded in verbal or algebraic form.
For example, doubling the length and width of a rectangle yields a perimeter that is double the original perimeter, but the area is four times as large as the original. C.1h
For additional strategies to assist diverse learners, access Recommendations for Accommodating Special Needs Students: Math 8, Cycle 4, Unit 11, Part 2.
In Formative Assessment – By the Sea, students plot geometric figures on the coordinate plane and create dilated images of each. They compare and contrast the changes from pre-image to image including changes in perimeter and area in the resulting figures. They also investigate reflections of the original figures Extensions for Pre-AP
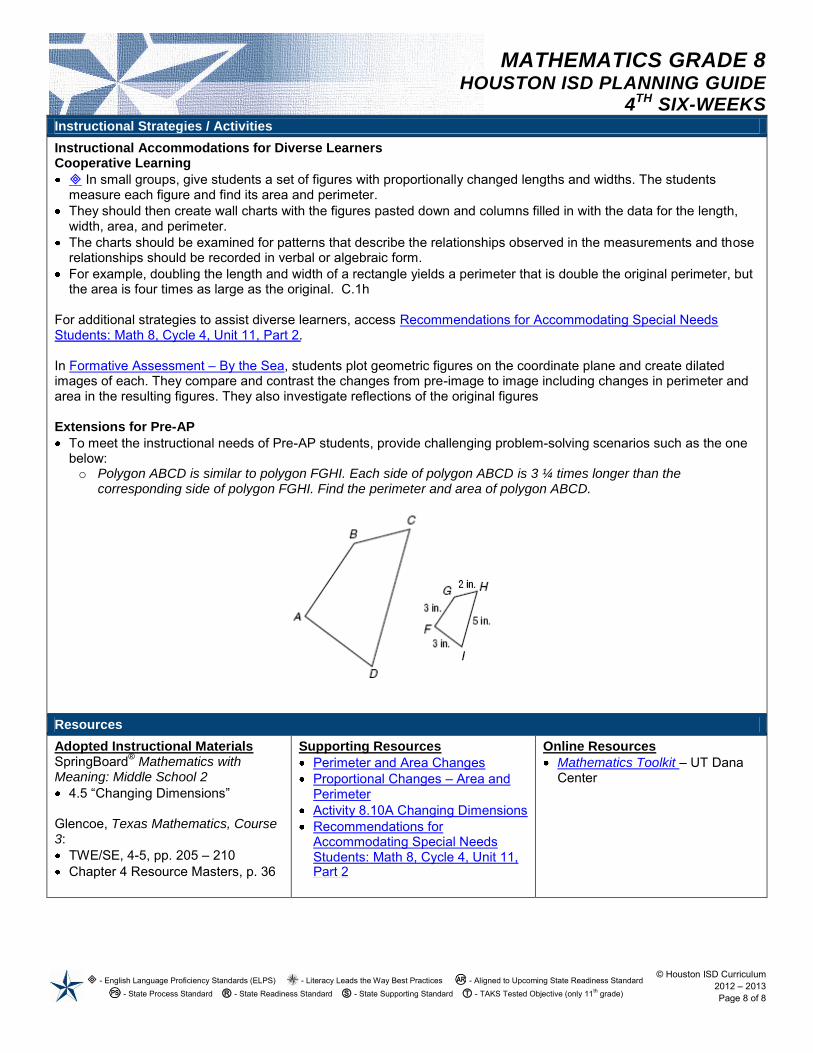
To meet the instructional needs of Pre-AP students, provide challenging problem-solving scenarios such as the one below: o Polygon ABCD is similar to polygon FGHI. Each side of polygon ABCD is 3 ¼ times longer than the
corresponding side of polygon FGHI. Find the perimeter and area of polygon ABCD.
Resources
Adopted Instructional Materials SpringBoard®
Mathematics with Meaning: Middle School 2 4.5 “Changing Dimensions”
Glencoe, Texas Mathematics, Course 3: TWE/SE, 4-5, pp. 205 – 210 Chapter 4 Resource Masters, p. 36
Supporting Resources
Perimeter and Area Changes Proportional Changes – Area and
Perimeter Activity 8.10A Changing Dimensions Recommendations for
Accommodating Special Needs Students: Math 8, Cycle 4, Unit 11,
Online Resources
Mathematics Toolkit – UT Dana Center
Part 2

MATHEMATICS GRADE 8 HOUSTON ISD PLANNING GUIDE
4th SIX-WEEKS
Recommendations for Instructional Enhancements for Students with Special Needs
Unit 11: Geometric Transformations and Dimensional Changes Part 1: Geometric Transformation on the Coordinate Plane Content-specific Accommodations for this Unit/Part
If asking students to place several graphs on one page of graph paper, provide paper already marked with multiple sets of coordinate planes.
Provide extended practice on figure reflection over the x- and y-axes. When the students first start reflecting the figures, provide the visual cue given on page 331 of Glencoe, Texas Mathematics, Course 3. Fade the cue as proficiency increases.
To teach rotational symmetry, open a blank page in Microsoft Word and insert a variety of figures. Ask students to manipulate a figure by rotating it and observing how many times in a 360º rotation an object will fit perfectly over its starting orientation. They can also determine the number of lines of rotational symmetry the figure has.
Example of Microsoft Word Inserted Figures
Figure Original orientation Rotated Rectangle
Octagon
General Accommodations for this Unit/Part
Substitute unfinished work of students who are substantially behind with projects that target the unfinished standards.
Present a bulleted, sequenced task analysis of a procedure and ask students to mark the places in a procedure in which they become confused and unable to proceed. Use that information to plan re-teaching.

MATHEMATICS GRADE 8 HOUSTON ISD PLANNING GUIDE
4th SIX-WEEKS
Recommendations for Instructional Enhancements for Students with Special Needs
Unit 11: Geometric Transformations and Dimensional Changes Part 2: Two-dimensional Changes in Area and Perimeter Content-specific Accommodations for this Unit/Part
After making conjectures as required in the Springboard Course 3, Section 4.5,
Patriotic Proportions, students generalize a rule and no longer rely on calculations to understand the impact of the rate of change. For students who have not generalized the rule, keep calculations low in complexity until they understand the relationship between perimeter and area of a figure when side lengths change proportionally. Prior to requiring students to determine the impact on the area of the figure by a change in the perimeter, provide extra practice on calculating the area and the perimeter of two-dimensional figures that do not change.
As students work the problems that involve change in perimeters, monitor to make sure they complete all the perimeter calculations along with area calculations, so they do not miss the link between the change in perimeter and the change in area.
Allow students to use a calculator and provide them with written calculator directions specific to this unit of instruction.
Substitute activities that require precise drawing with labeling activities to avoid interference from fine motor deficits.
General Accommodations for this Unit/Part
Allow students to use a word processor to respond to tasks involving large amounts of written expression.
When students take notes, teach them to write the notes and then look up to signal they are finished. Refrain from providing information while they are writing.
Encourage students, throughout the lesson, to place questions on post-it notes. Collect students’ post-its and answer questions without announcing the author of the question. This practice promotes a safe environment for asking questions as well as allowing all students to benefit from each other’s questions.
Require students to maintain a personal glossary. For example, have students create vocabulary cards on index card stock and attach them together with a key ring. Have students keep their glossary out while completing an assignment for easy reference.
Facilitate personal coping skills and strategies by making students aware of their own ARD/IEP and 504 Plan prescribed accommodations and teaching them to ask for accommodations that they are not receiving according to their individualized plans.

175Chapter 3: Geometry and Spatial Reasoning
Student Council Presidentgrade 8
Aricela is running for Student Council president at her school. She used her computer to make an fl yer with her picture and campaign slogan.
1. Aricela would like to enlarge the fl yer to maximize size. She wants to create posters that are similar to the original fl yer. She would like to display these new posters on doors that measure 3 feet by 6 feet. What size should the posters be? Explain your thinking.
2. Aricela wants to make additional posters using a copy machine. The largest paper she can use is 11 inches by 17 inches. What is the scale factor she must use? Explain your thinking.
3. Can Aricela make a poster with dimensions 13 inches by 15 inches similar to her original fl yer of 8.5 by 11 inches? Why or why not?
4. Aricela would like to reduce the fl yer to make campaign badges to distribute to students. If the height of each badge is 2 inches, what will the width be in order to make a similar image? Describe how you solved this problem.
5. What scale factor was used for the reduction? Explain your answer.
812
11" " ×

176 Chapter 3: Geometry and Spatial Reasoning
Teacher NotesMaterial
Graphing calculator
Connections to Middle School TEKS:
(8.2) Number, operation, and quantitative reasoning. The student selects and uses appropriate operations to solve problems and justify solutions. The student is expected to:
(A) select and use appropriate operations to solve problems and justify the selections
(8.3) Patterns, relationships, and algebraic thinking. The student identifi es proportional relationships in problem situations and solves problems. The student is expected to:
(B) estimate and fi nd solutions to application problems involving percents and proportional relationships such as similarity and rates
(8.5) Patterns, relationships, and algebraic thinking. The student uses graphs, tables, and algebraic
Scaffolding Questions
• What makes two fi gures similar?
• How does an enlargement or reduction affect the shape of a fi gure? How does it affect the size?
• What is a scale factor?
• How do you fi nd the scale factor of an enlargement? A reduction?
• How does the new fi gure compare with the original fi gure in an enlargement? In a reduction?
Sample Solutions
1. Aricela thinks big posters will get more attention; therefore, she wants to enlarge her fl yer as much as possible. She will make the largest possible poster by fi nding a scale factor that will enlarge the poster so that it fi ts on the door that is 3 feet by 6 feet. Convert the dimensions to inches.
The dimensions in inches are 36 inches by 72 inches. By building a table, possible dimensions can be explored and generalizations can be made.
3 36
6 72
feet x 12 inches
1 foot inches
feet x 12 inches
1 foot inches
=
=
Scale factor
Widthin inches
Lengthin inches
8
17
25
34
1
2
3
4
5
11
22
33
44
5542
12
12
12

177Chapter 3: Geometry and Spatial Reasoning
representations to make predictions and solve problems. The student is expected to:
(A) estimate, fi nd, and justify solutions to application problems using appropriate tables, graphs, and algebraic equations
(8.6) Geometry and spatial reasoning. The student uses transformational geometry to develop spatial sense. The student is expected to:
(A) generate similar shapes using dilations including enlargements and reductions
(8.9) Measurement. The student uses indirect measurement to solve problems. The student is expected to:
(B) use proportional relationships in similar shapes to fi nd missing measurements
Texas Assessment of Knowledge and Skills
Objective 3: The student will demonstrate an understanding of geometry and spatial reasoning.
The ratio of length to width for each row in the table is
equivalent to and can be expressed as . This is a constant ratio or constant of proportionality. The equation expresses a proportional relationship between the length and width of each rectangle. From the table, a scale factor between 4 and 5 will enlarge the
poster to a width between 34 inches and inches.
Enter into a graphing calculator and use the table feature to fi nd x = 36 . When x = 36, y = 46.6.
A poster that is 36 inches wide and 46.6 inches high will be similar to the original and will maximize the surface of the door that is 36 inches wide and 72 inches high. To fi nd the scale factor (4.24) that produced this enlargement, fi nd the ratio of corresponding widths or the ratio of corresponding lengths.
The size of the poster will be 36 inches by 46.6 inches.
2. With a scale factor of 1.29, she would get the largest width possible but would have to trim the extra height. Since Aricela is making an enlargement of her fl yer, she
will need a scale factor greater than 1. Enter into a graphing calculator and scroll to fi nd x = 11 andy = 14.235.
118 5.
yx
=118 5.
y x=118 5.
4212
y x=118 5.
368 5
4 24.
.≈
46 611
4 24.
.≈
y x=118 5.

178 Chapter 3: Geometry and Spatial Reasoning
To fi nd the scale factor used for this enlargement, use the ratio of corresponding widths or the ratio of corresponding heights.
The following computations can be used to check the value of the scale factor.
Using a scale factor of 1.29, or 129%, on a copy machine will give a poster that is 11 inches by 14.2 inches.
3. Aricela will not be able to enlarge her fl yer to a poster that is 13 inches by 15 inches. Find a scale factor that will scale up the width to 13 inches by fi nding a ratio of the width of the enlargement to the width of the original fl yer. Then multiply this scale factor by the original height to fi nd the new height.
Using a scale factor of 1.5 will increase the width to 13 inches, but the height would be 16.5 inches, which is too high.
Another strategy would be to enter the equation into a graphing calculator and use the table feature to fi nd x = 13. The corresponding value of y is 16.8, which will not meet the dimensions of the 13- by 15-inch poster.
118 5
1 29.
.≈
14 23511
1 29.
.≈
812
1 29 11
11 1 29 14 2
× ≈
× ≈
.
. .
13 812
1 5
11 1 5 16 5
÷ ≈
× =
.
. .
y x=118 5.

179Chapter 3: Geometry and Spatial Reasoning
She could make a poster that was 11.5 inches by 14.88 inches that would fi t on the 13-inch by 15-inch paper.
4. To fi nd the width of the badge, a proportion of width to height can be written and solved.
The width of the badge is about 1.5 inches.
Another strategy involves the use of the graphing calculator. Enter the equation
and use the table feature. Scroll down the y-column to 1.9412 and read the corresponding x-value of 1.5.
5. To fi nd the scale factor used for the reduction, the new dimensions are divided by the corresponding original dimensions. Since this is a reduction, the scale factor is less than 1.
The scale factor used for the reduction is 0.18.
8 511 28 5 2
1117111 5
.
.
.
=
×=
=
≈
w
w
w
w
y x=118 5.
1 5 8 5 0 18
2 11 0 18
. . .
.
÷ ≈
÷ ≈

180 Chapter 3: Geometry and Spatial Reasoning
Extension Questions
• On most copy machines, users are allowed to reduce or enlarge documents by specifying a percentage between 50% and 200%. How would you use the copy machine to reduce Aricela’s fl yer to 25% of the original document?
A user would need to make a 50% reduction and then reduce the half-size fl yer by another 50%. Let x be a dimension of the original document.
Reduction by 50% means the new image is 0.50x.
Reducing by 50% again means the next image is 50% of 0.50x or 0.50(0.50x) = 0.25x or 25% of x.

181Chapter 3: Geometry and Spatial Reasoning
Student Work Sample
This student’s work shows the use of scale factor.
The work exemplifi es many of the criteria on the solution guide, especially the following:
• Describes mathematical relationships
• Recognizes and applies proportional relationships
• Develops and carries out a plan for solving a problem that includes understand the problem, select a strategy, solve the problem, and check
• Solves problems involving proportional relationships using solution method(s) including equivalent ratios, scale factors, and equations
• Evaluates the reasonableness or signifi cance of the solution in the context of the problem
• Demonstrates an understanding of mathematical concepts, processes, and skills
• Communicates clear, detailed, and organized solution strategy

182 Chapter 3: Geometry and Spatial Reasoning

183Chapter 3: Geometry and Spatial Reasoning

Assessment Solution Guide
Student Name _________________________________________ Date ___________ Problem Name _________________________________________________________ This solution guide is a problem-solving checklist to help you understand what is necessary for a complete problem solution. Your teacher will indicate which of the criteria on this list you should consider in your problem analysis. After you have completed your solution, check if you feel you have sufficiently satisfied the criteria your teacher indicated. Be prepared to justify your check marks with examples in your solution.
Criteria to be considered in the solution of
problem (check all that
apply)
Criteria
Check if solution satisfies
this criteria
Describes mathematical relationships.
Recognizes and applies proportional relationships.
Develops and carries out a plan for solving a problem that includes understand the problem, select a strategy, solve the problem, and check.
Solves problems involving proportional relationships using solution method(s) including equivalent ratios, scale factors, and equations.
Evaluates the reasonableness or significance of the solution in the context of the problem.
Demonstrates an understanding of mathematical concepts, processes, and skills.
Uses multiple representations (such as concrete models, tables, graphs, symbols, and verbal descriptions) and makes connections among them.
Communicates clear, detailed, and organized solution strategy.
Uses appropriate terminology, notation, and tools.
States a clear and accurate solution using correct units.
Adapted from: MS Mathematics Assessments, The Charles A. Dana Center at the University of Texas at Austin, 2004, Austin, TX

Clarifying Activity 8.6A with Assessment Connections
Working in small groups, students lay a 1-centimeter grid transparency onto simple pictures and use the
relationship of the picture to the squares on the grid (the properties of dilation) to draw a similar picture
onto a larger grid, making an enlargement of the picture. (Note: If transparencies are not available,
pictures may be drawn or copied directly onto a grid.)
Each group can use a different size grid for its enlargement, compare their enlargements, and use
measurements of corresponding parts to identify the scale factor for each enlargement.
Assessment Connections
Questioning . . .
Open with . . .
How is your enlargement like your original and how is it different?
Probe further with . . .
How do you determine corresponding parts of figures?
How could you describe the relationship between the corresponding sides of the two figures?
How could you describe the relationship between the corresponding angles of the two figures?
How much did the measurements of the corresponding parts of your new figure increase when
compared to the original figure?
How does your previous knowledge of similarity relate to this activity?
Listen for . . .
Can the student use geometric terms such as dilation, enlargement, scale factor, growth, or
multiples to describe the change in size?
Does the student verbalize strategies about drawing the enlargement?
Does the student formulate questions to problem-solve during the activity?
Can the student use geometric terms to describe the similarity between the original and its
enlargement?
Does the student formulate questions to analyze the changes in the figure?
Does the student interact with group members to formulate relationships and establish patterns
among the figures?
Look for . . .
Can the student accurately copy the original figure to the transparency grid?
Can the student recognize if the enlargement is an accurate duplicate of the original figure?

Does the student self-check the enlargement for an accurate scale factor?
Does the student demonstrate strategies to find the scale factor of the dilation?

Mathematics 8 Formative Assessment
Activity: “By the Sea”, Middle School Mathematics Assessments, Chapter
3 (Geometry), pp.135 – 146. (see attachment)
Rubric for grading: Assessment
Solution Guide (see attachment)

135Chapter 3: Geometry and Spatial Reasoning
By the Sea
Tourists spot a family of whales swimming off the coast of California. They fi rst spot the mother whale, Millie. Willie, the father whale, is close by. Billie, the baby whale, trails behind.
1. Use the list of coordinates and instructions below to draw Millie on grid paper. Connect points with line segments as you graph. To draw Willie and Billie, use the given rules to fi nd the coordinates of each point. Plot the points to graph Willie and Billie, making sure you connect the points with line segments as you graph.
Po
int
A
B
C
D
E
F
G
H
I
J
K
L
M
N
O
P
Billie
(start over)
(start over)
Willie
(start over)
(start over)
Millie
(start over)
(start over)
RULE
(1, 2)
(1, 4)
(2, 5)
(1, 6)
(1, 8)
(3, 6)
(4, 6)
(6, 11)
(11, 11)
(13, 8)
(13, 4)
(3, 4)
(11, 6)
(12, 5)
(13, 5)
(10, 8)
(x, y) (2x, 2y) ( x, y)12
(connect L to A) (connect L to A) (connect L to A)
2. Compare Millie’s coordinates with those of Willie and Billie. What is the relationship between the coordinates of Millie and Willie? Of Millie and Billie?
grade 8

136 Chapter 3: Geometry and Spatial Reasoning
3. Compare and contrast the shapes of the three whales. What do you observe?
4. Billie becomes playful and does fl ips in the water. Refl ect Billie using the x-axis as the line of refl ection and list the new coordinates. How do these coordinates compare with the original coordinates? Write a rule in words and symbols that refl ects a point with coordinates (x, y) about the x-axis.
5. Billie continues to play. Now refl ect Billie using the y-axis as the line of refl ection and list the new coordinates. How do these new coordinates compare with the previous coordinates? Write a rule in words and symbols for a refl ection of a point with coordinates (x, y) about the y-axis.

138 Chapter 3: Geometry and Spatial Reasoning
Teacher Notes
Materials
Calculator
Half-centimeter grid paper
Tracing paper
Scissors
Ruler
Connections to Middle School TEKS
(8.6) Geometry and spatial reasoning. The student uses transformational geometry to develop spatial sense. The student is expected to:
(A) generate similar shapes using dilations including enlargements and reductions
(B) graph dilations, refl ections, and translations on a coordinate plane
(8.7) Geometry and spatial reasoning. The student uses geometry to model and describe the physical world. The student is expected to:
(D) locate and name points on a coordinate plane using ordered pairs of rational numbers
Scaffolding Questions
• How can you use the rule (2x, 2y) for fi nding the coordinates for Willie?
• What does the rule for Billie’s coordinates tell you to do?
• What does it mean for two fi gures to be similar?
• How do the side lengths of Millie and Willie compare? How do the corresponding angles of Millie and Willie compare?
• How do the side lengths of Millie and Billie compare? How do the corresponding angles of Millie and Billie compare?
• How do the side lengths of Willie and Billie compare? How do the corresponding angles of Willie and Billie compare?
• How do you refl ect a geometric fi gure about the x-axis? The y-axis?
• How do the original coordinates and corresponding new coordinates compare in a refl ection about the x-axis? About the y-axis?
• How can you state a rule in words for refl ecting a point with coordinates (x, y) about the x-axis? About the y-axis?
• How could you write these rules using symbols?

139Chapter 3: Geometry and Spatial Reasoning
(8.9) Measurement. The student uses indirect measurements to solve problems. The student is expected to:
(A) use the Pythagorean Theorem to solve real-life problems
Texas Assessment of Knowledge and Skills
Objective 3: The student will demonstrate an understanding of geometry and spatial reasoning.
Sample Solutions
1.P
oin
t
A
B
C
D
E
F
G
H
I
J
K
L
M
N
O
P
Billie
(start over)
(start over)
Willie
(start over)
(start over)
Millie
(start over)
(start over)
RULE
(1, 2)
(1, 4)
(2, 5)
(1, 6)
(1, 8)
(3, 6)
(4, 6)
(6, 11)
(11, 11)
(13, 8)
(13, 4)
(3, 4)
(11, 6)
(12, 5)
(13, 5)
(10, 8)
(x, y) (2x, 2y)
(2, 4)
(2, 8)
(4, 10)
(2, 12)
(2, 16)
(6, 12)
(8, 12)
(12, 22)
(22, 22)
(26, 16)
(26, 8)
(6, 8)
(22, 12)
(24, 10)
(26, 10)
(20, 16)
( x, y)12
(.5, 2)
(.5, 4)
(1, 5)
(.5, 6)
(.5, 8)
(1.5, 6)
(2, 6)
(3, 11)
(5.5, 11)
(6.5, 8)
(6.5, 4)
(1.5, 4)
(5.5, 6)
(6, 5)
(6.5, 5)
(5, 8)
(connect L to A) (connect L to A) (connect L to A)
A
B C
D
E
F
G
H IJ
K
L
M
P
NO
MILLIE

140 Chapter 3: Geometry and Spatial Reasoning
2. Using the completed table in problem 1, students see that the coordinates of the points for Willie are two times the coordinates of corresponding points for Millie. The rule used to create Willie (2x, 2y) states that each coordinate for Millie (x, y) is multiplied by 2. For Billie, each x-coordinate is half the corresponding x-coordinate for Millie. The y-coordinate does not change. The rule used to create Billie ( , y) states that each x-coordinate of Millie is multiplied by .
A
BC
D
EF
G
H IJP
KL
M
NO
BILLIE
A
B
C
D
E
FG
H I
JP
KL
M
NO
WILLIE
12
x12

141Chapter 3: Geometry and Spatial Reasoning
3. When comparing the shapes of the whales, measure the lengths of line segments and angles and then examine the relationships of the corresponding measurements to determine if the shapes are similar. To calculate the size of segments that are vertical or horizontal, students can count the number of units to fi nd length. Students can use the Pythagorean Theorem to fi nd the lengths of the slanted segments.
Millie and Willie are similar shapes. Each line segment of Willie is twice the length of the corresponding line segment of Millie, and each corresponding angle is congruent. An example of each type of segment and its corresponding length for Millie and Willie is shown in the table below.
Segment of figure Millie Willie
Tailsegment AB
Headsegment HI
Foreheadsegment JI
Vertical segment2 units
Vertical segment4 units
Horizontal segment10 units
Horizontal segment5 units
Slanted segment Slanted segment
22 + 32 = c2
4 + 9 = c2
13 = c2
13 = c
3.6 ≈ c
c ≈ 3.6 units
42 + 62 = c2
16 + 36 = c2
52 = c2
52 = c
7.2 ≈ c
c ≈ 7.2 units
The ratios of corresponding sides of the fi gures are all 2 units on Willie for every 1 unit on Millie. For example:
The measurements of corresponding angles are equal. This can be verifi ed by using a protractor or tracing paper. For example, for both Willie and Millie;
for Willie and Millie; and for both whale fi gures. Those angles having measures greater than 180˚ can be verifi ed using tracing paper. Trace the angle of Millie and align with the corresponding angle of Willie.
length of Willie' s taillength of Millie's tail
units2 units
units1 unit
length of Willie' s headlength of Millie's head
units5 units
units1 unit
length of Willie' s foreheadlength of Millie's forehead
7.2 units3.6 units
units1 unit
= =
= =
≈ =
4 2
10 2
2
m∠ = °H 112m∠ = °A 45 m∠ = °1 124

142 Chapter 3: Geometry and Spatial Reasoning
Because the sides of Millie have been scaled up using a scale factor of 2 to form Willie’s fi gure and corresponding angles are congruent, Millie and Willie are similar whale fi gures.
On the other hand, Millie and Billie are not similar whale fi gures. Each line segment of Billie is not proportional to the corresponding line segment of Millie, and each corresponding angle is not congruent. An example of each type of segment and its corresponding length for Millie and Willie is shown in the table below.
Segment of figure Millie Billie
Tailsegment AB
Headsegment HI
Foreheadsegment JI
Vertical segment2 units
Vertical segment2 units
Horizontal segment2.5 units
Horizontal segment5 units
Slanted segment Slanted segment
22 + 32 = c2
4 + 9 = c2
13 = c2
13 = c
3.6 ≈ c
c ≈ 3.6 units
22 + 1.52 = c2
4 + 2.25 = c2
6.25 = c2
6.25 = c
2.5 ≈ c
c ≈ 2.5 units
The ratios of corresponding sides of the fi gures are not equal. For example:
The measures of corresponding angles are not equal. This can be verifi ed by using a protractor or tracing paper. For example, for Millie, while for Billie. Likewise, Willie and Billie are not similar whale fi gures.
4. The new coordinates for Billie when refl ected about the x-axis are given in the table below. By comparing these new coordinates to the corresponding coordinates of the original fi gure, the x-coordinates are the same. However, the new y-coordinates are the opposite of the corresponding original y-coordinates.
length of Billie' s taillength of Millie's tail
units2 units
unit1 unit
length of Billie' s headlength of Millie's head
.5 units5 units
.5 units1 unit
length of Billie' s foreheadlength of Millie's forehead
2.5 units3.6 units
.694 units1 unit
= =
= =
≈ =
2 1
2 0
0
m∠ = °H 112 m∠ = °H 105

143Chapter 3: Geometry and Spatial Reasoning
Rule in words: A refl ection of a point with coordinates (x, y) about the x-axis produces a point with the same x-coordinate and a y-coordinate that is the opposite of the original y-coordinate.
Rule in symbols: (x, y) (x, -y)
Po
int
A
B
C
D
E
F
G
H
I
J
K
L
M
N
O
P
(connect L to A)
(start over)
(start over)
(.5, -2)
(.5, -4)
(1, -5)
(.5, -6)
(.5, -8)
(1.5, -6)
(2, -6)
(3, -11)
(5.5, -11)
(6.5, -8)
(6.5, -4)
(1.5, -4)
(5.5, -6)
(6, -5)
(6.5, -5)
(5, -8)
Billie
X
Y

144 Chapter 3: Geometry and Spatial Reasoning
5. The coordinates of the points in the table below are the new coordinates after Billie was refl ected about the y-axis from his position in problem 4. The y-coordinates stayed the same, but the new x-coordinates are the opposite of the corresponding x-coordinates in the previous table.
Rule in words: A refl ection of a point with coordinates (x, y) about the y-axis results in a point with coordinates (opposite of the x-coordinate, same y coordinate),
Rule in symbols: (x, y) (- x, y)
Po
int
A
B
C
D
E
F
G
H
I
J
K
L
M
N
O
P
(start over)
(start over)
(-.5, -2)
(-.5, -4)
(-1, -5)
(-.5, -6)
(-.5, -8)
(-1.5, -6)
(-2, -6)
(-3, -11)
(-5.5, -11)
(-6.5, -8)
(-6.5, -4)
(-1.5, -4)
(-5.5, -6)
(-6, -5)
(-6.5, -5)
(-5, -8)
Billie
(connect L to A)
X
Y

145Chapter 3: Geometry and Spatial Reasoning
Extension Questions
• A few years have passed and Billie has grown. A dilation is a transformation that moves a fi gure and changes its size to create a similar fi gure. Dilate Billie in the coordinate plane so that his new dimensions are times the original dimensions. List the coordinates for each vertex on Billie’s fi gure. Explain why the enlarged fi gure is a dilation.
To dilate Billie to his new size, multiply each number in the ordered pair (x, y) by . The results are listed in a table below.
412
412
Po
int
A
B
C
D
E
F
G
H
I
J
K
L
M
N
O
P
(start over)
(start over)
(2.25, 9)
(2.25, 18)
(4.5, 22.5)
(2.25, 27)
(2.25, 36)
(6.75, 27)
(9, 27)
(13.5, 49.5)
(24.75, 49.5)
(29.25, 36)
(29.25, 18)
(6.75, 18)
(24.75, 27)
(27, 22.5)
(29.25, 22.5)
(22.5, 36)
Billie
(connect L to A)
The enlarged fi gure is a dilation because it meets the following criteria:
• The transformation has preserved similarity. This can be verifi ed by comparing the lengths of corresponding sides and corresponding angles. Corresponding sides (enlarged to original) have a ratio of 4.5 : 1 and corresponding angles are congruent.
• Corresponding sides are parallel.

146 Chapter 3: Geometry and Spatial Reasoning
• Since this transformation is not a translation, there is a center of dilation. In this case, the center of dilation is at (0, 0). This can be determined by drawing lines through corresponding vertices. These lines all intersect at the center of dilation.
• Each side has been enlarged by a scale factor of .
• Orientation of the fi gures is the same.
• Describe how this transformation has affected the perimeter and area of the original fi gure.
Perimeter: Since Billie’s fi gure has been scaled up by a factor of 4.5, the enlarged fi gure is similar to the original fi gure, and the ratio of corresponding sides (enlarged to original) is 4.5 : 1. This ratio is the same as the ratio of corresponding perimeters. Therefore, the ratio of corresponding perimeters (enlarged fi gure to original fi gure) is 4.5 : 1.
Area: Since the enlarged fi gure formed by the dilation is similar to the original fi gure, the ratio of the areas (enlarged to original) is the square of the ratio of corresponding sides. The ratio of the area of the enlarged fi gure to the area of the original fi gure is (4.5)2 : 12 or 20.5 : 1.
412

Assessment Solution Guide
Student Name _________________________________________ Date ___________ Problem Name _________________________________________________________ This solution guide is a problem-solving checklist to help you understand what is necessary for a complete problem solution. Your teacher will indicate which of the criteria on this list you should consider in your problem analysis. After you have completed your solution, check if you feel you have sufficiently satisfied the criteria your teacher indicated. Be prepared to justify your check marks with examples in your solution.
Criteria to be considered in the solution of
problem (check all that
apply)
Criteria
Check if solution satisfies
this criteria
Describes mathematical relationships.
Recognizes and applies proportional relationships.
Develops and carries out a plan for solving a problem that includes understand the problem, select a strategy, solve the problem, and check.
Solves problems involving proportional relationships using solution method(s) including equivalent ratios, scale factors, and equations.
Evaluates the reasonableness or significance of the solution in the context of the problem.
Demonstrates an understanding of mathematical concepts, processes, and skills.
Uses multiple representations (such as concrete models, tables, graphs, symbols, and verbal descriptions) and makes connections among them.
Communicates clear, detailed, and organized solution strategy.
Uses appropriate terminology, notation, and tools.
States a clear and accurate solution using correct units.
Adapted from: MS Mathematics Assessments, The Charles A. Dana Center at the University of Texas at Austin, 2004, Austin, TX

Notes to the Teacher
Materials Graph paper
A22 Proportional Changes – Area and Perimeter Students will work with a partner to draw a rectangle on graph paper. The size does not matter. Then students will apply 6 different scale factors to make an enlargement or reduction of the rectangle, then draw the new rectangles on graph paper. Challenge students to use at least one or two decimals in their scale factor choices. Have students create a T-chart for the base and width; as well as the area and perimeter of the rectangles, including the original rectangle.
Scale Factor
Base Width Perimeter Area
Original 1 #2 #3 #4 #5 #6
When the table is completed, at least four ratio sets, comparing scale factors, bases, widths, perimeters and areas should be established. Each student in a pair can select two sets of ratios each. For example:
Scale Factor
Base Width Perimeter Area
Original 1 6 8 28 48 #2 2 12 16 56 192 #3 3 18 24 84 432 #4 0.5 3 4 14 12 #5 1.5 9 12 42 108 #6 5 30 40 240 1200
One ratio set is: # 2# 4
= =2
0.5 14 (comparing scale factors)
= =12 43 1
(comparing bases)
= =16 44 1
(comparing widths)
= =56 414 1
(comparing perimeters)
= =192 1612 1
(comparing areas)
Another ratio set is: # 2#5
= =2 4
1.5 3 (comparing scale factors)
= =12 49 3
(comparing bases)
= =16 412 3
(comparing widths)
= =56 442 3
(comparing perimeters)
= =192 16108 9
(comparing areas)

Notes to the Teacher When the sets are combined the patterns which should emerge are: When corresponding linear measures are compared the ratios are
the same as the ratio of the scale factors. When corresponding areas are compared, the ratios are the same
as the ratio of the squares of the scale factors.
Students now discuss together and then explain in whole class discussion why the areas result in a squaring of the scale factors. If they are unable to explain, ask them to describe the two measures used for the base, b, and width, w, of a rectangle. If the measures are scaled by a factor s, then the new rectangle will have measures sb and sw.
⋅ ⋅= = =
⋅ ⋅ ⋅2 2
1original area b w b wnew area sb sw s b w s
©2005 Houston Independent School District

Clarifying Activity 8.10A with Assessment Connections
Given the following grid with shapes that have proportionally changed lengths and widths, students find
the perimeter and area for each shape and organize the data in a table. Students are then instructed to
look for and list patterns that describe the relationship between the changes in the shapes' dimensions
and the changes in the shapes' perimeters and areas (e.g., halving the length and width of a rectangle
gives 1/2 of its original perimeter, but gives only 1/4 as much area).
Assessment Connections
Questioning . . .
Open with . . .
What is the relationship between the perimeter and area of these figures?
Probe further with . . .
Can you use a formula to find the perimeter?
Can you use a formula to find the area?
What is the relationship between corresponding sides of any two figures in the grid?
What is the relationship between the areas of any two figures in the grid?
What is the relationship between the perimeters of any two figures in the grid?
If you draw a figure with sides that are four times the length of the sides of figure A, what would
you expect the perimeter of the new figure to be?
If you draw a figure with sides that are four times the length of the sides of figure A, what would
you expect the area of the new figure to be?
Listen for . . .
Does the student recognize patterns in the table?

Does the student communicate using the properties of proportionality?
Does the student correctly describe perimeter and area?
Does the student express an understanding that perimeter increases by the scale factor in similar
figures?
Does the student express an understanding that area increases by the scale factor squared in
similar figures?
Look for . . .
Can the student organize a table?
How does the student organize the information?
Does the student correctly compute the perimeter and area?
Does the student use appropriate formulas to find the perimeter and area?
Does the student distinguish between the perimeter units and the area units of measure?

Notes to the Teacher
Materials Color Tiles Blackline Master B17 – Graph paper Graphing calculator(optional)
The whole class activity is a review of terms such as arrays, perimeter, base, etc. that students have been studying since 4th grade. It has been studied in rectangular arrays. A sound understanding of these terms is necessary for the in-depth study in this exercise.
Geometer’s Sketchpad may be used to investigate different polygons.
Students can compare quadrilaterals, noting that a square yields the greatest area of the quadrilaterals with the same perimeter.
The following rectangular arrays yield a perimeter of 18.
1 2 4
6 75
8
3
5
4
6
3
7 2
1 8
A17 Constant Perimeter
Build the following model on the overhead with transparent color tiles. Students may work in pairs or independently to build the model. Have the students independently draw onto graph paper (B17) outlining perimeter in one color and color area in a second color.
Ask students to determine the perimeter and area of the irregular figure. The perimeter is 18, the area is 10.
Challenge the students to find a rectangular polygon figure that yields the largest area with a perimeter of 18. Students build a rectangular array of 4 x 5 that yields an area of 20.
Break the students into small groups to build the smallest rectangular array with a perimeter of 18. (1 x 18). Ask students to use the color tiles to build as many configurations as possible that have a perimeter of 18. Record the Base/Length, Width, Perimeter and Area of the rectangle in a T-chart. Then graph the relationship of Width/Length(base) and Length (base)/Area using one sheet of graph paper (B18)
BASE/LENGTH WIDTH PERIMETER AREA 1 8 18 8 2 7 18 14 3 6 18 18 4 5 18 20 5 4 18 20 6 3 18 18 7 2 18 14 8 1 18 8

Notes to the Teacher Base to Area Graph:
Base to Width Graph:
Ask the students to answer the following questions, then discuss as a whole group: • What patterns are observed in the T-chart? The rectangle area
calculations represent the commutative property of multiplication. • What did the graph look like? The graph for the base to the area is
a curved line. The graph for the length to width relationship is linear, but not proportional.
• Determine a rule for determining area, A, when the base, b, (bottom) of the rectangle is given.
A = b(P/2 – b) Discuss this rule in terms of the total perimeter, which includes two bases and two widths. Therefore perimeter/2 gives one base and one width of the rectangle. The width is obtained by subtracting the base from half of the perimeter.
Example: if the Perimeter is 18 and the base is 3, A=3(18/2 – 3); therefore the area is 18.
The graph for the base to the area is a non-linear graph. Do not connect the points for this graph because there are other rational number values that can be used to give a constant perimeter of 18 with a changing area. Do not talk about quadratics, only reference as non-linear.
A18 Student Challenge – Irregular Shapes Constant Perimeter Distribute copies of graph paper to each student. (B18) Have students work independently to determine a constant perimeter they want to work with. Then have students create at least four (4) irregular shapes that keep the constant perimeter, but the area changes. These will all be different. Place the following question on the overhead or board for students to answer when finished. How can the formula for area A = L x W be used to determine that the correct area has been found? Students should conjecture that if they break the shape into rectangular arrays, they can apply the area formula by adding the area of the different rectangular arrays together for the total area of the irregular figure.
Materials One copy of Blackline Master B17 per student

Notes to the Teacher
This irregular figure can be broken into one 3 x 1 rectangle, one 2 x 2 rectangle, and one 2 x 1 rectangle.
The total area is 3 sq. units + 4 sq. units + 2 sq. units or 9 sq. units. Materials Color Tiles Overhead color tiles Overhead transparency of Grid Paper (B17) - This is optional. Geometer’s Sketchpad can be used to explore constant area with changing perimeters. Students conjecture the longer the base of the figure, the greater the perimeter. For example the 1 x 18 figure yields a perimeter of 38 and the 6 x 3 figure yields a perimeter of 18. Both have the same area. Students worked in seventh grade to demonstrate relationships of area and perimeter. Also, students need to understand the proportional changes that occur with area and perimeter in similar figures.
A19 Constant Area Work in whole class activity to model how perimeter changes with a constant area. Build the following model on the over head with transparent color tiles.
Ask students to determine the area and perimeter of the irregular figure. The area is 18 square units; the perimeter is 24units. Challenge students to find all rectangular figures that have a fixed area of 18. The smallest figure is 6 x 3. Then have the students build the figure that yields the largest perimeter with an area of 18. This figure is 1 x 18.
Have the students work in small groups to use the color tiles to build rectangular polygons with an area of 18 and record the base/length to width and perimeter to length relationship in a T-chart. Then graph the relationship of the base (length) to perimeter. BASE WIDTH AREA PERIMETER 1 18 18 38 2 9 18 22 3 6 18 18 4 n/a n/a n/a 5 n/a n/a n/a 6 3 18 18 7 n/a n/a n/a 8 n/a n/a n/a 9 2 18 22 18 1 18 38

Notes to the Teacher Base to Perimeter graph:
Ask the students to answer the following questions, then discuss as a whole group: • What patterns are observed? The perimeter changes by perfect
squares 16 and 4. Students may not see this pattern. There are only three shapes 1 x 18, 2 x 9, 3 x 6.
• Determine a rule for perimeter, P, when the base, b, (bottom) is given. P=2(A/b + b)
• How does this rule relate to the perimeter formula P= 2(L+W)? When you divide the area by the base it gives you the width of the rectangular array. When you add the base length back to the width, it
gives 21 the perimeter. Multiplying by 2 gives the whole perimeter.

B17 Graph Paper

STAARTM
State of Texas Assessments of
Academic Readiness
MATHEMATICS
Grade 8 2011 2011 Released Test Questions
These released questions represent selected TEKS student expectations for each reporting category. These questions are samples only and do not represent all the student expectations eligible for assessment.
Copyright © 2011, Texas Education Agency. All rights reserved. Reproduction of all or portions of this work is prohibited
without express written permission from the Texas Education Agency.

STAAR Grade 8 Mathematics 2011 ReleaseReleased Test Questions
1 Mr. Valdez plans to open a savings account. The annual interest rates offered by 4 banks are shown below.
1 3 4 22 %, 2 %, 2 %, 2 %2 8 5 3
Which list shows these interest rates in order from greatest to least?
3 4 2 1A 2 %, 2 %, 2 %, 2 %8 5 3 2
3 1 2 4B 2 %, 2 %, 2 %, 2 %8 2 3 5
4 3 2 1C 2 %, 2 %, 2 %, 2 %5 8 3 2
4 2 1 3D 2 %, 2 %, 2 %, 2 %5 3 2 8
1 32 A recipe that makes 1 dozen cookies requires cup of sugar. Shanika wants to make 2 4
6 dozen cookies. How many cups of sugar will she need?
1A 1 cups8
B 4 cups
3C 6 cups4
D 3 cups
Page 2

3 Gabriel can type 90 words in 65 seconds. Which equation can be used to find w, the number of words Gabriel can type at this rate in 125 seconds?
90A w = (125)65
65B w = (125)90
90(65)C w = 125
125D w = 90(65)
4 Macaleh compared the prices of four different brands of coffee.
STAAR Grade 8 Mathematics 2011 ReleaseReleased Test Questions
Coffee Price
4 ounces 8 ounces 12 ounces 16 ounces
Brand I $1.15 $2.30 $3.45 $4.60
Brand II $2.00 $3.80 $5.40 $6.80
Brand III $2.00 $3.00 $5.00 $8.00
Brand IV $3.30 $4.45 $6.60 $7.75
Which brand of coffee offers a proportional relationship between its weight and its price?
A Brand I
B Brand II
C Brand III
D Brand IV
Page 3

5 Last week a certain brand of bottled water cost $1.25 for a 16-ounce bottle. This week the water is on sale for $1.00 for a 16-ounce bottle. What is the percent decrease in the price of this bottled water?
A 16%
B 13%
C 20%
D 25%
6 Which equation best represents the data in the table below?
STAAR Grade 8 Mathematics 2011 ReleaseReleased Test Questions
A 4x − 3y = 12
B 4x − 3y = −9
C 3x − 4y = −12
D 3x − 4y = 9
Page 4

7 A right triangle is shown below.
STAAR Grade 8 Mathematics 2011 ReleaseReleased Test Questions
6 cm
8 cm
The triangle is dilated by a scale factor of 2.5 to create a new triangle. What is the perimeter of the new triangle?
A 120 cm
B 24 cm
C 60 cm
D 150 cm
Page 5

8 Mr. Barber wants to have the entire roof of his house replaced. A drawing of his prism-shaped house is shown below.
STAAR Grade 8 Mathematics 2011 ReleaseReleased Test Questions
55 ft30 ft
16 ft 16 ft
The cost of replacing the roof is $2.10 per square foot. What will be the cost for Mr. Barber to have the roof replaced?
A $1,760
B $3,465
C $880
D $3,696
Page 6

9 The paperweight shown below is in the shape of a square pyramid.
3 in. 3 4
6 in.
STAAR Grade 8 Mathematics 2011 ReleaseReleased Test Questions
What is the volume of this paperweight?
A 135 in.3
1B 22 in.3 2
C 45 in.3
1D 112 in.3 2
10 A 20-foot ladder is leaning against the side of a building. The bottom of the ladder is 4 feet from the wall. How many feet above the ground does the ladder touch the wall?
A 16 ft
B 384 ft
C 12 ft
D 416 ft
Page 7

STAAR Grade 8 Mathematics 2011 ReleaseReleased Test Questions
211 The dimensions of a rectangle are dilated using a scale factor of . What is the relationship3
between the new area and the original area?
8A The area of the new rectangle is the original area.3
2B The area of the new rectangle is the original area.3
4C The area of the new rectangle is the original area.9
8 D The area of the new rectangle is the original area.27
12 Rufus has a box that contains cards of the same shape and size. There are 5 yellow cards, 4 red cards, and 1 purple card. He draws a card at random, replaces it, and draws a second card. What is the probability that both cards will be red?
4A 5
2B 15
4C25
2D 5
Page 8

13 At Travis Middle School, 61 eighth graders are members of the band, and 35 eighth graders are members of the math club. There are 24 eighth graders who are members of both groups. Which Venn diagram best represents this information?
Eighth Graders
Band Math club
A
61 24 35
Eighth Graders
Band Math club
C
1137 24
Eighth Graders
Band Math club
B
61 24 11
Eighth Graders
Band Math club
D
3537 24
STAAR Grade 8 Mathematics 2011 ReleaseReleased Test Questions
Page 9

14 The graph below shows the number of students at Collins Middle School enrolled in Spanish classes over a 6-year period.
Num
ber
of Stu
den
ts
Spanish Class Enrollment
100
90
80
70
60
50
40
30
20
0 1 2 3 4 5 6
Year
STAAR Grade 8 Mathematics 2011 ReleaseReleased Test Questions
Based on the graph, which statement is true?
A The number of students enrolled in Spanish increased by about 300% from Year 1 to Year 6.
1B The number of students enrolled in Spanish during Year 6 was about 7 times the2number enrolled in Spanish in Year 1.
C The number of students enrolled in Spanish increased the most from Year 5 to Year 6.
D The number of eighth-grade students enrolled in Spanish increased by about 25% each year.
Page 10

STAAR Grade 8 Mathematics 2011 ReleaseAnswer Key
Item Number
Reporting Category
Readiness or Supporting
Content Student Expectation
Process Student Expectation
Correct Answer
1 1 Readiness 8.1(A) D 2 1 Readiness 8.2(B) 8.14(A) D 3 1 Supporting 8.2(D) 8.15(A) A 4 2 Supporting 8.3(A) 8.14(A) A 5 2 Readiness 8.3(B) 8.14(A) C 6 2 Readiness 8.4(A) B 7 3 Readiness 8.6(A) 8.14(C) C 8 3 Supporting 8.7(B) 8.14(B) D 9 4 Readiness 8.8(C) 8.14(B) C 10 4 Readiness 8.9(A) 8.14(B) B 11 4 Supporting 8.10(A) 8.15(A) C 12 5 Readiness 8.11(A) C 13 5 Supporting 8.12(C) 8.15(A) C 14 5 Readiness 8.13(B) 8.15(A) A
For more information about the new STAAR assessments, go to www.tea.state.tx.us/student.assessment/staar/.
Page 11

TEACHING SUGGESTIONS
In-Class GameThe Transformation Game
Separate the class into groups of four.
• The Transformation Game master, p. 22
• The Transformation Game Board master, p. 23
• The Transformation Game Pieces master, p. 24
• The Transformation Game Cards masters, pp. 25–26
• 30 index cards per group
• scissors
• tape or glue
Make a copy of The Transformation Game master on page 22 for eachstudent in the class. Photocopy The Transformation Game Board master onpage 23 onto card stock for each group. Photocopy The TransformationGame Pieces master on page 24 onto a clear transparency. Cut out the gamepieces and give each group four different game pieces. Make a copy of TheTransformation Game Cards masters on pages 25 and 26 for each group.Have students cut out the game cards, tape or glue them to the index cards,and draw a “?” on the reverse side.
• Choose the corner square that matches your game piece. Place your gamepiece so that it matches the T on your corner square. The goal is to reachthe square that is diagonally opposite from your starting square.
• A player chooses a card from the card pile, follows the instructions, andplaces it faceup in a discard pile. A playing piece may be moved followingthe instructions on the card if and only if the T can be made to match theT on the final square on which it lands. Two or more players may occupythe same square. Diagonal moves are not permitted.
• Free spaces do not have a T on them. Playing pieces may land on freespaces facing any direction. However, if a player lands on an occupied freespace, his or her piece must match the piece that is already there.
• A player loses his or her chance to move only if it is impossible to followthe instructions on the card. The first player to move into his or herdiagonally opposite corner square is the winner.
© Glencoe/McGraw-Hill 21 Mathematics: Applications and Concepts, Course 3

© Glencoe/McGraw-Hill 22 Mathematics: Applications and Concepts, Course 3
Name_____________________________ Date_____________
In-Class GameThe Transformation Game
Work in groups of four.
• Place the card pile in the middle of the table. Choose the corner squarethat matches your game piece. Place your game piece so that it matchesthe T on your corner square. The goal is to reach the square that isdiagonally opposite from your starting square.
• A player chooses a card from the card pile, follows the instructions, andplaces it faceup in a discard pile. A playing piece may be moved followingthe instructions on the card if and only if the T can be made to match theT on the final square on which it lands. Intermediate steps need notmatch, but all steps must be carried out in the exact order in which theyappear on the card. Therefore, the T on the playing piece must alwaysmatch the T on the game board space on which it sits. Two or moreplayers may occupy the same square. Diagonal moves are not permitted.
• There are three types of moves: slides, turns, and flips.
• Free spaces do not have a T on them. Playing pieces may land on freespaces facing any direction. However, if a player lands on an occupied freespace, his or her piece must match the piece that is already there.
• If a player can move, he or she must move, no matter what. A playerloses his or her chance to move only if it is impossible to follow theinstructions on the card. The first player to move into his or her diagonallyopposite corner square is the winner.
T TT
T
T T
T
T
T
T T
T
TT
slide turn flip

© Glencoe/McGraw-Hill 23 Mathematics: Applications and Concepts, Course 3
RESOURCES
In-Class GameThe Transformation Game Board
��
T
T TT T
T
����@@@@����ÀÀÀÀ
T
TT
T T
T
T T
T T T
TT
TTT
TTT
TT
T T
TT
T T T
T T
T
TTT
T
T����
T
T TT T
T T

© Glencoe/McGraw-Hill 24 Mathematics: Applications and Concepts, Course 3
RESOURCES
In-Class GameThe Transformation Game Pieces
T
T
T
T
T
T
T
T
T
����
����@@@@����ÀÀÀÀ
������
��
����@@@@����ÀÀÀÀ
���������
����
����@@@@����ÀÀÀÀ
������
����
������
@@@@@@
������
ÀÀÀÀÀÀ
����
��
������
@@@@@@
������
ÀÀÀÀÀÀ
������
����
������
@@@@@@
������
ÀÀÀÀÀÀ
����
����
����@@@@����ÀÀÀÀ
������
��
����@@@@����ÀÀÀÀ
���������
����
����@@@@����ÀÀÀÀ
������

© Glencoe/McGraw-Hill 25 Mathematics: Applications and Concepts, Course 3
RESOURCES
In-Class GameThe Transformation Game Cards
SLIDE
FLIP, SLIDE, andTURN
FLIP, SLIDE, andTURN
TURN, FLIP, andSLIDE
TURN, FLIP, andSLIDE
SLIDE and TURN
TURN, SLIDE, andFLIP
TURN, SLIDE, andFLIP
SLIDE, FLIP, andTURN
SLIDE, FLIP, andTURN
SLIDE and TURN
SLIDE, TURN, andFLIP
SLIDE, TURN, andFLIP
FLIP, TURN, andSLIDE
FLIP, TURN, andSLIDE

© Glencoe/McGraw-Hill 26 Mathematics: Applications and Concepts, Course 3
RESOURCES
In-Class GameThe Transformation Game Cards
FLIP
FLIP
TURN
TURN
SLIDE
FLIP and TURN
FLIP and TURN
FLIP and SLIDE
FLIP and SLIDE
TURN and SLIDE
TURN and FLIP
TURN and FLIP
SLIDE and FLIP
SLIDE and FLIP
TURN and SLIDE

Notes to the Teacher Materials Translations Cards (B9a – B9d)
A8 Translating Shapes Students work in pairs or small groups to match Translation Cards (verbal descriptions, pictorial representation of the pre-image and slide arrow, pictorial representation of the pre-image with image, rules, and t-charts). They should line up the five cards in a set and draw them out on their own graph paper to demonstrate mastery. The Blackline masters are set up so that each column is a matching set. The cards should be cut apart prior to distribution. Lamination will extend their useful lifespan.

B9a Translating Shapes
12
1
2
21
1
1
1
x x′y y′
91310 8
1 3 6 3
7 912 9
3 7 4 2
x x′y y′
8 9 6
3 7 5
1 4 3
3 4 1
x x′y y′
133345
6 1 311 611
6 1 311 611
7 9 9 91011

B9a Translating Shapes
Move
6 units to the left
Move
6 units up and 6 units to the
right
Move
2 units down and
5 units to the right
(x - 6, y)
(x + 6, y + 6)
(x - 2, y + 5)

9c Translating Shapes B
12
1
2
2
1
1
1
1
x x′y y′
1 5 2 0
1 3 6 3
8101310
3 7 4 2
x′x y y′
8 9 6
3 7 5
1 4 3
3 4 1
x x′y y′
7 91110119
61111 6 1 1
81313 8 3 3
1 3 5 4 5 3

B9d Translating Shapes
Move
2 units up and 6 units to the
right
Move
7 units up and 2 units to the
right
Move
2 units up and 5 units to the
left
(x + 6, y + 2)
(x - 2, y + 7)
(x - 5, y + 2)

Notes to the Teacher Materials Graph paper (B1) Graphing calculator (optional) The new vertices are: (-4,6), (-2,6), and (-1,9). In answering why the addition format works the answers will vary. However, the focus is that when movement is to the left or right it affects the x value. When movement is up or down, it affects the y value. The addition method sets up the addition for x to x and y to y.
A10 Transformation and Movement Arrow Students will work in a whole group setting to determine the vertex of translating a figure without graphing. Remind students that a translation is a slide or a glide without turning, as shown on the previous day. Now have the students graph the following vertices (1,2), (3,2), and (4,5). Explain that the movement arrow will be 5 units
left and 4 units up. This movement can be expressed as ( ). To
find the vertices of the new image we will use this “vector” or movement line by adding to each vertex. Show this example on the board or overhead:
45−
( )64
()45
()21 −
=−
+ Be sure to note these are not fractions. Therefore,
the new vertex is (-4,6). Ask students to find the next two vertices in the same manner, then graph to justify their findings. Explain why the addition format works.
Materials One copy of Blackline Master B11a, B11b, and B11c for each student.
A11 Translation Practice Students will work independently to graph translations, write verbal descriptions of translations, and create a rule for the translation. They will also build the concept of congruency by comparing side lengths, angle measure, perimeter, and area. The answers to the sheets are as follows: B11a
Original Image New Image A (-4,5) A′ (-1,5) B (1,5) B′ (4, 5) C (3, -3) C′ (6, -3) D (-4, -3) D′ (-1, -3)
(x + 3, y)
Original Image New Image A (-4,5) A′ (-4, 3) B (1,5) B′ (1, 3) C (3, -3) C′ (3, -5) D (-4, -3) D′ (-4, -5)
(x, y – 2)
4. Length of sides, angles, perimeter, and area will stay the same. 5. add 4 units to x value; add 5 units to y value B11b
A B(-4, 5)( 1, 5)( 1, 3)(-1, 3)(x, y)
(-4, -3)( 1, -3)( 1, -5)(-1, -5)(x, y - 8)
Description of transformation:
Vertical shift 8 units down (x, y - 8)
©2005 Houston Independent School District

Notes to the Teacher
B11b(answers continued) A B
(-4, 5)( 1, 5)( 1, 3)(-1, 3)(x, y)
(3, 5)( 8, 5)( 8, 3)(6, 3)(x + 7, y)
Description of transformation:
Horizontal shift 7 units tothe right
(x + 7, y)
A
(-4, 5)( 1, 5)( 1, 3)(-1, 3)(x, y)
B(3, -3)( 8, -3)( 8, -5)(6, -5)(x + 7, y - 8)
Description of transformation:
Vertical shift 8 units downand horizontal shift 7 unitsto the right (x + 7, y - 8)
B11c
New image(x’, y’)
(3, 5)(-1, 7)(-4, -5)(0, -7)(2, -2)
Original image(x, y)
(3, 11)(-1, 13)(-4, 1)(0, -1)(2, 4)
1.
2. Quadrant III answers will vary but must all have the form (-x, -y)
3. Quadrant IV answers will vary but must all have the form (x, -y)
4. (x + 5, y): move 5 units to the right (x, y + 5): move 5 units up (x – 3, y): move 3 units to the left (x, y – 3): move 3 units down (x – 3, y + 5): move 3 units to the left and 5 units up
©2005 Houston Independent School District

B1 Graph Paper
©2005 Houston Independent School District

B11a Translation Practice 1 1. Translate the figures below using the instructions given for each grid. 2. Create a t-chart to compare the coordinates of the points in the new image to the
corresponding points in the original image.
©2005 Houston Independent School District
3. Write a generalization in (x,y) form for points on the new image, compared to
corresponding points on the original image. 4. Explore the characteristics of the original image and new image. How do they
compare? • Length of corresponding sides • Corresponding angle measurements • Perimeter • Area
5. Write a generalization in (x,y) form if the transformation was:
• A translation 4 units to the left • A translation 5 units up
C
Translate 3 units to the right
Translate 2 units down
A B
D
A B
D C

B11b Translations Practice 2 For each set of figures: • Describe the transformation from figure A to figure B • Record ordered pairs of corresponding points in a table • Write a generalization in (x, y) form for points on figure B compared to figure A
A
B
Table Description of transformation
©2005 Houston Independent School District
A
B
A B
Generalization in (x, y) form
Table Description of transformation
Generalization ) form in (x, y
Table Description of transformation
Generalization in (x, y) form

B11c Translations Practice 3 1. Given the ordered pairs of points of an original image (x,y), create the corresponding
ordered pairs of the new image (x’,y’) if the figure is translated 6 units to the right.
In what quadrant is the new image? ______________________________
New image (x′, y′)
(3, 5) (-1, 7) (-4, -5) (0, 7) (2, -2)
Original image (x, y)
2. Create the corresponding ordered pairs of the new image (x’,y’) so that the new image will appear in quadrant III.
Original image (x, y)
New image (x′, y′)
(3, 5) (-1, 7) (-4, -5) (0, 7) (2, -2)
3. Create the corresponding ordered pairs of the new image (x’,y’) so that the new image will appear in quadrant IV.
Original image (x, y)
New image (x′, y′)
(3, 5) (-1, 7) (-4, -5) (0, 7) (2, -2)
4. Describe the transformation from (x, y) given the following generalizations:
• (x + 5, y) _____________________________________________________
• (x, y + 5) _____________________________________________________
• (x – 3, y) _____________________________________________________
• (x, y – 3) _____________________________________________________
• (x – 3, y + 5) _____________________________________________________
©2005 Houston Independent School District

Notes to the Teacher Materials Copies of blackline master B12, cut and laminated.
Graph Paper (B1) one copy per student.
Rulers Colored pencils or markers Blank overhead transparency Patty Paper/Tracing paper
A12 Properties of Reflections Distribute copies of cut-out triangles from blackline master B12 for students to use as tracing templates in this exercise. Students will also need copies of graph paper. The triangles are labeled A, B, and C so you can instruct students which one to use. Model the first three steps with the students on the overhead using a transparency of graph paper (B1). Have them draw the triangle and label it. Then fold the overhead in half along the y-axis, draw in the line of reflection and label it as such. (This will be the axis.) Have the students do the same on their paper. Then trace the triangle in a second color and label the new triangle with ′ notation. Ask the following questions about the two triangles: • Are the angles congruent? (Yes, they are the same) • Are the side lengths still the same? (Yes, they are the same) • Is the area of the two triangles still the same? (Yes, they are the
same) • Is the perimeter of the two triangles still the same? (Yes, they are the
same) • Are the triangles equidistant from the line of reflection? (Yes, they
are the same distance) Have students prove this last statement by doing the third step in this exercise. Draw three line segments that connect each vertex of the original triangle with the new triangle. Have students measure the distance from the line of reflection to each vertex point. (These measures should be the same) Have students draw a coordinate grid on their graph paper. Once completed students should lay the tracing paper on the grid with the line of reflection on the y-axis. Have students write the ordered pairs for the vertices of the original triangle and the new triangle. Have students describe the relationship from the original ordered pair and the new ordered pair. (-x.y)→(x,y) That the x values are opposites. Have students repeat this process for the last two tracing triangle templates.
Materials One copy blackline masters B13 – B13c per student.
Colored pencils (optional) if needed for the reflection.
A13 Reflections Practice Distribute copies of blackline mastera B13a, B13b, and B13c for students to work independently. The students will graph reflections, write verbal descriptions of reflections, and create a rule for the reflection. They will build the concept of line of reflection and the distance from the line is equal. The students will also develop the concept that the shapes are congruent due to side lengths, perimeter, angles, and area staying consistent even though the orientation has changed.

Notes to the Teacher Answers: B13a 1. 2.
Original New Image Image A(-5,6) A′ (5,6) B (-2,6) B′ (2, 6) C (-1, 1) C′ (1, 1) D (-5, 1) D′ (5, 1)
Original New Image Image A(-5,6) A′ (-5,-6) B (-2,6) B′ (-2, -6) C (-1, 1) C′ (-1, -1) D (-5, 1) D′ (-5, -1)
3. generalizations: (-x, y) and (x,-y) 4. length of corresponding sides are congruent corresponding angle measurements are congruent perimeter is congruent area is congruent B13b
New Image (1, 3) (1, 5) (6, 5) (3, 3)
(-x,y) → (x, y)
New Image (-1, -3) (-1, -5) (-6, -5) (-3, -3)
(-x, y) → (-x, -y)

B1 Graph Paper
©2005 Houston Independent School District

B12 Triangle Templates
B
A
C

B13a Reflection Practice 1 1. Reflect the figures below using the instructions given for each grid. 2. Create a t-chart to compare the coordinates of the points in the new image to the
corresponding points in the original image (pre-image).
Reflect across the Y-axis A B
3. Write a generalization in (x,y) form for points on the new image, compared to
corresponding points in the original image (pre-image). 4. Explore the characteristics of the original image (pre-image) and new image. How do
they compare? • Length of corresponding sides • Corresponding angle measurements • Perimeter • Area
C D
Reflect across the X-axis B A
D C

B13b Reflection Practice 2 For each set of figures: • Perform the given transformation • Record ordered pairs of corresponding points in a table • Write a generalization in (x, y) form for points on the image compared to the pre-
image (A)
A
Reflect across the y-axis Table Generalization in (x, y) form
Table
Table
Generalization in (x, y) form
Generalizatin (x, y) f
Reflect across the x-axis
A
Reflect across the y-axis and then across the x-axis ion
orm
A

B13c Reflection Practice 3 1. Given the ordered pairs of points of an original image (x,y), create the corresponding
ordered pairs of the new image (x’,y’) if the figure is reflected across the y-axis..
Original image (x, y)
(3, 5) (-1, 7) (-4, -5) (0, -7) (2, -2)
New image (x’, y’)
2. Create the corresponding ordered pairs of the new image (x’,y’) so that the new image will appear in reflected across the x-axis.
Original image (x, y)
(3, 5) (-1, 7) (-4, -5) (0, -7) (2, -2)
New image (x’, y’)
3. Create the corresponding ordered pairs of the new image (x’,y’) so that the new image will appear in reflected across the y-axis and then the x-axis.
Original image (x, y)
(3, 5) (-1, 7) (-4, -5) (0, -7) (2, -2)
New image (x’, y’)

Notes to the Teacher
Materials Transparencies of Blackline
Master B5a and B5b. Transparencies of Blackline
Masters B13 - B15 from Unit Two - Similar Figures.
The following are the ordered pairs used to create the graphs. Ordered Pairs: (2,0),(5,0),(5,2),(2,0) (6,0),(9,0),(9,6),(6,0)
(y = 52
x)
The last ordered pair is a repeat of the first for the graphing calculator. It is not necessary to give for graphing on paper. Ordered Pairs: (2,0),(5,0),(5,2),(2,0) (6,0),(9,0),(9,6),(6,0) (y = 0.75x - 0.75) The last ordered pair is a repeat of the first for the graphing calculator. It is not necessary to give for graphing on paper. Ordered Pairs: (2,2),(2,6),(5,6),(5,2),(2,2) (4,4),(4,12),(10,12),(10,4),(4,4) (Y=X) The last ordered pair is a repeat of the first for the graphing calculator. It is not necessary to give for graphing on paper.
A5 Polygon Dilations Place transparency (B5a) on the overhead and have students work in small groups to determine if the figures represent a dilation, and answer corresponding questions. 1. Do the two triangles represent a dilation? Justify your answer to
why or why it is not a dilation.
(This is not a dilation. The ray shown does not pass through corresponding vertices, and the scale factor is not applied to ordered pairs nor the side lengths, area, or perimeter.)
2. If you change the ray to go through point (1,0) does this make the
shape a dilation? Justify why moving the ray would or would not make this relationship a dilation.
The two figures do not have a common scale factor even if you change the ray to cross through (0,1). The answer as explained on the first figure would apply to this figure as well.
3. Does this picture illustrate a dilation?
Yes, the ordered pairs, area and perimeter dilate by a common scale factor.
4. According to the rules of dilation, in the above figure if the rays
were drawn through corresponding vertices would it have a vanishing point at (0,0)? (Yes)

Notes to the Teacher Answer the following questions regarding dilation of figures (B5b): 1. What is another name for figures that we studied previously that
enlarge by a common scale factor? (Similar Figures)Show students activity of Similar figures from Unit 2 B13-B15, and correlate how similar figures are dilations of the original. This is due to the scale factor. Note that angles did not change even though side lengths changed. However, the side lengths are in direct proportion to the original figure.
2. In dilating a figure does it matter if the ray passes through (0,0) or crosses corresponding vertices of the figures?
3. What role does the scale factor play in a dilation? Dilations are the same as similar figures.
Middle School TEXTEAMS: Geometry Across the TEKS
A6 Similarity and the Coordinate Plane This activity reinforces dilations and further exploration of the similarity of figures. It is important to distinquish the difference between similarity and congruence. Distribute copies of blackline master (B6) to students, and have them work independently, creating a dilation of the irregular pentagon and triangle. Once students have completed the activity discuss as whole group having students demonstrate their answers on the overhead. A blank copy of blackline master B6 should be on the overhead, for students can draw, and demonstrate their justification.
Have students answer the following questions, and write a justification for their answer. Place on overhead or chalkboard, or create a recording sheet for the answers: 1. How do the distances of A’ and A compare?
(The length is of A’ is twice that of A) 2. How do the distances of B’ and B compare? (The length of B’ is twice that of B)
Materials Copies of blackline master B6 for each student. Rulers Graphing Calculators (optional) Patty Paper (optional) This activity can be found in Navigating through Geometry Grades 6-8 page 38 for teacher notes, and page 100 for recording sheet. The following points should be discussed: The lengths of the line are 2X that of the original based on the scale factor. The triangles have the same shape with the rays crossing corresponding vertices and through the origin. Therefore, they have a center of dilation. The triangles are no longer congruent since the size changed, but remain similar. The shapes would enlarge by the scale factor given. Multiply each point of the shape by the new scale factor for the new points. The new figures would be dilations, and they would still be similar. All that is done is enlarging or reducing by a constant scale factor.

Notes to the Teacher
3. Do the two triangles have the same shape? Explain. (Yes, this can be determined by congruent angles, side lengths that enlarge by a common scale factor, and area and perimeter that also enlarge by a common scale factor.)
4. Make a conjecture about what the results would be if we used a
scale factor of 3, 4, or by 31 for each of the shapes, by identifying
the new coordinate points for each of the shapes. If we enlarged
by 3 or 4 the figure will enlarge, if we scale by 31 the figure will
reduce. 5. Would the figures represent a dilation? Would they still be similar?
(Yes, the figures would represent a dilation and they would be similar since all attributes would scale by a common factor)
Materials Copies of Graph paper (B1) – 4 sheets per student. Colored Pencils (optional) The pre-image and image may be graphed in different colors. Although each dilation requires its own coordinate plane, students can fit several coordinate planes on one piece of graph paper.
A7 A Different View Students will work independently to apply different dilation rules to polygons and determine what happened to the image. Distribute four sheets of graph paper per student. Place the following coordinates on the chalkboard and have students graph. Label connecting points of pre-image triangle ABC. A(2,1), B(5,2), C(3,6) Have students create a chart as follows:
DescriptionRule of Image Similar? How do you know?
Students create the new image following instructions on the overhead or chalkboard, and fill in the new information about the shape into the chart. For the original triangle, students perform the rules below and explain what happened to the original figure. Each dilation is graphed on a coordinate plane with the original figure. 1. (3X,3Y)
Answer: The result is an enlargement with (0,0) as vanishing point. This shape is not congruent, but is similar since the points are multiplied by a constant factor.

Notes to the Teacher 2. (3X+2, 3Y-5)
Answer: The figure is enlarged by a scale of 3 then is translated 2 units to the right, and 5 units down (due to adding 2 to X and subtracting 5 from Y). The shapes are not congruent, but are similar since they are multiplied by a constant scale factor.
3. (x,3Y)
Answer: The image is elongated and is not congruent nor similar. The y coordinates enlarge, but the x values stay the same.
4. 2
,2
yx
Answer: The image is reduced by 21 . The figures are not congruent,
but are similar since the coordinates are multiplied by a common scale factor.

B5a Polygon Dilations
Do the two triangles form a dilation? Why or why it is not? Justify your answer.
If the ray is changed to go through point (1,0) do the two triangles form a dilation? Why or why not? Justify yanswer.
our
Does this picture illustrate a dilation? Justify using the rules of dilation, of the ray and the common scale factor.

B5b Polygon Dilations Answer the following questions regarding dilation of figures: 1. What is another name for the kind of figures that enlarge by a
common scale factor? 2. In dilating a figure does it matter if the ray passes through (0,0), or crosses corresponding vertices of the figures? 3. What role does the scale factor play in a dilation?

B6 Similarity and the Coordinate Plane
A(2,1)
B(4,2)
C(4,-1)
G(5,5)
F(6,6)
E(4,8) D(2,8)
H(3,5)
O 1. Multiply the coordinates of points A, B, and C by 2, plot the new
points on the grid, and label them A’, B’, C’. 2. Multiply the coordinates of the points of the pentagon DEFGH
by 21 , plot the new points on the grid, and label the new figure
D’E’F’G’H’. 3. Draw lines through the corresponding vertices of each of the above
sets of figures. Make sure to extend the lines to a point of intersection.

Notes to the Teacher A2 Dilations on the Coordinate Plane Work with students in whole group to graph a dilation of two rectangles. Place the ordered pairs (x,y) of the first rectangle on the overhead or chalkboard. Have students record in a chart, and graph on grid paper or in the calculator. Figure 1: Coordinate Points (x,y): (2,0), (2,4), (6,4), (6,0)
x y2 0
2 4 6 4 6 0
Once the students have graphed the first figure (pre-image), have them record the new values as x′ and y′ for the second figure or image (a dilation), and graph as ordered pairs (x′, y′). These new ordered pairs are derived from using a scale factor of 2. Have students draw the rays as shown below on their figures. Starting from the origin, the rays are drawn to go through corresponding vertices. Figure 2. Coordinate Points (x′, y′): (4,0), (4,8), (12,8), (12,0). Dilation uses a scale factor of 2.
x y2 0
2 4 6 4 6 0
To put this in calculator, enter points for #1 in L1 and L2, and points for #2 in L3 and L4 then turn on both stat plots, choosing the second type of graph (continuous plot). Graph using the graph key. Ask the following questions regarding the dilation: 1. How do the two figures compare?
• Length of sides. (Length of the sides of the first rectangle are 4, the second rectangle are 8. The scale factor for the lengths is the same as the scale factor for the dilation: 2)
• Angle Measurements. (The angle remains the same: 90°. Additionally they are congruent.)
• Perimeter. (The perimeter of the original figure is 16, and the second figure is 32 which is a scale factor of 2.)
• Area. (The area in the original figure is 16, the area in the second figure is 64. This is the square of the scale factor. (2 x 2 x 16))
Materials Grid Paper (B1) Graphing Calculators (optional) Colored Pencils The dilations investigated in this section are ones that have a center of dilation, where the rays cross through the corresponding vertices and intersect at a center of dilation, in this case, the origin. This strategy for drawing dilations is used in art and architecture, and is called the vanishing point. (One point perspective) The teacher may display the rays on the calculator by finding their slopes and graphing the equations “over” the stat plot. In this case,
y=2x and y=32
x.
REMEMBER: SLOPE IS AN INFORMAL TOPIC AT THIS POINT. STUDENTS WILL NOT BE READY FOR THE Y=MX EQUATIONS.
x′ y ′2 0 2 4 6 4 6 0

Notes to the Teacher 2. When you dilate figures, what happens to the figures on the
coordinate plane? (Students should see that a dilation (enlargement/reduction) is being performed, and that the orientation of the figure is not changing. They should also recognize that the figures are similar figures since the angles do not change with the constant growth of the side lengths, area, and perimeter.)
Now have students use a scale factor of 3 to create a dilation of the original figure. They should record a new set of points in their chart, and graph the resulting figure. Answer:
Monitor the students to ensure accuracy, and discuss the same
questions as above with the students.
Materials Grid paper (B1) Graphing Calculators (Optional) Colored Pencils Patty paper can be used to draw the rays on the vertices. In order to display the rays on the overhead calculator, the teacher must input the equations: y = -0.5x + 4.5 y = -0.25x + 2.5
A3 Dilation or Not? In this activity, students work in a whole group setting to graph triangles and evaluate whether or not the figure is a dilation. Have students copy the given charts and plot the ordered pairs for the original figure and the image. (This can be done on graph paper or in a graphing calculator.)
x y1 2
5 2 1 6
x′ y′5 1
7 1 5 3
Discuss the following: • Even though the rays do not cross through the origin, are the figures
still a dilation of each other?(In this dilation the lines do not go through the origin, but do intersect at a common point on the x-axis. Therefore, giving a center of dilation as in A2.)
• Is the image a dilation of the pre-image? How can you justify your answer?(Side lengths, area, angles, perimeter. The students should notice as in the first model these attributes change by a common scale factor of 2. However, the ordered pairs do not change by a common scale factor, putting the center of dilation at (0,9))
©2005 Houston Independent School District

Notes to the Teacher Now change the position of the enlargement. Slide the enlargement left or right, up or down. Give students new ordered pairs on the overhead or chalkboard, and have them graph.
Possible new coordinate points (1,5), (5,5), (1,9), (1,5). Discuss the new location of the figure by asking: • Are the figures still the same? (The triangles are still similar, but in this
case the side lengths are enlarged/reduced by a common scale factor, not the x and y values in the ordered pairs.)
When the position of the dilated figure is changed, its center of dilation changes accordingly but similarity is preserved.
When the figure is slid to the left or right, up or down it is translated. Students need to be aware that this is the simplest form of dilation. A dilation that uses a scale factor of 1 is a translation. Similar figures should begin to surface as a topic in these discussions when the students notice that dilations preserve similarity.
A4 Reflect and Apply Place the following instructions on the overhead or chalkboard for students to work independently on dilations: Graph the following triangles: A(2,0), B(5,0), C(5,3) and D(6,0), E(9,0), F(9,6)
After the triangles are drawn, draw rays from the origin through the vertices of the original figure. (See diagram above. For grading purposes,
the equation of the line is y = x43
.)
Place the following questions on the board for the students to answer: • Do these figures represent a dilation with its center of dilation at the
origin? (Yes) • Do these figures represent a dilation from another point of dilation?
If so, name the point. (No)
Materials Graph paper (B1) Graphing Calculator (optional) Colored pencils

B1 Graph Paper
©2005 Houston Independent School District

Clarifying Activity 8.6B with Assessment Connections
Students dilate, reflect, or translate a polygon on a coordinate plane, compare the coordinates of the new
shape to the corresponding coordinates of the original shape, and look for patterns in the pairs of
coordinates that describe the transformation.
Example: Reflect the figure over the x-axis. Give the new coordinates. Reflect the original figure over the
y-axis. Give the new coordinates.
Assessment Connections
Questioning . . .
Open with . . .
What patterns do you notice in the ordered pairs from the original figure and the way they
correspond to the ordered pairs of the transformation?
Probe further with . . .
After the figure reflects over the x-axis, what do you notice about the values of the x-coordinates
in the original figure compared to the values of the x-coordinates of the transformed figure?
After the figure reflects over the y-axis, what do you notice about the values of the y-coordinates
in the original figure compared to the values of the y-coordinates of the transformed figure?
What do you notice about the y-coordinates of the two figures?
Listen for . . .
Can the student verbalize patterns found in the corresponding coordinates?
Can the student describe the differences between the processes for each type of transformation?
Can the student use the appropriate vocabulary when identifying transformations?
Look for . . .
Can the student plot the points correctly?
Can the student create a coordinate plane with correct symbols?
Can the student make the connection from transforming points visually one by one to making a
generalization and applying the generalization to the set of coordinates?