Embed Size (px)
Citation preview

Stage 9: Page 1
Mathematics overview: Stage 9 Star
Unit Hours KNOWLEDGE
Calculating 16 • calculate with roots, and with fractional indices • calculate with standard form A × 10n, where 1 ≤ A < 10 and n is an integer (ALSO 8*) • apply and interpret limits of accuracy including upper and lower bounds • calculate exactly with surds – be aware they haven’t yet covered Pythagoras’ theorem so you can’t use Pythagoras problems as a practical example • change recurring decimals into their corresponding fractions and vice versa • set up, solve and interpret the answers in growth and decay problems, including compound interest • estimate powers and roots of any given positive number (NCA) • simplify surd expressions involving squares (e.g. 12 = √(4 × 3) = √4 × √3 = 2√3) and rationalise denominators (NCA) • apply systematic listing strategies including use of the product rule for counting (NCA)
• measure line segments and angles in geometric figures, including interpreting maps and scale drawings and use of bearings (ALSO 8*) • identify, describe and construct similar shapes, including on coordinate axes, by considering enlargement (including fractional scale factors) (NEW) • construct plans and elevations of 3D shapes (NEW) • use standard ruler and compass constructions REMOVE as done in Year 7 and 8, they were very confident with this to solve loci (keep) problems; know that the
perpendicular distance from a point to a line is the shortest distance to the line (NEW) • identify, describe and construct similar shapes, including on coordinate axes, by considering enlargement (including fractional scale factors) (NCA) • describe the changes and invariance achieved by combinations of rotations, reflections and translations (NCA) • identify, describe and construct congruent and similar shapes, including on coordinate axes, by considering enlargement (including negative scale factors) (NCA)
• understand and use the concepts and vocabulary of identities • know the difference between an equation and an identity • simplify and manipulate algebraic expressions by expanding products of two binomials and factorising quadratic expressions of the form x² + bx + c, including the
difference of two squares (NEW) • manipulate algebraic expressions by factorising quadratic expressions of the form ax² + bx + c • simplify and manipulate algebraic expressions (including those involving surds and algebraic fractions) by expanding products of two or more binomials (NEW) • solve, in simple cases, two linear simultaneous equations in two variables algebraically (NCA) • solve two simultaneous equations in two variables where one is quadratic algebraically (NCA) • solve quadratic equations (including those that require rearrangement) algebraically by factorising (NCA) • find approximate solutions to equations numerically using iteration (NCA) • solve quadratic equations by completing the square and by using the quadratic formula (NCA) • solve problems involving direct and inverse proportion including graphical and algebraic representations • apply the concepts of congruence and similarity, including the relationships between lengths in similar figures • change freely between compound units (e.g. density, pressure) in numerical and algebraic contexts (ALSO 8*) • use compound units such as density and pressure (ALSO 8*) • recognise and interpret graphs that illustrate direct and inverse proportion (NCA) • understand that X is inversely proportional to Y is equivalent to X is proportional to 1/Y (NCA) • interpret equations that describe direct and inverse proportion (NCA) • construct equations that describe direct and inverse proportion (NCA) • interpret the gradient at a point on a curve as the instantaneous rate of change (NCA) • work with general iterative processes (NCA) REMOVE – DOESN’T FIT IN WITH THIS MODULE • deduce expressions to calculate the nth term of quadratic sequences • recognise and use simple geometric progressions (r^n where n is an integer, and r is a rational number > 0 ) • understand and use the concepts and vocabulary of inequalities
Visualising and constructing
12
Algebraic proficiency: tinkering
12
Proportional reasoning 12
Pattern sniffing 9
Solving equations and inequalities I
8
Calculating space 16
Conjecturing 8 Algebraic proficiency: visualising
16
Stage 9: Page 2
Solving equations and inequalities II
12
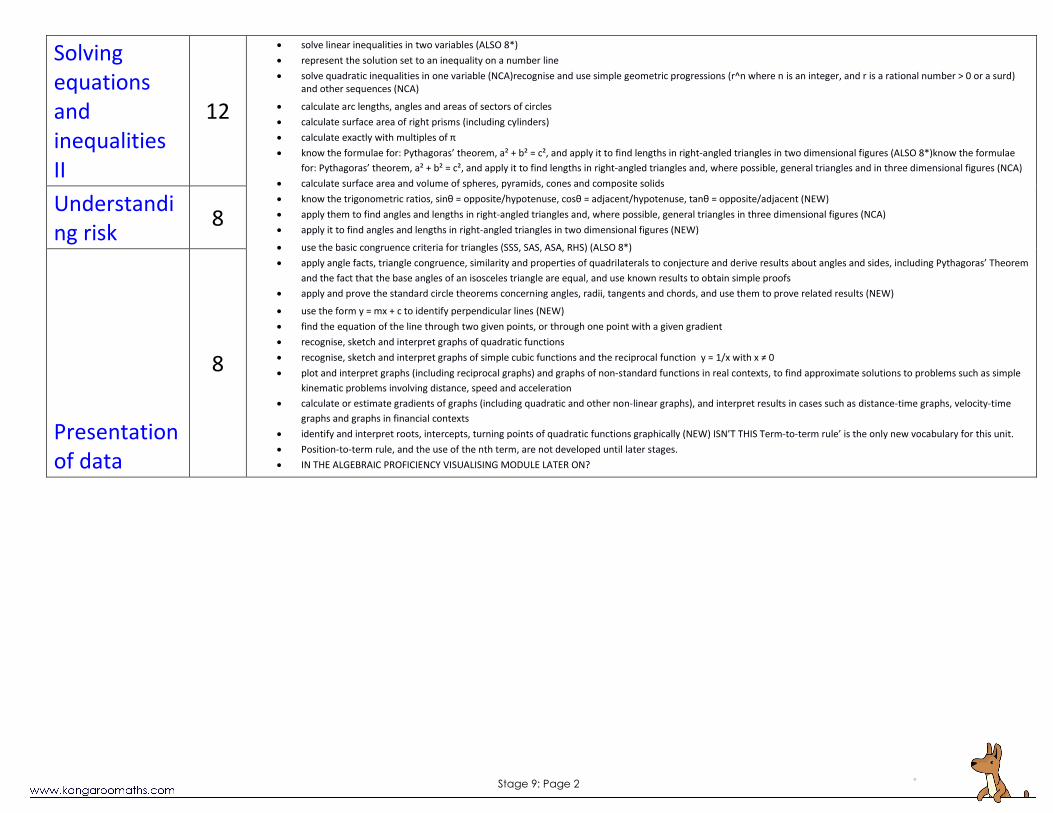
• solve linear inequalities in two variables (ALSO 8*) • represent the solution set to an inequality on a number line • solve quadratic inequalities in one variable (NCA)recognise and use simple geometric progressions (r^n where n is an integer, and r is a rational number > 0 or a surd)
and other sequences (NCA)
• calculate arc lengths, angles and areas of sectors of circles • calculate surface area of right prisms (including cylinders) • calculate exactly with multiples of π • know the formulae for: Pythagoras’ theorem, a² + b² = c², and apply it to find lengths in right-angled triangles in two dimensional figures (ALSO 8*)know the formulae
for: Pythagoras’ theorem, a² + b² = c², and apply it to find lengths in right-angled triangles and, where possible, general triangles and in three dimensional figures (NCA) • calculate surface area and volume of spheres, pyramids, cones and composite solids • know the trigonometric ratios, sinθ = opposite/hypotenuse, cosθ = adjacent/hypotenuse, tanθ = opposite/adjacent (NEW) • apply them to find angles and lengths in right-angled triangles and, where possible, general triangles in three dimensional figures (NCA) • apply it to find angles and lengths in right-angled triangles in two dimensional figures (NEW)
• use the basic congruence criteria for triangles (SSS, SAS, ASA, RHS) (ALSO 8*) • apply angle facts, triangle congruence, similarity and properties of quadrilaterals to conjecture and derive results about angles and sides, including Pythagoras’ Theorem
and the fact that the base angles of an isosceles triangle are equal, and use known results to obtain simple proofs • apply and prove the standard circle theorems concerning angles, radii, tangents and chords, and use them to prove related results (NEW)
• use the form y = mx + c to identify perpendicular lines (NEW) • find the equation of the line through two given points, or through one point with a given gradient • recognise, sketch and interpret graphs of quadratic functions • recognise, sketch and interpret graphs of simple cubic functions and the reciprocal function y = 1/x with x ≠ 0 • plot and interpret graphs (including reciprocal graphs) and graphs of non-standard functions in real contexts, to find approximate solutions to problems such as simple
kinematic problems involving distance, speed and acceleration • calculate or estimate gradients of graphs (including quadratic and other non-linear graphs), and interpret results in cases such as distance-time graphs, velocity-time
graphs and graphs in financial contexts • identify and interpret roots, intercepts, turning points of quadratic functions graphically (NEW) ISN’T THIS Term-to-term rule’ is the only new vocabulary for this unit. • Position-to-term rule, and the use of the nth term, are not developed until later stages. • IN THE ALGEBRAIC PROFICIENCY VISUALISING MODULE LATER ON?
Understanding risk 8
Presentation of data
8

Stage 9: Page 3
• deduce roots of quadratic functions algebraically (NEW) Term-to-term rule’ is the only new vocabulary for this unit. • Position-to-term rule, and the use of the nth term, are not developed until later stages. • • plot and interpret graphs (including exponential graphs) and graphs of non-standard functions in real contexts, to find approximate solutions to problems such as simple
kinematic problems involving distance, speed and acceleration (NCA) • recognise and use the equation of a circle with centre at the origin (NCA) • find the equation of a tangent to a circle at a given point (NCA)
• solve, in simple cases, two linear simultaneous equations in two variables algebraically (ALSO 8*) • find approximate solutions to simultaneous equations using a graph • represent the solution set to an inequality using set notation and a graph ALREADY DONE IN SOLVING EQUATIONS AND INEQUALITIES 1 MODULE • solve quadratic equations algebraically by factorising (NEW)
• calculate the probability of independent and dependent combined events, including using tree diagrams and other representations, and know the underlying assumptions (ALSO 8*)
• enumerate sets and combinations of sets systematically, using tree diagrams (ALSO 8*) • understand that empirical unbiased samples tend towards theoretical probability distributions, with increasing sample size • calculate and interpret conditional probabilities through representation using expected frequencies with two-way tables, tree diagrams and Venn diagrams (NEW)
• interpret and construct tables, charts and diagrams, including tables and line graphs for time series data and know their appropriate use • construct and interpret diagrams for grouped discrete data and continuous data, i.e. cumulative frequency graphs, and know their appropriate use • interpret, analyse and compare the distributions of data sets from univariate empirical distributions through appropriate graphical representation involving discrete,
continuous and grouped data, including box plots • interpret, analyse and compare the distributions of data sets from univariate empirical distributions through appropriate measures of central tendency including
quartiles and inter-quartile range • construct and interpret diagrams for grouped discrete data and continuous data, i.e. histograms with equal and unequal class intervals and know their appropriate use
(NCA) • infer properties of populations or distributions from a sample, whilst knowing the limitations of sampling (NCA) •
• All students will be assessed on the content identified by the standard and the underlined type; • more highly attaining students will develop confidence and competence with all of this content • Only the more highly attaining students will be assessed on the content identified by bold (RED) type. • The highest attaining students will develop confidence and competence with the bold (RED) content.

Stage 9: Page 4
Calculating Link to Stage 10 16 hours KNOWLEDGE The Big Picture: Calculation progression map
• calculate with roots, and with fractional indices • calculate with standard form A × 10n, where 1 ≤ A < 10 and n is an integer (ALSO 8*) • apply and interpret limits of accuracy including upper and lower bounds • calculate exactly with surds • change recurring decimals into their corresponding fractions and vice versa • set up, solve and interpret the answers in growth and decay problems, including compound interest • estimate powers and roots of any given positive number (NCA) • simplify surd expressions involving squares (e.g. 12 = √(4 × 3) = √4 × √3 = 2√3) and rationalise single term denominators (NCA) • apply systematic listing strategies including use of the product rule for counting (NCA)
Return to overview
SKILLS Suggested resources • Calculate with positive indices (roots) using written methods eg. 35 x 42 • Calculate with negative indices in the context of standard form • Use a calculator to evaluate numerical expressions involving powers (roots) • Interpret a number written in standard form • Add (subtract) numbers written in standard form • Multiply (divide) numbers written in standard form • Convert a ‘near miss’ into standard form; e.g. 23 × 107 • Enter a calculation written in standard form into a scientific calculator • Interpret the standard form display of a scientific calculator • Identify the minimum and maximum values of an amount that has been rounded (to nearest x, x d.p., x s.f.) • Use inequalities to describe the range of values for a rounded value • Solve problems involving the maximum and minimum values of an amount that has been rounded • Know that a0 = 1 , Know that a-n = 1/an , Know that a1/n = n√a • Calculate with negative and fractional powers
Calculate exactly with surds
KM: Maths to Infinity: Standard form KM: Maths to Infinity: Indices Investigate ‘Narcissistic Numbers’. NRICH: Power mad! NRICH: A question of scale The scale of the universe animation (external site) Learning review
www.diagnosticquestions.com
Prerequisites Mathematical language Agreed Common Teaching Approaches • Know the meaning of powers • Know the meaning of roots • Know the multiplication and division laws of indices • Understand and use standard form to write numbers • Round to a given number of decimal places or significant figures • Know the meaning of the symbols <, >, ≤, ≥
Power Root Index, Indices Standard form Inequality Truncate Round Minimum, Maximum Interval Decimal place Significant figure Notation Standard form: A × 10n, where 1 ≤ A < 10 and n is an integer Inequalities: e.g. x > 3, -2 < x ≤ 5
Common approaches The description ‘standard form’ is always used instead of ‘scientific notation’ or ‘standard index form’. Standard form is used to introduce the concept of calculating with negative indices. The link between 10-n and 1/10n can be established. The language ‘negative number’ is used instead of ‘minus number’.
Quizzes Hegarty Maths Calculating 1 108, 125 Calculating 2 54, 116 Calculating 3 115, 117 Algebraic Proficiency: Tinkering 1 114 Algebraic proficiency: Tinkering 2 137 Proportional Reasoning 1

Stage 9: Page 5
Reasoning opportunities and probing questions Cross Curricular Links Possible misconceptions • Kenny thinks this number is written in standard form: 23 × 107. Do
you agree with Kenny? Explain your answer. • When a number ‘x’ is rounded to 2 significant figures the result is 70.
Jenny writes ’65 < x < 75’. What is wrong with Jenny’s statement? How would you correct it?
• Convince me that 4.5 × 107 × 3 × 105 = 1.35 × 10¹³
Liaise with the science department to establish when students first meet the use of standard form, and in what contexts they will be expected to interpret it. NCETM: Departmental workshops: Index Numbers NCETM: Glossary
• Some students may think that any number multiplied by a power of ten qualifies as a number written in standard form
• When rounding to significant figures some students may think, for example, that 6729 rounded to one significant figure is 7
• Some students may struggle to understand why the maximum value of a rounded number is actually a value which would not round to that number; i.e. if given the fact that a number ‘x’ is rounded to 2 significant figures the result is 70, they might write ’65 < x < 74.99’
Stage 9: Page 6
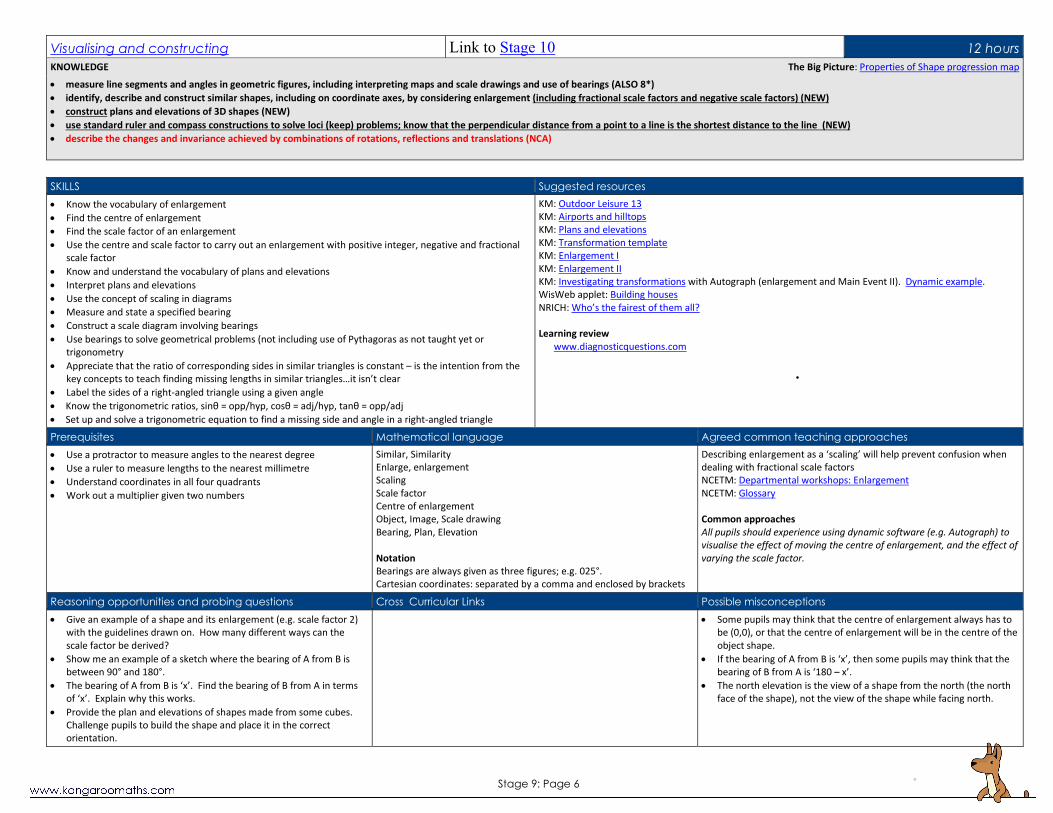
Visualising and constructing Link to Stage 10 12 hours KNOWLEDGE The Big Picture: Properties of Shape progression map
• measure line segments and angles in geometric figures, including interpreting maps and scale drawings and use of bearings (ALSO 8*) • identify, describe and construct similar shapes, including on coordinate axes, by considering enlargement (including fractional scale factors and negative scale factors) (NEW) • construct plans and elevations of 3D shapes (NEW) • use standard ruler and compass constructions to solve loci (keep) problems; know that the perpendicular distance from a point to a line is the shortest distance to the line (NEW) • describe the changes and invariance achieved by combinations of rotations, reflections and translations (NCA)
SKILLS Suggested resources • Know the vocabulary of enlargement • Find the centre of enlargement • Find the scale factor of an enlargement • Use the centre and scale factor to carry out an enlargement with positive integer, negative and fractional
scale factor • Know and understand the vocabulary of plans and elevations • Interpret plans and elevations • Use the concept of scaling in diagrams • Measure and state a specified bearing • Construct a scale diagram involving bearings • Use bearings to solve geometrical problems (not including use of Pythagoras as not taught yet or
trigonometry • Appreciate that the ratio of corresponding sides in similar triangles is constant – is the intention from the
key concepts to teach finding missing lengths in similar triangles…it isn’t clear • Label the sides of a right-angled triangle using a given angle • Know the trigonometric ratios, sinθ = opp/hyp, cosθ = adj/hyp, tanθ = opp/adj • Set up and solve a trigonometric equation to find a missing side and angle in a right-angled triangle
KM: Outdoor Leisure 13 KM: Airports and hilltops KM: Plans and elevations KM: Transformation template KM: Enlargement I KM: Enlargement II KM: Investigating transformations with Autograph (enlargement and Main Event II). Dynamic example. WisWeb applet: Building houses NRICH: Who’s the fairest of them all? Learning review
www.diagnosticquestions.com
Prerequisites Mathematical language Agreed common teaching approaches • Use a protractor to measure angles to the nearest degree • Use a ruler to measure lengths to the nearest millimetre • Understand coordinates in all four quadrants • Work out a multiplier given two numbers
Similar, Similarity Enlarge, enlargement Scaling Scale factor Centre of enlargement Object, Image, Scale drawing Bearing, Plan, Elevation Notation Bearings are always given as three figures; e.g. 025°. Cartesian coordinates: separated by a comma and enclosed by brackets
Describing enlargement as a ‘scaling’ will help prevent confusion when dealing with fractional scale factors NCETM: Departmental workshops: Enlargement NCETM: Glossary Common approaches All pupils should experience using dynamic software (e.g. Autograph) to visualise the effect of moving the centre of enlargement, and the effect of varying the scale factor.
Reasoning opportunities and probing questions Cross Curricular Links Possible misconceptions • Give an example of a shape and its enlargement (e.g. scale factor 2)
with the guidelines drawn on. How many different ways can the scale factor be derived?
• Show me an example of a sketch where the bearing of A from B is between 90° and 180°.
• The bearing of A from B is ‘x’. Find the bearing of B from A in terms of ‘x’. Explain why this works.
• Provide the plan and elevations of shapes made from some cubes. Challenge pupils to build the shape and place it in the correct orientation.
• Some pupils may think that the centre of enlargement always has to be (0,0), or that the centre of enlargement will be in the centre of the object shape.
• If the bearing of A from B is ‘x’, then some pupils may think that the bearing of B from A is ‘180 – x’.
• The north elevation is the view of a shape from the north (the north face of the shape), not the view of the shape while facing north.

Stage 9: Page 7
Algebraic proficiency: tinkering Link to Stage 10 12 hours KNOWLEDGE The Big Picture: Algebra progression map
• understand and use the concepts and vocabulary of identities • know the difference between an equation and an identity • simplify and manipulate algebraic expressions by expanding products of two binomials and factorising quadratic expressions of the form x² + bx + c, including the difference of two squares (NEW) • manipulate algebraic expressions by factorising quadratic expressions of the form ax² + bx + c • simplify and manipulate algebraic expressions (including those involving surds and algebraic fractions) by expanding products of two or more binomials (NEW) • solve, in simple cases, two linear simultaneous equations in two variables algebraically (NCA) • solve two simultaneous equations in two variables where one is quadratic algebraically (NCA) • solve quadratic equations (including those that require rearrangement) algebraically by factorising (NCA) • find approximate solutions to equations numerically using iteration (NCA) • solve quadratic equations by completing the square and by using the quadratic formula (NCA)
Return to overview
SKILLS Suggested resources • Understand the meaning of an identity • Multiply two linear expressions of the form (x + a)(x + b) • Multiply two linear expressions of the form (x ± a)(x ± b) • Expand the expression (x ± a)2 • Simplify an expression involving ‘x2’ by collecting like terms • Identify when it is necessary to remove factors to factorise a quadratic expression • Identify when it is necessary to find two linear expressions to factorise a quadratic expression • Factorise a quadratic expression of the form x² + bx + c or where the coefficient of x squared is higher than
‘1’ • Know how to set up an mathematical argument • Work out why two algebraic expressions are equivalent • Create a mathematical argument to show that two algebraic expressions are equivalent • Identify variables in a situation • Distinguish between situations that can be modelled by an expression or a formula • Create an expression or a formula to describe a situation • Add, subtract, multiply, divide and simplify algebraic fractions • Factorise a quadratic expression of the form ax² + bx + c
Simplify an algebraic fraction that involves factorization
KM: Stick on the Maths: Multiplying linear expressions KM: Maths to Infinity: Brackets KM: Maths to Infinity: Quadratics NRICH: Pair Products NRICH: Multiplication Square NRICH: Why 24? Learning review
www.diagnosticquestions.com
Prerequisites Mathematical language Agreed common teaching approaches • Manipulate expressions by collecting like terms • Know that x × x = x2 • Calculate with negative numbers • Know the grid method for multiplying two two-digit numbers • Know the difference between an expression, an equation and a
formula
Inequality Identity Equivalent Equation Formula, Formulae Expression Expand Linear Quadratic Notation The equals symbol ‘=’ and the equivalency symbol ‘≡‘
Pupils should be taught to use the equivalency symbol ‘≡‘ when working with identities. During this unit pupils could construct (and solve) equations in addition to expressions and formulae. NCETM: Algebra NCETM: Departmental workshops: Deriving and Rearranging Formulae NCETM: Glossary Common approaches All students are taught to use the grid method to multiply two linear expressions. They then use the same approach in reverse to factorise a quadratic.
Reasoning opportunities and probing questions Cross curricular links Possible misconceptions
Stage 9: Page 8
• The answer is x² + 10x + c. Show me a possible question. And another. And another … (Factorising a quadratic expression of the form x² + bx + c can be introduced as a reasoning activity: once pupils are fluent at multiplying two linear expressions they can be asked ‘if this is the answer, what is the question?’)
• Convince me that (x + 3)(x + 4) does not equal x² + 7. • What is wrong with this statement? How can you correct it? (x + 3)(x
+ 4) ≡ x2 + 12x + 7. • Jenny thinks that (x – 2)2 = x2 – 4. Do you agree with Jenny? Explain
your answer.
• Once pupils know how to factorise a quadratic expression of the form x² + bx + c they might overcomplicate the simpler case of factorising an expression such as x2 + 2x (≡ (x + 0)(x + 2))
• Many pupils may think that (x + a)2 ≡ x2 + a2 • Some pupils may think that, for example, -2 × -3 = -6 • Some pupils may think that x2 + 12 + 7x is not equivalent to x2 + 7x +
12, and therefore think that they are wrong if the answer is given as x2 + 7x + 12

Stage 9: Page 9
Proportional reasoning Link to Stage 10 12 hours KNOWLEDGE The Big Picture: Ratio and Proportion progression map
• solve problems involving direct and inverse proportion including graphical and algebraic representations • apply the concepts of congruence and similarity, including the relationships between lengths in similar figures • change freely between compound units (e.g. density, pressure) in numerical and algebraic contexts (ALSO 8*) • use compound units such as density and pressure (ALSO 8*) • recognise and interpret graphs that illustrate direct and inverse proportion (NCA) • understand that X is inversely proportional to Y is equivalent to X is proportional to 1/Y (NCA) • interpret equations that describe direct and inverse proportion (NCA) • construct equations that describe direct and inverse proportion (NCA) • interpret the gradient at a point on a curve as the instantaneous rate of change (NCA) • work with general iterative processes (NCA) REMOVE – DOESN’T FIT IN WITH THIS MODULE
SKILLS Suggested Resources
• Know the difference between direct and inverse proportion • Recognise direct (inverse) proportion in a situation • Know the features of a graph that represents a direct (inverse) proportion situation • Know the features of an expression (or formula) that represents a direct (inverse) proportion situation • Understand the connection between the multiplier, the expression and the graph • Form an equation arising from directly/indirectly proportional relationships • Know the meaning of congruent (similar) shapes • Identify congruence (similarity) of shapes in a range of situations • Identify the information required to solve a problem involving similar shapes • Finding missing lengths in similar shapes • Understand why speed, density and pressure are known as compound units • Know the definition of density (pressure, population density, speed) • Solve problems involving density (pressure, speed) • Convert between units of density • Recognise and interpret a graph that illustrates direct proportion • Recognise and interpret a graph that illustrates inverse proportion
Pupils have explored enlargement previously. Use the story of Archimedes and his ‘eureka moment’ when introducing density. Up-to-date information about population densities of counties and cities of the UK, and countries of the world, is easily NCETM: The Bar Model NCETM: Multiplicative reasoning NCETM: Departmental workshops: Proportional Reasoning NCETM: Departmental workshops: Congruence and Similarity NCETM: Glossary Common approaches All pupils are taught to set up a ‘proportion table’ and use it to find the multiplier in situations involving direct proportio
Prerequisites Mathematical language Agreed common teaching approaches • Find a relevant multiplier in a situation involving proportion • Plot the graph of a linear function • Understand the meaning of a compound unit • Convert between units of length, capacity, mass and time
Direct proportion Inverse proportion Multiplier Linear Congruent, Congruence Similar, Similarity Compound unit Density, Population density Pressure Notation Kilograms per metre cubed is written as kg/m3
Reasoning opportunities and probing questions Cross Curricular Possible misconceptions

Stage 9: Page 10

Stage 9: Page 11
Pattern sniffing Link to Stage 10 8 hours
KNOWLEDGE The Big Picture: Algebra progression map
• deduce expressions to calculate the nth term of quadratic sequences
• recognise and use simple geometric progressions (r^n where n is an integer, and r is a rational number > 0 ) • recognise and use simple geometric progressions (r^n where n is an integer, and r is a rational number > 0 or a surd) and other sequences (NCA)
Return to overview
SKILLS Suggested resources • Recognise Fibonacci numbers • Recognise the Fibonacci sequence • Generate Fibonacci type sequences • Find the next three terms in any Fibonacci type sequence • Substitute numbers into formulae including terms in x2 • Generate terms of a quadratic sequence • Identify quadratic sequences • Establish the first and second differences of a quadratic sequence • Find the next three terms in any quadratic sequence • Find the term in x2 for a quadratic sequence • Compare the term in x2 and the whole sequence • Find the nth term of a sequence of the form ax2 + b • Find the nth term of a sequence of the form ax2 + bx + c • Understand the difference between an arithmetic progression, a quadratic sequence and a geometric
progression • Recognise a simple geometric progression • Find the next three terms in a geometric progression • Find a given term in a simple geometric progression
Describe a geometric progression
KM: Forming Fibonacci equations KM: Mathematician of the Month: Fibonacci KM: Leonardo de Pisa KM: Fibonacci solver. Pupils can be challenged to create one of these. KM: Sequence plotting. A grid for plotting nth term against term. KM: Maths to Infinity: Sequences KM: Stick on the Maths: Quadratic sequences NRICH: Fibs Learning review
www.diagnosticquestions.com
Prerequisites Mathematical language Agreed Common Teaching Approaches • Generate a linear sequence from its nth term • Substitute positive numbers into quadratic expressions • Find the nth term for an increasing linear sequence • Find the nth term for an decreasing linear sequence
Term Term-to-term rule Position-to-term rule nth term Generate Linear Quadratic First (second) difference Fibonacci number Fibonacci sequence Notation T(n) is often used to indicate the ‘nth term’
The Fibonacci sequence consists of the Fibonacci numbers (1, 1, 2, 3, 5, …), while a Fibonacci type sequence is any sequence formed by adding the two previous terms to get the next term. NCETM: Departmental workshops: Sequences NCETM: Glossary Common approaches All students should use a spreadsheet to explore aspects of sequences during this unit. For example, this could be using formulae to continue a given sequence, to generate the first few terms of a sequence from an nth term as entered, or to find the missing terms in a Fibonacci sequence as in ‘Fibonacci solver’.
Reasoning opportunities and probing questions Cross Curricular Links Possible misconceptions
Stage 9: Page 12
• A sequence has the first two terms 1, 2, … Show me a way to continue this sequence. And another. And another …
• A sequence has nth term 3n2 + 2n – 4. Jenny writes down the first three terms as 1, 12, 29. Kenny writes down the first three terms as 1, 36, 83. Who do agree with? Why? What mistake has been made?
• A sequence starts with the terms 6, 12, 20, 30, … Find the nth term for this sequence (i.e. n2 + 3n + 2). Look for patterns in how each of the numbers can be constructed. Is there another way to find the nth term (i.e. (n+1)(n+2))? Show that the two nth terms are equivalent.
• Some students may think that it is possible to find an nth term for any sequence. A Fibonacci type sequence would require a recurrence relation instead.
• Some students may think that the second difference (of a quadratic sequence) is equivalent to the coefficient of x2.
• Some students may substitute into ax2 incorrectly, working out (ax)2 instead.
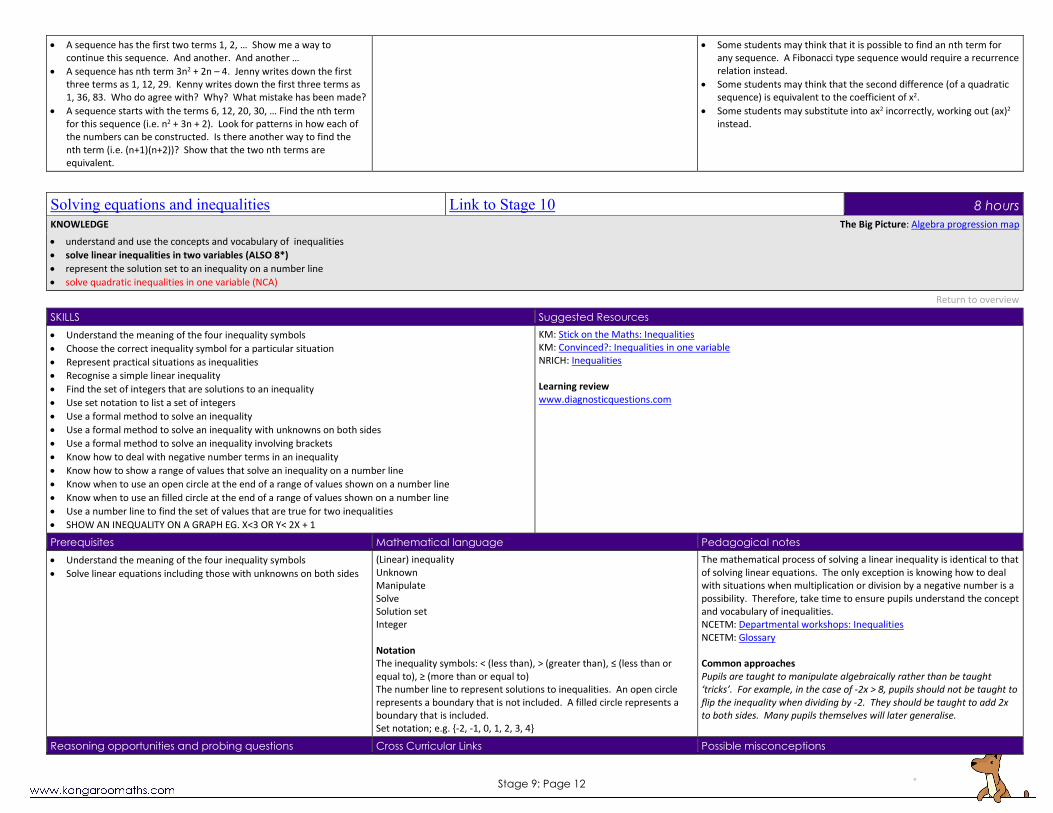
Solving equations and inequalities I Link to Stage 10 8 hours KNOWLEDGE The Big Picture: Algebra progression map
• understand and use the concepts and vocabulary of inequalities • solve linear inequalities in two variables (ALSO 8*) • represent the solution set to an inequality on a number line • solve quadratic inequalities in one variable (NCA)
Return to overview
SKILLS Suggested Resources • Understand the meaning of the four inequality symbols • Choose the correct inequality symbol for a particular situation • Represent practical situations as inequalities • Recognise a simple linear inequality • Find the set of integers that are solutions to an inequality • Use set notation to list a set of integers • Use a formal method to solve an inequality • Use a formal method to solve an inequality with unknowns on both sides • Use a formal method to solve an inequality involving brackets • Know how to deal with negative number terms in an inequality • Know how to show a range of values that solve an inequality on a number line • Know when to use an open circle at the end of a range of values shown on a number line • Know when to use an filled circle at the end of a range of values shown on a number line • Use a number line to find the set of values that are true for two inequalities • SHOW AN INEQUALITY ON A GRAPH EG. X<3 OR Y< 2X + 1
KM: Stick on the Maths: Inequalities KM: Convinced?: Inequalities in one variable NRICH: Inequalities Learning review www.diagnosticquestions.com
Prerequisites Mathematical language Pedagogical notes • Understand the meaning of the four inequality symbols • Solve linear equations including those with unknowns on both sides
(Linear) inequality Unknown Manipulate Solve Solution set Integer Notation The inequality symbols: < (less than), > (greater than), ≤ (less than or equal to), ≥ (more than or equal to) The number line to represent solutions to inequalities. An open circle represents a boundary that is not included. A filled circle represents a boundary that is included. Set notation; e.g. {-2, -1, 0, 1, 2, 3, 4}
The mathematical process of solving a linear inequality is identical to that of solving linear equations. The only exception is knowing how to deal with situations when multiplication or division by a negative number is a possibility. Therefore, take time to ensure pupils understand the concept and vocabulary of inequalities. NCETM: Departmental workshops: Inequalities NCETM: Glossary Common approaches Pupils are taught to manipulate algebraically rather than be taught ‘tricks’. For example, in the case of -2x > 8, pupils should not be taught to flip the inequality when dividing by -2. They should be taught to add 2x to both sides. Many pupils themselves will later generalise.
Reasoning opportunities and probing questions Cross Curricular Links Possible misconceptions
Stage 9: Page 13
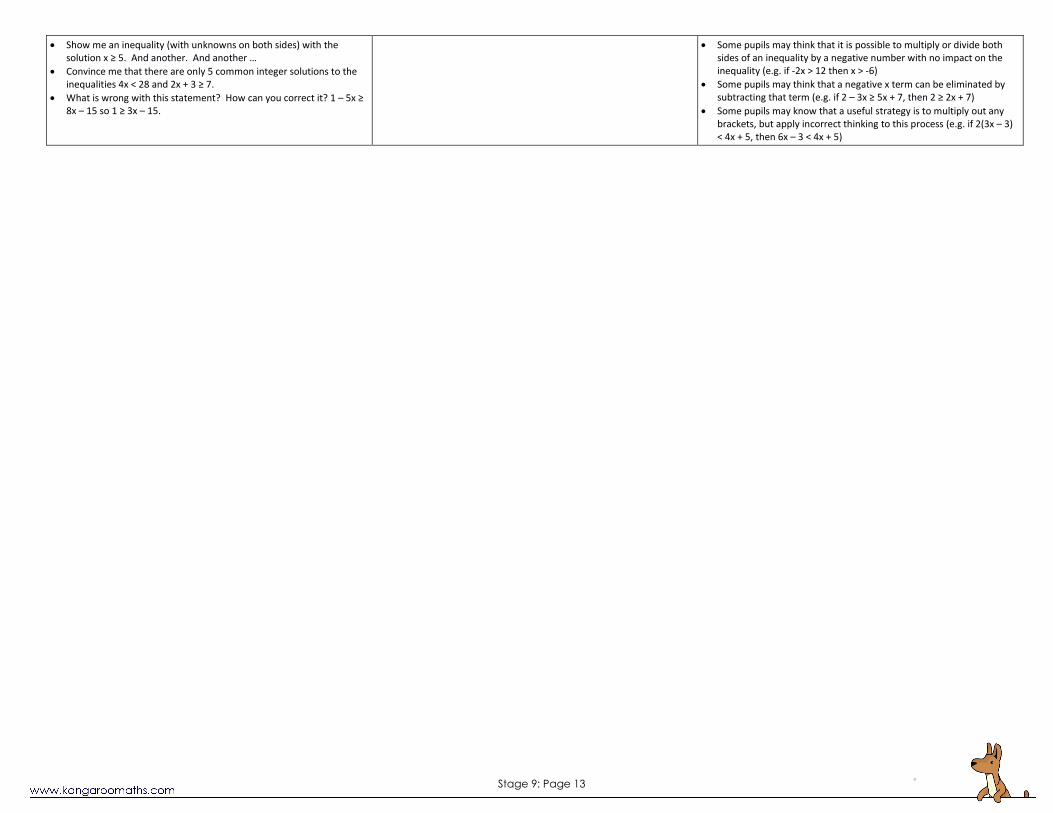
• Show me an inequality (with unknowns on both sides) with the solution x ≥ 5. And another. And another …
• Convince me that there are only 5 common integer solutions to the inequalities 4x < 28 and 2x + 3 ≥ 7.
• What is wrong with this statement? How can you correct it? 1 – 5x ≥ 8x – 15 so 1 ≥ 3x – 15.
• Some pupils may think that it is possible to multiply or divide both sides of an inequality by a negative number with no impact on the inequality (e.g. if -2x > 12 then x > -6)
• Some pupils may think that a negative x term can be eliminated by subtracting that term (e.g. if 2 – 3x ≥ 5x + 7, then 2 ≥ 2x + 7)
• Some pupils may know that a useful strategy is to multiply out any brackets, but apply incorrect thinking to this process (e.g. if 2(3x – 3) < 4x + 5, then 6x – 3 < 4x + 5)

Stage 9: Page 14
Calculating space Link to Stage 10 16 hours KNOWLDEGE The Big Picture: Measurement and mensuration progression map
• calculate arc lengths, angles and areas of sectors of circles • calculate surface area of right prisms (including cylinders) • calculate exactly with multiples of π • know the formulae for: Pythagoras’ theorem, a² + b² = c², and apply it to find lengths in right-angled triangles in two dimensional figures (ALSO 8*) • know the formulae for: Pythagoras’ theorem, a² + b² = c², and apply it to find lengths in right-angled triangles and, where possible, general triangles and in three dimensional figures (NCA) • calculate surface area and volume of spheres, pyramids, cones and composite solids • know the trigonometric ratios, sinθ = opposite/hypotenuse, cosθ = adjacent/hypotenuse, tanθ = opposite/adjacent (NEW) • apply them to find angles and lengths in right-angled triangles and, where possible, general triangles in three dimensional figures (NCA) • apply it to find angles and lengths in right-angled triangles in two dimensional figures (NEW)
Return to overview
SKILLS Suggested Resources • Know the vocabulary of circles • Know how to find arc length • Calculate the arc length of a sector when radius is given • Know how to find the area of a sector • Calculate the area of a sector when radius is given • Calculate the angle of a sector when the arc length and radius are known • Know how to find the surface area of a right prism (cylinder) • Calculate the surface area of a right prism (cylinder) • Calculate exactly with multiples of π • Know Pythagoras’ theorem and when to apply it • Identify the hypotenuse in a right-angled triangle • Calculate the hypotenuse of a right-angled triangle using Pythagoras’ theorem • Calculate one of the shorter sides in a right-angled triangle using Pythagoras’ theorem • Find the surface area of a sphere (cone, pyramid) • Identify how to find the surface area and volume of a composite solid • Solve practical problems involving the volume and surface area of solids • Find the volume of a sphere (cone, pyramid)
KM: The language of circles KM: One old Greek (geometrical derivation of Pythagoras’ theorem. This is explored further in the next unit) KM: Stick on the Maths: Pythagoras’ Theorem KM: Stick on the Maths: Right Prisms NRICH: Curvy Areas NRICH: Changing Areas, Changing Volumes Learning review
www.diagnosticquestions.com
Prerequisites Mathematical language Agreed Common Teaching Approaches • Know and use the number π • Know and use the formula for area and circumference of
a circle • Know how to use formulae to find the area of rectangles,
parallelograms, triangles and trapezia • Know how to find the area of compound shapes
Circle, Pi Radius, diameter, chord, circumference, arc, tangent, sector, segment (Right) prism, cylinder Cross-section Hypotenuse Pythagoras’ theorem Notation π Abbreviations of units in the metric system: km, m, cm, mm, mm2, cm2, m2, km2, mm3, cm3, km3
This unit builds on the area and circle work form Stages 7 and 8. Pupils will need to be reminded of the key formula, in particular the importance of the perpendicular height when calculating areas and the correct use of πr2. Note: some pupils may only find the area of the three ‘distinct’ faces when finding surface area. Pupils must experience right-angled triangles in different orientations to appreciate the hypotenuse is always opposite the right angle. NCETM: Glossary Common approaches Pupils visualize and write down the shapes of all the faces of a prism before calculating the surface area. Every classroom has a set of area posters on the wall. Pythagoras’ theorem is stated as ‘the square of the hypotenuse is equal to the sum of the squares of the other two sides’ not just a² + b² = c².
Reasoning opportunities and probing questions Cross Curricular Links Possible misconceptions
Stage 9: Page 15
• Show me a sector with area 25π. And another. And another …
• Always/ Sometimes/ Never: The value of the volume of a prism is less than the value of the surface area of a prism.
• Always/ Sometimes/ Never: If a² + b² = c², a triangle with sides a, b and c is right angled.
• Kenny thinks it is possible to use Pythagoras’ theorem to find the height of isosceles triangles that are not right- angled. Do you agree with Kenny? Explain your answer.
• Convince me the hypotenuse can be represented as a horizontal line.
• Some pupils will work out (π × r)2 when finding the area of a circle • Some pupils may use the sloping height when finding cross-sectional areas that are parallelograms,
triangles or trapezia • Some pupils may confuse the concepts of surface area and volume • Some pupils may use Pythagoras’ theorem as though the missing side is always the hypotenuse • Some pupils may not include the lengths of the radii when calculating the perimeter of an arc
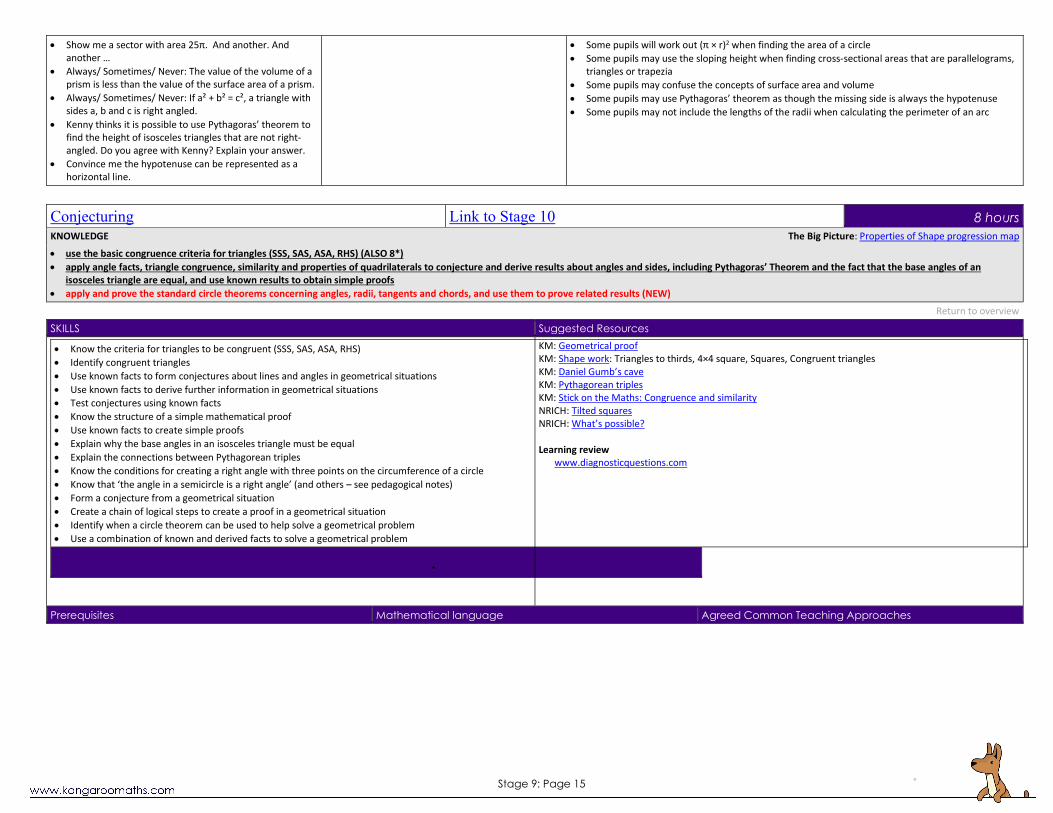
Conjecturing Link to Stage 10 8 hours KNOWLEDGE The Big Picture: Properties of Shape progression map
• use the basic congruence criteria for triangles (SSS, SAS, ASA, RHS) (ALSO 8*) • apply angle facts, triangle congruence, similarity and properties of quadrilaterals to conjecture and derive results about angles and sides, including Pythagoras’ Theorem and the fact that the base angles of an
isosceles triangle are equal, and use known results to obtain simple proofs • apply and prove the standard circle theorems concerning angles, radii, tangents and chords, and use them to prove related results (NEW)
Return to overview
SKILLS Suggested Resources
• Know the criteria for triangles to be congruent (SSS, SAS, ASA, RHS) • Identify congruent triangles • Use known facts to form conjectures about lines and angles in geometrical situations • Use known facts to derive further information in geometrical situations • Test conjectures using known facts • Know the structure of a simple mathematical proof • Use known facts to create simple proofs • Explain why the base angles in an isosceles triangle must be equal • Explain the connections between Pythagorean triples • Know the conditions for creating a right angle with three points on the circumference of a circle • Know that ‘the angle in a semicircle is a right angle’ (and others – see pedagogical notes) • Form a conjecture from a geometrical situation • Create a chain of logical steps to create a proof in a geometrical situation • Identify when a circle theorem can be used to help solve a geometrical problem • Use a combination of known and derived facts to solve a geometrical problem
KM: Geometrical proof KM: Shape work: Triangles to thirds, 4×4 square, Squares, Congruent triangles KM: Daniel Gumb’s cave KM: Pythagorean triples KM: Stick on the Maths: Congruence and similarity NRICH: Tilted squares NRICH: What’s possible? Learning review
www.diagnosticquestions.com
Prerequisites Mathematical language Agreed Common Teaching Approaches

Stage 9: Page 16
• Know angle facts including angles at a point, on a line and in a triangle
• Know angle facts involving parallel lines and vertically opposite angles • Know the properties of special quadrilaterals • Know Pythagoras’ theorem
Congruent, congruence Similar (shapes), similarity Hypotenuse Conjecture Derive Prove, proof Counterexample Notation Notation for equal lengths and parallel lines SSS, SAS, ASA, RHS The ‘implies that’ symbol (⇒)
‘Known facts’ should include angle facts, triangle congruence, similarity and properties of quadrilaterals NCETM: Glossary Common approaches All students are asked to draw 1, 2, 3 and 4 points on the circumference of a set of circles. In each case, they join each point to every other point and count the number of regions the circle has been divided into. Using the results 1, 2, 4 and 8 they form a conjecture that the sequence is the powers of 2. They test this conjecture for the case of 5 points and find the circle is divided into 16 regions as expected. Is this enough to be convinced? It turns out that it should not be, as 6 points yields either 30 or 31 regions depending on how the points are arranged. This example is used to emphasise the importance and power of mathematical proof. See KM: Geometrical proof
Reasoning opportunities and probing questions Cross Curricular Links Possible misconceptions • Show me a pair of congruent triangles. And another. And another • Show me a pair of similar triangles. And another. And another • What is the same and what is different: Proof, Conjecture,
Justification, Test? • Convince me the base angles of an isosceles triangle are equal. • Show me a Pythagorean Triple. And another. And another. • Convince me a triangle with sides 3, 4, 5 is right-angled but a triangle
with sides 4, 5, 6 is not right-angled.
• Some pupils think AAA is a valid criterion for congruent triangles. • Some pupils try and prove a geometrical situation using facts that
‘look OK’, for example, ‘angle ABC looks like a right angle’. • Some pupils do not appreciate that diagrams are often drawn to
scale. • Some pupils think that all triangles with sides that are consecutive
numbers are right angled.
Algebraic proficiency Link to Stage 10 16 hours KNOWLEDGE The Big Picture: Algebra progression map
• use the form y = mx + c to identify perpendicular lines (NEW) • find the equation of the line through two given points, or through one point with a given gradient • recognise, sketch and interpret graphs of quadratic functions • recognise, sketch and interpret graphs of simple cubic functions and the reciprocal function y = 1/x with x ≠ 0 • plot and interpret graphs (including reciprocal graphs) and graphs of non-standard functions in real contexts, to find approximate solutions to problems such as simple kinematic problems involving distance, speed
and acceleration • calculate or estimate gradients of graphs (including quadratic and other non-linear graphs), and interpret results in cases such as distance-time graphs, velocity-time graphs and graphs in financial contexts • identify and interpret roots, intercepts, turning points of quadratic functions graphically (NEW) • deduce roots of quadratic functions algebraically (NEW) • plot and interpret graphs (including exponential graphs) and graphs of non-standard functions in real contexts, to find approximate solutions to problems such as simple kinematic problems involving distance, speed and
acceleration (NCA) • recognise and use the equation of a circle with centre at the origin (NCA) • find the equation of a tangent to a circle at a given point (NCA)
Return to overview
SKILLS Suggested Resources
Stage 9: Page 17
• Use the form y = mx + c to identify parallel lines • Rearrange an equation into the form y = mx + c • Find the equation of a line through one point with a given gradient, and through two given points • Interpret the gradient of a straight line graph as a rate of change • Plot, recognise and interpret graphs of quadratic (cubic, reciprocal) functions • Sketch graphs of quadratic (cubic, reciprocal) functions • Plot and interpret graphs of non-standard functions in real contexts • Find approximate solutions to kinematic problems involving distance, speed and acceleration • Recognise (plot, interpret) graphs of exponential functions • Recognise that the gradient of a curve is not constant • Know that the gradient of a curve is the gradient of the tangent at that point • Calculate (estimate) the gradient at a point on a curve
Interpret the gradient at a point on a curve as the instantaneous rate of change
KM: Screenshot challenge KM: Stick on the Maths: Quadratic and cubic functions KM: Stick on the Maths: Algebraic Graphs NRICH: Diamond Collector NRICH: Fill me up NRICH: What’s that graph? NRICH: Speed-time at the Olympics NRICH: Exploring Quadratic Mappings NRICH: Minus One Two Three Learning review
www.diagnosticquestions.com
Prerequisites Mathematical language Agreed Common Teaching Approaches • Plot straight-line graphs • Interpret gradients and intercepts of linear functions
graphically and algebraically • Recognise, sketch and interpret graphs of linear
functions • Recognise graphs of simple quadratic functions • Plot and interpret graphs of kinematic problems
involving distance and speed
Function, equation Linear, non-linear Quadratic, cubic, reciprocal Parabola, Asymptote Gradient, y-intercept, x-intercept, root Rate of change Sketch, plot Kinematic Speed, distance, time Acceleration, deceleration Notation y = mx + c
This unit builds on the graphs of linear functions and simple quadratic functions work from Stage 8. Where possible, students should be encouraged to plot linear graphs efficiently by using knowledge of the y-intercept and the gradient. NCETM: Glossary Common approaches ‘Monter’ and ‘commencer’ are shared as the reason for ‘m’ and ‘c’ in y = mx + c and links to y = ax + b Students plot points with a ‘x’ and not ‘‘ Students draw graphs in pencil All student use dynamic graphing software to explore graphs
Reasoning opportunities and probing questions Cross Curricular Links Possible misconceptions • Convince me the lines y = 3 + 2x, y – 2x = 7, 2x + 6 = y
and 8 + y – 2x = 0 are parallel to each other. • What is the same and what is different: y = x, y = x2, y =
x3 and y=1/x ? • Show me a sketch of a quadratic (cubic, reciprocal)
graph. And another. And another … • Sketch a distance/time graph of your journey to school.
What is the same and what is different with the graph of a classmate?
• Some pupils do not rearrange the equation of a straight line to find the gradient of a straight line. For example, they think that the line y – 2x = 6 has a gradient of -2.
• Some pupils may think that gradient = (change in x) / (change in y) when trying to equation of a line through two given points.
• Some pupils may incorrectly square negative values of x when plotting graphs of quadratic functions.
• Some pupils think that the horizontal section of a distance time graph means an object is travelling at constant speed.
• Some pupils think that a section of a distance time graph with negative gradient means an object is travelling backwards or downhill.
Solving equations and inequalities II Link to Stage 10 12 hours KNOWLEDGE The Big Picture: Algebra progression map
• solve, in simple cases, two linear simultaneous equations in two variables algebraically (ALSO 8*) • find approximate solutions to simultaneous equations using a graph • represent the solution set to an inequality using set notation and a graph • solve quadratic equations algebraically by factorising (NEW)
Return to overview
SKILLS Suggested Resources

Stage 9: Page 18
• Understand that there are an infinite number of solutions to the equation ax + by = c (a ≠ 0, b ≠ 0) • Understand the concept of simultaneous equations • Find approximate solutions to simultaneous equations using a graph • Understand the concept of solving simultaneous equations by elimination* • Target a variable to eliminate • Decide if multiplication of one equation is required • Decide whether addition or subtraction of equations is required • Add or subtract pairs of equations to eliminate a variable • Find the value of one variable in a pair of simple simultaneous equations • Find the value of the second variable in a pair of simple simultaneous equations • Solve two linear simultaneous equations in two variables in very simple cases (no multiplication required) • Solve two linear simultaneous equations in two variables in simple cases (multiplication of one equation
only required) • Derive and solve two simultaneous equations • Interpret the solution to a pair of simultaneous equations • Understand the use of a graph to represent an inequality in two variables • State the (simple) inequality represented by a shaded region on a graph • Know when to use a dotted line as a boundary for an inequality on a graph • Know when to use a solid line as a boundary for an inequality on a graph
KM: Stick on the Maths ALG2: Simultaneous linear equations NRICH: What’s it worth? NRICH: Warmsnug Double Glazing NRICH: Arithmagons Learning review
www.diagnosticquestions.com
Prerequisites Mathematical language Agreed Common Teaching Approaches • Solve linear equations • Substitute numbers into formulae • Plot graphs of functions of the form y = mx + c, x ± y = c and ax ± by =
c) • Manipulate expressions by multiplying by a single term
Equation Simultaneous equation Variable Manipulate Eliminate Solve Derive Interpret
Pupils will be expected to solve simultaneous equations in more complex cases in Stage 10. This includes involving multiplications of both equations to enable elimination, cases where rearrangement is required first, and the method of substitution. NCETM: Glossary Common approaches Pupils are taught to label the equations (1) and (2), and label the subsequent equation (3) Teachers use graphs (i.e. dynamic software) to demonstrate solutions to simultaneous equations at every opportunity
Reasoning opportunities and probing questions Cross Curricular Links Possible misconceptions • Show me a solution to the equation 5a + b = 32. And another, and
another … • Show me a pair of simultaneous equations with the solution x = 2 and
y = -5. And another, and another … • Kenny and Jenny are solving the simultaneous equations x + 4y = 7
and x – 2y = 1. Kenny thinks the equations should be added. Jenny thinks they should be subtracted. Who do you agree with? Explain why.
• Some pupils may think that addition of equations is required when both equations involve a subtraction
• Some pupils may not multiply all coefficients, or the constant, when multiplying an equation
• Some pupils may think that it is always right to eliminate the first variable
• Some pupils may struggle to deal with negative numbers correctly when adding or subtracting the equations
Understanding risk Link to Stage 10 8 hours KNOWLEDGE The Big Picture: Probability progression map
• calculate the probability of independent and dependent combined events, including using tree diagrams and other representations, and know the underlying assumptions (ALSO 8*) • enumerate sets and combinations of sets systematically, using tree diagrams (ALSO 8*) • understand that empirical unbiased samples tend towards theoretical probability distributions, with increasing sample size • calculate and interpret conditional probabilities through representation using expected frequencies with two-way tables, tree diagrams and Venn diagrams (NEW)
Return to overview
Stage 9: Page 19
SKILLS Suggested Resources • List outcomes of combined events using a tree diagram • Label a tree diagram with probabilities • Label a tree diagram with probabilities when events are dependent • Know when to add two or more probabilities • Know when to multiply two or more probabilities • Use a tree diagram to calculate probabilities of independent combined events • Use a tree diagram to calculate probabilities of dependent combined events • Understand that relative frequency tends towards theoretical probability as sample size increases
Calculate conditional probabilities using different representations
KM: Stick on the Maths: Tree diagrams KM: Stick on the Maths: Relative frequency KM: The drawing pin experiment Learning review
www.diagnosticquestions.com
Prerequisites Mathematical language Agreed Common Teaching Approaches • Add fractions (decimals) • Multiply fractions (decimals) • Convert between fractions, decimals and percentages • Use frequency trees to record outcomes of probability experiments • Use experimental and theoretical probability to calculate expected
outcomes
Outcome, equally likely outcomes Event, independent event, dependent event Tree diagrams Theoretical probability Experimental probability Random Bias, unbiased, fair Relative frequency Enumerate Set Notation P(A) for the probability of event A Probabilities are expressed as fractions, decimals or percentage. They should not be expressed as ratios (which represent odds) or as words
Tree diagrams can be introduced as simply an alternative way of listing all outcomes for multiple events. For example, if two coins are flipped, the possible outcomes can be listed (a) systematically, (b) in a two-way table, or (c) in a tree diagram. However, the tree diagram has the advantage that it can be extended to more than two events (e.g. three coins are flipped). NCETM: Glossary Common approaches All students carry out the drawing pin experiment Students are taught not to simply fractions when finding probabilities of combined events using a tree diagram (so that a simple check can be made that the probabilities sum to 1)
Reasoning opportunities and probing questions Cross Curricular Links Possible misconceptions • Show me an example of a probability problem that involves adding
(multiplying) probabilities • Convince me that there are eight different outcomes when three
coins are flipped together • Always / Sometimes / Never: increasing the number of times an
experiment is carried out gives an estimated probability that is closer to the theoretical probability
• When constructing a tree diagram for a given situation, some students may struggle to distinguish between how events, and outcomes of those events, are represented
• Some students may muddle the conditions for adding and multiplying probabilities
• Some students may add the denominators when adding fractions
Stage 9: Page 20
Presentation of data Link to Stage 10 8 hours KNOWLEDGE The Big Picture: Statistics progression map
• interpret and construct tables, charts and diagrams, including tables and line graphs for time series data and know their appropriate use • construct and interpret diagrams for grouped discrete data and continuous data, i.e. cumulative frequency graphs, and know their appropriate use • interpret, analyse and compare the distributions of data sets from univariate empirical distributions through appropriate graphical representation involving discrete, continuous and grouped data, including box plots • interpret, analyse and compare the distributions of data sets from univariate empirical distributions through appropriate measures of central tendency including quartiles and inter-quartile range • construct and interpret diagrams for grouped discrete data and continuous data, i.e. histograms with equal and unequal class intervals and know their appropriate use (NCA) • infer properties of populations or distributions from a sample, whilst knowing the limitations of sampling (NCA)
Return to overview
SKILLS Suggested Resources
• Construct and interpret graphs of time series • Construct and interpret compound bar charts • Interpret a wider range of non-standard graphs and charts • Understand that correlation does not indicate causation • Interpret a scatter diagram using understanding of correlation • Construct a line of best fit on a scatter diagram • Use a line of best fit to estimate values • Know when it is appropriate to use a line of best fit to estimate values • Know the meaning of the lower quartile and upper quartile • Find the quartiles for discrete data sets • Calculate and interpret the interquartile range • Construct and interpret a box plot for discrete data • Use box plots to compare distributions • Understand the meaning of cumulative frequency • Complete a cumulative frequency table and curve • Use a cumulative frequency curve to estimate the quartiles and properties for grouped continuous data sets
KM: Stick on the Maths HD2: Frequency polygons and scatter diagrams Learning review
www.diagnosticquestions.com
Prerequisites Mathematical language Agreed Common Teaching Approaches • Know the meaning of discrete and continuous data • Interpret and construct frequency tables • Construct and interpret pictograms, bar charts, pie charts, tables,
vertical line charts, histograms (equal class widths) and scatter diagrams
Categorical data, Discrete data Continuous data, Grouped data Axis, axes Time series Compound bar chart Scatter graph (scatter diagram, scattergram, scatter plot) Bivariate data (Linear) Correlation Positive correlation, Negative correlation Line of best fit Interpolate Extrapolate Trend Notation Correct use of inequality symbols when labeling groups in a frequency table
Lines of best fit on scatter diagrams are first introduced in Stage 9, although pupils may well have encountered both lines and curves of best fit in science by this time. William Playfair, a Scottish engineer and economist, introduced the line graph for time series data in 1786. NCETM: Glossary Common approaches As a way of recording their thinking, all students construct the appropriate horizontal and vertical line when using a line of best fit to make estimates. In simple cases, students plot the ‘mean of x’ against the ‘mean of y’ to help locate a line of best fit.
Reasoning opportunities and probing questions Cross Curricular Links Possible misconceptions • Show me a compound bar chart. And another. And another. • What’s the same and what’s different: correlation, causation? • What’s the same and what’s different: scatter diagram, time series,
line graph, compound bar chart? • Convince me how to construct a line of best fit. • Always/Sometimes/Never: A line of best fit passes through the origin
• Some pupils may think that correlation implies causation • Some pupils may think that a line of best fit always has to pass
through the origin • Some pupils may misuse the inequality symbols when working with a
grouped frequency table

Stage 9: Page 21