Embed Size (px)
Citation preview
1
Is a theorem that gives the relationship between the sides of a right - angled triangle.
MATHEMATICS
YEAR 10
TEXTBOOK

2
MINISTRY OF EDUCATION
MATHEMATICS TEXTBOOK
YEAR 10
CURRICULUM DEVELOPMENT UNIT FIJI, 2015
3
The Ministry of Education owns the copyright to this 10 Mathematics Textbook.
Schools may reproduce this in part or in full for classroom purposes only. Acknowledgement
of the CDU Section of the Ministry of Education copyright must be included on any reproductions.
Any other use of these Textbook must be referred to the Permanent Secretary for Education through
the Director Curriculum Advisory Services.
Issued free to schools by the Ministry of Education.
First Edition 2015
© Ministry of Education, Fiji, 2015
Published by
Curriculum Development Unit
Ministry of Education
Waisomo House
Private Mail bag
Suva
Fiji
Tel: (679) 3313050
4
PREFACE
The revised Year 10 Syllabus has been presented to Year 10 teachers in all secondary schools
throughout the nation. The development of this Textbook was entirely based on this revised Year
10 Syllabus. It has a total of six strands: Functions, Algebra, Numbers, Geometry, Measurement
and Chance and Data and these are further divided into Sub - Strands.
The contents of this book have been simplified so that it can be used by all students of different
capabilities.
It is confidently believed that it will furnish Year 10 students with the necessary number and
variety of exercises essential to successful instructions in mathematics.
The book‟s step – by – step instructions in the methods and examples will make it suitable for
both direct one – on - one tutoring and as well as regular classroom use. Moreover, there are a
spectrum of exercises and illustrations that significantly enrich students understanding of
mathematical concepts.
All examples that have been introduced can even be attempted by an average pupil without
assistance. They have been carefully graded to suit the slow learners as well while there are some
problems that are provided for advance learners.

5
ACKNOWLEDGEMENT
Throughout the process in writing this textbook, a number of people have sacrificed their
valuable time to assist the Ministry of Education. They must be acknowledged for their active
participation and without their insights, guidance and continued support, this book may not have
been possible. The Ministry of Education, therefore, hereby acknowledges the following people
for their valuable contributions to this book:
Mr Seru Ramakita Dilkusha Methodist High School
Ms Amrita Devi Marist Brothers High School
Mrs Amelia Siga Higher Education Commission
Mr Timoci Vosailagi DAV Girls College
Mrs Evia Turaganivalu Suva Grammar School
Mrs Asenaca Tuinabua Suva Grammar School
Mr Emosi Lutunaika Curriculum Development Unit

6
TABLE OF CONTENTS 1.0 FUNCTIONS ................................................................................................................................ 8
2.0 ALGEBRA ................................................................................................................................. 36
3.0 NUMBERS ................................................................................................................................. 58
4.0 GEOMETRY .............................................................................................................................. 73
1.1 Linear and Quadratic Function……………………………………..…8
1.2 Graphing Equations and Inequations……………………………. 19
2.1Factorisation and Simplification of Algebraic Expressions………………… 37
2.2 Solving Equations and Inequations……………………………………..………….. 43
2.3 Formula Manipulation…………………………………………………..………….………54
3.1 Expressing Numbers in Indices For………………………………………59
3.2 Index Rules/Laws…………………………………………………………………61
4.1 Square and Square Roots…………………………… ………….74
4.2 Pythagoras Theorem……………………………………….……….76
4.3 Trigonometric Functions…………………………….……………83
4.4 Constructions…………………………………….………………….107
4.5 Intersecting Chord Theorem……………………… …………128

7
5.0 MEASUREMENT……………………………………………………………………………………………………………………..136
6.0 CHANCE AND DATA………………………………………………………………………………………………………………..154
5.1 Money………………………………………………..……………………….137
6.1 Data Representation……………………………………….…..155
6.2 Measures of Central Tendency……………………….…..162
6.3 Measures of Dispersion………………………………….…..168
6.4 Probability Experiments…………………………….…….….175
6.5 Events of Probability…………………………….………….… 183
6.6 Probability Formula……………………………………….…...190
6.7 Properties of Probability……………………….……..….…193
8
1.1 Linear and Quadratic Functions
LEARNING OUTCOMES
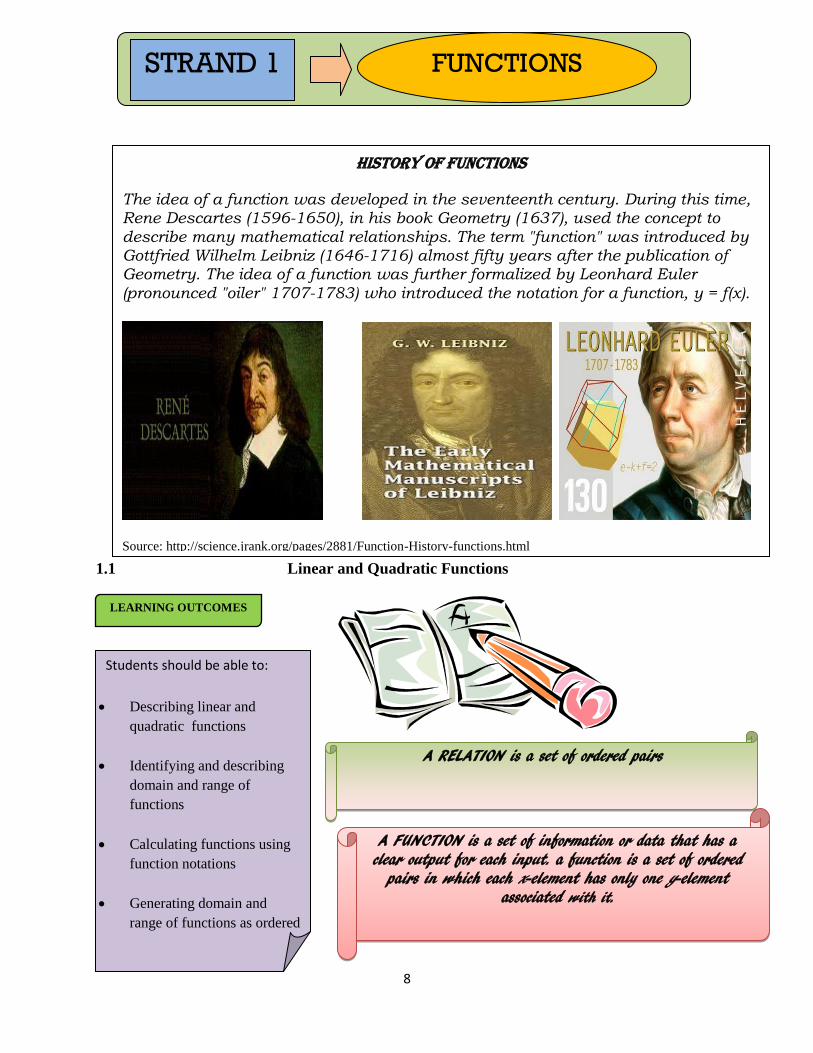
A FUNCTION is a set of information or data that has a clear output for each input. a function is a set of ordered
pairs in which each x-element has only one y-element associated with it.
A RELATION is a set of ordered pairs
Students should be able to:
Describing linear and
quadratic functions
Identifying and describing
domain and range of
functions
Calculating functions using
function notations
Generating domain and
range of functions as ordered
pairs, and plot these on the
Cartesian Plane to obtain the
graph of the function
STRAND 1 FUNCTIONS
History of Functions
The idea of a function was developed in the seventeenth century. During this time, Rene Descartes (1596-1650), in his book Geometry (1637), used the concept to describe many mathematical relationships. The term "function" was introduced by Gottfried Wilhelm Leibniz (1646-1716) almost fifty years after the publication of Geometry. The idea of a function was further formalized by Leonhard Euler
(pronounced "oiler" 1707-1783) who introduced the notation for a function, y = f(x).
Source: http://science.jrank.org/pages/2881/Function-History-functions.html

9
Types Of Function
I. Linear Function
Machine: 1 Machine: 2 Machine: 3
Rule: Rule: Rule:
INPUT OUTPUT
1 3
2 4
3 5
Example 1.1
For the linear function, 2 xy where x { -2, -1, 0, 1, 2} list the function as:
(i) a set of ordered pairs
(ii) an arrow diagram
(iii) a Cartesian graph
(iv) a table of values
ACTIVITY
Three number machines are given. For each number machine, state the rule being followed by the machines.
If x is to represent the input and y is to
represent the output, the common rule
derived from the three number
machines in terms of x and y would
be: 2 xy
LINEAR FUNCTION: A function
whereby the degree or index on the
input variable is 1 e.g. 2 xy has
the degree 1 i.e. the index on x the
input variable is 1

10
Answer
Linear function x value Substitute x y value
y = x + 2 x = -2 y = (-2) + 2 y = 0
x = -1 y = (-1) + 2 y = 1
x = 0 y = (0) + 2 y = 2
x = 1 y = (1) + 2 y = 3
x = 2 y = (2) + 2 y = 4
(i) Set of ordered pairs (ii) Arrow diagram
R={(-2,0)(-1,1)(0,2)(1,3)(2,4)}
(iii) Cartesian graph
(iv) Table of values
x -2 -1 0 1 2
y 0 1 2 3 4
II. Quadratic Function
x
-2
-1
0
1
2
y
0
1
2
3
4
ACTIVITY
Three number machines are given. For each number machine, state the rule being followed by the machines.

11
Machine: 1 Machine: 2 Machine: 3
Rule: Rule: Rule:
INPUT OUTPUT
1 1
2 4
3 9
Example 1.2
For the quadratic function, 2xy where x {-2, -1, 0, 1, 2} list the function as:
(i) a set of ordered pairs
(ii) an arrow diagram
(iii) a Cartesian graph
(iv) a table of values
If x is to represent the input and y is to
represent the output, the common rule
derived from the three number machines
in terms of x and y would be: 2xy
QUADRATIC FUNCTION: A
function whereby the degree,
power or index on the input
variable x is equal to 2 e.g. 2xy has the degree of 2 i.e. the
index on x the input variable is 2
12
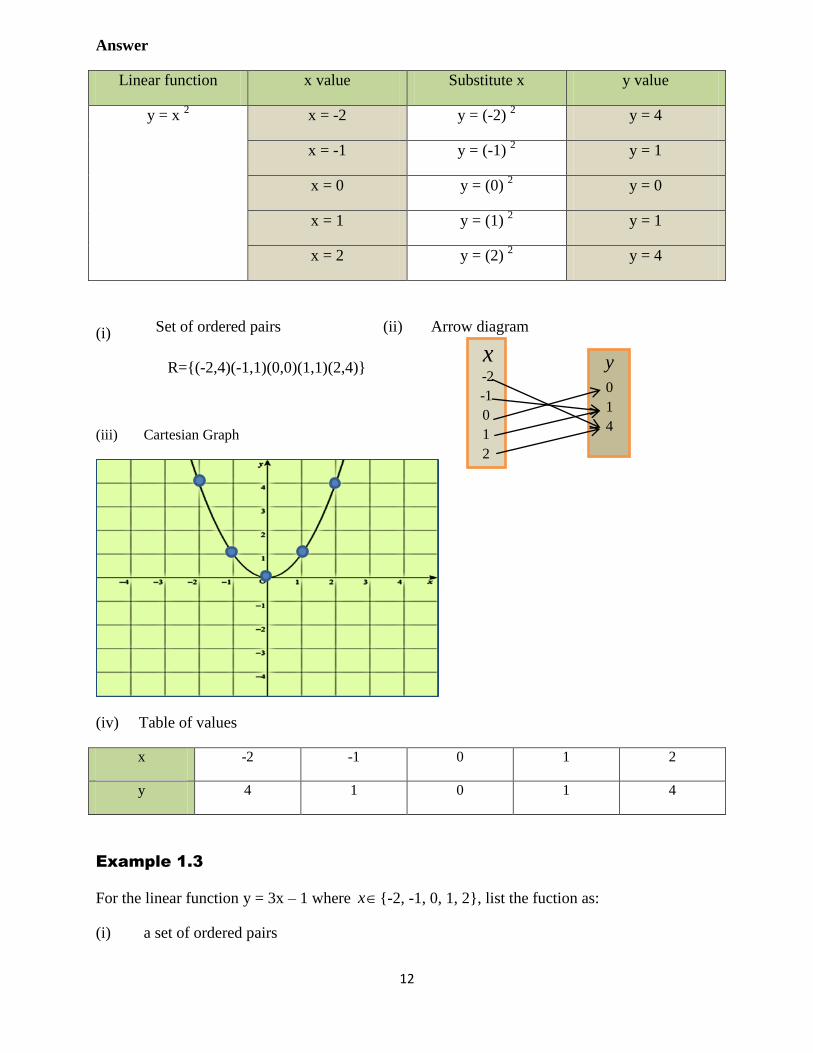
Answer
Linear function x value Substitute x y value
y = x 2
x = -2 y = (-2) 2
y = 4
x = -1 y = (-1) 2 y = 1
x = 0 y = (0) 2 y = 0
x = 1 y = (1) 2 y = 1
x = 2 y = (2) 2 y = 4
(i) Set of ordered pairs (ii) Arrow diagram
R={(-2,4)(-1,1)(0,0)(1,1)(2,4)}
(iii) Cartesian Graph
(iv) Table of values
x -2 -1 0 1 2
y 4 1 0 1 4
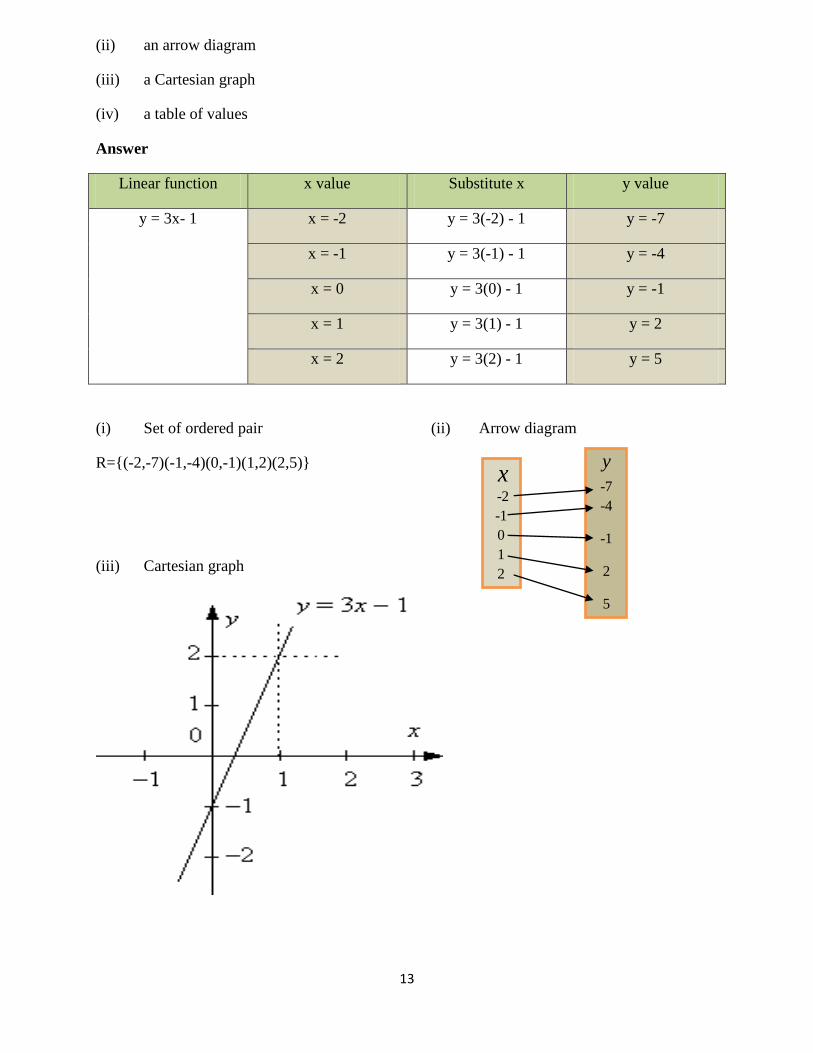
Example 1.3
For the linear function y = 3x – 1 where x {-2, -1, 0, 1, 2}, list the fuction as:
(i) a set of ordered pairs
x -2
-1
0
1
2
y
0
1
4
13
(ii) an arrow diagram
(iii) a Cartesian graph
(iv) a table of values
Answer
Linear function x value Substitute x y value
y = 3x- 1
x = -2 y = 3(-2) - 1 y = -7
x = -1 y = 3(-1) - 1 y = -4
x = 0 y = 3(0) - 1 y = -1
x = 1 y = 3(1) - 1 y = 2
x = 2 y = 3(2) - 1 y = 5
(i) Set of ordered pair (ii) Arrow diagram
R={(-2,-7)(-1,-4)(0,-1)(1,2)(2,5)}
(iii) Cartesian graph
x -2
-1
0
1
2
y
-7
-4
-1
2
5

14
(iv) Table of values
x -2 -1 0 1 2
y -7 -4 -1 2 5
1. For the function 1 xy where x {-2, -1, 1, 0, 1, 2} list the function as:
i. A set of ordered pairs
ii. An arrow diagram
iii. A Cartesian graph
2. For the function 22xy where Rx list the function as:
i. A set of ordered pairs
ii. An arrow diagram
iii. A Cartesian graph
3. For the function 12 xy where x {-5,-3,-1, 0, 1, 3, 5} list the function as:
i. A set of ordered pairs
ii. An arrow diagram
iii. A Cartesian graph
4. For the function 22xy where x {-4, -2, 0, 2, 4} list the function as:
i. A set of ordered pairs
ii. An arrow diagram
iii. A Cartesian graph
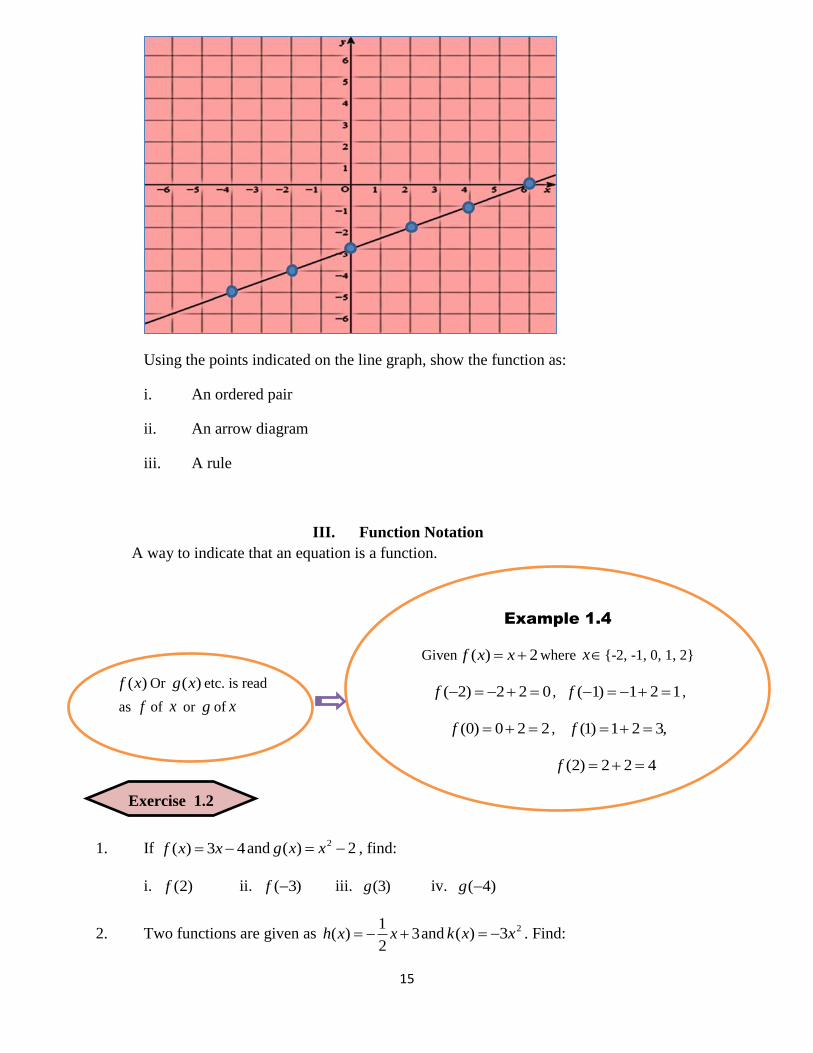
5. The diagram shows a function given as a Cartesian graph.
Exercise 1.1
15
Using the points indicated on the line graph, show the function as:
i. An ordered pair
ii. An arrow diagram
iii. A rule
III. Function Notation
A way to indicate that an equation is a function.
1. If 43)( xxf and 2)( 2 xxg , find:
i. )2(f ii. )3(f iii. )3(g iv. )4(g
2. Two functions are given as 32
1)( xxh and 23)( xxk . Find:
)(xf Or )(xg etc. is read
as f of x or g of x
Example 1.4
Given 2)( xxf where x {-2, -1, 0, 1, 2}
022)2( f , 121)1( f ,
220)0( f , ,321)1( f
422)2( f
Exercise 1.2

16
i. )3(k ii. )4(h iii. )6(k iv. )8(h
3. 4)( xxf and3
4)(
xxg . Evaluate
i. )2(f ii. )3
2(f iii. )13(g iv. )14(g
v. For what value of x is 5)( xf
vi. For what value of x is 3)( xg
IV. Domain )( xD And Range )( yR
Example 1.5
Give the domain and range for the following function.
(i) R= {(-2,0)(-1, 1)(0,2)(1,3)(2,4)}
Domain, )( xD {-2, -1, 0, 1, 2}
Range, )( yR {0, 1, 2, 3, 4}
(ii)
Domain, )( xD {-2, -1, 0, 1, 2}
Range, )( yR {0, 1, 2, 3, 4}
-2
-1
0
1
2
0
1
2
3
4
Domain )( xD : The set of Input Values or set of
x values that can be put in an equation.
Range )( yR : The set of output values or the set of
possible y values.

17
(iii) 4)( xxf where Rx
(iv) 2xy where Rx
1. List the domain and range for each of the following functions
a. A = {(1, 6), (2, 8), (3, 10), (4, 12)} b. B ={-4, 13), (-3, 6), (-2, 1), (-1, -2), (0, -3)}
Domain RXDx
Why? All values of x on the x axis
would be mapped on the line as
shown on the blue arrow ( )
Range RyRy
Why? All values of y on the y axis
would be mapped on the line as
shown by the maroon arrow ( )
Domain RXDx
Why? All values of x on the x axis
would be mapped on the line as
shown on the blue arrow ( )
Range 0y , Ry
Why? Only values of y that is
greater than and equal to zero on
the y axis would be mapped on the
line as shown on the maroon arrow
( )
Exercise 1.3

18
c. D = d. D=
2. For the functions given as a rule, list the domain and range.
a. 32 xy , x {0, 1, 2, 3, 4} b. 32 xy , x {-4, -3, -2, -1, 0}
c. 23)( xxf , x {-2, -1, 0, 1, 2} d. 33
2)( xxg , x {-9, -6, -3, 3, 6, 9}
3. List the domain and range for the functions given as a graph.
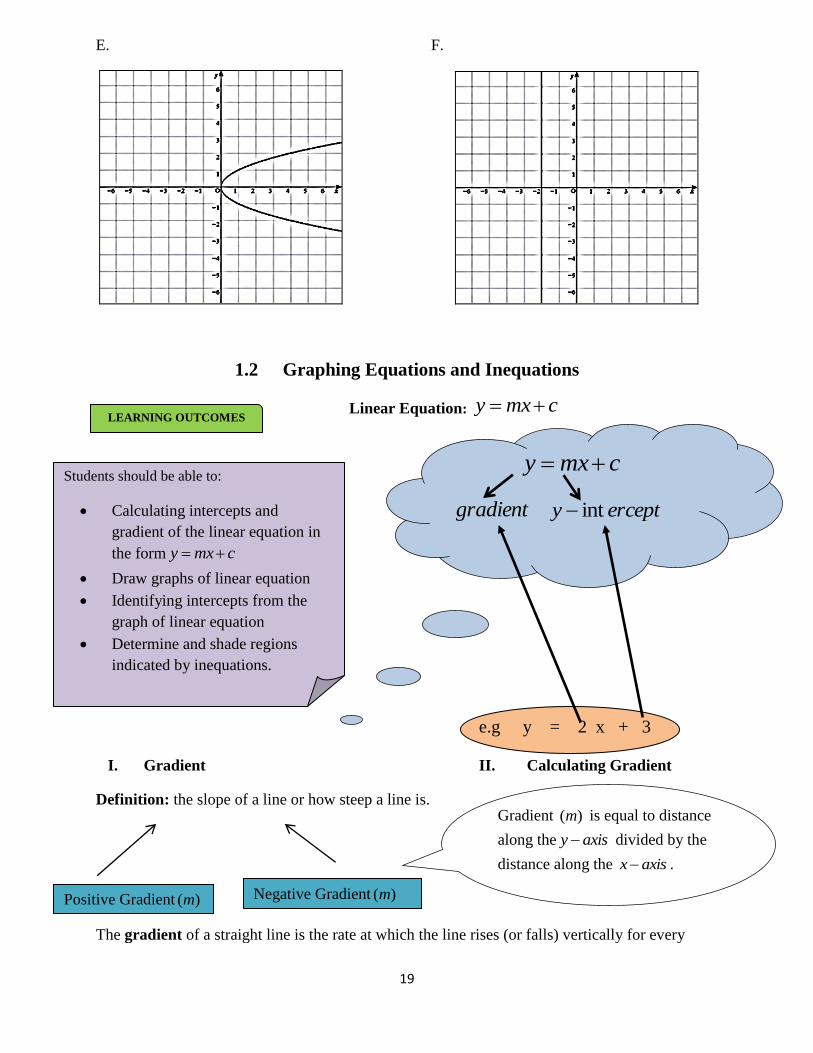
A. B.
C. D.
-3
2
11
-8
4
-7
p
r
t
q
s
u
19
E. F.
1.2 Graphing Equations and Inequations
Linear Equation: cmxy
e.g y = 2 x + 3
I. Gradient II. Calculating Gradient
Definition: the slope of a line or how steep a line is.
The gradient of a straight line is the rate at which the line rises (or falls) vertically for every
LEARNING OUTCOMES
cmxy
gradient
ercepty int
Positive Gradient )(m Negative Gradient )(m
Gradient )(m is equal to distance
along the axisy divided by the
distance along the axisx .
Students should be able to:
Calculating intercepts and
gradient of the linear equation in
the form cmxy
Draw graphs of linear equation
Identifying intercepts from the
graph of linear equation
Determine and shade regions
indicated by inequations.
20
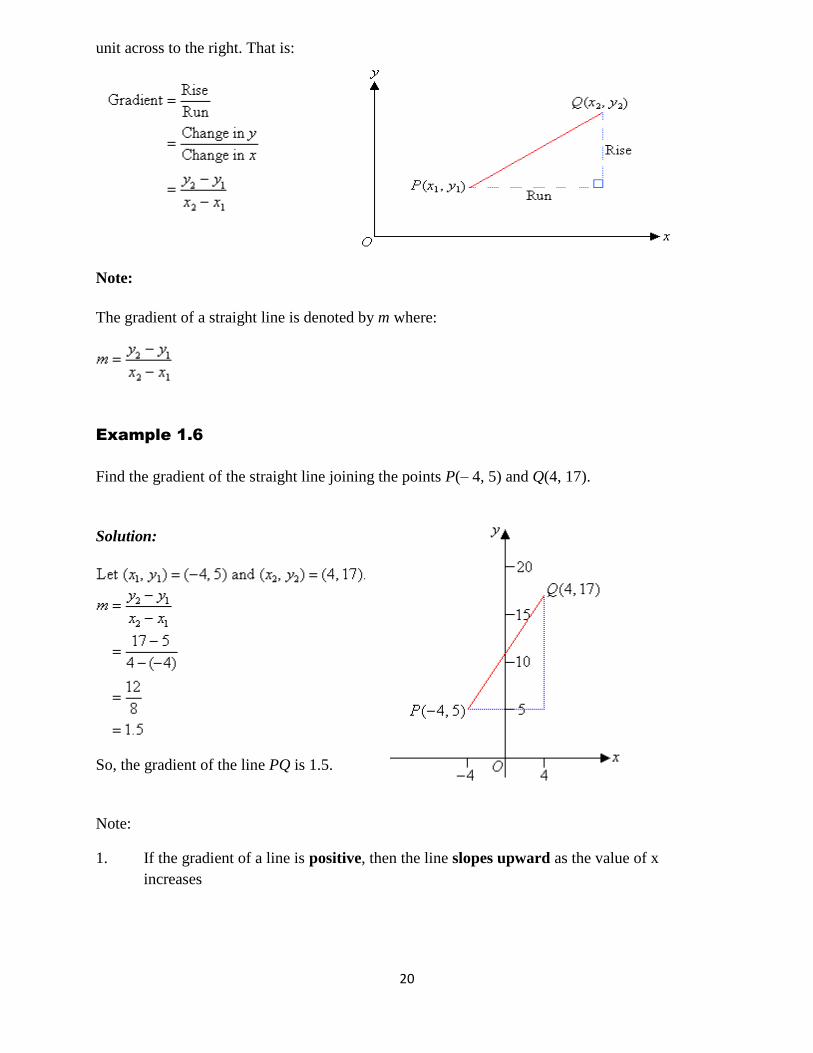
unit across to the right. That is:
Note:
The gradient of a straight line is denoted by m where:
Example 1.6
Find the gradient of the straight line joining the points P(– 4, 5) and Q(4, 17).
Solution:
So, the gradient of the line PQ is 1.5.
Note:
1. If the gradient of a line is positive, then the line slopes upward as the value of x
increases

21
2. If the gradient of a line is negative, then the line slopes downward as the value of x
increases
3. If the gradient of a line is zero, then the line is horizontal
4. If the gradient of a line is undefined, then the line is vertical

22
Example 1.7
Draw the graph for the linear equation: 32 xy
Solution:
Method I
STEP: 1 Identify the gradient )(m and ercepty int
m = 2 and ercepty int =3 or (0,3)
STEP: 2 Define the gradient )(m and its movement on the Cartesian plane
m =2 as a fraction would read 1
2meaning 2 steps along the axisy (upward
movement) and 1 movement along the axisx (movement to the right).
STEP: 3
Plot the ercepty int on the Cartesian plane to get the first point
STEP: 4
From the ercepty int , using the gradient plot the second point, ie, 2 movement
upwards and 1 movement to the right
1st
Point
point
st point
st Point
2nd
Point

23
Method II
Using table of values
Step: 1 Choose some x values (negative, zero and positive values)
x -2 -1 0 1 2
Step: 2 Substitute x values into the equation to get the y values
x -2 -1 0 1 2
y -1 1 3 5 7
Step: 3 Plot points on Cartesian plane join them with a line
Method III
Intercept method
Step: 1 Workout the x intercept by substituting y with 0, ie, y = 0
y = 2x + 3
0 = 2x + 3
-3 = 2x
= x or ( , 0)
Step: 2 Workout the y intercept by substituting x with 0, ie, x = 0
24
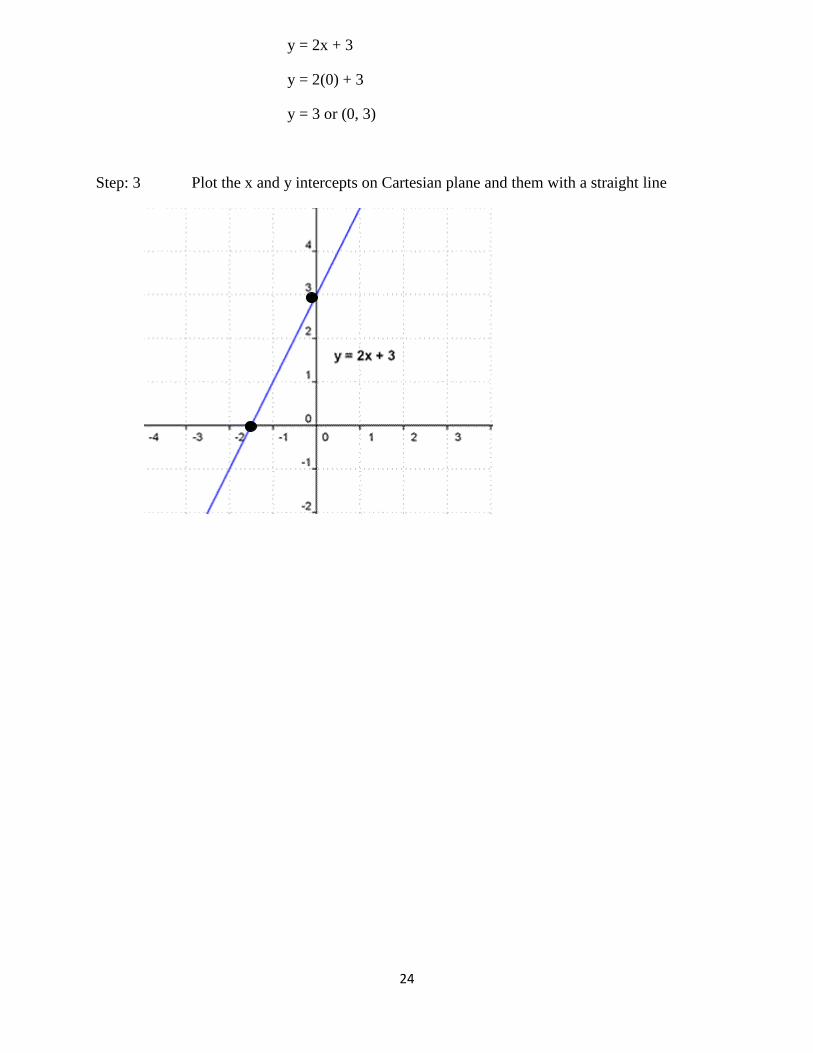
y = 2x + 3
y = 2(0) + 3
y = 3 or (0, 3)
Step: 3 Plot the x and y intercepts on Cartesian plane and them with a straight line

25
Example 1.8
Draw the graph for the linear equation 32 xy
m = -2 and y -intercept = 3 or (0,3)
III Working out Equation of the Line from the given Linear Graph: cmxy
Example 1.9
For the graph given below, work out the equation of the line:
2nd
point
1st point
1st point ( y -intercept)
2nd
point
2nd
point
positive
negative
negative
positive
26
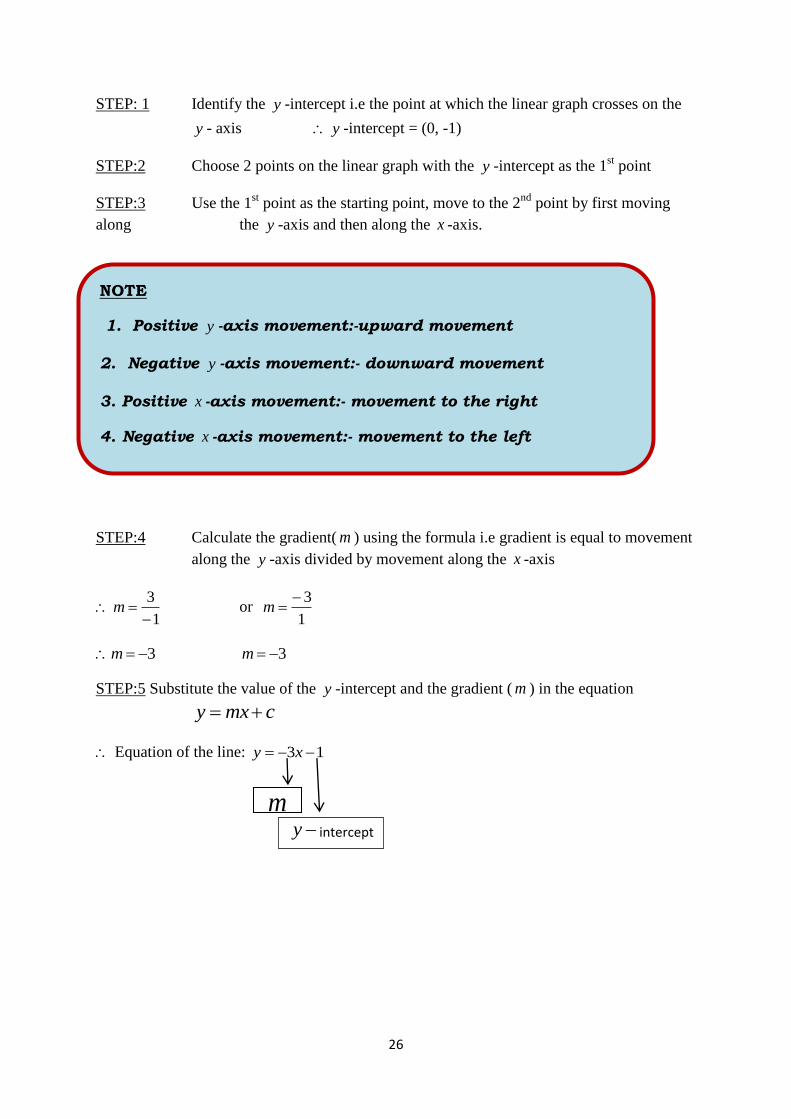
STEP: 1 Identify the y -intercept i.e the point at which the linear graph crosses on the
y - axis y -intercept = (0, -1)
STEP:2 Choose 2 points on the linear graph with the y -intercept as the 1st point
STEP:3 Use the 1st point as the starting point, move to the 2
nd point by first moving
along the y -axis and then along the x -axis.
STEP:4 Calculate the gradient( m ) using the formula i.e gradient is equal to movement
along the y -axis divided by movement along the x -axis
1
3
m or
1
3m
3m 3m
STEP:5 Substitute the value of the y -intercept and the gradient ( m ) in the equation
cmxy
Equation of the line: 13 xy
m
y intercept
NOTE
1. Positive y -axis movement:-upward movement
2. Negative y -axis movement:- downward movement
3. Positive x -axis movement:- movement to the right
4. Negative x -axis movement:- movement to the left

27
Example 1.10
Work out the equation of the line given below
1. y intercept, y = 3 or (0, 3)
2. gradient, m = = = 1
3. y = mx + c
y = 1x + 3 or y = x + 3
28
1. For the following equations, identify the gradient and the ercepty int .
a. 3 xy b. 13 xy c. 43
2 xy d. xy
3
12
2. Rearrange the equations to the form cmxy and state the gradient and ercepty int
a. 23 xy b. xy 43 c. 012 xy d. 936 yx
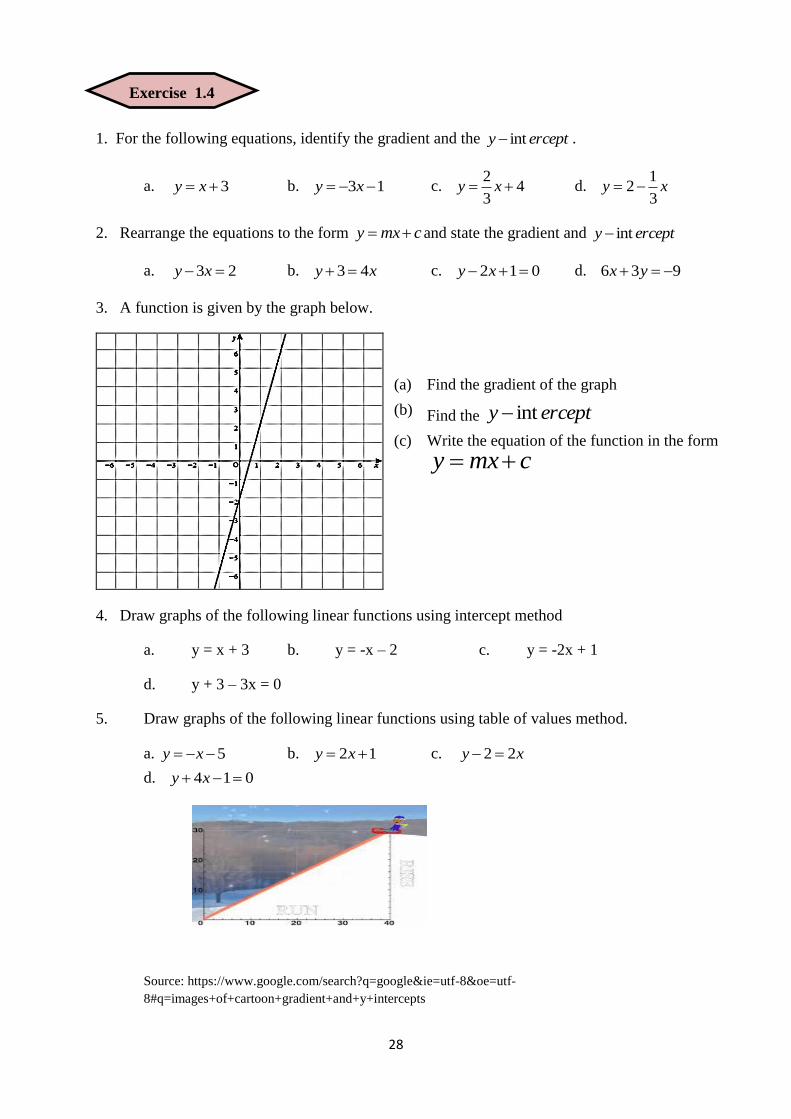
3. A function is given by the graph below.
4. Draw graphs of the following linear functions using intercept method
a. y = x + 3 b. y = -x – 2 c. y = -2x + 1
d. y + 3 – 3x = 0
5. Draw graphs of the following linear functions using table of values method.
a. 5 xy b. 12 xy c. xy 22
d. 014 xy
Source: https://www.google.com/search?q=google&ie=utf-8&oe=utf-
8#q=images+of+cartoon+gradient+and+y+intercepts
(a) Find the gradient of the graph
(b) Find the ercepty int
(c) Write the equation of the function in the form
cmxy
Exercise 1.4
29
6. Draw graphs of the following linear functions using the gradient, y intercept method.
a. 12 xy b. 15
2 xy c. 446 xy
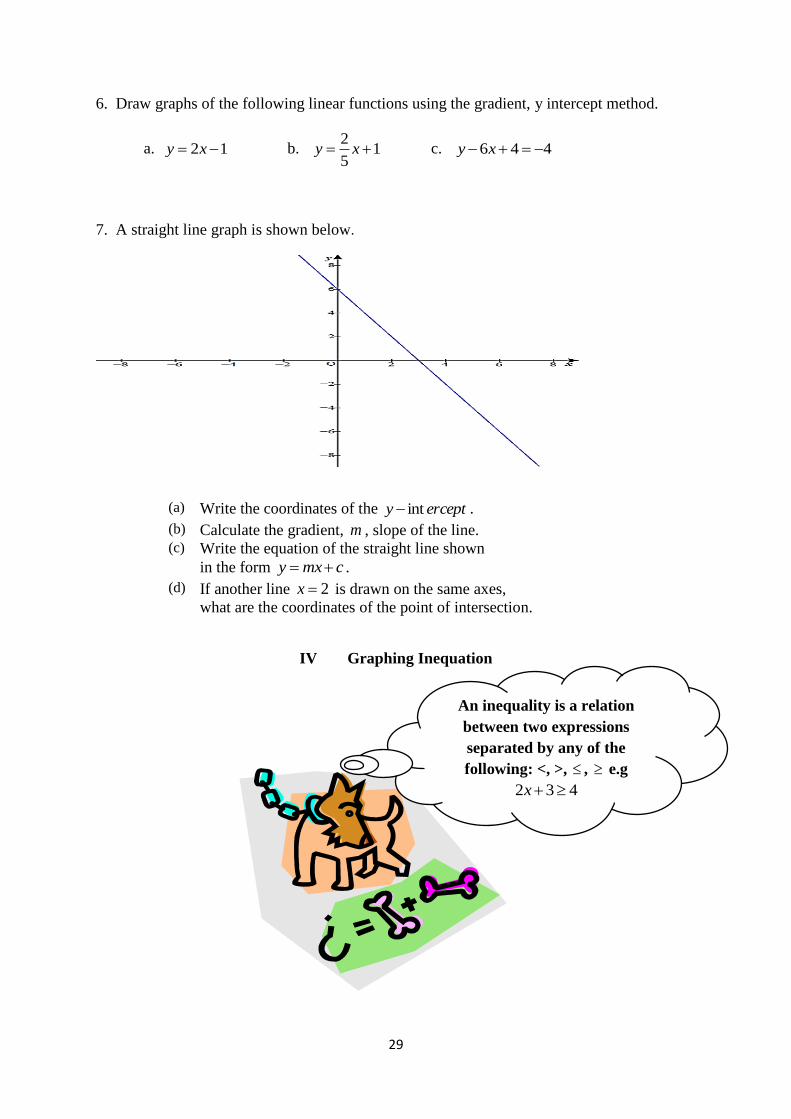
7. A straight line graph is shown below.
IV Graphing Inequation
(a) Write the coordinates of the ercepty int .
(b) Calculate the gradient, m , slope of the line. (c) Write the equation of the straight line shown
in the form cmxy .
(d) If another line 2x is drawn on the same axes,
what are the coordinates of the point of intersection.
An inequality is a relation
between two expressions
separated by any of the
following: <, >, , e.g
432 x
30
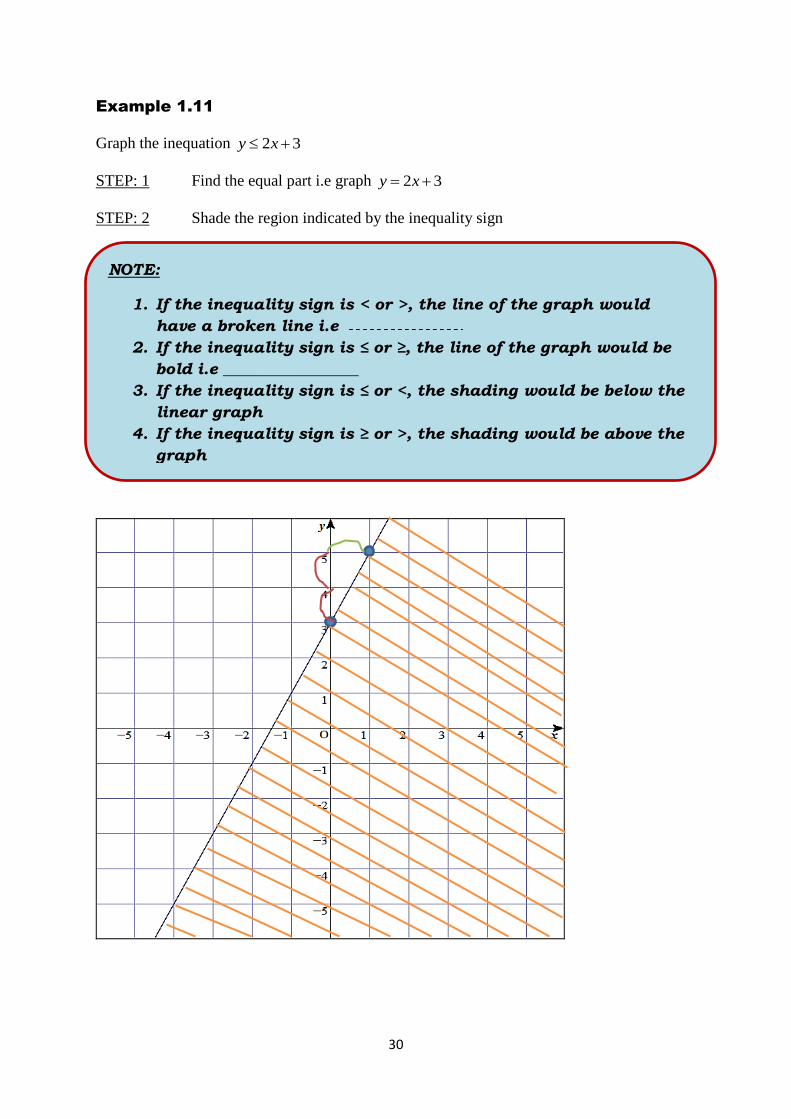
Example 1.11
Graph the inequation 32 xy
STEP: 1 Find the equal part i.e graph 32 xy
STEP: 2 Shade the region indicated by the inequality sign
NOTE:
1. If the inequality sign is < or >, the line of the graph would
have a broken line i.e
2. If the inequality sign is ≤ or ≥, the line of the graph would be
bold i.e _________________
3. If the inequality sign is ≤ or <, the shading would be below the
linear graph
4. If the inequality sign is ≥ or >, the shading would be above the
graph

31
Example 1.12
Graph the inequation y > - x – 5
Step: 1 Graph y = - x – 5
y intercept = (0, - 5) x intercept = (-5, 0) gradient, m = -1
Step: 2 Look at inequality sign and draw graph accordingly
y > - x – 5
For less than - broken line is used.
- area below the broken line is shaded

32
1. For the given graphs, describe the inequalities.
a. b. c.
2. Draw the graphs of the following inequations.
a. 4 xy b. 2
12 xy c. 25 xy d. 1264 xy
Domain and range in real life situations
A local youth group is planning a trip to a local amusement park. They are taking their church bus which holds 32 people. It will cost $25 for parking and tickets to enter the park are $22.50 per person. The equation that models this situation is: c(n) = 22.5n + 25, where c represents the cost for the group to go to the park and n represents the number of people who go on this excursion.
Source: https://www.google.com/search?q=google&ie=utf-8&oe=utf-8#q=images+of+cartoon+youth+group
Exercise 1.5
In this problem, for the domain, the problem says that the bus can only
hold 32 people, so the domain has to be less than or equal to 32. However,
since negative numbers are also less than 32 and impossible to have
negative people (independent variable), It is a must to have a lower limit
on domain of 0.To find the range values, simply use the limits set on the
domain and substitute those values into the equation to find my limits on
the range.

33
A Function is given by a Table of Values below The following table gives U.S. population in millions in the indicated year:
Year 1960 1970 1980 1990
U.S. Population (in millions) 181 205 228 250 Source: Statistical Abstracts of the United States,1993.
Source: https://www.google.com/search?q=google&ie=utf-8&oe=utf-8#q=images+of+cartoon+population
Peter needs to fill up his truck with gasoline to drive to and from school next week. If gas costs $2.79 per gallon, and his truck holds a maximum of 28 gallons, analyze the domain, range, and function values through the following questions.
We can think of population as depending on time in years so the independent
variable or input is the year and the dependent variable or output is the U.
S. population. Since the table gives a unique population for each year, it
represents a function. The domain is the set of years {1960, 1970, 1980,
1990} and the range is the set of populations in those years {181 million,
205 million, 228 million, 250 million}.
The domain is the number of gallons of gas purchased. On the graph, this
is the possible x-values. The range is the costs of the gasoline. On the graph, this is the possible y-values.
34
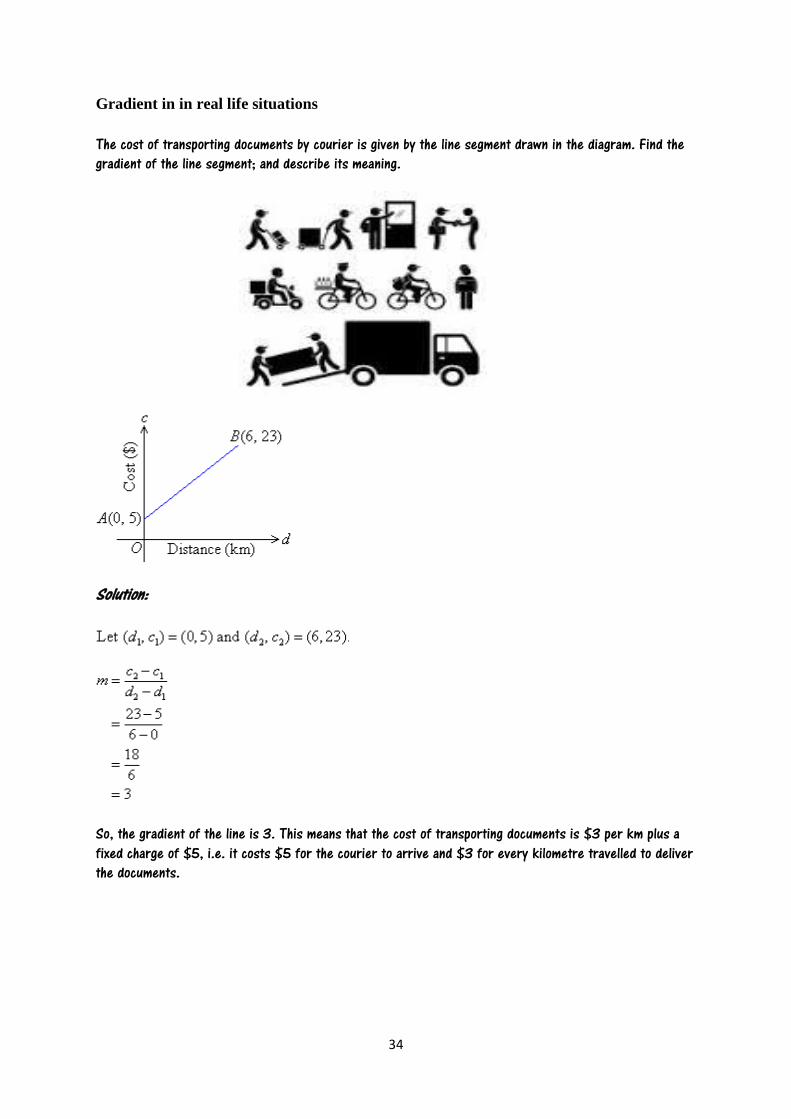
Gradient in in real life situations
The cost of transporting documents by courier is given by the line segment drawn in the diagram. Find the gradient of the line segment; and describe its meaning.
Solution:
So, the gradient of the line is 3. This means that the cost of transporting documents is $3 per km plus a fixed charge of $5, i.e. it costs $5 for the courier to arrive and $3 for every kilometre travelled to deliver the documents.

35
GLOSSARY 12 Cartesian plane A plane made up of an x axis (horizontal line)and y axis (vertical
line) 11 Coordinates Ordered set of numbers that define the position of a point 14 degree The degree of a term is the exponent of the term 5 Domain The set of x values 8 Equation A written statement indicating the equality of two expressions 3 Function A set of ordered pairs in which each x value has only one y value
associated with it 16 Gradient (slope) A measure of steepness of a line 15 In equation (inequality) A relation that holds between two values when they are different
A mathematical sentence built from expressions using one or more of the
symbols <, >,
13 Index A number to the right and above the base number 1 Intersection The point where two lines intersect 4 Linear Relating to a graph that is a linear, especially a straight line 9 Notations Written symbols used to represent numbers 7 Quadratics An equation where the highest exponent of the variable is a square
(2) 6 Range The set of y values 2 Relation A set of ordered pairs 10 Variable An element or feature that is liable to change 17 X intercept It is where the graph cuts the x axis 18 Y intercept It is where the graph cuts the y axis
36
Source: http://www.ehow.com/info_8143072_history-equality-symbols-math.html
ALGEBRA STRAND 2
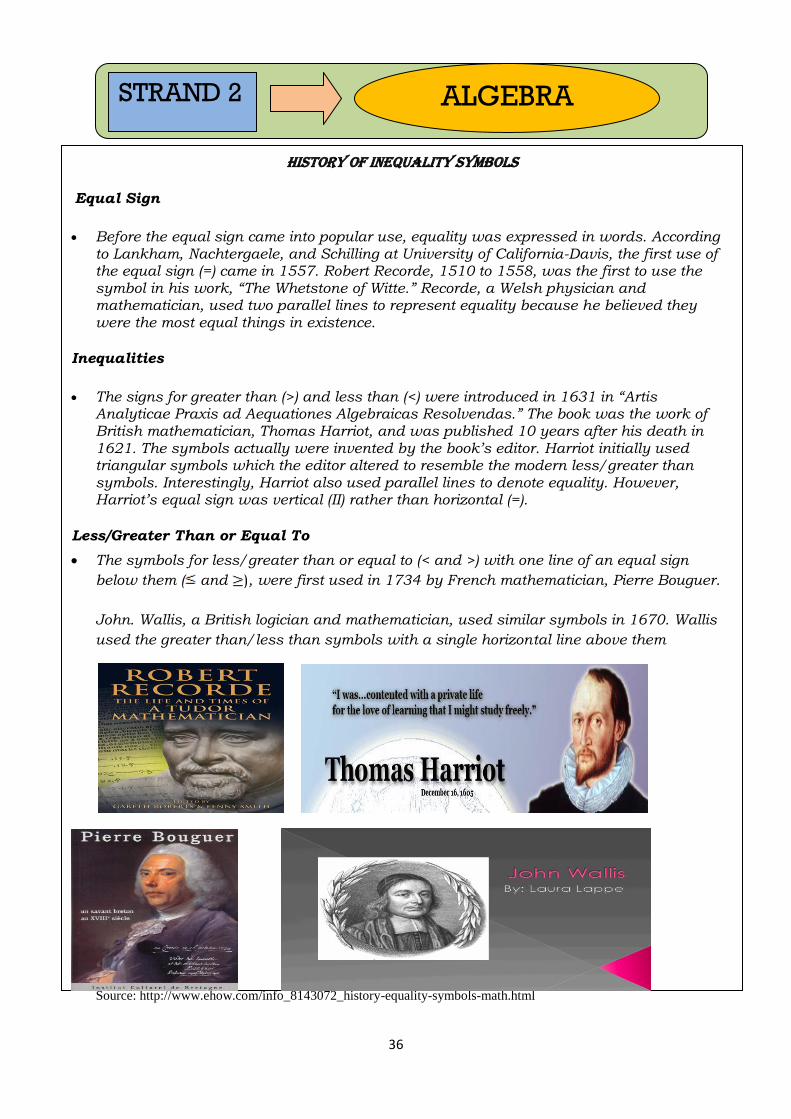
HISTORY OF INEQUALITY SYMBOLS
Equal Sign
Before the equal sign came into popular use, equality was expressed in words. According to Lankham, Nachtergaele, and Schilling at University of California-Davis, the first use of the equal sign (=) came in 1557. Robert Recorde, 1510 to 1558, was the first to use the symbol in his work, “The Whetstone of Witte.” Recorde, a Welsh physician and mathematician, used two parallel lines to represent equality because he believed they were the most equal things in existence.
Inequalities
The signs for greater than (>) and less than (<) were introduced in 1631 in “Artis Analyticae Praxis ad Aequationes Algebraicas Resolvendas.” The book was the work of British mathematician, Thomas Harriot, and was published 10 years after his death in 1621. The symbols actually were invented by the book’s editor. Harriot initially used triangular symbols which the editor altered to resemble the modern less/greater than symbols. Interestingly, Harriot also used parallel lines to denote equality. However, Harriot’s equal sign was vertical (II) rather than horizontal (=).
Less/Greater Than or Equal To
The symbols for less/greater than or equal to (< and >) with one line of an equal sign
below them ( and ), were first used in 1734 by French mathematician, Pierre Bouguer.
John. Wallis, a British logician and mathematician, used similar symbols in 1670. Wallis
used the greater than/less than symbols with a single horizontal line above them

37
2.1 Factorisation and Simplification of Algebraic Expressions
Factorisation
HOW?
Step: 1 Cut out the following squares and rectangles.
x 1 1 1 1 1
x x
Step: 2 Make rectangles from the cut out squares and rectangles in step 1 above.
Let‟s say “I use one piece of 2x and 4 pieces of x ”
Step: 3 Now make some more rectangles using the square and rectangular pieces
indicated below.
a) 1 piece of , 2 pieces of and 2 pieces of .
b) 1 piece of , 3 pieces of and 2 pieces of
x x
x
x + 4
1
LEARNING OUTCOME
Activity:
Let us make various rectangles out of squares
and rectangles.
2x x x
1 1
1 1 x x
1
1 1
2x x x
2x x
2x x
1
What is the area of
the new rectangle?
Students should be able to:
Factorizing algebraic expressions
by applying:
Common Factor method.
Grouping method
Difference of squares
method.
Perfect square method.

38
Note: If we are to make a rectangle out of 1 piece of , 4 pieces of and 3 pieces
of
Then we would get this rectangle:
Therefore:
1. The sum of the areas of all the pieces would be 342 xx
2. The area of the new and bigger rectangle would be )3)(1( xx
Finally: 342 xx is the product of )3)(1( xx which means that )1( x and )3( x are
factors of 342 xx .
Using Formula for Factorization:
1. Common Factor Method:
When all terms in a polynomial share a common factor, the expression can be factorized by
taking the common factor outside the brackets as in the distributive law.
Example 2.1
Factorize: xyx 32 2
And yxxy
xxx
33
22 2
The two terms have x as a common factor which is put outside the brackets to be distributed
to the left over terms as shown: )32(32 2 yxxxyx
1 2x x
2x x x
1
1
1
x x
1x
3x
Factorization is rewriting an expression or polynomial as a product of its factors.
)3)(1(342 xxxx
Factorization
Expansion

39
Example 2.2
Factorize: xxyx 963 2
xx
yxxy
xxx
339
326
33 2
)32(3963 2 yxxxxyx
2. Grouping Method
This is done by grouping a pair of terms. Then, factor each pair of two terms
Example 2. 3
Factorize: 12262 ppp
Note:A. Make 2 groups having the same common factor then factorize:
)122()6( 2 ppp
B. What is common to both groups will make one factor and the second
factor would be made up of the left over factors.
)2)(6(12262 ppppp
3. Quadratics
3a Difference of Squares: ))((22 bababa
When the sum of two numbers multiplies their difference (a + b)(a − b) then the product is
the difference of their squares, a 2 – b
2.
Group 1
)6(
62
pp
pp
Group 2
)6(2
122
p
p
+
Generalization:
Find factors of the first term and the second term separately, and then cross multiply. The
middle term should come from adding the diagonals.
i.e. 22 2 baba
b
b
a
a
ab
ab
ab
2
+
Middle Term

40
Proof
1. a2 – b
2 = (a + b)(a – b)
Use the distributive property to expand the right - hand side.
= a2 – ab + ba – b
2.
Apply the commutative Law to ba so that ba = ab ( b • a = a • b) or ba – ab = 0
= a2
– b2
Thus LHS = RHS
2. The difference of two squares can also be shown geometrically.
In the diagram given below, the shaded part represents the difference between the bigger
square (a2) and the smaller square (b
2) which is equal to a
2 - b
2.
The area of the shaded part can be worked out by adding the following:
Rectangle 1 = a (a – b)
Rectangle 2 = b (a – b)
= a (a – b) + b (a – b)
This can be factorized to (a + b)(a – b)
Thus a2 – b
2 = (a + b)(a – b)

41
Example 2.4 Example 2.5
Factorize: 162 x Factorize: 254 2 x
x x4
x x x
x
0
4
)4)(4( xx )52)(52( xx
3b Perfect Squares: 22 2 baba 2)( ba or
22 2 baba 2)( ba
Example 2.6 Example 2.7
Factorize: 442 xx Factorize: 442 xx
2)(2( xx )
2)2(
)2)(2(
x
xx 2)2( x
Factorize the following expressions
1. a) 22 x b) xx 32 c) yzxz 63
d) 269 xx e) 684 yx f) 32 24 yy
g) 222 aaa h) 8242 bbb i) 12432 yyy
2. a) 36122 xx b) 121222 xx c) 64162 xx
d) 9124 2 xx e) 4129 2 xx f) 424
2
xx
3. a) 362 x b) 22 9x c) 819 2 x
d) 94
1 2 x e) 4936
22 yx f)
164
22 y
a
4. Use the pattern ))((22 bababa to evaluate 22 3132
x
x
2
2
5
5
x
x
x
0
10
10
Note: x0 means that
there is no middle term
x
x
2
2
x
x
x
4
2
2
x
x
2
2
x
x
x
4
2
2
Exercise 2.1

42
5. Marika bought a square plot of land whose length is ( 14 y ) cm and then made a footpath
on which he could walk around while tending to his vegetable garden. If the vegetable plot
which is also square in shape but inside the square plot of land has length ( y3 ) cm, calculate
the area of the footpath.
Square Roots
SYMBOL: - makes mathematics looks important and is called the radical.
The square root of a number is a value that can be multiplied by itself to give the original
number.
Example 2.8 Example 2. 9
44 2525
2 5
i.e. 422
422
i.e.
2555
2555
Square Root Generalizations:
1. baab 2. aaa 2 e.g. 2222
e.g. 4312 a
aa
2
22
3. A positive number has 2 square roots i.e absolute values are equal but signs are
different. e.g square root of 4 are 4 and 4 or 4
4. b
a
b
a e.g = =
5. 00
WHAT CAN I
MULTIPLY BY
ITSELF TO GIVE
THIS????
LEARNING OUTCOME
Students should be able:
Introduce the formal
treatment of square
roots

43
6. + e.g +
Calculate the following:
a. 105 f. 22 xx
b. 169 g. 2)1( x
c. 426 h. 22)12( xx
d. 332 i.
16
4 2x
e. 5253 j. ))1((4
9 2x
2.2 Solving Equations & Inequations
What is an equation?
A mathematical statement that says two things are equal.
LEARNING OUTCOMES
?????
Students should be able to:
Solve linear equations
involving variables on both
sides of the equation.
Solve linear inequations
involving variables on both
sides of the inequality sign.
Solve equations by applying
the square root and null factor
law.
Exercise 2.2
How Can I
Balance
This???

44
2.2.1 Linear Equations Having Variables on Both Sides
Example: 2.10
Solve for the missing variable in the given equation
a. 232 xx
Step: 1 Collect the like terms
322 xx
b.
x
x
x
xx
xx
2
3
3
3
6
36
442
442
c.
18
1
18
1
18
1832
)6(32
243
2
423
2
x
x
x
xx
xx
xx
xx
Solve for the missing variable in the following equations.
a. 1246 yy b. 15375 bb c. 142104 aa
d. nn 26515 e. 2512 xx f. 307911 ww
g. )62(5)13(2 xx h. )4(27 hh i. 11)52(2 qq
j. 1)4(223 xx k. zzz 214)2(3 l. 24)3(3)5(2 xx
Linear equations in real life situations
When collecting the like terms;
to move one term from the right
of the equal sign to the left or
vice-versa, the sign changes.
Step: 2 Simplify both sides
5x
Exercise 2.3
Equations may look scary, but you use and solve linear equations every day of your life, whether you know it or not.
Variable should be alone on one
side by removing other terms to
the other side using opposite
operations
Remove brackets
Collect like terms
Simplify like terms
Find the unknown
45
One of the realities of life is how so much of the world runs by mathematical rules. As one of
the tools of mathematics, linear systems have multiple uses in the real world.
Source: https://www.google.com/search?q=google&ie=utf-8&oe=utf-8#q=images+of+cartton+linear+equations
In the Kitchen
Source: https://www.google.com/search?q=google&ie=utf-8&oe=utf-8#q=images+of+kitchens
Life is full of situations when the output of a system doubles if the input
doubles, and the output cuts in half if the input does the same. That's what a
linear system is, and any linear system can be described with a linear
equation.
If you've ever doubled a favorite recipe, you've applied a linear equation. If
one cake equals 1/2 cup of butter, 2 cups of flour, 3/4 tsp. of baking powder,
three eggs and 1 cup of sugar and milk, then two cakes equal 1 cup of butter, 4
cups of flour, 1 1/2 tsp. of baking powder, six eggs and 2 cups of sugar and
milk. To get twice the output, you put in twice the input. You might not have
known you were using a linear equation, but that's exactly what you did.

46
Melting Snow
Source: https://www.google.com/search?q=google&ie=utf-8&oe=utf-8#q=image+of+melting+snow+
Question
It's springtime and Mrs Bula wants to fill her swimming pool. She sees that it takes 25
minutes to raise the pool level by 4cm. She needs to fill the pool to a depth of 1metre; she has
44 more cm to go.
Source: https://www.google.com/search?q=google&ie=utf-8&oe=utf-
8#q=pictures+of+cartoon+swimming+pools
Suppose a water district wants to know how much snowmelt runoff it can
expect this year. The melt comes from a big valley, and every year the district
measures the snowpack and the water supply. It gets 60 acre-feet from every 6
inches of snow pack. This year surveyors measure 6 feet and 4 inches of snow.
The district put that in the linear expression (60 acre-feet/6 inches) * 76
inches. Water officials can expect 760 acre-feet of snowmelt from the water.
She figures out her linear equation: 44 cm* (25 minutes/4 cm is 275 minutes,
so she knows she has four hours and 35 minutes more to wait.

47
Question
Brian has noticed that it's springtime. The grass has been growing. It grew 2 cm in two
weeks. He doesn't like the grass to be taller than 2 1/2 cm, but he doesn't like to cut it shorter
than 1 3/4 cm. How often does he need to cut the lawn?
Source: http://landscaping.about.com/od/lawns/a/spring_lawns.htm
Question
A 45 feet of wood to use for making a bookcase. If the height and width are to be 10 feet and
5 feet, respectively, how many shelves can be made between the top and bottom of the
frame?
Source: https://www.google.com/search?q=google&ie=utf-8&oe=utf-8#q=images+of+bookcases
He needs to put that calculation in his linear expression, where (14 days/2 cm)
* 3/4 cm tells him he needs to cut his lawn every 5 1/4 days. He just ignores
the 1/4 and figures he'll cut the lawn every five days.
To solve this equation, we can use a linear relationship:
Nv+Mh=45
where v and h respectively represent the length in feet of vertical and horizontal
sections of wood. N and M represent the number of vertical and horizontal pieces,
respectively. Knowing that there will be only two vertical pieces, this formula can be
simplified to:
2⋅10+M⋅5=45
Solving for M, we find that there is enough material for 5 shelves (3 shelves if you don't count
the top and bottom).

48
Question
Consider a shirt that costs $24 when on a 40% discount. If the original price is x, find x
Answer
Source: Boundless. “Linear Equations and Their Applications.” Boundless Algebra.
Boundless, 03 Jul. 2014. Retrieved 03 Feb. 2015 from
https://www.boundless.com/algebra/textbooks/boundless-algebra-textbook/functions-
equations-and-inequalities-3/linear-equations-and-functions-22/linear-equations-and-their-
applications-121-5519/
Everywhere
Using similar models we can solve equations pertaining to distance, speed,
and time (Distance = Speed * Time); density (Density = Mass/ Volume); and
any other relationship in which all variables are first order.
It's not hard to see other similar situations. If you want to buy drinks for the big party and you've got $60 in your pocket, a linear equation tells you how much you can afford. Whether you need to bring in enough wood for the fire to burn overnight, calculate your paycheck, figure out how much paint you
need to redo the upstairs bedrooms or buy enough gas to make it to and from your Aunt Sylvia's, linear equations provide the answers. Linear systems are,
literally, everywhere
x−0.4⋅x=24
Solving for x, we find that the original price was $40.

49
2.2.2 Linear Inequations Having Variables on Both Sides
What is an inequation?
It is an algebraic sentence which has the inequality signs ( ,,, ) instead of the equal sign
(=).
Solve the following inequations.
a. 1045 xx b. yy 274 c. 922 ww
d. 27215 qq e. )5(2)7(3 hh f. 2
73
yy
Linear inequations in real life situations
Inequalities are very common in daily life. For example:
You can work a total of no more then 41 hours each week at your two jobs. House cleaning pays
$5 per hour and your sales job pays $8 per hour. You need to earn at least $254 each week to
pay your bills. Write a system of inequalities that shows the various numbers of hours you can
work at each job.
Source: https://www.google.com/search?q=google&ie=utf-8&oe=utf-
8#q=images+of+house+cleaning
Very Important Note!!!
Inequations are solved in the same way as equations.
Inequations usually have many solutions as compared to
equations.
e.g. 2
75
x
x
2
75
x
x
When an inequation is divided by -1, the inequality sign is
reversed to make the statement true.
One solution
Infinite solution
i.e. any number
greater than 2
Symbol Meaning
Less than or
equal to
Greater than or
equal to
< Less than
> Greater than
Exercise 2.4

50
x = housecleaning
y = sales job
Hours: x + y ≤ 41
Money: 5x + 8y ≥ 254
Fuel x costs $2 per gallon and fuel y costs $3 per gallon. You have at most $18 to spend on fuel.
Write and graph a system of linear inequalities to represent this situation.
x = fuel x
y = fuel y
Price: 2x + 3y ≤ 18
Gallons of x: x ≥0
Gallons of y: y ≥ 0
A salad contains fish and chicken. There are at most 6 pounds of fish and chicken in the salad.
Write and graph a system of inequalities to represent this situation.
Source: http://photobucket.com/images/salad?page=1
x = fish
y = chicken
Total Pounds: x + y ≤ 6
Pounds of fish: x ≥ 0
Pounds of chicken: y ≥ 0

51
Mary babysits for $4 per hour. She also works as a tutor for $7 per hour. She is only allowed to
work 13 hours per week. She wants to make at least $65. Write and graph a system of
inequalities to represent this situation.
Source: https://www.google.com/search?q=google&ie=utf-8&oe=utf-8#q=images+of+babysitter
x = babysitting
y = tutoring
Hours: x + y ≤ 13
Money: 4x + 7y ≥ 65
1. Seru has $500 at his savings account at the beginning of summer. He wants to
have at least $200 at the end of the summer. He withdraws $25 each week for
food and clothes.
Source: https://www.google.com/search?q=google&ie=utf-8&oe=utf-8#q=images+of+bank
(a) Write an equation that represents Seru‟s situation
(b) How many weeks can Seru withdraws money from his account? Justify
your answer.
Exercise 2.5

52
2. Marshall Taxi charges a $1.50 rate in addition to $0.85 for every kilometer.
Mr Maklu has no more than $10 to spend on a ride.
(a) Write an inequation that represents Mr Maklu‟s situation
(b) How many kilometers can he travel without exceeding his limit? Show
your working.
2.2.3 Solving Quadratic Equations
2.2.3.1 Using the Square Root Law
What would be the
difference between the
solutions in a linear
equation to that of a
quadratic equation? Linear equations have
one solution while
quadratic equations have
2 solutions.

53
Example 2: 11
Find all solutions to the following equations.
a)
3
3..
3
9
9
2
2
x
xei
x
x
x
b)
4
4..
4
16
16
511
115
2
2
2
2
x
xei
x
x
x
x
x
2.2.3.2 Using the Null Factor Law
Example 2. 12
Find all solutions to the following equations.
Exercise: Solve the equations using the null factor law or square root law.
Exercise
1. 0)3)(2( xx 2. 0)1)(5)(4( xxx 3. 812 x
4. 25)4( 2 x 5. 0)2(2 xx 6. 0)63)(12( xx
7. 182)2( 2 x 8. 0642 x 9. 25102 xx
To remove 2x we will have to
on both sides since square root
( ) is the opposite of square.
The square root of a number will
therefore have 2 values i.e. the positive
value and the negative value.
If multiplying any two numbers is zero, then one or both
of the numbers are zero, i.e. if 0ab ,then
0a or 0b . This is the Null Factor Law which is
often used to solve quadratic functions or other functions
which could have more than 2 solutions.
a. )3)(2( xx 0
02 x and 03x
20x and 3x
2x and 3x
b. )4)(1)(3( xxx = 0
03x , 01x and 04 x
30x , 10x and 40x
,3x 1x and 4x

54
2.3 Formula Manipulation
2rA what will r equal to if A = 225cm and 14.3
Example 2. 13
Given the formula for the area of a circle is 2rA , make r the subject of formula.
rA
rA
rA
rA
rA
2
2
2
2
LEARNING OUTCOME
Definition:1
Formula: An equation
which tells how variables
are related to one another.
Definition:2
Subject of formula: Single variable on
the left hand side of the equation with
everything else going on the right hand
side.
Definition: 3
Changing the subject of formula: Begins with the
variable to become the new subject and applying
inverse operations on the other variables.
Divide by on both sides of the equation to remove
from the right hand side and move the variable to
the left hand side using the same operation.
on both sides to remove square (2
)from the right
hand side and move the variable to the left hand side
using the same operation
Now r is the new
subject of formula
Students should be able to:
manipulate the original formula
using the inverse operations

55
For each of the equations given, make the variables given in brackets the new subject of formula.
1. atuv )(u 2. atuv )(t 3. cmxy )(x
4. bpap 32 )( p 5. fMmP )( )(M 6. hrV 2
3
1 )(r
7. hbA 2
1)(b 8.
35
zxy )(x 9. tvus )(2 )(t
Formula manipulation is also applied in others subjects such as Physics, Chemistry, Economics
Physics
Source: https://www.google.com/search?q=google&ie=utf-8&oe=utf-8#q=kinetic+and+potential+energy
Make m the subject of the formula
Where m = mass of the body,
h is the height attained due to the body's displacement and
g is the acceleration due to gravity which is constant on earth
v is the velocity of the body
E = mgh + ½mv2
Kinetic and Potential Energy
Now try it out yourself
Exercise 2.6
56
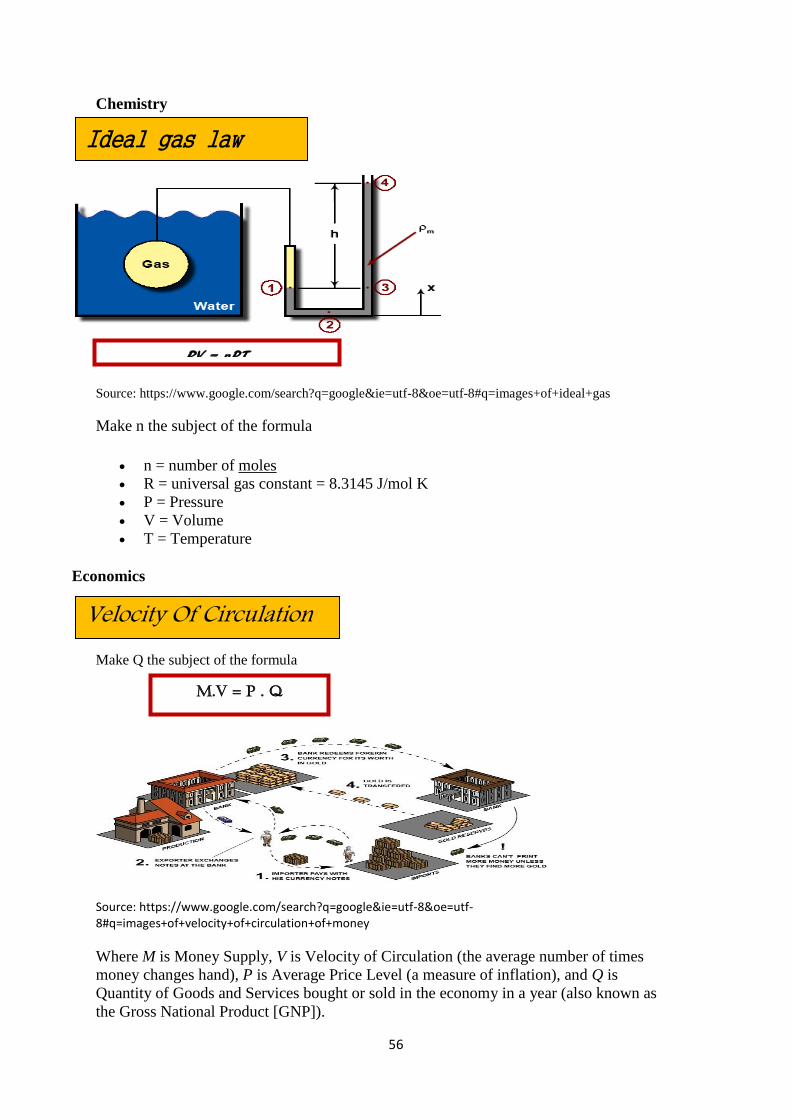
Chemistry
Source: https://www.google.com/search?q=google&ie=utf-8&oe=utf-8#q=images+of+ideal+gas
Make n the subject of the formula
n = number of moles
R = universal gas constant = 8.3145 J/mol K
P = Pressure
V = Volume
T = Temperature
Economics
Make Q the subject of the formula
Source: https://www.google.com/search?q=google&ie=utf-8&oe=utf-8#q=images+of+velocity+of+circulation+of+money
Where M is Money Supply, V is Velocity of Circulation (the average number of times
money changes hand), P is Average Price Level (a measure of inflation), and Q is
Quantity of Goods and Services bought or sold in the economy in a year (also known as
the Gross National Product [GNP]).
PV = nRT
Ideal gas law
Velocity Of Circulation
M.V = P . Q

57
GLOSSARY 11 Absolute values The magnitude of a quantity irrespective of sign
The distance of a quantity from zero 18 Acceleration Rate at which the speed is changing 1 Algebra A branch of mathematics in which symbols represent numbers of a specified set
and are used to represent quantities and to express general relationships that hold for all members of the given set
4 Common factor A number or quantity that divides two or more numbers exactly 7 Commutative law Swap numbers and still maintain the same answer 6 Distributive law Multiplying a number by a group of numbers added together is the same as
multiplying each separately 26 Economy Consists of production distribution or trade and consumption of limited goods and
services by different agents 15 Energy Property of objects, transferable among themthrough fundamental interactions,
which can be converted into different forms but not created or destroyed 9 Evaluate To find the numerical value 2 Factorise The resolution of an expression into factors such that when these factors are
multiplied together, they give the original expression 12 Formula Relationship between two or more variables 13 Formula manipulation Involves rearranging variables to make an algebraic expression better suit the
requirement. During this arrangement, the value of the expression does not change
20 Ideal gas A gas whose pressure, volume and pressure are related by the ideal gas law 25 Inflation The rate at which the general level of prices for goods and services is rising and
subsequently purchasing power is decreasing 16 Kinetic energy Energy of motion 21 Moles A unit of measurement used in chemistry to express the amount of a chemical
substance 8 Perfect square A number that can be expressed as the product of two equal integers 5 Polynomial An expression consisting of variables and coefficients that involves the
operations of addition, subtraction and multiplication and non - negative integer exponents
17 Potential energy Energy that an object has due to its position in a force field 22 Pressure A measure of the force applied over a unit area 10 Radical An expression that has a square root or cube root 3 Simplify To rewrite an expression as simple as possible 14 Subject of a formula The variable on its own, usually on the left hand side of a formula 23 Universal gas A physical constant used in many thermochemical equations and relationships 19 Velocity Rate of travel of an object along with its direction 24 Velocity of circulation The average number of times a unit of money changes hands in an economy
during a given period.

58
STRAND 3 NUMBERS
HISTORY OF INDICES
The word exponere (exponent) originated from Latin, expo, meaning out of, and ponere, meaning place. While the word exponent came to mean different things, the first recorded modern use of exponent in mathematics was in a book called "Arithemetica Integra," written in 1544 by English author and mathematician Michael Stifel. But he worked only with a base of two, so the exponent 3 would mean the number of 2s you would need to multiply to get 8. It would look like this 2³=8. The way Stifel would say it is kind of backwards when compared to the way we think about it today. He would say "3 is the 'setting out' of 8." Today, we would refer the equation simply as 2 cubed. He was working exclusively with a base or factor of 2 and translating from Latin a little more literally than we do today.
The idea of squaring or cubing goes all the way back to Babylonian times, part of Mesopotamia now Iraq. The earliest mention of Babylon was found on a tablet dating to the 23rd Century BC. And they were using the concept of exponents even then, although their numbering system used symbols to denote mathematical formulas.
What the Earliest Exponents Looked Like
The word "raised" is usually omitted, and very often "power" as well, so 35 is typically pronounced "three to the fifth" or "three to the five". The exponentiation bn can be read as b raised to the n-th power, or b raised to the power of n, or b raised by the exponent of n, or most briefly as b to the n.
The modern notation for exponentiation was introduced by René Descartes in his Géométrie (Geometry) of 1637
Source: http://en.wikipedia.org/wiki/Exponentiation
Source: http://www.ehow.com/about_5134780_history-exponents.html

59
3.1 Expressing Numbers in Indices Form
Activity:
A long time ago in the Duavata Kingdom lived a beautiful and hardworking girl. She was working for
a King who was the strict ruler of Duavata Kingdom. The King was really appreciative of the work
being done by the girl that he summoned her to his office to offer a reward. Below is the conversation
that took place between the King and the girl.
King: “Girl, I am going to give you anything you want from my Kingdom. Please tell me what is it
you really want me to give you”.
Girl: “My Lord, I come from a very poor family. My requests are as follows: Today- 1 gold coin, 1st
day of work tomorrow-2 gold coins, 2nd
day-4 gold coins, 3rd
day-8 gold coins, 4th day-16 gold coins
and to continue for 30days”.
King: “Is that all? You must be joking! You mean to tell me that that is enough for me to reward you
for all the work that you have been doing for me. Fine, may your request be granted. Here is the 1st
gold. My advisors will do the calculations and you will come and collect your rewards on a daily basis
as you have requested”.
The King called his advisors who then made all the calculations. After receiving the breakdown for
each day until the 30th day, the King fainted.
Source: https://www.google.com/search?q=google&ie=utf-8&oe=utf
8#q=images+of+a+cartoon+king+and+his+money
Questions:
1. How many gold coins would the girl receive on the 5th day of work?
2. Why did the King faint? [Clue: Do all the calculations for 30 days?
Solutions:
1. 1st day: no work done= 1 gold coin[ 120 ], 1st day: after work = 2 gold coins[ 221 ],
2nd
day: after work= 4 gold coins[ 422 ], 3rd
day: after work= 8 coins[ 823 ],
4th day: after work= 16 gold coins [ 1624 ], 5
th day: after work= 32 coins [ 3225 ]
LEARNING OUTCOMES
What is an
index? Students should be able to:
To introduce indices
To write numbers in the base
index form and vice versa.

60
2. The King fainted because of the amount of gold coins that he has to give after the 30days
beginning from the day of their conversation i.e. 1,073,741,823 gold coins
The girl used the concept of base index to formulate her request!!!!!! A very smart girl.
andedform
xxxxx
exp
4
Example 3. 1
Write the following in base-index form
a. cccc b. 55444
Solution:
a. 4ccccc [4 factors so the index is 4]
b. 23 5455444
Example 3.2
Write in expanded form:
a. 52h b.
25 43 fg
Solution:
a. hhhhhh 22 5
b. ffgggggfg 4343 25
1. Write in base-index form
a. qqqqqq b. yyy 6 c. zzaaa 32
d. 2222 e. 555 f. 4444333
g. pqpqpp h. ghghghg 43
2. Write in expanded form
a. 6x b. 42d c. 73 43 an
d. 55 63 ee e. 3232 4329 rrrr
Index
Base
Exponent: another
name for index 4x Is called the power of x
Exercise 3.1
61
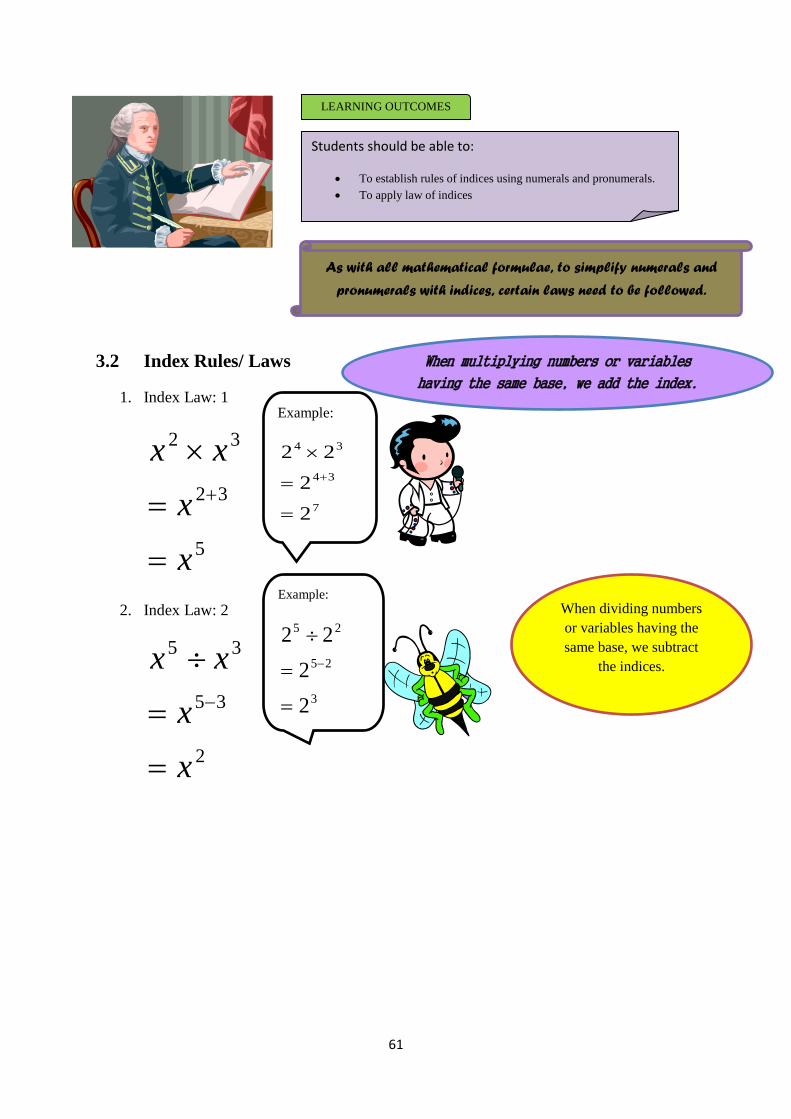
3.2 Index Rules/ Laws
1. Index Law: 1
5
32
32
x
x
xx
2. Index Law: 2
2
35
35
x
x
xx
LEARNING OUTCOMES
As with all mathematical formulae, to simplify numerals and
pronumerals with indices, certain laws need to be followed.
Example:
7
34
34
2
2
22
When multiplying numbers or variables
having the same base, we add the index.
Example:
3
25
25
2
2
22
When dividing numbers
or variables having the
same base, we subtract
the indices.
Students should be able to:
To establish rules of indices using numerals and pronumerals.
To apply law of indices

62
3. Index Law: 3
8
42
42
x
x
x
4. Index Law: 4
1
0
x
5. Index Law: 5
2
2
1
x
x
Example:
12
43
43
2
2
2
Where the index form is
raised to another power,
the indices are multiplied.
Example:
1
20
Any number or
variable raised to
the power of zero
is equal to 1.
Example:
8
1
222
1
2
1
2
3
3
A negative
index will
give a
fraction when
simplified.

63
Simplify. Your answer should contain only positive exponents.
Indices in real life situations
Most people who use Exponents are Economists, Bankers, Financial Advisors, Insurance
Risk Assessors, Biologists, Engineers, Computer Programmers, Chemists, Physicists,
Geographers, Sound Engineers, Statisticians, Mathematicians, Geologists and many other
professions
Exponents are fundamental, especially in Base 2 and Base 16, as well as in Physics and
Electronics formulas involved in Computing.
Source: http://passyworldofmathematics.com/exponents-in-the-real-world/
There has been an Exponential increase in the speed and power of computers over recent
years, and by around 2030 computing power is predicted to match that of the human brain.
1. a 2 2. w 3 4
3. k 6 k 3 4. p 2 3
5. r 6 5 6. t 7 7
7. 8. y 0
9. ( g 5 ) 2 10. ( 23 ) 2
11. 2 -3 12. 3 -2
Exercise 3.2

64
Exponents are critically important in modern Internet based Sales and Marketing,

65
Exponents are important in Investing and Finance.
Compound Interest also works against people with a Credit Card debt they do not pay off,
because the debt grows faster and faster each billing period and can quickly become out of
control.
Exponents are the basis of “Demographics” (Population Growth)

66
Consumer Credit Debt has increased over recent years to record high levels.
Exponents are also part of Food Technology and Microbiology.

67
Virus Illness, (as well as many email and computer viruses), can spread at ever increasing
rates causing major widespread infected areas.
This happens the same way that Viral Marketing branches out in ever increasingly wide
branches of more and more people passing something onto more and more other people.
In explosions we get an uncontrolled massively increasing output of energy and force within
a very short time period.
Picture this as a very steep exponential graph, compared to a burning match giving out energy
in a fairly flat straight line graph.

68
Exponential Growth
The situations we have been considering so far involve “Exponential Growth”. The equations
for graphs of these situations contain exponents, and this results in the graph starting off
slow, but then increasing very rapidly.
Eg. Think of Square Numbers and how they quickly get bigger and bigger:
1 4 9 16 25 36 49 64 81 100 121 132 etc . It only takes us nine square numbers to reach 100.
Exponential Growth situations when graphed look like the diagram below.
The opposite of “Exponential Growth”, is when we apply exponents to fractions which
results in “Exponential Decay”.
Exponential Decay
Using negative power values results in fractions, and when these fractions have exponents
applied to them we get “Decay”.
In a “Decay” process the amount involved drops off fairly quickly at the start, but then the
drop off becomes slower and slower. A typical Exponential Decay graph looks like this:

69
A fun way to make an Exponential decay graph is to take a pack of M&M‟s or Skittles and
keep pouring them out of a cup, but each time removing any candies which land with the
letter side showing.
Exponential Decay – Real Life Examples
Some examples of Exponential Decay in the real world are the following.

70
Exponential Decay and Half Life
Many harmful materials, especially radioactive waste, take a very long time to break down to
safe levels in the environment. This is because these materials undergo exponential decay,
and even a small amount of the material still remaining can be harmful.
Exponential Scales
The Richter Scale is used to measure how powerful earthquakes are.
The actual energy from each quake is a power of 10, but on the scale we simply take the
index value of 1, 2, 3, 4, etc rather than the full exponent quantity.
This means that a Richter Scale 6 earthquake is actually 10 times stronger than a Richter
Scale 5 quake. (Eg. 1000000 vs 100000).
Likewise, a Richter Scale 7 earthquake is actually 100 times stronger than a Richter Scale 5
quake. (Eg. 10000000 vs 100000).
The pH Scale for measuring the Acidity of materials is also created by taking the Power
Values from measured powers of 10 acid concentration values.

71
1. Evaluate the following using the index laws. Leave your answers in base-index form.
a. 223 b. 46 33 c. 323
d. 55 66 e. 42 44 d. 125
2. Simplify the following
a. 23 26 xx b. bb 318 3 c. 52 53 abba
d. 632
854
4
12
zyx
zyx e.
jn
hl
lh
jn2
8
62
43
6
10
5
18 f.
55
3
2
35
12
2
3
6
sr
gf
sr
gf
g.
yx
yx3
323
12
2
xy
yx
3
4 32
3. Write the following in base-index form using the number in brackets as the base.
a. 64 (4) b. 125 (5) c. 2401 (7)
d. 1/8 (2) e. 1/81 (3) f. 1/6 (6)
4. Evaluate the following
a. 32 24 b. 536 33 c. 3224 545
d. 020 52 xyx e. )100(7 0 yx 0
Exercise 3.3

72
GLOSSARY 6 Compound interest When the interest rate is applied to the original principal and any
accumulated interest
1 Exponent A number placed above and to the right of another number to show
that it has been raised to a power
5 Exponential Decay
It occurs when a population decreases at a consistent rate over time. For exponential decay, the total value decreases but the proportion that leaves remains constant over time
2 Exponential function Use to model a relationship in which a constant change in the
independent variable gives the same proportional change (i.e. percentage increase or decrease) in the dependent variable.
4 Exponential Growth It is a growth that increases at a consistent rate, and it is a
common occurrence in everyday life
3 Half Life The amount of time it takes for the amount of the substance to
diminish by half
9 Index (exponent, power) The index of a number says how many times to use the number in a
multiplication
7 Numeral A symbol used to represent a number
8 Pro - numeral A letter that is used to represent a number (or numeral) in a
problem

73
STRAND 4 GEOMETRY
HISTORY OF GEOMETRY
Geometry's was originated about 3,000 BC in ancient Egypt. Egyptians used an early
stage of geometry in several ways, including the surveying of land, construction of
pyramids, and astronomy. Around 2,900 BC, ancient Egyptians began using their
knowledge to construct pyramids with four triangular faces and a square base.
The next great advancement in geometry came from Euclid in 300 BC when he wrote a text titled 'Elements.' In this text, Euclid presented an ideal form in which propositions could be proven through a small set of statements that were accepted as true. In fact, Euclid was able to derive a great portion of planar geometry from just the first five postulates in the 'Elements.' These postulates are listed below:
A straight line segment can be drawn joining any two points.
A straight line segment can be drawn joining any two points.
Given any straight line segment, a circle can be drawn having the segment as radius and one endpoint as center.
All right angles are congruent.
If two lines are drawn which intersect a third line in such a way that the sum of the inner angles on one side is less than two right angles, then the two lines must intersect each other on that side if extended infinitely. Euclid's fifth postulate is also known as the parallel postulate.
The next advancement in the field of geometry occurred in the 17th century when René Descartes discovered coordinate geometry. The creation of coordinate geometry opened the doors to the development of calculus and physics.
In the 19th century, Carl Friedrich Gauss, Nikolai Lobachevsky, and János Bolyai formally discovered non-Euclidean geometry. In this kind of geometry, four of Euclid's first five postulates remained consistent, but the idea that parallel lines do not meet did not stay true. This idea is a driving force behind elliptical geometry and hyperbolic geometry.
Source: http://www.wyzant.com/resources/lessons/math/geometry/introduction/history_of_geometry
74
TRIGONOMETRY
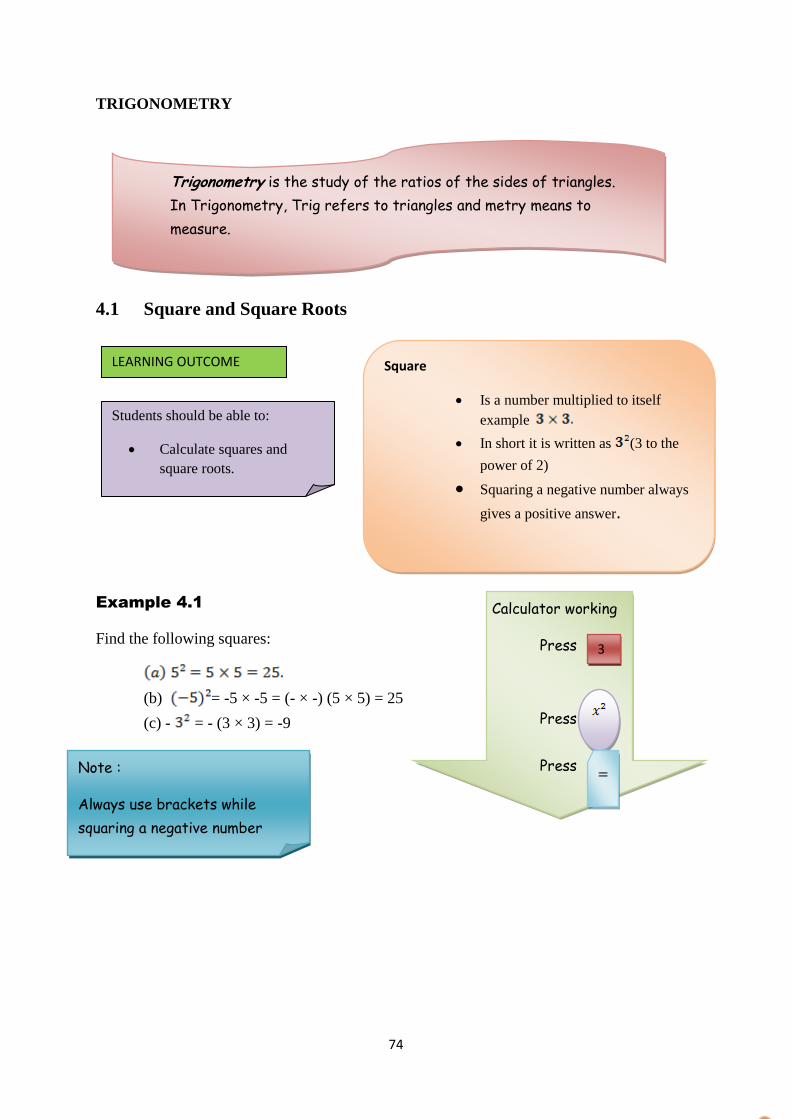
4.1 Square and Square Roots
Example 4.1
Find the following squares:
(b) = -5 × -5 = (- × -) (5 × 5) = 25
(c) - = - (3 × 3) = -9
Trigonometry is the study of the ratios of the sides of triangles.
In Trigonometry, Trig refers to triangles and metry means to
measure.
Square
Is a number multiplied to itself
example
In short it is written as (3 to the
power of 2)
Squaring a negative number always
gives a positive answer.
A number multiplied by itself
Example
In short it is written as ( 3 to the power
of 2).
Squaring a negative number always gives a
positive answer A number multiplied by
itself
Example
In short it is written as ( 3 to the power
of 2).
Squaring a negative number always gives a positive
answer
Calculator working
Press
Press
Press
3
Note :
Always use brackets while
squaring a negative number
LEARNING OUTCOME
Students should be able to:
Calculate squares and
square roots.

75
Example 4.2
Find
Solution
Since 25 = 5 x 5
means =
We know that 25 = 5 × 5 so is 5.
Perfect Square
Are squares of real numbers example 1, 4, 9, 16, 25, 36, 49, 64, 81……
Square roots ( )
A square root is the opposite of squaring a number.
A square root of a number is a value that can be multiplied by it to give the
original answer example
Square ( )
3 9
Square root ( )
Calculator
Press
Press
Press
25
76
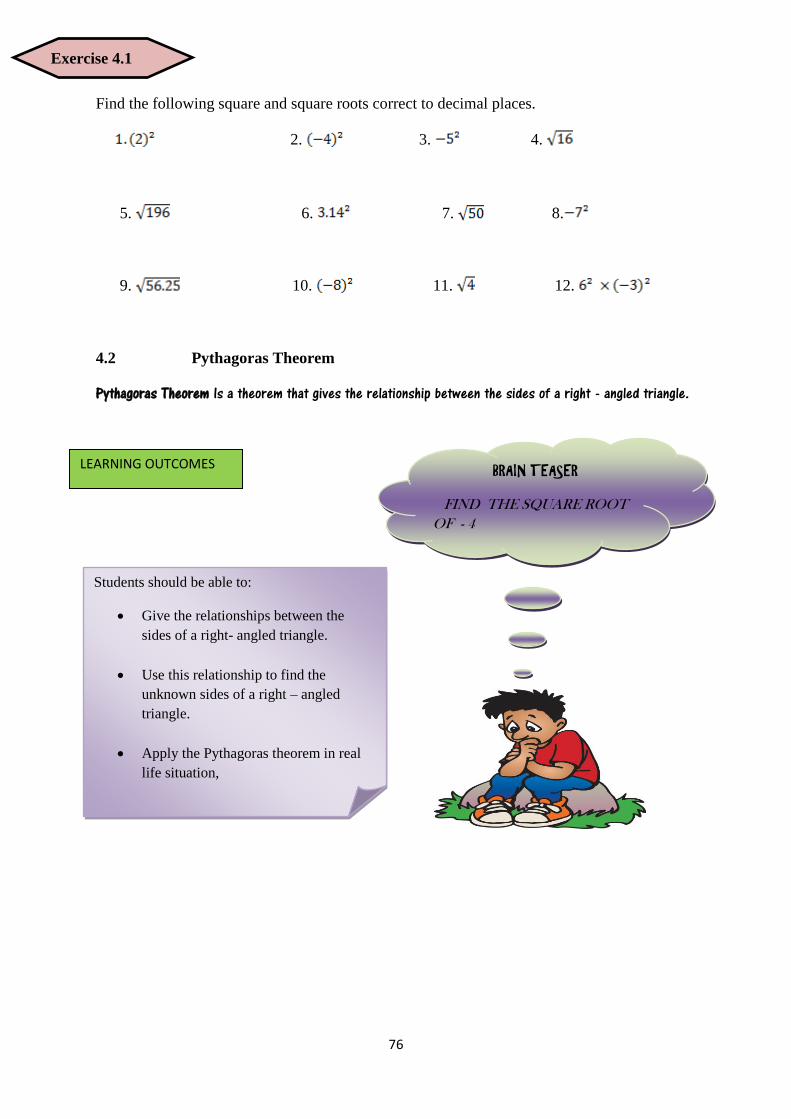
Find the following square and square roots correct to decimal places.
2. 3. 4.
5. 6. 7. 8.
9. 10. 11. 12.
4.2 Pythagoras Theorem
Pythagoras Theorem Is a theorem that gives the relationship between the sides of a right - angled triangle.
BRAIN TEASER
FIND THE SQUARE ROOT
OF - 4
LEARNING OUTCOMES
Exercise 4.1
Students should be able to:
Give the relationships between the
sides of a right- angled triangle.
Use this relationship to find the
unknown sides of a right – angled
triangle.
Apply the Pythagoras theorem in real
life situation,

77
Example one
Proof 1
History
Over 2000 years ago there was an amazing discovery made by Pythagoras’s about triangles.
“When the triangle has a right angle (90˚) and squares are made on each of the three sides, then the
biggest square has the exact same area as the other two squares put together”
The relationship discovered by Pythagoras’s is called the Pythagoras’s theorem and can be
written as a2 + b2 = c2.
+ =
Note:
1.In this case c is the longest side of the triangle and is called the hypotenuse, a
and b are the other two sides of the triangle. The hypotenuse is the side opposite
the right angle.
2. Given any two sides of the right angled triangle the pythagoras thoerem can be
used to find the length of the unknown side.
3. The theorem can also be used to determine whether a triangle is a right angled
triangle or not.

78
Proof 2
Source:
http://www.google.com/url?sa=t&rct=j&q=&esrc=s&source=web&cd=2&ved=0CCQQFjAB&url=http%3A%2F%2Fwww.
math.unl.edu%2F~sdunbar1%2FExperimentationCR%2FLessons%2FGeometry%2FPythagorean%2FPythagoreanTheorem.
ppt&ei=bdq9VOauCIXOmwWE9IGIAg&usg=AFQjCNEputeM7MH3CwS9cNOOYj1TmwLRqQ

79
Example 4.3
(c) A triangle has lengths 8, 15 and 16. Is it a right angled triangle?
Calculate the remaining side
(b)
Solution
a2 + b2 = c2
92 + b2 = 152
81 + b2 = 225 Taking 81
away from both sides gives
81 + b² - 81 = 225 - 81
b2 = 144
b = √144
b = 12
(a) Find the unknown sides in the triangles given below.
Solution
a2 + b2 = c2
52 + 122 = x2
25 + 144 = x2
169 = x2
x2 = 169
x =
x = 13

80
Solution
a2 + b2 = c2
82 + 15²= 289
8, 15, 16
162 = 256
c since a2 + b2 is not equal to c2 (a² + b² ≠ c²)
a b therefore the given triangle is not a
right - angled triangle.
Example 4.4
Show that the triangle given below is a right – angled triangle.
(a)
Show that a2
+ b2 = c
2
Note: assign 26 to c
since c is the longest side
of the triangle.
a = 10 b = 24 c = 26
102 + 24
2 = 676
262
= 676
Since a2
+ b2 = c
2 is
satisfied
Therefore the given
triangle is a right –
angled triangle.

81
Example 4.5
A 3m ladder stands on a horizontal ground and reaches 2.8m up a vertical wall. How far is
the foot of the ladder from the base of the wall?
Interpret and illustrate the question in mathematical terms.
Solution
Using the Pythagoras theorem a² + b² = c² to calculate the value of x.
Let a = x, c = 3m and b = 2.8m.
a² + b² = c²
x² + (2.8)² = 3²
x² + 7.84 = 9
x² + 7.84 – 7.84 = 9 – 7.84
x² = 1.16
x =
x = 1.08m

82
1. Find the missing sides
(a) (b)
2. The side lengths of various triangles are given. Determine which ones are right angled
triangles.
(a) {6, 8, 10}
(b) {3, 5, 6}
(c) { , , }
3. Town B is 8 miles north and 17 miles west of town A. How far are the two towns?
N
W E
A rectangular field is 125 m long and the length of one diagonal of the field is 150m. What is
is the width of the field.
A 8m ladder is leaned against the side of a wall. How high does the ladder reach if its base is
is 3m away from the building.
Exercise 4.2

83
4.3 Trigonometric Functions
4.3.1 Naming the Sides of a Right Angled Triangle
In trigonometry the Greek letter Ѳ (theta) is used as the name of an angle.
Using Ѳ the sides of the triangle can be named.
For example
The sides of the triangle can be labelled as a, b and c. Side a is opposite of Ѳ, side b adjacent
to Ѳ and side c is the hypotenuse (the longest side) opposite the right angle. From this, 3
functions can be introduced.
In short SOH, CAH, TOA can be used.
NOTE : Sin Ѳ † Cos Ѳ = Tan Ѳ
Students should be able to:
Describing the three basic trigonometric functions.
Calculating sine, cosine and tangent values of theta and vice versa.
Use SOH, CAH, TOA to find unknown side and angle of right angle triangle.
4. A rectangular field is 125 m long and the length of one diagonal of the field is
150m. What is the width of the field?
5. A 8m ladder is leaned against the side of a wall. How high does the ladder reach if
reach if its base is 3m away from the building?
6. Linda is mountain climbing with Allie and has just climbed a 16-metre vertical rock
rock face. Allie is standing 12 metres away from the bottom of the cliff, looking up at
up at Linda. How far away are Linda and Allie?
LEARNING OUTCOMES

84
4.3.2 Using A Calculator
A calculator can be used to find the values of the trigonometric ratios sin, cos and tan
for the given angle where the angle is measured in degrees.
In the same way if the trigonometric ratios are given then the angle can also be found
using the inverse function.
Example 4.6
Given below is a unit circle. A unit circle is circle of radius 1 unit. Θ is the angle marked in red
Questions
(i) What is the length of the hypotenuse?
(ii) Find Cos Ѳ
(iii) Find Sin Ѳθ
(iv) Find Tan Ѳ
(i) The size of the hypotenuse is I since it is the radius of a unit circle.
(ii) Cos Ѳ = , so Cos Ѳ = =
(iii) Sin Ѳ = = =
(iv) Tan θ = =
(v)
(vi) , Sin Ѳ = y /1 = y
(vii) Tan Ѳ = O/A or Sin Ѳ/ Cos Ѳ = y/x.
Sin θ and Cos θ are the x and y coordinates of the point (1, 0) as it is rotated by θ degrees about the
origin

85
Example 4.7
1.Evaluate the following 2. Find the value of Ѳ
(a) Sin 60˚ (a) Cos = 0.54
(b) Tan 34˚ (b) Sin = 0.76
(c) Cos 124˚ (c ) Tan = 0.45
3. The diagram given below shows a unit circle.
(i) Find the lengths of x and y. (ii) Write coordinates of A.
(iii) Use your calculator to find Sin 60 and Cos 60. Is it the same as the x and y coordinates of
point A?
(iv) Find tan 60 and compare it with sin 60
Exercise 4.3
Example Two
Find sin Ѳ = 0.66
Solution
Press shift
Press sin
Press 0.66 =
(0.66) = 41.30 (2 dp)

86
4.3.3 Applications of SOH, CAH, TOA
Example 4.8
Find the length of the side marked x in the
right - angled triangle given below
Step three
Ѳ= 55 ⁰ O = 3m H - x
x sin 55o = 3 ( multyplying x on both sides)
(dividing by sin 55 on both
sides)
x = 3.66m (2 dp)
Step one
Identify the given sides of the triangle.
Step two
Determine the trig function to be used
SOH CAH or TOA
Since O and H are given we use SOH
LEARNING OUTCOMES
Students should be able to use
SOHCAHTOA to calculate the:
Unknown side of a right
angle triangle
Unknown angle of a right
angle triangle
SOH CAH TOA CAN BE
USED TO FIND THE
UNKNOWN SIDE AND
ANGLES OF A RIGHT
ANGLED TRIANGLE

87
Example 4.9
Find the side marked x in the right - angled
triangle given below
Step two
Identify the trig function SOH CAH or
TOA
Since the opposite and adjacent are given
TOA is used.
Example 4.10
A right - angled triangle is given below
Step one
Identify the sides and angles given.
Step three
=
=
( multiplying by x on both
sides)
Step one
Identify the sides and the angles.
Hypotenuse -18cm
adjacent

88
Adjacent – x cm θ= 30⁰
Step two
Determine the trig function to use
Since a and h are given
CAH is used.
Example 4.11
For the right - angled triangle given, find
angle x
Step two
Determine the trig function to use
Since o and a are given
TOA is used.
Since the angle is the unknown we take
on both sides. = 36.87
Step three
Step one
Identify the sides and the angles.
= x, opposite – 3cm, adjacent – 4cm
Note: while solving this types of problems ensure
that the calculator is in the degree mode.
89
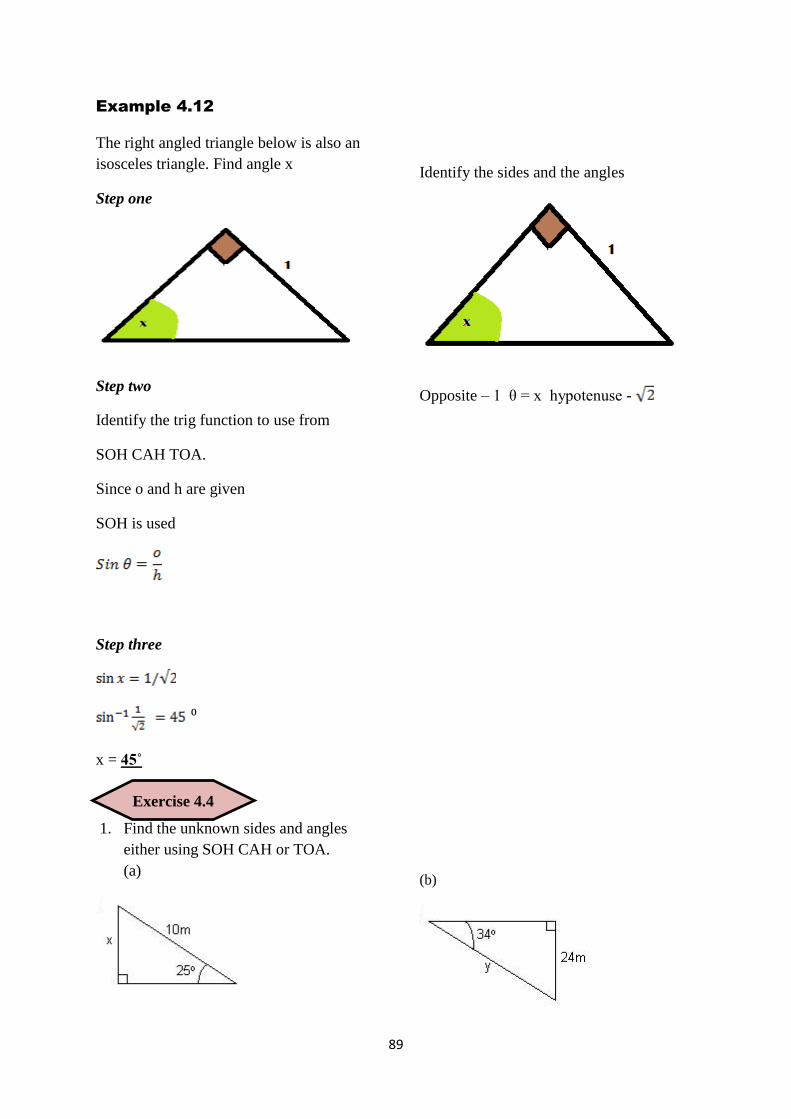
Example 4.12
The right angled triangle below is also an
isosceles triangle. Find angle x
Step one
Step two
Identify the trig function to use from
SOH CAH TOA.
Since o and h are given
SOH is used
Step three
⁰
x = 45˚
1. Find the unknown sides and angles
either using SOH CAH or TOA.
(a)
Identify the sides and the angles
Opposite – 1 θ = x hypotenuse -
(b)
Exercise 4.4

90
(c )
(d)
Trignometric Word Problems
(e)
(f )
SOH CAH TOA
can be used to
solve lots of real
life

91
Example 4.13
A ladder leaning against a wall makes 75 ⁰
angle with the ground. If the ladder is 5m
tall, how far is the base of the ladder from
the wall of the house?
A diagramatic representation of the
problem is given below.
Solution
Step one
Take out the triangle right angled triangle
formed
= 75 ⁰ adjacent – x hypotenuse- 5m
Step two
Identify the sides and angles given
Step three
Identify the trig function to use
Since a and h are given
CAH is used
Step four
Ѳ = 75 ⁰, a = x m, h = 5m
Hence the ladder is 1.29m away from the
wall.

92
Example 4.14
An aeroplane flies 250 km west, but the
wind blows it 60 km north
What is the compass bearing of the plane
from the starting point?
Step one Step two
compute angle x first
= x opposite – 60 km adjacent – 250km
Use TOA since opposite and adjacent are given
Step three
Total bearing = 90 +180+x
90+180+13.5 = 283.5
93
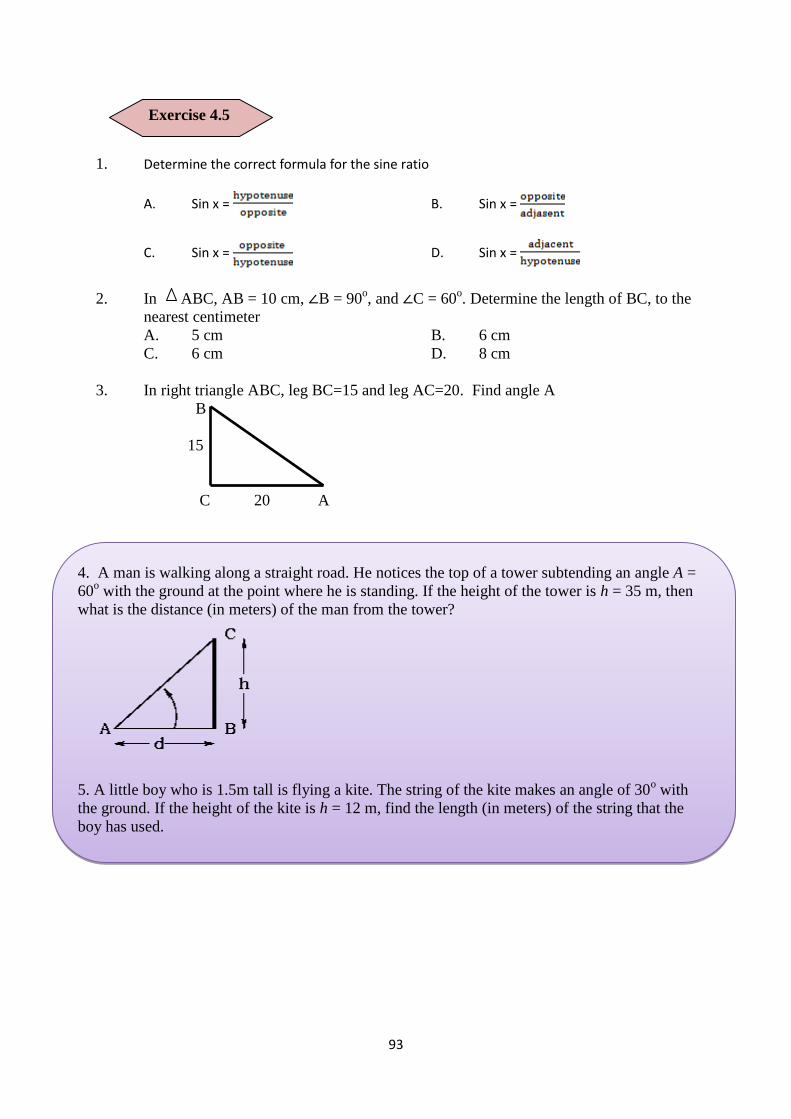
1. Determine the correct formula for the sine ratio
A. Sin x = B. Sin x =
C. Sin x = D. Sin x =
2. In ABC, AB = 10 cm, ∠B = 90o, and ∠C = 60
o. Determine the length of BC, to the
nearest centimeter
A. 5 cm B. 6 cm
C. 6 cm D. 8 cm
3. In right triangle ABC, leg BC=15 and leg AC=20. Find angle A
B
15
C 20 A
4. A man is walking along a straight road. He notices the top of a tower subtending an angle A =
60o with the ground at the point where he is standing. If the height of the tower is h = 35 m, then
what is the distance (in meters) of the man from the tower?
5. A little boy who is 1.5m tall is flying a kite. The string of the kite makes an angle of 30o with
the ground. If the height of the kite is h = 12 m, find the length (in meters) of the string that the
boy has used.
Exercise 4.5
94
4.3.4 Graphs of Trigonometric Functions
LEARNING OUTCOMES
Students should be able to:
Sketch the trigonometric
graphs.
Identify the graphs of sine,
cosine and tangent

95
Applications of the Trignometric Graphs
Music is an integral part of life of most people. Although the kind of music they prefer differs.
All music is the effect of the sound waves on the ears.
No matter what vibrating object is causing the sound wave the frequency of the wave (that is the number of
waves per second) creates a sensation that is called the pitch of sound.
Sound is just one of the many physical entities that are transmitted by waves. Light , radio, television, X-rays, and
microwaves are the others. The trigonometric Graphs that we study in this topic provide the mathematical basis
for the study of waves.
The Sine Graph
The Sine Graph can be plotted by using the unit circle .
Recall:
A unit circle is a circle of radius one unit with its centre at the origin.

96
y = sin θ is known as the sine function.
Using the unit circle, we can plot the values of y against the corresponding values of θ.
The graph of y = sin θ, for 0˚ ≤ θ≤ 360˚ obtained is as shown:
Properties of the Sine function:
The sine function forms a wave that starts from the origin
sin θ= 0 when θ = 0˚, 180˚, 360˚.
Maximum value of sin θ is 1 when θ= 90˚. Minimum value of sin θ is –1 when θ = 270˚. So, the
range of values of sin θ is –1 ≤ sin θ≤ 1.
The Cosine Graph
y = Cos θ is known as the cosine function.
Using the unit circle, the values of y against the corresponding values of θ can be plotted.
The graph of y = cos θ, for 0˚ ≤ θ≤ 360˚ obtained is as shown:
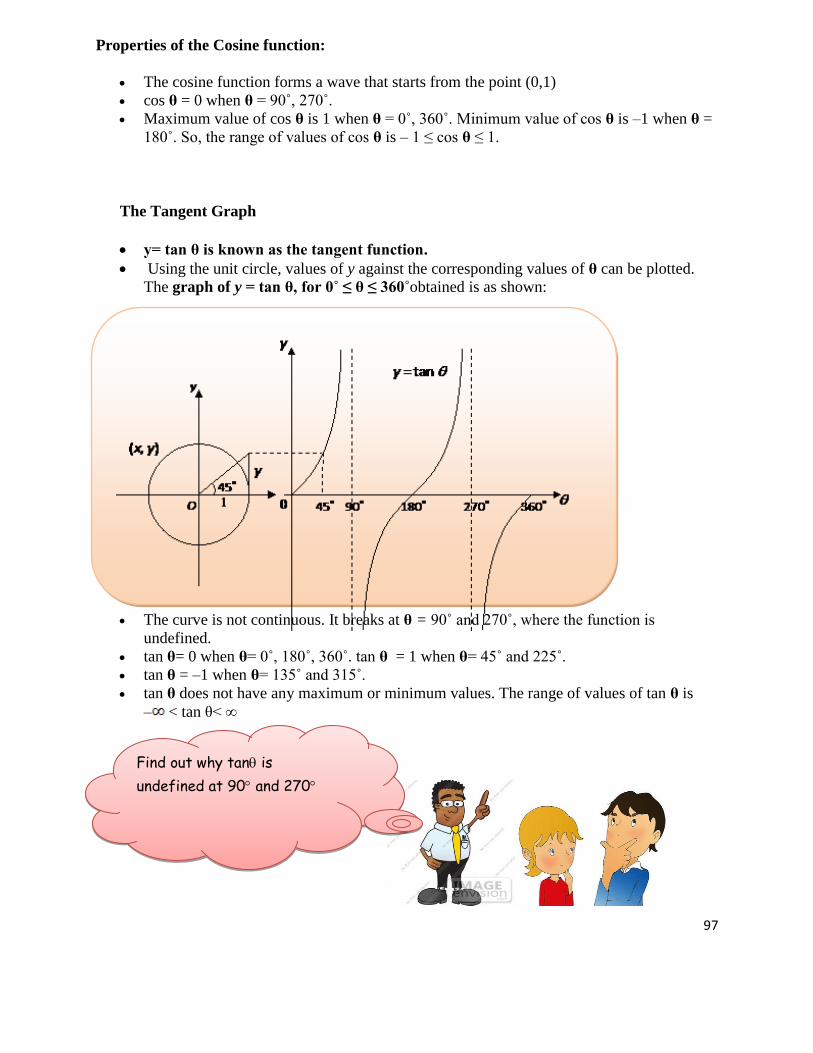
97
Properties of the Cosine function:
The cosine function forms a wave that starts from the point (0,1)
cos θ = 0 when θ = 90˚, 270˚.
Maximum value of cos θ is 1 when θ = 0˚, 360˚. Minimum value of cos θ is –1 when θ =
180˚. So, the range of values of cos θ is – 1 ≤ cos θ ≤ 1.
The Tangent Graph
y= tan θ is known as the tangent function.
Using the unit circle, values of y against the corresponding values of θ can be plotted.
The graph of y = tan θ, for 0˚ ≤ θ ≤ 360˚obtained is as shown:
The curve is not continuous. It breaks at θ = 90˚ and 270˚, where the function is
undefined.
tan θ= 0 when θ= 0˚, 180˚, 360˚. tan θ = 1 when θ= 45˚ and 225˚.
tan θ = –1 when θ= 135˚ and 315˚.
tan θ does not have any maximum or minimum values. The range of values of tan θ is
– < tan θ< ∞
Find out why tan is
undefined at 90 and 270

98
4.3.5 Proper Application of Clinometer
1. The diagram shows a graph of y = cos x for0˚ ≤ x ≤ 360˚, determine the values of
p, q and r.
2. Sketch the graph of y = tan x for 0˚ ≤ x ≤ 360˚ by setting up a table of values.
x 0 45 90 135 180 225 270 315 360
tan x
3.The diagram shows a graph of y = sin x for0˚ ≤ x ≤ 360˚, determine the
values of p, q and r.
4. Sketch the graph of y = cos x for 0˚ ≤ x ≤ 360˚ by setting up a table of values.
x 0 45 90 135 180 225 270 315 360
cos x
5. Sketch the graph of y = sin x for 0˚ ≤ x ≤ 360˚ by setting up a table of values.
x 0 45 90 135 180 225 270 315 360
sin x
Exercise 4.6
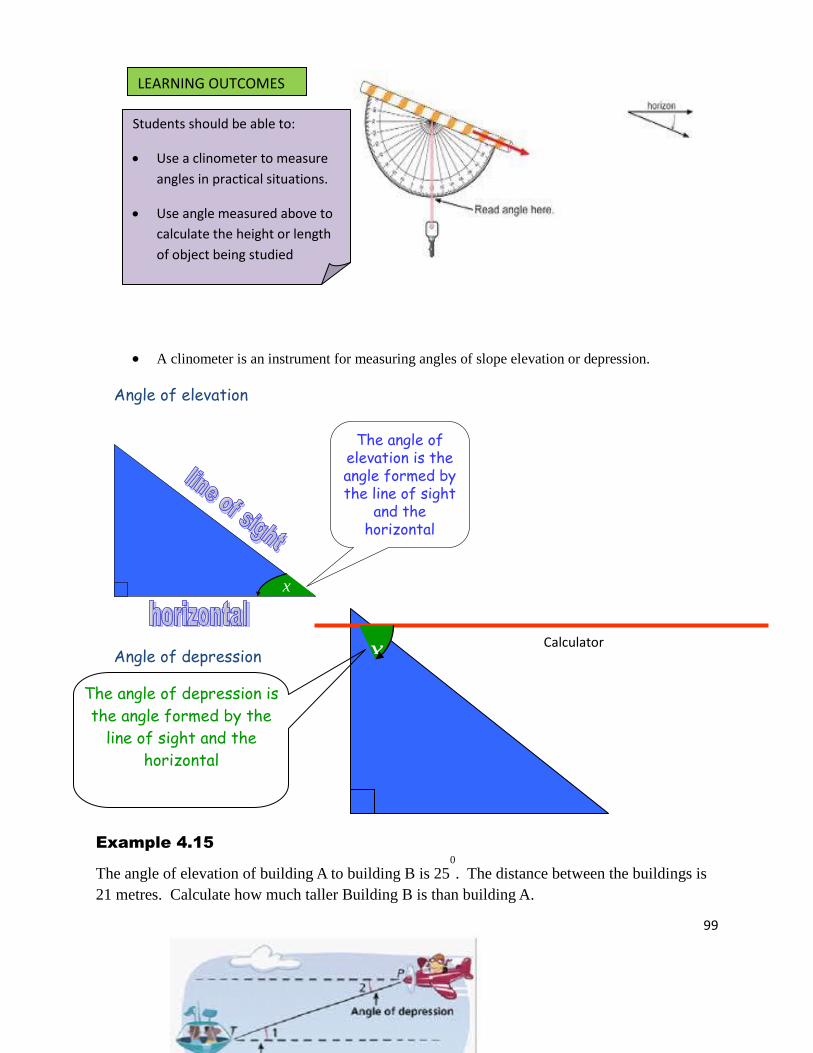
99
Example 4.15
The angle of elevation of building A to building B is 250
. The distance between the buildings is
21 metres. Calculate how much taller Building B is than building A.
A clinometer is an instrument for measuring angles of slope elevation or depression.
Angle of elevation
x
The angle of elevation is the angle formed by the line of sight
and the horizontal
Angle of depression
Example
Calculator
steps
Press
√
Press
Press
=
x
The angle of depression is
the angle formed by the line of sight and the
horizontal
LEARNING OUTCOMES
Students should be able to:
Use a clinometer to measure
angles in practical situations.
Use angle measured above to
calculate the height or length
of object being studied
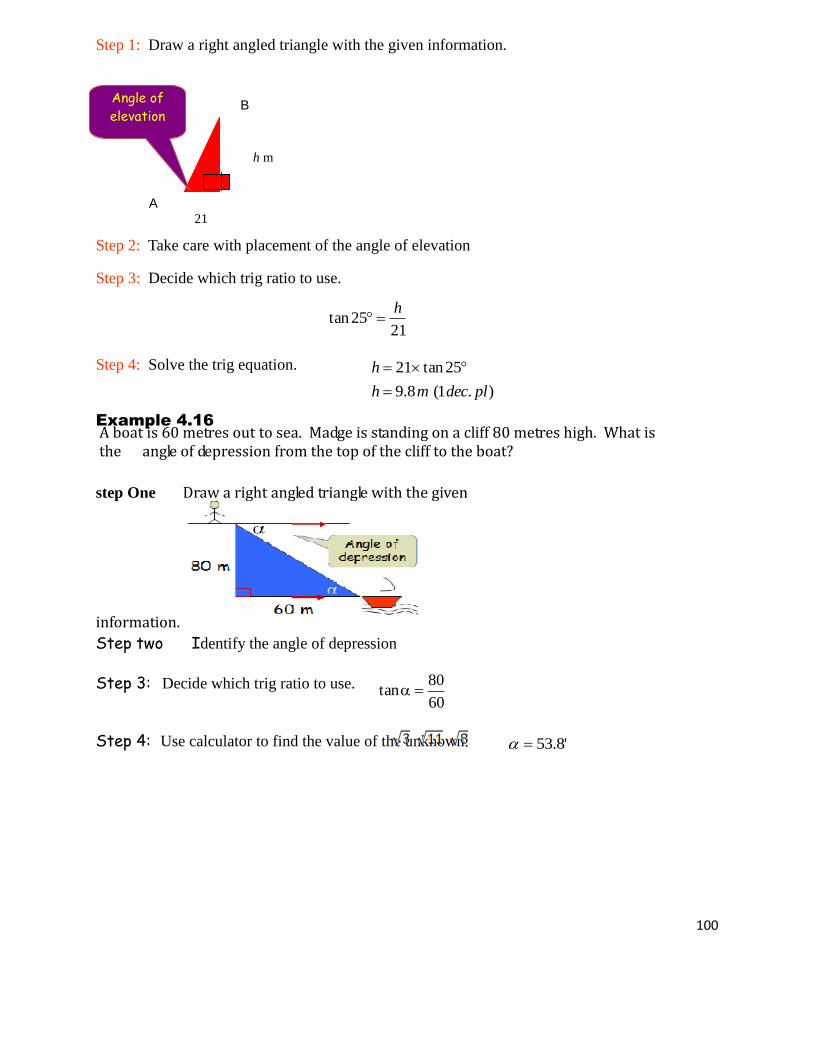
100
Step 1: Draw a right angled triangle with the given information.
Step 2: Take care with placement of the angle of elevation
Step 3: Decide which trig ratio to use.
Step 4: Solve the trig equation.
Example 4.16
step One Draw a right angled triangle with the given
information.
Step two Identify the angle of depression
Step 3: Decide which trig ratio to use.
Step 4: Use calculator to find the value of the unknown.
2. The side lengths of various triangles are given. Determine which ones are right angled
triangles.
(a) {6, 8, 10}
(b) {3, 5, 6}
(c) { , , }
3. Town B is 8 miles north and 17 miles west of town A. How far are the two towns?
N
W E
A rectangular field is 125 m long and the length of one diagonal of the field is 150m. What is
the width of the field.
A 8m ladder is leaned against the side of a wall. How high does the ladder reach if its base is
3m away from the building.
4. A rectangular field is 125 m long and the length of one diagonal of the field is
150m. What is the width of the field?
5. A 8m ladder is leaned against the side of a wall. How high does the ladder reach if
its base is 3m away from the building?
6. Linda is mountain climbing with Allie and has just climbed a 16-metre vertical rock
face. Allie is standing 12 metres away from the bottom of the cliff, looking up at
Linda. How far away are Linda and Allie?
2125tan
h
).1(8.9
25tan21
pldecmh
h
A boat is 60 metres out to sea. Madge is standing on a cliff 80 metres high. What is the angle of depression from the top of the cliff to the boat?
60
80tan
'8.53
B
A
21
h m
Angle of
elevation

101
Exercise 4.7
1. Neil sees a rocket at an angle of elevation of 11 degrees. If Neil is located 5 miles from the
rocket's launchpad, how high is the rocket? Round your answer to the nearest hundredth.
2. A boat is 500 meters from the base of a cliff. Jackie, who is sitting in the boat, notices that the
angle of elevation to the top of the cliff is 32°. How high is the cliff? (Give your answer to the
nearest metre).
3. Marty is standing on level ground when he sees a plane directly overhead. The angle of
elevation of the plane after it has travelled 25 km is 200
. Calculate the altitude of the plane at this
time
4. Kate and Petra are on opposite sides of a tree. The angle of elevation to the top of the tree from Kate
is 45o and from Petra is 65
o. If the tree is 5 m tall, who is closer to the tree, Kate or Petra

102
Let‟s make your own clinometer. To make your clinometer you need the following:
1. A drinking straw 2. A protractor 3. Some adhesive 4. A small mass
5. string
Use the adhesive to attach the straw to the protractor.
2. Let‟s measure some inaccessible heights in your school.
(a) You must choose your partner.
(b) Obtain a measuring tape and measure each other‟s height up to the eye level only.
(c) Use the measuring tape to find an appropriate distance back from the object you
are finding the height of.
(d) Hold the clinometer level along the horizontal line and adjust the angle of the
straw to sight the top of the object.
Example

103
4.3.6 Trigonometry in Real Life Situations
Results
Object name Height of person‟s eyes
From ground level
Angle of
elevation
Distance from base Height of object
(show all working)
1. If you were to measure the height of a street light would you use a clinometer .Explain why
or why not?
2. Jonetani is standing 15m from the base of a building and using a clinometer he measures
the angle of elevation to be 37. If his eyes are 1.65m above the ground, find the height of
the building.
Exercise 4.8

104
Trigonometry, out of all other topics is Mathematics is the most practical. It is almost used
everywhere in our daily lives.
Applications of trigonometry include its study in physics, engineering and chemistry. Though
trigonometry tables were created over two thousand years ago for computations in astronomy.
There are numerous jobs that require trigonometry of which some are shown below.
LEARNING OUTCOMES
Students should be able to:
Identify some career
opportunities related to
trigonometry

105
Trigonometry in real life situations
Trigonometry is commonly used in finding the height of towers and mountains.
It is used in navigation to find the distance of the shore from a point in the sea.
It is used in oceanography in calculating the height of tides in oceans

106
It is used in finding the distance between celestial bodies
The sine and cosine functions are fundamental to the theory of periodic functions such as
those that describe sound and light waves.
Architects use trigonometry to calculate structural load, roof slopes, ground surfaces and
many other aspects, including sun shading and light angles
Source: http://malini-math.blogspot.com/2011/08/applications-of-trigonometry-in-real.html

107
4.4 Constructions
4.4.1 Construct Angles
Students will be able to:
4.4.1.1 Constructing a 30o angle
1. Draw a line PQ that will be one leg of the angle
2. With the compass point on P, set it on any width between P and Q
3. Draw an arc crossing PQ at S
4. Move the compass point to S and draw another arc crossing the first one at T
5. Move to T and make an arc crossing the previous one , labelling the intersection point R
6. Draw a straight line from P through R
7. Angle RPQ = 30O
Steps
LEARNING OUTCOMES
Students will be able to:
Construct various special angles
Construct angle bisector, midpoint and mediator of line segment
Construct centers of triangles using ruler and compass

108
4.4.1.2 Constructing a 45o angle
1. Draw a line PQ that will be one leg of the angle
2. With the compass point on P, set it on any width of more than half the length of PQ
3. From points P and Q, draw arcs above and below line PQ
4. Draw a straight line joinning the arc intersections. The intersection of the two straight
lines is the midpoint of line PQ.
5. From the midpoint of PQ, set the compass width to point P
6. Draw an arc across the perpendicular line and label it Point C
7. Draw line PC
8. Angle PCQ = 45O
4.4.1.3 Constructing a 60o angle
1. Draw a line PQ that will be one leg of the angle
2. With the compass point on P, set its width to about half of PQ
3. Draw an arc from above point P and crossing PQ
4. Place the compass point to where the arc crosses PQ, draw an arc above PQ and ensure
that the two arcs cross each other. Label the point of intersection R
5. Draw straight line PR
6. Angle RPQ = 60O
Steps

109
4.4.1.4 Constructing a 90o angle
1. Draw a horizontal straight line and label one end A
2. Mark point D somewhere above and between the end points of the line drawn
3. Place the compass point on D and sets its width to point A
4. Draw an arc across the line to above point A
5. Draw a diameter through D starting from where the arc crosses the line
6. Draw a stright line from A to the other end of the diameter
7 The angle between the two straight lines is 90O
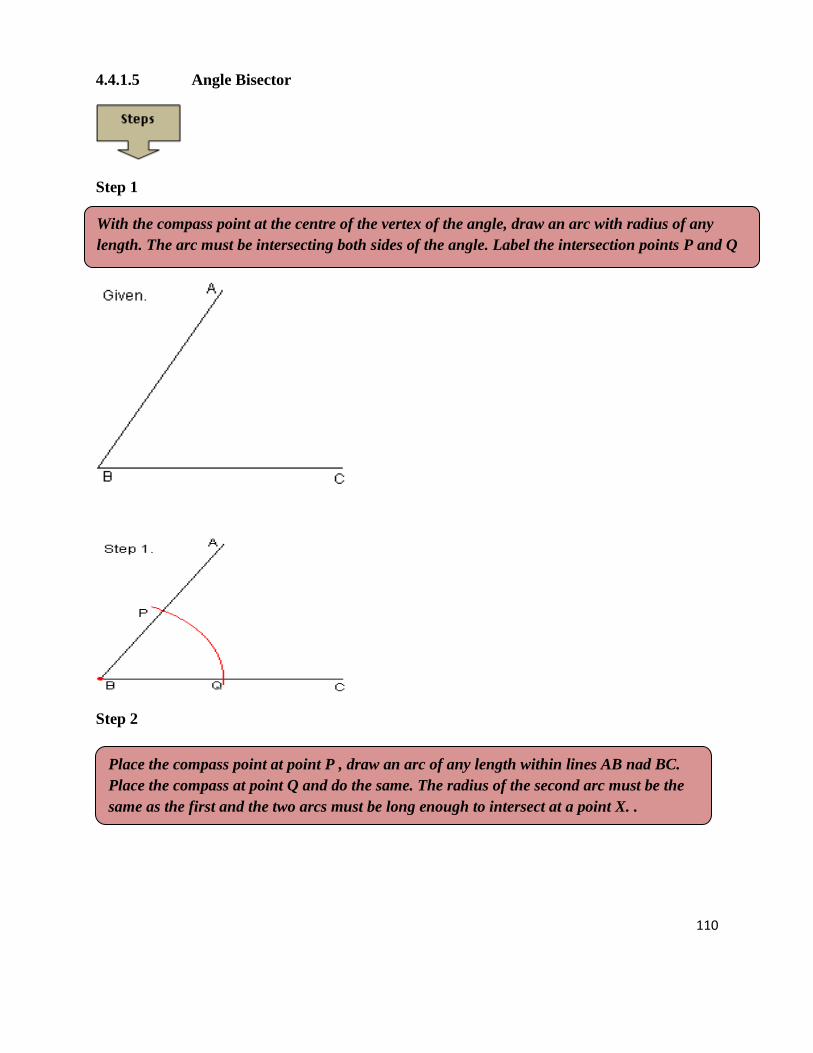
110
4.4.1.5 Angle Bisector
Step 1
Step 2
With the compass point at the centre of the vertex of the angle, draw an arc with radius of any
length. The arc must be intersecting both sides of the angle. Label the intersection points P and Q
Place the compass point at point P , draw an arc of any length within lines AB nad BC.
Place the compass at point Q and do the same. The radius of the second arc must be the
same as the first and the two arcs must be long enough to intersect at a point X. .

111
Step 3
.
4.4.1.6 Constructing the midpoint of a line segment
The midpoint of a line segmentis its middle point which is equidistant from the end points.
Constructing the midpoint of a segment is considered to be quite simple and easier than any other
straightedge construction.
Step 1
Draw line segment AB. Place the compass point at point A and with the width of more than
half the length of AB draw an arc from a point above AB right down to a point below AB
Draw a straight line from the center of the vertex through the point of intersection X.

112
Step 2
The two arcs should intersect above and below AB
Step 3
The point of intersection of the vertical line and the line segment AB shown with a green point is
the midpoint
Now place the compass point at B and draw an arc
Draw a straight line joining the two point intersection

113
4.4.1.7 Constructing the Mediator of a line segment
A mediator is the same as a perpendicular bisector, The bisector of segement AB is the line
perpendicular to this segment which passes through its midpoint
1. Bisect a 30o angle
2. Bisect a 45o angle
3. Bisect the line segment AB given below
4. Construct the bisector of ∠M and ∠N
M N
Exercise 4.8

114
5. Use the following picture to answer the questions.
(a) What is the angle bisector of ∠TPS?
(b) P is the midpoint of what two segments?
(c) Find ∠QPR
(d) Find ∠TPS
6. Use algebra to determine the value of variable(s) in each problem.
(a)
(b)
(c)
(d)

115
Constructing centers of triangles
4.4.2 The Incenter
Definition: The point of concurrency of the angle bisectors is called the incenter of the triangle.
Points of currency: The point where three or more lines intersect and usually refers to various
centers of a triangle.
The circle that has its center at the incenter and is tangent to each of the sides of the triangle is
called the inscribed circle, or simply the incircle of the triangle.
The steps for constructing the incenter and incircle are provided below
1. Draw a triangle
2. Construct the angle bisectors of each of the interior angles. These bisectors will intersect
in a single point called the incenter.
3. Mark the point of intersection of these lines.

116
4. Draw a perpendicular line from the incenter to one of the sides of the triangle. This line
becomes a radius.
5. Construct a circle that has center of the incenter and the intersection point on the circle
itself. This is the incircle.
Real life examples
Question : You are an architect and are given a task to design a round office tower. The client
wants the tower to be circular. The location on which it will be built is at the corner of two
streets and there is another buildng located on the property Where would you place the center of
the lanai (A veranda or roofed patio), to make it as big as possible?
Answer: The center of the round house needs to be equidistant from the street and the two
properties lines: if we must therefore be equidistant from the 3 sides of the triangle formed by the
3 lines. If we consider 2 lines at a time, the set of points equidistant from two lines is the bisector
of the angle between 2 lines. So the set of points equidistant from all 3 lines is the point where all
3 angle bisectors meet. This point is called the Incenter of the triangle. Because it is equidistant
from the 3 sides of the triangle, if we use that distance as radius, we can construct a circle
tangent to all 3 sides of the triangle. This circle is the outline of our lovely new round house
Source: https://www.google.com/search?q=google&ie=utf-8&oe=utf-8#q=incenter+of+a+triangle+in+real+life
The incenter could be used to build a clock. You wouldn't want the hands on the clock to be
off centered so you would find the middle of the circle.

117
Three pilots are flying over a triangular city. They plan to attack. The approach the city at the
corners, or verticies. They bisect each angle. They all are traveling, and have a 3 plane collision in
the center of the city. Too bad they hadn't calculated the incenter.
Source: http://www.illustrationsof.com/royalty-free-airplane-clipart-illustration-32931.jpg
4.4.3 The Circumcenter
Circumcenter is the center of a triangle's circumcircle. It is where the "perpendicular bisectors"
(the lines perpendicular to the side of each triangle which passes through its midpoint) meet.
The circumcircle (circumscribed circle) of a polygon is a circle which passes through all the
vertices of the polygon. The center of this circle is called the circumcenter.
In the case of a triangle, there is always a circumcircle possible, no matter what shape the
triangle is.
The circumcenter is constructed by identifying the midpoints of the segments AC, CD, and DA.
Then a perpendicular line is drawn through the midpoints perpendicular to the side segment.
The example shown below is of a right – angled triangle.

118
Note that the triangle is inside the circle and the circumcenter is in the center of the circle.
Constructing the Circumcenter
Use these steps to construct the circumcenter of the given triangle (ΔACD).
1 Construct the perpendicular bisector of one side (CD).
2. Construct the perpendicular bisector two other sides: AC and DA.
3. Where the 3 perpendicular bisectors intersect is the circumcenter. Mark this
as point B.
4. Place the compass point on B. Open the compass so that the pencil is on any vertex. of
the triangle. Draw a circle with this compass width with the center at B.
Real Life Examples
There are many reasons people may need to know the altitude of buildings. Pilots need to know
the altitude of a building if they are going to be landing on a building, such as the pilots that fly
the flight for life helicopter.

119
Source: https://www.google.com/search?q=google&ie=utf-8&oe=utf-8#q=images+of+helicopters
Without knowing the altitude of the building the pilot wouldn‟t know how fast or slow to begin
going and when to position the jet to get it on the building. Altitdue plays a very important role
in the career of Piloting.
There are many uses of the circumcenter of a triangle in real life, but most of these revolve
around one main thing. That is when you are locating a main point which is the same distance
to three different locations or spots making it most relevant to people. First of all circumcenter is
where three perpendicular bisectors meet at the point of concurrency meaning that spot would be
equal to all three vertices.
A company is designing a mall. They want the food court to be in the very center, and equidistant
from the three main stores (or verticies). They would put it at the circumcenter.
Source:
http://www.picturesof.net/_images_300/People_At_A_Shopping_Mall_Royalty_Free_Clipart_Picture_081106-
160290-408048.jpg
Finding the circumcenter could also be used when building a house. If you wanted to put a
window in the middle of a wall then you could find the circumcenter to do that.

120
Source: https://www.google.com/search?q=google&ie=utf-8&oe=utf-8#q=circumcenter+of+a+triangle+in+real+life
a family wanted to buy a home, but they wanted it to be close both to both the children's
school and the parents' workplace. By looking at a map, they could find a point that is
equidistant from both the workplace and the school by finding the circumcenter of the
triangular region.
4.4.4 The Centroid
A centroid of a triangle is the point where the three medians of the triangle intersect.
A median of a triangle is a line segment joining the vertex to the mid - point on the opposite side
of the triangle.
The centroid is also referred to as the center of gravity of the triangle
121
Centroid facts
The centroid is always inside the triangle
Each median divides the triangle into two smaller triangles of equal area.
The centroid is exactly two-thirds the way along each median.
Put another way, the centroid divides each median into two segments whose lengths are
in the ratio 2:1, with the longest one nearest the vertex. These lengths are shown on the
one of the medians in the figure at the top of the page so you can verify this property for
yourself.
Constructing the Centroid
The steps for constructing centroid are given below:
1. Draw Triangle ABC
2. Construct the mid - point of each side of the triangle and label them MA, MB, MC
accordingly
3. Draw a line joining the mid – point of BC to the vertex A on the opposite side (median).
Repeat this for the other two sides and vertices
4. Label the point of intersection of these three medians G which is called the Centroid
Source: https://www.google.com/search?q=google&ie=utf-8&oe=utf-8#q=centroid+in+real+life&start=10
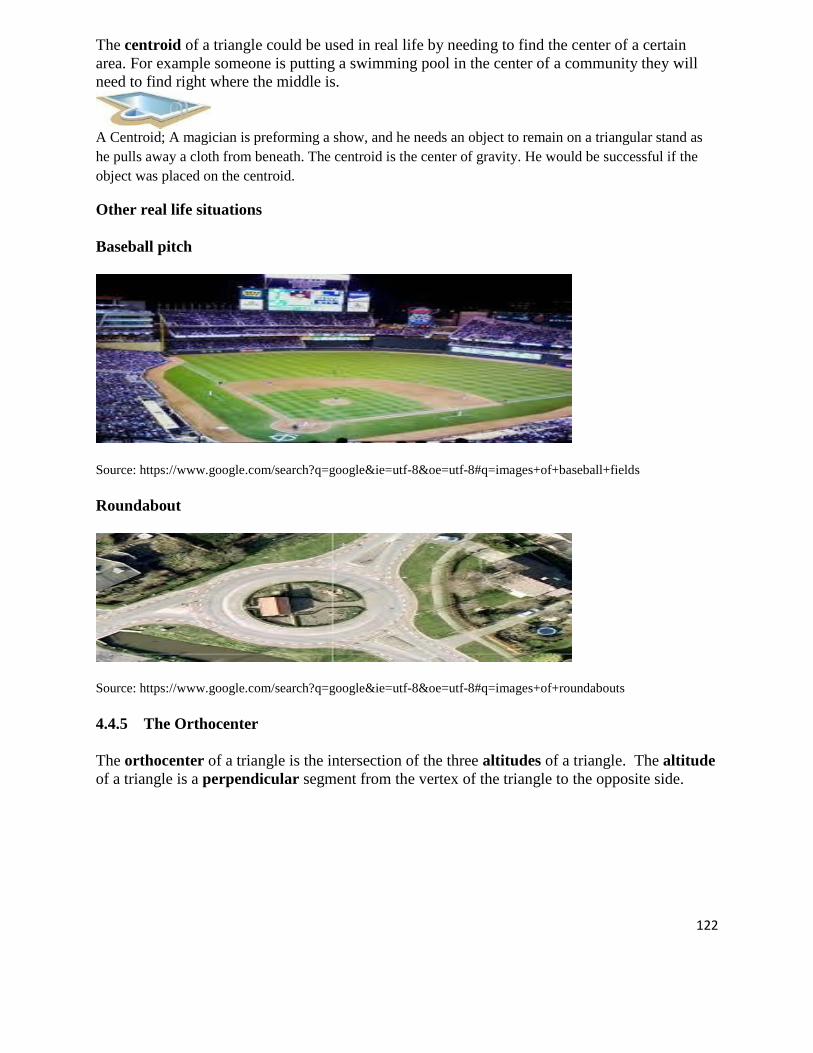
122
The centroid of a triangle could be used in real life by needing to find the center of a certain
area. For example someone is putting a swimming pool in the center of a community they will
need to find right where the middle is.
A Centroid; A magician is preforming a show, and he needs an object to remain on a triangular stand as
he pulls away a cloth from beneath. The centroid is the center of gravity. He would be successful if the
object was placed on the centroid.
Other real life situations
Baseball pitch
Source: https://www.google.com/search?q=google&ie=utf-8&oe=utf-8#q=images+of+baseball+fields
Roundabout
Source: https://www.google.com/search?q=google&ie=utf-8&oe=utf-8#q=images+of+roundabouts
4.4.5 The Orthocenter
The orthocenter of a triangle is the intersection of the three altitudes of a triangle. The altitude
of a triangle is a perpendicular segment from the vertex of the triangle to the opposite side.

123
There are therefore three altitudes possible, one from each vertex.
The orthocenter is not always inside the triangle. If the triangle is obtuse, it will be outside. To
make this happen the altitude lines have to be extended so they intersect.
Orthocenter of an Acute triangle
Orthocenter of an Obtuse triangle

124
Constructing orthocenter
If the three coordinates A, B and C are given, the following procedure is to be followed to find
the orthocenter:
1. Draw triangle ABC
2. Select vertex A and segment BC
3. Construct an altitude from vertex A to segment BC
4. Repeat this for the other two vertices and segments
5. The point where these altitudes intersect is the orthocenter
Real Life Examples
Orthocenter:
Imagine that you still live at a vertex of Denny Triangle. You want to find the shortest distance you must walk to get to the street that is the opposite side of the triangle. Since a straight line is the shortest distance, finding the street that is perpendicular to the opposite Would give you the shortest distance. Finding the orthocenter would give the perpendicular line, or altitude, from any vertex.
Another example of orthocenter is the Eiffel tower. They might of use the orthocenter to
find where all the altitudes met while building it.

125
In a triangular format lay a mall, park, and hotel. The city wants to build a memorial
fountain visible from every site. They find the altitudes, then the orthocenter for everyone to
enjoy.
Source: http://images.all-free-download.com/images/graphiclarge/fountain_clip_art_17015.jpg
Point of concurrency
The Centroid is the point of concurrency where the 3 medians of a triangle meet. This point is
also the triangle's center of gravity.
2) The Circumcenter is the point of concurrency where the perpendicular bisectors of all three
sides of the triangle meet. This point is the center of the triangle's circumscribed circle.
3) The Incenter is the point of concurrency where the angle bisectors of all three angles of the
triangle meet. Like the circumcenter, the incenter is the center of the inscribed circle of a
triangle.
4) The Orthocenter is the point of concurrency where the 3 altitudes of a triangle meet. Unlike
the other three points of concurrency, the orthocenter is only there to show that altitudes are
concurrent. Thus, bringing me back to the initial statement.

126
1. Write True or False
(a) The angle bisectors of a scalene triangle intersect outside the triangle __________
(b) The altitude from the vertex angle of an isosceles triangle is always the median__
(c) To find the point that is equidistant from the sides, find the circumcenter ______
(d) The median starts at a vertex and goes to the opposite midpoint _____________
2. Which principle is used in the construction shown below?
A. The intersection of the angle bisectors of a triangle is the center of the inscribed
circle
B. The intersection of the angle bisectors of a triangle is the center of the
circumscribed circle.
C. The intersection of the perpendicular bisectors of the sides of a triangle is the
center of the inscribed circle.
D. The intersection of the perpendicular bisectors of the sides of a triangle is the
center of the circumscribed circle.
3. The vertices of the triangle drawn are A(7, 9), B(3, 3), and C(11, 3).
Exercise 4.9

127
What are the coordinates of the centroid of ABC?
A. (5, 6)
B. (7, 3)
C (7, 5)
D (9, 6)
4 In the diagram below of ABC, AE ≅ BE, AF ≅ CF, and CD ≅ BD.
The point marked P is known as the
A Incenter
B Circumcenter
C Orthocenter
D. Centroid
5 The coordinates of the endpoints of AB are A(0, 0) and B(0, 6). The equation of the perpendicular
bisector of AB is
A. x = 0 B. x = 3
C. y = 0 D. y = 3
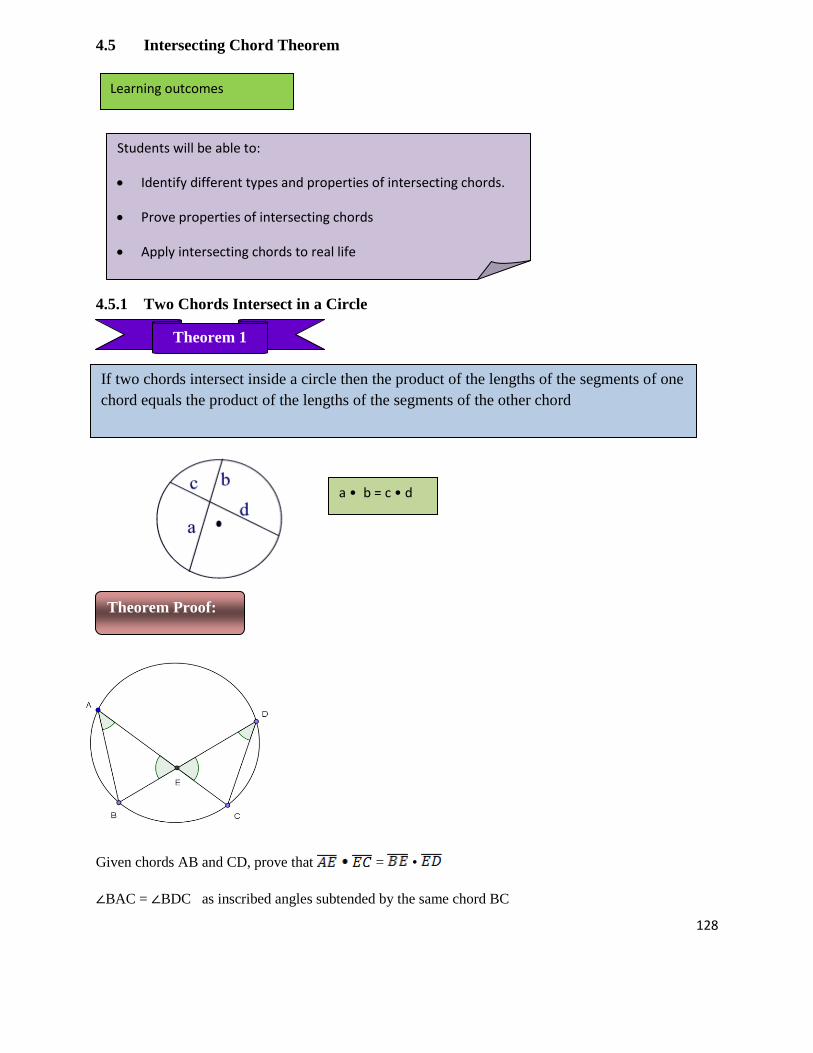
128
4.5 Intersecting Chord Theorem
4.5.1 Two Chords Intersect in a Circle
Given chords AB and CD, prove that = •
∠BAC = ∠BDC as inscribed angles subtended by the same chord BC
If two chords intersect inside a circle then the product of the lengths of the segments of one
chord equals the product of the lengths of the segments of the other chord
a • b = c • d
X
6
Theorem 1
Theorem Proof:
Learning outcomes
Students will be able to:
Identify different types and properties of intersecting chords.
Prove properties of intersecting chords
Apply intersecting chords to real life

129
∠ABD = ∠ACD as inscribed angles subtended by the same chord AD
∠AEB = ∠DEC as a pair of vertical angles
By Triangles with Two Equal Angles are Similar we have △AEB∼△DEC.
Thus:
Example 4.17 Find x in each of the following
(a)
By Theorem 1, 4 • x = 5 • 8
4x = 40
x = 10
(b)
x
By Theorem 1, x • x = 2 • 10
x 2 = 20
x = √20
x = 4.47
=
⟹
AE⋅EC =
DE⋅EB
2
x x
8
5 x
4 8
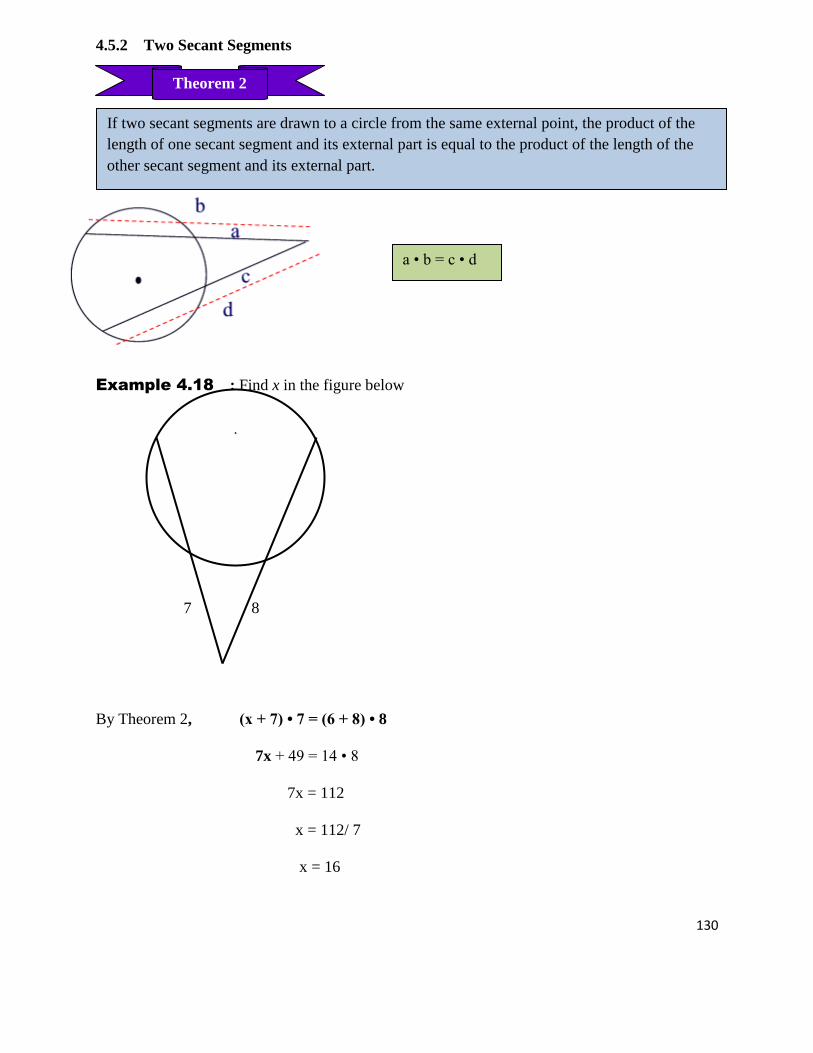
130
4.5.2 Two Secant Segments
Example 4.18 : Find x in the figure below
7 8
By Theorem 2, (x + 7) • 7 = (6 + 8) • 8
7x + 49 = 14 • 8
7x = 112
x = 112/ 7
x = 16
If two secant segments are drawn to a circle from the same external point, the product of the
length of one secant segment and its external part is equal to the product of the length of the
other secant segment and its external part.
a • b = c • d
.
Theorem 2

131
4.5.3 A Tangent and a Secant Segment
Given secant PR and tangent PS, prove that PS2 = PR×PQ
R
Q
P
S
In order to prove this theorem, we are going to join QS and RS.
In △PSQ and △PRS ∠PSQ = ∠PRS ______ (By tangent-chord theorem, according to which an angle formed by a
tangent and a chord is equal to the angle formed by that chord at another point at the circle.)
If a secant segment and tangent segment are drawn to a circle from the same external point,
the product of the length of the secant segment and its external part equals the square of the
length of the tangent segment.
b • c = a2
Theorem 3
Theorem Proof:

132
angle QPS = angle RPS ______ (Common angle)
Thus, △PSQ∼△PRS
PS2 = PR×PQ Hence proved.
Example
Use the theorem for the intersection of a tangent
and a secant of a circle to solve the problems
below.
In the diagram on the left, the red line is a
tangent, how long is it?
x² = (7+5) • 5
x² = (12) • 5
x² = 60
x =
x = 7.75
A Practical use
When making doors or windows with curved tops we need to find the radius of the arch so we
can lay them out with compasses. See Radius of an Arc for a way to do this using the
Intersecting Chords Theorem.
Circular arcs turn up frequently in the real world, such as the top of the window shown on the
right. When constructing them, we frequently know the width and height of the arc and need to
know the radius. This allows us to lay out the arc using a large compass to calculate the rad

133
Given an arc or segment with known width and height:
The formula for the radius is:
where:
W is the length of the chord defining the base of the arc
H is the height measured at the midpoint of the arc's base.
1. In the circle given below, and intersect at E. If = 10 cm, = 6 cm and = 4 cm,
what is the length of
A. 15cm C. 6.7cm
B. 12cm D 2.4cm
2. In the diagram below, tangent and secant are drawn from external point P. What
is the length of ? A
C B 4 P
A. 20 B. 9
C. 8 D. 6
Exercise 4.10
5
5
5
5
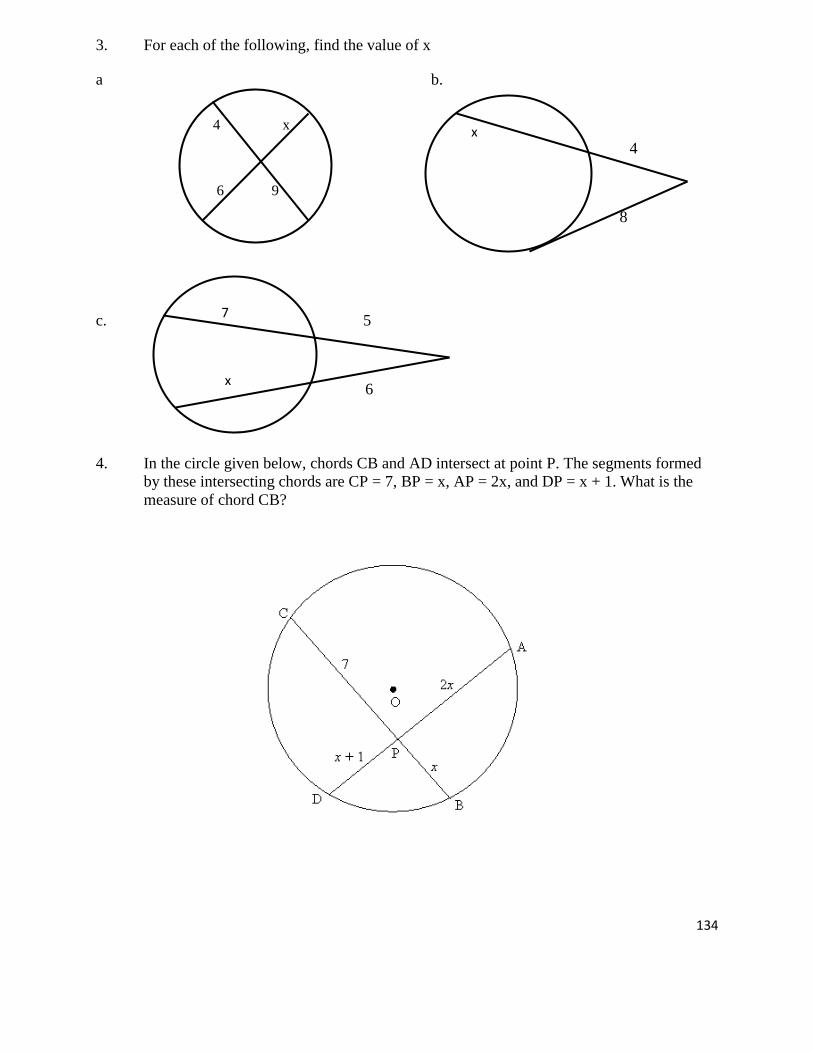
134
3. For each of the following, find the value of x
a b.
4
8
c. 5
6
4. In the circle given below, chords CB and AD intersect at point P. The segments formed
by these intersecting chords are CP = 7, BP = x, AP = 2x, and DP = x + 1. What is the
measure of chord CB?
4 x
6 9
x
7
x

135
GLOSSARY 1 Acute triangle All angles are less than right angles 2 Adjacent side Adjacent sides are those the are next to each other 3 Altitude A line segment through a vertex and perpendicular to (i.e. forming a right angle with)
a line containing the base (the opposite side of the triangle) 4 Angle bisector A line segment that bisects one of the vertex angles of a triangle. 5 Angle of depression Angle below the horizontal 6 Angle of elevation Angle above the horizontal 7 Arc A portion of the circumference of a circle 8 Bisect To divide into two equal parts 9 Centroid It is a point of concurrency of the triangle. It is the point where all 3 medians
intersect and is often described as the triangle's center of gravity 10 Chord It is a geometric line segment whose endpoints both lie on the circle 11 Circumcenter The point where the three perpendicular bisectors of the sides of a triangle meet.
Also, the center of the circumcircle. One of a triangle's points of concurrency. 12 Circumscribed circle It is a circle which passes through all the vertices of the polygon. The center of this
circle is called the circumcenter and its radius is called the circumradius 13 Clinometer An instrument used in surveying for measuring an angle of inclination 14 Point of Concurrency The point of intersection of the lines, rays, or segments 15 Construction The act of drawing geometric shapes using only a compass and straightedge 16 Equidistant When a point is the same distance from each figure. 17 Geometry The branch of mathematics that treats the properties, measurement, and relations of
points, lines, angles, surfaces, and solids. 18 Hypotenuse The side of a right triangle opposite the right angle. 19 Incenter The point of concurrency of the three angle bisectors of a triangle 21 Inscribed circle (incircle) When a circle drawn in a triangle touches the sides 23 Median A segment from a vertex to the midpoint of the opposite side 24 Mediator The plane through the midpoint of a line segment and perpendicular to that segment 25 Midpoint A point on a line segment that divides it into two equal parts 27 Orthocenter It is where altitudes meet. 28 Perpendicular bisector A segment, ray, line, or plane that is perpendicular to a segment at its midpoint 30 Pythagoras Theorem The square of the length of the hypotenuse of a right triangle equals the sum of the
squares of the lengths of the other two sides 31 Secant segment A secant is a line that intersects a circle at two points. 32 Segment The region bounded by a chord and the arc subtended by the chord 34 Straightedge construction It is the construction of lengths, angles, and other geometric figures using only a
ruler and compass. 35 Subtend To be opposite to and delimit (an angle or side) 36 Tangent A straight line to a plane or curve at a given point that "just touches" the curve at
that point 38 Trigonometry The branch of mathematics dealing with the relations of the sides and angles of
triangles and with the relevant functions of any angles 39 Vertex A vertex is a point where two or more straight lines meet. It is a Corner.

136
STRAND 5 MEASUREMENT
HISTORY OF MONEY
Money, one of the earliest and most significant inventions of civilization, is important
to the development of trade. Before money was used, there was only barter, a
relationship between two people each of whom has something which the other
wants
The earliest currency used in commercial transactions occurred in Egypt and
Mesopotamia by the third millennium BC. It consisted of gold bars which needed to
be weighed to establish their value each time they were exchanged. Later these
were supplemented by gold rings for smaller sums. In about 2500 BC an extensive
trade, at Ebla in modern Syria, was based on currency of this kind in silver and
gold.
The earliest known coins in the western world came from the city of Ephesus in
Ionia (in western Turkey) in about 650 BC. The metal used was electrum, a natural
alloy of gold and silver found locally. The coins were bean shaped and were struck
on one side with a distinguishing mark, such as the image of a lion. The underlying
purpose was to ensure a stable value in this variable metal of exchange, previously
traded by weight alone.
A century later, a king of neighbouring Lydia became the first ruler to mint coins in
pure gold and silver. They show the facing heads of a lion and a bull. Greek cities
closed to Lydia including the Persian empire were quick to adopt the useful new
technique of metal currency. By the end of the 6th century coinage was common
used throughout the region
Source: http://www.historyworld.net/wrldhis/PlainTextHistories.asp?historyid=ab14
137
5.1.1 Hire Purchase Agreements
5.1 Money
Stores like Courts, Morris Hedstrom and Tappos are popular places in Fiji
which sell televisions, furniture and many household items. The reason for
their popularity is that they sell their goods in two ways either cash or credit.
Cash is the usual way for paying. When goods are bought on cash the full
amount is paid and the good is taken home.
Hire purchase is buying on credit. Where the store trusts its customers and
expects them to pay later. Usually the store charges a certain amount of the
price as deposit which the customers may choose to pay. After which the
customer pays monthly or weekly instalments. The store charges a certain
amount of interest when goods are bought on hire purchase.
With lay -by the item is put away for the customer by the store, regular
payments need to be made to the store. when the entire cost of the item is paid
for then the customer takes the good home. Lay- by does not cost any more
than the ticketed price of the item.
Using credit cards is another way of paying for items and taking the goods
home. The transaction is finished from the retailer‟s point of view. The entire
balance of the card can be paid without being charged interest if the customer
is able to pay within the timeframe otherwise interest is charged on the
purchase.
LEARNING OUTCOME
Students should be able to:
explore the application of
percentages in social aspects of
living.
LEARNING OUTCOME
Students should be able to:
Calculate the total amount paid
when goods are bought on hire
purchase, credit terms and lay by
.
Discuss the advantages and the
disadvantages of buying on goods
on these terms.

138
Example 5.1
Cash price $ 2700
Or 24 monthly
payments of $150.00
The above deal is offered at a store in Suva. The customer wishes to take the set on hire purchase.
Calculate:
(I) Total amount the customer pays while buying on hire purchase.
Solution
24 x $150.00 = $3600.00
(ii) The amount the customer saves if the set is bought on cash.
Solution
$3600.00 - $2700.00 = $900.00
(iii) The percentage interest that the store charges.
Solution
($900.00 ÷ $2700.00) x 100 = 33.33%
Example 5.2
Alpana really likes a sari that she saw in Bhanlal & Sons. The sari costs $ 250 but Alpana just has $50
with her. The shopkeeper suggests that she lay – by the good. Calculate the number of payments
that Alpana needs to make if she deposits $50 and makes weekly payments of $25.00.
Solution
$ 250.00 - $ 50.00 = $200.00. (The amount owed)
$200.00 $25.00 = 8 weekly payments.
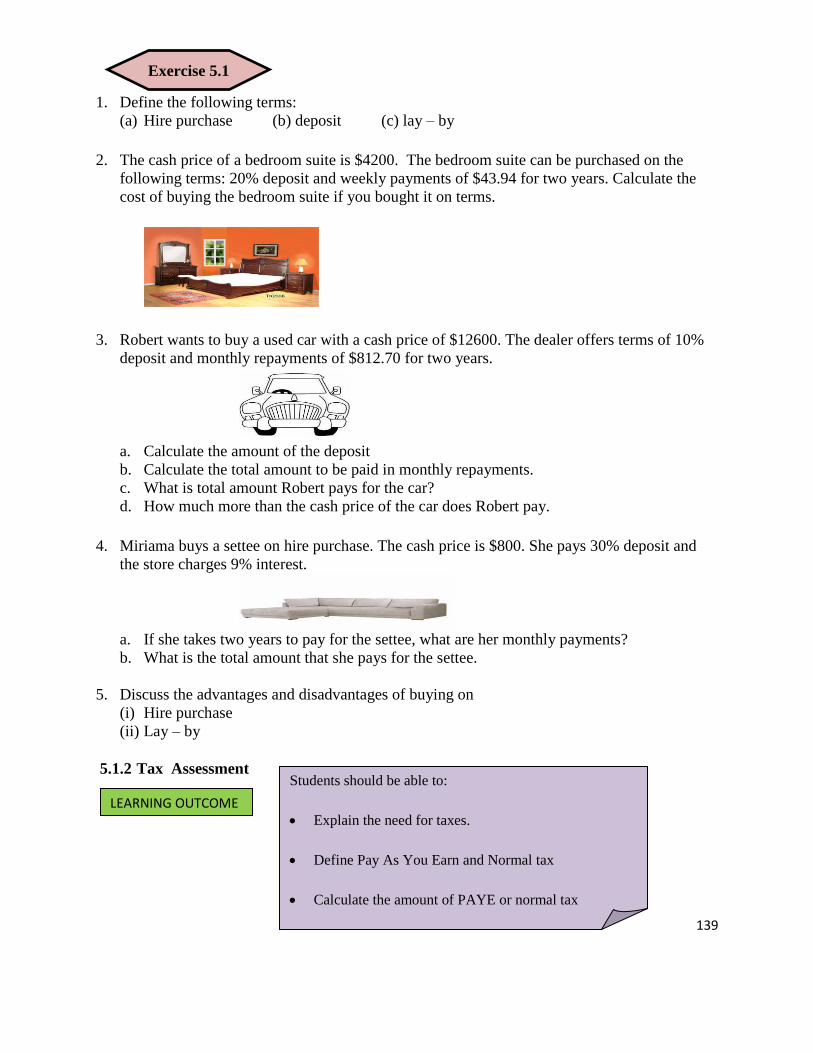
139
1. Define the following terms:
(a) Hire purchase (b) deposit (c) lay – by
2. The cash price of a bedroom suite is $4200. The bedroom suite can be purchased on the
following terms: 20% deposit and weekly payments of $43.94 for two years. Calculate the
cost of buying the bedroom suite if you bought it on terms.
3. Robert wants to buy a used car with a cash price of $12600. The dealer offers terms of 10%
deposit and monthly repayments of $812.70 for two years.
a. Calculate the amount of the deposit
b. Calculate the total amount to be paid in monthly repayments.
c. What is total amount Robert pays for the car?
d. How much more than the cash price of the car does Robert pay.
4. Miriama buys a settee on hire purchase. The cash price is $800. She pays 30% deposit and
the store charges 9% interest.
a. If she takes two years to pay for the settee, what are her monthly payments?
b. What is the total amount that she pays for the settee.
5. Discuss the advantages and disadvantages of buying on
(i) Hire purchase
(ii) Lay – by
5.1.2 Tax Assessment
LEARNING OUTCOME
Students should be able to:
Explain the need for taxes.
Define Pay As You Earn and Normal tax
Calculate the amount of PAYE or normal tax
Exercise 5.1

140
Pay As You Earn
Income tax is a tax on the money that you earn and is called Pay As You Earn.
In Fiji there is a new system where the correct amount of PAYE is deducted from the
salaries and wages.
The main objective of the new system is to ensure that tax payers pay the correct tax and
there is no refund or liability.
The last tax return was lodged in 2013 as in 2012 the new system was not put into place and
there were refunds and liabilities.
From 2014 the tax return forms were not lodged.
In Fiji any individual earning up to $15600 does not have to pay tax.
There are separate rates of normal tax for resident and non-resident individuals.
The tables below show the tax rates that are charged on the chargeable income.
Chargeable income =Total income – Total allowances & deductions
Normal tax is a basic rate of taxation (as on income) applied to taxpayers.
The calculation of normal tax will be based on actual income and the tax rates applicable to
the relevant period
Resident tax rates (2013)
Chargeable income Tax payable
0-16000 nil
16,001-22,000 7% of excess over $16000
22,001-50,000 420 +18% of excess over $22,000
50,001-270,000 5460+20% of excess over $50,000
270,001-300,000 49460+20% of excess over $270,000
300,001-350,000 55460+20% of excess over $300,000
350,001-400,000 65460+20% of excess over $350,000
Source : http://www.frca.org.fj/residents-tax-rates
Non Resident tax rates (2013)
WHY TAXES???
Taxes are a form of income for the government of Fiji. This income is used for social security, health care, national defence and for many other important reasons.

141
Chargeable income Tax payable
0-16000 20% of excess of $0
16,001-22,000 3200 + 20% of excess over $16000
22,001-50,000 4400 + 20% of excess over $22,000
50,001-270,000 10,000 + 20% of excess over $50,000
270,001-300,000 54,000 + 20% of excess over $270,000
300,001-350,000 60,000 + 20% of excess over $300,000
350,001-400,000 70,000 + 20% of excess over $350,000
Source : http://www.frca.org.fj/nonresidents-tax-rates
Example 5.3
Mr.Mikaele Waqa is resident of Fiji and is a school teacher and his chargeable income is
$24,493. Using the tables above calculate his normal tax.
SOLUTION Step 1
Since Mr. Mikaele is a resident we will use the table for resident tax rates and we choose
the row in which Mr. Mikaele‟s income falls.
Chargeable income Tax payable
0-16000 nil
16,001-22,000 7% of excess over $16000
22,001-50,000 420 +18% of excess over $22,000
50,001-270,000 5460+20% of excess over $50,000
270,001-300,000 49460+20% of excess over $270,000
300,001-350,000 55460+20% of excess over $300,000
350,001-400,000 65460+20% of excess over $350,000

142
Step 2 Step 3
Find the excess over $22,000. Find 18% of excess over $22000.
$24,493 - $22,000 = $2493 x 2493 = $448.74
Step 4
420 + 18% of excess over $22000.
420 + 448.74 = $868.74 Normal tax.
Example 5.4
Mr. David Rodney is a non- Fiji resident and works in Fiji as a lecturer at one of the local
University. His chargeable income is $85,890. Calculate his normal tax
SOLUTION
Step 1
Since Mr. David Rodney is a non- resident we will use the table for non- resident tax rates and
we choose the row in which his income falls.
Chargeable income Tax payable
0-16000 20% of excess of $0
16,001-22,000 3200 + 20% of excess over $16000
22,001-50,000 4400 + 20% of excess over $22,000
50,001-270,000 10,000 + 20% of excess over $50,000
270,001-300,000 54,000 + 20% of excess over $270,000
300,001-350,000 60,000 + 20% of excess over $300,000
350,001-400,000 70,000 + 20% of excess over $350,000
Step 2 Step 3
Find the excess over $50,000. Find 20% of excess over $50,000.
$85,890 - $50,000 = $35,890 x 35890 = $7178
Step 4
10000 + 18% of excess over $50000. 10000 + 7178 = $17178.00 Normal tax

143
Use the the tables for Resident and Non Resident tax rates (2013) above to answer
the following questions
1. Mr. Pradeep Kumar‟s chargeable income is $51,435.00. Calculate his normal tax
2. Ms. Katie Brown is a New Zealand resident who is hired by one of the local hair salons
in Fiji. Her chargeable income is $26,567.00 dollars. Find her normal tax
Source: https://www.google.com/search?q=google&ie=utf-8&oe=utf-8#q=images+of+cartoon+hair+salons
3. Mr. Kesar‟s chargeable income is $53,569.00 and is a Fijian resident. Calculate his
normal tax
Source: https://www.google.com/search?q=google&ie=utf-8&oe=utf-8#q=images+of+cartoon+guy+busy+working
Exercise 5.2
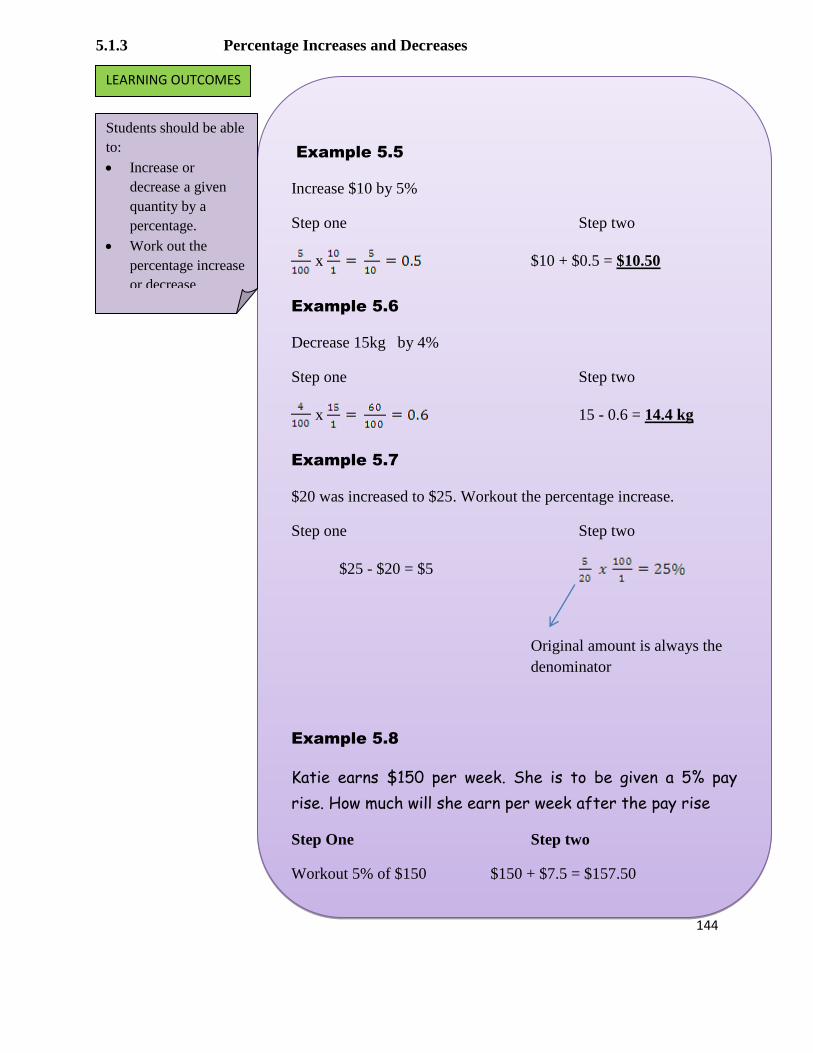
144
5.1.3 Percentage Increases and Decreases
Example 5.5
Increase $10 by 5%
Step one Step two
x $10 + $0.5 = $10.50
Example 5.6
Decrease 15kg by 4%
Step one Step two
x 15 - 0.6 = 14.4 kg
Example 5.7
$20 was increased to $25. Workout the percentage increase.
Step one Step two
$25 - $20 = $5
Original amount is always the
denominator
Example 5.8
Katie earns $150 per week. She is to be given a 5% pay
rise. How much will she earn per week after the pay rise
Step One Step two
Workout 5% of $150 $150 + $7.5 = $157.50
LEARNING OUTCOMES
Students should be able
to:
Increase or
decrease a given
quantity by a
percentage.
Work out the
percentage increase
or decrease

145
1 a) increase $1000 by 20% 2 a) decrease $60 by 30%
b) increase $400 by 30% b) decrease 8m by 5%
c) increase 40kg by 3% c) decrease 80kg by 10%
d) increase 250m by 7% d) decrease 90m by 2%
3. (a) 96m is increased to 120m. find the percentage increase.
(b) 56kg is reduced to 50kg. find the percentage decrease.
4. A company increases the cost of all its products by 5%. Calculate the new price of each item listed
(a) a tent that previously cost $450
(b) a sleeping bag that previously cost
$250
5. Joe was paid $30 per week for delivering papers. He was given a 3% pay rise.
How much will he now earn each week?
6. Samy’s grandmother wants to enlarge Samy’s graduation photo. The photo now has dimensions
25cm x 20cm. Find the new dimensions if the photo is to be enlarged by 25%.
7. The price of all television in a shop are to be increased by 8%. Calculate the new price of a
television that originally cost $899.
8. In a sale the cost of a computer is reduced by 30%. The normal price of the computer was $1499.
Calculate the sale price of the computer.
9. A mountain bike was priced at $180. Its price was increased by 8%. Later, this increased price was
reduced by 20% in a sale. Calculate the sale price of the bike.
10. This is how Caryl works out 15% of 120 in her head.
10% of 120 is 12,
5% of 120 is 6,
so 15% of 120 is 18.
how Caryl can work out 17 1
2
% of 240 in her head?
Exercise 5.3

146
6.1.2
Applications of Percentages in Real life
Percentages are an important part of our everyday lives.
Percentage is a very handy way of writing fractions.
Percentages can be compared more easily than fractions.
Shops advertise discounts on products. These discounts are
percentages.
"Up to 50% off marked prices"
Companies describe their success or failure as an increase or decrease
in profit levels.
"C-Company profit down by 15% for the last financial year"
A salesperson may be given a commission as payment for selling
goods. The commission can be a percentage of the sales made
Financial institutions quote interest charged to the client on loans, or
interest paid for money invested, as a percentage.
"Housing Loans-4.95% p.a. for the first 12 months"
Interest paid may be as Simple Interest or Compound Interest.
A bank is a business that borrows money in form
of deposits and it lends money in the form of
loans. They direct money from people who are
saving to people who want to build houses, buy
cars and start business. The bank pays interest to
all money that is deposited for a fixed term and
charges interest on all money that is borrowed.
Interest can either be simple or compound.
LEARNING OUTCOME
Students should be
able to:
Discuss
applications of
percentages in real
life situations

147
5.1.4 Simple Interest
Saving money is a lot better than borrowing money. When money is
saved and deposited, interest is paid out.
Example 5.9
Mr. Hiralal deposits $10000 in a bank for 3 years. The bank pays him
5% interest per annum. Calculate the total amount that Mr. Hiralal has in
his account after 3 years.
Solution
Calculate the interest in dollars.
Interest for one year.
Interest for 3 years.
$500 x 3 = $1500 (interest remains the same for the 3 years)
Total amount after 3 years = principal amount + interest for 3 years.
$10000 + $1500 = $11500
Example 5.10
Sunil wishes to buy a car worth $12000. He applies for a loan from a local bank which is going to
charge him 6% interest per annum. If Sunil takes 3 years to finish his loan what is the total
amount that he will have to pay?
Solution
Calculate the interest in dollars.
$12000 = $720 Interest for one year.
Interest for 3 years.
$720 x 3 = $2160 (interest remains the same for the 3 years)
Total amount after 3 years = principal amount + interest for 3 years.
$12000 + $2160= $14160
LEARNING OUTCOMES
Students should be
able to calculate:
Simple interest
The total
amount at the
end of a fixed
term.

148
1. If $200 is deposited in a savings account that earns 7.5% simple interest, how much
money will be earned after:
(a) 1 year (b) 3 years (c) 15 years
2. Inoke deposits $1500 in a savings account that earns 5% simple interest. How much
money would he have if he withdrew after:
(a) 1 year (b) 6 months (c) 9 months
3. Vilimaina invests $2000 in a term deposit account for 3 years. After 3 years she has a
total of $2388. What interest rate was paid on the account?
4. If $1000 is put on a term deposit that earns 8% simple interest, how many years will it
take the balance to reach $2000?
Example 5.11
Villiame puts $2000 in a two year term deposit that earns simple interest. When the account
matures he has $2200. What interest rate was charged.
Solution
(i) Find the interest (II) find interest per year
$2200 - $2000 = $200 $200 2 = $100
(ii) Find the rate (iv) convert to a percentage
$2000 0.05 = 5%
2000 = 100
x = 100/2000
x = 0.05
Exercise 5.4

149
5.1.5 Compound interest
Compound interest is paid by most banks. This type of interest
is not only paid on the principal , but also on the interest that has
been already earned.
Population growth and depreciation also work according to the
rules of compound interest.
Example 5.12
06/2010 Mr. Prasad deposits $10000 in a local bank which pays
out 3.5% compound interest. Find the total amount after 3 years.
Date Deposit and interest balance
06/ 2010 $10000 $10000
06/ 2011
$10000 + $350 = $10350
$10350
06/2012
$10350 + $362.25 = $10712.25
$10712.25
06/2013
$10712.25+ $374.93= $11087.18
$11087.18
LEARNING OUTCOMES
Students should be able
to:
Calculate the
compound interest.
Find the total amount.
Differentiate between
simple and compound
interest
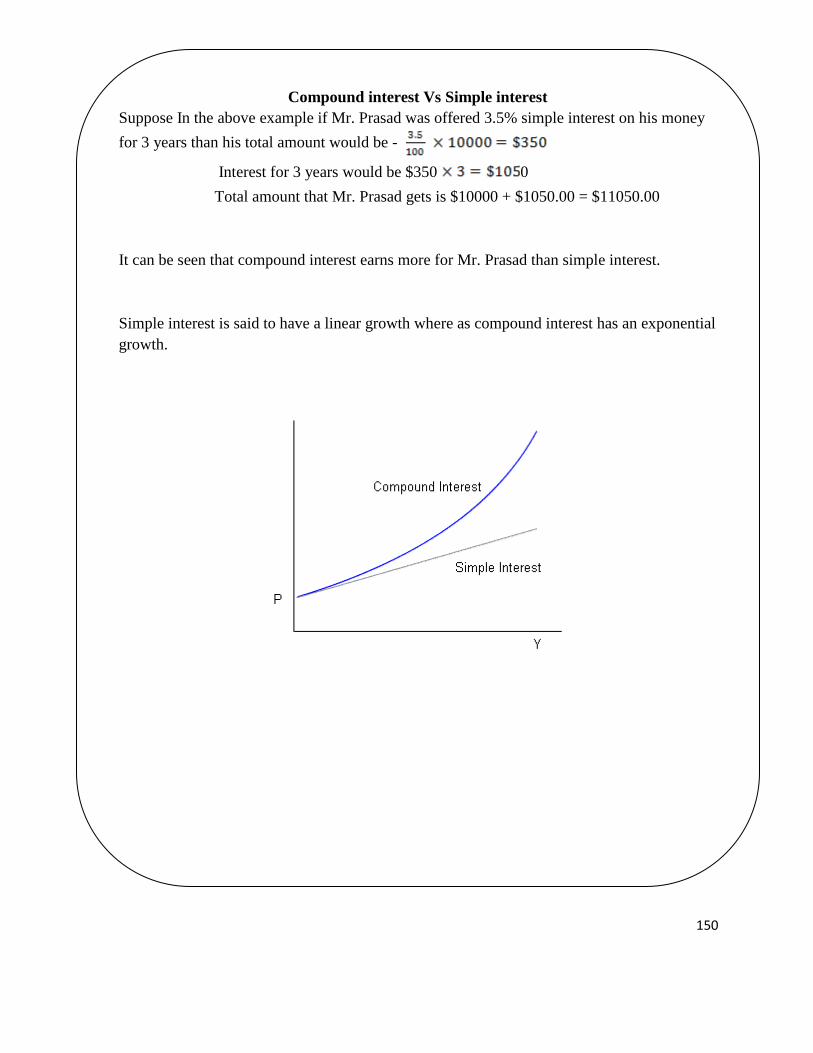
150
Compound interest Vs Simple interest
Suppose In the above example if Mr. Prasad was offered 3.5% simple interest on his money
for 3 years than his total amount would be -
Interest for 3 years would be $350 0
Total amount that Mr. Prasad gets is $10000 + $1050.00 = $11050.00
It can be seen that compound interest earns more for Mr. Prasad than simple interest.
Simple interest is said to have a linear growth where as compound interest has an exponential
growth.
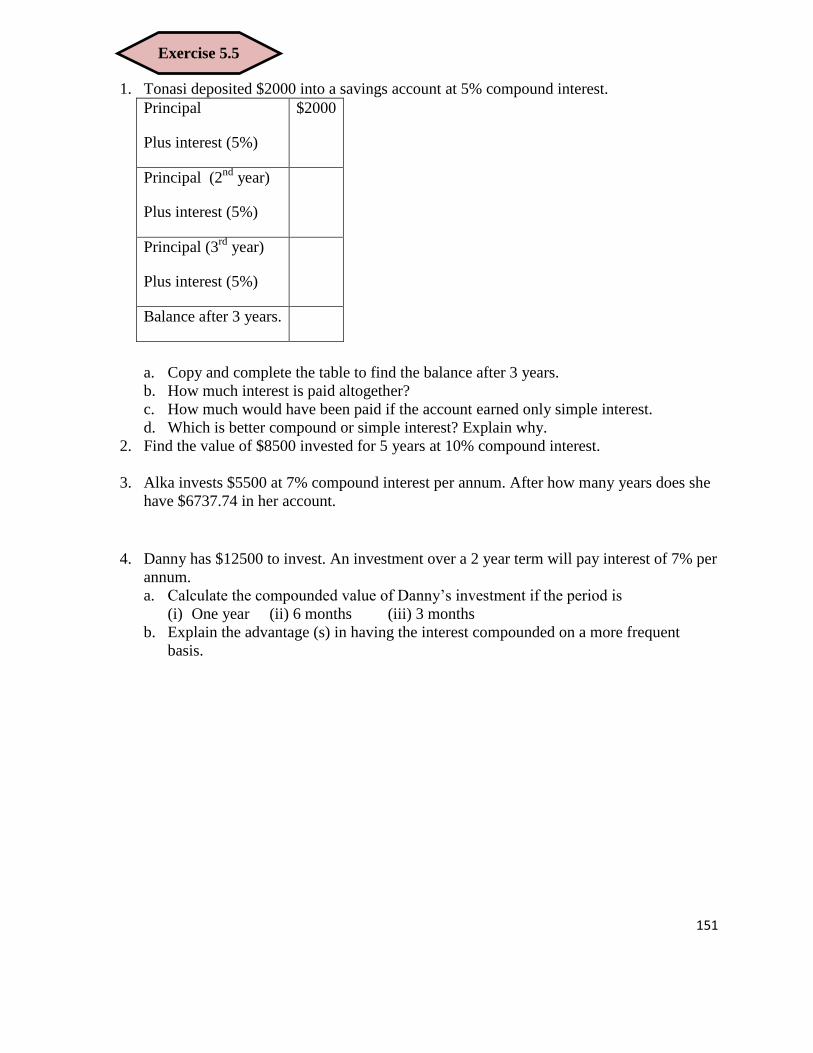
151
1. Tonasi deposited $2000 into a savings account at 5% compound interest.
Principal
Plus interest (5%)
$2000
Principal (2nd
year)
Plus interest (5%)
Principal (3rd
year)
Plus interest (5%)
Balance after 3 years.
a. Copy and complete the table to find the balance after 3 years.
b. How much interest is paid altogether?
c. How much would have been paid if the account earned only simple interest.
d. Which is better compound or simple interest? Explain why.
2. Find the value of $8500 invested for 5 years at 10% compound interest.
3. Alka invests $5500 at 7% compound interest per annum. After how many years does she
have $6737.74 in her account.
4. Danny has $12500 to invest. An investment over a 2 year term will pay interest of 7% per
annum.
a. Calculate the compounded value of Danny‟s investment if the period is
(i) One year (ii) 6 months (iii) 3 months
b. Explain the advantage (s) in having the interest compounded on a more frequent
basis.
Example One
Increase $10 by 5%
Step one Step two
x $10 + $0.5 =
$10.50
ExampleTw0
Decrease 15kg by 4%
Step one Step two
x 15 - 0.6 =
14.4 kg
Exercise 5.5

152
5.1.6 Careers
Of course money has lots of relevance in all our lives. Many calculations with money involve
mathematics like finding the discount, calculating the markups, finding the interest etc.
Social Maths can help in many ways and some career opportunities related to social maths are:
LEARNING OUTCOME
Students should be able to:
identify some careers
related to social
mathematics.

153
GLOSSARY 1 Cash price The actual amount of money that is exchanged when commodities are
bought and sold 2 Chargeable income It is your 'assessable income' after deducting 'personal reliefs
(deductions which help you to save tax) 3 Compound interest When the interest rate is applied to the original principal and
any accumulated interest
4 Deposit To put or leave something especially money in a particular place 5 Depreciation Reduction in the value of a tangible asset over specified period of
time 6 Discount Reducing the price or value of an object or item 7 Hire purchase A system by which a buyer pays for a thing in regular installments
while enjoying the use of it. 8 Money Coins or bills used as a way to pay for goods and services. Normal tax A basic rate of taxation (as on income) applied to taxpayers.
9 PAYE Tax payment method in which an employer is required by law to deduct income tax (and national insurance, if applicable) from an employee's taxable wages or salary
10 Percentage A percent is a ratio whose second term is 100. Percent means parts per hundred
11 Principal value A value selected at a point in the domain of a multiple-valued function, chosen so that the function has a single value at the point
12 Simple interest The original amount invested, separate from earnings 13 Tax A compulsory contribution to state revenue, levied by the
government on workers' income and business profits or added to the cost of some goods, services, and transactions
14 Tax payable A type of account in the current liabilities section of a company's balance sheet. This account is comprised of taxes that must be paid to the government within one year.
15 Tax return A form on which a taxpayer makes an annual statement of income and personal circumstances, used by the tax authorities to assess liability for tax

154
STRAND 6 CHANCE AND DATA
HISTORY OF MEAN, MEDIAN
The arithmetic mean, although a concept known to the Greeks, was not generalised to more than two values until the 16th century. The invention of the decimal system by Simon Stevin in 1585 seems likely to have facilitated these calculations. This method was first adopted in astronomy by Tycho Brahe who was attempting to reduce the errors in his estimates of the locations of various celestial bodies.
The idea of the median originated in Edward Wright's book on navigation (Certaine Errors in Navigation) in 1599 in a section concerning the determination of location with a compass. Wright felt that this value was the most likely to be the correct value in a series of observations.
Source: https://www.google.com/search?q=google&ie=utf-8&oe=utf-8#q=images+of+mean+and+median
Source: https://www.google.com/search?q=google&ie=utf-8&oe=utf-8#q=images
Source: https://www.google.com/search?q=google&ie=utf-8&oe=utf-8#q=history+of+mean+median+mode

155
6.1 Data Representation
We will study various graphical forms of data representation which are often used by statisticians. Some forms of representation are used more commonly than others.
We will now have a look at five different forms of graphs used by statisticians. These are:
frequency tables
bar graphs
line graphs
pie charts
Pictograms
A worked example will be given for each one followed by an example for you to try on your own.
a) Frequency tables:
Data that is collected is generally tabulated in frequency tables. These tables might contain data that is either grouped or ungrouped.
The type of representation that is used depends on: o the nature of the data, i.e., discrete or continuous data
o the format in which the data is given ungrouped or grouped
LEARNING OUTCOMES
Students should be able to:
Organise numerical data into a frequency table
Recognise different types of graphs and how they are sketched
Identify suitable graphs for various data
What is the best way to represent collected data?

156
Definition
Example 6.1
The following frequency table shows the number of Grade 2 students who chose cat, dog or hamster as their favorite pet.
b ) B a r g r a p h s
A bar graph is a graph made of vertical columns or rectangles with equal widths. The height/length represents the frequency of the category. Here is an example of a bar graph to represent the data from the following table.
Example 6.2
Occurrence of the numbers thrown with a die
Number Frequency
1 6
2 5
3 4
4 7
5 7
6 32
When the bars are joined to each other, the graph is called a histogram.
A Frequency Table is a table that lists items and uses tally marks
to record and show the number of times they occur.

157
Example 6.3
Draw a histogram for the following data:
Class Interval Frequency
0 - 5 4
5 - 10 10
10 - 15 18
15 - 20 8
20 - 25 6
Solution:
Source: http://math.tutorvista.com/statistics/histogram.html
c ) L i n e g r a p h s
A line graph is a graph made up of straight line segments joined together between points which
are marked according to frequencies.
Month Number of Eggs sold
March 105
April 200
May 158
June 167
July 220
August 171
Eggs sold at Corner Shop March to August

158
0
50
100
150
200
250
Month March April May June July August
Nu
mb
er
of
egg
s so
ld
Month
Number of eggs sold
d ) P i e c h a r t s
A pie chart is a circular representation, a bit like a pie which has been cut up into various sizes
of slices. The different segments (the slices) represent the various relative frequencies.
The relative frequency of a class is the fraction of the total number of data of items belonging to
the class. For example, a data set with a total number of n items, the relative frequency of each
class is given by the following formula.
Relative Frequency =
The segments are usually labeled in percentages, and the total of all the
percentages should be 100%.

159
Example 6.4
The pie chart represents amounts spent by a family on various items in the month of September
in a certain year. Take note of how the angle sizes of the segments are calculated.
Item Amount Spent ($)
Amount Spent (%)
Angle Size of Segment
Food 2000 40
Household 1250 25
Recreation 250 5
Savings 500 10
Other 1000 20
Amounts spent from family budget on various items
e ) P i c t o g r a m s
A pictogram looks a like a bar graph. The difference is that the bars are made up of little pictures which represent certain numbers of things as is indicated in the key, which must accompany the pictogram. The picture usually relates in some way to the data being represented.
Below is a frequency table for the number of cars passing through various police check points on 22nd September in a certain year.
Check points Number of Cars Passed through
A 250
B 520
C 135
D 330
E 405

160
Below is a pictogram representing the number of cars passing through the Check points A – E:
Checkpoint No of Cars
A
B
C
D
E
KEY
Represents 100 cars
Represents 10 cars
Represents 5 cars
1. i. Using the data in the table below, draw a bar graph to illustrate the information. Use
graph or grid paper.
Favorite cakes in Class 4B
Type Frequency
chocolate 15
vanilla 11
carrot 6
coconut 7
apple pie 6
coffee 3
ii. What is an advantage of using a bar graph here than a pie chart?
Exercise 6.1

161
2. Consider the following information relating to the number of buses going and arriving at
various bus stations in Fiji.
City/Town Number of buses per day
Suva
120
Lautoka 67
Nadi 45
Nausori 90
Ba 55
Source: https://www.google.com/search?q=google&ie=utf-8&oe=utf-8#q=images+of+cartoon+buses
Which would be a better way to represent this in a line graph or a pictogram? Why? (Show
your answer)
6.2 Measures Of Central Tendency
LEARNING OUTCOMES
Students should be able to:
Define measures of central tendency
Calculate measures of central tendency
Work out measures of central tendency from frequency table
Identify median from a histogram
Relate measures of central tendency to real life situations

162
One of the most simple ways of describing and analyzing data is to use measures of central
tendency.
To a statistician, the arithmetic mean is only one of several measures of central tendency to get
an idea about the center of a distribution. The idea of the center of a distribution and what it
reflects depends on a number of some factors. That is why statisticians believe that there should
be other measures of central tendency.
i . M e a n o r a v e r a g e
A single number, obtained through a mathematical calculation which is very often used to
describe a set of data.
To calculate the mean, we add all of the data items together and then divide that sum by the
number of terms which we added.
Example 6.5
Find the mean of 56, 34, 25, 38, 49, 80 and 73.
To do this you should add 56, 34, 25, 38, 49, 80 and 73 and then divide the sum of these numbers
by 7.
So 56 + 34 + 25+ 38+ 49+ 80 + 73 = 7
355 = 50.71
The mean is 50.71.
i i . M e d i a n
The median of a set of data is the value which divides the set into two equal numbered parts
when the data has been ranked according to size. To rank data, we put it into ascending (or
Great questions
deserve average
answers

163
descending) numerical order. If the number of scores is odd, then the central score will be the
median. If the number of scores is even, then the median will be the average of the two central
scores.
Source:
https://www.google.com/search?q=images+of+median&biw=1760&bih=843&tbm=isch&tbo=u&source=univ&sa=
X&ei=GIfFVNGRNIz-8QXNhoKwCw&ved=0CDMQ7Ak
Example 6.6
Calculate the median of the following data:
2, 4, 9, 10, 13, 15, 19
The data has been ranked (it is in ascending numeric order), there are seven data items (scores)
and so 10, which is the central most score (the one in the middle), is the median.
Example 6.7
Calculate the median of the following data:
12, 16, 80, 0, 0, 0, 0, 0, 0, 0, 0, 0
Rank the data: 0, 0, 0, 0, 0, 0, 0, 0, 0, 12, 16, 80.
There is an even number of data items. The two central data items are both zero. The average of
these two numbers is zero and so the median is zero.
i i i . M o d e
The mode is the score that appears the most often. It is the most common score.
Why do you think educators might find the mode a useful measure of central tendency?

164
S o u r c e :
h t t p s : / / w w w . g o o g l e . c o m / s e a r c h ? q = i m a g e s + o f + m o d e + o f + s c o r e s & b i w = 1 7 6 0 & b i h
= 8 4 3 & t b m = i s c h & t b o = u & s o u r c e = u n i v & s a = X & e i = t 4 j F V P z N M 6 L d m A X Q 9 Y G w B w
& v e d = 0 C D M Q 7 A k
E x a mp le 6 .8
What is the mode of 1, 2, 2, 3, 3, 3, 3, 4 and 15?
The 3 appears more often than any other score and so it is the mode.
What is the mode of 2, 4, 9, 9, 10, 10, 13, 13, 13, 15, 19 and 19?
The 13 appears more often than any other score and so it is the mode.
Data may have two modes, in which case it is called bi-modal.
1.
A marathon race was completed by 5
participants in the times given below.
3.2 hr, 7.1 hr, 5.4 hr, 5.8 hr, 4.7 hr
What is the mean race time for this marathon?
2. i. Find the mean of the following numbers: 32, 24, 14, 18, 11, 10, 31. Show your working.
ii. Is the order of numbers important while calculating the mean? Why?
3. If the rainfall in Koro Island in a certain year was 12mm in January, 16 mm in February, 80
mm in March and in the remaining months of the year no rainfall was recorded, calculate the
mean rainfall for the Koro Island for that year. Show your working.
4. Calculate the median of: (Show all working)
Exercise 6.2

165
a) 32, 24, 14, 18, 11, 10 and 31.
b) 50, 65, 35, 60, 40, 90, 50, 48, 63, 27, 68 and 53.
c) Compare your working in a) and b) above. What is different about the two
workings? Why is this so?
5. What is the mode of:
1,1,2,2,3,3,3,3,4,4,4,5 and 6?
6. Below is a table showing the Maths marks of Year 9 students in a test
Marks Frequency
0 2
2 2
3 8
4 A
5 2
a. If the mean test mark is 3, find the value of A.
b. What is the:
i. Median mark?
ii. Modal mark?
6.2.1 Class Intervals And Histograms
When data does not fall into evenly spaced categories, we can make our own categories.
These categories are called class intervals. Class intervals should be equal in width and non-
overlapping. A histogram is a frequency graph of class intervals.
To make a frequency distribution table, first divide the numbers over which the data ranges
into intervals of equal length. Then count how many data points fall into each interval.
A histogram is "a representation of a frequency distribution by means of rectangles whose
widths represent class intervals and whose areas are proportional to the corresponding
frequencies." Online Webster's Dictionary
Finding The Mean Range, Mode And Median From Class Intervals.
Example 6.9
Create a frequency table and histogram of the data below on quiz grades.
67, 99, 88, 87, 95, 92, 100, 89, 73, 84, 85, 84, 93, 91, 72, 75, 98, 93, 83, 79

166
Solution
Intervals Frequency
65 - 74 3
75 - 84 5
85 - 94 8
95 - 104 4
Total 20
Calculate the range and mean, median and mode
Answers
i. Range= Highest score – Lowest score
100 – 65 = 35
ii. Mean= Sum of Centre of Interval x Frequency
Sum of frequency
Intervals Centre of Interval Frequency Total [Centre x Freq]
65 - 74 69.5 3 208.5
75 - 84 79.5 5 397.5
85 - 94 89.5 8 716
95 - 104 99.5 4 398
Total 20 1720
Mean= 20
1720 = 86
iii. Median= Sum of Cumulative Frequency + 1 = 21 = 10.5
2 2

167
Intervals Frequency Cumulative Frequency
65 - 74 3 3
75 - 84 5 8
85 - 94 8 16 10th
and 11th
scores
95 - 104 4 20
The median is between the 10th
and the 11th
scores which is in the 85-94 score
range so the median interval is 85-94.
iv. Mode=The most common score would be shown by the highest bar so the modal
interval is 85-94
1. Below are the marks obtained by learners in Year 10, Term 4.
51 64 56 53 72 45 42 46 57 41
51 63 50 45 64 53 48 47 34 48
39 52 36 55 58 46 50 39 48 44
57 47 54 41 36 54 46 44 57 52
49 77 70 49 41 60 54 69 53 65
i. Draw a frequency table for the data.
ii. Show the data on a histogram.
iii. Find the:
Mean
Range
Median
Mode
2. Apenisa grows two different types of cucumber plants (Type A and Type B) in his
greenhouse. One week he keeps a record of the number of cucumbers he picks from each
type of plant.
Day Mon Tue Wed Thu Fri Sat Sun
Type A 5 5 4 1 0 1 5
Type B 3 4 3 3 7 9 6
Exercise 6.3

168
i. Calculate the mean, median and mode for the Type A cucumber plants
ii. Calculate the mean, median and mode of the Type B cucumber plants
iii. Which measure would you argue that there is no difference between type A and
Type B plants?
iv. Which measure would you argue that Type A is the best plant?
v. Which measure would you argue that Type B is the best plant?
6.3 Measures of Dispersion
For a more informative numerical summary, we need some measure of dispersion, sometimes
called the spread, of observations. This gives us the information of how spread out the values of
a data set is.
i. The Range
The range is defined as the difference between the largest score in the set of data and the
smallest score in the set of data.
Formula: Range = Highest Score – Lowest Score
LEARNING OUTCOMES
Students should be able to:
Identify and describe different measures of dispersion
Calculate the measures of dispersion from an ungrouped data
Calculate the measures of dispersion from frequency tables
Interpret the meaning of numerical values representing measures of dispersion
Relate the measures of dispersion to real life situations

169
Source:
https://www.google.com/search?q=images+of+range+of+scores&biw=1760&bih=843&tbm=isch&tbo=u&source=u
niv&sa=X&ei=eIvFVNmnJ4GsmAWvwIHQDQ&ved=0CDEQ7Ak
Example 6.10
What is the range of the following data:
4 8 1 6 6 2 9 3 6 9
The largest score is 9; the smallest score is 1; the range is 9 - 1 = 8
i i . Q u a r t i l e s a n d t h e i n t e r q u a r t i l e r a n g e
The median divides the data into two equal sets, the first (usually to the left of the median) and
the second.
The lower quartile is the value of the middle of the first set, where 25% of the values are
smaller than Q1 and 75% are larger. This first quartile takes the notation Q1.
The upper quartile is the value of the middle of the second set, where 75% of the values
are smaller than Q3 and 25% are larger. This third quartile takes the notation Q3.
It should be noted that the median takes the notation Q2, the second quartile
The interquartile range is the difference between the lower and upper quartiles. The quartiles
split the data into quarters. In other words:
lower quartile(Q1) = splits lowest 25% of data
second quartile (Q2) = cuts data set in half = also known as the median
third quartile (Q3) = upper quartile = splits highest 25% of data, or lowest 75%
The difference between the upper and lower quartiles is called the interquartile range

170
Example 6.11
For the set given below, identify the median, the middle value of the 1st set and the middle value
of the 2nd
set
45, 47, 52, 52, 53, 55, 56, 58, 62, 80
Answer
Example 6.12
Identify the median, the upper and lower quartiles
Example 6.13
Find the upper and lower quartile of the following set of data
1, 11, 15, 19, 20, 24, 28, 34, 37, 47, 50, 57
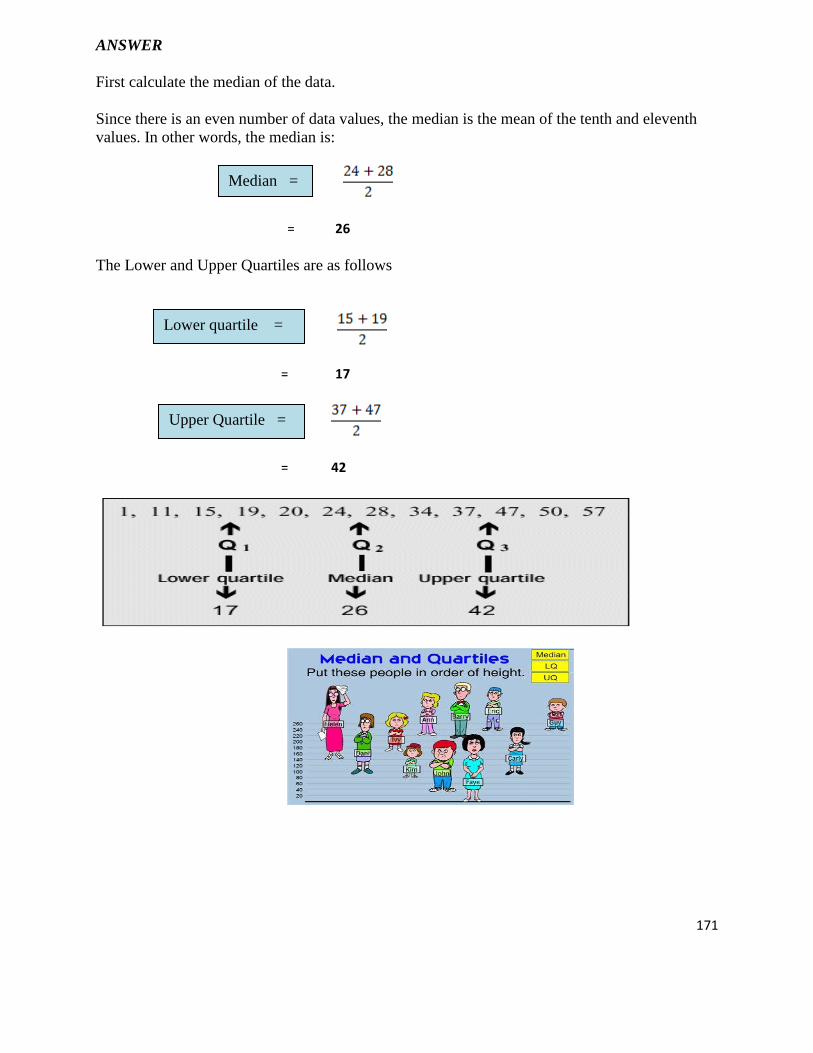
171
ANSWER
First calculate the median of the data.
Since there is an even number of data values, the median is the mean of the tenth and eleventh
values. In other words, the median is:
= 26
The Lower and Upper Quartiles are as follows
= 17
= 42
Median =
Lower quartile =
Upper Quartile =

172
Example 6.14
7, 1, 3, 6, 3, 7 may be ordered as 1, 3, 3, 6, 7, 7
i. The sample median is : 1, 3, 3, 6, 7, 7
= 3 + 6
= 9 ÷ 2 = 4 .5
ii. The upper quartile and lower quartile is:
1, 3, 3, 6, 7, 7
Q1 = 3 and Q3 = 7
iii. The interquartile range is:
1, 3, 3, 6, 7, 7
= 7 – 3 = 4
The s t a n d a r d d e v i a t i o n : A measure that does not require sorting of the data and has
good statistical properties is the standard deviation.
The Standard Deviation is a measure of how spread out numbers is.
Its symbol is σ (the Greek letter sigma)
1. The list below shows the prices of soft drinks at Sunshine Supermarket:
$1.50, $2.00, $3.20,$3.20, $4.00, $4.80, $2.40
a. Find the median price of a soft drink
b. Find the range
Exercise 6.4
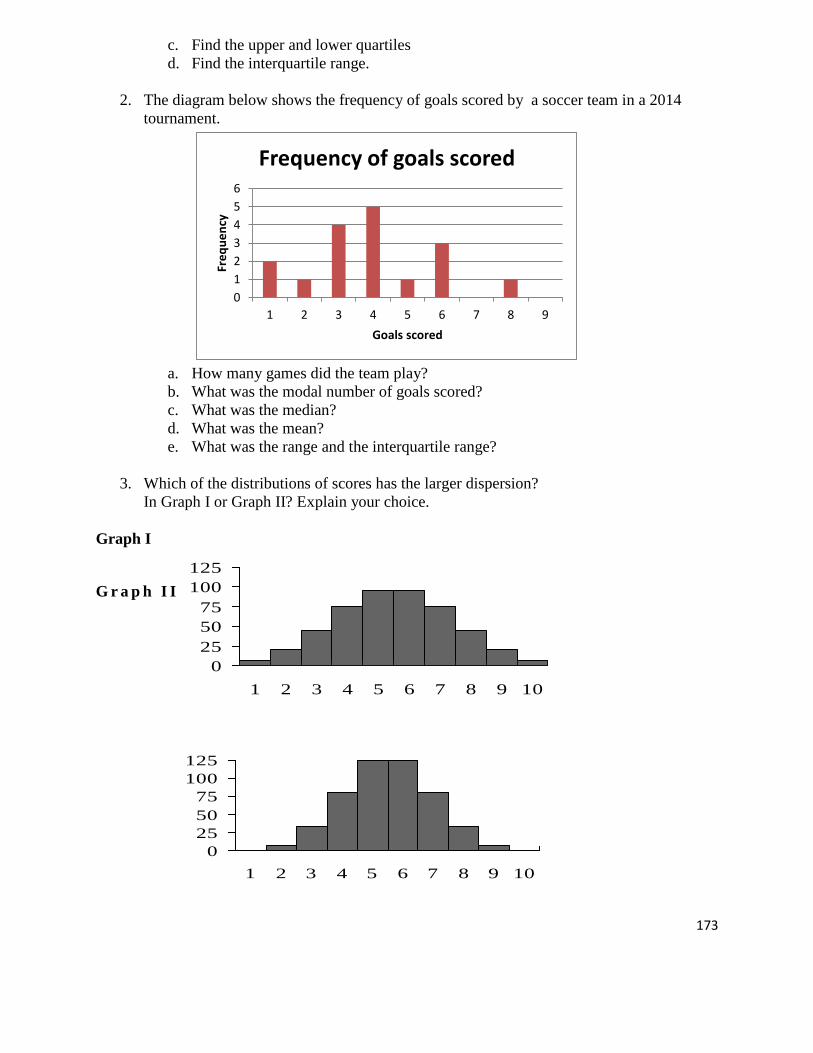
173
c. Find the upper and lower quartiles
d. Find the interquartile range.
2. The diagram below shows the frequency of goals scored by a soccer team in a 2014
tournament.
0
1
2
3
4
5
6
1 2 3 4 5 6 7 8 9
Fre
qu
en
cy
Goals scored
Frequency of goals scored
a. How many games did the team play?
b. What was the modal number of goals scored?
c. What was the median?
d. What was the mean?
e. What was the range and the interquartile range?
3. Which of the distributions of scores has the larger dispersion?
In Graph I or Graph II? Explain your choice.
Graph I
G r a p h I I
0
25
50
75
100
125
1 2 3 4 5 6 7 8 9 10
0
25
50
75
100
125
1 2 3 4 5 6 7 8 9 10

174
Statistics in Real life Situations
Find an article from a newspaper or magazine which includes a graphical form of data
representation. Read the whole article and study the graph carefully before answering the
following questions.
1. What was the investigation about?
2. How is the data represented?
3. Is the presentation used to compare sets of data? If it is, then what is the comparison about?
4. Is the data represented clearly? Give reasons for your answer. Explain any abuses of
statistics which you feel are present, if there are any.
5. Discuss the usefulness of the data.
6. What technology (such as computers) do you think was used to collect the data?
7. Will it be a useful exercise for the learners? Why?
Exercise 6.5
In today’s information over-loaded age, statistics is a very useful subject to learn.
Newspapers are filled with statistical data and anyone who is ignorant is at a risk of
being misled about important real- life decisions as to what to eat, who is leading the
polls, the dangers of smoking etc. Knowing a little about statistics will help you to
make informed decisions. When used correctly, statistics can also tell us any trends in
what happened in the past and can be useful in predicting what may happen in the
future.

175
PROBABILITY
Introduction
Probability is simply how likely something is to happen. Whenever we‟re unsure about the
outcome of an event, we can talk about the probabilities of certain outcomes (how likely they
are). The analysis of events governed by probability is called statistics.
6.4 Probability Experiments
Probability we had said earlier is the likelihood or chance that something will happen. The
highest probability an event can have is 1 or 100% and it means that the event will certainly
happen. The lowest probability is 0% meaning that the event is certainly not going to happen.
LEARNING OUTCOMES
Students should be able to:
Define simple probability terms
Perform simple probability experiments and determine relative frequency outcomes
Probability can be expressed as a ratio, a percentage or as a fraction

176
Probability Key Terms
Experiment
An experiment or a trial in probability is a test to see what will happen in case you do
something. A simple example is flipping a coin. When you flip a coin, you are
performing an experiment to see what side of the coin you'll end up with.
Outcome
An outcome in probability refers to a single (one) result of an experiment. In the example
of an experiment above, one outcome would be heads and the other would be tails.
Source: https://www.google.com/search?q=google&ie=utf-8&oe=utf-
8#q=images+of+an+outcome+in+a+probability
Event
An event in probability is the set of a group of different outcomes of an experiment.
Suppose you flip a coin multiple times, an example of an event would the getting a
certain number of heads.
Source: https://www.google.com/search?q=google&ie=utf-8&oe=utf-
8#q=images+of+an+event+in+a+probability

177
Sample Space
A sample space in probability is the total number of all the different possible outcomes of
a given experiment. If you flipped a coin once, the sample space S would be given by:
S = (H, T)
If you flipped the coin multiple times, all the different combinations of heads and tails
would make up the sample space. A sample space is also defined as a Universal Set for
the outcomes of a given experiment.
Source: https://www.google.com/search?q=google&ie=utf-8&oe=utf-8#q=images+of+a+sample+space
1. Which of these can you be certain of?Why?
i. Your height
ii. Cost of your fare to school
iii. Exact time of arrival of your school bus
2. Write the following probabilities as percentages:
i. 0.35
ii. 2/3
iii. 1 out of 5
3. List the sample space for:
i. Throwing a single die
ii. Throwing two dice
iii Tossing a coin
Exercise 6.6

178
Basic Concepts Of Probability
i. We can use probability to make decisions.
For example:
The weather report might say that the probability of rain is 40%. This means that there is a 40%
chance that it will rain and a 60% chance that it won‟t (40% + 60% = 100%). This probability
will help us to make decisions regarding activities like picnics or games to organize for the day.
ii. We can use probability to make predictions.
For example:
The probability of tossing a single coin and getting a tail is 0.5. If we toss the coin 30 times how
many times will we get tails?
Probability of tails x Number of tosses = Number of tails
0.5 x 30 = 15 tails
iii. We can estimate probability from observations.
Example 6.15
In April 2014, the Levuka Islanders counted 17 sunny days out of a total of 30. They assumed
then that the probability of a sunny day in April 2015 will be the same as the percentage of sunny
days last April.
Source: https://www.google.com/search?q=google&ie=utf-8&oe=utf-8#q=images+of+sunny+day
= = 0 57 = 56.7%
Do you think the islanders are correct in saying that the weather in the future will be like in the
past?
179
They are correct in assuming the weather will be like the previous years but they are not correct
in counting the number of sunny days from just one year. It would be better to take the number
of sunny days over several years.
Sunny days in April over 10 years = 120 = 0.4 = 40%
Total days in April over 10 years 300
The more data we use for our estimation the better it will be.
iv. We can find the probability of events by calculating the relative frequency.
Relative Frequency is the number of successful trials divided by the total number of trials.
Relative frequency = no. of successful trials / Total count
The above equation expresses relative frequency as a proportion. It is also often expressed as a
percentage. Thus, a relative frequency of 0.40 is equivalent to a percentage of 40%.
Example 6.16
Tossing a coin
Source: https://www.google.com/search?q=google&ie=utf-8&oe=utf-8#q=images+of+tossing+a+coin+10+times
Raju tosses a coin 20 times and gets a total of 14 heads. The relative frequency of the head is:
Relative frequency = no. of successful trials / Total count
= 14/ 20 = 0.7
Example 6.17
Rolling a Die
Source: https://www.google.com/search?q=google&ie=utf-8&oe=utf-8#q=images+of+rolling+dice

180
a. Sera did an experiment in which she threw a single die 50 times. She found that the
relative frequency of a “five” was 0.2. How many “fives” did she get:
Relative frequency = no. of successful trials / Total count
0.2 = x / 50
x = 10 “fives”
b. If Sera throw the same die 150 times, how many “fives” should she expect?
Relative frequency = no. of successful trials / Total count
0.2 = x / 150
x = 30 “fives”
Example 6.18
Drawing a card
Mani did an experiment to find the probability of drawing a black card from a standard deck of
52 cards.
The table below shows the data of the relative frequencies in various trials:
Trials Relative Frequencies
5 0.2
10 0.8
15 0.57
20 0.3
25 0.4
30 0.43
35 0.57
40 0.50
45 0.52
50 0.49

181
a. What is the limit of relative frequency?
We plot the data given above on a graph.
The graph above shows that the relative frequency starts very low then goes very high and then comes closer and closer to 0.5. If we keep increasing the number of trials, it will keep getting closer to 0.5. So, the limit of relative frequency is 0.5.
b. What is the probability of drawing a black card?
The probability of an event is equal to the limit of its relative frequency. So, the probability of drawing a black card is 0.5.
1.a) If you toss a fair coin, the probability of getting “heads” is 0.5
i. Write this probability as a percentage.
ii. If John tosses the coin 28 times how many times would you expect to get heads?
iii. Will you always get tails this many times when anyone does this experiment? Explain.
2. When a child is born the probability that it will be a girl is equal to that it will be a boy:
both probabilities are 0.5
Exercise 6.7
182
i. If 300 babies were born in CWMH how many would you expect to be
girls?
ii. How many would you expect to be boys?
3. The probability of getting a surprise Accounting test in Year 10 is 0.25.
Source: https://www.google.com/search?q=google&ie=utf-8&oe=utf-
8#q=images+of+cartoon+students+sitting+tests
If there are 180 school days in the year, how many surprise tests can students expect?
Is it certain that students will have this many surprise tests? Explain.
4. The table below shows the percentage of Rosi High School Year 10 students who passed
their mathematics test over the last 5 years.
Year 1 2 3 4 5
Pass rate 90% 99% 100% 87% 91%
i. Find the average pass rate of students.
ii. What is the probability of a randomly selected student passing this year?
iii. If there are 260 students in Year 10, how many are likely to pass?
5. Some students in Year 10 investigated the probability of a box landing on its side as
shown below.
i. Use the data below to calculate the relative frequency for each set of toss.

183
Trials Side Trials Side
5 3 30 8
10 2 35 18
15 0 40 6
20 9 45 10
25 14 50 19
ii. On graph paper draw the graph of the relative frequency.
iii. What seems to be the limit of relative frequency?
iv. What is the probability of the matchbox landing on its side?
v. Is this reasonable? Explain in terms of the shape of the matchbox.
6.5 Events Of Probability
Source: https://www.google.com/search?q=google&ie=utf-8&oe=utf-8#q=images+of+life
LEARNING OUTCOMES
Students should be able to:
Identify and define the different types of events
Describe the probability
Life is full of random events! We need to get a "feel" for them to be smart and successful people.

184
The throw of a dice, toss of a coin and lottery draws are all examples of random events.
When we say "Event" we mean one (or more) outcomes.
An event therefore is defined as any outcome that can occur.
Types Of Probability Events
An event can include several outcomes:
Choosing a "King" from a deck of cards (any of the 4 Kings) is an event
Rolling an "even number" (2, 4 or 6) is also an event
Getting a Tail when tossing a coin is an event
Rolling a "5" is an event.
Let's look at each of those types of events.
o Random event
In a random event all the outcomes have the same probability.
Example 6.19
Tossing a coin is a random event because “heads” and “tails” both have the same chance of
occurring.
Source: https://www.google.com/search?q=google&ie=utf-8&oe=utf-8#q=IMAGES+OF+FIJI+COINS
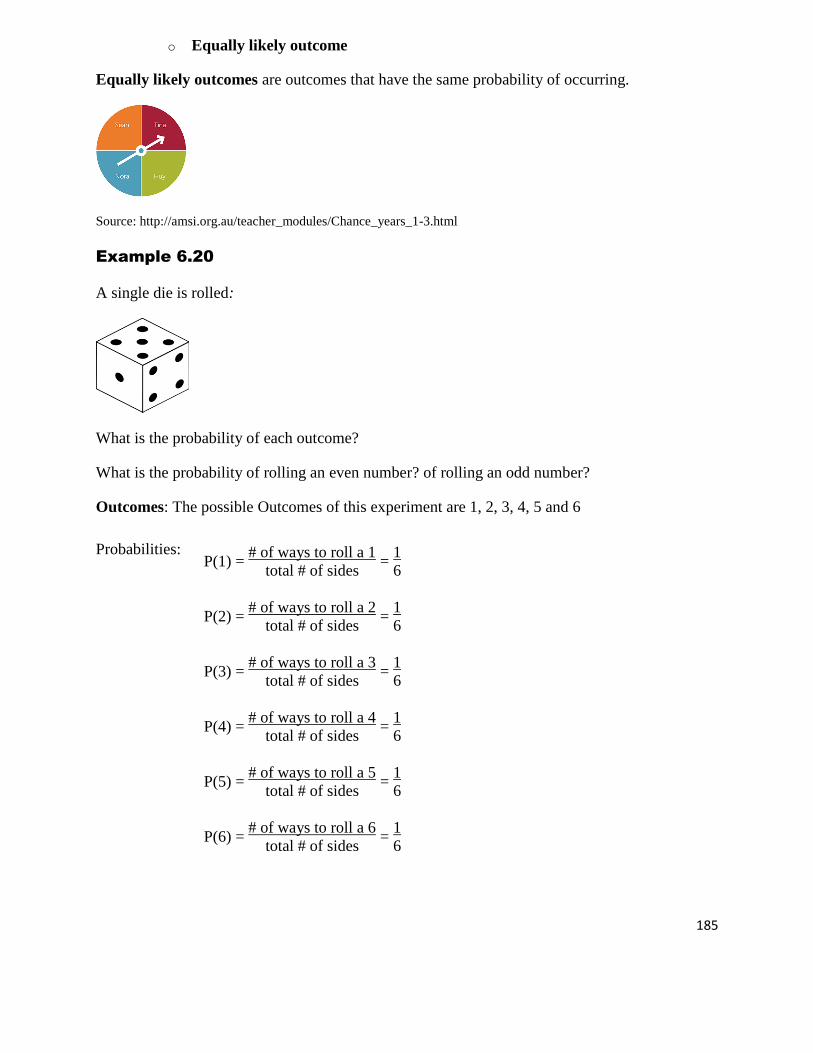
185
o Equally likely outcome
Equally likely outcomes are outcomes that have the same probability of occurring.
Source: http://amsi.org.au/teacher_modules/Chance_years_1-3.html
Example 6.20
A single die is rolled:
What is the probability of each outcome?
What is the probability of rolling an even number? of rolling an odd number?
Outcomes: The possible Outcomes of this experiment are 1, 2, 3, 4, 5 and 6
Probabilities: P(1) =
# of ways to roll a 1 =
1
total # of sides 6
P(2) = # of ways to roll a 2
= 1
total # of sides 6
P(3) = # of ways to roll a 3
= 1
total # of sides 6
P(4) = # of ways to roll a 4
= 1
total # of sides 6
P(5) = # of ways to roll a 5
= 1
total # of sides 6
P(6) = # of ways to roll a 6
= 1
total # of sides 6

186
In this experiment the probability of rolling each number on the die is always one sixth. We say
that the outcomes are equally likely to occur.
Knowing that the above are equally likely outcomes we can calculate their probabilities without
doing the experiment i.e the probability of anyone of them is equal to 1 divided by the number of
outcomes:
1 ÷ 6 = 6
1
o Fair event
Tossing a fair coin is a random event. This means that all the outcomes are equally likely.
Source: https://www.google.com/search?q=google&ie=utf-8&oe=utf-8#q=images+of+fair+events
o Biased event
This means that the probabilities of the outcomes are not equal.
.
Biased samples can occur two ways:
"With careful and prolonged planning, we may reduce or
eliminate many potential sources of bias, but seldom will we be
able to eliminate all of them. Accept bias as inevitable and then
endeavor to recognize and report all exceptions that do slip thought
the cracks."
Good and Hardin (2006) Common Errors in Statistics (and How to
Avoid Them), p. 113
1. If the sample selected is not representative of the population to be surveyed.

187
Example:
The city council is going to vote on whether to keep its leash laws.
Sample 1 ~ survey dog owners
Sample 2 ~ survey people who don’t have pets
Sample 3 ~ surveying some people who own dogs and some who don’t.
Which sample shows the least bias?
Answer
Sample 3 ~ equal chances of yes or no answers
Example:
Wording 1 ~ Should the mayor approve a bill requiring dogs that are outdoors to be on
leashes at all times, instead of running over people’s property?
Source: https://www.google.com/search?q=google&ie=utf-8&oe=utf-8#q=images+of+dogs
Wording 2 ~ Should the mayor approve a bill requiring dogs that are outdoors to be on
leashes at all times, instead of running freely to exercise?
Wording 3 ~ Should the mayor approve a bill requiring dogs that are outdoors to be on
leashes at all times?
Which wording shows the least bias?
Answer
Wording 3 ~ the other two wordings make it sound like either a bad idea or good idea to let
the dogs run freely.
2. If the survey questions are worded in ways meant to lead the people surveyed to
give a certain answer.

188
1. Identify more likely, less likely, equally likely, sure and impossible events:
i. Selection of a white ball from a box with 5 white balls, 8 red balls and 10 yellow
balls.
ii. Selection of a black card from a deck of cards
iii. Occurrence of even number when a die is rolled.
iv. Selection of red marble from a box with 12 red marbles.
v. Selection of red marble from a box with 12 white balls.
vi. Selecting a boy for a field trip from a group of 35 students with 12 girls.
2. A fair dice is tossed:
i. Write down the set of possible outcomes.
ii. Are the outcomes equally likely?
iii. What must the sum of the probabilities of all the possible outcomes
iv. Find the probability of each of the outcomes listed in iii.
3. State whether or not a sample is biased. If so, identify the source of the bias in the following
scenarios.
(a). A movie theater surveyed patrons 45 years of age and older and asked what type of
movie they prefer.
(b). The student body wants to survey the 8th grade class to choose a theme for the winter
dance. They surveyed Mr. Walker‟s 3rd period art class.
(c). The patrons of a pet store were asked what their favorite type of pet is.
(d). Students are asked, “Are you willing to waste weekend time volunteering at an animal
shelter?”
(e). Parents are asked, “Should we develop hand-eye coordination in our children by
teaching them how to play computer games?”
Exercise 6.8

189
Determining Probability From An Experiment
For example, if a dice is rolled 6000 times and the number '5' occurs 990 times, then the
experimental probability that '5' shows up on the dice is 990/6000 = 0.165.
On the other hand, theoretical probability is determined by noting all the possible outcomes
theoretically, and determining how likely the given outcome is. Mathematically,
LEARNING OUTCOME
Students should be able to:
Determine the probability from an experiment consisting of equally
likely outcomes for example; drawing a colored ball from a box.
Experimental probability refers to the probability of an event occurring when an experiment
was conducted.

190
1. A bag contains 7 red marbles, 3 blue marbles, and 1 green marble. What is the probability
of choosing a marble that is not blue?
A. 11/8 B. 3/11
C. 3/8 D. 8/11
2. A bag contains 6 red, 3 blue, 2 green and 1 white balls. A ball is picked at random. What
is the probablity that it is:
1. red
2. blue or white
3. not green
4. not green or red?
3. A card is selected randomly from a pack of 52. What is the probability that it is:
1. the 2 of hearts
2. a red card
3. a picture card
4. an ace
5. a number less than 4?
4. Even numbers from 2 -100 are written on cards. What is the probability of selecting a
multiple of 5, if a card is drawn at random?
6.6 Probability Formula
LEARNING OUTCOMES
Students should be able to:
Solve the probability of an event P (E)
Determine the expected number of occurrences in a sequence
of independent trials
Exercise 6.9

191
Probability formula is the ratio of number of favorable outcomes to the total number of possible
outcome.
Probability of an event X is symbolized by P(X). Probability of an event X is lies between 0 ≤
P(X) ≤ 1.
Probability of an event = (number of ways it can happen) / (total number of outcomes)
P(X) = (no. of ways X can happen) / (Total number of outcomes)
How to find the probability:
Step 1: List the outcomes of the experiment.
Step 2: Count the number of possible outcomes of the experiment.
Step 3: Count the number of favorable outcomes.
Step 4: Use the probability formula.
Example 1: Rolling dice
When rolling a single die, there are six different outcomes: {1,2,3,4,5,6}
i. What‟s the probability of rolling a „1‟?
ii. What‟s the probability of rolling a „1‟ or a „6‟?
iii. What‟s the probability of rolling an even number? (i.e. rolling a 2, 4 or 6)
Using the formula from above:

192
P(A) = (no. of ways A can happen) / (Total number of outcomes)
The probability of rolling a „1‟ is 6
1
The probability of rolling a „1‟ or a „6‟ is 6
2 or
3
1
The probability of rolling an even number is 6
3
Example 6.21
Two dice are rolled once. Calculate the probability that the sum of the numbers on the two dice
is 6.
Solution: Possible outcomes (Sample Space) = {(1, 1), (1, 2),...............,(1, 6), (2, 1), (2, 2),................,
(2, 6), (3, 1), (3, 2),...........,(3, 6), .............,(4, 1), (4, 2),..........,(4, 6), (5, 1), (5,2),...............,(5, 6),
(6, 1), (6, 2),......................,(6, 6)}
Total possible outcomes = 36
No. of outcomes of the experiment that are favorable to the event that a sum of two events is 6
=> Favorable outcomes are: (1, 5), (2, 4), (3, 3), (4, 2) and (5, 1)
Number of favorable outcomes = 5
Use, probability formula = Number of favorable outcomes/Total number of possible outcomes
= 36
5
The probability of a sum of 6 is 36
5

193
Using the above formula find:
i. A card is drawn at random from a deck of cards. Find the probability of getting the 5 of
diamond.
ii. Two dice are rolled, find the probability that the sum is
a) equal to 1
b) equal to 5
c) less than 13
iii. A jar contains 4 red marbles, 6 green marbles and 10 white marbles. If a marble is drawn
from the jar at random, what is the probability that this marble is white?
6.7 Properties Of Probability
LEARNING OUTCOMES
Students should be able to:
Find out why the sum of all probabilities for an experiment is equal to one
Examine and explain why the probability of an event is between zero and one
Apply the above properties to real life situations
Exercise 6.10
Note:
The probability of event A is often written as P(A) If P(A) > P(B) then event A has a higher chance of occurring than event B If P(A) = P(B) then events A and B are equally likely to occur

194
i. The probability of an event can only be between 0 and 1.
0 ≤ P (A) ≤ 1
In other words, the highest probability an event can have is 1 or 100% (certain to happen)
and the lowest probability is 0(certain not to happen). Probabilities between 0 and 1 mean
that the event might happen; the higher the probability, the greater the chance that it will
happen.
ii. The sum of the probabilities of an event and its complementary is 1, so the probability of
the complementary event is:
iii. The probability of an impossible event is zero.
1. Which of the following events has the highest probability of occurring?
a. The probability of rain on Christmas day is 65%.
b. The probability of tossing a coin and getting a “tail” is 0.5%
c. The probability of the Fiji Rugby team winning the rugby game in Dubai is 2 out
of 15
d. The probability of rolling two dice and getting a total of 8 is 5/36
2. A lollie was picked from a bag that contains 1 blue lollie, 1 red lollie and 1 orange
lollie.
a. List the sample space
b. What is the probability of picking a red lollie?
c. What is the probability of picking a lollie that is not red?
d. What is the probability of picking a white lollie?
Exercise 6.11

195
Application Of Probability
It is true that the future cannot be predicted but mathematics can help determine its probability
and how likely something might occur or not. In our daily lives we often use probability to make
better decisions.
Here are some of the common categories to discuss:
Sports – be it basketball or football and coin is tossed and both teams have 50/50 chances
of winning it, a basketball player takes a free throw judging his past performance it can
be determined if he will make it or not.
Board Games – a game spinner with four sections, there is a 25% chance of it landing
blue, since one of the 4 sections is blue. Similarly the odds of rolling one die and getting
and odd number there is a 50% chance since three of the six numbers on a die are odd.
“The probable is what usually
happens.” - Aristotle.
196
Source: https://www.google.com/search?q=google&ie=utf-8&oe=utf-8#q=images+of+SPINNERS
Medical Decisions – When a patient is advised to undergo surgery, they often want to
know the success rate of the operation which is nothing but a probability rate. Based on
the same the patient takes a decision whether or not to go ahead with the same.
Source: https://www.google.com/search?q=google&ie=utf-8&oe=utf
8#q=cartoon+images+of+hospital+patients
Life Expectancy – this is based on the number of years the same groups of people have
lived in the past. “These ages are used as guidelines by entities such as financial advisers
to help clients prepare for their retirement years.” – ehow.com
Source: https://www.google.com/search?q=google&ie=utf-8&oe=utf-8#q=images+of+life+expectancy

197
Weather – when planning an outdoor activity, people generally check the probability of
rain. Meteorologists also predict the weather based on the patterns of the previous year,
temperatures and natural disasters are also predicted on probability and nothing is ever
stated as a surety but a possibility and an approximation.
Therefore, even though we do not realize the use of mathematical probabilities in
everyday life, subconsciously we use it in every step that we take.
1. Calculate the probability of obtaining the following outcomes when rolling a die:
i. An even number.
ii. A multiple of three.
iii. A five or a six.
2. Find the probability of obtaining the following outcomes when flipping two coins:
Source: https://www.google.com/search?q=google&ie=utf-8&oe=utf-8#q=images+of+cartoon+boy+tossing+a+coin
Exercise 6.12
198
i. Two heads.
ii. Two tails.
iii. One head and one tail.
4. There are 20 raffle tickets in an envelope. Eight are for a car, and the rest are blank. Find
the probability of drawing a ticket for the car if:
i. Only one raffle ticket is extracted.
ii. Two raffle tickets are extracted.
iii. Three raffle tickets are extracted.
4. Students A and B have probabilities of failing an exam of 1/2 and 1/5 respectively. The
probability of them both failing the examination is 1/10. Determine the probability that at
least one of the two students fail.
Source: https://www.google.com/search?q=google&ie=utf-8&oe=utf-
8#q=images+of+cartoon+students+failing+exams
5. A father and a son go hunting. The father kills an average of 2 animals every 5 shots and
the son kills one animal every 2 shots. If the two fired at the same animal at the same
time, what is the probability that they will obtain a kill?

199
Source: https://www.google.com/search?q=google&ie=utf-8&oe=utf-8#q=images+of+cartoon+people+go+hunting
6. A class consists of 10 boys and 20 girls. Exactly half of the boys and half of the girls
have brown eyes. Determine the probability that a randomly selected student will be a
boy or a student with brown eyes.
Source: https://www.google.com/search?q=google&ie=utf-8&oe=utf-
8#q=images+of+cartoon+students+who+have+brown+eyes
7. The probability that a husband and wife will still be living in 20 years is ¼ for the
husband and is 1/3 for the wife. Calculate the probability that:
Source: https://www.google.com/search?q=google&ie=utf-8&oe=utf-
8#q=images+of+husband+and+wife+
Of them both being alive in 20 years.
The husband living in 20 years but not the wife.
The husband and the wife dying before 20 years.

200
GLOSSARY 1 Bar graph A chart that uses bars to show comparisons between categories of data. The bars can
be either horizontal or vertical 2 Central tendency A measure of central tendency is a measure that tells us where the middle of a bunch
of data lies. 3 Complementary Two events are complementary if they are the only two possible outcomes 4 Dispersion Denotes how stretched or squeezed a distribution is 5 Event It is any collection of outcomes of an experiment. 6 Experiment It is any procedure that can be infinitely repeated and has a well-defined set of possible
outcomes, known as the sample space 7 Frequency The number of times the event occurred in an experiment 8 Histogram It represents a frequency distribution by means of rectangles whose widths represent
class intervals and whose areas are proportional to the corresponding frequencies: the height of each is the average frequency density for the interval
9 Interquartile range Equal to the difference between the upper and lower quartile 10 Lower quartile The median of the lower half of the data 11 Mean Sum total of all the observations divided by the number of observations. 12 Median If the data is arranged in the increasing or decreasing order then the middlemost value
of the data 13 Mode Observation has appeared the most number of times 14 Outcome A single (one) result of an experiment 15 Pictogram Visual presentation of data using icons, pictures, symbols 16 Pie chart A circular statistical graph, which is divided into sectors to illustrate numerical
proportion 17 Probability The relative possibility that an event will occur, as expressed by the ratio of the number
of actual occurrences to the total number of possible occurrences 18 Quartile A set of data values are the three points that divide the data set into four equal groups 19 Random sample It is a subset of individuals (a sample) chosen from a larger set (a population). Each
individual is chosen randomly and entirely by chance, such that each individual has the same probability of being chosen at any stage during the sampling process, and each subset of k individuals has the same probability of being chosen for the sample as any other subset of k individuals
20 Range Difference between the highest value and the lowest value 21 Relative frequency The ratio of the actual number of favourable events to the total possible number of
events 22 Sample space The total number of all the different possible outcomes of a given experiment 23 Standard deviation It is a measure of how numbers are spread out 24 Statistics A branch of mathematics dealing with the collection, analysis, interpretation, and
presentation of masses of numerical data 25 Upper quartile The median of the upper half of the data.