Embed Size (px)
Citation preview

HAL Id: halshs-00868217https://halshs.archives-ouvertes.fr/halshs-00868217
Preprint submitted on 1 Oct 2013
HAL is a multi-disciplinary open accessarchive for the deposit and dissemination of sci-entific research documents, whether they are pub-lished or not. The documents may come fromteaching and research institutions in France orabroad, or from public or private research centers.
L’archive ouverte pluridisciplinaire HAL, estdestinée au dépôt et à la diffusion de documentsscientifiques de niveau recherche, publiés ou non,émanant des établissements d’enseignement et derecherche français ou étrangers, des laboratoirespublics ou privés.
Union Membership does not payMathieu Bunel, Gilles Raveaud
To cite this version:
Mathieu Bunel, Gilles Raveaud. Union Membership does not pay. 2011. �halshs-00868217�

Wor
kin
g P
aper
Uni
vers
ity
of R
enne
s 1
Uni
vers
ity
of C
aen
Union Membership does not pay:
Evidence from recent French Micro Data
Mathieu Bunel University of Caen Basse-Normandie - CREM UMR CNRS 6211, France
Gilles Raveaud Institut d’Etudes Européennes, Université Paris 8 Saint-Denis
Octobre 2012 - WP 2012-32
Centre de Recherche en Économie et ManagementCenter for Research in Economics and Management
1
UNION MEMBERSHIP PAYS LITTLE IN FRANCE:
EVIDENCE FROM RECENT MICRO DATA
BUNEL Matthieu1
RAVEAUD Gilles2
ABSTRACT:
We used a French employer–employee representative survey to estimate, within private firms
covered by union contracts, the union member wage premium. Our estimates are based on
several methods: ordinary least squares with averaged individual characteristics at the
workplace level, the propensity score and separated equations. We found no wage penalty for
non union members. There exists a union membership wage premium for blue collar and
office workers, which is of a limited amount (around 3%). Thus, for most workers in France,
there is no important financial gain associated with union membership.
Key words: Union wage premium, union membership, employer-employee data, propensity
score method, separated equations method
1 Université de Caen Basse-Normandie (UCBN), Laboratoire CREM and Fédération de recherche TEPP, 19, rue Claude Bloch, 14000 Caen - France, Tel: +33 (0)2-31-56-59-80, Fax: +33 (0)3-1-56-62-15, E-mail: [email protected]
2 Institut d’Etudes Européennes, Université Paris 8 Saint-Denis, 2, rue de la Liberté, 93 526 Saint-Denis cedex -France, Tel: +33 (0)1-45-43-10-45, E-mail: [email protected]

2
Trade unions are a key feature of industrial relations in France, even if they have few
members. In international comparison, France is characterized by a very low level of union
membership (8%), a high union coverage (92%) and an average presence of unions at the
workplace (40%).
This paradox can be explained by a variety of institutional factors, such as the fact that the
main unions are, by law, supposed to “represent” all workers, regardless of their membership.
Also, the access of unions to public financing and their bargaining power are, to a certain
extent, unrelated to their membership.
On their side, workers can join a union for a variety of raisons. For instance, as French unions
have specific political orientations, joining a union can be a way to push forward specific
political demands (Friedman 1988; Besancenot & Vranceanu 1999). Also, workers may want
to benefit from specific information that their local union can provide; or peer pressure might
lead them to join. Lastly, workers can also join a union in order to become staff delegates. In
fact, due to the small number of union members compared to the number of positions to be
filled in various professional settings, most of the union members have responsibilities as staff
delegates, at the local or national level (Andolfatto & Labbé, 2007).
A question which is notably absent in the literature on French unions is the financial incentive
to join a union. Given, in particular, the political nature of French unions, this point has
generally been dismissed a priori as irrelevant by many scholars. But this does not mean that
such gains do not exist. Also and more importantly, the low level of union membership in
France, together with recent law changes, have lead unions themselves to ask for financial
gains associated with membership.
Some recent applied papers have studied the specific impact of union membership on wages
in the covered sector (Booth & Chattererji 1995; Budd & Na 2000; Fang & Verma 2002;

3
Booth & Bryan, 2004), by using British or US data. For France, Blanchflower & Bryson
(2003) proposed the only estimate known. Using a very small sample (less than 700
individuals, taken from the International Social Survey Program for the years 1996-1998),
they found a positive but not significant union membership wage premium (UMWP).
The aim of this paper is thus to assess the amount of the UMWP in France. Our purpose of
study is the measure of the individual wage gain by a worker when he or she joins a union.
This calls for two immediate clarifications. Firstly, let us stress that estimating the magnitude
of the UMWP does not imply that we make any assumption regarding the motivations for
membership. In fact, this paper does not study the motives for joining a union. Secondly, we
do not study the global impact of unions on the level of wages at different levels (workplace,
firm, industry).
To specify the relation between union membership and wage in the French context, we used a
very large sample, based on REPONSE, a merged representative employer–employee survey
conducted in 2005 (see appendix). To control for selection process, we restricted our analysis
to workers employed in firms where at least one trade union is present. Moreover, given the
sensitivity of the results obtained in the literature to the econometric method, our estimates are
based on the usual estimates: the simple ordinary least squares on pooled workers (OLS);
OLS with workplace dummies; OLS with averaged individual characteristics at the workplace
level (Booth & Bryan 2004); the propensity score method (Bryson 2002); and separated
equations (Andrews & al. 1998). In order to minimize measurement errors and to deal with a
homogeneous definition of the wage, we merged our sample with administrative files to
obtain the effective compensation received by employees.
Overall, our results point out that there is no wage penalty for non union members, except for
blue collar and office workers. For these workers, the UMWP is around 3%. For other
workers, we generally find a negative premium, but coefficients are not significant. Thus, for

4
these workers, financial motives cannot play a large role in their decision to join a union. The
structure of the paper is as follows: Sections 2 and 3 present the French union membership
situation and a short survey of the UMWP existing estimations. In section 4 we describe our
data and present some descriptive statistics. Section 5 displays the econometric strategy and
discusses the results. Section 6 concludes.
UNION MEMBERSHIP IN FRANCE
In 2004, only 1.9 million French workers, that is 8% of the total workforce, are trade union
members (Amossé 2004). The figures are lower in the private sector (5%) and in small firms
(4%); they are higher in the public sector (15%) and in large firms (9%).
Why there are so few union members in France
Among industrialised countries, France has always distinguished itself by a low level of
unionisation. This low level of unionization is in part a consequence of the fact that trade
unions do not need a high level of membership. This is explained by legal, financial and
political reasons.
The first reason is legal: in 1966, a decree established a “presumption of representativeness”
for the five main unions. The CGT, CGT-FO, CFDT, CFTC and CFE-CGC – and only them –
are said to “represent” all workers during bargaining rounds on wages and working
conditions, both at the national and firm levels, regardless of their membership. Overall,
French laws and customs do not create incentives for unions to look for members, and for
workers to join unions.
Secondly, several systems of public financing, in cash and in kind, help unions function, even
when their membership dwindles. For instance, in public firms and in the public sector,
5
unions can use as union officials a number of workers whose wages are paid by the employer.
Besides, the 1884 Waldeck-Rousseau law stated that, in order to protect them from political
power, unions do not have to disclose their financial resources. It is estimated than
membership fees amount to between 15% and 60% of their resources (Hadas-Lebel 2006).
Moreover, Friedman‟s (1988) historical analysis shows that French unions had an incentive to
involve as many workers as they could during strikes or bargaining periods, but that the
incentives for unions to increase their membership permanently have remained quite weak.
Hadas-Lebel (2006) pointed out that “French trade unionism has never been a trade unionism
based on large memberships”. Similarly, Besancenot and Vranceanu (1999) remark that
“union leaders are far more interested in obtaining state or EU subsidies than by gaining new
members and membership fees”. In effect, it is generally estimated that the bargaining power
of unions depends more on their capability to mobilize the workforce on occasion than on
their membership.
Lastly, French unions have traditionally insisted on the political and/or moral values of their
members. Each union has its own values and political orientations, which are well known by
the workers. Preserving these political orientations has put a limit on recruitment, as unions
have been looking for militant reformers rather than for mere members (see Bevort 1994 for
the case of the CFDT). This is because, historically, some French unions did not mainly view
themselves as organizations which wanted to grow, but as a source of ideological influence on
workers (Friedman, 1988; Andolfatto & Labbé, 2007).
In this context, why do French workers join at all? One can think of several reasons. First of
all, local unions provide benefits that only union members enjoy, such as career information
and advice. Also, in workplaces where union density is high, fellow workers can interpret not
joining the union as a sign of disinterest in the work collective. Peer pressure thus raises the
incentive to join (Booth 1995). Thirdly, given the political nature of French trade unions, it is

6
likely that many workers join unions because they see them as a concrete vehicle for political
battles. Indeed, using the European Social survey, Schnabel & Wagner (2007) have pointed
out that political and social attitudes affect significantly union membership in France. Lastly,
joining a union can also be a way to become staff delegates, as this is the case of the vast
majority of union members (Andolfatto & Labbé, 2007).
Another potential raison to join a union is the financial gain associated with membership.
Previously, this question has attracted little attention from scholars. But, despite the high level
of union coverage in France, there are two raisons to pay some attention to this question.
Firstly, it is important to know, from an empirical point of view, if trade union members
benefit financially from their membership, and if so, how much. Secondly, recent changes in
law have redefined the representativeness of French unions in a way which grants more
weight to membership. Unions are now more concerned than in the past to find ways to
increase their membership. In so doing, some of them have publicly expressed the need for
financial rewards to be associated with membership. It is thus important to know the current
value of the wage premium enjoyed by union members.
THE UNION MEMBERSHIP WAGE PREMIUM DEBATE
There are two types of premia associated with unions: the union wage premium (UWP for
short), which is the gain for all workers of the presence of a union in the firm, and the union
membership wage premium (UMWP), where the gain is restricted to union members, on
which we focus here. Both have been studied first in Canada, the UK and the US (Freeman &
Medoff 1984; Lewis 1986; Booth 1995). In these countries, given the workshop system and
the presence of rents, unions can exercise their bargaining power to obtain a higher collective
wage. Unions can also protect employees from downward wage pressures (Freeman &

7
Medoff 1984). Several empirical papers have tested these relations especially for Canada, the
UK and the US (Lewis 1986; Bryson 2007).
The existence of a UMWP is not specific to non-continental countries. But its nature is
different in continental countries, where the vast majority of workers benefit from collective
agreements that do not require union membership (Bryson 2007). Thus, in these countries, the
UMWP is more likely to be caused by factors like human capital and lack of information,
rather than by the bargaining power of unions, as in Canada, the UK and the US. However,
little is known of this kind of correlation, because the economic literature has mainly focused
so far on the US and the UK. One can point out three main reasons for the existence of a
UMWP.
Firstly this premium can be directly connected to the union wage premium. Union members
can receive a higher wage than non-members because they work in firms where a union
obtains a higher wage.
Secondly, union members can receive a higher wage than non-members because of their
higher level of human capital. In fact, union members have longer tenures (few workers join a
union at the beginning of their career), benefit from union training programs, and so have a
stronger motivation to stay in the same firm. Thus, when they are dissatisfied with their wage,
union members are more likely to “voice” their concerns than non members, who would
rather choose to “exit”, i.e. to quit (Hirschman, 1970). Given all these factors, union members
are more likely to invest in firm specific human capital. They will be more productive, and
better paid, than other workers.
Lastly, there has been in the recent years an increasing use of bonuses, premiums, and forms
of compensation related to the meeting of team or individual objectives, in workers‟ overall
remuneration. In this context, union members, who are better informed, are in a better

8
position to claim such benefits than other workers, which will again result in higher pay for
union members.
Due to the previous lack of information, estimates of the UMWP are recent, even for the US.
As older databases did not distinguish well between union status, union membership and
union coverage, it was quite difficult to estimate precisely the UMWP (Lewis 1986). In recent
datasets, three types of information are available: the presence of a union in the workplace;
workers‟ membership to a workplace union which is officially recognized for the purpose of
negotiations in the establishment; and if the wage is set by collective bargaining. This level of
detail makes it possible to distinguish clearly between the UWP and the UMWP (Bryson
2007).
In the literature, the estimated value of the UMWP appears to be heavily dependent on the
specification of the model used, and on the country instigated. Using the US Current
Population Survey for the period 1983-1993, Budd & Na (2000) obtained an estimation of the
union membership wage premium around 12%-14%1. When controlling for the endogeneity
of union membership by using instrumental variables, this premium seemed to be even larger.
In the Budd & Na study, only individual characteristics are taken into account in the
estimates. The industry effect is controlled for by the introduction of 8 dummy variables.
Surprisingly, the authors point out that the introduction of job tenure and plant size affected
only slightly the wage premium estimation. Also, one can remark that the pseudo-R2 is rather
low (around 35%) for the wage equation, and that the instruments used are quite weak. (Out
of five, only one is significant at the 5% level.)
Fang & Verma (2002), using a Canadian Workplace and Employee Survey from 1999,
obtained a union membership wage premium around 6% by using a simple OLS estimate.
They controlled for individual characteristics, and they introduced plant size and industry
dummies.

9
Hildreth (2000) exploited the British Household Panel Survey from 1991 to 1994 and found a
25% union member wage differential and a non-significant coverage wage premium equal to
10% for full-time private sector workers. Hildreth (2000) used first differences and
instrumental techniques to control for the endogeneity of the union status. These estimates are
noticeably higher than usual, and they have thus raised interest. But it seems that Hildreth‟s
results are fragile. Firstly, the economic interpretation of the instruments used to explain
membership is questionable (Koevoets 2007). Secondly, Hildreth (2000) found no significant
wage premium for non-member covered workers, which contradicts the literature. Thirdly,
Hildreth concluded that his OLS estimates were downward biased, but, given the existence of
a selectivity effect, Lewis (1986) thought that, on the contrary, OLS estimates were likely to
be upward biased.
More generally, Hildreth‟s results are contradicted by those found in a number of studies.
With the same panel (for the years 1995 to 1997), and using a more robust methodology and
other instruments, Koevoets (2007) found estimates that contradict Hildreth‟s. This matches
the conclusion of Booth & Bryan (2004): using data from the British Workplace Employee
Relations Survey for the year 1998, they found no premium for union members for full time
private sector covered employees. Also, their analysis outlined that UMWP estimates are
sensitive to the introduction of workplace characteristics. In a similar vein, Blanchflower and
Bryson (2002, 2003, 2004, 2009) and Bryson (2002), using a variety of techniques – OLS,
propensity score method (PSM), OLS with individual and workplace characteristics,
longitudinal fixed effects – on data from different surveys (the British Workplace Employee
Relations Survey and the International Social Survey Panel), found no significance for the
union membership. In conclusion, the existence of a UMWP seems established for the US; the
results are more open to debate for the UK.

10
Little attention has been paid in the economic literature to the existence of a union
membership wage premium estimates in France. The only estimate known is given by
Blanchflower & Bryson (2003), who used the International Social Survey Program for 1996-
1998. The main limit on their investigation is the size of the sample used (less than 700
individuals). Blanchflower & Bryson obtained a positive but not significant effect for union
membership. The aim of this paper is to propose a first estimate of the UMWP in France,
using a large representative survey. Before that, it is useful to give some information on the
French institutional context.
THE DATA
The dataset used in this paper is the REPONSE survey, which covers Industrial Relations and
Collective Bargaining at the Firm Level. In this representative employer-employee sample,
2,900 French establishments in private firms employing more than 20 employees and 7,000
employees were surveyed.
This dataset gives us a sample with rich information about individuals (age, diploma, work
experience, socio-professional category, working time, etc.), union membership and firms
(size plan, industry). However, no record was available in this survey on neither the individual
hourly wage nor the average hourly wage in the workplace. To obtain these data, we merged
the REPONSE survey with the Annual Declaration of Social Data (Called DADS; see
appendix for a presentation). DADS are a very reliable source, as they are part of the firm tax
declaration. They correspond to the wage effectively received by employees, including
premium and bonuses (but there is no way to separate, in these data, premium and bonuses
from regular pay). Thus, contrarily to most papers, we do not use declared information on
hourly wages. This allows us to minimize the measurement errors that can strongly affect this
kind of data and bias the wage premium estimation (Stewart, 1983). Also, as they use a

11
homogeneous definition of the wage, DADS have the great advantage of being stable across
individuals.
Table 1 presents the average hourly wage, both for individual workers and at the workplace
level, according to membership, union presence, occupation and gender. The third column
gives the wage gap between workers employed in workplaces belonging to firms where at
least one trade union is present (the union not being necessarily present in the workplace
itself), and the others. The last columns deal with the subsample of workplaces where at least
one trade union is present, and point out the impact of union membership on wages. For the
entire sample, 7.5% of workers are union members and 74% of workers are employed in a
firm where at least one trade union is present. In the latter group of firms, 9.5% of the
employees are union members. Note that in some very rare cases (less than 0.5% of our
sample) some employees belong to a trade union even if no trade union is present in their
firm2.
Globally, workers in firms where a trade union is present received a 10% higher hourly wage
than the others. There are no differences regarding occupations, but the gap is larger for men
(17.1%) than for women (9.2%). These results are similar to the ones in the UK and in the US
where trade unions seem more likely to be found in high paying workplaces (Booth and
Bryson, 2004).
According to the last column of table 1, within firms where at least one trade union is present,
there is little difference between union members and non-members. Also, we observe that
union members are in workplaces where the average wage is slightly higher (+2.3%).
However, individually, union members do not receive a higher wage than non-members (-
1.2%). This negative wage premium seems to be higher for men than for women. The
stronger difference is between two groups of workers, office and blue collar vs. executives
and intermediate. The gap amounts to 18.1 percentage points (11.2 - (-6.9)).

12
Descriptive statistics show that, except for blue collar and office workers, there is no clear
union membership wage effect. This is in sharp contrast with the Anglo-Saxon situation.
However, these results are sensitive to individual and workplace characteristics. This is why
we present some descriptive statistics for different sub-samples.
Table 1: Hourly wage for covered workers according to membership, union presence,
occupation, and gender
with a
union in
the firm
(1)
without a
union in
the firm
(2)
(1)/(2) With a trade union in the firm
Union
members
(4)
Non
Members
(5)
(4)/(5)
All
Individual wage 12.76 11.60 10.0% 12.62 12.77 -1.2%
Average wage in the workplace 12.97 11.59 11.9% 13.24 12.94 2.3%
Gender (individual wage)
Men 13.68 11.68 17.1% 13.16 13.74 -4.2%
Women 10.92 10.00 9.2% 10.91 10.92 -0.1%
Occupation (individual wage)
Office and blue collar workers 9.36 8.45 10.8% 10.30 9.26 11.2%
Executives and intermediates 16.62 14.84 12.0% 15.55 16.70 -6.9%
Source: Full time private sector, the REPONSE Survey 2004-Dares. All data are weighted.
According to table 1, on average, compared to non members, union members were older,
more likely to be male, had longer tenure, were more likely to work in large plants (i.e. plants
of up to 500 employees); they were less likely to work in the distribution, hotels and catering
industry, and in plants with a high proportion of women.

13
Table 2: Descriptive statistics
With a trade union in the workplace Without a trade union
in the workplace
Office and blue collar workers
All
Union membership Union Member
Non member
Union Member
Non member
Individual characteristics Male 0.755 0.622 0.760 0.654 0.645
Tenure (years) 16.65 13.55 17.67 13.94 10.71
Age (years) 42.55 38.41 43.19 39.38 37.96
Working time (hours per week) 36.78 36.78 37.80 38.56 38.86
Qualified job 0.371 0.402 0.207 0.212 0.243
< High School 0.352 0.344 0.263 0.240 0.245
High School 0.442 0.415 0.381 0.304 0.359
College only 0.130 0.150 0.150 0.139 0.140
College and further 0.076 0.092 0.206 0.317 0.256
Workplace characteristics
Firm size (<50) 0.134 0.136 0.124 0.125 0.557
Firm size (50-199) 0.333 0.400 0.314 0.351 0.378
Firm size (200-499) 0.235 0.257 0.251 0.259 0.058
Firm size (500) 0.297 0.206 0.310 0.265 0.008
Manufactured consumable goods 0.157 0.144 0.122 0.122 0.083
Others manufacturing industries 0.295 0.259 0.276 0.252 0.175
Construction 0.040 0.044 0.029 0.041 0.119
Distribution, hotels, catering 0.061 0.157 0.052 0.115 0.224
Transport and communications 0.163 0.095 0.142 0.074 0.050
Banking, insurance, finance 0.026 0.034 0.062 0.067 0.031
Business services 0.102 0.114 0.125 0.158 0.157
Other services 0.116 0.115 0.120 0.100 0.093
Located in Paris 0.199 0.148 0.209 0.211 0.147
Domestic market 0.569 0.564 0.529 0.538 0.768
Market share >25% 0.342 0.385 0.328 0.384 0.292
Firm belongs to a group 0.684 0.654 0.679 0.676 0.359
Means of individual characteristics at the workplace
% of women in the workplace 0.297 0.372 0.318 0.370 0.348
Average age 37.07 36.01 37.55 36.53 29.94
% part time workers 14.0 15.2 14.3 14.6 12.1
% executive workers 0.108 0.102 0.168 0.194 0.150
% intermediate workers 0.210 0.195 0.279 0.243 0.220
% office workers 0.200 0.245 0.186 0.208 0.218
% blue collar workers 0.482 0.458 0.368 0.355 0.412
Union characteristics variables
Union density in the workplace 0.206 0.107 0.194 0.102 0,017
Only one trade union in the workplace 0.289 0.372 0.245 0.320 -
Two trade unions and more in the
workplace 0.711 0.628 0.755 0.680
-
Number of observations 404 1,945 782 4,176 1,531
Source: Full time private sector, the REPONSE Survey 2004. All data are weighted.

14
According to Schnabel and Wagner (2007), the probability to join a union is significantly
affected by personal and workplace characteristics, by the presence of a trade union, and by
union density in the workplace. In effect, we observe that union members are more likely to
be found in plants where union density is higher and where several trade unions are present,
factors which can influence the wage premium (table 2).
When it comes to individual characteristics, we note that workers who work in an
environment where no trade union is present differed only slightly from the others. On the
contrary, we note large differences in workplace characteristics.
Trade unions are more often missing in small plants, as well as in the distribution and
construction industries, where the workforce is younger and more often blue collar. On the
contrary, unions are relatively more present in firms which are large, which have an important
market share, which belong to a group and which are in the manufacturing, banking,
insurance and finance industries.
The aim of the econometric strategy is to test these results by controlling the selection process
and the observed and unobserved heterogeneity due to workplace characteristics.
THE ECONOMETRIC STRATEGY
The wage equation for worker i in workplace j takes the standard form:
(1)
Where ln W is the logarithm of the gross hourly wage, X is a vector of exogenous individual
characteristics, Z is a vector of exogenous workplace characteristics, and U is a union member
dummy variable. and are the estimated parameters. is our parameter of interest.

15
The vector X includes variables which we assume influence human capital (age, tenure,
working time, qualification, sex, and diploma). Some of these variables are correlated with
membership.
The vector Z includes industry and firm size dummies, the geographic location of the
establishment, and the proportion of female workers. These variables are usual in the sense
that they are present in almost all the studies which estimate union wage premium. Our
employer-employee sample gives us the opportunity to introduce more specific information.
In particular, we control for the firm‟s precise economic situation, i.e. the nature of its product
market (domestic or international; with a high or a low degree of competition) and the fact
that the firm belongs or not to a group of firms.
Finally, is an unobservable workplace effect and is a random effect.
Using a simple OLS estimation on pooled workers, table 3 presents the benchmark estimation
of the union membership wage premium. In model 1, which uses the entire sample of full
time employees in the private sector, the coefficient associated with union membership is not
significant.
When we restrict the sample to blue collar and office employees (who work in a firm where at
least one trade union is present), the UMWP becomes positive and significant. As noted by
Lewis (1986), translating the wage premium obtained by using equation (1) into a percentage
difference requires calculating 100(e0,033
-1), i.e. 3.4%.
The signs of the coefficients associated with control variables are coherent with other studies.
For instance, according to table 3, men receive higher wages than women. Also, as is usually
found, the relations between the log hourly wage and age or tenure are U-shaped. However,
we know that union membership is likely to be endogenous because of error measures,
selectivity issues or unobserved heterogeneity. The membership wage premiums obtained in
16
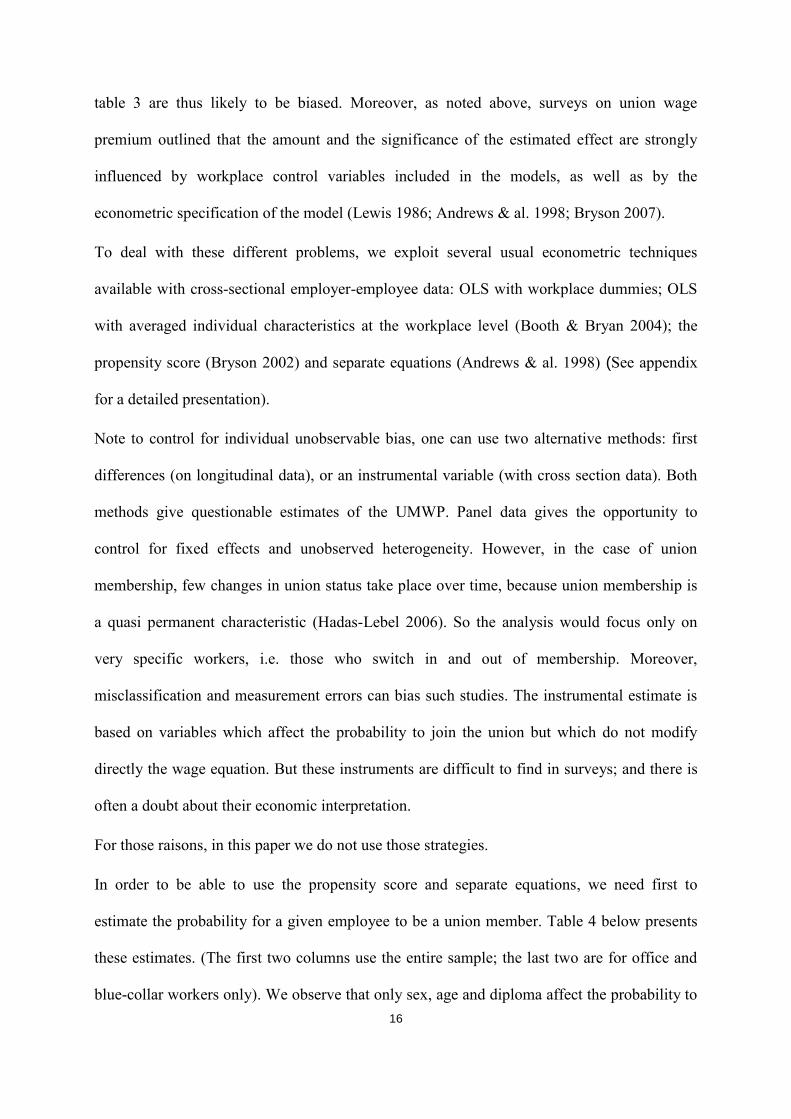
table 3 are thus likely to be biased. Moreover, as noted above, surveys on union wage
premium outlined that the amount and the significance of the estimated effect are strongly
influenced by workplace control variables included in the models, as well as by the
econometric specification of the model (Lewis 1986; Andrews & al. 1998; Bryson 2007).
To deal with these different problems, we exploit several usual econometric techniques
available with cross-sectional employer-employee data: OLS with workplace dummies; OLS
with averaged individual characteristics at the workplace level (Booth & Bryan 2004); the
propensity score (Bryson 2002) and separate equations (Andrews & al. 1998) (See appendix
for a detailed presentation).
Note to control for individual unobservable bias, one can use two alternative methods: first
differences (on longitudinal data), or an instrumental variable (with cross section data). Both
methods give questionable estimates of the UMWP. Panel data gives the opportunity to
control for fixed effects and unobserved heterogeneity. However, in the case of union
membership, few changes in union status take place over time, because union membership is
a quasi permanent characteristic (Hadas-Lebel 2006). So the analysis would focus only on
very specific workers, i.e. those who switch in and out of membership. Moreover,
misclassification and measurement errors can bias such studies. The instrumental estimate is
based on variables which affect the probability to join the union but which do not modify
directly the wage equation. But these instruments are difficult to find in surveys; and there is
often a doubt about their economic interpretation.
For those raisons, in this paper we do not use those strategies.
In order to be able to use the propensity score and separate equations, we need first to
estimate the probability for a given employee to be a union member. Table 4 below presents
these estimates. (The first two columns use the entire sample; the last two are for office and
blue-collar workers only). We observe that only sex, age and diploma affect the probability to

17
be a union member. It is noticeable that tenure and working time have no significant effect.
Another interesting result is the fact that the individual‟s opinion on unions and the union
characteristics at the workplace strongly affected the probability to join a union. Also, as table
4 shows, the higher union density is, the stronger the individual‟s probability to join a union3.
This can be interpreted as a peer pressure effect. Also, when several trade unions are present
in the workplace, the probability to join a union is higher. Several reasons may explain this,
such as increased competition between trade unions or the fact that unions target different
sections of the workforce (by occupation, for example). Also, when there are multiple unions
in the workplace, the worker may more easily find a union with political views more
consistent with his or her own views.
Table 5 presents the results obtained when using these three methods for the entire sample as
well as for the sub-samples made of, i) office and blue-collar workers; ii) qualified office and
blue-collar workers; and iii) office and blue-collar workers working in the manufacturing
industries. The different variables included in each specification are listed beneath the table.
The first row of the table recalls the coefficient obtained in table 3. The three next rows
include workplace characteristics to control for fixed effects. The UMWP are obtained by
introducing successively workplace dummies, means of individual characteristics4, and union
power (approximated by union density, as estimated by the manager and by the number of
different unions present in the workplace).
The next rows of table 5 gives estimates based on the propensity score method (PSM). As a
matching method, the PSM mimics an experiment, as it compares similar groups of
participants and non-participants. The PSM method matches the two groups just on the
propensity score; conversely, the matching method is based on a vector of characteristics.
Compared to the separate equations (SE) method (see below), the main advantage of the PSM
method is the non-parametric specification of the selection process. However, its drawback is

18
the lack of control for unobservables. So the result depends on the richness of the data
introduced in the score.
Table 3: OLS Results for the log hourly wage
Model 1 Model 2
Coeff. SDT Coeff. SDT
Constant 0.377* 0.213 1.667*** 0.323
Union member -0.002 0.014 0.033** 0.014
Male 0.121*** 0.009 0.092*** 0.009
Tenure/10 0.073* 0.036 0.133*** 0.039
(Tenure/10)2 -0.021*** 0.004 -0.019*** 0.003
Age/10 0.330*** 0.043 0.205*** 0.044
(Age/10) 2 -0.029*** 0.006 -0.023*** 0.006
(Tenure/10)*(Age/10) 0.014* 0.008 0.003 0.009
Working time 0.396*** 0.093 0.063 0.154
(Working time) 2 -0.019 0.011 -0.017 0.019
Qualified job 0.651*** 0.132 -0.476*** 0.116
< High School -0.394*** 0.012 -0.167*** 0.017
High School -0.330*** 0.012 -0.129*** 0.016
College -0.237*** 0.013 -0.086*** 0.018
College and further Ref. Ref.
Working time *Qualified job -0.205*** 0.036 0.114*** 0.031
Tenure *Qualified job -0.025** 0.010 0.000 0.009
Plant size (5) Yes Yes
Industry effect (8) Yes Yes
Paris localization 0.125*** 0.011 0.086*** 0.013
Domestic market -0.033*** 0.009 -0.046*** 0.010
Market share >25% -0.006 0.008 0.017* 0.009
Firm belong to a group 0.031*** 0.009 0.019** 0.009
Sample size 4,934 2,342
Adjusted R2 57.2 38.3
Source: Full time private sector, the REPONSE Survey 2004-Dares.
* significant at the 0.1 level, ** at the 0.05 level *** at the 0.01 level
Model 1: All workers with trade union(s) in the firm only
Model 2: For blue collar and office workers employees only and with trade union(s) in the firm

19
Note that, given that the calculated propensity score is a continuous variable, it is rare to
observe two individuals whose score is exactly the same. To overcome this problem, various
methods are available. In this paper, we chose the Kernel matching method. The main
advantage of this method is that all treated individuals are matched with a weighted average
of all controls, with a weight inversely proportional to the distance between the propensity
scores of the treated and the controls. This technique is more efficient than the “stratification”
or the “nearest neighbor” alternative methods (Lee, 2005).
Finally, the last rows of table 5 present the results for the separate equations model. Both the
propensity score method (PSM) and the separate equations (SE) specifications are based in
the first step on the estimation of the employee‟s probability to be a union member (see table
4). The controlled observed characteristics are sex, age, tenure, diploma, union density, the
individual‟s and manager‟s opinion on unions, size and industry dummies, and finally the
means of the sex, age, and occupation of the workers in the workplace.
For the separate equations (SE) specification, as Heckman and Robb (1985) pointed out, it is
not strictly necessary to find instruments for the identification of the effect of union
membership on the wage. The nonlinearity of the probit model is sufficient for the
identification. However, the presence of variables that are correlated with membership but
which are not correlated with unobserved factors explaining the wage (the manager’s and the
individual’s opinion on unions, the individual’s participation in a collective action) reinforce
the quality of the estimate. In contrast with OLS specification, the SE does not impose that the
coefficients associated with members and non members sub-samples are equal.
The Chow test allows us to control for this assumption. In our framework, the Chow test F
ratio obtained from estimating the wage equation subject to the restriction that the coefficient
associated to member and non-members is equal to 1,500. The critical value from the F table

20
is 1.75, so this hypothesis is strongly rejected. The separate equations model will provide
better estimates.
Note that the coefficients associated with the correlation between the error term of the
equation of selection and the two wage equations (noted and in the appendix) are
positive and significant at the 5% level. Finally, we calculated the average treatment effect on
the treated. The bootstrap technique (with 500 draws) is used to estimate the covariate
associated with this estimate.
We can finally estimate the value of the UMWP. Table 5 presents our various estimates
obtained with the different methods exposed above.
For estimates based on the entire sample, the coefficients associated with union membership
are never positive and significant. They are even negative in 7 out of the 10 specifications, but
the coefficients are insignificant, except when we introduce simple dummies to control for
fixed effects. These results indicate clearly that in France, on average, union membership does
not pay. This situation contrasts strongly with what is observed in the US.
Does this particular situation hold across workers, occupations, industries and firm sizes?
First, we note no differences between male and female workers, unlike what is observed in the
UK (Booth and Bryson, 2004). Moreover, there are no significant differences among
industries or firms of different size5.
Second, we observe a specific situation for office and blue-collar workers. According to table
5, these workers benefit from a positive and significant wage premium when they belong to a
union (in 5 specifications out of 10). However, this premium is very small; it varies between
+2.7% and +3.6%.

21
Table 4: Probit of the probability to be a union member
Model 1 Model 2
Coeff. SDT Coeff. SDT
Individual characteristics
Male 0.157*** 0.062 0.213*** 0.090
Tenure/10 0.072 0.151 -0.179 0.221
Age/10 0.152*** 0.053 0.156** 0.075
(Tenure/10)*(Age/10) -0.002 0.031 0.040 0.045
Working time 0.041 0.057 -0.038 0.123
< High School 0.003 0.079 -0.218 0.148
High School 0.158** 0.072 -0.047 0.142
College 0.211*** 0.082 -0.031 0.159
College and further Ref. Ref.
Union characteristics at the workplace
Union density in the workplace 1.158*** 0.145 1.055*** 0.194
Doesn‟t know union density 0.076 0.074 -0.033 0.108
Only one trade union in the workplace -0.096** 0.062 -0.074 0.084
Individual’s opinion on unions
Trade unions are useful for representing workers 0.481*** 0.067 0.606*** 0.093
Trade unions help workers 0.174*** 0.070 0.073 0.096
Trade unions only defend their own interests -0.292*** 0.053 -0.362*** 0.075
Trade unions do not interfere with firm business 0.322*** 0.054 0.360*** 0.075
Participation in collective actions (strikes, petitions...) 0.912*** 0.226 0.899*** 0.316
Participation in collective actions* Age -0.098** 0.052 -0.099 0.075
Manager’s opinion on unions
Trade unions are useful for representing workers 0.121** 0.071 0.072 0.107
Trade unions help workers -0.010 0.081 0.051 0.115
Trade unions only defend their own interests 0.008 0.051 -0.089* 0.070
Trade unions do not interfere with firm business -0.112** 0.066 -0.093 0.094
Workplace characteristics
% female -0.193 0.163 -0.003 0.223
Average age -0.047 0.068 -0.097 0.098
% intermediate workers 0.762*** 0.208 0.027 0.448
% office workers 0.693*** 0.198 0.448 0.364
% blue collar 0.338*** 0.159 0.094 0.328
Plant size (5) Yes Yes
Industry effect (8) Yes yes
Constant -2.872*** 0.407 -1.736*** 0.698
Sample size 4,934 2,342
Pseudo R2 25.5 21.3
Source: Full time private sector, the REPONSE Survey 2004-Dares.
* significant at the 0.1 level, ** at the 0.05 level *** at the 0.01 level
Model 1: All workers with a trade union(s) in the firm only
Model 2: For blue collar and office workers employees only and with trade union(s) in the firm


23
Table 5: Union membership estimate (full sample)
Full sample blue collar and office
workers only
Qualified blue collar and
office workers only
Qualified blue collar and office workers in
manufactured industries only
Coeff. std Coeff. std Coeff. std Coeff. std
Simple OLS -0.002 0.014 0.033** 0.014 0.040** 0.018 0.047** 0.024
OLS with control for workplace-level influence
With dummy variables for workplace -0.041*** 0.014 -0.022 0.015 -0.005 0.020 -0.042 0.031
With mean characteristics for workplace -0.006 0.013 0.027** 0.014 0.035** 0.017 0.034 0.024
With mean characteristics for workplace and union power -0.015 0.0134 0.017 0.014 0.027 0.018 0.026 0.025
PSM estimates
Kernel -0.004 0.017 0.036** 0.017 0.039* 0.024 0.057* 0.031
Kernel with common support 0.000 0.017 0.035** 0.017 0.039* 0.023 0.055 0.035
Separate equations method
Simple -0.007 0.016 0.018 0.017 0.028 0.025 0.073* 0.037
With dummy variables for workplace 0.028 0.076 0.100 0.083 0.120 0.214 0.130 0.166
With mean characteristics for workplace -0.001 0.015 0.029* 0.016 0.028 0.023 0.044 0.032
With mean characteristics for workplace and union density 0.001 0.015 0.028** 0.014 0.031 0.023 0.054 0.035
N 4,934 2,342 1,404 708
Source: Full time private sector, the REPONSE Survey 2004-Dares.
* significant at the 0.1 level, ** at the 0.05 level *** at the 0.01 level
Individuals and workplace characteristics included in OLS and SE specifications are: gender, age, tenure, working time, diploma, plant size and industry dummies, localization, and
the market characteristics of the firm (domestic orientation and degree of competitiveness). Mean characteristics for workplace included the average age of the workers and the
percentages of female, intermediate, office and blue-collar workers. Union power included union density and the number of trade unions present in the workplace. PSM are estimated
through Becker and Ichino‟s (2002) Stata algorithms pscore.ado and attk.ado; the standard error is obtained with the bootstrap method (100 draws). The standard errors of the SE
estimate are obtained with the bootstrap method (500 draws).

24
The variation of the coefficients across the specifications suggests that workplace fixed
effects, as well as the endogeneity of the union status and union density in the workplace,
affected significantly the membership premium estimate. The last row of table 5 is the only
estimate that proposed to control for such effects. The estimate we obtain is 2.8% and the
average of all the estimations is 2.3%.
The last columns of table 5 present different tests for different sub-samples. When we restrict
the sample to qualified blue collar and office workers and for those in the manufacturing
industries, the estimated wage premiums are slightly higher (between 4% and 7%). But the
estimates are more often not significant, due in part to the reduction in the size of the sample.
CONCLUSION
Little attention has been paid to French unions compared to their North American, British and
Scandinavian counterparts. This might be because of the specific context of this country. In
France, even if union density is very low, “representative” trade unions play a significant role
in bargaining rounds, and almost all workers are covered by collective agreements.
This paper is a first attempt to estimate, on a large representative survey, the UMWP. We
estimated this premium by using the three usual econometric techniques: OLS, PSM and SE.
We found that financial gains alone cannot, in any case, play a large part in explaining the
decision to join a union. Thus other explanations than the wage premium are required in order
to explain union membership such as, for instance, peer pressure or political considerations.
Besides, qualitative work indicates that the vast majority of union members have some level
of responsibility within French unions (Andolfatto & Labbé 2007). Joining a union can thus
also be understood as a way to start a new career.
However, given the low level of union density, if one wishes to strengthen bargaining at the
firm level and the representativeness of trade unions, ways are to be found to make union

25
membership more appealing to workers. We cannot say of course that increased wage premia
would induce more workers to join a union; but we cannot exclude this possibility either.
REFERENCES
Amossé, T. 2004. Myth and reality of union membership in France. Premières Synthèses,
44.2.
Andolfatto, D. & Labbé D. 2007. Les syndiqués en France (1990-2006), Report for the
DARES (Research unit of the French minsitry of labour).
Andrews, M. J., Stewart M. B., Swaffield J. K. and Upward R.. 1998. The estimation of union
wage differentials and the impact of methodological choices. Labour Economics, 5: 449-474.
Becker, S. O. and Ichino, A. 2002. Estimation of average treatment effects based on
propensity scores. Stata Journal, 2(4):358-377.
Besancenot, D. and Vranceanu, R. 1999. A trade union model with endogenous militancy:
interpreting the French case. Labour economics, 6: 355-373.
Bevort, A. 2004. Le syndicalisme français et la logique du recrutement sélectif : le cas de la
CFTC-CFDT. Le Mouvement social, 169: 109-136.
Blanchflower, D. and Bryson, A. 2004. The union wage premium in the US and the UK.
Center of Economic Performance Discussion Paper, 612.
Blanchflower, D. and Bryson, A. 2002. Changes Over Time in Union Relative Wage Effects
in the UK and the US Revisited. NBER Working Paper, 9395.
Blanchflower, D. and Bryson, A.. 2003. What Effect Do Unions Have on Wages Now and
Would „What Do Unions Do?‟ Be Surprised?. NBER Working Paper, 9973.
Blanchflower, D. and Bryson, A. 2009. The Wage Impact of Trade Unions in the UK Public
and Private Sectors. Economica, forthcoming.

26
Booth, A. L. 1995, The economics of the trade Union, Cambridge University Press.
Booth, A. L. and Bryan, M. L. 2004. The Union membership Wage-Premium Puzzle: Is there
a Free Rider Problem. Industrial and Labor Relations Review, 57 (3): 402-421.
Booth, A. L. and Chatterji, M. 1995. Union Membership and wage Bargaining when
membership is not compulsory. Economic Journal, 105: 345-360.
Bryson, A. 2002. The Union Membership Wage Premium: An Analysis Using Propensity
Score Matching. Center for economic Performance Discussion Paper, 530.
Bryson, A. 2007. The effect of trade Unions on wages. Reflets et Perspectives de la Vie
Economique, 54(2-3): 33-45.
Budd, J. W. and Na, I-G. 2000. The union membership wage premium for employees covered
by collective bargaining arrangements. Journal of labor Economics, 18: 783-807.
Dehejia, R. H. and Wahba, S. 2002. Propensity Score Matching Methods for
Nonexperimental Causal Studies. Review of Economics and Statistics, 84(1): 151-161.
Fang, T. and Verma, A.. 2002. Union wage premium. Perspectives on Labour and Income,
14(4): 17-23.
Friedman, G. 1988. Strike Success and Union Ideology: the United States and France, 1980-
1914. Journal of Economic History, 58(1):1-25.
Hadas-Lebel, R. 2006. Pour un dialogue social efficace et légitime : Représentativité et
financement des organisations professionnelles et syndicales. Paris: La Documentation
Française.
Heckman, J. J. Ichimura, H. and Todd, P. 1998. Matching as an econometric estimator Review
of Economic Studies, 65: 261-294.
Hildreth, A. 2000. Union Wage Differentials for Covered Members and Nonmembers in
Great Britain. Journal of Labor research, 21(1): 133-147.

27
Hirschman, A. 0. 1970. Exit, Voice and Loyalty: Responses to Decline in Firms,
Organizations, and States. Cambridge, MA: Harvard University Press.
Jarrell, S. B. and Stanley, T. D. 1990. A Meta-Analysis of the Union-Nonunion Wage Gap.
Industrial and Labor Relations Review, 44(1): 54-67.
Koevoets, W. 2007. Union wage premiums in Great Britain: Coverage or membership?
Labour Economics, 14:53-71.
Lee, M.-J. 2005. Micro-Econometrics for Policy Program, and Treatment Effects. New York:
Oxford University Press.
Lewis, H. G. 1986. Union relative wage effect. In Handbook of Labor Economics, edited by
Orley Ashenfelter and Richard Layard, Vol. II: 1139-82. Amsterdam: North-Holland.
OECD. 2004. Wage-setting institutions and outcomes. In Employment Outlook,
Chapter 3:127-181. Paris: OECD.
Reilly, K. T. 1996. Does Union Membership Matter? The Effect of Establishment Union
Density on the Union Wage Differential. Review of Economics and Statistics, 78(3): 547-557.
Rosenbaum, P. R. and Rubin, D. B. 1983. The Central Role of the Propensity Score in
Observational Studies for Causal Effects. Biometrika, 70: 41-55.
Schnabel, C. and Wagner, J. 2007. Union density and determinants of union membership in
18 EU countries: evidence from micro data 2002/3. Industrial Relations Journal, 38(1): 5-32.
Stewart, M. B. 1983. On Least Squares Estimation When the Dependent Variable is Grouped.
Review of Economic Studies, 50 (4): 737-753.
28
APPENDIX
The data
The REPONSE survey
The REPONSE survey (REPONSE literally means, in French, “answer”. It is an acronym for
“RElations PrOfessionnelles et NégociationS d‟Entreprise”) was conducted in 2005 by the
research and statistical unit of the French ministry for labour (the “DARES”) together with
the polling institute BVA. The survey covers economic activity, human resources
management and industrial relations in establishments belonging to firms operating in the
private sector with 20 employees or more (in 2004). The survey has three distinct parts: the
first part deals with representatives of the management (establishments sample); the second
with workers representatives (workers representatives sample); the third with the firm‟s
workers (workers sample). Each part has its own specific questionnaire.
The establishments sample includes around 3,000 observations out of a poll stratified by size
and activity, taken from the national firms and establishments database (called “SIRENE”).
The workers sample includes 12,000 observations taken from the national declaration of
social data (or “DADS” – see below). The poll was weighted by the workforce of each
establishment contacted. Last, the workers representative sample includes 2,000 observations.
The matching of the first two samples gives information on about 7,000 workers (age,
diploma, work experience, socioprofessional category, working time, etc.) and the firm where
they work (size, industry, economic environment, industrial relations, etc.).
The DADS files
DADS stands for “Annual Declaration of Social Data”. Filling this information once a year is
a legal requirement for all French firms. The information is sent to the Social Security

29
administration. The DADS declaration includes rich information on the firm‟s workers,
notably their wage. This is an exhaustive survey that covers all employees of the private
sector.
The hourly wage used here includes the base wage and premiums; bonuses corresponding to
extra time, hours worked on Sundays, during holidays or at night; some declared in-kind
benefits, employer pension schemes; profit-sharing schemes.
Econometric estimators
OLS with controls for the influence of the workplace
The employer-employee data give the opportunity to control for the across-workplace
selection problem (Booth and Bryan, 2004). Two alternatives are available: either the
introduction of workplace dummy variables, or the introduction of averaged workplace
variables.
In the first specification we have:
Note that the dummy variables (Dj) include all observable (Zj) and unobservable ( )
workplace characteristics of equation (1).
In the second specification we introduce mean characteristics in the wage equation. Note that
Booth and Bryan (2004) used averaged information calculated over observed individuals
only. In an employer-employee survey, the number of workers per workplace is relatively
small vis-a-vis the firm‟s size. Moreover, in most cases, these workers are neither random nor
representative of the staff. The use of this indicator can thus bias the estimates. In our sample,
this bias could be large6.

30
The REPONSE Survey used in this paper is merged with DADS files (see above). As we use
this survey that covers all employees, we can calculate the true mean individual
characteristics for a given workplace. Unfortunately, not all the variables included in X are
available in the DADS files. So, the specification takes the following form:
are the mean characteristics calculated for all the workers in the workplace. is the union
density declared by the manager. See Reilly (1996) for the control of endogeneity of this latter
variable.
Propensity score matching estimators
The causal effect of a given treatment (to be a union member in our case) on a given outcome
Y (the wage) can be evaluated with the propensity score matching method (Bryson, 2002).
Let us note T, an indicator of the treatment. If the worker received the treatment, T = 1 and
his/her outcome is y1. Conversely, if he/she did not receive the treatment, T = 0 and his/her
outcome is y0. The causal effect is defined by the difference between y1 and y0. The problem is
that two outcomes are never observed at the same time since a worker is either treated or
untreated but he/she cannot be both.
The average treatment effect on the treated takes the following form:
E(y1. - y0. T=1) = E(y1. T=1) - E(y0. T=1)
The second element on the right hand-side of this equation is never observable, so we need to
construct a counterfactual. This counterfactual is the outcome treated workers would have
benefited from if they had not been treated.
The matching method and the propensity score method are both based on the assumption that
all relevant differences between the two groups of workers, the treated and the non-treated,

31
are captured by the observable element. Rubin and Rosenbaum (1983) showed that
conditional independence with the X variables was equivalent to the independence compared
to the propensity score. If Y T X so Y T p(x), with X a vector of observable variables
and p(x) the probability to be treated conditionally to X.
The propensity score is easier to use than the matching method because it is based only on a
one-dimension summary criterion. This criterion is the matching variables obtained by the
estimate of the probability of being exposed to the treatment. By using this method it is
possible to build pairs of comparable treated and non-treated workers. These subjects have the
same or a neighboured propensity score.
In the kernel estimator each non-treated individual takes part in the construction of the
counterfactual of the treated individual (Heckman, Ichimura and Todd, 1998). The weight of
the non-treated in the elaboration of the counterfactual is given according to the distance
between their score and the score of a treated individual.
Separated equations method
The separate equation method is an alternative method to estimate the causal effect and to
control for endogenous selection bias (Andrews and al., 1998). The main drawback of this
method is the parametric specification of the selection; its main advantage is that it controls
for unobservables. Let assume the selection process between two subgroups, treated and no-
treated. Let T be an indicator of the treatment given by a latent variable T*:
T = 1(T*>0)
With 1() an indicator function that takes the value 1 if the condition is true and 0 otherwise.
Assume T* is a linearly relation of observable variables, noted Z, and unobservable ones,
noted u. So:

32
T =1(u>- Z)
According to the value of the treatment, we observe two outcomes y1 and y0. We assume that
yi linearly depends on observable variables Xi and unobservable ones, noted vi, i=0, 1.
Y = Xi i + vi for i=0, 1
Under the assumption of multivariate normal distribution between the terms u and vi, it is
possible to estimate the parameters and I by maximum likelihood technique. We note:
(u ,v0, v1) = N(0, ) with
The average treatment effect on the treated can be written as:
E(y1. - y0. Z, X1, X0 , T=1) = E(y1. X1, X0 , T=1) - E(y0. X1, X0 T=1)
According to previous assumptions, we have:
E(y1. X1, X0 , T=1) = X1 1 + 1 ( Z))/( Z)
and
E(y0. X1, X0 , T=1) = X0 0 + 0 ( Z))/( Z)
With the density function and the cumulative normal function.
33
NOTES
1 Jarrell and Stanley (1990), using meta-analysis, pointed out that the union non-union wage gap has varied
between 9% and 12% during the 1967-79 period.
2 Note that union members do not have the same status than union delegates. The latter benefit from a reduction
of working time for union activities, and are more protected than others workers against firing.
3 Note that this is not endogenous as the measure of union density excludes the membership of the individual
considered.
4 Note that for the means for individual characteristics, the data at the workplace level was available only for the
age, the percentage of female workers and the distribution of the workplace by occupation.
5 These results are not presented in the paper but are available under request.
6 In our sample, we observed (rounded figures): less than 1% of the labour-force in 40% of the workplaces;
between 1% and 10% in half the workplaces; and 10% and more for the remainder.

1
UNION MEMBERSHIP PAYS LITTLE IN FRANCE:
EVIDENCE FROM RECENT MICRO DATA
BUNEL Matthieu1
RAVEAUD Gilles2
ABSTRACT:
We used a French employer–employee representative survey to estimate, within private firms
covered by union contracts, the union member wage premium. Our estimates are based on
several methods: ordinary least squares with averaged individual characteristics at the
workplace level, the propensity score and separated equations. We found no wage penalty for
non union members. There exists a union membership wage premium for blue collar and
office workers, which is of a limited amount (around 3%). Thus, for most workers in France,
there is no important financial gain associated with union membership.
Key words: Union wage premium, union membership, employer-employee data, propensity
score method, separated equations method
1 Université de Caen Basse-Normandie (UCBN), Laboratoire CREM and Fédération de recherche TEPP, 19, rue Claude Bloch, 14000 Caen - France, Tel: +33 (0)2-31-56-59-80, Fax: +33 (0)3-1-56-62-15, E-mail: [email protected]
2 Institut d’Etudes Européennes, Université Paris 8 Saint-Denis, 2, rue de la Liberté, 93 526 Saint-Denis cedex -France, Tel: +33 (0)1-45-43-10-45, E-mail: [email protected]

2
Trade unions are a key feature of industrial relations in France, even if they have few
members. In international comparison, France is characterized by a very low level of union
membership (8%), a high union coverage (92%) and an average presence of unions at the
workplace (40%).
This paradox can be explained by a variety of institutional factors, such as the fact that the
main unions are, by law, supposed to “represent” all workers, regardless of their membership.
Also, the access of unions to public financing and their bargaining power are, to a certain
extent, unrelated to their membership.
On their side, workers can join a union for a variety of raisons. For instance, as French unions
have specific political orientations, joining a union can be a way to push forward specific
political demands (Friedman 1988; Besancenot & Vranceanu 1999). Also, workers may want
to benefit from specific information that their local union can provide; or peer pressure might
lead them to join. Lastly, workers can also join a union in order to become staff delegates. In
fact, due to the small number of union members compared to the number of positions to be
filled in various professional settings, most of the union members have responsibilities as staff
delegates, at the local or national level (Andolfatto & Labbé, 2007).
A question which is notably absent in the literature on French unions is the financial incentive
to join a union. Given, in particular, the political nature of French unions, this point has
generally been dismissed a priori as irrelevant by many scholars. But this does not mean that
such gains do not exist. Also and more importantly, the low level of union membership in
France, together with recent law changes, have lead unions themselves to ask for financial
gains associated with membership.
Some recent applied papers have studied the specific impact of union membership on wages
in the covered sector (Booth & Chattererji 1995; Budd & Na 2000; Fang & Verma 2002;

3
Booth & Bryan, 2004), by using British or US data. For France, Blanchflower & Bryson
(2003) proposed the only estimate known. Using a very small sample (less than 700
individuals, taken from the International Social Survey Program for the years 1996-1998),
they found a positive but not significant union membership wage premium (UMWP).
The aim of this paper is thus to assess the amount of the UMWP in France. Our purpose of
study is the measure of the individual wage gain by a worker when he or she joins a union.
This calls for two immediate clarifications. Firstly, let us stress that estimating the magnitude
of the UMWP does not imply that we make any assumption regarding the motivations for
membership. In fact, this paper does not study the motives for joining a union. Secondly, we
do not study the global impact of unions on the level of wages at different levels (workplace,
firm, industry).
To specify the relation between union membership and wage in the French context, we used a
very large sample, based on REPONSE, a merged representative employer–employee survey
conducted in 2005 (see appendix). To control for selection process, we restricted our analysis
to workers employed in firms where at least one trade union is present. Moreover, given the
sensitivity of the results obtained in the literature to the econometric method, our estimates are
based on the usual estimates: the simple ordinary least squares on pooled workers (OLS);
OLS with workplace dummies; OLS with averaged individual characteristics at the workplace
level (Booth & Bryan 2004); the propensity score method (Bryson 2002); and separated
equations (Andrews & al. 1998). In order to minimize measurement errors and to deal with a
homogeneous definition of the wage, we merged our sample with administrative files to
obtain the effective compensation received by employees.
Overall, our results point out that there is no wage penalty for non union members, except for
blue collar and office workers. For these workers, the UMWP is around 3%. For other
workers, we generally find a negative premium, but coefficients are not significant. Thus, for

4
these workers, financial motives cannot play a large role in their decision to join a union. The
structure of the paper is as follows: Sections 2 and 3 present the French union membership
situation and a short survey of the UMWP existing estimations. In section 4 we describe our
data and present some descriptive statistics. Section 5 displays the econometric strategy and
discusses the results. Section 6 concludes.
UNION MEMBERSHIP IN FRANCE
In 2004, only 1.9 million French workers, that is 8% of the total workforce, are trade union
members (Amossé 2004). The figures are lower in the private sector (5%) and in small firms
(4%); they are higher in the public sector (15%) and in large firms (9%).
Why there are so few union members in France
Among industrialised countries, France has always distinguished itself by a low level of
unionisation. This low level of unionization is in part a consequence of the fact that trade
unions do not need a high level of membership. This is explained by legal, financial and
political reasons.
The first reason is legal: in 1966, a decree established a “presumption of representativeness”
for the five main unions. The CGT, CGT-FO, CFDT, CFTC and CFE-CGC – and only them –
are said to “represent” all workers during bargaining rounds on wages and working
conditions, both at the national and firm levels, regardless of their membership. Overall,
French laws and customs do not create incentives for unions to look for members, and for
workers to join unions.
Secondly, several systems of public financing, in cash and in kind, help unions function, even
when their membership dwindles. For instance, in public firms and in the public sector,

5
unions can use as union officials a number of workers whose wages are paid by the employer.
Besides, the 1884 Waldeck-Rousseau law stated that, in order to protect them from political
power, unions do not have to disclose their financial resources. It is estimated than
membership fees amount to between 15% and 60% of their resources (Hadas-Lebel 2006).
Moreover, Friedman‟s (1988) historical analysis shows that French unions had an incentive to
involve as many workers as they could during strikes or bargaining periods, but that the
incentives for unions to increase their membership permanently have remained quite weak.
Hadas-Lebel (2006) pointed out that “French trade unionism has never been a trade unionism
based on large memberships”. Similarly, Besancenot and Vranceanu (1999) remark that
“union leaders are far more interested in obtaining state or EU subsidies than by gaining new
members and membership fees”. In effect, it is generally estimated that the bargaining power
of unions depends more on their capability to mobilize the workforce on occasion than on
their membership.
Lastly, French unions have traditionally insisted on the political and/or moral values of their
members. Each union has its own values and political orientations, which are well known by
the workers. Preserving these political orientations has put a limit on recruitment, as unions
have been looking for militant reformers rather than for mere members (see Bevort 1994 for
the case of the CFDT). This is because, historically, some French unions did not mainly view
themselves as organizations which wanted to grow, but as a source of ideological influence on
workers (Friedman, 1988; Andolfatto & Labbé, 2007).
In this context, why do French workers join at all? One can think of several reasons. First of
all, local unions provide benefits that only union members enjoy, such as career information
and advice. Also, in workplaces where union density is high, fellow workers can interpret not
joining the union as a sign of disinterest in the work collective. Peer pressure thus raises the
incentive to join (Booth 1995). Thirdly, given the political nature of French trade unions, it is

6
likely that many workers join unions because they see them as a concrete vehicle for political
battles. Indeed, using the European Social survey, Schnabel & Wagner (2007) have pointed
out that political and social attitudes affect significantly union membership in France. Lastly,
joining a union can also be a way to become staff delegates, as this is the case of the vast
majority of union members (Andolfatto & Labbé, 2007).
Another potential raison to join a union is the financial gain associated with membership.
Previously, this question has attracted little attention from scholars. But, despite the high level
of union coverage in France, there are two raisons to pay some attention to this question.
Firstly, it is important to know, from an empirical point of view, if trade union members
benefit financially from their membership, and if so, how much. Secondly, recent changes in
law have redefined the representativeness of French unions in a way which grants more
weight to membership. Unions are now more concerned than in the past to find ways to
increase their membership. In so doing, some of them have publicly expressed the need for
financial rewards to be associated with membership. It is thus important to know the current
value of the wage premium enjoyed by union members.
THE UNION MEMBERSHIP WAGE PREMIUM DEBATE
There are two types of premia associated with unions: the union wage premium (UWP for
short), which is the gain for all workers of the presence of a union in the firm, and the union
membership wage premium (UMWP), where the gain is restricted to union members, on
which we focus here. Both have been studied first in Canada, the UK and the US (Freeman &
Medoff 1984; Lewis 1986; Booth 1995). In these countries, given the workshop system and
the presence of rents, unions can exercise their bargaining power to obtain a higher collective
wage. Unions can also protect employees from downward wage pressures (Freeman &

7
Medoff 1984). Several empirical papers have tested these relations especially for Canada, the
UK and the US (Lewis 1986; Bryson 2007).
The existence of a UMWP is not specific to non-continental countries. But its nature is
different in continental countries, where the vast majority of workers benefit from collective
agreements that do not require union membership (Bryson 2007). Thus, in these countries, the
UMWP is more likely to be caused by factors like human capital and lack of information,
rather than by the bargaining power of unions, as in Canada, the UK and the US. However,
little is known of this kind of correlation, because the economic literature has mainly focused
so far on the US and the UK. One can point out three main reasons for the existence of a
UMWP.
Firstly this premium can be directly connected to the union wage premium. Union members
can receive a higher wage than non-members because they work in firms where a union
obtains a higher wage.
Secondly, union members can receive a higher wage than non-members because of their
higher level of human capital. In fact, union members have longer tenures (few workers join a
union at the beginning of their career), benefit from union training programs, and so have a
stronger motivation to stay in the same firm. Thus, when they are dissatisfied with their wage,
union members are more likely to “voice” their concerns than non members, who would
rather choose to “exit”, i.e. to quit (Hirschman, 1970). Given all these factors, union members
are more likely to invest in firm specific human capital. They will be more productive, and
better paid, than other workers.
Lastly, there has been in the recent years an increasing use of bonuses, premiums, and forms
of compensation related to the meeting of team or individual objectives, in workers‟ overall
remuneration. In this context, union members, who are better informed, are in a better

8
position to claim such benefits than other workers, which will again result in higher pay for
union members.
Due to the previous lack of information, estimates of the UMWP are recent, even for the US.
As older databases did not distinguish well between union status, union membership and
union coverage, it was quite difficult to estimate precisely the UMWP (Lewis 1986). In recent
datasets, three types of information are available: the presence of a union in the workplace;
workers‟ membership to a workplace union which is officially recognized for the purpose of
negotiations in the establishment; and if the wage is set by collective bargaining. This level of
detail makes it possible to distinguish clearly between the UWP and the UMWP (Bryson
2007).
In the literature, the estimated value of the UMWP appears to be heavily dependent on the
specification of the model used, and on the country instigated. Using the US Current
Population Survey for the period 1983-1993, Budd & Na (2000) obtained an estimation of the
union membership wage premium around 12%-14%1. When controlling for the endogeneity
of union membership by using instrumental variables, this premium seemed to be even larger.
In the Budd & Na study, only individual characteristics are taken into account in the
estimates. The industry effect is controlled for by the introduction of 8 dummy variables.
Surprisingly, the authors point out that the introduction of job tenure and plant size affected
only slightly the wage premium estimation. Also, one can remark that the pseudo-R2 is rather
low (around 35%) for the wage equation, and that the instruments used are quite weak. (Out
of five, only one is significant at the 5% level.)
Fang & Verma (2002), using a Canadian Workplace and Employee Survey from 1999,
obtained a union membership wage premium around 6% by using a simple OLS estimate.
They controlled for individual characteristics, and they introduced plant size and industry
dummies.

9
Hildreth (2000) exploited the British Household Panel Survey from 1991 to 1994 and found a
25% union member wage differential and a non-significant coverage wage premium equal to
10% for full-time private sector workers. Hildreth (2000) used first differences and
instrumental techniques to control for the endogeneity of the union status. These estimates are
noticeably higher than usual, and they have thus raised interest. But it seems that Hildreth‟s
results are fragile. Firstly, the economic interpretation of the instruments used to explain
membership is questionable (Koevoets 2007). Secondly, Hildreth (2000) found no significant
wage premium for non-member covered workers, which contradicts the literature. Thirdly,
Hildreth concluded that his OLS estimates were downward biased, but, given the existence of
a selectivity effect, Lewis (1986) thought that, on the contrary, OLS estimates were likely to
be upward biased.
More generally, Hildreth‟s results are contradicted by those found in a number of studies.
With the same panel (for the years 1995 to 1997), and using a more robust methodology and
other instruments, Koevoets (2007) found estimates that contradict Hildreth‟s. This matches
the conclusion of Booth & Bryan (2004): using data from the British Workplace Employee
Relations Survey for the year 1998, they found no premium for union members for full time
private sector covered employees. Also, their analysis outlined that UMWP estimates are
sensitive to the introduction of workplace characteristics. In a similar vein, Blanchflower and
Bryson (2002, 2003, 2004, 2009) and Bryson (2002), using a variety of techniques – OLS,
propensity score method (PSM), OLS with individual and workplace characteristics,
longitudinal fixed effects – on data from different surveys (the British Workplace Employee
Relations Survey and the International Social Survey Panel), found no significance for the
union membership. In conclusion, the existence of a UMWP seems established for the US; the
results are more open to debate for the UK.

10
Little attention has been paid in the economic literature to the existence of a union
membership wage premium estimates in France. The only estimate known is given by
Blanchflower & Bryson (2003), who used the International Social Survey Program for 1996-
1998. The main limit on their investigation is the size of the sample used (less than 700
individuals). Blanchflower & Bryson obtained a positive but not significant effect for union
membership. The aim of this paper is to propose a first estimate of the UMWP in France,
using a large representative survey. Before that, it is useful to give some information on the
French institutional context.
THE DATA
The dataset used in this paper is the REPONSE survey, which covers Industrial Relations and
Collective Bargaining at the Firm Level. In this representative employer-employee sample,
2,900 French establishments in private firms employing more than 20 employees and 7,000
employees were surveyed.
This dataset gives us a sample with rich information about individuals (age, diploma, work
experience, socio-professional category, working time, etc.), union membership and firms
(size plan, industry). However, no record was available in this survey on neither the individual
hourly wage nor the average hourly wage in the workplace. To obtain these data, we merged
the REPONSE survey with the Annual Declaration of Social Data (Called DADS; see
appendix for a presentation). DADS are a very reliable source, as they are part of the firm tax
declaration. They correspond to the wage effectively received by employees, including
premium and bonuses (but there is no way to separate, in these data, premium and bonuses
from regular pay). Thus, contrarily to most papers, we do not use declared information on
hourly wages. This allows us to minimize the measurement errors that can strongly affect this
kind of data and bias the wage premium estimation (Stewart, 1983). Also, as they use a

11
homogeneous definition of the wage, DADS have the great advantage of being stable across
individuals.
Table 1 presents the average hourly wage, both for individual workers and at the workplace
level, according to membership, union presence, occupation and gender. The third column
gives the wage gap between workers employed in workplaces belonging to firms where at
least one trade union is present (the union not being necessarily present in the workplace
itself), and the others. The last columns deal with the subsample of workplaces where at least
one trade union is present, and point out the impact of union membership on wages. For the
entire sample, 7.5% of workers are union members and 74% of workers are employed in a
firm where at least one trade union is present. In the latter group of firms, 9.5% of the
employees are union members. Note that in some very rare cases (less than 0.5% of our
sample) some employees belong to a trade union even if no trade union is present in their
firm2.
Globally, workers in firms where a trade union is present received a 10% higher hourly wage
than the others. There are no differences regarding occupations, but the gap is larger for men
(17.1%) than for women (9.2%). These results are similar to the ones in the UK and in the US
where trade unions seem more likely to be found in high paying workplaces (Booth and
Bryson, 2004).
According to the last column of table 1, within firms where at least one trade union is present,
there is little difference between union members and non-members. Also, we observe that
union members are in workplaces where the average wage is slightly higher (+2.3%).
However, individually, union members do not receive a higher wage than non-members (-
1.2%). This negative wage premium seems to be higher for men than for women. The
stronger difference is between two groups of workers, office and blue collar vs. executives
and intermediate. The gap amounts to 18.1 percentage points (11.2 - (-6.9)).

12
Descriptive statistics show that, except for blue collar and office workers, there is no clear
union membership wage effect. This is in sharp contrast with the Anglo-Saxon situation.
However, these results are sensitive to individual and workplace characteristics. This is why
we present some descriptive statistics for different sub-samples.
Table 1: Hourly wage for covered workers according to membership, union presence,
occupation, and gender
with a
union in
the firm
(1)
without a
union in
the firm
(2)
(1)/(2) With a trade union in the firm
Union
members
(4)
Non
Members
(5)
(4)/(5)
All
Individual wage 12.76 11.60 10.0% 12.62 12.77 -1.2%
Average wage in the workplace 12.97 11.59 11.9% 13.24 12.94 2.3%
Gender (individual wage)
Men 13.68 11.68 17.1% 13.16 13.74 -4.2%
Women 10.92 10.00 9.2% 10.91 10.92 -0.1%
Occupation (individual wage)
Office and blue collar workers 9.36 8.45 10.8% 10.30 9.26 11.2%
Executives and intermediates 16.62 14.84 12.0% 15.55 16.70 -6.9%
Source: Full time private sector, the REPONSE Survey 2004-Dares. All data are weighted.
According to table 1, on average, compared to non members, union members were older,
more likely to be male, had longer tenure, were more likely to work in large plants (i.e. plants
of up to 500 employees); they were less likely to work in the distribution, hotels and catering
industry, and in plants with a high proportion of women.

13
Table 2: Descriptive statistics
With a trade union in the workplace Without a trade union
in the workplace
Office and blue collar workers
All
Union membership Union Member
Non member
Union Member
Non member
Individual characteristics Male 0.755 0.622 0.760 0.654 0.645
Tenure (years) 16.65 13.55 17.67 13.94 10.71
Age (years) 42.55 38.41 43.19 39.38 37.96
Working time (hours per week) 36.78 36.78 37.80 38.56 38.86
Qualified job 0.371 0.402 0.207 0.212 0.243
< High School 0.352 0.344 0.263 0.240 0.245
High School 0.442 0.415 0.381 0.304 0.359
College only 0.130 0.150 0.150 0.139 0.140
College and further 0.076 0.092 0.206 0.317 0.256
Workplace characteristics
Firm size (<50) 0.134 0.136 0.124 0.125 0.557
Firm size (50-199) 0.333 0.400 0.314 0.351 0.378
Firm size (200-499) 0.235 0.257 0.251 0.259 0.058
Firm size (500) 0.297 0.206 0.310 0.265 0.008
Manufactured consumable goods 0.157 0.144 0.122 0.122 0.083
Others manufacturing industries 0.295 0.259 0.276 0.252 0.175
Construction 0.040 0.044 0.029 0.041 0.119
Distribution, hotels, catering 0.061 0.157 0.052 0.115 0.224
Transport and communications 0.163 0.095 0.142 0.074 0.050
Banking, insurance, finance 0.026 0.034 0.062 0.067 0.031
Business services 0.102 0.114 0.125 0.158 0.157
Other services 0.116 0.115 0.120 0.100 0.093
Located in Paris 0.199 0.148 0.209 0.211 0.147
Domestic market 0.569 0.564 0.529 0.538 0.768
Market share >25% 0.342 0.385 0.328 0.384 0.292
Firm belongs to a group 0.684 0.654 0.679 0.676 0.359
Means of individual characteristics at the workplace
% of women in the workplace 0.297 0.372 0.318 0.370 0.348
Average age 37.07 36.01 37.55 36.53 29.94
% part time workers 14.0 15.2 14.3 14.6 12.1
% executive workers 0.108 0.102 0.168 0.194 0.150
% intermediate workers 0.210 0.195 0.279 0.243 0.220
% office workers 0.200 0.245 0.186 0.208 0.218
% blue collar workers 0.482 0.458 0.368 0.355 0.412
Union characteristics variables
Union density in the workplace 0.206 0.107 0.194 0.102 0,017
Only one trade union in the workplace 0.289 0.372 0.245 0.320 -
Two trade unions and more in the
workplace 0.711 0.628 0.755 0.680
-
Number of observations 404 1,945 782 4,176 1,531
Source: Full time private sector, the REPONSE Survey 2004. All data are weighted.

14
According to Schnabel and Wagner (2007), the probability to join a union is significantly
affected by personal and workplace characteristics, by the presence of a trade union, and by
union density in the workplace. In effect, we observe that union members are more likely to
be found in plants where union density is higher and where several trade unions are present,
factors which can influence the wage premium (table 2).
When it comes to individual characteristics, we note that workers who work in an
environment where no trade union is present differed only slightly from the others. On the
contrary, we note large differences in workplace characteristics.
Trade unions are more often missing in small plants, as well as in the distribution and
construction industries, where the workforce is younger and more often blue collar. On the
contrary, unions are relatively more present in firms which are large, which have an important
market share, which belong to a group and which are in the manufacturing, banking,
insurance and finance industries.
The aim of the econometric strategy is to test these results by controlling the selection process
and the observed and unobserved heterogeneity due to workplace characteristics.
THE ECONOMETRIC STRATEGY
The wage equation for worker i in workplace j takes the standard form:
(1)
Where ln W is the logarithm of the gross hourly wage, X is a vector of exogenous individual
characteristics, Z is a vector of exogenous workplace characteristics, and U is a union member
dummy variable. and are the estimated parameters. is our parameter of interest.

15
The vector X includes variables which we assume influence human capital (age, tenure,
working time, qualification, sex, and diploma). Some of these variables are correlated with
membership.
The vector Z includes industry and firm size dummies, the geographic location of the
establishment, and the proportion of female workers. These variables are usual in the sense
that they are present in almost all the studies which estimate union wage premium. Our
employer-employee sample gives us the opportunity to introduce more specific information.
In particular, we control for the firm‟s precise economic situation, i.e. the nature of its product
market (domestic or international; with a high or a low degree of competition) and the fact
that the firm belongs or not to a group of firms.
Finally, is an unobservable workplace effect and is a random effect.
Using a simple OLS estimation on pooled workers, table 3 presents the benchmark estimation
of the union membership wage premium. In model 1, which uses the entire sample of full
time employees in the private sector, the coefficient associated with union membership is not
significant.
When we restrict the sample to blue collar and office employees (who work in a firm where at
least one trade union is present), the UMWP becomes positive and significant. As noted by
Lewis (1986), translating the wage premium obtained by using equation (1) into a percentage
difference requires calculating 100(e0,033
-1), i.e. 3.4%.
The signs of the coefficients associated with control variables are coherent with other studies.
For instance, according to table 3, men receive higher wages than women. Also, as is usually
found, the relations between the log hourly wage and age or tenure are U-shaped. However,
we know that union membership is likely to be endogenous because of error measures,
selectivity issues or unobserved heterogeneity. The membership wage premiums obtained in

16
table 3 are thus likely to be biased. Moreover, as noted above, surveys on union wage
premium outlined that the amount and the significance of the estimated effect are strongly
influenced by workplace control variables included in the models, as well as by the
econometric specification of the model (Lewis 1986; Andrews & al. 1998; Bryson 2007).
To deal with these different problems, we exploit several usual econometric techniques
available with cross-sectional employer-employee data: OLS with workplace dummies; OLS
with averaged individual characteristics at the workplace level (Booth & Bryan 2004); the
propensity score (Bryson 2002) and separate equations (Andrews & al. 1998) (See appendix
for a detailed presentation).
Note to control for individual unobservable bias, one can use two alternative methods: first
differences (on longitudinal data), or an instrumental variable (with cross section data). Both
methods give questionable estimates of the UMWP. Panel data gives the opportunity to
control for fixed effects and unobserved heterogeneity. However, in the case of union
membership, few changes in union status take place over time, because union membership is
a quasi permanent characteristic (Hadas-Lebel 2006). So the analysis would focus only on
very specific workers, i.e. those who switch in and out of membership. Moreover,
misclassification and measurement errors can bias such studies. The instrumental estimate is
based on variables which affect the probability to join the union but which do not modify
directly the wage equation. But these instruments are difficult to find in surveys; and there is
often a doubt about their economic interpretation.
For those raisons, in this paper we do not use those strategies.
In order to be able to use the propensity score and separate equations, we need first to
estimate the probability for a given employee to be a union member. Table 4 below presents
these estimates. (The first two columns use the entire sample; the last two are for office and
blue-collar workers only). We observe that only sex, age and diploma affect the probability to

17
be a union member. It is noticeable that tenure and working time have no significant effect.
Another interesting result is the fact that the individual‟s opinion on unions and the union
characteristics at the workplace strongly affected the probability to join a union. Also, as table
4 shows, the higher union density is, the stronger the individual‟s probability to join a union3.
This can be interpreted as a peer pressure effect. Also, when several trade unions are present
in the workplace, the probability to join a union is higher. Several reasons may explain this,
such as increased competition between trade unions or the fact that unions target different
sections of the workforce (by occupation, for example). Also, when there are multiple unions
in the workplace, the worker may more easily find a union with political views more
consistent with his or her own views.
Table 5 presents the results obtained when using these three methods for the entire sample as
well as for the sub-samples made of, i) office and blue-collar workers; ii) qualified office and
blue-collar workers; and iii) office and blue-collar workers working in the manufacturing
industries. The different variables included in each specification are listed beneath the table.
The first row of the table recalls the coefficient obtained in table 3. The three next rows
include workplace characteristics to control for fixed effects. The UMWP are obtained by
introducing successively workplace dummies, means of individual characteristics4, and union
power (approximated by union density, as estimated by the manager and by the number of
different unions present in the workplace).
The next rows of table 5 gives estimates based on the propensity score method (PSM). As a
matching method, the PSM mimics an experiment, as it compares similar groups of
participants and non-participants. The PSM method matches the two groups just on the
propensity score; conversely, the matching method is based on a vector of characteristics.
Compared to the separate equations (SE) method (see below), the main advantage of the PSM
method is the non-parametric specification of the selection process. However, its drawback is

18
the lack of control for unobservables. So the result depends on the richness of the data
introduced in the score.
Table 3: OLS Results for the log hourly wage
Model 1 Model 2
Coeff. SDT Coeff. SDT
Constant 0.377* 0.213 1.667*** 0.323
Union member -0.002 0.014 0.033** 0.014
Male 0.121*** 0.009 0.092*** 0.009
Tenure/10 0.073* 0.036 0.133*** 0.039
(Tenure/10)2 -0.021*** 0.004 -0.019*** 0.003
Age/10 0.330*** 0.043 0.205*** 0.044
(Age/10) 2 -0.029*** 0.006 -0.023*** 0.006
(Tenure/10)*(Age/10) 0.014* 0.008 0.003 0.009
Working time 0.396*** 0.093 0.063 0.154
(Working time) 2 -0.019 0.011 -0.017 0.019
Qualified job 0.651*** 0.132 -0.476*** 0.116
< High School -0.394*** 0.012 -0.167*** 0.017
High School -0.330*** 0.012 -0.129*** 0.016
College -0.237*** 0.013 -0.086*** 0.018
College and further Ref. Ref.
Working time *Qualified job -0.205*** 0.036 0.114*** 0.031
Tenure *Qualified job -0.025** 0.010 0.000 0.009
Plant size (5) Yes Yes
Industry effect (8) Yes Yes
Paris localization 0.125*** 0.011 0.086*** 0.013
Domestic market -0.033*** 0.009 -0.046*** 0.010
Market share >25% -0.006 0.008 0.017* 0.009
Firm belong to a group 0.031*** 0.009 0.019** 0.009
Sample size 4,934 2,342
Adjusted R2 57.2 38.3
Source: Full time private sector, the REPONSE Survey 2004-Dares.
* significant at the 0.1 level, ** at the 0.05 level *** at the 0.01 level
Model 1: All workers with trade union(s) in the firm only
Model 2: For blue collar and office workers employees only and with trade union(s) in the firm

19
Note that, given that the calculated propensity score is a continuous variable, it is rare to
observe two individuals whose score is exactly the same. To overcome this problem, various
methods are available. In this paper, we chose the Kernel matching method. The main
advantage of this method is that all treated individuals are matched with a weighted average
of all controls, with a weight inversely proportional to the distance between the propensity
scores of the treated and the controls. This technique is more efficient than the “stratification”
or the “nearest neighbor” alternative methods (Lee, 2005).
Finally, the last rows of table 5 present the results for the separate equations model. Both the
propensity score method (PSM) and the separate equations (SE) specifications are based in
the first step on the estimation of the employee‟s probability to be a union member (see table
4). The controlled observed characteristics are sex, age, tenure, diploma, union density, the
individual‟s and manager‟s opinion on unions, size and industry dummies, and finally the
means of the sex, age, and occupation of the workers in the workplace.
For the separate equations (SE) specification, as Heckman and Robb (1985) pointed out, it is
not strictly necessary to find instruments for the identification of the effect of union
membership on the wage. The nonlinearity of the probit model is sufficient for the
identification. However, the presence of variables that are correlated with membership but
which are not correlated with unobserved factors explaining the wage (the manager’s and the
individual’s opinion on unions, the individual’s participation in a collective action) reinforce
the quality of the estimate. In contrast with OLS specification, the SE does not impose that the
coefficients associated with members and non members sub-samples are equal.
The Chow test allows us to control for this assumption. In our framework, the Chow test F
ratio obtained from estimating the wage equation subject to the restriction that the coefficient
associated to member and non-members is equal to 1,500. The critical value from the F table

20
is 1.75, so this hypothesis is strongly rejected. The separate equations model will provide
better estimates.
Note that the coefficients associated with the correlation between the error term of the
equation of selection and the two wage equations (noted and in the appendix) are
positive and significant at the 5% level. Finally, we calculated the average treatment effect on
the treated. The bootstrap technique (with 500 draws) is used to estimate the covariate
associated with this estimate.
We can finally estimate the value of the UMWP. Table 5 presents our various estimates
obtained with the different methods exposed above.
For estimates based on the entire sample, the coefficients associated with union membership
are never positive and significant. They are even negative in 7 out of the 10 specifications, but
the coefficients are insignificant, except when we introduce simple dummies to control for
fixed effects. These results indicate clearly that in France, on average, union membership does
not pay. This situation contrasts strongly with what is observed in the US.
Does this particular situation hold across workers, occupations, industries and firm sizes?
First, we note no differences between male and female workers, unlike what is observed in the
UK (Booth and Bryson, 2004). Moreover, there are no significant differences among
industries or firms of different size5.
Second, we observe a specific situation for office and blue-collar workers. According to table
5, these workers benefit from a positive and significant wage premium when they belong to a
union (in 5 specifications out of 10). However, this premium is very small; it varies between
+2.7% and +3.6%.

21
Table 4: Probit of the probability to be a union member
Model 1 Model 2
Coeff. SDT Coeff. SDT
Individual characteristics
Male 0.157*** 0.062 0.213*** 0.090
Tenure/10 0.072 0.151 -0.179 0.221
Age/10 0.152*** 0.053 0.156** 0.075
(Tenure/10)*(Age/10) -0.002 0.031 0.040 0.045
Working time 0.041 0.057 -0.038 0.123
< High School 0.003 0.079 -0.218 0.148
High School 0.158** 0.072 -0.047 0.142
College 0.211*** 0.082 -0.031 0.159
College and further Ref. Ref.
Union characteristics at the workplace
Union density in the workplace 1.158*** 0.145 1.055*** 0.194
Doesn‟t know union density 0.076 0.074 -0.033 0.108
Only one trade union in the workplace -0.096** 0.062 -0.074 0.084
Individual’s opinion on unions
Trade unions are useful for representing workers 0.481*** 0.067 0.606*** 0.093
Trade unions help workers 0.174*** 0.070 0.073 0.096
Trade unions only defend their own interests -0.292*** 0.053 -0.362*** 0.075
Trade unions do not interfere with firm business 0.322*** 0.054 0.360*** 0.075
Participation in collective actions (strikes, petitions...) 0.912*** 0.226 0.899*** 0.316
Participation in collective actions* Age -0.098** 0.052 -0.099 0.075
Manager’s opinion on unions
Trade unions are useful for representing workers 0.121** 0.071 0.072 0.107
Trade unions help workers -0.010 0.081 0.051 0.115
Trade unions only defend their own interests 0.008 0.051 -0.089* 0.070
Trade unions do not interfere with firm business -0.112** 0.066 -0.093 0.094
Workplace characteristics
% female -0.193 0.163 -0.003 0.223
Average age -0.047 0.068 -0.097 0.098
% intermediate workers 0.762*** 0.208 0.027 0.448
% office workers 0.693*** 0.198 0.448 0.364
% blue collar 0.338*** 0.159 0.094 0.328
Plant size (5) Yes Yes
Industry effect (8) Yes yes
Constant -2.872*** 0.407 -1.736*** 0.698
Sample size 4,934 2,342
Pseudo R2 25.5 21.3
Source: Full time private sector, the REPONSE Survey 2004-Dares.
* significant at the 0.1 level, ** at the 0.05 level *** at the 0.01 level
Model 1: All workers with a trade union(s) in the firm only
Model 2: For blue collar and office workers employees only and with trade union(s) in the firm

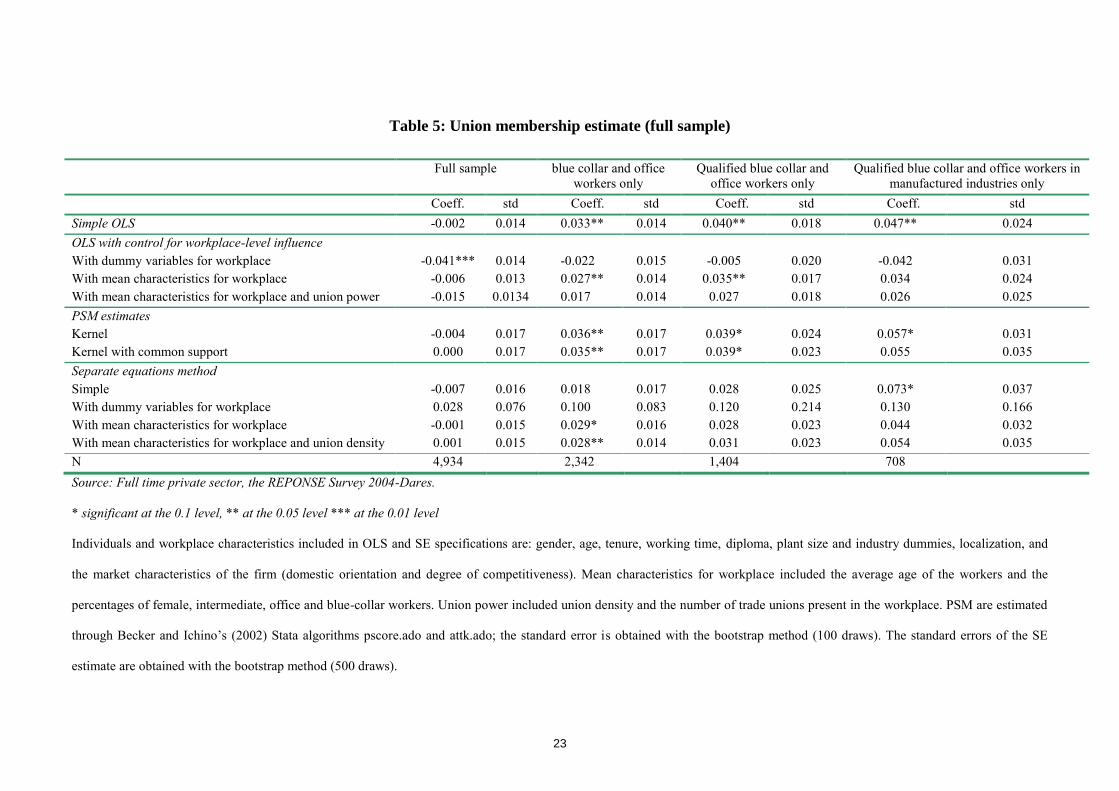
23
Table 5: Union membership estimate (full sample)
Full sample blue collar and office
workers only
Qualified blue collar and
office workers only
Qualified blue collar and office workers in
manufactured industries only
Coeff. std Coeff. std Coeff. std Coeff. std
Simple OLS -0.002 0.014 0.033** 0.014 0.040** 0.018 0.047** 0.024
OLS with control for workplace-level influence
With dummy variables for workplace -0.041*** 0.014 -0.022 0.015 -0.005 0.020 -0.042 0.031
With mean characteristics for workplace -0.006 0.013 0.027** 0.014 0.035** 0.017 0.034 0.024
With mean characteristics for workplace and union power -0.015 0.0134 0.017 0.014 0.027 0.018 0.026 0.025
PSM estimates
Kernel -0.004 0.017 0.036** 0.017 0.039* 0.024 0.057* 0.031
Kernel with common support 0.000 0.017 0.035** 0.017 0.039* 0.023 0.055 0.035
Separate equations method
Simple -0.007 0.016 0.018 0.017 0.028 0.025 0.073* 0.037
With dummy variables for workplace 0.028 0.076 0.100 0.083 0.120 0.214 0.130 0.166
With mean characteristics for workplace -0.001 0.015 0.029* 0.016 0.028 0.023 0.044 0.032
With mean characteristics for workplace and union density 0.001 0.015 0.028** 0.014 0.031 0.023 0.054 0.035
N 4,934 2,342 1,404 708
Source: Full time private sector, the REPONSE Survey 2004-Dares.
* significant at the 0.1 level, ** at the 0.05 level *** at the 0.01 level
Individuals and workplace characteristics included in OLS and SE specifications are: gender, age, tenure, working time, diploma, plant size and industry dummies, localization, and
the market characteristics of the firm (domestic orientation and degree of competitiveness). Mean characteristics for workplace included the average age of the workers and the
percentages of female, intermediate, office and blue-collar workers. Union power included union density and the number of trade unions present in the workplace. PSM are estimated
through Becker and Ichino‟s (2002) Stata algorithms pscore.ado and attk.ado; the standard error is obtained with the bootstrap method (100 draws). The standard errors of the SE
estimate are obtained with the bootstrap method (500 draws).

24
The variation of the coefficients across the specifications suggests that workplace fixed
effects, as well as the endogeneity of the union status and union density in the workplace,
affected significantly the membership premium estimate. The last row of table 5 is the only
estimate that proposed to control for such effects. The estimate we obtain is 2.8% and the
average of all the estimations is 2.3%.
The last columns of table 5 present different tests for different sub-samples. When we restrict
the sample to qualified blue collar and office workers and for those in the manufacturing
industries, the estimated wage premiums are slightly higher (between 4% and 7%). But the
estimates are more often not significant, due in part to the reduction in the size of the sample.
CONCLUSION
Little attention has been paid to French unions compared to their North American, British and
Scandinavian counterparts. This might be because of the specific context of this country. In
France, even if union density is very low, “representative” trade unions play a significant role
in bargaining rounds, and almost all workers are covered by collective agreements.
This paper is a first attempt to estimate, on a large representative survey, the UMWP. We
estimated this premium by using the three usual econometric techniques: OLS, PSM and SE.
We found that financial gains alone cannot, in any case, play a large part in explaining the
decision to join a union. Thus other explanations than the wage premium are required in order
to explain union membership such as, for instance, peer pressure or political considerations.
Besides, qualitative work indicates that the vast majority of union members have some level
of responsibility within French unions (Andolfatto & Labbé 2007). Joining a union can thus
also be understood as a way to start a new career.
However, given the low level of union density, if one wishes to strengthen bargaining at the
firm level and the representativeness of trade unions, ways are to be found to make union

25
membership more appealing to workers. We cannot say of course that increased wage premia
would induce more workers to join a union; but we cannot exclude this possibility either.
REFERENCES
Amossé, T. 2004. Myth and reality of union membership in France. Premières Synthèses,
44.2.
Andolfatto, D. & Labbé D. 2007. Les syndiqués en France (1990-2006), Report for the
DARES (Research unit of the French minsitry of labour).
Andrews, M. J., Stewart M. B., Swaffield J. K. and Upward R.. 1998. The estimation of union
wage differentials and the impact of methodological choices. Labour Economics, 5: 449-474.
Becker, S. O. and Ichino, A. 2002. Estimation of average treatment effects based on
propensity scores. Stata Journal, 2(4):358-377.
Besancenot, D. and Vranceanu, R. 1999. A trade union model with endogenous militancy:
interpreting the French case. Labour economics, 6: 355-373.
Bevort, A. 2004. Le syndicalisme français et la logique du recrutement sélectif : le cas de la
CFTC-CFDT. Le Mouvement social, 169: 109-136.
Blanchflower, D. and Bryson, A. 2004. The union wage premium in the US and the UK.
Center of Economic Performance Discussion Paper, 612.
Blanchflower, D. and Bryson, A. 2002. Changes Over Time in Union Relative Wage Effects
in the UK and the US Revisited. NBER Working Paper, 9395.
Blanchflower, D. and Bryson, A.. 2003. What Effect Do Unions Have on Wages Now and
Would „What Do Unions Do?‟ Be Surprised?. NBER Working Paper, 9973.
Blanchflower, D. and Bryson, A. 2009. The Wage Impact of Trade Unions in the UK Public
and Private Sectors. Economica, forthcoming.
26
Booth, A. L. 1995, The economics of the trade Union, Cambridge University Press.
Booth, A. L. and Bryan, M. L. 2004. The Union membership Wage-Premium Puzzle: Is there
a Free Rider Problem. Industrial and Labor Relations Review, 57 (3): 402-421.
Booth, A. L. and Chatterji, M. 1995. Union Membership and wage Bargaining when
membership is not compulsory. Economic Journal, 105: 345-360.
Bryson, A. 2002. The Union Membership Wage Premium: An Analysis Using Propensity
Score Matching. Center for economic Performance Discussion Paper, 530.
Bryson, A. 2007. The effect of trade Unions on wages. Reflets et Perspectives de la Vie
Economique, 54(2-3): 33-45.
Budd, J. W. and Na, I-G. 2000. The union membership wage premium for employees covered
by collective bargaining arrangements. Journal of labor Economics, 18: 783-807.
Dehejia, R. H. and Wahba, S. 2002. Propensity Score Matching Methods for
Nonexperimental Causal Studies. Review of Economics and Statistics, 84(1): 151-161.
Fang, T. and Verma, A.. 2002. Union wage premium. Perspectives on Labour and Income,
14(4): 17-23.
Friedman, G. 1988. Strike Success and Union Ideology: the United States and France, 1980-
1914. Journal of Economic History, 58(1):1-25.
Hadas-Lebel, R. 2006. Pour un dialogue social efficace et légitime : Représentativité et
financement des organisations professionnelles et syndicales. Paris: La Documentation
Française.
Heckman, J. J. Ichimura, H. and Todd, P. 1998. Matching as an econometric estimator Review
of Economic Studies, 65: 261-294.
Hildreth, A. 2000. Union Wage Differentials for Covered Members and Nonmembers in
Great Britain. Journal of Labor research, 21(1): 133-147.

27
Hirschman, A. 0. 1970. Exit, Voice and Loyalty: Responses to Decline in Firms,
Organizations, and States. Cambridge, MA: Harvard University Press.
Jarrell, S. B. and Stanley, T. D. 1990. A Meta-Analysis of the Union-Nonunion Wage Gap.
Industrial and Labor Relations Review, 44(1): 54-67.
Koevoets, W. 2007. Union wage premiums in Great Britain: Coverage or membership?
Labour Economics, 14:53-71.
Lee, M.-J. 2005. Micro-Econometrics for Policy Program, and Treatment Effects. New York:
Oxford University Press.
Lewis, H. G. 1986. Union relative wage effect. In Handbook of Labor Economics, edited by
Orley Ashenfelter and Richard Layard, Vol. II: 1139-82. Amsterdam: North-Holland.
OECD. 2004. Wage-setting institutions and outcomes. In Employment Outlook,
Chapter 3:127-181. Paris: OECD.
Reilly, K. T. 1996. Does Union Membership Matter? The Effect of Establishment Union
Density on the Union Wage Differential. Review of Economics and Statistics, 78(3): 547-557.
Rosenbaum, P. R. and Rubin, D. B. 1983. The Central Role of the Propensity Score in
Observational Studies for Causal Effects. Biometrika, 70: 41-55.
Schnabel, C. and Wagner, J. 2007. Union density and determinants of union membership in
18 EU countries: evidence from micro data 2002/3. Industrial Relations Journal, 38(1): 5-32.
Stewart, M. B. 1983. On Least Squares Estimation When the Dependent Variable is Grouped.
Review of Economic Studies, 50 (4): 737-753.

28
APPENDIX
The data
The REPONSE survey
The REPONSE survey (REPONSE literally means, in French, “answer”. It is an acronym for
“RElations PrOfessionnelles et NégociationS d‟Entreprise”) was conducted in 2005 by the
research and statistical unit of the French ministry for labour (the “DARES”) together with
the polling institute BVA. The survey covers economic activity, human resources
management and industrial relations in establishments belonging to firms operating in the
private sector with 20 employees or more (in 2004). The survey has three distinct parts: the
first part deals with representatives of the management (establishments sample); the second
with workers representatives (workers representatives sample); the third with the firm‟s
workers (workers sample). Each part has its own specific questionnaire.
The establishments sample includes around 3,000 observations out of a poll stratified by size
and activity, taken from the national firms and establishments database (called “SIRENE”).
The workers sample includes 12,000 observations taken from the national declaration of
social data (or “DADS” – see below). The poll was weighted by the workforce of each
establishment contacted. Last, the workers representative sample includes 2,000 observations.
The matching of the first two samples gives information on about 7,000 workers (age,
diploma, work experience, socioprofessional category, working time, etc.) and the firm where
they work (size, industry, economic environment, industrial relations, etc.).
The DADS files
DADS stands for “Annual Declaration of Social Data”. Filling this information once a year is
a legal requirement for all French firms. The information is sent to the Social Security

29
administration. The DADS declaration includes rich information on the firm‟s workers,
notably their wage. This is an exhaustive survey that covers all employees of the private
sector.
The hourly wage used here includes the base wage and premiums; bonuses corresponding to
extra time, hours worked on Sundays, during holidays or at night; some declared in-kind
benefits, employer pension schemes; profit-sharing schemes.
Econometric estimators
OLS with controls for the influence of the workplace
The employer-employee data give the opportunity to control for the across-workplace
selection problem (Booth and Bryan, 2004). Two alternatives are available: either the
introduction of workplace dummy variables, or the introduction of averaged workplace
variables.
In the first specification we have:
Note that the dummy variables (Dj) include all observable (Zj) and unobservable ( )
workplace characteristics of equation (1).
In the second specification we introduce mean characteristics in the wage equation. Note that
Booth and Bryan (2004) used averaged information calculated over observed individuals
only. In an employer-employee survey, the number of workers per workplace is relatively
small vis-a-vis the firm‟s size. Moreover, in most cases, these workers are neither random nor
representative of the staff. The use of this indicator can thus bias the estimates. In our sample,
this bias could be large6.

30
The REPONSE Survey used in this paper is merged with DADS files (see above). As we use
this survey that covers all employees, we can calculate the true mean individual
characteristics for a given workplace. Unfortunately, not all the variables included in X are
available in the DADS files. So, the specification takes the following form:
are the mean characteristics calculated for all the workers in the workplace. is the union
density declared by the manager. See Reilly (1996) for the control of endogeneity of this latter
variable.
Propensity score matching estimators
The causal effect of a given treatment (to be a union member in our case) on a given outcome
Y (the wage) can be evaluated with the propensity score matching method (Bryson, 2002).
Let us note T, an indicator of the treatment. If the worker received the treatment, T = 1 and
his/her outcome is y1. Conversely, if he/she did not receive the treatment, T = 0 and his/her
outcome is y0. The causal effect is defined by the difference between y1 and y0. The problem is
that two outcomes are never observed at the same time since a worker is either treated or
untreated but he/she cannot be both.
The average treatment effect on the treated takes the following form:
E(y1. - y0. T=1) = E(y1. T=1) - E(y0. T=1)
The second element on the right hand-side of this equation is never observable, so we need to
construct a counterfactual. This counterfactual is the outcome treated workers would have
benefited from if they had not been treated.
The matching method and the propensity score method are both based on the assumption that
all relevant differences between the two groups of workers, the treated and the non-treated,
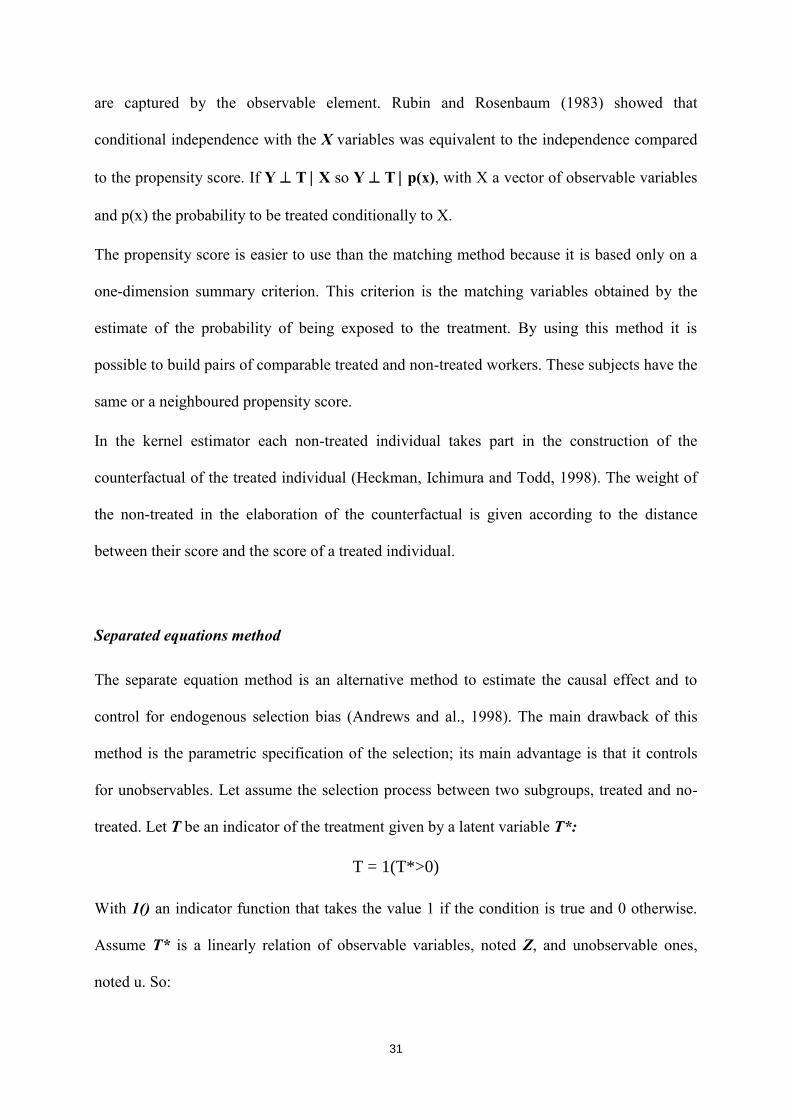
31
are captured by the observable element. Rubin and Rosenbaum (1983) showed that
conditional independence with the X variables was equivalent to the independence compared
to the propensity score. If Y T X so Y T p(x), with X a vector of observable variables
and p(x) the probability to be treated conditionally to X.
The propensity score is easier to use than the matching method because it is based only on a
one-dimension summary criterion. This criterion is the matching variables obtained by the
estimate of the probability of being exposed to the treatment. By using this method it is
possible to build pairs of comparable treated and non-treated workers. These subjects have the
same or a neighboured propensity score.
In the kernel estimator each non-treated individual takes part in the construction of the
counterfactual of the treated individual (Heckman, Ichimura and Todd, 1998). The weight of
the non-treated in the elaboration of the counterfactual is given according to the distance
between their score and the score of a treated individual.
Separated equations method
The separate equation method is an alternative method to estimate the causal effect and to
control for endogenous selection bias (Andrews and al., 1998). The main drawback of this
method is the parametric specification of the selection; its main advantage is that it controls
for unobservables. Let assume the selection process between two subgroups, treated and no-
treated. Let T be an indicator of the treatment given by a latent variable T*:
T = 1(T*>0)
With 1() an indicator function that takes the value 1 if the condition is true and 0 otherwise.
Assume T* is a linearly relation of observable variables, noted Z, and unobservable ones,
noted u. So:
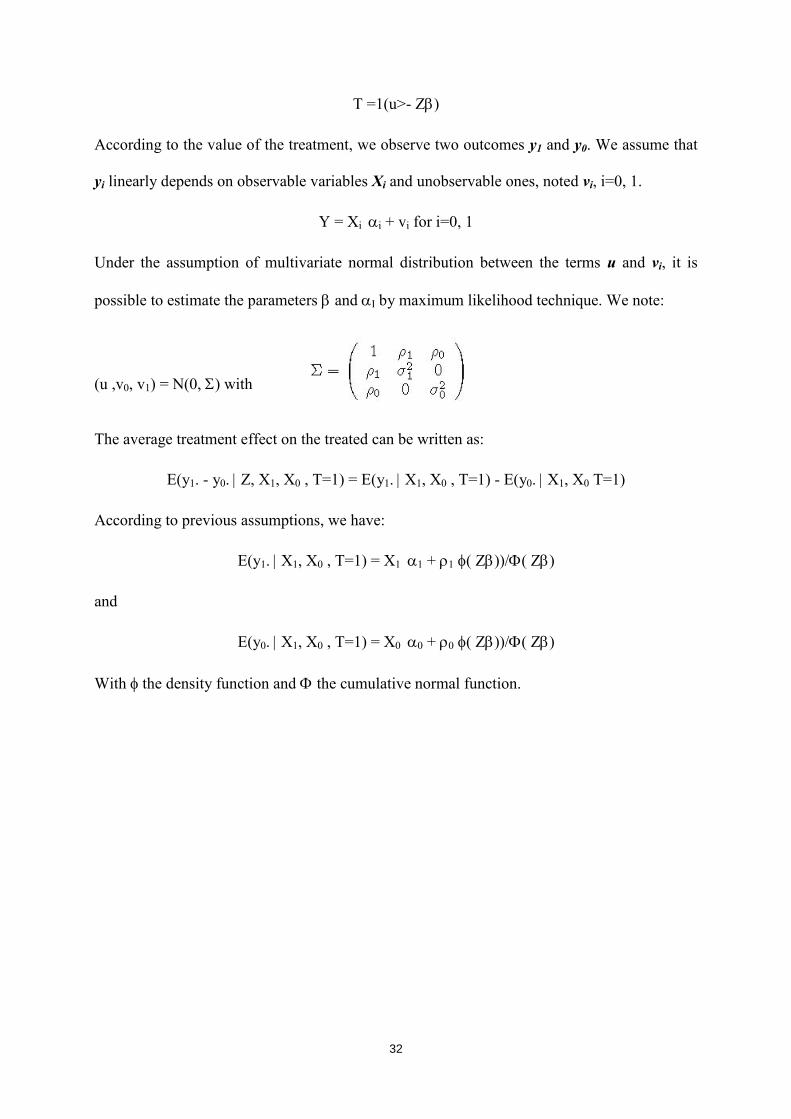
32
T =1(u>- Z)
According to the value of the treatment, we observe two outcomes y1 and y0. We assume that
yi linearly depends on observable variables Xi and unobservable ones, noted vi, i=0, 1.
Y = Xi i + vi for i=0, 1
Under the assumption of multivariate normal distribution between the terms u and vi, it is
possible to estimate the parameters and I by maximum likelihood technique. We note:
(u ,v0, v1) = N(0, ) with
The average treatment effect on the treated can be written as:
E(y1. - y0. Z, X1, X0 , T=1) = E(y1. X1, X0 , T=1) - E(y0. X1, X0 T=1)
According to previous assumptions, we have:
E(y1. X1, X0 , T=1) = X1 1 + 1 ( Z))/( Z)
and
E(y0. X1, X0 , T=1) = X0 0 + 0 ( Z))/( Z)
With the density function and the cumulative normal function.

33
NOTES
1 Jarrell and Stanley (1990), using meta-analysis, pointed out that the union non-union wage gap has varied
between 9% and 12% during the 1967-79 period.
2 Note that union members do not have the same status than union delegates. The latter benefit from a reduction
of working time for union activities, and are more protected than others workers against firing.
3 Note that this is not endogenous as the measure of union density excludes the membership of the individual
considered.
4 Note that for the means for individual characteristics, the data at the workplace level was available only for the
age, the percentage of female workers and the distribution of the workplace by occupation.
5 These results are not presented in the paper but are available under request.
6 In our sample, we observed (rounded figures): less than 1% of the labour-force in 40% of the workplaces;
between 1% and 10% in half the workplaces; and 10% and more for the remainder.