Embed Size (px)
Citation preview

Matrix Effect on Fat Crystallization in Laminated Bakery Products
by
Kristin Danielle Mattice
A Thesis presented to
The University of Guelph
In partial fulfillment of requirements for the degree of
Master of Science
In
Food Science
Guelph, Ontario, Canada
© Kristin Danielle Mattice, August, 2017

ii
ABSTRACT
Matrix Effect on Fat Crystallization in Laminated Bakery Products
Kristin Danielle Mattice Advisor:
University of Guelph, 2017 Dr. Alejandro G. Marangoni
The impact of a croissant matrix on fat crystallization was determined by analyzing the
polymorphism using powder x-ray diffraction (XRD), solid fat content (SFC) by pulsed nuclear
magnetic resonance (p-NMR) and melting behaviour by differential scanning calorimetry (DSC).
Roll-in shortenings of varying composition were used to prepare croissants. XRD revealed
polymorphic conversion (from β' to the β form) occurs when fat is baked within the matrix, and
the extent of conversion depends on the fat’s composition. In addition, the fat contained within a
croissant will have a significantly lower SFC and a greater temperature is required for complete
melting. The same fats were then baked in the presence of isolated croissant components (wheat
starch, gelatinized wheat starch, gluten and a formed gluten network) and the cooled samples
were analyzed using the same methods. Overall, the results suggested that changes in
crystallization behaviour are caused by an interaction between fat and gelatinized wheat starch.

iii
ACKNOWLEDGEMENTS
I would like to start by thanking my supervisor, Dr. Alejandro Marangoni, for all of his
guidance over the past two years. He has been incredibly supportive and encouraging throughout
this time, always pushing me to think, question and discuss. It is because of his continuous
support and the positive environment he encourages in the lab that I am where I am today. I
share my success with him, even though he never let me live down putting pineapple and bacon
in chocolate.
I would also like to thank my committee members, Dr. Douglas Goff and Dr. Amanda
Wright, for willingly giving me their time, insight and support for the duration of my Master’s
degree. Thank you for the constructive feedback and encouragement, your extensive knowledge
has been so valuable to this project.
To Dr. Fernanda Peyronel, Saeed Mirzaee Ghazani and Andrew Gravelle, I thank you for
the advice, the help with equipment and for being friendly faces to rely on. To my lab mates,
Katie, Brian, Pere, Cendy, Ming, Braulio, Chloe, Reed and the many visiting students that have
come through, thank you for being true friends who are kind and enjoyable to be around. You are
all responsible for the positive and respectful environment in the lab and it would not be the
same without you.
Finally, I would like to thank my family for their constant love and support. My parents,
Susan and Mike, and my brother, Greg, who were always encouraging and were my biggest
cheerleaders whenever I accomplished something new. And last but not least, my dog Finnie,
who’s snuggling and companionship I could not live without.

iv
TABLE OF CONTENTS
ABSTRACT ................................................................................................................................ ii
ACKNOWLEDGEMENTS ....................................................................................................... iii
TABLE OF CONTENTS ........................................................................................................... iv
LIST OF TABLES .................................................................................................................... vii
LIST OF FIGURES .................................................................................................................. viii
LIST OF ABBREVIATIONS ..................................................................................................... x
1.0 Introduction ........................................................................................................................... 1
1.1 Objectives .................................................................................................................................... 3
1.2 Hypotheses .................................................................................................................................. 4
1.3 References ....................................................................................................................................... 5
2.0 Literature Review .................................................................................................................. 8
2.1 Introduction into Fat Crystallization ............................................................................................ 8
2.2 Properties of Laminating Shortenings ......................................................................................... 9
2.3 Laminated Doughs ..................................................................................................................... 10
2.4 Wheat Flour and its Components .............................................................................................. 12
2.4.1 Starch Retrogradation ........................................................................................................... 13
2.4.2 Lipid-Starch Interactions ...................................................................................................... 13
2.4.3 Lipid-Protein Interactions ..................................................................................................... 14
2.5 Challenges in Improving the Fatty Acid Profile of Roll-in Shortenings ................................... 15
2.5.1 Partial Solid Fat Replacement using Oleogels ...................................................................... 17
2.6 Conclusions ............................................................................................................................... 19
2.7 References ..................................................................................................................................... 21

v
3.0 Part I: Matrix effects on the crystallization behaviour of butter and roll-in shortening in
laminated bakery products ........................................................................................................ 28
3.1 Materials and Methods .................................................................................................................. 28
3.1.1 Materials ............................................................................................................................... 28
3.1.2 Fatty Acid (FA) Composition ................................................................................................ 28
3.1.3 Triacylglycerol (TAG) Compositions .................................................................................... 29
3.1.4 Croissant Preparation .......................................................................................................... 29
3.1.5 Baked Bulk Fats .................................................................................................................... 32
3.1.6 Polymorphism ....................................................................................................................... 32
3.1.7 Thermal Behaviour ............................................................................................................... 32
3.1.8 Solid Fat Content .................................................................................................................. 33
3.1.9 Texture Analysis .................................................................................................................... 33
3.1.10 Statistical Analysis .............................................................................................................. 34
3.2 Results and Discussion.................................................................................................................. 34
3.2.1 Fatty Acid Composition ........................................................................................................ 34
3.2.2 Triacylglycerol Composition ................................................................................................ 35
3.2.3 Polymorphism ....................................................................................................................... 37
3.2.4 Thermal Behaviour ............................................................................................................... 43
3.2.5 Solid Fat Content .................................................................................................................. 45
3.2.6 Texture Analysis .................................................................................................................... 47
3.3 Conclusions ................................................................................................................................... 48
3.4 References ..................................................................................................................................... 50
4.0 Part II: Gelatinized Wheat Starch Influences Crystallization Behaviour and Structure of
Roll-in Shortenings in Laminated Bakery Products .................................................................. 53
4.1 Materials and Methods .................................................................................................................. 53
4.1.1 Materials ............................................................................................................................... 53
4.1.2 Croissant Preparation .......................................................................................................... 53

vi
4.1.3 Baked Isolated Component Mixtures .................................................................................... 53
4.1.4 Polymorphism ....................................................................................................................... 54
4.1.5 Solid Fat Content .................................................................................................................. 54
4.1.6 Rate of Crystallization .......................................................................................................... 55
4.1.7 Thermal Behaviour ............................................................................................................... 55
4.1.8 Statistical Analysis ................................................................................................................ 56
4.2 Results and Discussion.................................................................................................................. 56
4.2.1 Polymorphism ....................................................................................................................... 56
4.2.2 Solid Fat Content .................................................................................................................. 59
4.2.3 Rate of Crystallization .......................................................................................................... 60
4.2.4 Thermal Behaviour ............................................................................................................... 62
4.3 Conclusions ................................................................................................................................... 66
4.4 References ..................................................................................................................................... 67
5.0 Conclusions and Future Work ............................................................................................. 70

vii
LIST OF TABLES
Table 1: Roll-in Fat Compositions (as stated by manufacturer) 28
Table 2: Croissant Formula 31
Table 3: FA Composition as determined by GC 35
Table 4: TAG composition as determined by HPLC 36
Table 5: Ratios of β to β' peak areas1
with increasing storage time for baked fats and 42
croissants
Table 6: Isolated component mixture compositions 54
Table 7: SFC curves as a function of temperature for samples of hydrogenated 60
shortening and non-hydrogenated shortening with and without croissant matrix
components.
Table 8: Avrami coefficients from modelled rate of crystallization curves (Fig. 11) 62
for each shortening in bulk and when baked with wheat starch or gelatinized
wheat starch
Table 9: Melting peak width represented as the magnitude of difference between 64
Tend and Tonset for each shortening after baking without matrix components, after
baking into a croissant and after baking with isolated croissant components.
Table 10: Peak melting and crystallization temperatures for samples of baked 64
hydrogenated shortening and non-hydrogenated shortening with and without
croissant matrix components

viii
LIST OF FIGURES
Figure 1: Cross section of croissant prepared in this study (dough according to 31
formula from Table 2; roll-component was hydrogenated shortening A)
Figure 2: Wide angle X-ray spectra of roll-in fats in bulk, after baking, and baked 38
into a croissant (Cr): a) hydrogenated shortening A, b) hydrogenated shortening B,
c) butter and d) non-hydrogenated shortening
Figure 3: Wide angle X-ray spectra of baked roll-in fats over one week of storage: a) 40
hydrogenated shortening A, b) hydrogenated shortening B, c) butter and d)
non-hydrogenated shortening.
Figure 4: Wide angle X-ray spectra of croissants over one week of storage prepared 41
from a) hydrogenated shortening A, b) hydrogenated shortening B, c) butter and
d) non-hydrogenated shortening.
Figure 5: Wide angle X-ray spectra of a) crystalline wheat starch (obtained in 43
isolated form at a local supermarket) and b) gelatinized wheat starch
Figure 6: DSC melting endotherms of fats in bulk, after baking and within a 45
croissant (Cr): a) hydrogenated shortening A, b) hydrogenated shortening B,
c) butter and d) non-hydrogenated shortenings.
Figure 7: SFC curves as a function of temperature for: a) roll-in fats 46
and b) croissants.
Figure 8: Maximum force required to cut croissants comparing croissants prepared 47
with the different roll-in fats at different storage times. Bars with the same letter are
not statistically different.
Figure 9: XRD spectra after 24h of storage of a) hydrogenated shortening and 57
b) non-hydrogenated shortening, after baking without matrix components, after
baking into a croissant and after baking with isolated croissant components.
Figure 10: XRD spectra of a) H+St, b) NH+St, c) H+GSt and d) NH+GSt over 58
one week of storage.

ix
Figure 11: Changes in SFC as a function of time during the isothermal (10°C) 61
of a) hydrogenated shortening and b) non-hydrogenated shortening, each in bulk,
and after baking with wheat starch or gelatinized wheat starch. Solid lines
correspond to the Avrami fit of the model to the data.
Figure 12: DSC melting endotherms of a) hydrogenated shortening and 65
b) non-hydrogenated shortening with different components, and DSC crystallization
exotherms of c) hydrogenated shortening and d) non-hydrogenated shortening with
different components.

x
LIST OF ABBREVIATIONS
XRD Powder X-ray diffraction
SFC Solid fat content
p-NMR Pulsed nuclear magnetic resonance
DSC Differential scanning calorimetry
TAG(s) Triacylglycerols
FA Fatty acids
TFA Trans fatty acids
SFA Saturated fatty acids
UFA Unsaturated fatty acids
Tm Melting temperature
Tc Crystallization temperature
NH Non-hydrogenated shortening
H Hydrogenated shortening
+St Samples containing crystalline wheat starch
+GSt Samples containing gelatinized wheat starch
+G Samples containing gluten
+GN Samples containing formed gluten network

1
1.0 Introduction
Laminated doughs are high fat bakery products, consisting of many thin, alternating
layers of fat and dough formed by repeated rolling and folding. The extensive rolling and folding
that takes place has given the fats used in lamination the name of “roll-ins.” Upon baking, the
layering causes each individual dough layer to bake separately, creating the characteristic visual
separation of layers and flaky texture. Types of laminated doughs include croissants, known for
their distinct shape, Danishes, often filled with fruit, and puff pastry, used in a variety of
applications from sweet to savoury. Croissants, the primary focus of this thesis, can contain
approximately 30-40% fat by weight, therefore the properties of the fat have the ability to impact
the overall quality of the products (Lai & Lin, 2006). The fat serves many purposes in these
products, contributing functionality as wells as taste and lubricity. Crystallization characteristics
of these fats can be studied as an indicator of functionality, including the solid fat content (SFC)
as an indication of the hardness and rolling ability at a given temperature, and crystal
polymorphism which is often used in the food industry as an indicator of optimum plasticity. Of
the three major polymorphic forms occurring in fats (α, β' and β), optimum plasticity of roll-in
fats has been correlated to the presence of β' crystals (Macias-Rodriguez & Marangoni, 2016a).
The polymorphic form present will also directly affect the melting temperature of a fat
(Marangoni & Wesdorp, 2013a).
While butter is often thought of as the standard for laminated dough preparation, it is not
favourable for large scale production due to its high cost and narrow plastic range. In the
industry, roll-in shortenings manufactured by partial hydrogenation from different oils were first
utilized, and produced highly accepted laminated dough products. However, these shortenings
contain high proportions of trans fatty acids (TFA), which have a known association with heart
disease and other chronic diseases (Keys, Anderson, & Grande, 1965; Lichtenstein, 2014;
Mensink & Katan, 1992; Mensink, Zock, Kester, & Katan, 2003; Thompson, Minihane, &
Williams, 2011). This has led to the removal of partially hydrogenated shortenings in favour of
non-hydrogenated shortenings produced via interestification or by blending oils with high
melting fractions (Gibon & Kellens, 2014; McNeill, 2014). These shortenings, however, have
not provided the same sensorial acceptability as the partially hydrogenated shortenings, leaving
many consumers unsatisfied with the alternatives (Garcia-Macias, Gordon, Frazier, Smith, &

2
Gambelli, 2011, 2012; Simovic, Pajin, Seres, & Filipovic, 2009; F. C. Wang, Gravelle, Blake, &
Marangoni, 2016). Continuing research indicates that increasing consumption of unsaturated
fatty acids (UFA) in favour of saturated fatty acids (SFA) is correlated with positive health
effects (Hu, Manson, & Willett, 2001; Lunn & Theobald, 2006). This has led to new efforts to
produce a roll-in shortening containing primarily UFA, however studies have found that these
shortenings have limitations when it comes to functionality (Acevedo & Marangoni, 2014; Blake
& Marangoni, 2015; Garcia-Macias et al., 2011, 2012; Simovic et al., 2009). At this point, no
roll-in shortening developed meets both the health and functionality criteria.
The focus now must be to understand how hydrogenated roll-in shortenings behave once
incorporated into these products and ultimately to develop a TFA free, and low SFA roll-in
shortening that behaves in the same way. It cannot be assumed that the properties of a roll-in
shortening prior to incorporation remain after baking. First, the high temperatures required in
baking are sufficient to completely melt any existing fat crystals, erasing their prior crystalline
form and allowing for changes in crystallization behaviour upon cooling within the matrix.
Second, melting and cooling the fat in the presence of the other ingredients creates opportunity
for ingredient interactions. Notable interactions between lipid materials and starch, as well as
lipid materials and proteins have been documented, meaning there is great potential for the
croissant components (particularly wheat starch and gluten) to interact with the roll-in fats and
alter the crystallization behaviour (Eliasson, 1994; Goesaert et al., 2005; Karel, 1973; Pareyt,
Finnie, Putseys, & Delcour, 2011; Tang & Copeland, 2007). Storage time is also a variable given
the known changes that occur in bakery products, including starch retrogradation and the
migration and loss of moisture, which could impact the fat crystallization behaviour over a
croissants’ week long shelf life.
Until now, the crystallization properties of a fat contained within a baked matrix have
never been investigated. In this work, the impact of baking a commonly used roll-in fat into a
laminated dough matrix on a fat’s crystallization behaviour was investigated, including
polymorphism (by XRD), melting behaviour (by DSC) and SFC (by p-NMR). The use of these
techniques applied to fat contained within bakery products, specifically croissants has not been
documented, therefore sample preparation techniques were developed accordingly. Four
different fats were used to prepare four different types of croissants: butter, two different
hydrogenated shortenings (termed A & B) and one non-hydrogenated shortening. The

3
shortenings used were all specialized for lamination. The inclusion of both hydrogenated and
non-hydrogenated shortenings allowed for speculative assessment of why the products produced
vary significantly in perceived acceptability. Texture analysis for product firmness, using a
Texture Analyzer fit with a knife blade attachment, also shed light on potential sensory
consequences of any changes in crystallization behaviour occurring in the matrix. For a complete
investigation, comparison of samples of each fat baked for the same time and at the same
temperature used in baking the croissants ensured that any noted differences between bulk fat
and fat within a croissant were not simply caused by melting and recrystallization. In order to
determine which components are responsible for any observed interaction, this research
evaluated potential for interactions between the roll-in shortenings and either wheat starch or
gluten. Given the noted differences observed between shortenings of different composition, and
whether or not they had been hydrogenated, this investigation focused on the behaviour of one
hydrogenated shortening and one non-hydrogenated shortening. Mixtures of each shortening
with either crystalline wheat starch (St) or gluten (G) were prepared. However, since croissant
preparation requires the roll-in shortenings to be layered with pre-made dough, in which flour is
hydrated, this means that the gluten contained would have formed a network, and the starch
would gelatinize upon baking. As such, interactions with gelatinized wheat starch (GSt) or a
formed gluten network (GN) were accounted for by first mixing starch or gluten with distilled
water before baking in order to best simulate a fat interacting with prepared dough. All results
were compared with those previously obtained from the respective croissants.
1.1 Objectives
Identify sample preparation techniques for croissants by XRD, p-NMR and DSC
Analyze the crystallization behaviour of fats contained within croissants
Determine if there is an interaction between fat and croissant matrix components
Investigate and identify component(s) that are interacting

4
1.2 Hypotheses
The crystallization behaviour of fats will be different within a croissant matrix
compared to when simply heated and cooled on their own
An interaction between one or more croissant components causes changes in
crystallization behaviour
The interaction will cause the fat to form the most stable polymorphic form
The interaction will be between starch or gluten, suspected based on the large
proportion of wheat flour in the ingredient composition

5
1.3 References
Acevedo, N. C., & Marangoni, A. G. (2014). Engineering the Functionality of Blends of Fully
Hydrogenated and Non-Hydrogenated Soybean Oil by Addition of Emulsifiers. Food
Biophysics, 9, 368–379.
Blake, A. I., & Marangoni, A. G. (2015). Factors affecting the rheological properties of a
structured cellular solid used as a fat mimetic. Food Research International, 74, 284–293.
Eliasson, A. (1994). Interactions between starch and lipids studied by DSC. Thermochimica
Acta, 246, 343–356.
Garcia-Macias, P., Gordon, M. H., Frazier, R. A., Smith, K., & Gambelli, L. (2011).
Performance of palm-based fat blends with a low saturated fat content in puff pastry.
European Journal of Lipid Science and Technology, 113, 1474–1480.
Garcia-Macias, P., Gordon, M. H., Frazier, R. A., Smith, K., & Gambelli, L. (2012). Effect of
TAG composition on performance of low saturate shortenings in puff pastry. European
Journal of Lipid Science and Technology, 114, 741–747.
Gibon, V., & Kellens, M. (2014). Latest Developments in Chemical and Enzymatic
Interesterification for Commodity Oils and Specialy Fats. In D. R. Kodali (Ed.), Trans Fat:
Replacement Solutions (pp. 153–186). Urbana, IL: AOCS Press.
Goesaert, H., Brijs, K., Veraverbeke, W. S., Courtin, C. M., Gebruers, K., & Delcour, J. A.
(2005). Wheat flour constituents: how they impact bread quality, and how their mpact their
functionality. Trends in Food Science & Technology, 16, 12–30.
Hu, F. B., Manson, J. E., & Willett, W. C. (2001). Types of Dietary Fat and Risk of Coronary
Heart Disease: A Critical Review. Journal of the American College of Nutrition, 20, 5–19.
Karel, M. (1973). Protein Interactions in Biosystems: Protein-Lipid interactions. Journal of Food
Science, 38, 756–763.
Keys, A., Anderson, J., & Grande, F. (1965). Serum cholesterol response to changes in the diet:
IV. Particular saturated fatty acids in the diet. Metabolism, 14, 776–787.
Lai, H. M., & Lin, T. C. (2006). Bakery Products: Science and Technology. In Y. H. Hui (Ed.),
Bakery Products: Science and Technology (pp. 3–65). Ames, IA: Blackwell Publishing.

6
Lichtenstein, A. H. (2014). Dietary Trans Fatty Acids and Cardiovascular Disease Risk: Past and
Present. Current Atherosclerosis Reports, 16, 1–7.
Lunn, J., & Theobald, H. E. (2006). The health effects of dietary unsaturated fatty acids.
Nutrition Bulletin, 31, 178–224.
Macias-Rodriguez, B., & Marangoni, A. G. (2016). Physicochemical and Rheological
Characterization of Roll-in Shortenings. JAOCS, Journal of the American Oil Chemists’
Society, 93, 575-585.
Marangoni, A. G., & Wesdorp, L. H. (2013). Crystallography and Polymorphism. In Structure
and Properties of Fat Crystal Networks (pp. 1–24).
McNeill, G. P. (2014). Processing Solutinos: Fractionation and Blended Oils. In D. R. Kodali
(Ed.), Trans Fat: Replacement Solutions (pp. 123–138). Urbana, IL: AOCS Press.
Mensink, R. P., & Katan, M. B. (1992). Effect of Dietary Fatty Acids on Serum Lipids and
Lipoproteins: A meta-analysis of 27 trials. Arteriosclerosis, Thrombosis, and Vascular
Biology, 12, 911–919.
Mensink, R. P., Zock, P. L., Kester, A. D. M., & Katan, M. B. (2003). Effects of dietary fatty
acids and carbohydrates on the ratio of serum total to HDL cholesterol and on serum lipids
and apolipoproteins: a meta-analysis of 60. The American Journal of Clinical Nutrition, 77,
1146–1155.
Pareyt, B., Finnie, S. M., Putseys, J. A., & Delcour, J. A. (2011). Lipids in breadmaking: Sources
interactions and impact on bread quality. Journal of Cereal Science, 54, 266–279.
Simovic, D. S., Pajin, B., Seres, Z., & Filipovic, N. (2009). Effect of low-trans margarine on
physicochemical and sensory properties of puff pastry. International Journal of Food Science
and Technology, 44, 1235–1244.
Tang, M. C., & Copeland, L. (2007). Analysis of complexes between lipids and wheat starch.
Carbohydrate Polymers, 67, 80–85.
Thompson, A. K., Minihane, A.-M., & Williams, C. M. (2011). Trans fatty acids, insulin
resistance and diabetes. European Journal of Clinical Nutrition, 65, 553–564.

7
Wang, F. C., Gravelle, A. J., Blake, A. I., & Marangoni, A. G. (2016). Novel trans fat
replacement strategies. Current Opinion in Food Science, 7, 27–34.

8
2.0 Literature Review
2.1 Introduction into Fat Crystallization
Solid fats, including roll-in fats, are semisolid materials made of triacylglycerides (TAG)
molecules where a solid fat crystal network entraps liquid oil within. Each fat will have a
specific crystallization and melting temperature. When the system is in liquid state and is cooled
below the melting temperature, the system becomes undercooled. This is equivalent to
supersaturation, and at this point it is energetically favourable to change from liquid to solid state
(Marangoni & Wesdorp, 2013b; Rousset, 2002). Fat crystallization begins with nucleation, when
the TAG molecules aggregate to form stable nuclei. However, components in the system, such as
impurities, can act as a site on which fat can crystallize, and in this case it is more energetically
favourable to crystallize directly on that surface rather than form nuclei, and as such, the rate of
crystallization is increased (Coupland, 2002; Rousset, 2002). Crystal size, and by extension the
number of crystals formed, are highly dependent on the nucleation rate therefore any factors that
alter this rate have the potential to alter the properties of the TAG system.
Once nucleation has begun, the crystal size depends on whether the dominating force is
crystal growth or nucleation. Larger crystals form when fat simply attaches to existing crystals or
nuclei, and this is favoured when slow cooling rates are used. However, different processing
conditions can be modified to alter the crystallization process and favour formation of smaller
crystals, including rapid cooling with added shear force during cooling. Crystal size will affect
the rheological properties of a fat, including plasticity, which is an important characteristic to
consider in many food applications (Narine & Marangoni, 1999).
After nucleation has occurred, the fat crystals that form can take on different forms, a
phenomenon known as polymorphism. The three major polymorphic forms occurring in fats are:
α (hexagonal), β' (orthorhombic), and β (triclinic), listed in increasing order of melting point,
density and stability, and classified according to their subcell structure. The polymorphic form(s)
present will directly affect the melting point of a fat and have also been correlated to the
rheological properties, therefore making the polymorphism of a fat relevant in terms of
functionality and potential application (Marangoni & Wesdorp, 2013a).

9
2.2 Properties of Laminating Shortenings
Laminating shortenings are solid fats used to make high fat (on average 40% fat by
weight) dough and pastry products, including yeast-leavened Danishes and croissants, as well as
unleavened puff pastry. The shortenings used are commonly high in saturated fat content and are
therefore of interest for saturated fat reduction (Ergun, Thomson, & Huebner-Keese, 2016; Lai &
Lin, 2006). The properties of a roll-in fat which achieve optimum functionality have been well
established. First, roll-in fats require optimum plasticity at the specific temperature at which the
croissants will be prepared due to the rolling that will take place. The fats must be soft and
spreadable to facilitate layering without tearing the dough layers, but not so soft that they leak
out under the pressure. A minimum SFC is also required to entrap and stabilize small bubbles of
air. The layering of fat within the wheat dough results in a structure with air bubbles of non-
uniform size dispersed horizontally within the matrix (Deligny & Lucas, 2015). This aids in the
separation of the dough layers creating the visible rise and yielding an airy, flaky appearance.
The SFC of a fat is one factor that gives a good indication of the hardness and rolling
ability of a fat at a given temperature. The fatty acid composition of a fat governs the SFC at
particular temperatures, with respect to the proportions of saturated (SFA), unsaturated (UFA)
and trans fatty acids (TFA). It is commonly understood that fats high in SFA or TFA will be
solid at ambient temperatures and have a higher SFC, while fats high in UFA will have a low
SFC at ambient temperatures, and exist in oil form. The fatty acid content is highly variable
based on the fat source and can be used to predict the plasticity of a fat, as well as the SFC at
particular temperatures. Roll-in shortenings are produced with a SFC ranging from 10-40% over
a range of 33.3-10.0°C, making them plastic and workable in a wider range than other bakery
fats (Baldwin, Baldry, & Johansen, 1972; Lai & Lin, 2006).
However, SFC is not the sole factor controlling the functionality of a fat (Marangoni &
Rousseau, 1998). Another factor involved in the plasticity and functionality of roll-in fats is
polymorphism. Fat polymorphism is often used as an indicator for fat functionality in the food
industry, and in the case of laminated doughs, optimum plasticity has been correlated to the
presence of β' crystals. These crystals tend to be smaller in size with needle-like shapes, and
create strong, plastic shortenings (Macias-Rodriguez & Marangoni, 2016a). It has also been
suggested that fats stable in the β' form have a greater ability to retain separate layers during

10
rolling and manufacturing (Garcia-Macias et al., 2011). Conversion to β polymorphs, the most
stable crystal form, can occur but these crystals are often larger and associated with hard and
brittle textures making them undesirable for rolling (Baldwin et al., 1972; DeMan, DeMan, &
Blackman, 1991). The presence of β' polymorphism has become standard for laminating or roll-
in shortenings.
The fatty acid composition and TAG composition of roll in fats can vary significantly. In
two studies by Garcia-Macias et al., different fat blends composed primarily of either soybean
and shea or palm fractions were used to prepare puff pastry (Garcia-Macias et al., 2011, 2012).
These blends all had approximately the same content of SFA (30%) but had different FA and
TAG compositions. The resultant puff pastry behaved differently with regards to puff pastry
height and hardness, which puts emphasis on the fact that fat composition is a factor in the
performance of a fat used in lamination.
Recent work by Macias-Rodriguez and Marangoni thoroughly characterizes the
rheological characteristics of roll-in shortenings and compared the results to all-purpose
shortenings commonly used in cakes and other non-rolling applications (Macias-Rodriguez &
Marangoni, 2016a, 2016b, 2017). The authors noted that all types of shortenings displayed
similarities in polymorphism, SFC, melting behaviour, as well as large deformation mechanical
behaviour. However, there were distinct differences in the nonlinear rheological behaviour
between the types of shortenings, where roll-in shortenings displayed greater viscous behaviour.
This behaviour was correlated to the microstructure of layered crystalline aggregates identified
using ultra small angle x-ray scattering (USAXS) unique to laminating shortenings, stating that
this structure allows for greater viscous dissipation during the lamination process. The authors
describe that this behaviour can be thought of as a “rheological fingerprint,” where shortening
alternatives can be developed with this behaviour in mind.
2.3 Laminated Doughs
Many types of laminated dough products exist, including puff pastry, Danishes and
croissants. They all characteristically contain numerous alternating layers of fat and dough
created by repeated rolling and folding, but will differ in the softness of the dough, the layering
process used and content of yeast. For each type of laminated dough, different layering methods

11
exist, each involving distinct folding patterns and a varying number of resultant layers. These
methods can be done by manual rolling or machine sheeting, however industrial production will
employ machine roller systems to ensure the desired thickness is achieved and uniform (Lai &
Lin, 2006). By creating these thin layers of solid fat within the dough, the fat is then able to act
as a moisture barrier during baking. When the moisture in the dough turns to vapour and
expands, the many hydrophobic layers of fat prevent this vapour from simply escaping, and as a
result, the layers begin to expand (Baldwin et al., 1972; Renzetti, de Harder, & Jurgens, 2016;
Rogers, 2004). Laminated doughs possess the capability of rising 80-600% of their initial height
(Deligny & Lucas, 2015). For context, oven-rising bread dough will only rise to 20-100% of the
initial height.
Deligny & Lucas investigated the effect of the number of layers on the final product
(Deligny & Lucas, 2015). Their work revealed that a minimum number of fat layers result in
baked products with few, large air pockets. Increasing the number of folds, and by extension the
number of layers, increased the height of the final product. However, there was a maximum
number of folds to which this relationship applied. Exceeding this number of folds resulted in fat
layers that were too thin to act as water vapour barriers and thus rising was limited.
Renzetti et al. demonstrated the importance of the layered structure in laminated
doughs, with respect to the extent of rising and flakiness of the final product (Renzetti et al.,
2016). The authors determined that the highest lift and flaky texture corresponded to the doughs
that contained the best formed layered structure, identified using microscopy. The rolling and
sheeting process involves significant strain and deformation rates. The ability to achieve a
desired layered structure depends on the materials ability to respond to this stress. Layers which
were not uniformly formed or had been broken during rolling contributed to compromised lift
and flakiness. This study put emphasis on the type of fat used and its consistency both initially
and during working or rolling, where they were able to identify which fats would perform the
best in regards to forming the best layered structure.

12
2.4 Wheat Flour and its Components
Wheat flour is composed of starch, water, protein, non-starch polysaccharides and lipids.
Starch is the major component (70-75%), followed by water (14%), protein (10-12%),
polysaccharides (2-3%) and finally the lipid portion (1.5-2%) (Frazier, Daniels, & Eggitt, 1981;
Goesaert et al., 2005). For starch, the primary components are amylose and amylopectin, two
different polymers of D-glucose. Amylose is a linear polymer of glucopyranose linked together
by α(1,4) glycosidic bonds, while amylopectin is a branched polymer of glucopyranose linked
together by α(1,4) glycosidic bonds with branches linked by α(1,6) bonds (Goesaert et al., 2005;
S. Wang, Li, Copeland, Niu, & Wang, 2015). In breadmaking, starch contributes to water
absorption but does not contribute much functionality overall, acting mainly as a filler within the
network of protein that forms after hydration. The protein content of wheat flour is integral to
breadmaking, specifically due to the content of gluten. Wheat flour proteins are distinguished
into two main groups: gluten proteins and non-gluten proteins. However, the non-gluten only
comprise approximately 15-20% of the total proteins, and their role in breadmaking remains
unclear (Goesaert et al., 2005; Veraverbeke & Delcour, 2002). It is the gluten proteins that are
responsible for network formation, and of these proteins, there are two distinguishable fractions,
gliadins, which are monomeric, and glutenins, which are polymeric. Changes in the relative
proportions of glutenin and gliadin cause variations in the protein network formation during
breadmaking (Goesaert et al., 2005; Marchetti, Cardós, Campaña, & Ferrero, 2012). The gluten
network that forms is viscoelastic, giving bread dough the ability to retain gas cells as they
expand during leavening and baking, allowing for significant expansion or rising (Marchetti et
al., 2012). The non-starch polysaccharides include arabinoxylans, β-glucan, cellulose and
arabinogalactan peptides, which can effect dough consistency, development time, gas cell
stabilization during baking, and loaf volume (Gan, Ellist, & Schofield, 1995; Goesaert et al.,
2005). Finally, the lipid portion is divided into starch lipids and non-starch lipids. Starch lipids,
primarily lysophospholipids, are strongly bound to starch, while non-starch lipids, which
represent the majority of the total lipids, are primarily TAGs, and are either free or associated
with proteins. Overall, wheat flour lipids contribute to gas cell stability and gluten network
formation in breadmaking (Frazier et al., 1981; Goesaert et al., 2005; Lasztity, Bekes, Orsi,
Smied, & Ember-Karpati, 1996).

13
2.4.1 Starch Retrogradation
The process of retrogradation occurs naturally in baked goods over time and is often
considered detrimental due to its association with bread staling and firming. However, it is
desired in other applications such as dehydrated mashed potatoes and breakfast cereals due the
sensory and structural properties contributed (Karim, Norziah, & Seow, 2000; S. Wang et al.,
2015). Native starch exists in a semi-crystalline form, and will produce characteristic peaks in an
XRD spectrum. When starch is hydrated and heated, gelatinization occurs, where granules swell
and lose their crystallinity. This gelatinized state is associated with physical changes including
increased viscosity and gel formation (Ratnayake & Jackson, 2007; S. Wang et al., 2015). After
gelatinization, storage time allows for amylose and amylopectin chains to precipitate from their
gelled state and re-associate into ordered structures, a process known as retrogradation.
Retrogradation has also been described as the return of starch components to their granular or
crystalline state, evident by XRD as the loss of peaks in the spectra after gelatinization, and the
return of a weak pattern over time. (Bayer, Cagiao, & Baltá Calleja, 2006; Miles, Morris, Orford,
& Ring, 1985; Morris, 1990; Roulet, MacInnes, Würsch, Sanchez, & Raemy, 1988). For this
reason, XRD is one method used in the analysis of starch retrogradation, in addition to thermal
analysis and rheological methods (Karim et al., 2000).
2.4.2 Lipid-Starch Interactions
Beyond laminated dough products, there are many food products in which starch and
lipids are major components and have the opportunity to interact. This led to the documentation
of many types of interactions between lipids and starch, including the addition of fat to baked
goods to reduce moisture loss and increase the shelf life, as well as the addition of fat to alter the
rheological properties of starch (Eliasson & Wahlgren, 2004; Tang & Copeland, 2007). Fatty
acids and monoglycerides have been shown to increase the viscosity of starch pastes using rapid
visco analyzer (RVA) techniques (Liang, King, & Shih, 2002; Ravi, Manohar, & Rao, 1999;
Tang & Copeland, 2007; Zhang & Hamaker, 2003).
Many of these observed effects resulting from starch-lipid interactions are explained by
the well-established formation of amylose-lipid and amylopectin-lipid complexes, which form
when starch is gelatinized in the presence of lipids, particularly monoglycerides and fatty acids

14
(Eliasson & Wahlgren, 2004; Tang & Copeland, 2007; Tufvesson & Eliasson, 2000). Formation
of these complexes changes properties of the starch, including modification of the solubility of
starch in water, and retarding starch retrogradation (Riisom, Krog, & Eriksen, 1984; Tang &
Copeland, 2007). The structure of these complexes can be described as a helix formed by
glucosyl residues around a hydrophobic centre. Amylose-lipid complexes have melting
temperatures ranging from 95-115°C, at which point they dissociate. Upon cooling, the materials
recrystallize and again form the complexes, demonstrating reversible thermal behaviour (Bulpin,
Welsh, & Morris, 1982; Putseys, Lamberts, & Delcour, 2010). Amylopectin-lipid complexes do
not show any endothermic peaks upon melting during DSC analysis and are therefore more
difficult to identify. Many factors dictate the extent of complex formation, including the content
of unsaturated versus saturated monoglycerides and fatty acids, the type of starch and the rate of
gelatinisation (Eliasson & Krog, 1985; Krog & Nybo Jensen, 1970; Riisom et al., 1984). These
factors also influence the melting behaviour of the resultant complexes, where longer differences
in chain length and the time-temperature treatment used in formation will directly affect the
melting behaviour of the complexes (Eliasson & Wahlgren, 2004; Karkalas, Ma, Morrison, &
Pethrick, 1995; Siswoyo & Morita, 2002).
2.4.3 Lipid-Protein Interactions
Protein molecules are very long and are composed of both hydrophobic and hydrophilic
regions, therefore, they could interact with either type of material. These different and alternating
sections are responsible for creating the secondary, tertiary and quaternary structure of proteins.
Proteins also have non-polar side chains that can interact with lipids, and for this reason proteins
are known to have oil and fat binding properties. In foods, proteins often interact with lipid
components to form emulsions. For example, emulsion stabilization in products such as dairy
occurs due to protein-lipid interactions (Karel, 1973; Pomeranz & Chung, 1978). Dairy is an oil-
in-water emulsion where lipoprotein complexes surround fat globules and stabilize them in the
system.
The well-known interaction between lipids (when in large quantities) and gluten is the
inhibition of gluten network formation, desirable in certain bakery applications including cookies
and pie crusts. However, wheat flour contains a small portion of lipids itself, and this content has
been shown to interact with gluten by hydrophobic or hydrophilic bonds with gliadin and

15
glutenin respectively, contributing to dough formation and loaf volume (Frazier et al., 1981;
Lasztity et al., 1996; MacRitchie, 1977; McCann, Small, Batey, Wrigley, & Day, 2009;
Pomeranz & Chung, 1978). It was determined that non-polar lipids exist on the surface of starch
granules or in small lipid droplets throughout bread dough, while polar lipids were present within
the protein matrix itself, identified using confocal scanning laser microscopy. Together, gluten
and polar lipids form a three dimensional matrix that surrounds starch granules and has excellent
gas cell stabilization abilities (Li, Dobraszczyk, & Wilde, 2004).
2.5 Challenges in Improving the Fatty Acid Profile of Roll-in Shortenings
Solid fat plays a distinct and essential role in a large variety of food products. This
includes functional roles, as well as providing characteristic mouthfeel and texture. In general,
the high melting TAGs are made up of a combination of SFAs and/or TFAs. In contrast, low
melting TAGs are primarily composed of UFAs (Marangoni & Garti, 2011). While lipids are an
important component of the diet, it is recommended to limit consumption of SFAs and especially
TFAs due to their well-documented association with adverse effects on cardiovascular health
(Mensink et al., 2003; Mozaffarian, Katan, Ascherio, Stampfer, & Willett, 2006). For some time,
liquid edible oils have been hydrogenated to create solid fats, including many of the shortenings
used for lamination, however this method of production leads to the production of TFAs, the
consumption of which is more concerning than the SFAs they were created to replace
(Mozaffarian et al., 2006). In contrast, there are recognized beneficial health effects from
increasing UFA consumption (Lunn & Theobald, 2006). For this reason, the concept of replacing
SFAs and TFAs with UFAs in foods is gaining popularity. However, direct replacement of solid
fat with oils is usually not an option due to differences between their physical and sensory
properties. In the case of laminating shortenings, solid fat is instrumental, responsible for being
able to roll the fat while maintaining individual and separate layers, for the rising phenomenon,
and for mouthfeel and texture upon consumption.
While shortenings containing substantial amounts of TFAs created highly acceptable
products in terms of consumer acceptance, the push for the removal of TFAs from the diet has
created a need for alternatives. However, substitution with other solid fats, including the use of
naturally occurring highly saturated fats, such as palm, proved not to be as simple as it seemed.
Research by Simovic et al. found that using low trans, yet still highly saturated, laminating

16
margarines in the production of puff pastry was not economical, nor nutritionally beneficial
(Simovic et al., 2009). The authors found that laminating margarines containing less than 1%
TFAs could only produce high quality products when the fat content was increased to 55% by
weight. This is significant when compared to the common content of 30-40% fat by weight in
laminated dough products (Lai & Lin, 2006). Even with significantly reduced TFA content, the
overall increased fat content results in no actual health benefit.
Garcia-Macias et al. compared puff pastry made with fat blends composed of palm
fractions with high oleic sunflower oil to that made with butter (Garcia-Macias et al., 2011).
Each blend had a decreased SFA content, each with approximately 30%, compared to butter with
approximately 65% SFA. Overall, the blends had different TAG compositions, but were each
high in palmitic acid and oleic acid. Three out of four of these blends created puff pastry that was
harder or tougher than that made with butter. One blend created puff pastry that was similar to
that with butter in regards to texture, but all blends were still limited by the rise and specific
volume of the final product. In another study, Garcia-Macias et al. analyzed four low SFA fat
blends made with shea stearin, interesterified shea stearin, fully hydrogenated soybean oil and
high oleic sunflower oil. Each blend again had approximately 30% SFA, and varying TAG
compositions, but each was high in stearic acid and oleic acid. Similar to their first study, puff
pastry prepared with each of the blends was harder and/or denser than that made with butter.
Renzetti et al. looked at the use of fats with varying levels of SFA by creating blends of
palm stearin, palm oil and rapeseed oil in different ratios in the production of puff pastry
(Renzetti et al., 2016). Palm stearin is the solid fat portion of palm oil and contains entirely SFA,
while palm oil contains a mixture of SFA and UFA, and rapeseed oil is highly unsaturated. Six
blends were created and ranged from approximately 40-55% SFA. The authors noted differences
in the consistency as a result of the varying SFA content. It was suggested that fats with
intermediate SFA content had the optimum consistency and were able to perform the best in
regards to spreading and rolling during production. This optimum consistency translated into
puff pastry with optimum structure and texture. While this work did not identify a low SFA
blend for immediate use, the importance of fat consistency in regards to its performance during
baking leads to possible future experiments where consistency is modified using factors other
than SFA content.

17
2.5.1 Partial Solid Fat Replacement using Oleogels
Recently, oleogels have emerged as a novel means of employing liquid, edible oils in
solid fat applications in food systems. This concept has the potential for creating foods with
desirable physical and sensory properties, which also meet evolving regulations and health
concerns. Canola oil is one of the many oils that can be gelled and contains only 6% saturated
fatty acids, with mono- and polyunsaturated fatty acids comprising the remainder. This is one of
the lowest proportions of saturated fatty acids naturally occurring in edible oils.
Ethylcellulose (EC) is a polymer capable of structuring oils into solid gel networks,
which are potential alternatives to solid fat sources with improved fatty acid profiles. EC is a
semi-crystalline cellulose polymer derivative, consisting of a cellulose backbone with ethoxyl
substitutions at hydroxyl groups such that the substitution ratio is 2.5/2.6 (Davidovich-Pinhas,
Barbut, & Marangoni, 2015; Stortz, Zetzl, Barbut, Cattaruzza, & Marangoni, 2012). It is this
degree of substitution that causes the necessary lipophilicity at high temperatures. Commonly
used EC range from, 10, 20 or 45 cP, which is based on the average molecular weight (MW) of
polymers present, where a higher MW corresponds to a greater viscosity (Dow Cellulosics,
2005). EC is of particular interest for food applications due to being tasteless, non-caloric and
physiologically inert (Hughes, Marangoni, Wright, Rogers, & Rush, 2009; Zetzl, Marangoni, &
Barbut, 2012). Incorporation of oleogels into food systems can both improve the fatty acid
profile of the food, as well as decrease the overall fat content.
Using gelled canola oil in replacement of common solid fat sources, a significant
reduction in trans and saturated fatty acid consumption is possible, without sacrificing many of
the characteristic properties of foods. However, the need for solid fat in order to achieve the
characteristic qualities associated with laminated dough products makes it particularly
challenging to completely eliminate the saturated fatty acid content in laminating shortenings,
therefore only partial fat replacement with oleogels can be considered. Dow Global Technologies
LLC has submitted an application to patent laminating shortenings containing a proportion of EC
oleogels, which was filed in 2014 and published in 2016 with the number US20160021898 A1
(Ergun et al., 2016). In addition, a portion of the fat was replaced with an alternative lower fat
component, meaning the shortening had a lower overall fat content, in addition to the reduced
saturated fatty acid content. Different formulations were described for the applications of

18
Danishes, puff pastry and croissants. Depending on the needs of the specific laminated
application, each contained different varieties of EC, ranging from 20 to 45 cP, but each had a
degree of substitution of 2.46-2.57. Each shortening blend contained at least one traditional solid
fat component (butter, margarine or shortening) and an EC oleogel prepared with either canola
oil or sunflower oil. Additionally, flour was added, and in some cases carboxymethyl cellulose,
to increase the viscosity in order to eliminate shortening squeezing out during rolling. In some
cases, water was added to facilitate adequate expansion upon baking. The exact composition
depended on the laminated application. Danish pastries were produced containing a roll-in fat
component with 23% oleogel (12% of 45 cP EC in canola oil) and 50% butter by weight, with
the remaining portion comprised of flour. This was found to create a Danish pastry with an
acceptable flaky texture. Oleogels prepared for puff pastry contained 12% of 45 cP EC in canola
oil by weight. This oleogel was added at about 5% into the dough itself, which replaced butter
entirely. The puff pastry roll-in shortening was composed of 35% butter and 40.5% oleogel. The
remainder consisted of a solution of carboxymethyl cellulose in water, and flour. The resultant
texture was also deemed acceptable, and further testing determined that CMC could be omitted
while still obtaining a successful product. Finally, croissants were prepared using 7.1% of 45 cP
EC in sunflower oil by weight. This decrease in EC concentration reflects the softer texture of
croissant dough as compared to Danish and puff pastry doughs, and therefore the need for softer
shortenings that would not tear the dough when rolling. The roll-in contained 40.3% laminating
margarine, 52.7% oleogel, 1.7% water and 5.3% flour. This mixture allowed for a 60% reduction
in saturated fat. The resultant croissants were reported to be indistinguishable from croissants
made entirely with laminating margarine. While the published patent describes success in
creating acceptable products in each laminated application, data that proves this, such as proof of
comparable rise, firmness and texture, is not included. In addition, the lack of sensory analysis is
a limitation and would be required before widespread acceptance and large scale availability.
Other oleogelators exist, including plant waxes, which have also been investigated for
their use in laminating shortenings. These waxes are capable of gelling liquid oil at low
concentrations (as low as <1% w/w) by trapping large volumes within a three dimensional
network. Waxes are composed of a complex mixture of molecules, including esters of long-chain
carboxylic acid and long chain alcohol derived from fatty acids and fatty alcohols hydrocarbons,
free fatty acids, free fatty alcohols and other components in lesser quantities (Doan et al., 2017;
19
Vali, Ju, Kaimal, & Chern, 2005; Zulim Botega, Marangoni, Smith, & Goff, 2013). It is the
content wax esters that is generally considered responsible for the gelation behaviour of natural
waxes (Blake, Co, & Marangoni, 2014; Hwang, Kim, Singh, Winkler-Moser, & Liu, 2012; Patel,
Babaahmadi, Lesaffer, & Dewettinck, 2015). A wax dispersed in an oil will crystallize with
decreasing temperature, forming three-dimensional crystals of characteristic shape. One wax in
particular, rice bran wax, forms long fibrous crystals which likely contribute to its high gelation
efficiency, where it is capable of forming oleogels at concentrations as low as 1% (w/w) in
canola oil (Blake et al., 2014; Dassanayake, Kodali, Ueno, & Sato, 2009). Even still,
concentrations as low as 0.50 (w/w) were observed to cause gelation in soybean oil when
specific cooling rates were used (Hwang et al., 2012).
Blake and Marangoni reported using plant wax oleogelators to formulate laminating
shortenings, named by the authors as Coasun Laminate, and used the resulting substitute to
prepare croissants and Danishes (Blake & Marangoni, 2015). The laminating shortening
contained 7.5% rice bran wax, 6% monoglycerides (aphadim), 35% water, 0.3% sodium stearoyl
lactylate, 0.1% potassium sorbate, and the remainder was canola oil. Sodium stearoyl lactylate
was added as a co-surfactant for stabilization, and potassium sorbate was added as a preservative.
The formulated substitute was only used to laminate the products, and was not substituted for the
fat portion included in the dough. The authors claimed that the resultant products were visually
flaky and golden-brown in colour, resembling that of characteristic croissants and Danishes.
Based on unofficial sensory testing, the authors also reported that there was no waxy mouthfeel,
however the Coasun Laminate products were found to be denser than traditional croissants and
Danishes. Despite some textural differences, the authors were optimistic regarding the potential
of Coasun Laminate to be used as a laminating shortening replacement, however proper sensory
testing would shed more light on the consumer acceptance of these products, especially when
directly compared to traditional laminated products.
2.6 Conclusions
The crystallization properties of laminating shortenings are easy to determine using well
established techniques. The process of lamination then requires the shortenings to be layered
among a prepared wheat dough and baked at high temperatures that cause complete melting. It is
easy to assume that the properties of the fat after baking into dough are the same as they were in

20
bulk, however the melting that occurs and the presence of dough ingredients create the potential
for changes in crystallization properties once cooled. The properties after baking must therefore
be considered important, given the large quantity of fat in laminated bakery products and
consequently the impact of fat on the quality of the final product overall. In addition, there are
many types of laminating shortenings which do not all create the same quality of baked good,
and therefore may have different properties after baking. Identifying key differences in their
behaviour and correlating that to the quality of the final product could unveil what the desirable
behaviour of laminating shortenings should be.
Despite the potential for ingredient interactions, the presence of other ingredients creates an
issue when it comes to analysis, as the established methods for fat crystallization analysis do not
tend to account for the presence of non-fat material. For example, components aside from fat
have been known to produce peaks in a similar region as fat in an XRD spectrum, and
components aside from fat will cause a signal when measuring for SFC by p-NMR. The
importance of understanding any interactions between laminating shortenings and non-fat
ingredients means it is necessary to have those ingredients present during analysis. Therefore, it
must be determined if the conventional fat analysis techniques (e.g. XRD, DSC and p-NMR) can
be performed on fat contained within a baked laminated product, and what, if any, additional
steps are required to obtain usable and informative results.
21
2.7 References
Baldwin, R. R., Baldry, R. P., & Johansen, R. G. (1972). Fat Systems for Bakery Products.
Journal of American Oil Chemist Society, 49, 473–477.
Bayer, R. K., Cagiao, M. E., & Baltá Calleja, F. J. (2006). Structure development in amorphous
starch as revealed by X-ray scattering: Influence of the network structure and water content.
Journal of Applied Polymer Science, 99, 1880–1886.
Blake, A. I., Co, E. D., & Marangoni, A. G. (2014). Structure and physical properties of plant
wax crystal networks and their relationship to oil binding capacity. JAOCS, Journal of the
American Oil Chemists’ Society, 91, 885–903.
Blake, A. I., & Marangoni, A. G. (2015). Factors affecting the rheological properties of a
structured cellular solid used as a fat mimetic. Food Research International, 74, 284–293.
Bulpin, P. V., Welsh, E. J., & Morris, E. R. (1982). Physical Characterization of Amylose-Fatty
Acid Complexes in Starch Granules and in Solution. Starch‐Stärke, 34, 335–339.
Coupland, J. N. (2002). Crystallization in emulsions. Current Opinion in Colloid and Interface
Science, 7, 445–450.
Dassanayake, L. S. K., Kodali, D. R., Ueno, S., & Sato, K. (2009). Physical properties of rice
bran wax in bulk and organogels. JAOCS, Journal of the American Oil Chemists’ Society, 86,
1163–1173.
Davidovich-Pinhas, M., Barbut, S., & Marangoni, A. G. (2015). The gelation of oil using ethyl
cellulose. Carbohydrate Polymers, 117, 869–878.
Deligny, C., & Lucas, T. (2015). Effect of the number of fat layers on expansion of Danish
pastry during proving and baking. Journal of Food Engineering, 158, 113–120.
DeMan, L., DeMan, J. M., & Blackman, B. (1991). Physical and Textural Characteristics of
Some North American Shortenings. Journal of the American Oil Chemists’ Society, 68, 63–
69.
Doan, C. D., To, C. M., De Vrieze, M., Lynen, F., Danthine, S., Brown, A., Dewettinck, K.,
Patel, A. R. (2017). Chemical profiling of the major components in natural waxes to elucidate
their role in liquid oil structuring. Food Chemistry, 214, 717–725.

22
Dow Cellulosics. (2005). EthocelTM: Ethylcellulose Polymers Technical Handbook. Midland,
MI.
Eliasson, A. C., & Krog, N. (1985). Physical properties of amylose-monglyceride complexes.
Journal of Cereal Science, 3, 239–248.
Eliasson, A. C., & Wahlgren, M. (2004). Starch-Lipid Interactions and Their Relevance in Food
Products. In A. C. Eliasson (Ed.), Starch in Food: Structure, Function and Applications (pp.
441–454). Boca Raton, FL: CRC Press.
Ergun, R., Thomson, B. S., & Huebner-Keese, B. (2016). Low fat laminated dough and pastry.
United States.
Frazier, P. J., Daniels, N. W. R., & Eggitt, P. W. R. (1981). Lipid-Protein Interactions During
Dough Development. Journal of the Science of Food and Agriculture, 32, 877–897.
Gan, Z., Ellist, P. R., & Schofield, J. D. (1995). Gas cell stabilization and gas retention in wheat
bread dough. Journal of Cereal Science, 21, 215–230.
Garcia-Macias, P., Gordon, M. H., Frazier, R. A., Smith, K., & Gambelli, L. (2011).
Performance of palm-based fat blends with a low saturated fat content in puff pastry.
European Journal of Lipid Science and Technology, 113, 1474–1480.
Garcia-Macias, P., Gordon, M. H., Frazier, R. A., Smith, K., & Gambelli, L. (2012). Effect of
TAG composition on performance of low saturate shortenings in puff pastry. European
Journal of Lipid Science and Technology, 114, 741–747.
Goesaert, H., Brijs, K., Veraverbeke, W. S., Courtin, C. M., Gebruers, K., & Delcour, J. A.
(2005). Wheat flour constituents: how they impact bread quality, and how their mpact their
functionality. Trends in Food Science & Technology, 16, 12–30.
Hughes, N., Marangoni, A. G., Wright, A. J., Rogers, M. A., & Rush, J. W. E. (2009). Potential
food applications of edible oil organogels. Trends in Food Science & Technology, 20, 470–
480.
Hwang, H. S., Kim, S., Singh, M., Winkler-Moser, J. K., & Liu, S. X. (2012). Organogel
Formation of Soybean Oil with Waxes. JAOCS, Journal of the American Oil Chemists’
Society, 89, 639–647.

23
Karel, M. (1973). Protein Interactions in Biosystems: Protein-Lipid interactions. Journal of Food
Science, 38, 756–763.
Karim, A. A., Norziah, M. H., & Seow, C. C. (2000). Methods for the study of starch
retrogradation. Food Chemistry, 71, 9–36.
Karkalas, J., Ma, S., Morrison, W. R., & Pethrick, R. A. (1995). Some factors determining the
thermal properties of amylose inclusion complexes with fatty acids. Carbohydrate Research,
268, 233–247.
Krog, N., & Nybo Jensen, B. (1970). Interaction of monoglycerides in different physical states
with amylose and their anti-firming effects in bread. Journal of Food Technology, 5, 77–87.
Lai, H. M., & Lin, T. C. (2006). Bakery Products: Science and Technology. In Y. H. Hui (Ed.),
Bakery Products: Science and Technology (pp. 3–65). Ames, IA: Blackwell Publishing.
Lasztity, R., Bekes, F., Orsi, F., Smied, I., & Ember-Karpati, M. (1996). Protein-lipid and
protein-carbohydrate interactions in the gluten complex. Periodica Polytechnica: Chemical
Engineering, 40, 29–40.
Li, W., Dobraszczyk, B. J., & Wilde, P. J. (2004). Surface properties and locations of gluten
proteins and lipids revealed using confocal scanning laser microscopy in bread dough.pdf.
Journal of Cereal Science, 39, 403–411.
Liang, X., King, J. M., & Shih, F. F. (2002). Pasting property differences of commercial and
isolated rice starch with added lipids and β-cyclodextrin. Cereal Chemistry, 79, 812–818.
Lunn, J., & Theobald, H. E. (2006). The health effects of dietary unsaturated fatty acids.
Nutrition Bulletin, 31, 178–224.
Macias-Rodriguez, B. A., & Marangoni, A. A. (2016a). Physicochemical and Rheological
Characterization of Roll-in Shortenings. JAOCS, Journal of the American Oil Chemists’
Society, 93, 575–585.
Macias-Rodriguez, B. A., & Marangoni, A. A. (2016b). Rheological characterization of
triglyceride shortenings. Rheological Acta, 55, 767–779.
Macias-Rodriguez, B. A., & Marangoni, A. A. (2017). Understanding the functionality of lipid-
based materials under large-amplitude nonlinear deformations. Lipid Technology, 29, 23–27.
24
MacRitchie, F. (1977). Flour Lipids and Their Effects in Baking. Journal of the Science of Food
and Agriculture, 28, 53–58.
Marangoni, A. G., & Garti, N. (2011). Edible Oleogels: Structure and Health Implications. In A.
G. Marangoni & N. Garti (Eds.), Edible Oleogels (pp. 1–17). Urbana, IL: AOCS Press.
Marangoni, A. G., & Rousseau, D. (1998). Chemical and enzymatic modification of butterfat and
butterfat-canola oil blends. Food Research International, 31, 595–599.
Marangoni, A. G., & Wesdorp, L. H. (2013a). Crystallography and Polymorphism. In A. G.
Marangoni & L. H. Wesdorp (Eds.), Structure and Properties of Fat Crystal Networks (2nd
ed., pp. 1–24). Boca Raton, FL: CRC Press.
Marangoni, A. G., & Wesdorp, L. H. (2013b). Nucleation and Crystalline Growth Kinetics. In A.
G. Marangoni & L. H. Wesdorp (Eds.), Structure and Properties of Fat Crystal Networks (2nd
ed., pp. 27–99). Boca Raton, FL: CRC Press.
Marchetti, L., Cardós, M., Campaña, L., & Ferrero, C. (2012). Effect of glutens of different
quality on dough characteristics and breadmaking performance. LWT - Food Science and
Technology, 46, 224–231.
McCann, T. H., Small, D. M., Batey, I. L., Wrigley, C. W., & Day, L. (2009). Protein-lipid
interactions in gluten elucidated using acetic-acid fractionation. Food Chemistry, 115, 105–
112.
Mensink, R. P., Zock, P. L., Kester, A. D. M., & Katan, M. B. (2003). Effects of dietary fatty
acids and carbohydrates on the ratio of serum total to HDL cholesterol and on serum lipids
and apolipoproteins : a meta- analysis of 60. The American Journal of Clinical Nutrition, 77,
1146–1155.
Miles, M. J., Morris, V. J., Orford, P. D., & Ring, S. G. (1985). The Roles of Amylose and
Amylopectin in the Gelation and Retrogradation of Starch. Carbohydrate Research, 135, 271–
281.
Morris, V. J. (1990). Starch gelation and retrogradation. Trends in Food Science and
Technology, 1, 2–6.

25
Mozaffarian, D., Katan, M. B., Ascherio, A., Stampfer, M. J., & Willett, W. C. (2006). Trans
Fatty Acids and Cardiovascular Disease. New England Journal of Medicine, 354(15), 1601–
1613.
Narine, S. S., & Marangoni, A. G. (1999). Relating structure of fat crystal networks to
mechanical properties : a review. Food Research International, 32, 227–248.
Patel, A. R., Babaahmadi, M., Lesaffer, A., & Dewettinck, K. (2015). Rheological Profiling of
Organogels Prepared at Critical Gelling Concentrations of Natural Waxes in a Triacylglycerol
Solvent. Journal of Agricultural and Food Chemistry, 63, 4862–4869.
Pomeranz, Y., & Chung, O. K. (1978). Interaction of Lipids with Proteins and Carbohydrates in
breadmaking. Journal of the American Oil Chemists’ Society, 55, 285–289.
Putseys, J. A., Lamberts, L., & Delcour, J. A. (2010). Amylose-inclusion complexes: Formation,
identity and physico-chemical properties. Journal of Cereal Science, 51, 238–247.
Ratnayake, W. S., & Jackson, D. S. (2007). A new insight into the gelatinization process of
native starches. Carbohydrate Polymers, 67, 511–529.
Ravi, R., Manohar, R. S., & Rao, P. H. (1999). Use of Rapid Visco Analyser (RVA) for
measuring the pasting characteristics of wheat flour as influenced by additives. Journal of the
Science of Food and Agriculture, 79, 1571–1576.
Renzetti, S., de Harder, R., & Jurgens, A. (2016). Puff pastry with low saturated fat contents:
The role of fat and dough physical interactions in the development of a layered structure.
Journal of Food Engineering, 170, 24–32.
Riisom, T., Krog, N., & Eriksen, J. (1984). Amylose complexing capacities of cis- and trans-
unsaturated monoglycerides in relation to their functionality in bread. Journal of Cereal
Science, 2, 105–118.
Rogers, D. (2004). Functions of fats and oils in bakery products. Food Technology, 15, 572–574.
Roulet, P., MacInnes, W. M., Würsch, P., Sanchez, R. M., & Raemy, A. (1988). A comparative
study of the retrogradation kinetics of gelatinized wheat starch in gel and powder form using
X-rays, differential scanning calorimetry and dynamic mechanical analysis. Food
Hydrocolloids, 2, 381–396.

26
Rousset, P. (2002). Modeling Crystallization Kinetics of Triacylglycerols. In A. G. Marangoni &
S. S. Narine (Eds.), Physical Properties of Lipids (pp. 11–46). New York, NY: Marcel
Dekker.
Simovic, D. S., Pajin, B., Seres, Z., & Filipovic, N. (2009). Effect of low-trans margarine on
physicochemical and sensory properties of puff pastry. International Journal of Food Science
and Technology, 44, 1235–1244.
Siswoyo, T. A., & Morita, N. (2002). Thermal properties and kinetic paramters of amylose-
glycerophosphatidylcholine complexes with various acyl chain lengths. Food Research
International, 35, 737–744.
Stortz, T. A., Zetzl, A. K., Barbut, S., Cattaruzza, A., & Marangoni, A. G. (2012). Edible
oleogels in food products to help maximize health benefits and improve nutritional profiles.
Lipid Technology, 24, 151–154.
Tang, M. C., & Copeland, L. (2007). Analysis of complexes between lipids and wheat starch.
Carbohydrate Polymers, 67, 80–85.
Tufvesson, F., & Eliasson, A. C. (2000). Formation and crystallization of amylose-monglyceride
complexes in a starch matrix. Carbohydrate Polymers, 43, 359–365.
Vali, S. R., Ju, Y. H., Kaimal, T. N. B., & Chern, Y. T. (2005). A process for the preparation of
food-grade rice bran wax and the determination of its composition. Journal of the American
Oil Chemists’ Society, 82, 57–64.
Veraverbeke, W. S., & Delcour, J. A. (2002). Wheat protein composition and properties of wheat
glutenin in relation to breadmaking functionality. Critical Reviews in Food Science and
Nutrition, 42, 179–208.
Wang, S., Li, C., Copeland, L., Niu, Q., & Wang, S. (2015). Starch retrogradation: A
comprehensive review. Comprehensive Reviews in Food Science and Food Safety, 14, 568–
585.
Zetzl, A. K., Marangoni, A. G., & Barbut, S. (2012). Mechanical properties of ethylcellulose
oleogels and their potential for saturated fat reduction in frankfurters. Food & Function, 3,
327–37.

27
Zhang, G., & Hamaker, B. R. (2003). A Three Component Interaction among Starch, Protein,
and Free Fatty Acids Revealed by Pasting Profiles. Journal of Agricultural and Food
Chemistry, 51, 2797–2800.
Zulim Botega, D. C., Marangoni, A. G., Smith, A. K., & Goff, H. D. (2013). The potential
application of rice bran wax oleogel to replace solid fat and enhance unsaturated fat content in
ice cream. Journal of Food Science, 78, 1334–1339.

28
3.0 Part I:
Matrix effects on the crystallization behaviour of butter and roll-in shortening in
laminated bakery products
3.1 Materials and Methods
3.1.1 Materials
Butter and all non-fat ingredients were purchased at a local supermarket. Three different
shortenings were obtained from Bunge® Canada. The composition of each shortening used, as
stated by the supplier, is listed in Table 1. To maintain the fat crystal memory, the shortenings
and butter were stored at 5°C prior to measurement. Wheat starch was obtained at a local
supermarket, and pre-gelatinized wheat starch was obtained from ADM Food Ingredients.
Prepared croissants were stored at room temperature for one week. One week was the
determined shelf life as croissants became mouldy after this length of time.
Table 1: Roll-in Fat Compositions (as stated by manufacturer)
Roll-In Fat Type Composition
Unsalted Butter Butter
Hydrogenated Shortening A Hydrogenated vegetable and hydrogenated modified
palm oil
Hydrogenated Shortening B Hydrogenated soybean and cotton seed oils
Non-Hydrogenated Shortening Canola oil, modified palm oil and palm kernel oil
3.1.2 Fatty Acid (FA) Composition
Milk fat was obtained from butter by heating gently on hot plate until bubbling ceased.
Foam was skimmed off the surface and the solids were discarded, retaining only the fat portion

29
for analysis. Each of the roll-in fats were converted into fatty acid methyl esters (FAMEs) using
the protocol described by Christie (Christie, 1982). An Agilent 6890 series GC (Agilent
Technologies Inc., Wilmington DE, USE) equipped with a CP-Sil 88 capillary column (100 m x
0.25 mm x 0.20 µm), flame ionization detector (FID), split/splitless injection port and a 7683-
series auto-sampler was used for the analysis of prepared FAMEs. 1-2 µg/µL of total FAMEs
were dissolved into hexane and 1µL was then injected. Hydrogen was used as the carrier gas at a
flow rate of 1 mL/minute. The oven began at a temperature of 110°C, increasing to 230°C at a
rate of 4°C/minute and holding here for 10 minutes. The injector temperature was 240°C, and the
detector temperature was 280°C. Triplicate analysis was performed and the average reported.
Fatty acid (FA) composition was determined with the use of an internal standard. Quantification
of FAs was done by integration of the relative peak area.
3.1.3 Triacylglycerol (TAG) Compositions
Determination of TAG composition of milk fat (obtained from butter using the same
method described above) and each shortening was carried out by high performance liquid
chromatography (Agilent HPLC model 110, Agilent Tech, Palo Alto, CA), equipped with a
quaternary pump, autosampler and Hewlett-Packard Chem Station software (Version A.10).
TAGs were detected using a refractive index detector. Samples were dissolved in a 37.5:62.5
(v/v) solution of chloroform and acetone-acetonitrile (60:40 v/v). 10 µL of each sample was
injected into an Econosil column (C18, 250 x 4.6 mm) in isocratic mode at a flow rate of 1.0
mL/minute. The mobile phase was acetone-acetonitrile (60:40 v/v). Triplicate analysis was
performed and the average reported. TAGs were identified by comparison with internal
standards (Sigma Aldrich, Oakville, ON, Canada) and quantified by integration of the relative
peak area.
3.1.4 Croissant Preparation
Butter and each shortening were used to prepare different croissants using the following
steps. The formulation used is presented in Table 2. Each batch prepared 12 croissants. An
image of one of the final products is presented in Figure 1.

30
1. Add flour, water, 1% skim milk, sugar, instant yeast, salt, and a small amount of the
respective fat type to a Kitchen Aid Standmixer affixed with a dough hook attachment, and
mix together at a low speed for 4 minutes to form and knead the dough.
2. Allow the dough to rise for 90 minutes at room temperature.
3. Move the dough into a refrigerator to chill for at least 1 hour.
4. Place the dough on a floured surface and roll into a square of dimensions 25 cm x 25 cm.
5. Form the roll-in portion of the respective fat into a flat square of dimensions
16 cm x 16 cm.
6. Using the envelope method of folding, position the fat square in the center of the dough
square, placed such that the corners of the fat met the midpoint of the dough edges. Fold
the corners of the dough around the fat square to enclose.
7. Roll the fat and dough envelope into a rectangle approximately 0.5 cm thick, and fold in
thirds.
8. Repeat step 8 two more times.
9. Rest in refrigerator for at least 4 hours.
10. Roll the layered dough on a floured surface into a rectangle of dimensions 55 cm x 22 cm.
11. Cut 12 triangular shapes from the dough such that the base of each triangle is 9 cm.
12. Cut a slit at the base of each triangle and stretch the corners as the croissant is rolled into
the characteristic shape. Each croissant should weigh approximately 45-50 g before baking.
13. Let the croissants rise at room temperature for 2 hours.
14. Bake at 175°C (approx. 350°F) for 20 minutes.
15. Allow to cool at room temperature in order to simulate the uncontrolled cooling conditions
of the bakery industry.

31
Table 2: Croissant Formula
Ingredient % By Weight
White Unbleached Flour 37.54%
Water 18.39%
1% Skim Milk 9.58%
Sugar 4.49%
Instant Yeast 0.76%
Salt 0.54%
Fat/Shortening 2.14%
Roll-in Fat/Shortening 26.81%
Total fat 28.95%
Figure 1: Cross section of croissant prepared in this study (dough according to formula from
Table 2; roll-component was hydrogenated shortening A)

32
3.1.5 Baked Bulk Fats
Approximately 20 g of each fat was added to a 50 mL beaker. A Thermo Scientific
Heratherm oven set to 175°C (approx. 350°F) was used to bake the fat for 20 minutes, the same
baking conditions used for the croissants. Each sample was allowed to cool completely at room
temperature in order to simulate the uncontrolled conditions of the bakery industry. Butter was
cooled in an incubator set to 16°C, due to need for lower temperatures to induce crystallization.
3.1.6 Polymorphism
Polymorphism classification was achieved by powder X-ray diffraction (XRD) (Rigaku,
Japan). Approximately 1-2 g of roll-in fat, baked roll-in fat or crumbled croissant sample was put
onto a glass slide into the machine at room temperature (20°C). Wheat starch and pre-gelatinized
wheat starch were also prepared in the same manner on glass slides. The copper lamp was
operating at 40 kV and 44 mA, used with the following slits: divergence (0.57 mm), scatter (0.57
mm), and receiving (0.3 mm). Polymorphic forms were identified from the resulting spectra in
the wide angle region (WAXS) from 15-25° at a scan rate of 0.20°/minute. This rate was chosen
in order to balance the need for good resolution while avoiding sample cracking over time
caused by drying out within the machine. MDI’s Jade 6.5 software (Rigaku, Japan) was used to
examine the WAXS spectra, where the presence of characteristic peaks was used to identify the
presence different polymorphic forms. The relative proportion of each polymorph present was
determined through qualitative comparison of peak heights. Triplicate analysis was performed
for all samples, and new batches of croissants were prepared for each analysis.
Polymorphism changes with increasing storage time were evaluated using the same
conditions listed above at determined time points: 0h (freshly baked and cooled), 24h (after one
day of storage) and 1w (after one week of storage). Results presented are normalized values to
account for a lesser signal achieved from a croissant sample containing approximately 30% fat.
3.1.7 Thermal Behaviour
A Mettler Toledo differential scanning calorimeter (DSC) (Mettler Toledo, Mississauga,
ON, Canada) was used to determine the thermal behaviour of roll-in fats and corresponding
croissant samples. Baked croissant and fat samples were analyzed after 48 hours of storage to
33
allow for crystal stabilization. 8-10 mg of each sample was weighed into aluminum crucibles and
subjected to the conditions listed below. The peak temperatures of melting (Tm) were determined
using STARe software (Mettler Toledo). Triplicate analysis was performed for all samples, and
new batches of croissants were prepared for each analysis. Results presented are normalized to
account for a reduced signal achieved from croissant samples containing approximately 30% fat.
First, the samples were held at 5°C for 10 minutes. The samples were then heated from 5 to 80°C
at a rate of 5°C/minute. This was followed by isothermal holding at 80°C for 15 minutes. Finally,
the samples were cooled from 80 to 0°C at a rate of 5°C/minute.
3.1.8 Solid Fat Content
The SFC of each roll-in fat and their corresponding croissant sample measured at 10.0,
21.1, 26.7, 33.3 and 37.8°C according to AOCS Official Method Cd 16b-93. Glass NMR tubes
were filled with the samples. The samples were equilibrated at each temperature for 30 minutes
prior to measurement. Measurements for all samples were carried out using a Bruker PC/20
Series Minispec p-NMR Analyzer (Bruker Optics Ltd., Milton, ON). Fat free, baked croissant
dough was also analyzed using the same conditions to account for signals caused by other
ingredients in the croissant matrix. The average SFC and standard error are reported. Triplicate
analysis was performed for all samples.
3.1.9 Texture Analysis
A Model TA.XT2 texture analyzer (Stable Micro Systems, Texture Technologies Corp.,
Scarsdale, NY) affixed with a TA-42 knife blade attachment and a 30 kg load cell was used to
measure the firmness of croissants prepared with different roll-in fats. Measurements for each
croissant type were taken at the same storage time points listed previously: 0h, 24h and 1w
stored at room temperature. The average height of the croissants was 4 cm. The width of the
knife blade always exceeded that of the croissants. The knife blade operated at a test speed of 2.0
mm/s over a distance of 70 mm. Three different batches of each type of croissant were analyzed
using three sample croissants from each batch for a total of 9 replicates per point. Results will be
reported as the average maximum force required to cut each croissant as an indicator of firmness
when eating.

34
3.1.10 Statistical Analysis
GraphPad Prism 5.0 (GraphPad Software, San Diego, CA, USA) was used for statistical
analysis and normalization of data. One-way ANOVA was performed on texture analysis data
for each of the fats at every time point analyzed. The level of significance was chosen as
p < 0.05.
3.2 Results and Discussion
3.2.1 Fatty Acid Composition
The fatty acid composition of each roll-in fat is summarized in Table 3. Each fat used
contains a different blend of SFA and UFA, allowing for the desired functionality and
spreadability (Macias-Rodriguez & Marangoni, 2016). Both hydrogenated shortenings contain a
similar distribution of FAs, with hydrogenated A (vegetable and palm oil based) containing
slightly more palmitic acid, and hydrogenated B (soybean and cotton seed oil based) containing
slightly more trans oleic fatty acids. The non-hydrogenated shortening contains a notable
proportion of 12:0, 14:0 and 16:0 SFAs, reflecting its composition high in palm and palm kernel
oils. The notable difference between the non-hydrogenated shortening and the other fats is the
absence of TFA. The TFA content in both hydrogenated shortenings is significant (Table 3), and
still, the method of analysis used was only able to distinguish the trans 18:1 fatty acids. Given
that these shortenings are blended combinations of hydrogenated and non-hydrogenated
components, it is reasonable to assume that a proportion of the linoleic acid, as well as the
“other” unidentified fatty acids, could also be trans fatty acids. Additionally, the nutrition facts
provided by the manufacturer indicate a TFA content of 25-30% for these shortenings, which is
well above recommendations to limit of TFA intake as much as possible (<1%) described by the
USDA, the American Heart Association and Health Canada (American Heart Association, 2015;
Health Canada, 2010; USDA, 2010). Butter contains the greatest diversity of FAs, including
characteristic short chain SFA from 4:0-10:0.

35
Table 3: FA Composition as determined by GC
FA (%) Hydrogenated A Hydrogenated B Non-Hydrogenated Butter
4:0 1.4±0.2
6:0 1.6±0.1
8:0 1.2±0.04
10:0 2.9±0.06
12:0 4.6±0.3 3.7±0.06
14:0 2.3±0.2 12.3±0.1
14:1 1.1±0.01
15:0 1.2±0.004
16:0 19.7±1.1 13.3±0.03 29.9±0.1 34.5±0.2
16:1 2.0±0.03
17:0 0.5±0.003
18:0 12.0±1.4 16.0±0.6 3.3±0.07 10.3±0.1
18:1 (c9) 31.0±4.1 26.4±1.1 39.4±0.9 20.6±0.001
18:1 (t9) 13.0±1.0 16.6±0.07 0.4±0.1
18:2 11.7±1.2 11.1±0.01 12.9±0.4 1.8±0.01
18:3 (3) 0.6±0.2 0.8±0.3 5.2±0.8 0.5±0.004
Other 3.5±0.4 12.4±0.03 3.2±0.01 4.0±0.02
SFA 31.7 29.3 40.1 69.6
TFA 13.0 16.6 0.0 0.4
3.2.2 Triacylglycerol Composition
The TAG composition of each fat used is summarized in Table 4. The TAG composition
of a fat is related to their lipid source and processing. While determining the presence of
different isomeric FAs in TAGs (i.e. cis vs. trans) for the hydrogenated shortenings is difficult, it
is conceivable that any oleic acid component in the TAG composition could also be elaidic acid
in a random distribution. Both hydrogenated shortenings have generally similar TAG

36
composition, primarily composed of OOLe, POLe, OOO, SOO and PSS. The non-hydrogenated
shortening contained many TAGs characteristic of palm oil, including POO, POP and PPP, in
addition to considerable proportions of OOLn, OLeLe, OOLe and OOO. Milk fat contained the
largest variety of TAG species, including several short-chain species, making it difficult to
compare to the manufactured shortenings. Based on the distinct differences in TAG, as well as
FA composition between butter and the shortenings, it is expected that butter croissants will
possess properties dissimilar from shortening containing croissants.
Table 4: TAG composition as determined by HPLC
TAG (%) Hydrogenated A Hydrogenated B Non-Hydrogenated Butter
LaOBu 3.2±0.04
MMBu + PLaBu 0.6±0.001 0.5±0.07 2.8±0.3
BuOM + MMCp
+ PLaBu 3.0±0.2
LLL 0.9±0.06
PMBu 3.5±0.01
BuOO 1.3±0.1
MOCp 2.9±0.1
PMCp + POBu 5.2±0.3
PPBu + SMBu 4.7±0.2
LnLnLn 0.6±0.01 0.7±0.2 2.6±0.3
LeLeLe 2.8±0.1 2.9±0.3
OOLn 8.0±0.6
OLeLe 6.2±0.1 5.2±0.2 14.0±0.6
PLeLe 3.1±0.06 3.1±0.3
MLeP 1.8±0.4
OOLe 14.2±0.4 11.7±0.5 18.0±1.8 1.2±0.1
POLe 7.3±0.5 7.4±0.3 3.5±0.4 1.8±0.3
PLeP 1.8±0.3
PPLe 2.9±0.01

37
Table 4 Continued:
TAG (%) Hydrogenated A Hydrogenated B Non-Hydrogenated Butter
POM 1.2±0.3 2.9±0.02
PPM 3.7±0.2 1.6±0.1
OOO 24.8±0.08 26.2±0.7 16.0±1.0 2.6±0.08
POO 14.0±0.7 17.1±0.06 5.0±0.6 4.0±0.09
POP 6.8±0.5
PPO 2.7±0.1
PPP 5.1±0.1 0.9±0.2 9.8±0.3 1.8±0.2
SOO 5.5±0.9 8.4±0.1 1.4±0.5 3.6±0.08
POS 2.0±0.3 3.2±0.09 1.2±0.4 4.4±0.2
PPS 6.8±0.06 2.4±0.2 1.7±0.08 2.1±0.2
SOS 0.8±0.5 2.2±0.02
PSS 4.3±0.2 4.9±0.3 1.2±0.01
SSS 3.9±0.06 0.4±0.0
Bu – Butyric acid, Cp – Caprylic acid, La – Lauric acid, Le – Linoleic acid, Ln – Linolenic
acid, O – Oleic acid, P – Palmitic acid, M – Myristic acid, S – Stearic acid
3.2.3 Polymorphism
Three principal polymorphic forms can exist in fats: α, β' and β, where α crystals are the
least stable and β are the most. Most roll-in shortenings are manufactured to contain β'
polymorphs, but conversion to the most stable crystal form can occur when conditions are
favourable. Characteristic Bragg’s peaks in the spectra corresponding to d-spacing values of 4.2
Å, 4.3 Å and 3.8 Å, indicate the presence of β' polymorphs for all roll-in fats (Fig 2) (Marangoni
& Wesdorp, 2013). Only in the case of the non-hydrogenated shortening is there a small peak
appearing at 4.6 Å, indicative of β polymorphs. Based on relative peak sizes, the non-
hydrogenated shortening contains an approximately equal proportion of β' and β polymorphs.
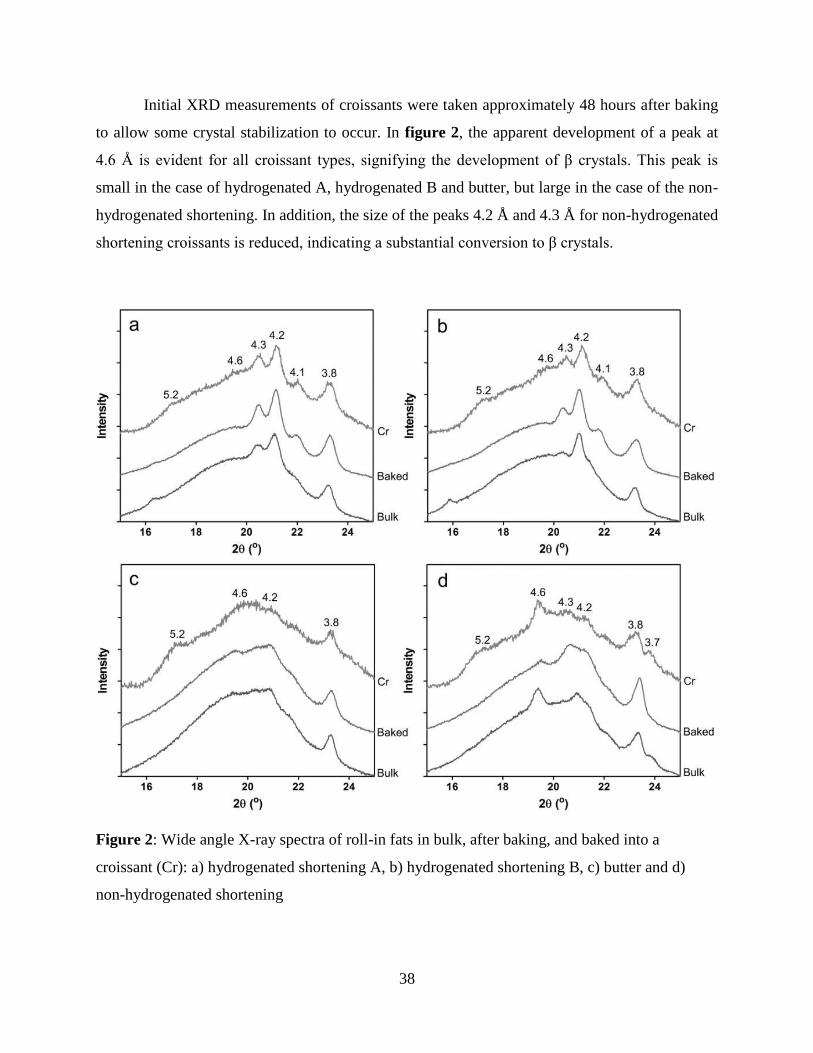
38
Initial XRD measurements of croissants were taken approximately 48 hours after baking
to allow some crystal stabilization to occur. In figure 2, the apparent development of a peak at
4.6 Å is evident for all croissant types, signifying the development of β crystals. This peak is
small in the case of hydrogenated A, hydrogenated B and butter, but large in the case of the non-
hydrogenated shortening. In addition, the size of the peaks 4.2 Å and 4.3 Å for non-hydrogenated
shortening croissants is reduced, indicating a substantial conversion to β crystals.
Figure 2: Wide angle X-ray spectra of roll-in fats in bulk, after baking, and baked into a
croissant (Cr): a) hydrogenated shortening A, b) hydrogenated shortening B, c) butter and d)
non-hydrogenated shortening

39
When each fat was baked using the same conditions as for the croissants, the XRD
spectra contained peaks of roughly the same size and position as compared to the same fats
before the baking treatment (Fig. 2). Values presented in Table 5 are the calculated ratios of the
area of peaks corresponding to β polymorphs to the area of peaks corresponding to β'
polymorphs. Values closer to 0 denote content of primarily β' polymorphs and values closer to
1.0 denote content of primarily β polymorphs. From these values, it is clear that baked fats do not
experience significant polymorphic conversion over one week of storage, with the exception of
the non-hydrogenated shortening, which shifts to a greater proportion of β polymorphs over time.
Croissants are consumed from the point they are baked and cooled, until the end of their
one week shelf life, making the properties of a fat throughout this time relevant. With increasing
storage time, the position and size of the peaks present in the XRD spectra for each of the bulk
baked fats is largely unchanging, indicating polymorphic stability over one week of storage (fig.
3). However, the corresponding XRD spectra for croissant samples at the same time points
indicate that this stability is lost in the presence of a croissant matrix (fig 4). Each of the four fats
initially form predominantly β' polymorphs, an occurrence that is similar to that of the same fats
when baked in bulk, but polymorphic conversion becomes distinct after 24 hours of storage time
has passed. Croissants prepared with either of the hydrogenated shortenings show only minor
conversion from β' to β polymorphs, with the appearance of a small peak corresponding to a d-
spacing of 4.6 Å becoming more distinct over one week of storage. This is not so much an
increase in height or peak area, reflected in the unchanging values from Table 5, but by visual
inspection of the spectra, this peak does become noticeable with increasing storage. Butter
croissants experience moderate conversion from β' to β polymorphs, but it is the non-
hydrogenated shortening that experiences the most notable polymorphic conversion, evident by
the significant peak growing in height at 4.6 Å and near loss of the peak at 4.2 Å over storage,
and the notable increase in values in Table 5. Additionally, the appearance of a peak at 3.7 Å
separate from that at 3.8 Å indicates that β polymorphs are predominating (Marangoni &
Wesdorp, 2013).

40
Figure 3: Wide angle X-ray spectra of baked roll-in fats over one week of storage: a)
hydrogenated shortening A, b) hydrogenated shortening B, c) butter and d) non-hydrogenated
shortening

41
Figure 4: Wide angle X-ray spectra of croissants over one week of storage prepared from a)
hydrogenated shortening A, b) hydrogenated shortening B, c) butter and d) non-hydrogenated
shortening

42
Table 5: Ratios of β to β' peak areas1
with increasing storage time for baked fats and croissants
Type
Baked Fats Croissants
0h 24h 1 week 0h 24h 1 week
Hyd A 0.25 ± 0.01 0.24 ± 0.004 0.24 ± 0.001 0.30 ± 0.03 0.30 ± 0.01 0.31 ± 0.01
Hyd B 0.29 ± 0.005 0.28 ± 0.01 0.28 ± 0.005 0.31 ± 0.003 0.32 ± 0.001 0.32 ± 0.008
Non-Hyd 0.35 ± 0.01 0.33 ± 0.02 0.39 ± 0.01 0.34 ± 0.005 0.42 ± 0.05 0.66 ± 0.05
Butter 0.42 ± 0.03 0.40 ± 0.02 0.40 ± 0.01 0.37 ± 0.007 0.38 ± 0.04 0.41 ± 0.01
1 β' considered peaks: 4.3, 4.2, 3.8; considered β peaks: 4.6, 3.7
The differences seen between fats simply melted at high temperatures versus the same
fats baked into a croissant matrix indicate that there is a component within the croissant matrix
which influences formation of at least a small proportion of β polymorphs after 24 hours of
storage. This matrix interaction seems to have a greater effect on the polymorphism of the non-
hydrogenated shortening when compared to the hydrogenated fats and butter. This could be due
to the presence of different TAGs in each roll-in fat source, as certain TAGs may form β
polymorphs more readily within the croissant matrix. It is also possible that certain TAGs
interact more with the croissant matrix, resulting in the formation of stable β polymorphs. The
opposite may also be true, where the lack of one, or a combination of specific TAGs could be the
cause of polymorphic instability.
A peak corresponding to a d-spacing value of 5.2 Å becomes notable in the spectra for
each croissant type after at least 24 hours of storage, and more prominent after one week.
Initially, it was assumed that this resulted from the conversion to β crystals over time due to
established associations with this peak and this polymorphic form (Marangoni & Wesdorp,
2013). However, after one week of storage a peak at 5.8 Å also begins to appear. Together, peaks
at 5.2 Å and 5.8 Å are also two of the characteristic peaks of crystalline wheat starch (fig 5a).
Wheat starch is gelatinized during baking due to the moisture in the croissant dough, causing it
to lose its crystallinity and no longer produce any peaks in an XRD spectrum (fig 5b). However,
starch retrogradation occurs over storage, when amylose and amylopectin chains will precipitate
from their gelled state and recrystallize into ordered structures. For this reason, the phenomenon

43
of retrogradation has also been described as the return of starch components to their granular or
crystalline state, and causes a weak pattern to again appear in the XRD spectra (Bayer, Cagiao,
& Baltá Calleja, 2006; Miles, Morris, Orford, & Ring, 1985; Morris, 1990; Roulet, MacInnes,
Würsch, Sanchez, & Raemy, 1988). Therefore, it is assumed that the starch retrogradation
increasing with time is responsible for the appearance and growth of these peaks at 5.2 Å and 5.8
Å, in addition to one at 3.8 Å which would overlap with the same peak produced by β and β'
polymorphs. Interestingly, the occurrence of starch retrogradation coincides with the formation
of β polymorphs over storage time. It is therefore possible that the polymorphic conversion is
caused, at least in part, by the presence of retrograded starch. Determining whether this is a
direct relationship or simply a coincidence is an objective for future work.
Figure 5: Wide angle X-ray spectra of a) crystalline wheat starch (obtained in isolated form at a
local supermarket) and b) gelatinized wheat starch
3.2.4 Thermal Behaviour
Melting behaviour was determined for all samples. The presence of different
polymorphic forms, each with their own melting point, appears as multiple peaks in the obtained
DSC endotherm curve. For each fat type, it is evident that the melting temperature (Tm), or the
temperature at which the maximum of each peak occurs, is not changing with the presence of the

44
croissant matrix (fig. 6). However, the peaks broaden, such that a higher temperature is required
to completely melt the fat. In the case of butter and the non-hydrogenated shortening (fig. 6 c &
d), there is an observed fractionation occurring that causes two or more smaller peaks take the
place of a former larger peak. Here, the slow cooling of the fats causes higher and lower melting
fractions to fractionate, resulting in two distinct melting points when heated. Since this occurs
upon baking regardless of the croissant matrix, it is only the broadening of the peaks that can be
considered a result of any existing matrix interactions. The broadening peaks suggest that the
TAG crystals present within the croissant are more heterogeneous, existing in many different
sizes. Returning to the hypothesis that certain TAGs interact with the matrix more than others, it
is possible that the extent of interaction causes the TAGs to crystallize in a different manner,
perhaps manifested as rapid crystallization upon cooling, encouraging the formation of β
polymorphs and the promotion of heterogeneous mixture of crystal sizes and forms.

45
Figure 6: DSC melting endotherms of fats in bulk, after baking and within a croissant (Cr): a)
hydrogenated shortening A, b) hydrogenated shortening B, c) butter and d) non-hydrogenated
shortenings
3.2.5 Solid Fat Content
The SFC of each fat decreased with increasing temperature, as expected, where butter
showed the most drastic variance in SFC over the temperatures analyzed, having the largest
value at 10°C and falling to almost 0% solids at 37.8°C (fig. 7a). The signal from fat free baked
dough at each temperature was subtracted from that obtained for each croissant sample to
account for the signal caused by the non-fat ingredients of a croissant. The results showed that
the SFC contained within a croissant matrix is significantly less than a bulk fat (fig. 7b). The

46
suspected interaction is likely causing some of the TAGs normally solid at the respective
temperatures to not crystallize. Interestingly, the non-hydrogenated shortening has the greatest
SFC at 21.1°C, the closest temperature to that which consumption and storage would normally
occur. While the difference is not considered significant (p<0.05) as compared to the other
shortenings used, the large variation in the results makes firm conclusions difficult. This
variation resulted from the uneven distribution of fat throughout the croissants, where it was
impossible to ensure the same amount of fat to other croissant components in each sample. Even
still, the SFC values obtained for each of the bulk fats showed the opposite trend, where the non-
hydrogenated shortening had the lowest SFC as compared to the other shortenings (excluding
butter). Again, these results point towards this hypothesized interaction occurring to a different
extent for the non-hydrogenated shortening compared with any other type of roll-in fat. The
greater SFC combined with the increased content of β polymorphs in the non-hydrogenated
shortening contained within the croissant matrix could account for some of the reduced
acceptance of these products, potentially causing a waxy mouthfeel when compared to croissants
prepared with other fats.
Figure 7: SFC curves as a function of temperature for: a) roll-in fats and b) croissants

47
3.2.6 Texture Analysis
Texture analysis allows for determination of the maximum force required to cut each
sample, used as an indication of firmness and potential sensorial consequences of using different
roll in fats. The maximum force during cutting occurred at the time just before the bulk of the
croissant yielded to the knife attachment and two separate pieces were formed. As the knife
attachment began pressing down on the croissant, the crumb structure first compressed, such that
the maximum force required to cut the croissant was measured for the compact structure.
However, this compression also occurs when one bites into a croissant, therefore this analysis
can be used as an indicator for the results that could be attained if sensory analysis were to be
performed. The croissants began with crisp edges and softened over time, however, the force
required to penetrate the crust was never greater than that to completely cut the croissants in half.
A one-way ANOVA (p < 0.05) was performed to determine significant differences between the
all croissant types at each time point (fig. 8).
Figure 8: Maximum force required to cut croissants comparing croissants prepared with the
different roll-in fats at different storage times. Bars with the same letter are not statistically
different (p < 0.05).

48
Of the four fats used, only the non-hydrogenated shortening showed a significant change
in firmness over one week of storage. After 24 hours, the firmness increased greatly, however it
decreased once again after one week to a level which was not significantly different than when it
was fresh. Only when fresh were these croissants comparable in firmness to the hydrogenated
shortening or butter croissants. It is therefore conceivable to think that croissants prepared with
non-hydrogenated shortening have only a 24 hour window for consumption before the matrix
interactions cause quality deterioration.
Comparison also revealed differences in firmness between croissant types only appear
after 24 hours, when croissants prepared with any shortening increased in firmness (to a point not
significantly different from each other), while the croissants made with butter experienced a
decrease in firmness. After one week, the butter croissants remained the softest. Essentially,
croissants prepared shortenings with a greater SFC experienced an increase in firmness, while
those prepared with butter, which has the lowest SFC, decreased in firmness. This result
contradicts previous findings that detailed a reduced firming rate in bread over storage when
using a shortening with a greater SFC (Rogers, Zeleznak, Lai, & Hoseney, 1988; Smith &
Johansson, 2004). It is possible that because bread contains significantly less fat than croissants
(% w/w), the effects noticed in these studies are simply caused by the moisture barrier created by
the presence of solid fat, reducing migration as compared to a fat free dough. Since croissants
contain a significantly greater amount of fat, the impact on texture caused by the properties of
the fats themselves, or the results of matrix interactions occurring, overshadows the effects of
firming by moisture migration.
3.3 Conclusions
In this part, two hydrogenated roll-in shortenings, one non-hydrogenated roll-in
shortening and butter were used to prepared croissants. The fat crystallization properties of each
fat in bulk, each fat after a baking treatment, and each fat within the matrix of croissants were
compared. In each case, only the fat contained within a croissant began to convert from β' to β
polymorphs over one week of storage, however conversion was only significant in croissants
prepared with non-hydrogenated shortening. Peak broadening occurred in the melting
endotherms for each type of fat within the croissant matrix, indicating crystal heterogeneity. A
significantly decreased SFC for each type of croissant was observed as compared to that of the
49
same fat in bulk. Finally, variations in firmness over one week of storage indicated that
croissants prepared with shortening increased in firmness over time, with greatest increase seen
in croissants prepared with non-hydrogenated shortening. Given the results, it is likely that there
is an interaction occurring between the roll-in fats and the croissant matrix that is causing
observed differences. The results suggest that the extent of this interaction may be determined by
the presence, or lack of, particular TAGs. The conclusion that shortenings will behave differently
within a croissant matrix is significant considering the dependence of consumer acceptance on
the type of shortening used. However, sensory analysis is required to determine conclusive
relationships regarding consumer acceptability and the crystallization behaviour of the
shortenings or butter.
When considering the components of the croissant matrix, the ingredient with the greatest
potential for interaction is wheat flour, as it is the only ingredient present at a high enough
concentration. However, the components that make up flour, protein and starch, must be
considered separately. Interactions between lipids and proteins, as well as lipids and starch have
been well documented, yet the noted interactions have only been observed when isolated in fat
alone, not within an entire ready-to-eat matrix. Therefore more research is required to determine
which components are interacting, and what type of interaction is occurring.

50
3.4 References
Acevedo, N. C., & Marangoni, A. G. (2014). Engineering the Functionality of Blends of Fully
Hydrogenated and Non-Hydrogenated Soybean Oil by Addition of Emulsifiers. Food
Biophysics, 9, 368–379.
American Heart Association. (2015). Trans Fat. Retrieved February 6, 2017, from
http://www.heart.org/HEARTORG/HealthyLiving/HealthyEating/Nutrition/Trans-
Fats_UCM_301120_Article.jsp#.WKcgQDsrI2w.
Baldwin, R. R., Baldry, R. P., & Johansen, R. G. (1972). Fat Systems for Bakery Products.
Journal of American Oil Chemist Society, 49, 473–477.
Bayer, R. K., Cagiao, M. E., & Baltá Calleja, F. J. (2006). Structure development in amorphous
starch as revealed by X-ray scattering: Influence of the network structure and water content.
Journal of Applied Polymer Science, 99, 1880–1886.
Blake, A. I., & Marangoni, A. G. (2015). Factors affecting the rheological properties of a
structured cellular solid used as a fat mimetic. Food Research International, 74, 284–293.
Chiming Tang, M., & Copeland, L. (2007). Analysis of complexes between lipids and wheat
starch. Carbohydrate Polymers, 67, 80–85.
Christie, W. W. (1982). A simple procedure for rapid transmethylation of glycerolipids and
cholesterol esters. Journal of Lipid Research, 7, 1072–1075.
DeMan, L., DeMan, J. M., & Blackman, B. (1991). Physical and Textural Characteristics of
Some North American Shortenings. Journal of the American Oil Chemists’ Society, 68, 63–
69.
Eliasson, A. (1994). Interactions between starch and lipids studied by DSC. Thermochimica
Acta, 246, 343–356.
Garcia-Macias, P., Gordon, M. H., Frazier, R. A., Smith, K., & Gambelli, L. (2011).
Performance of palm-based fat blends with a low saturated fat content in puff pastry.
European Journal of Lipid Science and Technology, 113, 1474–1480.
Gibon, V., & Kellens, M. (2014). Latest Developments in Chemical and Enzymatic
Interesterification for Commodity Oils and Specialy Fats. In D. R. Kodali (Ed.), Trans Fat:
Replacement Solutions (pp. 153–186). Urbana, IL: AOCS Press.
Health Canada. (2010). Dietary Refernce Intake Tables. Retrieved February 7, 2017, from
http://www.hc-sc.gc.ca/fn-an/nutrition/reference/table/index-eng.php/.

51
Hu, F. B., Manson, J. E., & Willett, W. C. (2001). Types of Dietary Fat and Risk of Coronary
Heart Disease: A Critical Review. Journal of the American College of Nutrition, 20, 5–19.
Karel, M. (1973). Protein Interactions in Biosystems: Protein-Lipid interactions. Journal of Food
Science, 38, 756–763.
Keys, A., Anderson, J., & Grande, F. (1965). Serum cholesterol response to changes in the diet:
IV. Particular saturated fatty acids in the diet. Metabolism, 14, 776–787.
Lai, H. M., & Lin, T. C. (2006). Bakery Products: Science and Technology. In Y. H. Hui (Ed.),
Bakery Products: Science and Technology (pp. 3–65). Ames, IA: Blackwell Publishing.
Lichtenstein, A. H. (2014). Dietary Trans Fatty Acids and Cardiovascular Disease Risk: Past and
Present. Current Atherosclerosis Reports, 16, 1–7.
Lunn, J., & Theobald, H. E. (2006). The health effects of dietary unsaturated fatty acids.
Nutrition Bulletin, 31, 178–224.
Macias-Rodriguez, B., & Marangoni, A. G. (2016). Physicochemical and Rheological
Characterization of Roll-in Shortenings. JAOCS, Journal of the American Oil Chemists’
Society, 93, 575-585.
Marangoni, A. G., & Rousseau, D. (1998). Chemical and enzymatic modification of butterfat and
butterfat-canola oil blends. Food Research International, 31, 595–599.
Marangoni, A. G., & Wesdorp, L. H. (2013). Crystallography and Polymorphism. In Structure
and Properties of Fat Crystal Networks (pp. 1–24).
McNeill, G. P. (2014). Processing Solutinos: Fractionation and Blended Oils. In D. R. Kodali
(Ed.), Trans Fat: Replacement Solutions (pp. 123–138). Urbana, IL: AOCS Press.
Mensink, R. P., & Katan, M. B. (1992). Effect of Dietary Fatty Acids on Serum Lipids and
Lipoproteins. A meta-analysis of 27 trials. Arteriosclerosis, Thrombosis, and Vascular
Biology 12, 911-919.
Mensink, R. P., Zock, P. L., Kester, A. D. M., & Katan, M. B. (2003). Effects of dietary fatty
acids and carbohydrates on the ratio of serum total to HDL cholesterol and on serum lipids
and apolipoproteins : a meta- analysis of 60. The American Journal of Clinical Nutrition,
77, 1146–1155.
Miles, M. J., Morris, V. J., Orford, P. D., & Ring, S. G. (1985). The Roles of Amylose and
Amylopectin in the Gelation and Retrogradation of Starch. Carbohydrate Research, 135,
271–281.

52
Morris, V. J. (1990). Starch gelation and retrogradation. Trends in Food Science and
Technology, 1, 2–6.
Pareyt, B., Finnie, S. M., Putseys, J. A., & Delcour, J. A. (2011). Lipids in breadmaking: Sources
interactions and impact on bread quality. Journal of Cereal Science, 54, 266–279.
Rogers, D. E., Zeleznak, K. J., Lai, C. S., & Hoseney, R. C. (1988). Effect of Native Lipids,
Shortening, and Bread Moisture on Bread Firming. Cereal Chemistry, 65, 398-401.
Roulet, P., MacInnes, W. M., Würsch, P., Sanchez, R. M., & Raemy, A. (1988). *A comparative
study of the retrogradation kinetics of gelatinized wheat starch in gel and powder form using
X-rays, differential scanning calorimetry and dynamic mechanical analysis. Food
Hydrocolloids, 2, 381–396.
Smith, P., & Johansson, J. (2004). Influences of the Proportion of Solid Fat in a Shortening on
Loaf Volume and Staling of Bread. Journal of Food Processing and Preservation, 28, 359–
367.
Thompson, A. K., Minihane, A.-M., & Williams, C. M. (2011). Trans fatty acids, insulin
resistance and diabetes. European Journal of Clinical Nutrition, 65, 553–564.
USDA. (2010). Dietary Guidelines for Americans. Retrieved February 7, 2017, from
https://health.gov/dietaryguidelines/2015/guidelines/.
Wang, F. C., Gravelle, A. J., Blake, A. I., & Marangoni, A. G. (2016). Novel trans fat
replacement strategies. Current Opinion in Food Science, 7, 27–34.
53
4.0 Part II:
Gelatinized Wheat Starch Influences Crystallization Behaviour and Structure of
Roll-in Shortenings in Laminated Bakery Products
4.1 Materials and Methods
4.1.1 Materials
Non-fat ingredients were purchased at a local supermarket. Two different shortenings
were obtained from Bunge® Canada, one hydrogenated shortening (hydrogenated vegetable and
hydrogenated modified palm oil) and one non-hydrogenated shortening (canola oil, modified
palm oil and palm kernel oil). To maintain the fat crystal memory, the shortenings were stored at
5°C prior to measurement. Prepared croissants were stored at room temperature for one week.
One week was the determined shelf life as croissants became mouldy after this length of time.
4.1.2 Croissant Preparation
Each shortening was used to prepare different croissants. The formulation used and the
preparation steps are detailed in section 3.1.4.
4.1.3 Baked Isolated Component Mixtures
Mixtures of each shortening with either gluten or wheat starch were prepared and baked
in 50 mL beakers. Samples were also prepared where the gluten or wheat starch was first
hydrated through direct addition of water. All samples contained components at the same ratio as
what exists within a croissant (Table 6). Samples will be referred to as H (hydrogenated
shortening) or NH (non-hydrogenated shortening), with added matrix components +St
(crystalline wheat starch), +GSt (gelatinized wheat starch), +G (gluten), or +GN (gluten
network). Each mixture was approximately 50g in total. A Thermo Scientific Heratherm oven set
to 175°C (approx. 350°F) was used to bake the mixtures for 20 minutes, the same baking
conditions used for croissants. Each sample was allowed to cool completely at room temperature.

54
Table 6: Isolated component mixture compositions
Sample Shortening Starch Gluten Water
Shortening + St 52% 48% - -
Shortening + GSt 39% 36% - 25%
Shortening + G 86% - 14% -
Shortening + GN 56% - 9% 35%
4.1.4 Polymorphism
Polymorphism was determined using powder X-ray diffraction (XRD) (Rigaku, Japan).
Approximately 1-2 g of each sample was put onto a glass slide into the machine at room
temperature. The copper lamp was operating at 40 kV and 44 mA, used with the following slits:
divergence (0.57 mm), scatter (0.57 mm), and receiving (0.3 mm). Polymorphic forms were
identified from the resulting spectra in the wide angle region (WAXS) from 15-25° at a scan rate
of 0.20°/min. The same rate used previously for croissant samples was chosen, in order for direct
comparison of intensity. MDI’s Jade 6.5 software (Rigaku, Japan) was used to examine the
WAXS spectra, where the presence of characteristic peaks was used to identify the presence
different polymorphic forms. The relative proportion of each polymorph present was determined
through qualitative comparison of peak heights. Polymorphism changes with increasing storage
time were evaluated using the same conditions listed above at determined time points: 0h
(freshly baked and cooled), 24h (after one day of storage) and 1w (after one week of storage).
Triplicate analysis was performed for all samples. Results presented are normalized values to
account variation in the signal achieved from samples containing different amounts of fat.
4.1.5 Solid Fat Content
The SFC of each roll-in fat and their corresponding croissant sample measured at 10.0,
21.1, 26.7, 33.3 and 37.8°C according to AOCS Official Method Cd 16b-93. Glass NMR tubes
were filled with the samples. The samples were equilibrated at each temperature for 30 min prior
to measurement. Measurements for all samples were carried out using a Bruker PC/20 Series
Minispec p-NMR Analyzer (Bruker Optics Ltd., Milton, ON). Values achieved at 60°C

55
(determined to be above the melting temperature of both fats) were subtracted from all values to
account for signals caused by non-fat ingredients. The average SFC and standard error are
reported.
4.1.6 Rate of Crystallization
Again, the Bruker PC/20 Series Minispec p-NMR Analyzer (Bruker Optics Ltd., Milton,
ON) was used. Samples in NMR tubes were first allowed to equilibrate to 60°C in a water bath.
After initial measurements were taken at 60°C, samples were then moved to a water bath set to
10°C. Measurements were taken at predetermined time intervals up to 1 hour after cooling
began, returning the samples to the 10°C water bath after each measurement. The obtained data
was fitted using the Avrami model. Using this model is common to quantify the fat
crystallization kinetics (Marangoni, 1998; Sharples, 1996; Wright, Hartel, Narine, & Marangoni,
2000). The equation is in the form:
where k is the Avrami constant that represents the crystallization rate constant, and n is the
Avrami exponent, or index of crystallization. The constant k takes into account both nucleation
and crystal growth, where a large value indicates a faster crystallization rate and vice versa. The
exponent n describes the crystal growth mechanism, including the time dependence of nucleation
and the dimensions in which crystal growth occurs.
4.1.7 Thermal Behaviour
A Mettler Toledo differential scanning calorimeter (DSC) (Mettler Toledo, Mississauga,
ON, Canada) was used to determine the thermal behaviour all samples. Baked samples were
analyzed after 48 hours of storage to allow for crystal stabilization. 8-10 mg of each sample was
weighed into aluminum crucibles and subjected to the following conditions: held at 5°C for 15
minutes, heated from 5 to 80°C at a rate of 5°C/minute, held at 80°C for 15 minutes, cooled from
80 to 0°C at a rate of 5°C/minute. The peak temperatures of melting (Tm¬) were determined
using STARe software (Mettler Toledo). Results presented are normalized to account for lesser
signals achieved samples containing different amounts of fat. Subsequent tests were run on

56
samples containing shortening +GSt to identify if amylose-lipid complexes had formed in the
system. For these tests, conditions used were the same as described previously except that the
maximum temperature was 115°C, as this is above the melting temperature previously
documented for these complexes.
4.1.8 Statistical Analysis
GraphPad Prism 5.0 (GraphPad Software, San Diego, CA, USA) was used for statistical
analysis and normalization of data. One-way ANOVA was performed on the Avrami coefficient
data for each sample type. The level of significance was chosen as p < 0.05.
4.2 Results and Discussion
4.2.1 Polymorphism
There are three principal polymorphic forms that can exist in fats, α, β' and β, in order of
increasing stability, and are identified using characteristic Bragg’s peaks in the XRD spectra.
Peaks corresponding to d-spacing values at 4.3 Å, 4.2 Å and 3.8 Å, indicate the presence of β'
polymorphs, while peaks corresponding to d-spacing values of 5.2 Å and 4.6 Å indicate the
presence of β polymorphs (Marangoni & Wesdorp, 2013a). In our previous investigation, β'
polymorphs were most prevalent in each roll-in shortening examined. However, conversion to
the most stable crystal form (β) occurred to different extents when shortenings were baked into a
croissant matrix and stored for one week. In order to identify the cause of this conversion,
shortenings were baked with isolated matrix components. In Figure 9, it can be seen that after 24
hours of storage, the only samples which experienced polymorphic conversion were the
croissants and the gelatinized wheat starch (+GSt) samples. For both, the non-hydrogenated
(NH) shortening experienced much more notable conversion compared to the hydrogenated (H)
shortening, evident by the drastic difference in relative peak height at 4.6 Å. When crystalline
wheat starch (+St) is present, its previously identified characteristic peaks at 4.9 Å, 5.2 Å and 5.8
Å appear, proving that gelatinization does not occur when water is not added (Mattice &
Marangoni, 2017). Neither the gluten (+G) nor the gluten network (+GN) samples experienced
any polymorphic conversion for either shortening. Since our previous investigation showed that
storage time is a factor for polymorphic conversion within croissants, this was again considered

57
for samples containing gelatinized wheat starch. Based on when the peak at 4.6 Å appears over
storage time, Figure 10 a&b show that polymorphic conversion takes place only after 24 hours
of storage for the non-hydrogenated shortening, but only after one week of storage for the
hydrogenated shortening. Further, after one week of storage, NH+GSt had almost completely
converted to the β form, evident by the near loss of peaks at 4.3 Å and 4.2 Å, and the appearance
of a separate peak at 3.7 Å, also associated with β polymorphs. In comparison, the H+GSt
samples only experienced very minor conversion (Marangoni & Wesdorp, 2013a). To complete
the comparison, +St samples were also analyzed over one week of storage, shown in Figure 10
c&d. Here, it is apparent that there is no polymorphic conversion occurring in H+St samples, but
growth of the peak at 4.6 Å does indicate conversion to some degree in NH+St samples, however
not nearly to the same extent as NH+GSt samples. Based on the similarities between croissant
and +GSt samples, gelatinized wheat starch is likely the cause of the observed polymorphic
instability.
Figure 9: XRD spectra after 24h of storage of a) hydrogenated shortening and b) non-
hydrogenated shortening, after baking without matrix components, after baking into a croissant
and after baking with isolated croissant components.

58
Figure 10: XRD spectra of a) H+St, b) NH+St, c) H+GSt and d) NH+GSt over one week of
storage.
In agreement with Part I, the interaction observed appears to occur at different extents
based on the type of shortening. This could be explained by very different TAG composition of
this shortening when compared with the other fat sources, reported in our previous study. It
could be that certain TAGs in the non-hydrogenated shortening interact to a greater extent, or
form β polymorphs more readily in the presence of gelatinized wheat starch. It is also possible
that the lack of one, or a combination of specific TAGs could be the cause of polymorphic
instability. Given that there are particular documented interactions specifically between

59
monoacylglycerides and starch, there is precedence for varying levels of interaction between
different lipid components (Eliasson, 1994; Tang & Copeland, 2007).
Similar to results previously reported from analysis of croissants, the appearance and
growth of peaks at 4.9 Å, 5.2 Å and 5.8 Å occurs over storage for GSt containing samples. Given
that these are two of the characteristic peaks associated with crystalline wheat starch, we
previously attributed this to starch retrogradation with increasing storage time. When wheat
starch is gelatinized, the characteristic peaks associated with crystalline wheat starch no longer
appear in an XRD spectrum, however, retrogradation has also been described as the return of
starch components to their granular or crystalline state, and causing a weak pattern to again
appear in the XRD spectra (Bayer et al., 2006; Miles et al., 1985; Morris, 1990; Roulet et al.,
1988). Interestingly, starch retrogradation continuing with time coincides with the increasing
formation of β polymorphic crystals. It is therefore likely that the polymorphic conversion is
caused in part by the either the presence of retrograded starch or the actual process of
retrogradation. However, because some extent of conversion does exist with the presence of non-
gelatinized, or crystalline, wheat starch over time, retrogradation cannot be solely responsible.
4.2.2 Solid Fat Content
The signal from wheat starch, gelatinized wheat starch, gluten and gluten network at each
temperature cause great difficulty in determining the SFC of the sample mixtures, particularly in
gelatinized wheat starch and gluten network samples due to the presence of moisture. Our
previous investigation determined that the SFC contained within a croissant matrix is
significantly less than a bulk fat, and the results of the gelatinized wheat starch samples generally
follow this trend, particularly at higher temperatures. However, this trend was also observed for
the other component samples, with the exception of +G, making it difficult to state true
conclusions from these results (Table 7).

60
Table 7: SFC curves as a function of temperature for samples of hydrogenated shortening and
non-hydrogenated shortening with and without croissant matrix components.
SFC (%)
Sample 10.0°C 21.1°C 26.7°C 33.3°C 37.8°C
H shortening 29.0 ± 0.4 22.5 ± 0.6 21.1 ± 0.6 19.6± 0.4 15.8 ± 0.1
H+St 26.0 ± 2.4 19.7 ± 1.6 16.2 ± 0.8 12.9 ± 0.3 10.8 ± 0.3
H+GSt 30.8 ± 0.5 23.1 ± 0.4 18.4 ± 0.3 14.3 ± 0.4 11.4 ± 0.3
H+G 26.8 ± 2.1 21.3 ± 1.6 20.5 ± 1.6 19.0 ± 1.5 16.2 ± 1.5
H+GN 28.3 ± 3.7 21.9 ± 2.9 17.4 ± 2.3 13.5 ± 1.8 10.3 ± 1.3
NH shortening 26.4 ± 0.4 20.8 ± 0.6 18.5 ± 0.6 13.8 ± 0.2 8.05 ± 0.3
NH+St 20.7 ± 2.3 16.4 ± 1.5 14.2 ± 0.6 10.6 ± 0.4 8.0 ± 0.3
NH+GSt 23.9 ± 2.9 19.2 ± 1.5 16.7 ± 0.9 12.8 ± 0.7 9.6 ± 0.6
NH+G 35.8 ± 2.3 27.6 ± 1.6 22.4 ± 1.6 15.6 ± 1.2 11.6 ± 0.9
NH+GN 25.2 ± 2.3 19.2 ± 1.7 15.3 ± 1.4 10.8 ± 1.0 8.1 ± 0.7
4.2.3 Rate of Crystallization
The rate of crystallization was determined by measuring the SFC as samples were cooled
from 60°C to 10°C. Figure 11 presents the SFC as a function of time, where the cooling rate
over the elapsed time was determined to be statistically similar for all samples. The curves
obtained were fit using the Avrami model, and the Avrami coefficients (k) and exponents (n) are
reported in Table 8. From the results, it is evident that the SFC of a fat in the presence of
gelatinized wheat starch increases at a faster rate than what occurs for the same fat in bulk based
on increased k values. It is also noteworthy that samples containing crystalline wheat starch did
not demonstrate this behaviour. It is therefore conceivable that gelatinized wheat starch is acting
as a nucleation site on which the fat can crystallize, thereby allowing crystallization to occur
more quickly. Faster crystallization causes formation of less thermodynamically stable crystals,

61
which could be the cause of some polymorphic instability over time. Although the majority of
polymorphic conversion does not occur immediately upon cooling, the fact that the existing fat
crystals in the system were formed so quickly gives rise to greater instability, increasing the
chance that another environmental factor, such as starch retrogradation, could cause the shift
from β' to β crystals at a later time. The n values reported in Table 8 do not show any significant
changes with added crystalline or gelatinized wheat starch, indicating the crystal growth
mechanism is not impacted by the presence of these components.
Figure 11: Changes in SFC as a function of time during the isothermal (10°C) of a)
hydrogenated shortening and b) non-hydrogenated shortening, each in bulk, and after baking
with wheat starch or gelatinized wheat starch. Solid lines correspond to the Avrami fit of the
model to the data.

62
Table 8: Avrami variables from modelled rate of crystallization curves (Fig. 11) for each
shortening in bulk and when baked with wheat starch or gelatinized wheat starch.
Sample Avrami Coefficient (k) Avrami Exponent (n) R2
Hydrogenated A
Bulk Fat 0.61a ± 0.01 0.64
ab ± 0.01 1.00
+St 0.69a ± 0.02 0.58
a ± 0.03 0.96
+GSt 0.92b ± 0.04
0.50a ± 0.04
0.90
Non-Hydrogenated
Bulk Fat 0.61a ± 0.02 0.90
b ± 0.05 0.98
+St 0.60a ± 0.01 0.89
b ± 0.03 0.98
+GSt 0.88b ± 0.06 0.83
b ± 0.09 0.84
Values with the same superscript letter within the same column are not statistically different (P < 0.05)
4.2.4 Thermal Behaviour
In Figure 12a, it is evident that the melting temperature (Tm) of the hydrogenated
shortening, or the temperature at which the maximum of each peak occurs, does not change with
the presence of matrix components (Table 9). In Figure 12b, the non-hydrogenated shortening
undergoes an observed fractionation that causes two smaller peaks to take the place of a former
larger peak (relative to the same shortening before baking as reported in our previous
investigation), occurring for all samples after baking with the exception NH+St samples (Mattice
& Marangoni, 2017). Additionally, both NH+G and NH+GN samples appear to undergo
fractionation to a lesser extent, evident by the first peak occurring at temperatures between that
of fractionated and unfractionated samples.
However, in the case of both shortenings, the presence of gelatinized wheat starch
prompts the same result as when baked into a croissant, where the peaks broaden such that a
higher temperature is required to completely melt the fat (Fig. 12 a&b). The peak width was
represented by the difference between the onset (Tonset) of the first major melting peak, and the
temperature at which melting had completed, where the curve levelled (Tend), in degrees Celsius
(Table 10). For each shortening, the croissant and +GSt samples had significantly greater peak
63
width values when compared to all other samples. There was greater variance in the case of the
non-hydrogenated shortening due to the existence of two major peaks and extent of fractionation
that occurred with different samples, however it was still evident that the peak widths of
croissant and +GSt samples were significantly different than all other samples. The broadening
peaks suggest that the TAGs crystallize heterogeneously in the presence of gelatinized wheat
starch, existing in many different sizes. It is also possible that the heterogeneity is a result of the
previously observed increase in crystallization rate. As stated in the previous section, it is likely
that gelatinized wheat starch acts as a nucleation site on which the shortenings can crystallize.
However, not necessarily all of the fat will crystallize on the gelatinized starch, but rather some
extent of nucleation may be occurring within the fat itself. This theory can be used to explain the
variation in crystal size, as the different processes may favour crystal growth over nucleation
more than another.
The crystallization behaviour of both shortenings exhibits a similar pattern, where the
+St, +G and +GN samples behave like the shortenings baked in the absence of matrix
components, while croissant and +GSt samples demonstrate a different behaviour. While the
onset temperature of these samples is unchanging, the peak maximum or crystallization
temperature (Tp) occurs at a lower temperature than all other samples of the same fat. The
difference in Tp is only minor, despite the onset of crystallization being the same (Fig. 12c&d),
therefore we hypothesize that at that instant there is too much heat generated from the rapid
crystallization to dissipate, leading to a delayed Tp due to the fact that the temperature within the
sample had not yet decreased to the same point as the instrument (Table 10).

64
Table 9: Melting peak width represented as the average magnitude of difference between Tend
and Tonset for each shortening after baking without matrix components, after baking into a
croissant and after baking with isolated croissant components for nine replicates, with outliers
removed.
Sample Peak width (°C) Sample Peak Width (°C)
Baked H shortening 6.4a ± 2.1 Baked NH shortening 15.5
a ± 2.2
H croissant 19.4b ± 1.4 NH croissant 23.6
b ± 1.1
H+St 7.2a ± 1.7 NH+St 9.4
c ± 2.9
H+GSt 14.2c ± 1.8 NH+GSt 22.0
b ± 2.8
H+G 7.6a ± 1.8 NH+G 10.1
c ± 2.8
H+GN 8.9a ± 2.4 NH+GN 13.0
ac ± 3.5
Values with the same superscript letter within the same column are not statistically different (P < 0.05)
Table 10: Peak melting and crystallization temperatures for samples of baked hydrogenated
shortening and non-hydrogenated shortening with and without croissant matrix components.
Sample
Melting (°C) Crystallization (°C)
Peak 1 Peak 2 Peak 1 Peak 2
Baked H shortening 50.1 ± 0.5 - 30.0 ± 0.3 -
H croissant 49.5 ± 0.4 - 28.9 ± 0.5 -
H+St 50.2 ± 0.5 - 29.9 ± 0.3 -
H+GSt 50.1 ± 0.6 - 29.8 ± 0.4 -
H+G 50.2 ± 1.0 - 30.2 ± 0.3 -
H+GN 49.8 ± 0.7 - 30.1 ± 0.6 -
Baked NH shortening 42.7 ± 1.8 50.5 ± 1.2 24.0 ± 0.4 11.1 ± 0.6
NH Croissant 42.0 ± 1.1 49.9 ± 0.6 22.5 ± 0.5 8.2 ± 0.7
NH+St 46.1 ± 1.2 - 24.3 ± 0.2 11.6 ± 0.5
NH+GSt 42.5 ± 1.3 50.8 ± 1.3 23.3 ± 0.4 10.3 ± 0.8
NH+G 44.5 ± 0.9 51.1 ± 0.2 24.7 ± 0.3 11.8 ± 0.5
NH+GN 44.4 ± 1.3 50.4 ± 0.9 24.1 ± 0.4 11.4 ± 1.2

65
Figure 12: DSC melting endotherms of a) hydrogenated shortening and b) non-hydrogenated
shortening with different components, and DSC crystallization endotherms of c) hydrogenated
shortening and d) non-hydrogenated shortening with different components.

66
Additional testing, where H+GSt and NH+GSt samples were heated further to 115°C, did
not reveal any additional endothermic peaks. This indicates, that despite starch gelatinization
occurring in the presence of lipid material, no amylose-lipid complexes were formed, which, as
previously cited, melt at temperatures ranging from 95-115°C. This is likely a reflection of a lack
of monoglycerides and free fatty acids in each of the shortenings’ composition.
4.3 Conclusions
Overall, the similarities in behaviour between +GSt and croissant samples indicate that
there is an interaction that occurs between gelatinized wheat starch and roll-in shortenings. This
interaction is associated with polymorphic conversion to the most stable form, an increased rate
of crystallization and crystal heterogeneity as evidenced by a broader melting peak in the DSC
endotherm. Consequences of this interaction are pronounced for the non-hydrogenated
shortening, which appears to interact with gelatinized starch to a greater extent than the
hydrogenated shortening. When considering the coincidental occurrence of polymorphic
conversion with starch retrogradation, it is possible that retrogradation is at least in part
responsible for the polymorphic instability observed. This therefore puts emphasis on the
benefits of consuming laminated baked products as soon after baking as possible, particularly
those which have been prepared using non-hydrogenated shortening. Also notable is the
increased rate of crystallization that occurs in the presence of gelatinized wheat starch. Based on
the results observed, it is probable that the crystallization behaviour of roll-in shortenings within
a croissant matrix is most significantly impacted by this increased crystallization rate, the
occurrence of starch retrogradation, or by the combination of the two.
This research allows for a better understanding of the interactive role of fats in baked
laminated dough products, with the goal of aiding in the eventual development of acceptable
alternatives with improved fatty acid profile. By determining that shortening composition is a
factor in how it interacts with the gelatinized wheat starch within the laminated dough matrix, it
is possible to tailor shortenings during development such that they behave like those which are
known to create the most acceptable products. This would open the door for products that
comply with evolving regulations and health concerns however still satisfy consumers.

67
4.4 References
Bayer, R. K., Cagiao, M. E., & Baltá Calleja, F. J. (2006). Structure development in amorphous
starch as revealed by X-ray scattering: Influence of the network structure and water content.
Journal of Applied Polymer Science, 99, 1880–1886.
Bulpin, P. V., Welsh, E. J., & Morris, E. R. (1982). Physical Characterization of Amylose-Fatty
Acid Complexes in Starch Granules and in Solution. Starch‐Stärke, 34, 335–339.
Coupland, J. N. (2002). Crystallization in emulsions. Current Opinion in Colloid and Interface
Science, 7, 445–450.
Eliasson, A. C. (1994). Interactions between starch and lipids studied by DSC. Thermochimica
Acta, 246, 343–356.
Frazier, P. J., Daniels, N. W. R., & Eggitt, P. W. R. (1981). Lipid-Protein Interactions During
Dough Development. Journal of the Science of Food and Agriculture, 32, 877–897.
Karel, M. (1973). Protein Interactions in Biosystems: Protein-Lipid interactions. Journal of Food
Science, 38, 756–763.
Lai, H. M., & Lin, T. C. (2006). Bakery Products: Science and Technology. In Y. H. Hui (Ed.),
Bakery Products: Science and Technology (pp. 3–65). Ames, IA: Blackwell Publishing.
Lasztity, R., Bekes, F., Orsi, F., Smied, I., & Ember-Karpati, M. (1996). Protein-lipid and
protein-carbohydrate interactions in the gluten complex. Periodica Polytechnica: Chemical
Engineering, 40, 29–40.
Macias-Rodriguez, B., & Marangoni, A. G. (2016). Physicochemical and Rheological
Characterization of Roll-in Shortenings. JAOCS, Journal of the American Oil Chemists’
Society, 93, 575–585.
MacRitchie, F. (1977). Flour Lipids and Their Effects in Baking. Journal of the Science of Food
and Agriculture, 28, 53–58.
Marangoni, A. G. (1998). On the use and misuse of the avrami equation in characterization of the
kinetics of fat crystallization. Journal of the American Oil Chemists’ Society, 75, 1465–
1467.

68
Marangoni, A. G., & Wesdorp, L. H. (2013a). Crystallography and Polymorphism. In A. G.
Marangoni & L. H. Wesdorp (Eds.), Structure and Properties of Fat Crystal Networks (2nd
ed., pp. 1–24). Boca Raton, FL: CRC Press.
Marangoni, A. G., & Wesdorp, L. H. (2013b). Nucleation and Crystalline Growth Kinetics. In A.
G. Marangoni & L. H. Wesdorp (Eds.), Structure and Properties of Fat Crystal Networks
(2nd ed., pp. 27–99). Boca Raton, FL: CRC Press.
Mattice, K. D., & Marangoni, A. G. (2017). Matrix effects on the crystallization behaviour of
butter and roll-in shortening in laminated bakery products. Food Research International, 96,
54–63.
McCann, T. H., Small, D. M., Batey, I. L., Wrigley, C. W., & Day, L. (2009). Protein-lipid
interactions in gluten elucidated using acetic-acid fractionation. Food Chemistry, 115, 105–
112.
Miles, M. J., Morris, V. J., Orford, P. D., & Ring, S. G. (1985). The Roles of Amylose and
Amylopectin in the Gelation and Retrogradation of Starch. Carbohydrate Research, 135,
271–281.
Morris, V. J. (1990). Starch gelation and retrogradation. Trends in Food Science and
Technology, 1, 2–6.
Pomeranz, Y., & Chung, O. K. (1978). Interaction of Lipids with Proteins and Carbohydrates in
breadmaking. Journal of the American Oil Chemists’ Society, 55, 285–289.
Putseys, J. A., Lamberts, L., & Delcour, J. A. (2010). Amylose-inclusion complexes: Formation,
identity and physico-chemical properties. Journal of Cereal Science, 51, 238–247.
Roulet, P., MacInnes, W. M., Würsch, P., Sanchez, R. M., & Raemy, A. (1988). A comparative
study of the retrogradation kinetics of gelatinized wheat starch in gel and powder form using
X-rays, differential scanning calorimetry and dynamic mechanical analysis. Food
Hydrocolloids, 2, 381–396.
Rousset, P. (2002). Modeling Crystallization Kinetics of Triacylglycerols. In A. G. Marangoni &
S. S. Narine (Eds.), Physical Properties of Lipids (pp. 11–46). New York, NY: Marcel
Dekker.
69
Sharples, A. (1996). Overall kinetics of crystallization. In A. Sharples (Ed.), Introduction to
polymer crystallization (pp. 44–59). London: Edward Arnold.
Tang, M. C., & Copeland, L. (2007). Analysis of complexes between lipids and wheat starch.
Carbohydrate Polymers, 67, 80–85.
Wright, A. J., Hartel, R. W., Narine, S. S., & Marangoni, A. G. (2000). The effect of minor
components on milk fat crystallization. Journal of the American Oil Chemists’ Society, 77,
463–475.

70
5.0 Conclusions and Future Work
Laminating or roll-in shortenings serve the main purpose of creating many thin layers of
shortening that separate layers of dough. Because of the extensive rolling and folding that takes
place, the shortening must be very plastic and extensive research has been done to determine the
properties which achieve this plasticity. However, it cannot be assumed that the properties of a
roll-in shortening prior to incorporation remain after baking as the melting at high temperatures
and the potential for ingredient interactions create opportunity for changes in crystallization
behaviour upon cooling within the matrix.
In this work, specialized laminating or roll-in shortenings, two hydrogenated and one
non-hydrogenated, as well as butter were used to prepare four different types of croissants. The
fats, the same fats after baking and the respective croissants were each analyzed using the same
techniques to examine the effect of the croissant matrix on fat crystallization. Each of the
samples were analyzed for polymorphism using powder x-ray diffraction (XRD), SFC by pulsed
nuclear magnetic resonance (p-NMR) and melting behaviour by differential scanning calorimetry
(DSC).
First, given the lack of research done on the fat contained within an entire food product
using these specific methods, sample preparation techniques were developed, specific to each
method. For XRD, the croissants were grated into a fine crumb using a metal sieve, and the
crumbs were then pressed down into the sample well in a glass XRD slide. It was determined
that this fine size was needed in order to prevent having an uneven surface when applied to the
slide. During measurement, the scanning rate was chosen to be slow enough to have optimal
resolution, yet not so slow that crumbs dried out, avoiding surface cracking. For p-NMR,
croissants were again crumbled, however the size did not need to be as small nor uniform. A
metal rod just slimmer than the width of the glass p-NMR tubes was then used to press down
croissant pieces to the bottom of the tube, working small portions at a time to ensure there were
no air pockets. However, there were still difficulties in attaining SFC measurements due to the
many non-fat ingredients in croissants that still registered a signal. Three methods were tested to
best account for this additional signal. First, the signal achieved at temperatures above the
melting point of fat (60°C) was subtracted from the SFC measurements. Alternatively, croissant

71
dough was baked in the absence of fat and the signal from this fat free dough was taken at each
temperature and subtracted from the respective SFC measurements. Indirect SFC measurements
were also taken, however the presence of moisture in the dough interfered with these results.
Overall, the results obtained when the signal of fat free dough is subtracted were determined to
be the most appropriate due to the fact that the signal from non-fat components changed with
temperature, giving this method the greatest accuracy across all temperatures. Finally, for the
DSC, it was determined that little accommodation was needed to analyze croissants, and they
were simply cut using a small blade and weighed into the aluminum crucibles.
For each type of laminating fat used, XRD revealed that the polymorphism of a roll-in
shortening or butter is different when baked within the dough matrix than when simply heated
and cooled on its own. Both hydrogenated roll-in shortenings and butter experienced only minor
changes, largely retaining their β' polymorphs, however the non-hydrogenated shortening
experienced significant conversion from β' to the β form. Interestingly, this conversion did not
take place immediately upon cooling, but after approximately 24 hours of storage time. The fat
contained within the croissants exhibited a significantly lower SFC than the same fats in bulk.
Further, DSC results demonstrated that a greater temperature was required to melt all of the fat
completely in a croissant than the same fat in bulk, observed visually as broader peaks in the
melting endotherms. Analysis of croissant firmness over storage time, measured as the maximum
force required to cut a croissant was used as an indication of potential sensory consequences.
Results suggested that only croissants prepared with non-hydrogenated shortening experienced
significant changes in firmness over one week of storage. These results indicate an interaction
occurs between the shortenings and the ingredients of the croissant matrix. Given the differences
observed between the type of roll-in fats used, the extent of interaction is potentially influenced
by the composition of the roll-in fat itself.
The same shortenings and butter were then baked in the presence of isolated croissant
components and the cooled samples were analyzed using the same methods as the croissants.
Samples did not require specialized preparation for analysis for XRD and DSC, however the
same metal rod was used to press the samples down into glass p-NMR tubes. Limitations were
noted again with the SFC measurements, due to the complexity of the mixtures and the signals
achieved from non-fat ingredients, particularly gelatinized wheat starch and gluten network
which contain moisture. While fat-free dough was analyzed to account for this in croissants,

72
usable measurements of fat free gelatinized wheat starch and gluten network could not be
obtained, therefore more research is required to determine the most suitable method of
accounting for this added signal.
Overall, the only component that prompted the same results as seen from the croissant
samples was gelatinized wheat starch, causing similar changes in polymorphism and melting
behaviour. Crystalline wheat starch did prompt polymorphic conversion over one week of
storage, but to a much lesser extent. The samples gluten or a formed gluten network behaved as
the respective fats in bulk. These results suggest that the proposed interaction occurs between
roll-in shortenings or butter and the gelatinized wheat starch within the matrix. The interaction
appears to cause an increased rate of crystallization identified as by a faster increase in SFC as
samples were cooled from 60 to 10°C. It is possible that the observed increase in crystallization
rate results in greater crystal heterogeneity. This heterogeneity was identified based on
broadening peaks in the DSC endotherms, where the peak width of croissants and samples
containing gelatinized wheat starch of croissant was greater than all other samples. As stated in
the previous section, it is likely that gelatinized wheat starch acts as a nucleation site on which
the shortenings can crystallize. However, not necessarily all of the fat will crystallize on the
gelatinized starch, but rather some extent of nucleation may be occurring within the fat itself.
This theory can be used to explain the variation in crystal size, as the different processes may
favour crystal growth over nucleation more than another. Based on the results observed, it is
probable that the crystallization behaviour of roll-in shortenings within a croissant matrix is most
significantly impacted by this increased crystallization rate, the occurrence of starch
retrogradation, or by the combination of the two.
The implication of this research for the food industry is to understand the interactive role
of fats in these baked dough products, with the goal of aiding in the eventual development of
acceptable, trans fatty acid-free alternatives. By determining that different shortenings and butter
likely interact to different extents with the gelatinized wheat starch within the laminated dough
matrix, it is possible that newly developed trans fatty acid free and low saturated fatty acid
shortenings could be tailored such that they behave like those which create the most acceptable
products. This would open the door for products that comply with evolving regulations and
health concerns that are still satisfying to consumers.

73
Because the true nature of the interaction was not revealed, more research to uncover
would be recommended in the future. Likely, this would involve microscopy, where starch
retrogradation and the fat structure at a similar scale to the starch granules could be monitored
over time. Additionally, the inclusion of more laminating shortenings of different compositions
could be included, to further identify any differences in behaviour and structure, and relate this
back to the TAG and FA composition. Another consideration is the fact that the different types
of laminated dough products have slightly different compositions and differing ratios of
ingredients. These products may each have unique interactions compared to that of croissants.
For this reason, the laminating shortenings could be used to prepare different laminated products
and examined in a similar manner.
Another major aspect is sensory analysis, which would be necessary to truly identify if
the polymorphic changes over storage time cause a perceivable difference for consumers among
the different shortening types. However, a different selection of shortenings would be needed for
this, as the hydrogenated shortenings included in this investigation were notably high in trans
fatty acids and it would not have been ethical to feed participants a large number of croissants
over the week of storage time knowing that consumption of this content of trans fat has been
proven on many occasions to have negative health associations.
To conclude, gelatinized wheat starch, and likely the retrogradation that it experiences
over storage time, has an influence on the crystallization behaviour and structure of fat contained
within croissants. Additionally, the extent of the interaction was found to depend on the
composition of the shortening, specifically regarding the content of trans fatty acids. Given the
difference in behaviour of shortenings previously reported to produce less desirable products,
these techniques are therefore suitable to analyze laminated products produced with new and
novel shortening alternatives as an indicator of potential consumer acceptance and for large scale
production.