Embed Size (px)
Citation preview

© 2014 PerkinElmer
HUMAN HEALTH • ENVIRONMENTAL HEALTH
© 2017 PerkinElmer
Matrix Interferences in ICP-MS: Causes, Effects, and Strategies to Reduce or Eliminate Them…
Ruth E. Wolf, Ph. D. and Daniel H. Jones

Matrix Effects in ICP-MS (and ICP-OES)
• Spectral Interferences ◦ Isobaric or molecular overlaps
- 64Zn and 64Ni - 40Ar35Cl on 75As
• Non-spectral interferences1 ◦ Matrix induced changes in signal intensity ◦ Concomitant elements may enhance or suppress analyte signals
- Multiplicative effects that change slope of calibration curve
• Happen in sample introduction/plasma (known since the early 1970’s) ◦ Easily Ionizable Element (EIE) effects ◦ Aerosol Ionic Redistribution Effects (AIR) ◦ Organic Enhancement effects ◦ Matrix/Acid washout
• Happen in the mass spectrometer ◦ Space charge effects
1 Inductively Coupled Plasma Mass Spectrometry, Ed., Akbar
Montaser, 1998, pp 543-548, ISBN: 0-471-18620-1
• Collision/Reaction Cells
• High Resolution
• Matrix Separation….

Sample Introduction/Plasma Effects
Good review article – although written for ICP-AES the
effects in the spray chamber and processes in the plasma
are the same in ICP-MS…

Organic Signal Enhancement Effects
• Organics can cause signal enhancements of high IP elements,
e.g. arsenic (3-8 times) and selenium (2-6 times).
◦ Attributed to the modification of the ionization equilibrium in the plasma
◦ E.g. carbon acts as an electron sink….
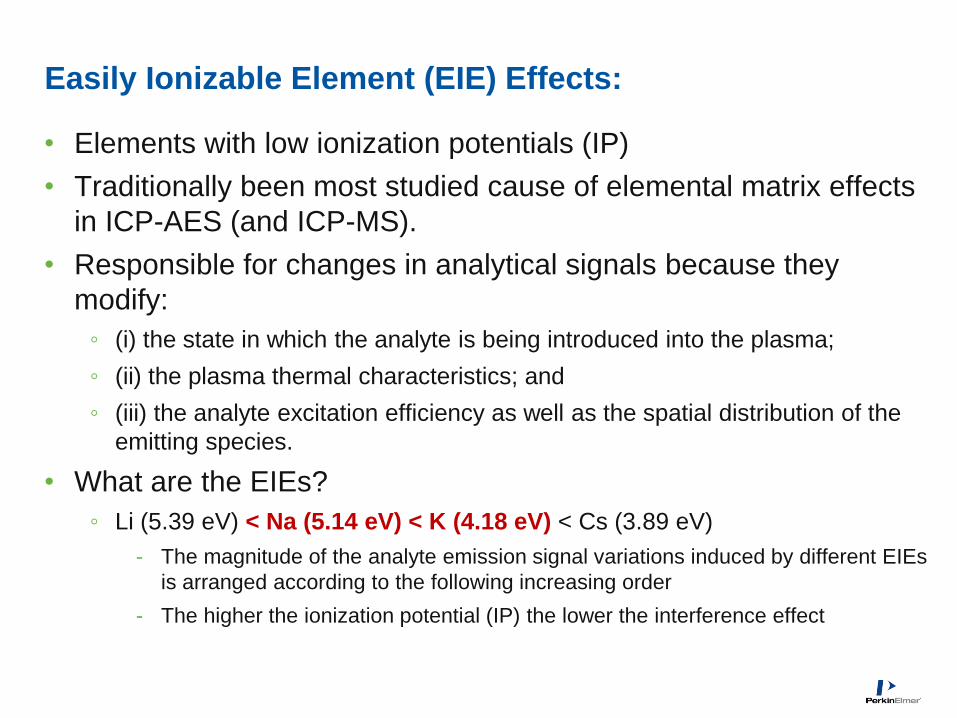
Easily Ionizable Element (EIE) Effects:
• Elements with low ionization potentials (IP)
• Traditionally been most studied cause of elemental matrix effects
in ICP-AES (and ICP-MS).
• Responsible for changes in analytical signals because they
modify:
◦ (i) the state in which the analyte is being introduced into the plasma;
◦ (ii) the plasma thermal characteristics; and
◦ (iii) the analyte excitation efficiency as well as the spatial distribution of the
emitting species.
• What are the EIEs?
◦ Li (5.39 eV) < Na (5.14 eV) < K (4.18 eV) < Cs (3.89 eV)
- The magnitude of the analyte emission signal variations induced by different EIEs
is arranged according to the following increasing order
- The higher the ionization potential (IP) the lower the interference effect

Internal Standards in ICP-MS
• Can be used to compensate for changes in sample introduction
◦ Sample viscosity
◦ Tubing wear
◦ Changes in cone orifices (deposition over time)
• Can be used to compensate for matrix effects - MAYBE
◦ However, depending on the cause of the matrix effect the internal standard may or may not correctly compensate for the signal changes
- Depends in ionization potential of Internal Standard element and analyte
- Depends on how internal standard elements and analytes are affected by concomitant elements in the plasma
• There is NO PERFECT internal standard for all samples!
◦ May consider adding alternate internal standards
◦ Reprocess data with different internal standard to see effects

EPA Method 200.8
• Approved elements:
◦ Al, Sb, As, Ba, Be, Cd, Cr, Co, Cu, Pb, Mn, Hg, Mo, Ni, Se, Ag, Tl, Th, U, V, Zn
• How many of you only monitor those elements?
• What about the major cations: Na, K, Mg, Ca?
◦ Did you ever see a natural water without some level of these elements???
◦ What are the typical concentrations of these elements in your samples?
- Could be 10 - 50 ppm, depending on element and water source
◦ Na and K are known EIE elements
- High concentrations of EIE elements can affect elements with higher ionization
potentials (e.g. Ge, As, Se)
◦ Measured interference effects: K < Na < Mg < Ca
- Based on IP, a non-thermal excitation mechanism was likely to take place
- Calcium is regarded as one of the elements that produces the most serious
interferences in ICP-AES (changes nebulization and vaporization characteristics)
• Do you have trouble keeping External QC’s in limits when they contain
ALL elements typically present in a water?

Concentrations of Major Cations in Drinking Water
• Mg, Ca, Na, and K present in all waters and highly variable
• From: http://www.mgwater.com/mgrank.shtml ◦ Accessed 06/26/2017
◦ Not all states and only a few locations in each state, total N=99
• My own assignment to regions…
Region States
Average Concentration mg/L (SD)
Mg Ca Na K
North West CA, HA, OR, WA 6.8 (4.6) 12.1 (11.1) 23.0 (24.5) 1.7 (1.3)
North Central IA, IL, IN, KS, KY, MI, MN, MO, NE,
OH, WI 14.7 (6.5) 46.1 (13.2) 21.0 (19.2) 1.7 (1.3)
North East CT, DC, MA, MD, NJ, PA, RI, VA, NY 3.8 (2.9) 17.2 (11.4) 5.6 (2.9) 1.4 (0.6)
South West AZ, CO, NM 10.6 (6.0) 43.7 (20.3) 36.1 (34.9) 2.1 (1.1)
South Central AL, LA, MS, OK, TN, TX 6.6 (6.1) 23.8 (12.7) 29.5 (22.5) 2.5 (2.1)
South East FL, GA, NC 4.1 (4.0) 26.1 (27.4) 5.6 (3.3) 1.4 (0.4)
Grand MEAN ALL STATES 9.4 (9.5) 31.8 (20.9) 22.5 (30.1) 2.5 (2.4)
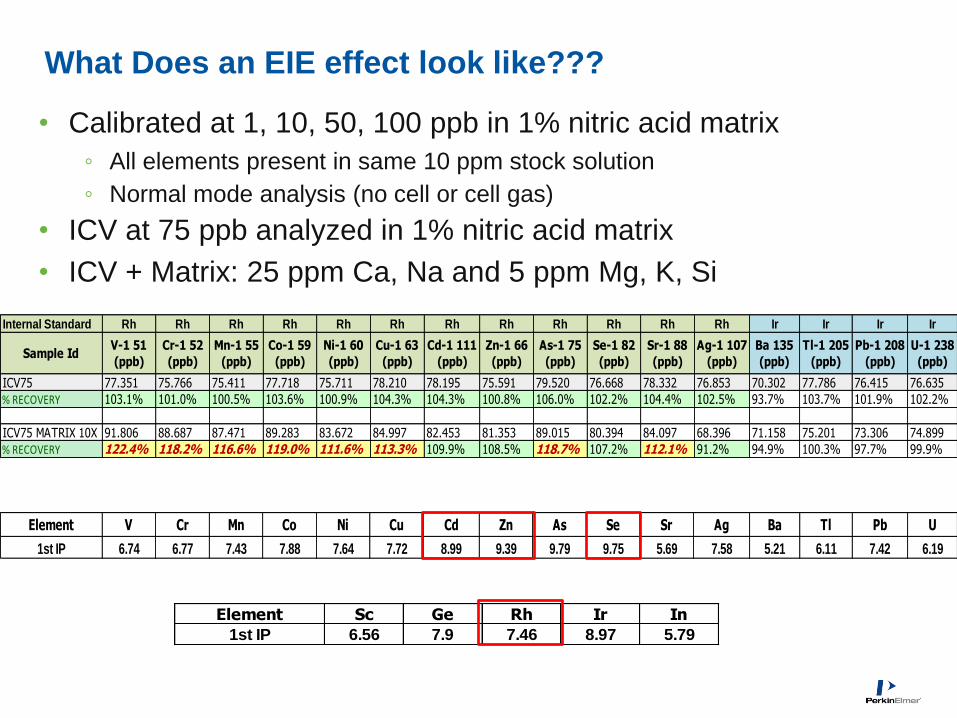
What Does an EIE effect look like???
• Calibrated at 1, 10, 50, 100 ppb in 1% nitric acid matrix
◦ All elements present in same 10 ppm stock solution
◦ Normal mode analysis (no cell or cell gas)
• ICV at 75 ppb analyzed in 1% nitric acid matrix
• ICV + Matrix: 25 ppm Ca, Na and 5 ppm Mg, K, Si
Element V Cr Mn Co Ni Cu Cd Zn As Se Sr Ag Ba Tl Pb U
1st IP 6.74 6.77 7.43 7.88 7.64 7.72 8.99 9.39 9.79 9.75 5.69 7.58 5.21 6.11 7.42 6.19
Element Sc Ge Rh Ir In
1st IP 6.56 7.9 7.46 8.97 5.79
Internal Standard Rh Rh Rh Rh Rh Rh Rh Rh Rh Rh Rh Rh Ir Ir Ir Ir
Sample IdV-1 51
(ppb)
Cr-1 52
(ppb)
Mn-1 55
(ppb)
Co-1 59
(ppb)
Ni-1 60
(ppb)
Cu-1 63
(ppb)
Cd-1 111
(ppb)
Zn-1 66
(ppb)
As-1 75
(ppb)
Se-1 82
(ppb)
Sr-1 88
(ppb)
Ag-1 107
(ppb)
Ba 135
(ppb)
Tl-1 205
(ppb)
Pb-1 208
(ppb)
U-1 238
(ppb)
ICV75 77.351 75.766 75.411 77.718 75.711 78.210 78.195 75.591 79.520 76.668 78.332 76.853 70.302 77.786 76.415 76.635
% RECOVERY 103.1% 101.0% 100.5% 103.6% 100.9% 104.3% 104.3% 100.8% 106.0% 102.2% 104.4% 102.5% 93.7% 103.7% 101.9% 102.2%
ICV75 MATRIX 10X 91.806 88.687 87.471 89.283 83.672 84.997 82.453 81.353 89.015 80.394 84.097 68.396 71.158 75.201 73.306 74.899
% RECOVERY 122.4% 118.2% 116.6% 119.0% 111.6% 113.3% 109.9% 108.5% 118.7% 107.2% 112.1% 91.2% 94.9% 100.3% 97.7% 99.9%

Change the Internal Standards…
• Same raw data reprocessed with different internal standards
• Different Internal Standards behave differently…
• Indication you have EIE or other matrix effects occurring
Internal Standard Ge Ge Ge Ge Ge Ge Ge Ge Ge Ge Ge Ge
Sample IdV-1 51
(ppb)
Cr-1 52
(ppb)
Mn-1 55
(ppb)
Co-1 59
(ppb)
Ni-1 60
(ppb)
Cu-1 63
(ppb)
Cd-1 111
(ppb)
Zn-1 66
(ppb)
As-1 75
(ppb)
Se-1 82
(ppb)
Sr-1 88
(ppb)
Ag-1 107
(ppb)
ICV75 76.015 74.433 74.106 76.354 74.487 76.871 76.803 74.336 78.141 75.315 77.017 75.552
% RECOVERY 101.4% 99.2% 98.8% 101.8% 99.3% 102.5% 102.4% 99.1% 104.2% 100.4% 102.7% 100.7%
ICV75 MATRIX 10X 80.608 77.809 76.765 78.356 73.461 74.560 72.296 71.439 78.070 70.499 73.934 60.145
% RECOVERY 107.5% 103.7% 102.4% 104.5% 97.9% 99.4% 96.4% 95.3% 104.1% 94.0% 98.6% 80.2%
Internal Standard Rh Rh Rh Rh Rh Rh Rh Rh Rh Rh Rh Rh
Sample IdV-1 51
(ppb)
Cr-1 52
(ppb)
Mn-1 55
(ppb)
Co-1 59
(ppb)
Ni-1 60
(ppb)
Cu-1 63
(ppb)
Cd-1 111
(ppb)
Zn-1 66
(ppb)
As-1 75
(ppb)
Se-1 82
(ppb)
Sr-1 88
(ppb)
Ag-1 107
(ppb)
ICV75 77.351 75.766 75.411 77.718 75.711 78.210 78.195 75.591 79.520 76.668 78.332 76.853
% RECOVERY 103.1% 101.0% 100.5% 103.6% 100.9% 104.3% 104.3% 100.8% 106.0% 102.2% 104.4% 102.5%
ICV75 MATRIX 10X 91.806 88.687 87.471 89.283 83.672 84.997 82.453 81.353 89.015 80.394 84.097 68.396
% RECOVERY 122.4% 118.2% 116.6% 119.0% 111.6% 113.3% 109.9% 108.5% 118.7% 107.2% 112.1% 91.2%
Internal Standard Ir Ir Ir Ir Ir Ir Ir Ir Ir Ir Ir Ir
Sample IdV-1 51
(ppb)
Cr-1 52
(ppb)
Mn-1 55
(ppb)
Co-1 59
(ppb)
Ni-1 60
(ppb)
Cu-1 63
(ppb)
Cd-1 111
(ppb)
Zn-1 66
(ppb)
As-1 75
(ppb)
Se-1 82
(ppb)
Sr-1 88
(ppb)
Ag-1 107
(ppb)
ICV75 74.765 73.153 72.893 75.070 73.307 75.615 75.536 73.159 76.855 74.114 75.814 74.354
% RECOVERY 99.7% 97.5% 97.2% 100.1% 97.7% 100.8% 100.7% 97.5% 102.5% 98.8% 101.1% 99.1%
ICV75 MATRIX 10X 75.422 72.696 71.806 73.266 68.748 69.749 67.635 66.863 73.057 65.945 69.215 56.240
% RECOVERY 100.6% 96.9% 95.7% 97.7% 91.7% 93.0% 90.2% 89.2% 97.4% 87.9% 92.3% 75.0%

60.0%
70.0%
80.0%
90.0%
100.0%
110.0%
120.0%
Ca
lib
rati
on
Bla
nk
1 p
pb
10
pp
b50
pp
b10
0p
pb
20
0p
pb
BL
AN
K C
HE
CK
ICV
75
ICV
75
M1
0X
ICB
CA
L B
LA
NK
1 P
PB
10
PP
B50
PP
B M
20X
10
0 P
PB
M10
X20
0 P
PB
M5X
ICV
75
ICV
75
M1
0X
ICB
MD
L-0
1M
DL
-02
MD
L-0
3M
DL
-04
MD
L-0
5M
DL
-06
MD
L-0
7M
DL
-08
MD
L-0
9M
DL
-10
CA
L B
LA
NK
1 P
PB
10
PP
B50
PP
B10
0 P
PB
20
0 P
PB
ICV
75
ICV
75
M1
0X
ICB
CA
L B
LA
NK
1 P
PB
10
PP
B50
PP
B M
20X
10
0 P
PB
M10
X20
0 P
PB
M5X
ICV
75
ICV
75
M1
0X
ICB
% R
ec
ove
ry
Internal Standards
Sc45-STD
Ir193 STD
Rh103- STD
Ge72-STD
Look at what Internal Standards are doing…
• Presence of Na, K, Mg, Ca, Si matrix suppresses Ir and Rh
• As Matrix concentrations increase so does suppression
◦ Matrix 20X = 12.5 ppm Ca, Na + 2.5ppm Mg, K, Si
◦ Matrix 10x = 25 ppm Ca, Na + 5 ppm Mg, K, Si
◦ Matrix 5x = 50 ppm Ca, Na + 10 ppm Mg, K, Si

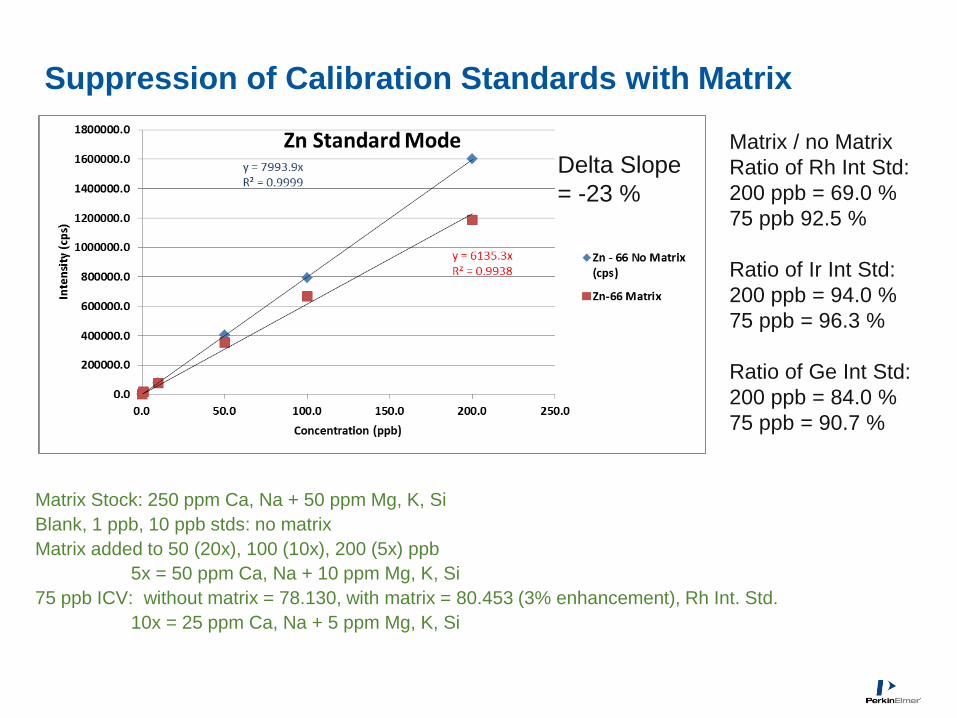
Suppression of Calibration Standards with Matrix
Matrix Stock: 250 ppm Ca, Na + 50 ppm Mg, K, Si
Blank, 1 ppb, 10 ppb stds: no matrix
Matrix added to 50 (20x), 100 (10x), 200 (5x) ppb
5x = 50 ppm Ca, Na + 10 ppm Mg, K, Si
75 ppb ICV: without matrix = 76.648, with matrix = 84.700 (10% enhancement), Rh Int Std
10x = 25 ppm Ca, Na + 5 ppm Mg, K, Si
Matrix / no Matrix
Ratio of Rh Int Std:
200 ppb = 69.0 %
75 ppb 92.5 %
Ratio of Ir Int Std:
200 ppb = 94.0 %
75 ppb = 96.3 %
Ratio of Ge Int Std:
200 ppb = 84.0 %
75 ppb = 90.7 %
Delta Slope
= -15 %

Suppression of Calibration Standards with Matrix
Matrix Stock: 250 ppm Ca, Na + 50 ppm Mg, K, Si
Blank, 1 ppb, 10 ppb stds: no matrix
Matrix added to 50 (20x), 100 (10x), 200 (5x) ppb
5x = 50 ppm Ca, Na + 10 ppm Mg, K, Si
75 ppb ICV: without matrix = 78.130, with matrix = 85.052 (9% enhancement), Rh Int. Std.
10x = 25 ppm Ca, Na + 5 ppm Mg, K, Si
Delta Slope
= -13 %
Matrix / no Matrix
Ratio of Rh Int Std:
200 ppb = 69.0 %
75 ppb 92.5 %
Ratio of Ir Int Std:
200 ppb = 94.0 %
75 ppb = 96.3 %
Ratio of Ge Int Std:
200 ppb = 84.0 %
75 ppb = 90.7 %
Suppression of Calibration Standards with Matrix
Matrix Stock: 250 ppm Ca, Na + 50 ppm Mg, K, Si
Blank, 1 ppb, 10 ppb stds: no matrix
Matrix added to 50 (20x), 100 (10x), 200 (5x) ppb
5x = 50 ppm Ca, Na + 10 ppm Mg, K, Si
75 ppb ICV: without matrix = 78.130, with matrix = 80.453 (3% enhancement), Rh Int. Std.
10x = 25 ppm Ca, Na + 5 ppm Mg, K, Si
Delta Slope
= -23 %
Matrix / no Matrix
Ratio of Rh Int Std:
200 ppb = 69.0 %
75 ppb 92.5 %
Ratio of Ir Int Std:
200 ppb = 94.0 %
75 ppb = 96.3 %
Ratio of Ge Int Std:
200 ppb = 84.0 %
75 ppb = 90.7 %

Suppression of Calibration Standards with Matrix
Matrix Stock: 250 ppm Ca, Na + 50 ppm Mg, K, Si
Blank, 1 ppb, 10 ppb stds: no matrix
Matrix added to 50 (20x), 100 (10x), 200 (5x) ppb
5x = 50 ppm Ca, Na + 10 ppm Mg, K, Si
75 ppb ICV: without matrix = 76.796, with matrix = 69.096 (11% suppression), Rh Int. Std.
10x = 25 ppm Ca, Na + 5 ppm Mg, K, Si
Delta Slope
= -38 %
Matrix / no Matrix
Ratio of Rh Int Std:
200 ppb = 69.0 %
75 ppb 92.5 %
Ratio of Ir Int Std:
200 ppb = 94.0 %
75 ppb = 96.3 %
Ratio of Ge Int Std:
200 ppb = 84.0 %
75 ppb = 90.7 %

Matrix Match the Calibration…
• Calibration with increasing concentrations of major cations ◦ Na, Ca, K, Mg, Si
• Minimizes EIE effects
• Internal standard less critical…
Internal Standard Rh Rh Rh Rh Rh Rh Rh Rh Rh Rh Rh Rh Rh
Sample IdV-1 51
(ppb)
Cr-1 52
(ppb)
Mn-1 55
(ppb)
Co-1 59
(ppb)
Ni-1 60
(ppb)
Cu-1 63
(ppb)
Ga-1 69
(ppb)
Cd-1 111
(ppb)
Zn-1 66
(ppb)
As-1 75
(ppb)
Se-1 82
(ppb)
Sr-1 88
(ppb)
Ag-1 107
(ppb)
ICV 75 72.214 72.141 73.911 71.124 73.341 72.975 75.074 72.680 75.910 72.135 77.455 70.208 74.940
% RECOVERY 96.3% 96.2% 98.5% 94.8% 97.8% 97.3% 100.1% 96.9% 101.2% 96.2% 103.3% 93.6% 99.9%
ICV 75 M10X 73.085 73.128 72.930 72.032 73.990 75.698 74.353 73.886 75.865 74.217 76.498 71.736 73.497
% RECOVERY 97.4% 97.5% 97.2% 96.0% 98.7% 100.9% 99.1% 98.5% 101.2% 99.0% 102.0% 95.6% 98.0%
Internal Standard Ge Ge Ge Ge Ge Ge Ge Ge Ge Ge Ge Ge Ge
Sample IdV-1 51
(ppb)
Cr-1 52
(ppb)
Mn-1 55
(ppb)
Co-1 59
(ppb)
Ni-1 60
(ppb)
Cu-1 63
(ppb)
Ga-1 69
(ppb)
Cd-1 111
(ppb)
Zn-1 66
(ppb)
As-1 75
(ppb)
Se-1 82
(ppb)
Sr-1 88
(ppb)
Ag-1 107
(ppb)
ICV 75 75.304 75.230 77.074 74.163 76.436 76.081 78.236 75.664 79.101 75.161 80.733 73.177 78.107
% RECOVERY 100.4% 100.3% 102.8% 98.9% 101.9% 101.4% 104.3% 100.9% 105.5% 100.2% 107.6% 97.6% 104.1%
ICV 75 M10X 72.732 72.773 72.607 71.693 73.588 75.361 73.998 73.379 75.478 73.767 76.135 71.390 73.121
% RECOVERY 97.0% 97.0% 96.8% 95.6% 98.1% 100.5% 98.7% 97.8% 100.6% 98.4% 101.5% 95.2% 97.5%
Internal Standard Ir Ir Ir Ir Ir Ir Ir Ir Ir Ir Ir Ir Ir
Sample IdV-1 51
(ppb)
Cr-1 52
(ppb)
Mn-1 55
(ppb)
Co-1 59
(ppb)
Ni-1 60
(ppb)
Cu-1 63
(ppb)
Ga-1 69
(ppb)
Cd-1 111
(ppb)
Zn-1 66
(ppb)
As-1 75
(ppb)
Se-1 82
(ppb)
Sr-1 88
(ppb)
Ag-1 107
(ppb)
ICV 75 73.611 73.552 75.386 72.523 74.712 74.406 76.508 73.899 77.351 73.521 78.953 71.510 76.324
% RECOVERY 98.1% 98.1% 100.5% 96.7% 99.6% 99.2% 102.0% 98.5% 103.1% 98.0% 105.3% 95.3% 101.8%
ICV 75 M10X 71.298 71.334 71.197 70.320 72.174 73.884 72.535 71.877 73.960 72.378 74.631 69.942 71.659
% RECOVERY 95.1% 95.1% 94.9% 93.8% 96.2% 98.5% 96.7% 95.8% 98.6% 96.5% 99.5% 93.3% 95.5%
Matrix Stock: 250 ppm Ca, Na + 50 ppm Mg, K, Si
Blank, 1 ppb, 10 ppb stds: no matrix
Matrix added to 50 (20x), 100 (10x), 200 (5x) ppb
5x = 50 ppm Ca, Na + 10 ppm Mg, K, Si

Tips for Calibrating for Method 200.8
• Figure out range of major elements typically seen in lab – including external QC samples
◦ Example: Ca = 30 mg/L, Na = 38 mg/L, K = 5 mg/L, Mg = 9 mg/L - An Internet USDA report listed the above Mean Concentrations
(https://www.ars.usda.gov/ARSUserFiles/80400525/Articles/NDBC32_WaterMin.pdf)
• Make up a Matrix Standard 5 – 10 X higher in concentration ◦ Use this to spike increasing levels of your matrix elements into your calibration standards ◦ Be careful you are using ultrapure standards if you make your own
- Recommend purchasing a multi-element standard from reputable supplier to contaminants are reported
• Example Calibration Scheme: ◦ Add increasing spike amounts of the matrix standard to each calibration standard (see below)
- Can use no matrix in lowest 1 or 2 standards – to prevent contamination
◦ Monitor what your internal standards (and alternates) are doing
https://www.perkinelmer.com/lab-solutions/resources/docs/APP-NexION-2000-ICP-MS-EPA-200-Point-8-Standard-Mode-013121B_01.pdf
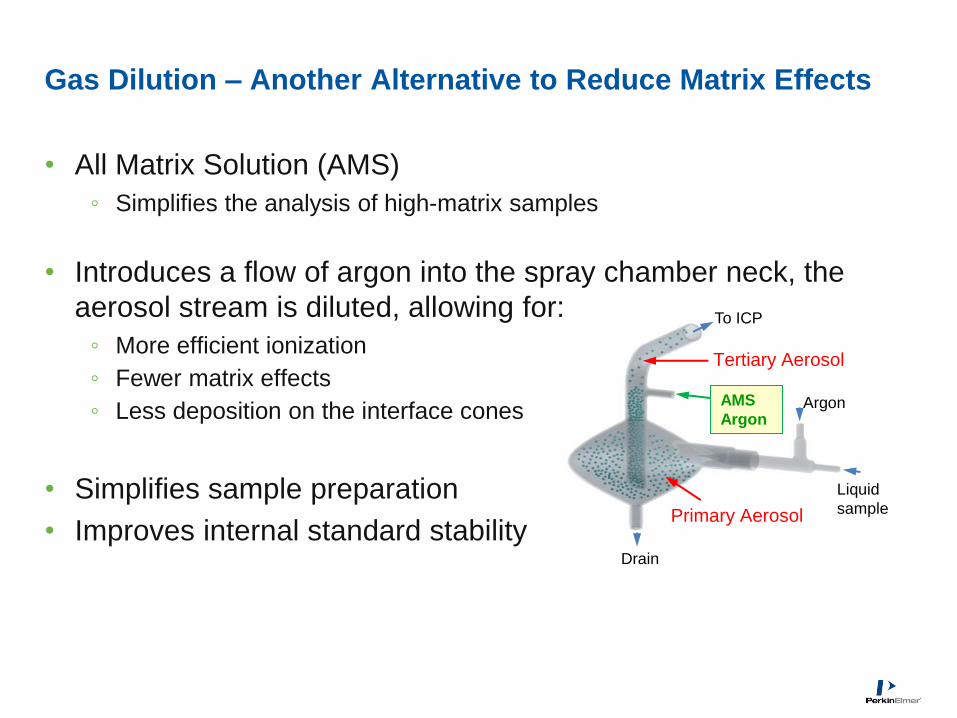
Gas Dilution – Another Alternative to Reduce Matrix Effects
• All Matrix Solution (AMS)
◦ Simplifies the analysis of high-matrix samples
• Introduces a flow of argon into the spray chamber neck, the
aerosol stream is diluted, allowing for:
◦ More efficient ionization
◦ Fewer matrix effects
◦ Less deposition on the interface cones
• Simplifies sample preparation
• Improves internal standard stability Primary Aerosol
Tertiary Aerosol
Liquid
sample
Argon
Drain
AMS
Argon
To ICP

PerkinElmer All Matrix Solution (AMS)
• Signal attenuation
through gas dilution
• Over 100x dilution
• Predictable response
across mass range
http://www.perkinelmer.com/CMSResources/Images/44-175832PRD_NexION-AMS-Systems-Product-Note-
012394_01.pdf
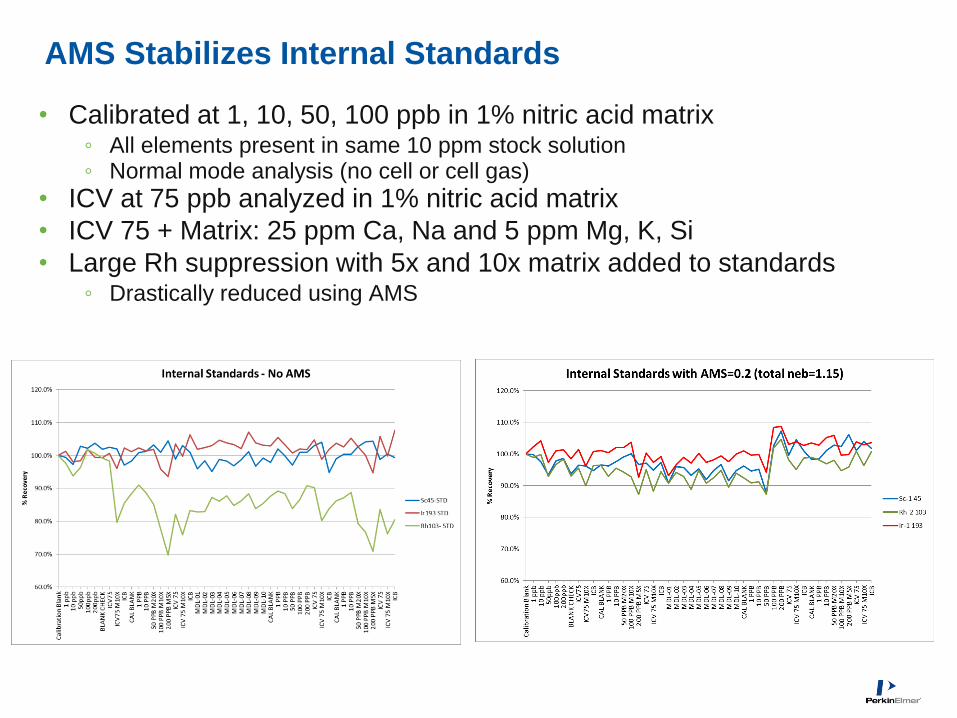
AMS Stabilizes Internal Standards
• Calibrated at 1, 10, 50, 100 ppb in 1% nitric acid matrix ◦ All elements present in same 10 ppm stock solution ◦ Normal mode analysis (no cell or cell gas)
• ICV at 75 ppb analyzed in 1% nitric acid matrix
• ICV 75 + Matrix: 25 ppm Ca, Na and 5 ppm Mg, K, Si
• Large Rh suppression with 5x and 10x matrix added to standards ◦ Drastically reduced using AMS
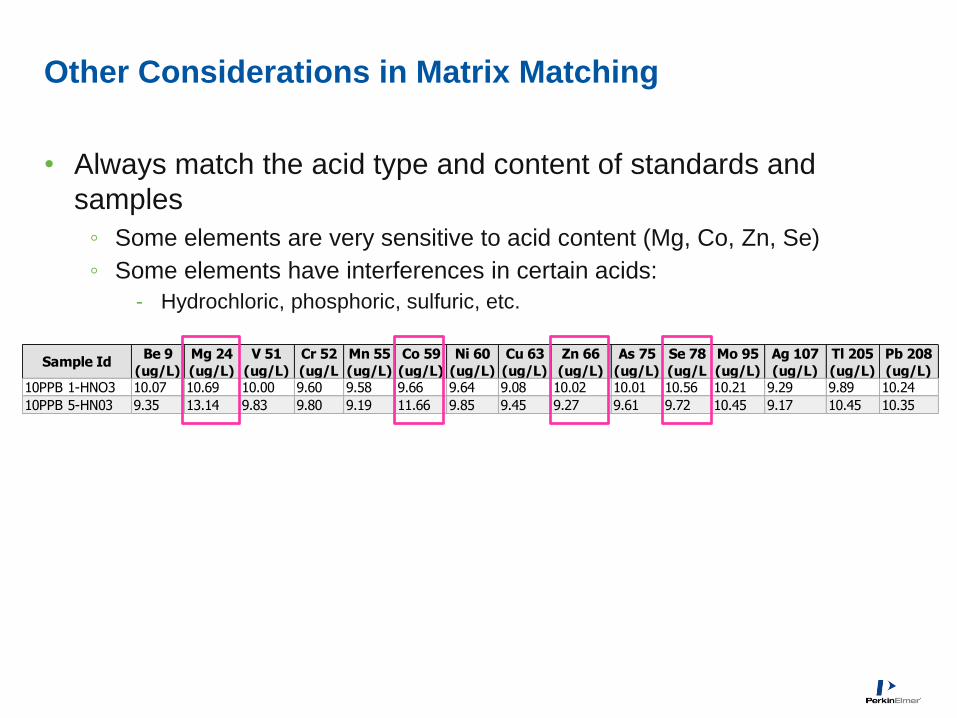
Other Considerations in Matrix Matching
• Always match the acid type and content of standards and
samples
◦ Some elements are very sensitive to acid content (Mg, Co, Zn, Se)
◦ Some elements have interferences in certain acids:
- Hydrochloric, phosphoric, sulfuric, etc.
Sample IdBe 9
(ug/L)
Mg 24
(ug/L)
V 51
(ug/L)
Cr 52
(ug/L
Mn 55
(ug/L)
Co 59
(ug/L)
Ni 60
(ug/L)
Cu 63
(ug/L)
Zn 66
(ug/L)
As 75
(ug/L)
Se 78
(ug/L
Mo 95
(ug/L)
Ag 107
(ug/L)
Tl 205
(ug/L)
Pb 208
(ug/L)10PPB 1-HNO3 10.07 10.69 10.00 9.60 9.58 9.66 9.64 9.08 10.02 10.01 10.56 10.21 9.29 9.89 10.24
10PPB 5-HN03 9.35 13.14 9.83 9.80 9.19 11.66 9.85 9.45 9.27 9.61 9.72 10.45 9.17 10.45 10.35
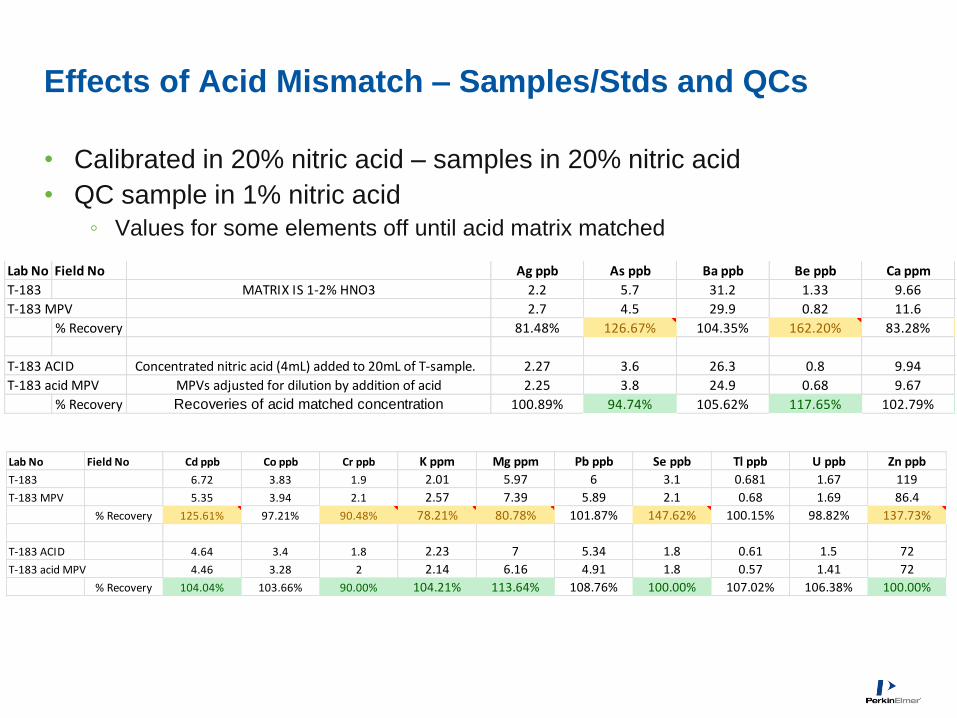
Effects of Acid Mismatch – Samples/Stds and QCs
• Calibrated in 20% nitric acid – samples in 20% nitric acid
• QC sample in 1% nitric acid
◦ Values for some elements off until acid matrix matched
Lab No Field No Ag ppb As ppb Ba ppb Be ppb Ca ppm
T-183 MATRIX IS 1-2% HNO3 2.2 5.7 31.2 1.33 9.66
T-183 MPV 2.7 4.5 29.9 0.82 11.6
% Recovery 81.48% 126.67% 104.35% 162.20% 83.28%
T-183 ACID Concentrated nitric acid (4mL) added to 20mL of T-sample. 2.27 3.6 26.3 0.8 9.94
T-183 acid MPV MPVs adjusted for dilution by addition of acid 2.25 3.8 24.9 0.68 9.67
% Recovery Recoveries of acid matched concentration 100.89% 94.74% 105.62% 117.65% 102.79%
Lab No Field No Cd ppb Co ppb Cr ppb K ppm Mg ppm Pb ppb Se ppb Tl ppb U ppb Zn ppb
T-183 6.72 3.83 1.9 2.01 5.97 6 3.1 0.681 1.67 119
T-183 MPV 5.35 3.94 2.1 2.57 7.39 5.89 2.1 0.68 1.69 86.4
% Recovery 125.61% 97.21% 90.48% 78.21% 80.78% 101.87% 147.62% 100.15% 98.82% 137.73%
T-183 ACID 4.64 3.4 1.8 2.23 7 5.34 1.8 0.61 1.5 72
T-183 acid MPV 4.46 3.28 2 2.14 6.16 4.91 1.8 0.57 1.41 72
% Recovery 104.04% 103.66% 90.00% 104.21% 113.64% 108.76% 100.00% 107.02% 106.38% 100.00%

Other Effects to Be Aware Of…
• Switching acid concentrations between samples and washes may have lingering effects on sensitivities
• May need to test stabilization times in plasma
◦ Can be minutes!!
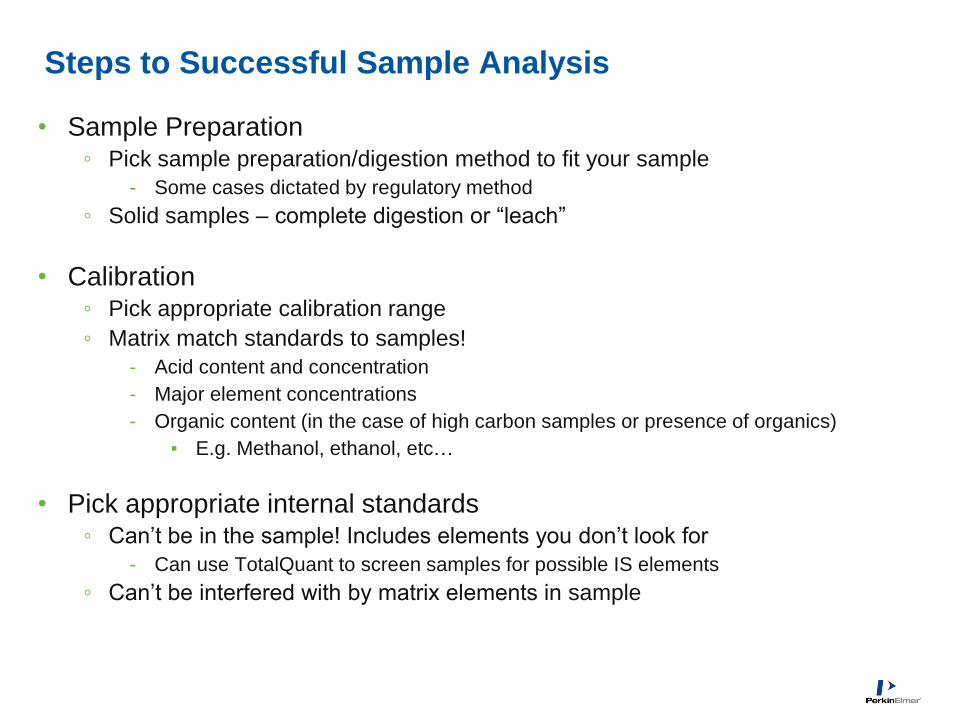
Steps to Successful Sample Analysis
• Sample Preparation ◦ Pick sample preparation/digestion method to fit your sample
- Some cases dictated by regulatory method
◦ Solid samples – complete digestion or “leach”
• Calibration ◦ Pick appropriate calibration range
◦ Matrix match standards to samples!
- Acid content and concentration
- Major element concentrations
- Organic content (in the case of high carbon samples or presence of organics)
▪ E.g. Methanol, ethanol, etc…
• Pick appropriate internal standards ◦ Can’t be in the sample! Includes elements you don’t look for
- Can use TotalQuant to screen samples for possible IS elements
◦ Can’t be interfered with by matrix elements in sample

Final Thoughts….
• Seeing weird effects/results on certain samples for certain elements isn’t generally the result of an instrument (mass spectrometer) problem!
◦ Remember the detector on the mass spectrometer is NOT element specific
• If some result is different than expected it is generally because something changed BEFORE the mass spectrometer and/or detector
• Examine ALL the RAW data… what trends do you see in intensity counts for your samples, internal standards
◦ Look at RSD’s - High RSD’s indicate stability issue somewhere…
• 95% of all issues in ICP/ICP-MS occur in the sample introduction system!
◦ All these interference effects apply to ICP-OES as well – Axial View in particular!