Embed Size (px)
Citation preview
©2013 Mattel, Inc. All Rights Reserved
J A N U A R Y 3 1 , 2 0 1 4
BRYAN S TO CKTO N – CHAI RM AN AND CE O KE V I N FARR – CF O
Mattel, Inc. Earnings Conference Call
Fourth Quarter and Full Year 2013 (Unaudited Results)
2 ©2013 Mattel, Inc. All Rights Reserved
Mattel
FORWARD-LOOKING STATEMENTS: This presentation includes forward-looking statements relating to the future performance of our overall business, brands and product lines. These statements are based on currently available operating, financial, economic and other information and they are subject to a number of significant risks and uncertainties which could cause our actual results to differ materially from those projected in the forward-looking statements. We describe some of these uncertainties in the Risk Factors section of our 2012 Annual Report on Form 10-K, in our 2013 quarterly reports on Form 10-Q and in other filings we make with the SEC from time to time, as well as in other public statements. Mattel does not update forward-looking statements and expressly disclaims any obligation to do so.
REGULATION G: Information required by Securities and Exchange Commission Regulation G, regarding non-GAAP financial measures, as well as other financial and statistical information, will be available at the time of the conference call on the “Investors & Media” section of http://corporate.mattel.com/, under the subheading “Financial Information” – “Earnings Releases.”
3 ©2013 Mattel, Inc. All Rights Reserved
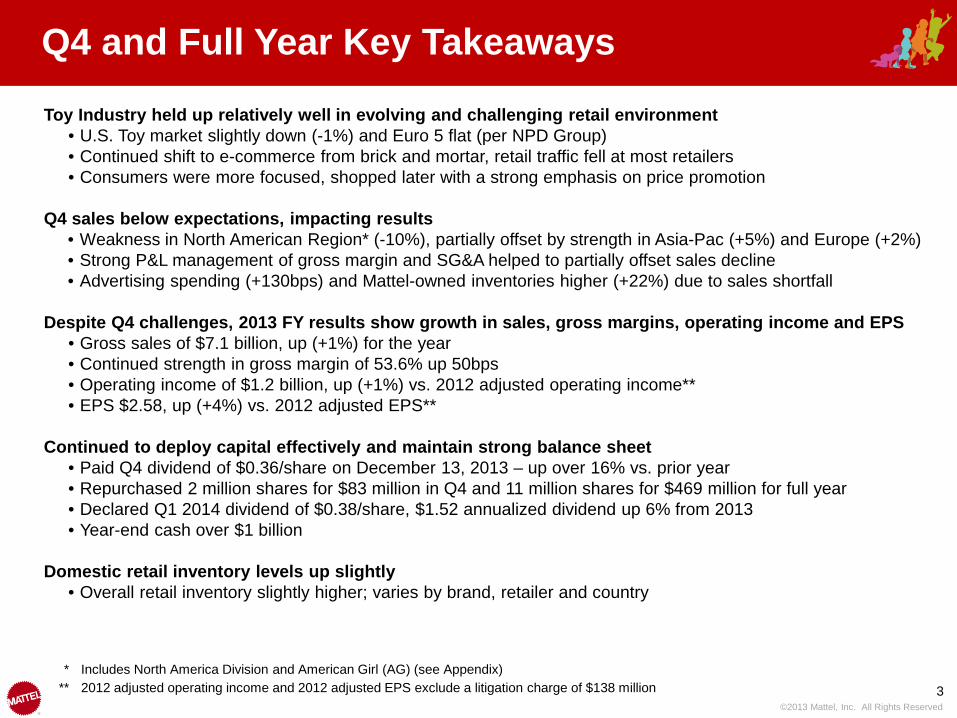
* Includes North America Division and American Girl (AG) (see Appendix) ** 2012 adjusted operating income and 2012 adjusted EPS exclude a litigation charge of $138 million
Toy Industry held up relatively well in evolving and challenging retail environment • U.S. Toy market slightly down (-1%) and Euro 5 flat (per NPD Group) • Continued shift to e-commerce from brick and mortar, retail traffic fell at most retailers • Consumers were more focused, shopped later with a strong emphasis on price promotion
Q4 sales below expectations, impacting results
• Weakness in North American Region* (-10%), partially offset by strength in Asia-Pac (+5%) and Europe (+2%) • Strong P&L management of gross margin and SG&A helped to partially offset sales decline • Advertising spending (+130bps) and Mattel-owned inventories higher (+22%) due to sales shortfall
Despite Q4 challenges, 2013 FY results show growth in sales, gross margins, operating income and EPS
• Gross sales of $7.1 billion, up (+1%) for the year • Continued strength in gross margin of 53.6% up 50bps • Operating income of $1.2 billion, up (+1%) vs. 2012 adjusted operating income** • EPS $2.58, up (+4%) vs. 2012 adjusted EPS**
Continued to deploy capital effectively and maintain strong balance sheet
• Paid Q4 dividend of $0.36/share on December 13, 2013 – up over 16% vs. prior year • Repurchased 2 million shares for $83 million in Q4 and 11 million shares for $469 million for full year • Declared Q1 2014 dividend of $0.38/share, $1.52 annualized dividend up 6% from 2013 • Year-end cash over $1 billion
Domestic retail inventory levels up slightly
• Overall retail inventory slightly higher; varies by brand, retailer and country
Q4 and Full Year Key Takeaways
4 ©2013 Mattel, Inc. All Rights Reserved
2013 2012
2,495 2,349
2013 2012
7,053 7,118 7,1187,0536,8416,3875,934
2011 2010 2009 2013 2012
Worldwide Gross Sales
* Includes North America Division and American Girl (see Appendix) ** Includes International Division (see Appendix)
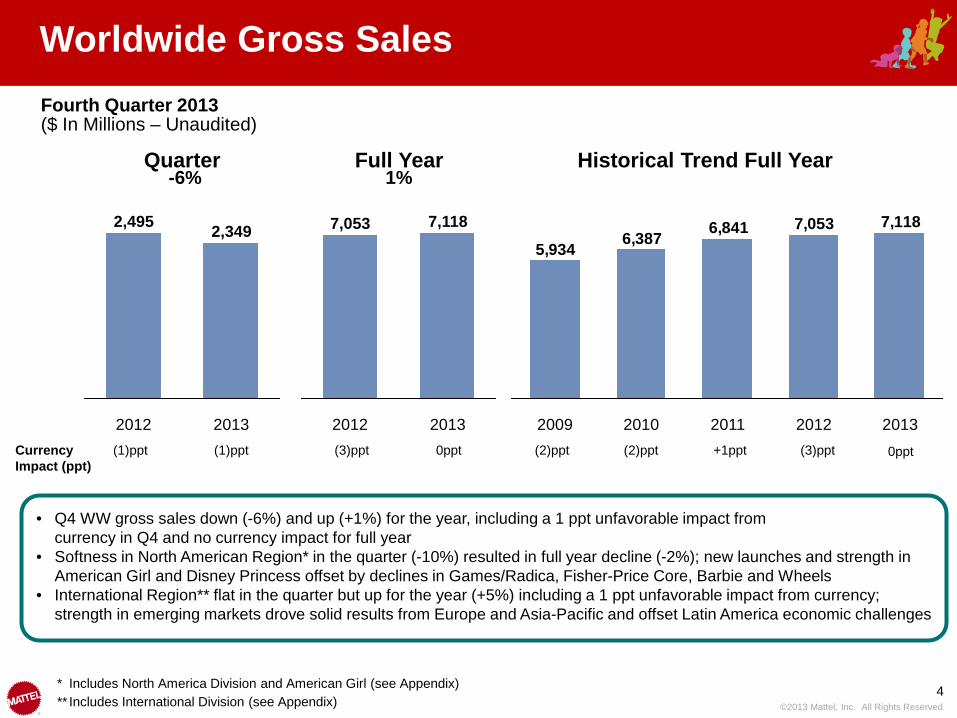
Fourth Quarter 2013 ($ In Millions – Unaudited)
• Q4 WW gross sales down (-6%) and up (+1%) for the year, including a 1 ppt unfavorable impact from currency in Q4 and no currency impact for full year
• Softness in North American Region* in the quarter (-10%) resulted in full year decline (-2%); new launches and strength in American Girl and Disney Princess offset by declines in Games/Radica, Fisher-Price Core, Barbie and Wheels
• International Region** flat in the quarter but up for the year (+5%) including a 1 ppt unfavorable impact from currency; strength in emerging markets drove solid results from Europe and Asia-Pacific and offset Latin America economic challenges
Quarter Full Year Historical Trend Full Year
Currency Impact (ppt)
(1)ppt (3)ppt 0ppt 0ppt (2)ppt (2)ppt +1ppt
-6% 1%
(3)ppt (1)ppt
5 ©2013 Mattel, Inc. All Rights Reserved
FY
Q4
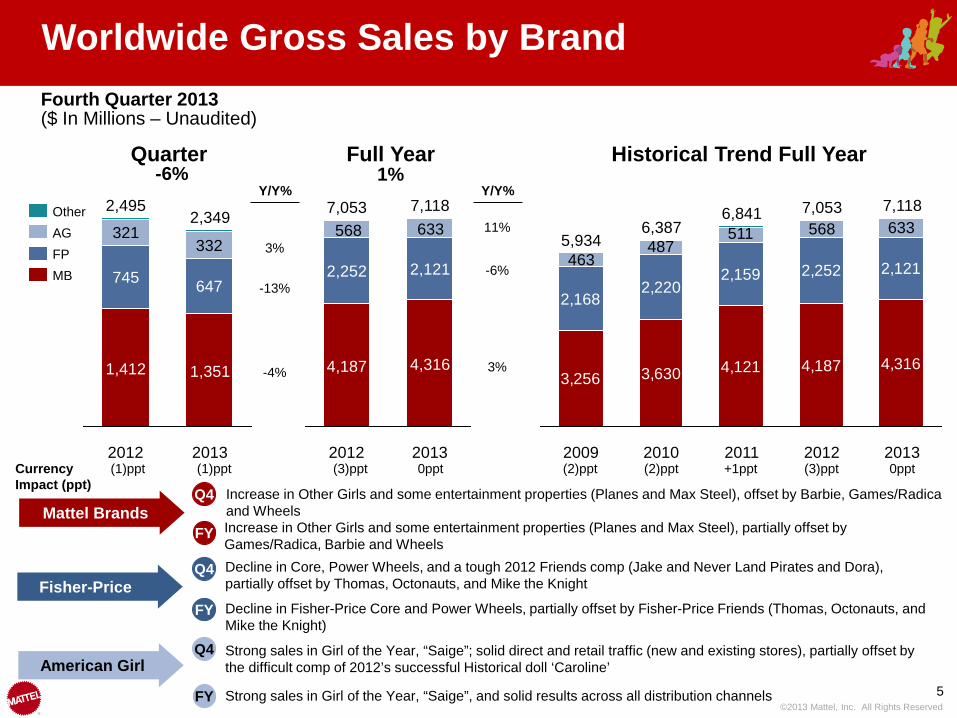
Worldwide Gross Sales by Brand Fourth Quarter 2013 ($ In Millions – Unaudited)
Currency Impact (ppt)
Quarter -6%
(1)ppt (1)ppt (3)ppt 0ppt
Historical Trend Full Year
0ppt (2)ppt (2)ppt +1ppt (3)ppt
Full Year Y/Y%
-13%
-4%
1%
647745
332321
2013
2,349
1,351
2012
2,495
1,412
MB FP AG Other
2013
7,118
4,316
2,121
2012
7,053
4,187
2,252
Y/Y%
11%
-6%
3% 3,256 3,630 4,121 4,187
2,1682,220
2,159 2,252
4,316
2,121
6337,118
6,387
2011
6,841 7,053
2013 2010 2009
5,934
2012
Increase in Other Girls and some entertainment properties (Planes and Max Steel), offset by Barbie, Games/Radica and Wheels Mattel Brands
Fisher-Price
Strong sales in Girl of the Year, “Saige”; solid direct and retail traffic (new and existing stores), partially offset by the difficult comp of 2012’s successful Historical doll ‘Caroline’ American Girl
3%
Q4
FY
568 633
463 487
511 568
Increase in Other Girls and some entertainment properties (Planes and Max Steel), partially offset by Games/Radica, Barbie and Wheels
Decline in Fisher-Price Core and Power Wheels, partially offset by Fisher-Price Friends (Thomas, Octonauts, and Mike the Knight)
Strong sales in Girl of the Year, “Saige”, and solid results across all distribution channels
Q4
FY
Decline in Core, Power Wheels, and a tough 2012 Friends comp (Jake and Never Land Pirates and Dora), partially offset by Thomas, Octonauts, and Mike the Knight
6 ©2013 Mattel, Inc. All Rights Reserved
1,8651,904
1,2991,409
6335683,840
2013 2012
3,927
0ppt
North American Region Gross Sales by Brand
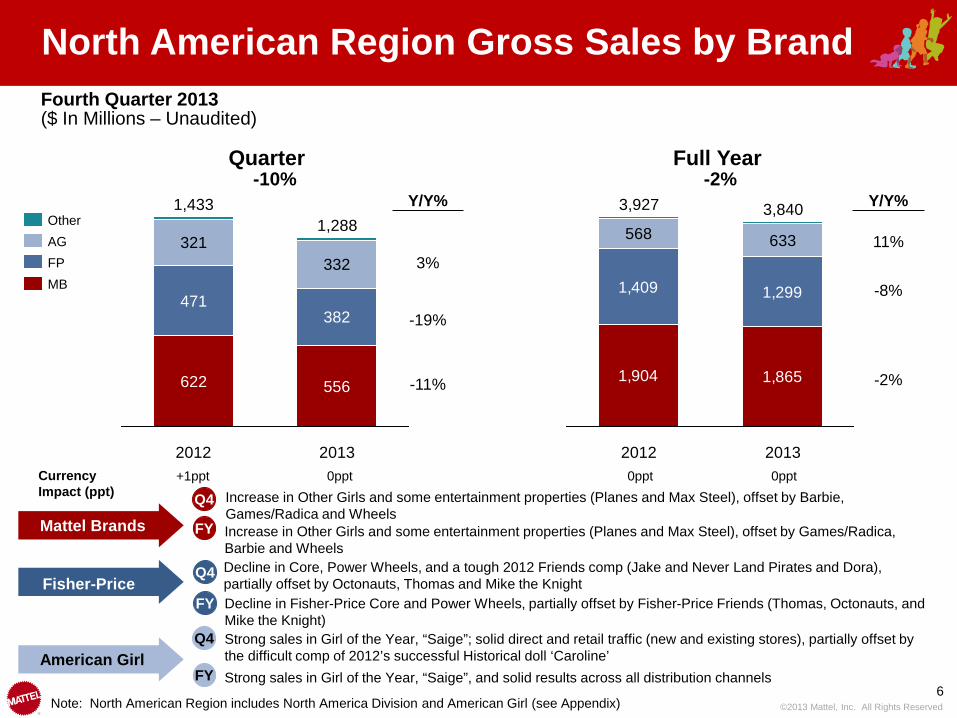
Note: North American Region includes North America Division and American Girl (see Appendix)
Fourth Quarter 2013 ($ In Millions – Unaudited)
Currency Impact (ppt)
+1ppt 0ppt
Y/Y%
-19%
-11%
0ppt
3%
Quarter Full Year -10% -2%
Mattel Brands
Increase in Other Girls and some entertainment properties (Planes and Max Steel), offset by Barbie, Games/Radica and Wheels
Fisher-Price
American Girl Strong sales in Girl of the Year, “Saige”; solid direct and retail traffic (new and existing stores), partially offset by the difficult comp of 2012’s successful Historical doll ‘Caroline’
556622
382471
332321
2013 2012
1,433 1,288
MB
AG FP
Other Y/Y%
-8%
-2%
11%
Decline in Core, Power Wheels, and a tough 2012 Friends comp (Jake and Never Land Pirates and Dora), partially offset by Octonauts, Thomas and Mike the Knight
Strong sales in Girl of the Year, “Saige”, and solid results across all distribution channels
Increase in Other Girls and some entertainment properties (Planes and Max Steel), offset by Games/Radica, Barbie and Wheels
Decline in Fisher-Price Core and Power Wheels, partially offset by Fisher-Price Friends (Thomas, Octonauts, and Mike the Knight)
FY
Q4
Q4
FY
Q4
FY
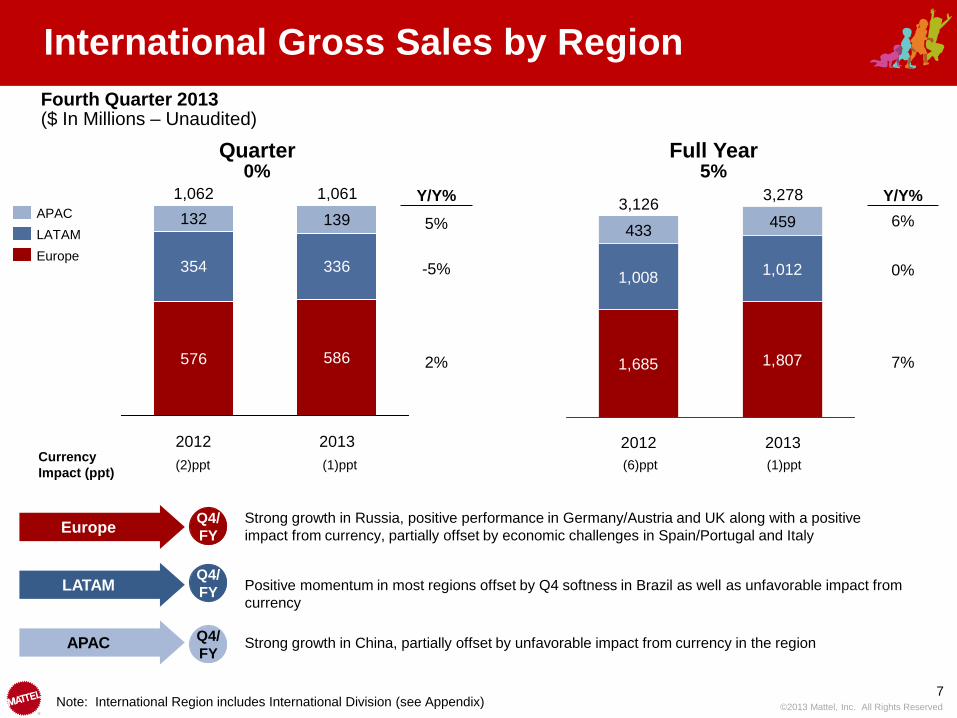
7 ©2013 Mattel, Inc. All Rights Reserved Note: International Region includes International Division (see Appendix)
Fourth Quarter 2013 ($ In Millions – Unaudited)
Quarter Full Year 0% 5%
International Gross Sales by Region
586576
336354
1391321,061
2013 2012
1,062
Europe LATAM APAC
1,685 1,807
1,008 1,012
433 459
3,278 3,126
2012 2013 (1)ppt Currency
Impact (ppt) (2)ppt (1)ppt
Y/Y%
-5%
2%
(6)ppt
5%
Y/Y%
0%
7%
6%
Strong growth in Russia, positive performance in Germany/Austria and UK along with a positive impact from currency, partially offset by economic challenges in Spain/Portugal and Italy Europe
Positive momentum in most regions offset by Q4 softness in Brazil as well as unfavorable impact from currency
LATAM
Strong growth in China, partially offset by unfavorable impact from currency in the region APAC Q4/ FY
Q4/ FY
Q4/ FY
8 ©2013 Mattel, Inc. All Rights Reserved
Q4 2013 Drivers
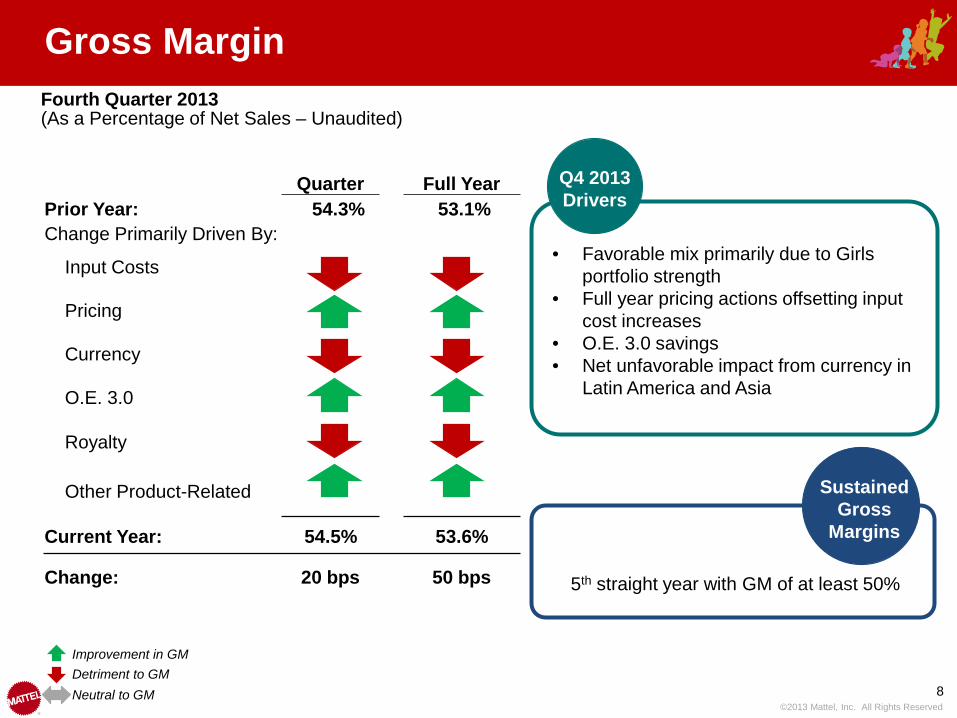
Gross Margin Fourth Quarter 2013 (As a Percentage of Net Sales – Unaudited)
Quarter Full Year Prior Year: 54.3% 53.1% Change Primarily Driven By:
Input Costs
Pricing
Currency
O.E. 3.0
Royalty
Other Product-Related
Current Year: 54.5% 53.6%
Change: 20 bps 50 bps
Improvement in GM Detriment to GM Neutral to GM
• Favorable mix primarily due to Girls portfolio strength
• Full year pricing actions offsetting input cost increases
• O.E. 3.0 savings • Net unfavorable impact from currency in
Latin America and Asia
5th straight year with GM of at least 50%
Sustained Gross
Margins
9 ©2013 Mattel, Inc. All Rights Reserved
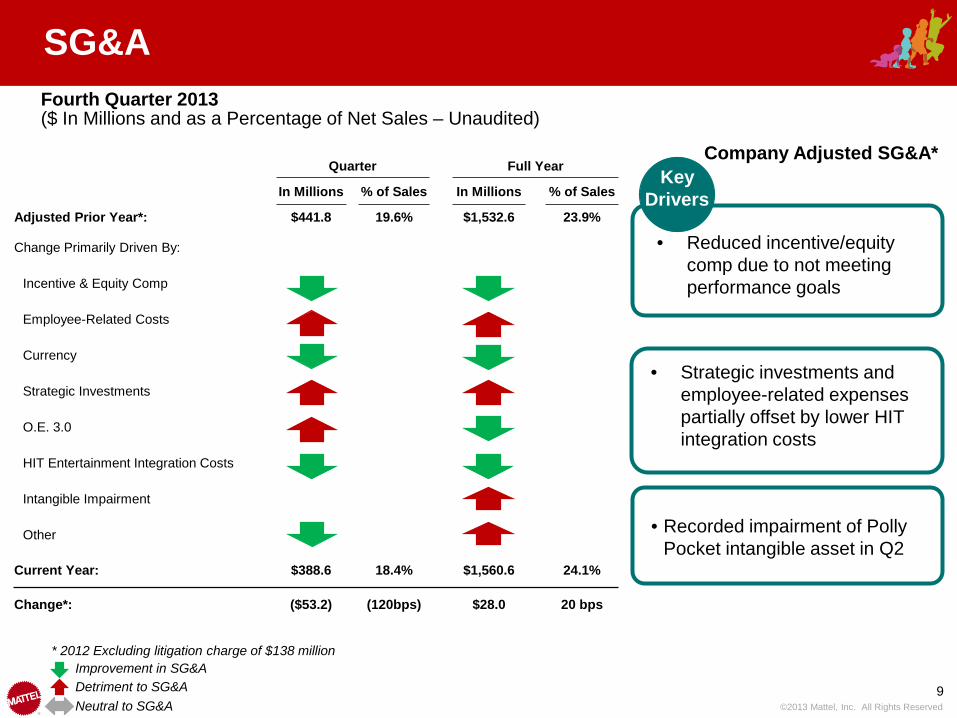
Quarter Full Year
In Millions % of Sales In Millions % of Sales
Adjusted Prior Year*: $441.8 19.6% $1,532.6 23.9%
Change Primarily Driven By:
Incentive & Equity Comp
Employee-Related Costs
Currency
Strategic Investments
O.E. 3.0
HIT Entertainment Integration Costs
Intangible Impairment
Other
Current Year: $388.6 18.4% $1,560.6 24.1%
Change*: ($53.2) (120bps) $28.0 20 bps
SG&A Fourth Quarter 2013 ($ In Millions and as a Percentage of Net Sales – Unaudited)
• Recorded impairment of Polly Pocket intangible asset in Q2
• Strategic investments and employee-related expenses partially offset by lower HIT integration costs
Improvement in SG&A Detriment to SG&A Neutral to SG&A
• Reduced incentive/equity comp due to not meeting performance goals
Company Adjusted SG&A*
* 2012 Excluding litigation charge of $138 million
Key Drivers
10 ©2013 Mattel, Inc. All Rights Reserved
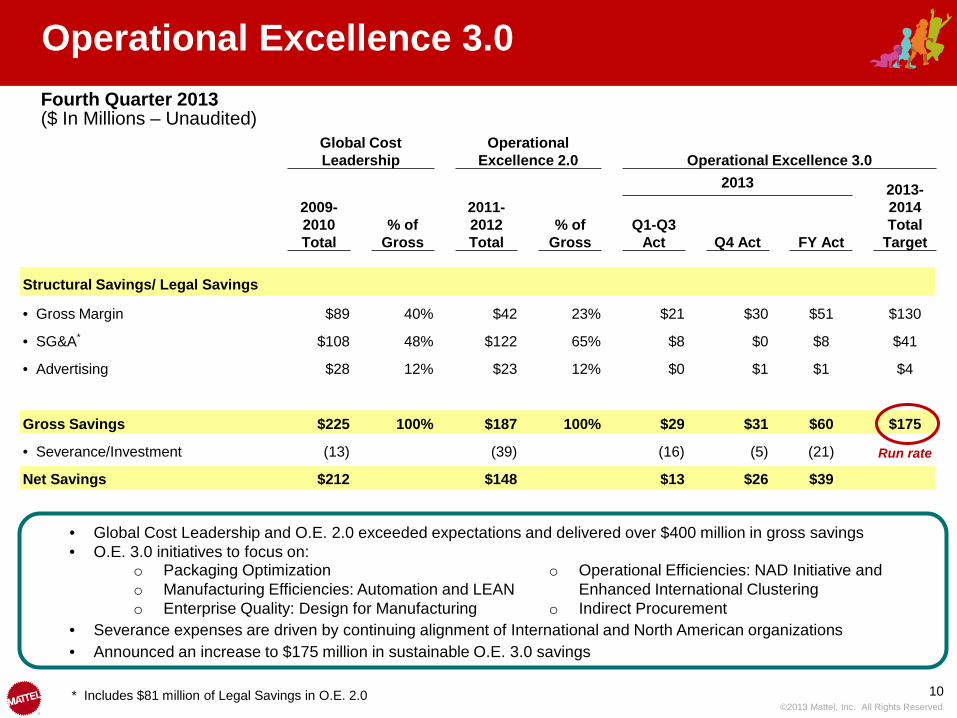
Operational Excellence 3.0 Fourth Quarter 2013 ($ In Millions – Unaudited)
• Global Cost Leadership and O.E. 2.0 exceeded expectations and delivered over $400 million in gross savings • O.E. 3.0 initiatives to focus on:
Run rate
o Packaging Optimization o Manufacturing Efficiencies: Automation and LEAN o Enterprise Quality: Design for Manufacturing
o Operational Efficiencies: NAD Initiative and Enhanced International Clustering
o Indirect Procurement
* Includes $81 million of Legal Savings in O.E. 2.0
Global Cost Leadership
Operational Excellence 2.0 Operational Excellence 3.0
2013 2013-2014 Total
Target
2009-2010 Total
% of Gross
2011-2012 Total
% of Gross
Q1-Q3 Act Q4 Act FY Act
Structural Savings/ Legal Savings
• Gross Margin $89 40% $42 23% $21 $30 $51 $130
• SG&A* $108 48% $122 65% $8 $0 $8 $41
• Advertising $28 12% $23 12% $0 $1 $1 $4
Gross Savings $225 100% $187 100% $29 $31 $60 $175
• Severance/Investment (13) (39) (16) (5) (21)
Net Savings $212 $148 $13 $26 $39
• Severance expenses are driven by continuing alignment of International and North American organizations • Announced an increase to $175 million in sustainable O.E. 3.0 savings
11 ©2013 Mattel, Inc. All Rights Reserved
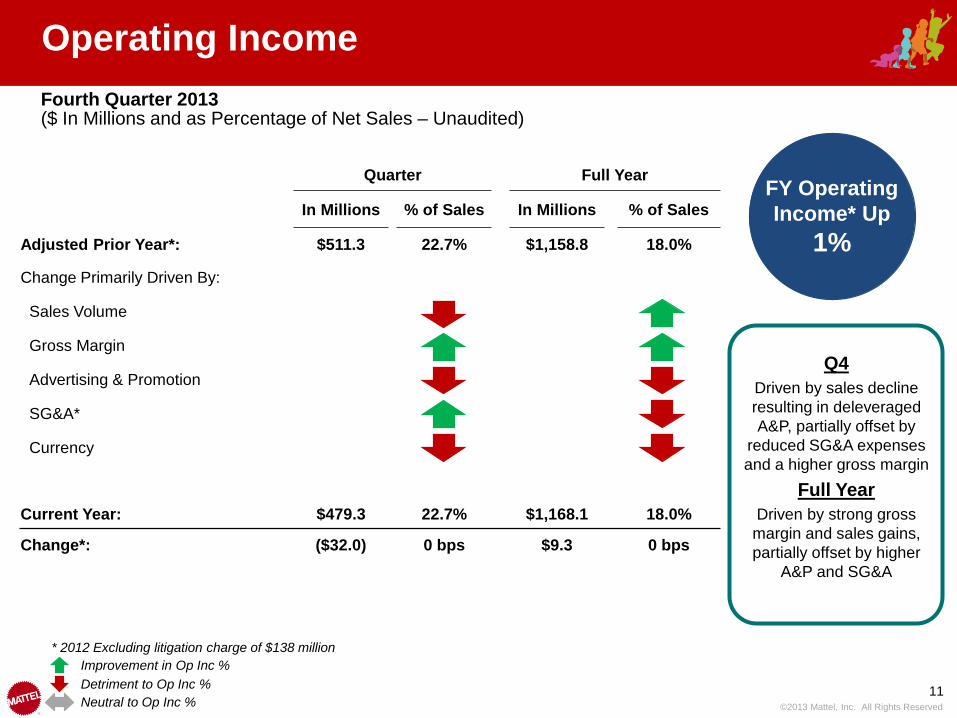
Operating Income
Improvement in Op Inc %
Neutral to Op Inc % Detriment to Op Inc %
Q4 Driven by sales decline resulting in deleveraged A&P, partially offset by
reduced SG&A expenses and a higher gross margin
Full Year Driven by strong gross margin and sales gains, partially offset by higher
A&P and SG&A
FY Operating Income* Up
1%
Quarter Full Year
In Millions % of Sales In Millions % of Sales
Adjusted Prior Year*: $511.3 22.7% $1,158.8 18.0%
Change Primarily Driven By:
Sales Volume
Gross Margin
Advertising & Promotion
SG&A*
Currency
Current Year: $479.3 22.7% $1,168.1 18.0%
Change*: ($32.0) 0 bps $9.3 0 bps
Fourth Quarter 2013 ($ In Millions and as Percentage of Net Sales – Unaudited)
* 2012 Excluding litigation charge of $138 million
12 ©2013 Mattel, Inc. All Rights Reserved
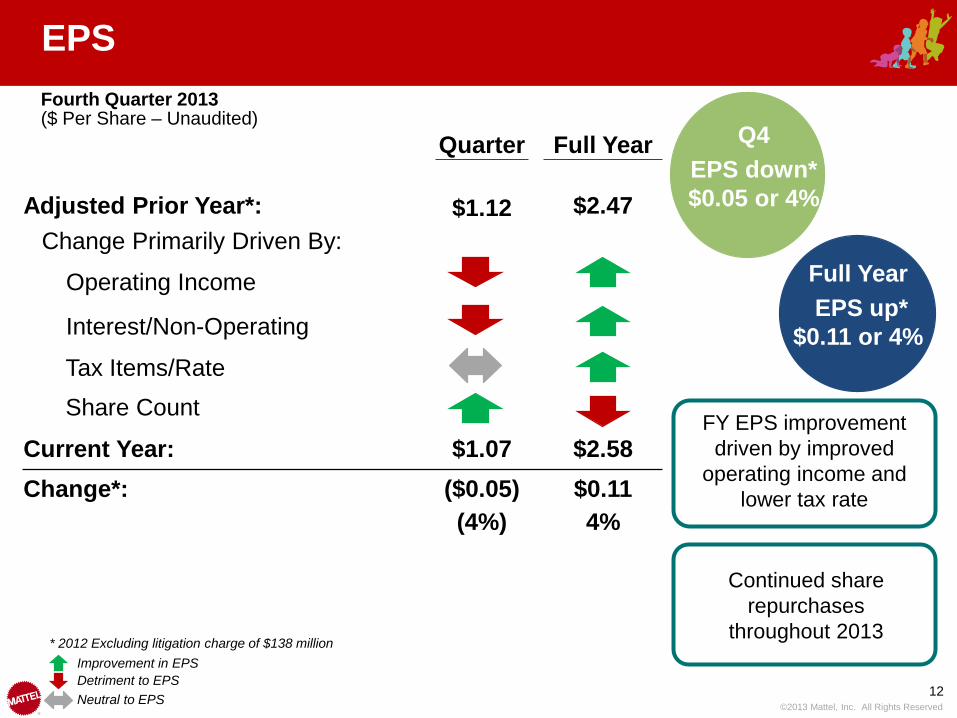
Quarter Full Year Adjusted Prior Year*:
$1.12
$2.47
Change Primarily Driven By:
Operating Income
Interest/Non-Operating
Tax Items/Rate Share Count
Current Year: $1.07 $2.58 Change*: ($0.05) $0.11
(4%) 4%
EPS Fourth Quarter 2013 ($ Per Share – Unaudited)
Improvement in EPS
Neutral to EPS Detriment to EPS
Q4 EPS down* $0.05 or 4%
FY EPS improvement driven by improved
operating income and lower tax rate
Full Year EPS up*
$0.11 or 4%
Continued share repurchases
throughout 2013 * 2012 Excluding litigation charge of $138 million
13 ©2013 Mattel, Inc. All Rights Reserved
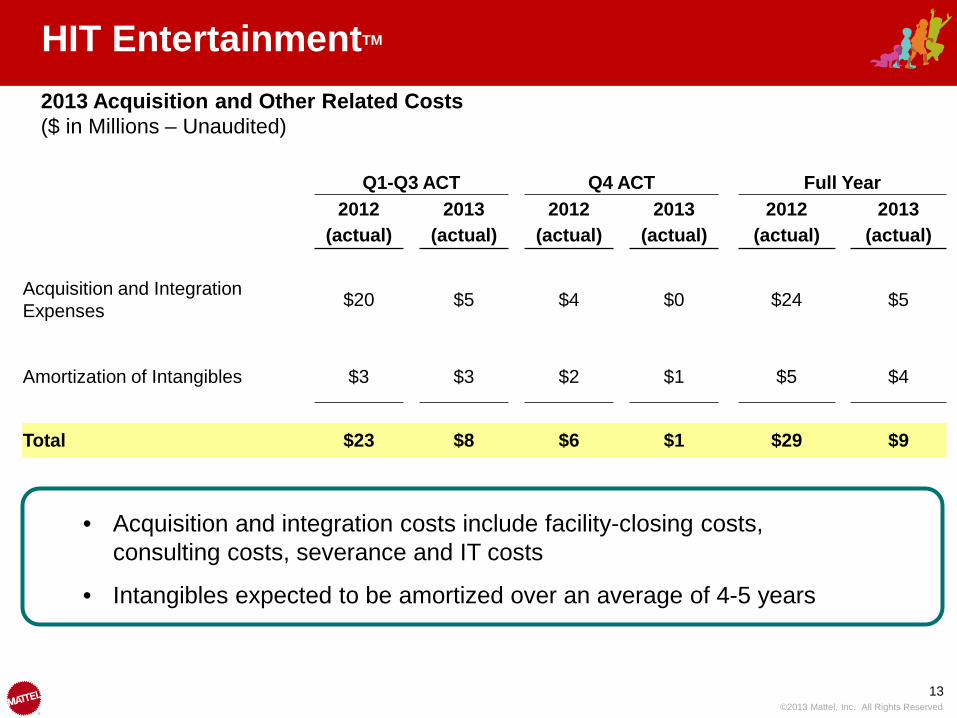
HIT EntertainmentTM
2013 Acquisition and Other Related Costs ($ in Millions – Unaudited)
• Acquisition and integration costs include facility-closing costs, consulting costs, severance and IT costs
• Intangibles expected to be amortized over an average of 4-5 years
Q1-Q3 ACT Q4 ACT Full Year 2012
2013 2012
2013 2012
2013
(actual) (actual) (actual) (actual) (actual) (actual)
Acquisition and Integration Expenses $20 $5 $4 $0 $24 $5
Amortization of Intangibles $3 $3 $2 $1 $5 $4
Total $23 $8 $6 $1 $29 $9
14 ©2013 Mattel, Inc. All Rights Reserved
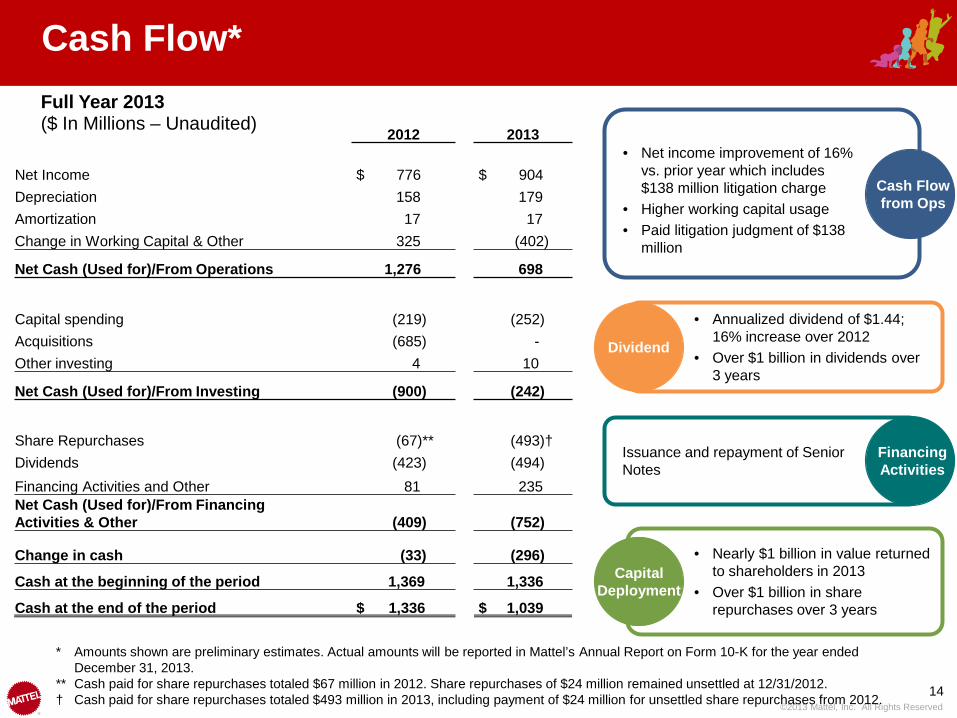
Cash Flow* Full Year 2013 ($ In Millions – Unaudited)
* Amounts shown are preliminary estimates. Actual amounts will be reported in Mattel’s Annual Report on Form 10-K for the year ended December 31, 2013.
** Cash paid for share repurchases totaled $67 million in 2012. Share repurchases of $24 million remained unsettled at 12/31/2012. † Cash paid for share repurchases totaled $493 million in 2013, including payment of $24 million for unsettled share repurchases from 2012.
2012 2013
Net Income $ 776 $ 904 Depreciation 158 179 Amortization 17 17 Change in Working Capital & Other 325 (402)
Net Cash (Used for)/From Operations 1,276 698
Capital spending (219) (252) Acquisitions (685) - Other investing 4 10
Net Cash (Used for)/From Investing (900) (242)
Share Repurchases (67)** (493)† Dividends (423) (494) Financing Activities and Other 81 235 Net Cash (Used for)/From Financing Activities & Other (409) (752)
Change in cash (33) (296)
Cash at the beginning of the period 1,369 1,336
Cash at the end of the period $ 1,336 $ 1,039
Dividend
• Annualized dividend of $1.44; 16% increase over 2012
• Over $1 billion in dividends over 3 years
Financing Activities
Issuance and repayment of Senior Notes
Capital Deployment
• Nearly $1 billion in value returned to shareholders in 2013
• Over $1 billion in share repurchases over 3 years
• Net income improvement of 16% vs. prior year which includes $138 million litigation charge
• Higher working capital usage • Paid litigation judgment of $138
million
Cash Flow from Ops
15 ©2013 Mattel, Inc. All Rights Reserved
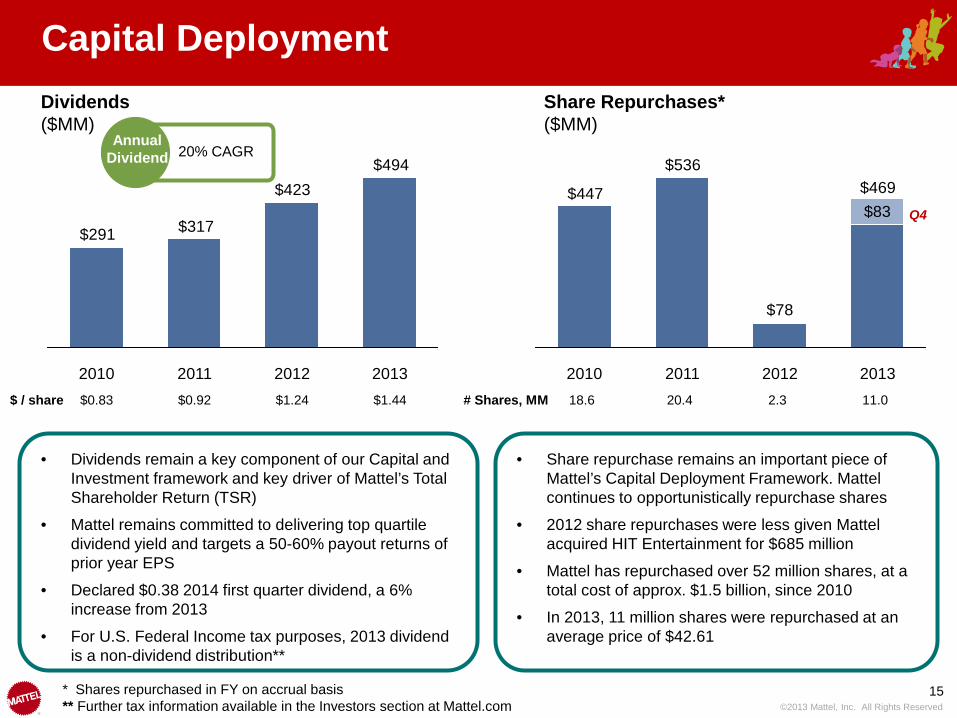
Capital Deployment
$494$423
$317$291
2013 2012 2011 2010
$78
$536
$447$83
2013
$469
2012 2011 2010
Dividends ($MM)
Share Repurchases* ($MM)
• Dividends remain a key component of our Capital and Investment framework and key driver of Mattel’s Total Shareholder Return (TSR)
• Mattel remains committed to delivering top quartile dividend yield and targets a 50-60% payout returns of prior year EPS
• Declared $0.38 2014 first quarter dividend, a 6% increase from 2013
• For U.S. Federal Income tax purposes, 2013 dividend is a non-dividend distribution**
• Share repurchase remains an important piece of Mattel’s Capital Deployment Framework. Mattel continues to opportunistically repurchase shares
• 2012 share repurchases were less given Mattel acquired HIT Entertainment for $685 million
• Mattel has repurchased over 52 million shares, at a total cost of approx. $1.5 billion, since 2010
• In 2013, 11 million shares were repurchased at an average price of $42.61
Q4
* Shares repurchased in FY on accrual basis ** Further tax information available in the Investors section at Mattel.com
$ / share $0.83 $0.92 $1.24 $1.44 # Shares, MM 18.6 20.4 2.3 11.0
Annual Dividend 20% CAGR
16 ©2013 Mattel, Inc. All Rights Reserved
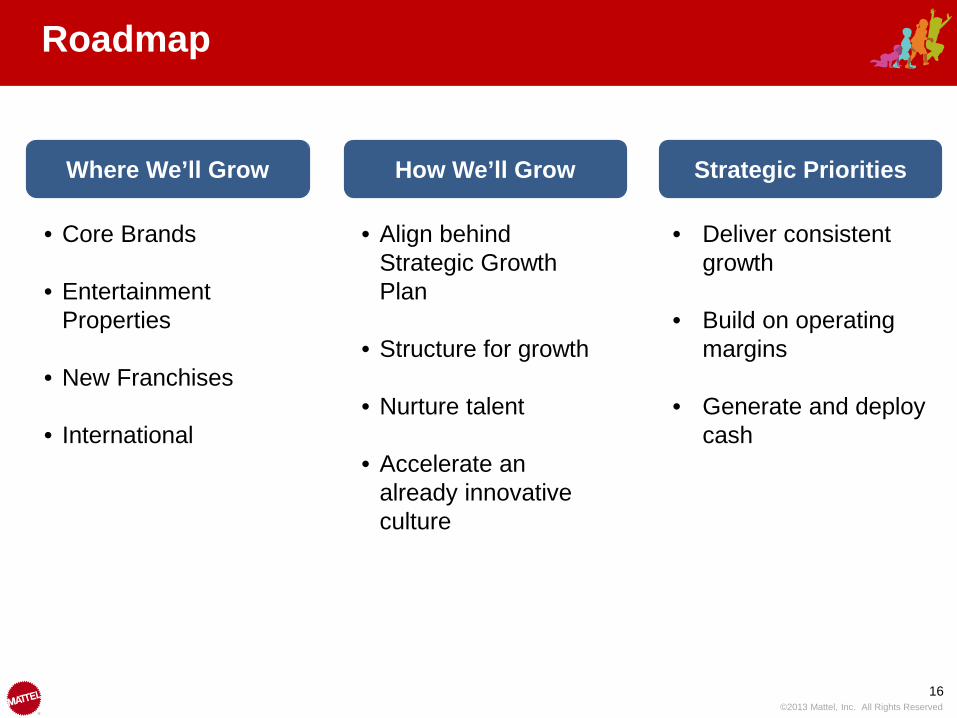
Roadmap
• Core Brands
• Entertainment Properties
• New Franchises
• International
• Align behind Strategic Growth Plan
• Structure for growth
• Nurture talent
• Accelerate an already innovative culture
• Deliver consistent growth
• Build on operating margins
• Generate and deploy cash
Where We’ll Grow How We’ll Grow Strategic Priorities
17
APPENDIX
18 ©2013 Mattel, Inc. All Rights Reserved
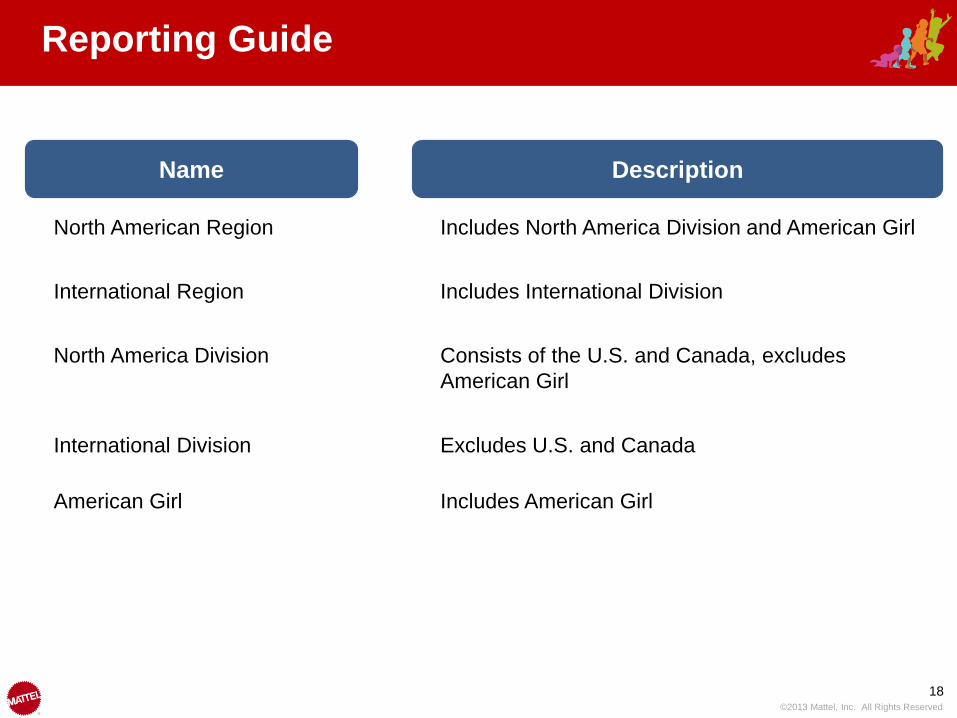
Reporting Guide
North American Region Includes North America Division and American Girl
International Region Includes International Division
North America Division Consists of the U.S. and Canada, excludes American Girl
International Division Excludes U.S. and Canada
Name Description
American Girl Includes American Girl
Mattel Confidential Information/May Include Trade Secrets Do Not Distribute ©2012 Mattel, Inc. All Rights Reserved 19