Embed Size (px)
Citation preview

Maximize Operator Effectiveness:
High Performance HMI Principles and Best Practices
Part 1 of 2
A PAS White PaperVersion 3.0
Bill HollifieldPrincipal Alarm Management and HMI Consultant, PAS
Hector PerezHMI Product Manager, PAS
High Performance HMI 3.0 - Part 1 | Cover© PAS Global, LLC 2017

Table of Contents
High Performance HMITM | Table of Contents© PAS Global, LLC 2017
Introduction and Overview ......................................................................................................................................................... 1
HMIs Past and Present ………………………………………………….................................................…....…………...................................... 3
Justification for HMI Improvement .......................................................................................................................................... 5
Proper Graphic Principles ........................................................................................................................................................... 6
Show Information Instead of Raw Data ................................................................................................................................. 7
Proper Use of Color ....................................................................................................................................................................... 9
Elements and Depictions of HPHMI ........................................................................................................................................ 10
Depicting Process Values ......................................................................................................................................................... 10
Depicting Alarms ......................................................................................................................................................................... 11
Depicting Profiles of Temperature or Pressure ................................................................................................................ 13
Depicting Dynamic Equipment .............................................................................................................................................. 13
Bars vs. Pointers .......................................................................................................................................................................... 14
Depicting Level Indication ....................................................................................................................................................... 14
Depicting Control Valves and Shutoff Valves ................................................................................................................... 14
Depicting Equipment Commands ........................................................................................................................................ 15
Use of Trends ................................................................................................................................................................................ 16
Depicting Tables .......................................................................................................................................................................... 16
Depicting Advanced Process Control (APC) .................................................................................................................... 17
Depicting Shutdown Activation ............................................................................................................................................ 17
Depicting Interlock Functionality ......................................................................................................................................... 18
Startup Map ................................................................................................................................................................................... 20
Navigation and Command Buttons ...................................................................................................................................... 20
Display Layout and Faceplate Handling ............................................................................................................................. 21
Avoiding “Blob” Graphics ......................................................................................................................................................... 23
Display Hierarchy ......................................................................................................................................................................... 23
Level 1 – Operation Overview ................................................................................................................................................. 24
Level 2 – Unit Control ................................................................................................................................................................ 25
Level 3 – Unit Detail .................................................................................................................................................................... 26
Level 4 –Support and Diagnostic Displays ........................................................................................................................ 26
Conclusion of the Part 1 Document ...................................................................................................................................... 27
About the Authors ...................................................................................................................................................................... 28
References ..................................................................................................................................................................................... 29

High Performance HMI 3.0 - Part 1 | Page 1© PAS Global, LLC 2017
Introduction and OverviewThe process control and automation industry has spent billions on improving process safety
via complex, instrumented systems. Yet, we continue to frequently see industrial incidents,
accidents, and fatalities in the news. The causes are generally not the failure of such automated
systems, but are instead the result of a wide variety of human errors. PAS firmly believes that
addressing the causes of human error and the improvement of Operator Effectiveness is of
the highest importance. The proper use of such technologies as High Performance HMI and
Alarm Management can actually save lives and prevent injuries. Detailed information on these
should not be withheld, and that is why we offer this and other white papers freely. They can
also significantly lessen process upsets, improve process efficiency, and increase productivity.
The human-machine interface (HMI) is the collection of screens, graphic displays, and other
technologies used by the operator to monitor and interact with the control system (typically
DCS or SCADA). Several major accidents, such as the Texas City refinery explosion in 2005,
have cited poor HMIs as a significant contributing factor. The design of the HMI plays a critical
role in determining the operator’s ability to effectively manage the operation, particularly in
quickly detecting and resolving an abnormal situation, which is the most important task of an
operator. A poor HMI can actively interfere with this ability.
For several reasons, the current designs and capabilities of most HMIs are far from optimal
for running the kinds of complex operations we have in industry. Most HMIs consist simply of
schematic or P&ID style graphics covered in numbers. Such displays provide the operator large
amounts of raw data, but almost no real information. They are difficult to interpret and provide
inadequate situation awareness to the operator.
Since we published The High Performance HMI Handbook in 2008, improving HMI has become
on of the hottest topics in the automation industry. In that book, we explained exactly why
most current HMI practices were poor, and we put forth the proper principles and details for
making graphics significantly better. Many companies have adopted those principles and have
completed migrations to improved graphics. Many more have such efforts currently underway.
This two-part paper provides a history, justification, and detailed plan of action for the
improvement of a process control HMI. Here is an overview of the contents.

High Performance HMI 3.0 - Part 1 | Page 2© PAS Global, LLC 2017
Part 1Examples: We provide typical examples of common but poor HMIs, along with highly
detailed depictions of improved methods that provide for much better operator situation
awareness and control.
Principles: We cover the most important aspect of High Performance HMI™ (HPHMI),
the display of information to the operator rather than raw data. Many other necessary
graphic principles including the correct way to use color are provided. Depictions of
detailed graphic elements are included.
Hierarchy: HPHMI graphic designs must reflect a proper hierarchy – the exposure of
additional detail as needed. We include examples of graphics that illustrate this hierarchy,
along with the work processes used to design such graphics.
If your facility utilizes a process control system with a computer-based HMI, you will find this
information useful. This white paper augments the detailed content in The High Performance
HMI Handbook.
Part 2 (Separate Document)Case Studies: Since the publication of our 2008 book, many projects have provided
for the development of real-world case studies. We include two such studies in this
paper. The first was conducted by the Electric Power Research Institute (EPRI), but is
applicable to all types of process operations. The second shows how a major company
has improved performance and significantly lowered costs via company-wide adoption
of standardized High Performance graphics. This has led to a major HPHMI product
innovation for the power industry: PowerGraphiX®.
We also provide an example as to how “out-of-the-box thinking” can address HMI issues,
in the discussion of a Pipeline System Overview Display.
Standards Review: Two standards documents available on HMI are discussed, including
the ISA-101 HMI Standard released in August 2015.
HPHMI Work Processes and Implementation Guidance: The work process for HMI
improvement is described. We also address the most common issues encountered in
HMI improvement, and cost effective ways to transition to High Performance graphics.

High Performance HMI 3.0 - Part 1 | Page 3© PAS Global, LLC 2017
HMIs Past and PresentBefore the advent of sophisticated digital control systems, the operator’s HMI usually consisted
of a control wall concept such as Figure 1.
The control wall had the advantages of
providing an overview of the entire operation,
key trends, and a limited number of well-defined
alarms. A trained operator could see the entire
operation almost at a glance. Spatial and
pattern recognition played an important role
in the operator’s ability to detect burgeoning
abnormal situations.
These systems had several disadvantages.
They were difficult to modify, the addition of
incremental capabilities was problematic, and
the ability to extract and analyze data from
them was almost non-existent. In the 1980s-1990s, the modern electronic control systems (DCS/
SCADA) replaced them for such reasons.
When the modern systems were introduced, they included the capability to create and display
graphics for aiding in the control of the operation. However, there were no guidelines available
as to how to create effective graphics. Early adopters created graphics that mimicked P&ID or
schematic drawings, primarily because they were readily available. The limited color palette was
used inconsistently, and screens
began to be little more than
crowded displays of numbers on
a P&ID.
Graphics such as Figures 2
and 3 were developed over 20
years ago and remain common
throughout the industry. Indeed,
inertia, not cost, is the primary
obstacle to the improvement of
HMIs. Engineers and operators
become accustomed to this style
of graphic, and are resistant to
change.
Figure 1: Example of a Control Wall
Figure 2: An Early Graphic Showing Many Problematic Practices

High Performance HMI 3.0 - Part 1 | Page 4© PAS Global, LLC 2017
As a result, industries that
use modern control systems
are now running multi-
million dollar operations
from primitive HMIs created
decades ago at a time that
little knowledge of proper
practices and principles was
available.
As control system hardware
progressed, the manufacturers
began to develop very flashy
example graphics which were
used for marketing purposes. While fit for that purpose, they were quite ineffective for actually
controlling a process. Many companies and projects, however, began to create graphics similar
to those examples. The results were displays that are actually suboptimal for operators.
To illustrate this point, Figure 4 is an example of flashy design taken from a power generation
facility. The graphic dedicates 90 percent of the screen space to the depiction of 3-D equipment,
vibrantly colored operation lines, cutaway views, and similar elements. However, the information
actually used by the operator consists of poorly depicted numerical data, which is scattered
around the graphic, and only makes up 10 percent of the available screen area.
There are no trends, condition
indicators, or key performance
elements. You cannot easily
tell from this graphic whether
the operation is running well
or poorly. That situation is true
for more than 90 percent of
the graphics used throughout
industry today because
they were not designed to
incorporate such information.
Instead, they simply display
dozens to hundreds of
raw numbers lacking any
informative context.
Figure 3: A Typical Crowded, P&ID-Style Graphic
Figure 4: A Flashy Graphic Inappropriate for Actual Operational Control
High Performance HMI 3.0 - Part 1 | Page 5© PAS Global, LLC 2017
Justification for HMI ImprovementPoorly performing HMIs have been cited time and again as significant contributing factors to
major accidents. Yet, our industry has made little significant change in HMI design. There is
another industry that learns from its accidents and has made phenomenal advancement in HMI
design based on new technology. That industry is avionics. The resulting improvement in pilot
situation awareness is one of the largest contributing factors in the decades-long decline in
aviation accidents.
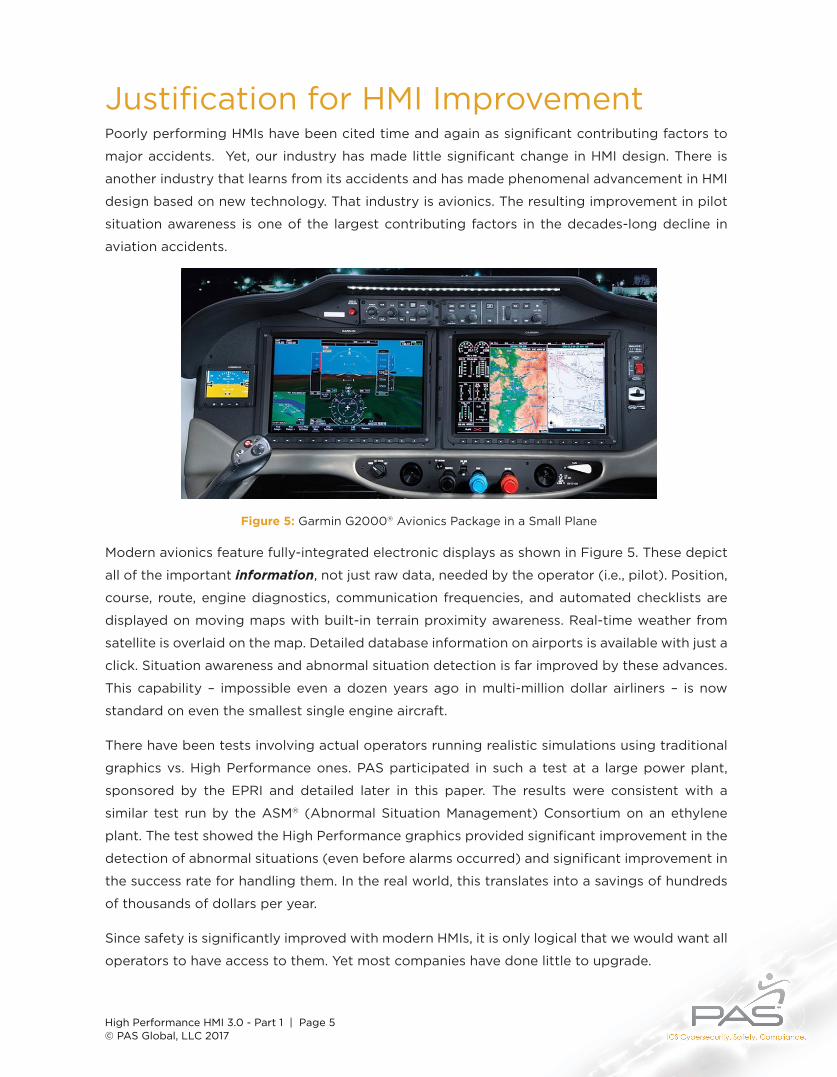
Modern avionics feature fully-integrated electronic displays as shown in Figure 5. These depict
all of the important information, not just raw data, needed by the operator (i.e., pilot). Position,
course, route, engine diagnostics, communication frequencies, and automated checklists are
displayed on moving maps with built-in terrain proximity awareness. Real-time weather from
satellite is overlaid on the map. Detailed database information on airports is available with just a
click. Situation awareness and abnormal situation detection is far improved by these advances.
This capability – impossible even a dozen years ago in multi-million dollar airliners – is now
standard on even the smallest single engine aircraft.
There have been tests involving actual operators running realistic simulations using traditional
graphics vs. High Performance ones. PAS participated in such a test at a large power plant,
sponsored by the EPRI and detailed later in this paper. The results were consistent with a
similar test run by the ASM® (Abnormal Situation Management) Consortium on an ethylene
plant. The test showed the High Performance graphics provided significant improvement in the
detection of abnormal situations (even before alarms occurred) and significant improvement in
the success rate for handling them. In the real world, this translates into a savings of hundreds
of thousands of dollars per year.
Since safety is significantly improved with modern HMIs, it is only logical that we would want all
operators to have access to them. Yet most companies have done little to upgrade.
Figure 5: Garmin G2000® Avionics Package in a Small Plane

High Performance HMI 3.0 - Part 1 | Page 6© PAS Global, LLC 2017
Proper Graphic PrinciplesIneffectively designed graphics are easy to find. Simply search the internet for images under the
category “HMI.” Problems with these graphics include:
● Primarily a schematic or P&ID representation
● Lots of displayed numbers
● Few or no trends
● Spinning pumps/compressors, moving conveyors, animated flames, and similar distracting elements ● Brightly colored 3-D equipment ● Highly detailed equipment depictions ● Attempts to color code piping with contents ● Long, cryptic tagnames shown on the screen
● Brightly colored liquid levels displaying the full width of the vessel
● Lots of crossing lines and inconsistent flow direction
● Inconsistent color coding ● Bright colors on dark backgrounds ● Misuse of alarm-related colors ● Limited, haphazard navigation ● A lack of display hierarchy
Ineffective graphics encourage poor operating practices, such as operating by alarm. By
contrast, High Performance graphics have:
● A generally non-schematic depiction except when functionally essential
and at Level 3
● Limited use of color, where color is used specifically and consistently
● Gray backgrounds to minimize glare and reflection issues
● No animation, except for specific alarm-related graphic behavior ● Embedded, properly-formatted trends of important parameters ● Analog representation of important measurements, including their value
to normal, abnormal, alarm, and interlock conditions ● A proper hierarchy of display content providing for the progressive exposure
of detailed information as needed
● Simple and straightforward depictions in 2-D not 3-D ● Consistent flow depiction and layout to minimize crossing lines ● Embedded information in context (via right-click menus or similar methods) such
as alarm documentation and rationalization, standard operating procedures, and
more. ● Logical and consistent navigation methods ● Techniques to minimize operator data entry mistakes ● Validation and security measures

High Performance HMI 3.0 - Part 1 | Page 7© PAS Global, LLC 2017
Show Information Instead of Raw DataA primary difference of High Performance graphics is the underlying principle that, wherever
possible, operational values are shown in an informational context and not simply as raw
numbers scattered around the screen.
As an example, consider this depiction of a
compressor shown in Figure 6. Much money has
been spent on the purchase of instrumentation.
Yet, unless you are specifically trained and
experienced with this compressor, you cannot
tell if it is running at peak efficiency or is about
to fail.
The mental process of comparing each
number to a memorized mental map of
“what is good” is a difficult cognitive process.
Operators have hundreds (or even thousands)
of measurements to monitor. Thus the results vary by the experience and memory of the
operators, as well as how many abnormal situations they have personally experienced with this
particular compressor. Training new operators is difficult because the building of these mental
maps is a slow process. Adding more numbers to a screen like this one does not aid in situation
awareness; it actually detracts from it.
By contrast, a bank of analog indicators, as in Figure 7, can represent these numbers much more
effectively. Analog is a powerful tool because humans intuitively understand analog depictions.
Information is data in context made useful.
Figure 6: All Data, No Information
West East
Drive: 232.2 amps
Cooler
W. Vibration: 2.77 E. Vibration: 3.07
2.77MSCFH
155.2 °F 108.2 °F 166.1 °F55.7 psig
135.1psig
190.5 psig
Oil 155.2 °FOil 85.1 psi
65.1 °F
Figure 7: Analog Depiction of Information
Coolgpm
RECYCLE COMPRESSOR K43
Alarm Indicator
Desirable Operating Range
AlarmRange
AlarmRange
Suctpsig
Interpsig
Dschpsig
SuctdegF
InterdegF
DschdegF
E. Vibmil
N. Vibmil
W. Vibmil
MotorAmps
Oilpsig
OildegF
Interlock Threshold
42.7 38.7 93.1 185 95 120 170 12 8 9 170 80 290
2

High Performance HMI 3.0 - Part 1 | Page 8© PAS Global, LLC 2017
We are hard-wired for pattern recognition. With a single glance at this bank of properly designed
analog indicators, the operators can tell if any values are outside of the normal range, by how
much, and the proximity of the reading to both alarm ranges and the values at which interlock
actions occur. Analog depictions such as these moving analog indicators are a key element of
HPHMI.
In just a second or two of examination, the operator knows which readings, if any, need further
attention. If none do, the operator can continue to survey the other portions of the operation.
In a series of short scans, the operator becomes fully aware of the current performance of their
entire span of control.
The knowledge of what is normal is embedded into the HMI itself, making training easier and
facilitating abnormal situation detection – even before alarms occur, which is highly desirable.
Similarly, depiction of PID controllers is accomplished with the addition of easily scanned
setpoint, mode, and output information, as in Figure 9. If the final control element has a position
feedback signal, deviation is easily and effectively shown on the output scale. Mechanical
deviations are prime causes of abnormal situations, and they should be made easy to spot.
The subtle, slight gradients and shadows are intended to increase prominence of the live
elements. Images in printed form are often significantly different than images shown on a
screen. For that reason, other modifications to increase printed visibility have been made on
some depictions in this paper. Actual design of HPHMI elements concerns their appearance on
the screen.
Figure 8: Further Explanation of Moving Analog Indicators
FLOWgph
Desirable Operating Range shown as a light blue shaded area
Hi-Hi Alarm Range
Low Alarm
Abnormal High Range
Abnormal Low Range
32.1
Moving Analog indicators with Normal Range, High, Hi-Hi, Low, and Lo-Lo alarm indications, Interlock indication, and recent range
Hi Alarm Range
Lo-Lo Alarm
FLOWgph
81.1
FLOWgph
91.1
Priority 3Hi Alarm is in effect
Priority 2 Hi-Hi alarm is in effect and Hi Alarm is still in effect
Alarm indicator is always based on the highest priority alarm in effect on the sensor
FLOWgph
Dark blue bar shows measurement variability in a specified time period such as prior 2 hours. (possible on some control systems)
63.5Interlock Function
When Measurement
Is Invalid
----BAD
43 2

High Performance HMI 3.0 - Part 1 | Page 9© PAS Global, LLC 2017
Proper User of ColorColor must be used consistently. People have several types of common color-detection
deficiency (e.g., red-green, white-cyan, green-yellow). For this reason, the most important rule
for color is this:
Color, by itself, is never used as the sole differentiator of an important condition or status.
Most graphics throughout the world violate this principle. A color palette must have a limited
number of distinguishable colors used consistently. Bright colors are primarily used to bring
or draw attention to abnormal situations, not normal ones. Screens depicting the operation
running normally should not show brightly saturated colors, such as bright red or green pumps,
equipment, valves, and similar items.
When alarm colors are chosen, such as bright red and yellow, they are used solely as an aspect
of the depiction of an alarm-related condition, and for no other purpose. If color is used
inconsistently, then it ceases to have meaning. Figure 10 is a workable HPHMI color palette, and
the example figures in this paper generally follow it. There should not be very many colors, and
all colors must be easily distinguishable.
Graphics with color-neutral gray backgrounds on LCD screens are effective. They also enable
the lights in the control room to be turned back to bright – where they should be. Poor graphics
began with dark backgrounds and bright colors due to 1980s-90s CRT hardware limitations.
This scheme resulted in major glare and reflection problems, which were addressed by dimming
the control room lights. For operator alertness, the control room lighting should actually be
brighter than a typical office, all day and all night.
Controller with Device Feedback
562.1AUTO560.0
22%23%
With Position Deviation Alarm
602.1AUTO485.0
22%55%
A A A A M A A AA B C D E F G H
Damper Position
7473
77 78
45 78
74 75
50 51
50 50
75 65
5155
2
22
DescriptionUnits (psig)
PV, Mode, Setpoint & OutputValues
Diamond for Setpoint
Output Indicator0-100%
Black Outline Indicates Mode is Abnormal
Analog Controller Depiction
562.1MAN560.022%
Device Feedback on same scale
Figure 9: Analog Depiction of PID Controllers and Position Feedback

High Performance HMI 3.0 - Part 1 | Page 10© PAS Global, LLC 2017
Elements and Depictions of HPHMIThis section shows many of the common situations that a process graphic must depict, and how
to accomplish those depictions by following High Performance HMI principles.
Depicting Process ValuesThe display of live values on the screen should be shown in a different way than static text:
● The choice of a bold, dark blue is a good choice with the gray background, and
differentiates live values from static text done in black or dark gray as in Figure 11.
● Leading zeros are not displayed, except on fractional values (e.g., 0.27). Values are
shown only to the precision needed by the operator.
● In tables or columns, generally align numbers on the decimal point.
● Units of measurement are displayed in non-bold text near the value.
Figure 10: An Example HPHMI Color Palette
Color RGB Values Sample Defined Uses
Gray 213, 213, 213 Overall graphic background
White 255, 255, 255 Highlighting of some small items, e.g., PV Quality indications
Light Gray 243, 243, 243 ON indication for equipment
Gray 136, 136, 136 Off indication for equipment
Dark Gray 74, 74, 74 Some text, minor process lines
Black 0, 0, 0 Text and labels, major process lines, process vessel outlines. Dark Gray (64, 64, 64) can also be a good choice.
Dark Blue 0, 0, 215 Process values, controller modes and outputs, similar special purposes. Trend line for a single trended value.
Dark Green 0, 128, 0 Controller setpoints and other operator inputs, trend trace of setpoints
Light Green 153, 255, 102 Possible “faint green” for some specific highlighting
Light Blue 187, 224, 227 Desired operating ranges or conditions
Cyan 0, 255, 255 Vessel level strips, trend lines
Brown 204, 102, 0 Trend lines, position feedback indiciation
Pale Red (Pink) 255, 153, 204 Possible “faint red” for some specific indications
Red 255, 0, 0 Top level, priority one alarm
Yellow 255, 255, 0 Priority two alarm
Orange 255, 102, 0 Priority three alarm
Magenta 255, 0, 255 Priority four alarm for diagnostics
Dark Magenta 204, 0, 102 Trend lines

High Performance HMI 3.0 - Part 1 | Page 11© PAS Global, LLC 2017
● Point names should not be shown on the screen by default. It should never
be necessary for an operator to have to type in a point name in the entire HMI.
● Process values can have a variety of diagnostic conditions. Figure 11 shows a clear,
concise, and visible way for depicting those. Color coding is not recommended.
● When items are “selected”, that status should be indicated. Surrounding the
selected item with a white outline is a good practice.
Depicting Alarms Proper alarm depiction should also be redundantly coded based upon alarm priority
(color / shape / text). Alarm colors should not be used for non-alarm related functionality.
When a value or object comes into alarm, the separate alarm indicator appears next to it, as
shown in Figure 12. The indicator flashes while the alarm is unacknowledged (one of the very
few proper uses of animation) and ceases flashing after acknowledgement, but remains visible
as long as the alarm condition is in effect. People do not detect color change well in peripheral
vision, but movement such as flashing is readily detected. Alarms thus readily stand out on a
graphic (and on multiple screens) and are detectable at a glance.
Figure 12 shows that the most common methods of alarm indication are a direct violation of the
basic rule of color use, as they are different solely by the use of color.
Figure 11: Depicting Process Values
480.1 psi
480.1 psi
Invisible selection area
480.1 psi
Selection indication
Normal
Display of process values. No alarm conditions are in effect.
480.1 psi
Bad or Out of Range Value
?LG
Note that the BAD or OOR condition is normally alarmed, and the additional alarm element would be shown (see depiction of alarm conditions).
It may be possible to show the Last Good Value of a BAD or OOR measurement, rather than showing dashes. If this is the case, the depiction will be:
----- psi
Bad Value
----- psi
Out of Range
BAD OOR
Vent ValveAutoMoving Locked
Damper 7: SW 66:
ClosedStoppedPump 14:
Discrete (“digital”) conditions are shown using the same blue color and in bold, using easily understood words
Selection of an item causes the relevant faceplate to appear and the selected item is highlighted. See Faceplate section.

High Performance HMI 3.0 - Part 1 | Page 12© PAS Global, LLC 2017
It is highly beneficial to include access within the HMI
to the alarm rationalization information contained in
the Master Alarm Database as show in Figure 13. If
these terms are unfamiliar, you are advised to read
the ISA 18.2 standard for Alarm Management in the
Process Industry, or read the API RP-1167 Alarm
Management Recommended Practice if you are in
the pipeline industry. PAS offers free white papers
explaining both documents.
Figure 13: Linked Alarm Information
Information called into the shape & size of a standard faceplate
Link to Procedures
Right-click callup
Embedding Alarm Documentation
Off spec ProductionLowered efficiency
Category: Minor FinancialPriority: 3Setting: 120 deg FResponse Time: <15 min
Adjust reflux per computation; check Controller for cascade mode.Check feed composition
SOP 468 -1
Adjust base steam rate.Check pressure and feed parameters vs.
Excess steamPressure excursionInsufficient refluxFeed composition variance
TI-468-02 ColumnOverhead Temperature
-
122.1 deg F
X
Corrective Actions:
Alarm Causes:
Alarm Consequences:
Alarm: PV HIGH
3
Figure 12: Depiction of Alarms
Diagnostic Priority
Priority 3 Priority 2 Priority 1
480.1 psi 480.1 psi 480.1 psi480.1 psi
Diagnostic Priority
Priority 3 Priority 2 Priority 1
psi psi psipsi 480.1480.1 480.1 480.1
480.1 psi
No Alarm
480.1 psi
In Alarm
SimilarBadDepictions
480.1480.1480.1
480.1 psi
In Alarm
The symbol’s outlines above are important! Symbols without them would not be as effective in standing out on a graphic:
Priority 4Diagnostic
Priority 3 Priority 2 Priority 1
480.1 psi 480.1 psi 480.1 psi480.1 psi
2 1
4 3
4 3 12
SuppressedAlarm 480.1 psi
S
Poor Alarm Depictions Violating the Basic Color Rule
Improved Alarm Depictions With Redundant Coding
Total 4 8 1 120
0 2 10
Alarms
Un-Ack
Overall Alarms Summary element
432 S1

High Performance HMI 3.0 - Part 1 | Page 13© PAS Global, LLC 2017
Depicting Profiles of Temperature or PressureConsider these alternative distillation column
temperature profile displays. When only numbers
are shown, even an experienced operator may easily
miss a suboptimal condition. Additionally, a new
operator will find it difficult to build a mental map
of a proper profile. The desire is for all operators to
recognize normal and abnormal profiles at a single
glance.
A correct profile can be seen at a glance as a
straight line.
Depicting Dynamic Equipment So what about the paradigm of using bright green to depict “on” and bright red for “off” (or
vice versa in the power industry)? This is an improper use of color. The answer is a depiction
such as Figure 15.
The relative brightness of the object shows
its on-off status, as does the use of a process
value word next to it. Equipment items
brighter than the background are on (think of
a light bulb inside them). Items darker than
the background are off. If equipment has no
status that is sensed by the control system, but
is desired on the graphic anyway, it is shown
as transparent to the background color. The
status word can indicate several conditions,
as shown. Remember, if any of those are also
alarm conditions, the separate alarm indicator
will appear next to the equipment when it is
in an alarmed state.
A Column Temperature Profile
Is this a good profile?
Too hot at the bottom, too cold
at the top.
20.1
24.2
25.6
27.8
28.9
20.1
24.2
25.6
27.8
28.9
Alarm Ranges
This one is.
Normalrange
18.2
24.0
25.6
29.8
32.9 2
Figure 14: Measurement Profile
Figure 15: Depicting Status with Redundant Coding
and Proper Color Usage
(Shape is Filled Darker)
Wrong Better
Pump Not Running
PumpRunning
Wrong Better
STOPPED
RUNNING(Shape is Filled Brighter)
Dynamic equipment without instrumentation sensing of process states can be depicted with a fill the same as the background.
RunningInterlocked
Stopped – ErrorStopped with ConditionStopped – Needs ResetStopped – OK to Start
Repair State
RunningInterlocked
Stopped – ErrorStopped with ConditionStopped – Needs ResetStopped – OK to Start
Repair State
Showing choices from predefined conditions
Running
Limiting the displayed conditions to only those in effect:
Stopped – Needs Reset

High Performance HMI 3.0 - Part 1 | Page 14© PAS Global, LLC 2017
Bars vs. Pointers Attention to detail is important. It is typical to use bar graph elements to show relative
positions and values. While this may be better than simply showing numbers, it is inferior
to the use of moving pointer elements, since the bar disappears as the bar’s value gets low.
The human eye is better at detecting the presence of something than its absence. And, the
low condition may be more
important than the high
condition and should have
equal visual prominence.
The example in Figure 16 is
superior in showing relative
values, besides the color
improvement.
Depicting Level Indication Vessel levels should not be shown as large blobs of saturated color. A simple strip depiction
showing the proximity to alarm limits is better. A combination of trend and analog indicator
depictions is even better such as Figure 17. The right-hand edge of the trend replaces the pointer
and provides context.
Depicting Control Valves and Shutoff Valves Control valves turn out to be one of the more complicated items to depict. The tendency is
to want to cram too much data into a small space. Traditionally, we depict a control valve
(throttling, variable position) with a domed head depiction and an automated block valve (only
on-off) with a rectangular head depiction.
25% 50% 75%
ValveV-1V-2V-3X-1X-2X-3X-4S-1S-2K-1K-2
100%100%
95%88%
100%100%
75%0%
55%100%100%
100%0%
Analog Position - Better
25% 50% 75%
100%100%
95%88%
100%100%
75%0%
55%100%100%
100%0%
Analog Position – Poor but Typical
ValveV-1V-2V-3X-1X-2X-3X-4S-1S-2K-1K-2
Figure 16: Bars vs. Pointers
Poor Better: Thin bar level strip with
normal and alarm range
context
Very Poor
Crude Feed
-21
Trend with dotted lines for normal range, tic marks for
alarm settings
Best:Combination
with full context analog indicator
2 Hrs 81.5%
Depiction of Vessel Level Indication
2 Hrs 49.5%56.5%
TK
2
Figure 17: Vessel Levels

High Performance HMI 3.0 - Part 1 | Page 15© PAS Global, LLC 2017
In keeping with equipment depictions, the valve body is filled darkly for closed and brightly
for open. This also follows the P&ID paradigm for block valves. The same method can depict
the state of three-way valves. The solenoid and position switch statuses can also be shown if
desired.
Depicting Equipment Commands When DCS/SCADA points are built that indicate equipment state, the control engineer can
usually decide which words to display to represent the current state. The choices they make
are often poor. The most common example is “RUN” and “STOP.” Do these represent the
equipment’s status, or a command to it? “RUNNING” and “STOPPED” are much better status
indication words. “STOP” and “START” are commands, not statuses.
Similarly, the graphics need to differentiate clearly between status indications and command
possibilities. In general, the graphic indicates the current state, and faceplate interactions are
used to command changes to that state. It is
common to have a point type that includes
both a switch-type (binary) output command
and binary status feedback, commonly called
a Digital Composite Point. Figure 19 shows a
compact graphic presentation of those statuses.
Selecting the graphic element would call up the
faceplate for the actual interaction.
Figure 18: Control and Automated Block Valves
Control Valves(no feedback)
Same Principles for On-Off Valves, with Status Words
ValveOpen
ValveClosed
33%
0%
TravOpen
Closed
Actual determines valve body fill.O% and A %
numbers are shown
O: 33%A: 38%
Control Valves(with Analog Feedback)
3-Way Valves Showing Open Flow Paths
Valve Head is Unfilled
Output determines valve head
Open
Closed
Output determines valve head
No feedback
FailOpen
0%
FailClosed
0%
FailLast
0%
Valve Traveling
Position Switches: Made and Unmade
Solenoid: When de-energized, valve moves to fail position
Showing All The Options: Confusing!
O: 100%A: 99%
Output % Shown
Valve Fail Direction
Avoid Tiny Output Bars!
If You Can’t Resist, at Least Use a Slider
Figure 19: Digital Composite Point Depiction
RunStopped
Pump 22
Digital Composite Point Depiction:Command (“setpoint”) to the device:Feedback from the device:
Mismatch alarm if applicable
3

High Performance HMI 3.0 - Part 1 | Page 16© PAS Global, LLC 2017
Use of Trends The most glaring deficiency in HMI today is the general
lack of properly implemented trends. Every graphic
generally has one or two values on it that would be far
better understood if presented as trends. However, the
graphics rarely incorporate them.
Instead, engineers and managers believe vendor claims
that their operators can easily trend any value in the
control system on demand with just a click. This is
incorrect in practice; a properly scaled and ranged trend
may take 10 to 20 clicks/selections to create, and usually
disappears into the void if the screen is used for another
purpose (like calling up a different graphic).
This deficiency is easily provable; simply walk into the
control room and count how many trends are displayed.
Our experience in hundreds of control rooms is that
trends are vastly underutilized and situation awareness
suffers due to that.
Trends should be embedded in the graphics and appear, showing proper history, whenever
the graphic is called up. This is generally possible, but is a capability often not utilized. Trends
should incorporate elements that depict both the normal and abnormal ranges for the trended
value. There are a variety of ways to accomplish this as shown in Figure 20. The range indicator
could also indicate the alarm and interlock ranges (see the later Level 1 Overview Example;
Figure 33).
Depicting Tables Even tables and checklists can
incorporate proper principles as
shown in Figure 21. Consistent
colors and status indication can
be integrated. The intent is to
make the abnormal stand out.
Figure 20: Trend Depiction of Desirable Ranges
West Comp Discharge Temp °C
40.0
50.0
-60 -30-90 Hours2
West Comp Flow MSCFH
45.0
55.0
-60 -30-90 2 Hours- --
PV49.1SP
50.5
PV44.1
500015
1 Hr
Feed Water3280DrumLevel-0.5
MainSteam4150
0-10
Figure 21: Tables and Checklists
Abc abc abcAbc abc abcAbc abc abcAbc abc abcAbc abc abc
XXX
Better PracticeAbc abc abcAbc abc abcAbc abc abcAbc abc abcAbc abc abc
Improper PracticeBreaker 15 Power Oil Temp 16-33Oil Pres Status Level in TK-8776 Gen System Status Comp 88 in Auto Lineup Ready Sys Status Checks Bearing Readouts Comm check Outlet Temp < 250 Cooling Flow Internal Circuit Check Bypass Closed AFS Function
NOT OK
HPHMI Startup Permissives Table
Air Comp
Status Mode Diagnostic
C #1 RUNNING AUTO OK
C #2 STOPPED MAN OK
C #3 RUNNING AUTO OK
C #4 STOPPED AUTO FAULT
A2 CWP
B2 CWP
Pump Status
ON
ON
A2 HWP
B2 HWPON
OFF
C2 HWP
SUBFPON
ON
A2BFPT
B2BFPTON
ON
Another Better Practice Status Table
HPHMI Equipment Status Table
Table Design
2
3
OKNOT OK
NOT OKNOT OK
OFF
OKNOT OK
OK
OFFNOT OK
NOT OK
NOT OK
NOT OKNOT OKNOT OK
3

High Performance HMI 3.0 - Part 1 | Page 17© PAS Global, LLC 2017
Depicting Advanced Process ControlAdvanced Process Control (APC) is also known as Multi-Variable Control. It is the method by
which a sophisticated computer program monitors the process and adjusts controllers in real
time to continually optimize performance.
Not all controllers are “touched” by the APC
system, and it is useful for the operator to see
which ones are, and what the APC system is
doing with them. Small indicators next to the
affected controllers are useful for this. Figure
22 shows this with an alternative, non-analog
PID controller representation that is useful in
some circumstances.
A Level 2 or 3 screen showing overall health
and functionality of the APC system itself is
desirable.
Depicting Shutdown ActivationOperators must have the ability to shut down operating equipment manually and quickly.
However, when an important action with significant consequences is based upon operator
input, the input should have a confirmation mechanism that avoids inadvertent activation. The
“cancellation” option should be consistently implemented.
It should never be possible to make a single selection on a screen that results in an inadvertent
shutdown. A “Shutdown button” should call up at least one and perhaps two layers of
confirmation before it is possible to actually cause such a significant event.
The “defaults” of such mechanisms should be
on the safe option. Always consider what an
inadvertent “ENTER” will do and label screen
items with full clarity.
Major process upsets have occurred by
mistyping an input (for example, opening a
slide valve to 47 percent instead of 4.7 percent).
Older DCSs using membrane keyboards are
particularly susceptible to this type of error.
Error checking methods should be used to
require confirmation of numerical entries that
seem inappropriate.
Figure 22: Advanced Process Control
APC
APC APC APC
APC is ON: Indicators for increase, decrease, and maintain:
APC in effect on a controller:
Simplified Alternative
APCAPC is Off: X X
Advanced Process Control (APC)
PSOAuto
77.088.5 %
TK21 Level75.1 %
Screen button selection calls
up a confirmation faceplate.
“Cancel” is the default:
“Continue” brings
up standard Digital Output
Faceplate:
SHUTDOWN
REACTOR7
Reactor 7Manual
Shutdown
CONTINUE
ACCESSReactor 7 Manual
Shutdown Switch
CANCELReactor 7Manual
Shutdown
CANCEL
X
Normal
DownShut
Screen button selection calls
up a confirmation faceplate.
“Cancel” is the default:
“Continue” brings
up standard Digital Output
Faceplate:
SHUTDOWN
REACTOR7
Normal
DownShut
Reactor 7Manual
Shutdown
CONTINUE
CANCEL
ACCESSReactor 7 Manual
Shutdown Switch
CANCELReactor 7
ManualShutdown
Shut Down
Normal
Reactor 7Shutdown
Figure 23: Layers of Confirmation

High Performance HMI 3.0 - Part 1 | Page 18© PAS Global, LLC 2017
Depicting Interlock FunctionalityInterlocks are functions whereby normal
control actions are overridden by
predetermined process conditions. An
example would be to override a steam valve
to the closed position if the equipment
temperature or pressure is too high.
There are several HMI-related issues to be
addressed for interlocks, and these must be
handled regardless of whether the interlock
is implemented in the DCS or in a separate
Safety Instrumented System.
Interlocks are implemented using logic structures – usually “blocks” or “points” or “ladders.”
These are usually complicated and cryptic to understand, when displayed using the native
capabilities of the DCS (e.g., logic point detail). They may activate infrequently, since they are
usually designed to protect against an abnormal situation. Due to this, the operator may not
encounter them for months. When they activate, the operator may not remember being told
about “the new column interlock” implemented a year ago, and have no idea why he cannot
start feed to the column. If this occurs at 2 a.m. on a Saturday night, then the engineer is
(deservedly) likely to get a phone call and production may be delayed.
Therefore every interlock, when activated, needs to indicate that activation on the appropriate
Level 2 and 3 display. The strategy
may be different for those displays.
For Level 2 displays, a small bank of
interlock symbols can be created,
with functionality as shown in
Figures 24 and 34. An element next
to it can indicate the interlock action
conditions. When an interlock
becomes active, any element that
it is affecting (such as a pump
or control valve) should have the
interlock symbol appear next to it.
In this manner, the operator can
clearly see which interlocks are
in effect and what items they are
affecting.
Interlock in Effect
I
Interlock in Bypass
Interlock Not in Effect
I-57D I-57D I-57D
I
I I-5A I-5B I-5C
I-5D
I I
I I-5EI I-5FI
Feed ADTV-1 ADTV-2
Temp Pres Level
Interlock Actions:Stop Feed Stop ADTV-1Stop ADTV-2Max CoolingMax Vent
OFFOFFOFFOFFON
Interlock Symbology
Bank of Interlocks, Status and Actions
I
Figure 24: Interlock Symbology
Figure 25: Interlock Before and After Activation
Main Feed
I-57D
II-57D
Main Feed
Interlock DepictionPre-Alarm has occurredController is in Auto and block valve is still Open
Interlock DepictionPre-Alarm still in effect. Interlock has Activated with alarm. Controller is overridden to Manual and both valves are Closed
PSOAuto
110.052.0 %
Feed1 Flow108.5 gph
Open Open
Closed Closed
PSOMan
0.00.0 %
Feed1 Flow0.0 gph
D-101
D-101psig
D-101psig
I
D-101
202.0
222.0
2
2 2

High Performance HMI 3.0 - Part 1 | Page 19© PAS Global, LLC 2017
For Level 3 displays, a more
detailed view of the interlock can
be shown such as in Figure 26.
When active, the specific interlock
symbol can be displayed next to
each initiator signal and affected
output. For Level 3 displays, an
interlock diagnostic element
should be created, clearly
showing the possible initiators
and possible actions taken by the
interlock. This does not have to
be complicated; a table such as
the following can often suffice.
When an interlock shuts down a piece of equipment, a first-out indication is often desirable
since some of the other initiators may activate after the shutdown trip occurs. Figure 27 is a
simple example of a Shutdown “First Out” Table:
Shortly after the compressor shuts down due to high vibration, the oil pressure also drops,
which produces another shutdown initiator. As a result of equipment isolation, the suction
pressure may also drop sufficiently to activate another shutdown initiator. Thus by the time the
diagnostic graphic is consulted, three separate shutdown causes are present and the question
is – which is the original culprit? Two are a consequence of the immediately prior shutdown, and
the actual cause of the shutdown is shown via the “First Out.” The vibration reading depicted is
“currently” much less than the shutdown limit (since it quits shaking after the shutdown), thus
the high vibration indication (the “X”) needs to be latched until reset.
West Compressor Interlock Initiators
Comp in Overspeed
Winding Temp is High
Vibration is High
1 Stg Pres is High
2 Stg Pres is High
Suction Pres is Low
Oil Pres is Low
NO
NO
NO
I W-1A W-1B W-1CI IMech Flow Pres
NO
YES
YES
Total Flow is Low NO
NO
West Compressor Interlock Actions
W. Comp Shutdown
Inlet Block Valve
Outlet Block Valve
Flow Cascade to Manual
Maximum Flow Bypass
Maximum Cooling
E. Comp Override to 100%
NO
OPEN
OPEN
NONORM
OFFWinding Purge
YESOPEN
Figure 26: Interlock Diagnostic Table
Figure 27: Shutdown Initiator Table with First Out
Compressor 43 Shutdown Initiators
West VIB >25
West Bearing Temp >220
East VIB >25
East Bearing Temp >220
Suction Pressure <20
Discharge Temp >240
Oil Pressure <10
Overspeed OK
160.3
1.3
155.3
12.3
148.7
3.3
1.5 First OutX
X
X

High Performance HMI 3.0 - Part 1 | Page 20© PAS Global, LLC 2017
Startup MapInterlocks are functions whereby
normal control actions are overridden
by predetermined process conditions.
An example would be to override a
steam valve to the closed position if the
equipment temperature or pressure is too
high. There are several HMI-related issues
to be addressed for interlocks, and these
must be handled regardless of whether
the interlock is implemented in the DCS
or in a separate Safety Instrumented
System.
Navigation and Command ButtonsMultiple methods of navigation should be provided. The operator should be able to go up and
down through the hierarchy, side to side through the process, and call related details, trends,
and shutdown status displays from any graphic. This navigation capability should work with
all available methods provided by the DCS vendor – mouse or touch screen target selections,
keyboard keystrokes, context sensitive menus, or others.
Every screen (particularly Level 2) should have navigation targets to the most likely other screens
that the operator would access. When a P&ID depiction is used, any process line entering or
exiting the screen should contain a navigation link to the relevant graphic. Navigation buttons
or targets should be consistent and simple (and not look identical to command buttons).
Most control systems provide pre-made navigation button objects, including many that are
inappropriately colored, needlessly 3-D, and overly intrusive.
The system and graphics should be configured so it is never necessary for the operator to
type in a point name or graphic name. Some DCSs have arrays of programmable keys, which
can be assigned to call up certain
displays or combinations of
displays. For systems that do
not, programmable key arrays
are inexpensive on the computer
accessory market.
Figure 28: High Performance Element Designed for Startup Use
Reactor 7 Startup
0
+30 +60 +90
20
40
60
80
0
5
10
15
20
0
2
4
6
8
TempDeg C
FeedRateMPH
AdditiveFlowMPH
65.1
21.1
6.9
Tank Farm 2
Non-navigation depiction
Navigation Buttons Faceplate or Special Purpose Element Callup Buttons
NavigationTarget
ScrubberMain Menu
L2 Reactor M5
L2 Feed System
L3 M5 Agitator
L3 Analyzers
Pres Control
APC
Product Change
Feed Change
Figure 29: Navigation Buttons and Targets
High Performance HMI 3.0 - Part 1 | Page 21© PAS Global, LLC 2017
Implementing an entire navigation structure in a single windows-type pull-down hierarchical
menu (i.e., one with “sub-menus” that pop-out of the side) is generally not recommended,
particularly a structure more than two levels deep.
The Main Menu: It is desirable for the operator to have two-click access from any graphic to any
other graphic, to supplement any other navigation method used. Every graphic should have a
consistently placed “Main Menu” navigation button. It opens a simple text screen, logically and
hierarchically arranged, with one-click navigation links to all graphics.
Display Layout and Faceplate Handling
Displays need a consistent “look and
feel.” Different DCSs have unique
embedded structures and paradigms
around the location and type of
navigation abilities, faceplates,
“change zones,” programmable keys,
and similar items. These features
should be implemented in such a way
as to comply with the principles of
High Performance displays.
It is important to use these built-in
abilities to their maximum potential.
It is inadvisable to attempt to make a
“Brand XYZ” DCS look like a “Brand
ABC.” The results will usually be far
from optimum.
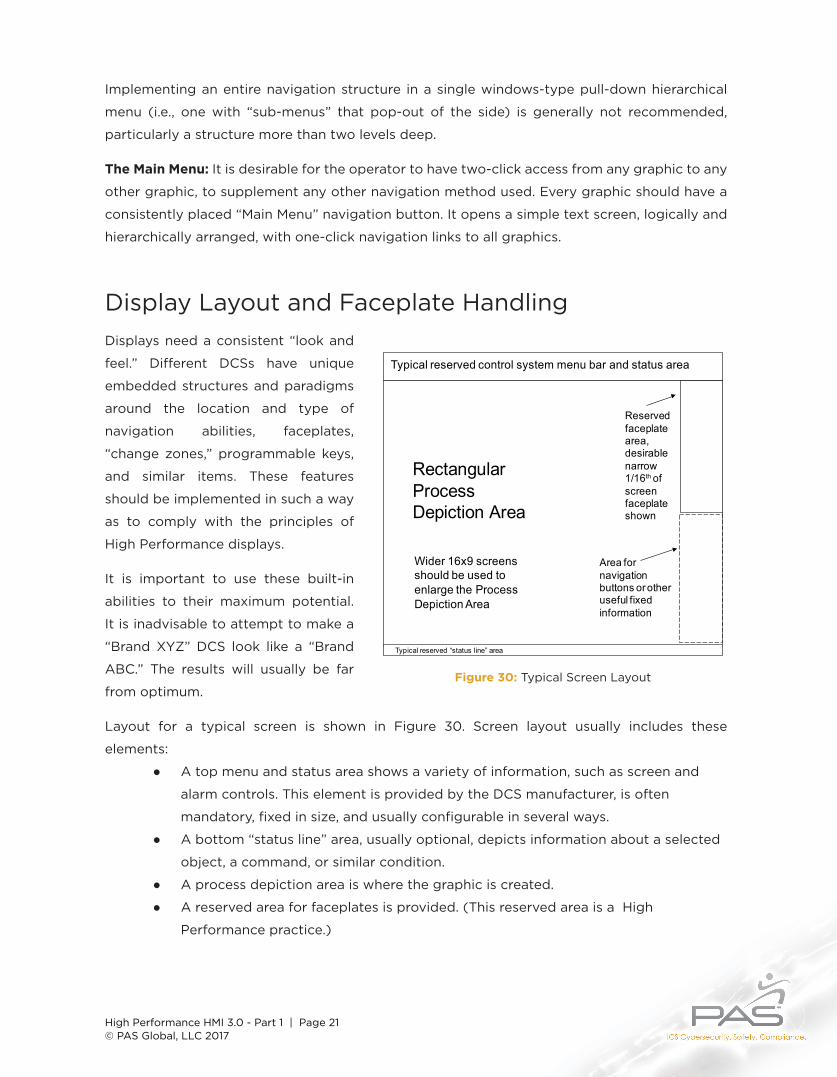
Layout for a typical screen is shown in Figure 30. Screen layout usually includes these
elements:
● A top menu and status area shows a variety of information, such as screen and
alarm controls. This element is provided by the DCS manufacturer, is often
mandatory, fixed in size, and usually configurable in several ways.
● A bottom “status line” area, usually optional, depicts information about a selected
object, a command, or similar condition.
● A process depiction area is where the graphic is created.
● A reserved area for faceplates is provided. (This reserved area is a High
Performance practice.)
Typical reserved control system menu bar and status area
Reserved faceplate area, desirablenarrow 1/16th of screen faceplate shown
Typical reserved “status line” area
RectangularProcess Depiction Area
Area for navigation buttons or other useful fixed information
Wider 16x9 screens should be used to enlarge the Process Depiction Area
Figure 30: Typical Screen Layout

High Performance HMI 3.0 - Part 1 | Page 22© PAS Global, LLC 2017
When screen objects are selected, additional information about them should be shown. This
is typically in the form of a faceplate popup. If the operator can interact with or manipulate
the object, the interface for that interaction is contained in the faceplate. A reserved area in
which the faceplate appears is important. It is undesirable for a faceplate to appear randomly
on the screen, obscuring the primary graphic, and then requiring it being manually dismissed
or moved. Reserved areas should be a rectangular area on the upper or lower right side of the
screen, or a narrow strip across the bottom or right-hand side.
The size of the reserved faceplate area is determined by the brand of DCS. Ideally, faceplates are
tall and narrow. This provides for placing them adjacent to the right-hand edge of the graphic,
leaving a large, contiguous, mostly rectangular area for the process depiction. But, some DCSs
have faceplates that are large, square, clunky, and poorly organized, making a reserved area for
them difficult to accomplish. If you own such a system, encourage the manufacturer to move
into the 21st century and modify their standard faceplates.
Only one item on a screen should be selectable at a time. Any new selection on the screen
should replace any prior faceplate from a prior selection, without any manual “closing” of
the prior faceplate needed. On a few screens, it might be desirable to enable more than one
faceplate at a time.
Faceplates are usually supplied as standard elements by the DCS manufacturer. It may or may
not be possible to alter them, and they may not follow some of the principles you desire for
your HMI, such as proper and consistent use of color. However, rebuilding or replicating dozens
of standard faceplates from scratch to correct minor consistency issues may not be worth the
effort, since future vendor software upgrades may override that work.
The faceplate should show the point name and description, since point names should not
normally be shown on a graphic. Exposing even more configuration information (i.e., Level 4
“point detail” or configuration data) about the point should be possible from the faceplate
element. Faceplate interaction should not be modal (i.e., preventing other graphic action until
the faceplate is closed).
We have seen a presentation advocating that faceplate functionality (altering setpoints, outputs,
modes, states, etc.) be incorporated into the graphics themselves, and the use of the standard
faceplate interaction eliminated. Now, as you can imagine, we are always open to evaluating
new ideas, but not every new idea is a good one! The claim is made that “it is speedier and the
operator might save fractions of a second per interaction that way, which will add up to maybe
several hours saved per year.” This is a bad idea, because huge amounts of additional custom
coding and its upkeep are needed and significant layout and consistency problems must be
addressed. Stick with faceplates.

High Performance HMI 3.0 - Part 1 | Page 23© PAS Global, LLC 2017
Depending on DCS HMI capabilities, other methods for point information manipulation are
possible, such as right-click menu access.
Avoiding “Blob” GraphicsSome places have carried the gray-scale principle
too far and created extremely low-contrast “blob”
graphics shown in Figure 31. These are gray-on-gray,
typically without even thin black boundary lines
defining the various elements. These are a bad idea;
we have seen many operators squinting at these to
figure out what is happening. Graphics should be
clear and unambiguous, and blob graphics are not
recommended. The key is to provide easy visibility
of elements, but to reserve emphasis for abnormal
situations.
Display HierarchyDisplays should be designed in a hierarchy that provides progressive exposure of detail. Displays
designed from a stack of P&ID schematic designs will not have this; they will be “flat” like a
computer hard disk with one folder for all the files. This does not provide for optimum situation
awareness and control. A four-level hierarchy is desired.
65.1
68.2
70.5
72.6
80 %
22 %
64.2 C-42
C-44
107.56
Figure 31: “Blob Graphic” Elements with Insufficient Contrast
Level 2
Process UnitControl Display
Level 2
Process UnitControl Display
Level 2
AbnormalSituation Tasks
Level 3
Process UnitDetail Display
Level 3
Process UnitDetail Display
Level 3
Process UnitDetail Display
Level 4
Process UnitSupport Display
Level 4
Process UnitSupport Display
Level 4
Process UnitSupport Display
For Each Overview Display, Multiple Level 2 Process Unit Detail Displays
For Each Level 2 Display, Multiple Level 3 Process Unit Detail Displays
For Each Level 3 Display, Multiple Level 4 Process Unit Support Displays
Smaller equipment groups, Controllers,
Alarms, Values, Trends, ESD Displays, Equipment
Status
Interlocks, Details, Diagnostics, “First-Outs,”
Procedures, Documentation, Help
Level 1
Process AreaOverview Display
Controllers, Values, Alarms, Trends, Status
Note: Possibly More than one Overview Display available, designed for significantly different operating states
Figure 32: High Performance HMI Display Hierarchy
High Performance HMI 3.0 - Part 1 | Page 24© PAS Global, LLC 2017
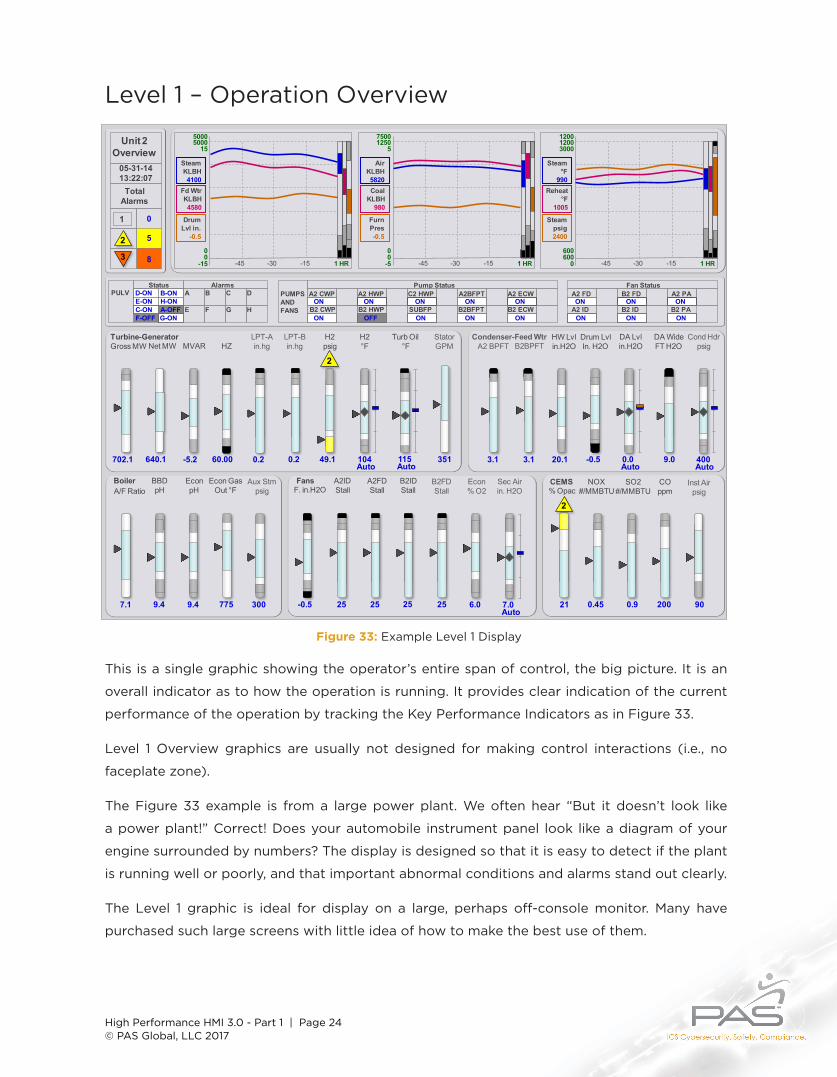
Level 1 – Operation Overview
This is a single graphic showing the operator’s entire span of control, the big picture. It is an
overall indicator as to how the operation is running. It provides clear indication of the current
performance of the operation by tracking the Key Performance Indicators as in Figure 33.
Level 1 Overview graphics are usually not designed for making control interactions (i.e., no
faceplate zone).
The Figure 33 example is from a large power plant. We often hear “But it doesn’t look like
a power plant!” Correct! Does your automobile instrument panel look like a diagram of your
engine surrounded by numbers? The display is designed so that it is easy to detect if the plant
is running well or poorly, and that important abnormal conditions and alarms stand out clearly.
The Level 1 graphic is ideal for display on a large, perhaps off-console monitor. Many have
purchased such large screens with little idea of how to make the best use of them.
AD-ONPULVStatus
A2 CWP
B2 CWPE-ONC-ONF-OFF
H-ONA-OFFG-ON
Alarms
E
B
F
C
G
D
H
PUMPS ANDFANS
Pump Status
ON
ON
A2 HWP
B2 HWPON
OFF
C2 HWP
SUBFPON
ON
A2BFPT
B2BFPTON
ON
A2 ECW
B2 ECWON
ON
Fan StatusA2 FDON
ON
B2 FD
B2 IDON
ON
A2 PA
B2 PAON
ONA2 ID
7.1
A/F Ratio
9.4
BBDpH
9.4
EconpH
Boiler
775
Econ GasOut °F
300 -0.5
Aux Stmpsig
25 25 7.0Auto
351
25 6.0 21 0.45 0.9 200 90
F. in.H2OA2IDStall
A2FDStall
Fans B2IDStall
B2FDStall
Econ% O2
Sec Airin. H2O % Opac
NOX#/MMBTU
SO2#/MMBTU
CEMS COppm
Inst Airpsig
702.1 640.1 -5.2
MVARTurbine-GeneratorGross MW
60.00 0.2 0.2
LPT-Ain.hg
49.1 3.13.1 20.1 -0.5 9.0
H2psig
H2°F
Turb Oil°F
StatorGPM
Condenser-Feed WtrA2 BPFT B2BPFT
Drum LvlIn. H2O
HW Lvlin.H2O
DA Lvlin.H2O
DA WideFT H2O
Cond Hdrpsig
104 115Auto Auto
Net MW HZLPT-Bin.hg
400Auto
0.0Auto
25
B-ON
05-31-1413:22:07
Unit 2Overview
1
Total Alarms
0
5
80
-450
-15 1 HR
50005000
15
SteamKLBH4100
Fd WtrKLBH4580
DrumLvl in.
-0.5
-30 -15
0
-450
-5 1 HR
75001250
5
AirKLBH5820Coal
KLBH980
FurnPres-0.5
-30 -15
600
-45600
0 1 HR
120012003000
Steam°F
990Reheat
°F1005
Steampsig2400
-30 -153
2
2
2
Figure 33: Example Level 1 Display

High Performance HMI 3.0 - Part 1 | Page 25© PAS Global, LLC 2017
Level 2 – Unit Control
Every operation consists of smaller, sub-sectional unit operations. Examples include a single
reactor, a pipeline segment, a distillation train, or a compressor station. A Level 2 graphic exists
for each separate major unit operation. It is designed to contain all the information and controls
required to perform almost all operator tasks associated with that section, from a single graphic
as shown in Figure 34.
Notice how the analog indicators and controllers are lined up for easy scanning, rather than
being scattered all around a P&ID depiction. Ease of abnormal situation detection is an important
HPHMI design consideration.
When properly designed, most operator actions will occur at Level 2, and the Level 3 graphics
will be used only for more detailed troubleshooting.
VENT SYS
ThioniteProduct: Mid-Run
PRODUCT
SHUTDOWN M5
IN OUT
Calc Diff:
-10%
+10%
238.1
State:
19.7 19.3
2.1 %
FREEZEM5
80.5
%A
15.5
%B
4.0
%CFeed Composition
77.5Auto
Feed MPH
11.9Auto
ADTV-1 MPH
4.0Auto
ADTV-2 MPH Reserved
Faceplate Zone
When any item on the screen is selected, the faceplate for that item appears in this reserved area.
All control manipulation is accomplished through the standardized faceplates.
Reactor M5
80.5
Coolant:GPM °C
15.5
PurgeMCFH
4.0
Cat.Act%
Conv.Eff. %
80.5 15.5
75.0
75.9Auto
54.3%
Lvl%
92.0
Prod MPH
45.0Auto
Temp °C
112.2Auto
Pres psig
To CoilsAgitator
ON
M5 Circ
ISOLATEM5
ON-OKRTAM:Run Plan:
Actual:
Main Menu
L2 M5 Startup
L2 M5 Scram
M5 Vent Sys
Daystrom Pumps
M5 Agitator
L2 Feed System
L2 Prod Recovery
M5 Interlocks
M5 Cooling Sys
---- Level 3 ----
L2 Compression
L2 RX Summary
I I-5A I-5B I-5C
I-5D I-5E I-5F
Feed ADTV-1 ADTV-2
Temp Pres Level
Interlock Actions:Stop Feed Stop ADTV-1Stop ADTV-2
Max CoolMax Vent
OFFOFFOFF
OFFOFF
0%
Out:
%DIFF
Open Open Open Open
Backup Lvl %75.8
40.0 -60 -30-90 2 Hrs
48.0
Temp °C
OP
Open
Open 5.0 %
Open
2.0 -60 -30-90 2 Hrs
6.0
ADTV2
MPH
OP
10.0 -60 -30-90 2 Hrs
14.0
ADTV1
MPH
OP
72.0 -60 -30-90 2 Hrs
80.0
Feed MPH
OP
I
I
I
I
I
27%
17%
48%
53%
48 %35 %
32.0 -60 -30-90 2 Hrs
40.0
Analysis: Inhibitor Concentration %
4.0 -60 -30-90 2 Hrs
6.0
Analysis: Purity %
Reactor M5In:Material Balance
Hours:
74.3 %
Pump A
Running
OK
Pump B
Fault
Stopped
Pumps Needed: 1
Max Circ OFF
2
4
3
Figure 34: Example Level 2 Display of a Reactor

High Performance HMI 3.0 - Part 1 | Page 26© PAS Global, LLC 2017
Level 3 – Unit Detail
Level 3 graphics provide all of the detail about a single piece of equipment. These are used for
detailed diagnosis of problems. They show all of the instruments, interlock status, and other
details. A schematic or P&ID type of depiction is often desirable for a Level 3 display.
The Figure 35 example shows what could be created “from scratch” as a Level 3. Besides the
P&ID depiction, other HPHMI elements are included. In existing systems, most graphics are
actually Level 3. See the “HPHMI Implementation on a Budget” section in the Part 2 document
for guidance about this.
Level 4 –Support and Diagnostic DisplaysLevel 4 displays provide the most detail of subsystems, individual sensors, or components.
They show the most detailed possible diagnostic or miscellaneous information. A “Point Detail”
display is a typical example. The dividing line between Level 3 and Level 4 displays can be
somewhat gray.
PSOAUTO
76.8 MSCFH76.088.5 %
Flow Demand
RUNNING
PSOCAS
90.090.0 %
WC Speed
65.0 °C
West Comp Discharge Temp °C
40.0
50.0
-60 -30-90 2 Hours
1st
Stage
2nd
Stage
CW
32.0 °C
20.0 °C
28.0 °C
WESTCOMP
OH
44.0 °C
90.8 %
48.0 psi
90.0 psi
EAST COMP
20.1 psi
111.0 °C
West Compressor Interlock Initiators
Comp in Overspeed
Winding Temp is High
Vibration is High
1 Stg Pres is High
2 Stg Pres is High
Suction Pres is Low
Oil Pres is Low
NO
NO
NO
West Comp Flow MSCFH
45.0
55.0
-60 -30-90 2 Hours
48.4 MSCFH
West Comp Speed %
85.0
95.0
-60 -30-90 2 Hours
RECOVERY
West Compressor
95.1 Oil psi
---- Level 3 ----
I W-1A W-1B W-1CI IMech Flow Pres
MANUAL ACTIONS
NO
NO
NO
Total Flow is Low
West Compressor Interlock Actions
W. Comp Shutdown
Inlet Block Valve
Outlet Block Valve
Flow Cascade to Manual
Maximum Flow Bypass
Maximum Cooling
E. Comp Override to 100%
NO
OPEN
OPEN
NO
NOCLOSED
NORM
OFFWinding PurgeNO
NO
Inter-cooler
---- Level 4 ----
OPEN
OPEN
Main Menu
L2 Compression
L2 Recovery
East Comp
Seq. Overlay
Startup Overlay
Logic Diagrams
Procedures
West Interlocks
West Cooling
Reserved Faceplate Zone
When any item on the screen is selected, the faceplate for that item appears in this reserved area.
All control manipulation is accomplished through the standardized faceplates.
IDLEWESTCOMP
PURGEWESTCOMP
ISOLATEWESTCOMP
SHUTDOWN WESTCOMP
Speed%
90.8Cas
76.8Auto
48.0 90.0 65.0 32.0
Tot FlowMSCFH
1 Stgpsi
2 Stgpsi
CLR In°C
CLR Out°C
Winding°C
111
FLOW-SPEED CASCADEIN EFFECT
EAST COMP
Figure 35: Example Level 3 Display

High Performance HMI 3.0 - Part 1 | Page 27© PAS Global, LLC 2017
Conclusion of the Part 1 DocumentThe principles of High Performance HMI are specifically developed to deal with the needs of
today’s operators regarding the complex systems they manage. A High Performance HMI is
designed to be the best tool for operator interaction with the process control system. It is
designed to maximize operator situation awareness and abnormal situation detection and
response.
In the separate Part 2 document, we provide case studies supporting that a High Performance
HMI accomplishes these goals. In addition, there is discussion of a major HMI-related advance
in the power industry, a review of HMI Standards, and an example Table of Contents of HMI
Philosophy and Style Guide documents.

High Performance HMI 3.0 - Part 1 | Page 28© PAS Global, LLC 2017
About the AuthorsBill R. Hollifield, PAS Principal Alarm Management and HMI Consultant
Bill is the Principal Consultant responsible for the PAS work processes and
intellectual property in the areas of both Alarm Management and High
Performance HMI. He is a member of the American Petroleum Institute’s API
RP-1167 Alarm Management Recommended Practice committee, the ISA SP-
18 Alarm Management committee, the ISA SP101 HMI committee, and the
Engineering Equipment and Materials Users Association (EEMUA) Industry
Review Group.
Bill has multi-company, international experience in all aspects of Alarm Management and HMI
development. He has 28 years of experience in the petrochemical industry in engineering and
operations, and an additional 12 years in alarm management and HMI software and services for
the petrochemical, power generation, pipeline, pharmaceutical, and mining industries.
Bill is co-author of The Alarm Management Handbook, The High Performance HMI Handbook, and
The Electric Power Research Institute (EPRI) Guideline on Alarm Management.
Bill has authored several papers on Alarm Management and HMI, and is a regular presenter on
such topics in such venues as API, ISA, and Electric Power symposiums. He has a BSME from
Louisiana Tech University and an MBA from the University of Houston. In 2014, Bill was made an
ISA Fellow.
Hector R. Perez, PAS High Performance HMI Product Manager
Hector oversees the High Performance HMI business line at PAS. He is a
chief designer of High Performance graphics intended to facilitate situation
awareness in a variety of industries. At PAS, Hector oversees PAS software
directions to improve product design and capabilities.
Prior to working with PAS, Hector was a senior engineer at Schlumberger. His
strength in design contributed to his success in creating new and improved
HMIs for reservoir evaluation services and interfaces for business Key
Performance Indicator tracking.
In addition to his expertise in High Performance HMI, Hector has widespread experience in all
aspects of Alarm Management. He has facilitated numerous Alarm Management workshops,
conducted alarm rationalization projects, and developed Alarm Philosophy documents for a wide
range of clients in the petrochemical, power generation, pipeline, and mining industries.
Hector has authored technical articles on High Performance HMI. In 2009, he and Bill collaborated
with the Electrical Power Research Institute (EPRI) on a comparative research study evaluating
High Performance graphics and operator effectiveness. Hector holds a Bachelor of Science in
Chemical Engineering from Rice University.

High Performance HMI 3.0 - Part 1 | Page 29© PAS Global, LLC 2017
ReferencesAPI-RP-1165: Recommended Practice for Pipeline SCADA Displays, American Petroleum Institute
(2006)
Crawford, W., Hollifield, B., Perez, H., Electric Power Research Institute Operator HMI Case Study:
The Evaluation of Existing “Traditional” Operator Graphics vs. High Performance Graphics in a
Coal Fired Power Plant Simulator, Product ID 1017637 (2009)
Hollifield, B. Oliver, D., Nimmo, I., and Habibi, E., The High Performance HMI Handbook. PAS (2008)
Hollifield, B. and Habibi, E. 2006. The Alarm Management Handbook, 2nd edition. PAS (2010)
ANSI/ISA-101.01-2015: Human Machine Interfaces for Process Automation Systems, International
Society for Automation, August 2015

High Performance HMI 3.0 - Part 1 | Page 30© PAS Global, LLC 2017
About PAS
PAS Global, LLC is a leading provider of software solutions for process safety, cybersecurity, and
asset reliability to the energy, process, and power industries worldwide. PAS solutions include
industrial control system cybersecurity, automation asset management, alarm management, high
performance HMI, boundary management, and control loop performance optimization. PAS
solutions are installed in over 1,000 facilities worldwide with more than 40,000 users.
For more information, visit www.pas.com.
Connect with PAS on Twitter @PASGlobal or LinkedIn.
© PAS Global, LLC 2017. Ideas, solutions, suggestions, hints and procedures from this document are the intellectual property of PAS Global, LLC and thus protected by copyright. They may not be reproduced, transmitted to third parties or used in any form for commercial purposes without the express permission of PAS Global, LLC.