Embed Size (px)
Citation preview
Click To Edit Master Ti
Maximizing Supermarket Refrigeration System Energy Efficiency
Lead,
Team
tle StyleAndrew Mitchell Lead, Technology Solutions Teams Robert Zogg
Refrigeration
Contact Information
Andy Mitchell (DOE), Lead, Technology Solutions Teams: [email protected]
Bob Zogg (Navigant), Lead, Refrigeration Team: [email protected]
2
Agenda
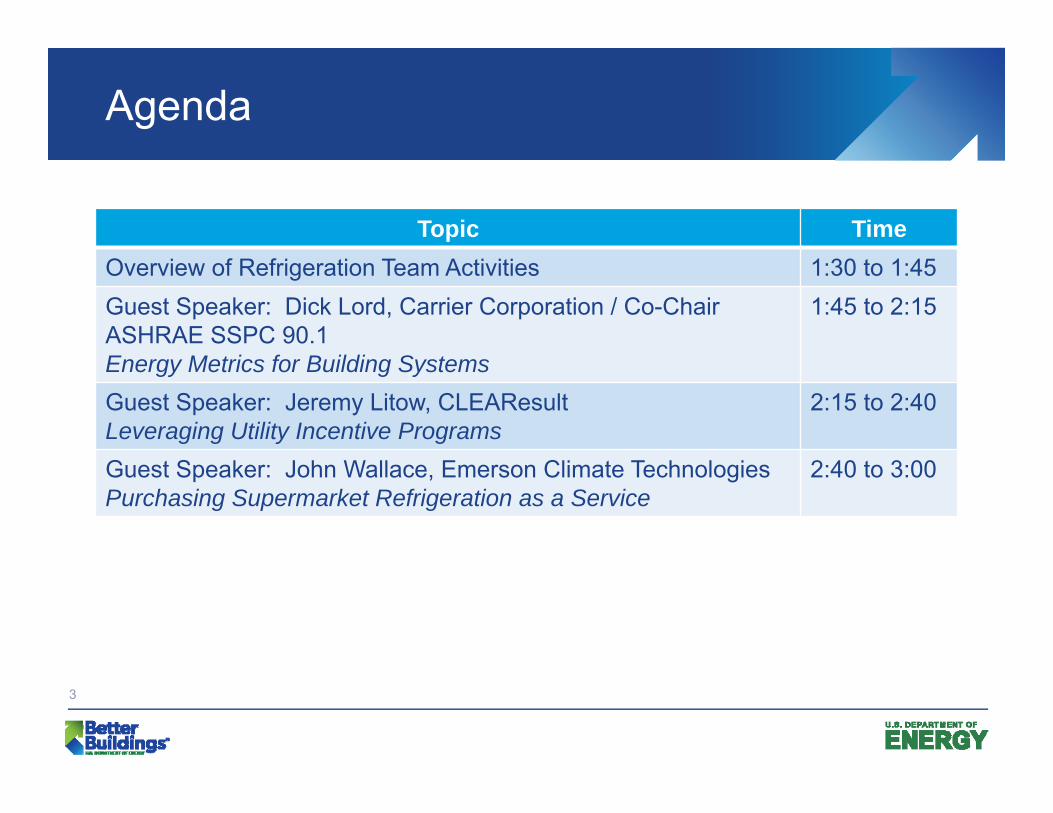
Topic Time Overview of Refrigeration Team Activities 1:30 to 1:45 Guest Speaker: Dick Lord, Carrier Corporation / Co-Chair 1:45 to 2:15 ASHRAE SSPC 90.1 Energy Metrics for Building Systems Guest Speaker: Jeremy Litow, CLEAResult 2:15 to 2:40 Leveraging Utility Incentive Programs Guest Speaker: John Wallace, Emerson Climate Technologies 2:40 to 3:00 Purchasing Supermarket Refrigeration as a Service
3
Activity Overview—Case Studies
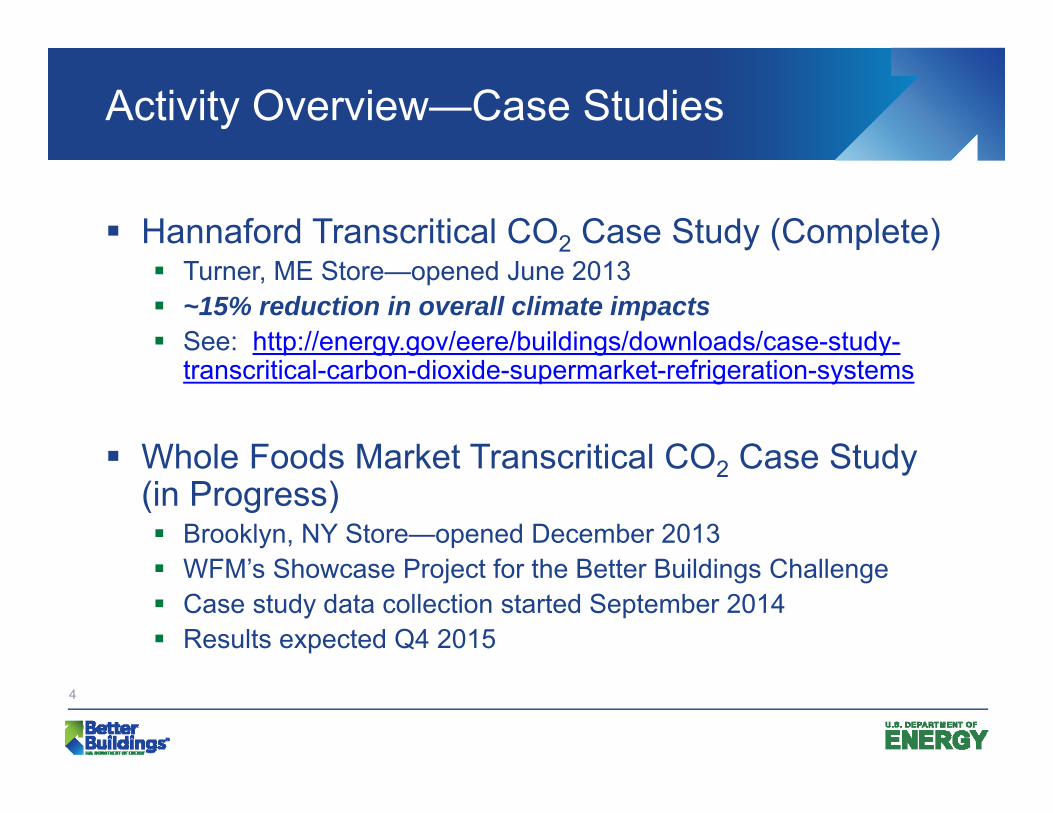
Hannaford Transcritical CO2 Case Study (Complete) Turner, ME Store—opened June 2013 ~15% reduction in overall climate impacts See: http://energy.gov/eere/buildings/downloads/case-study-
transcritical-carbon-dioxide-supermarket-refrigeration-systems
Whole Foods Market Transcritical CO2 Case Study(in Progress) Brooklyn, NY Store—opened December 2013 WFM’s Showcase Project for the Better Buildings Challenge Case study data collection started September 2014 Results expected Q4 2015
4
Activity Overview—Working Group Updates
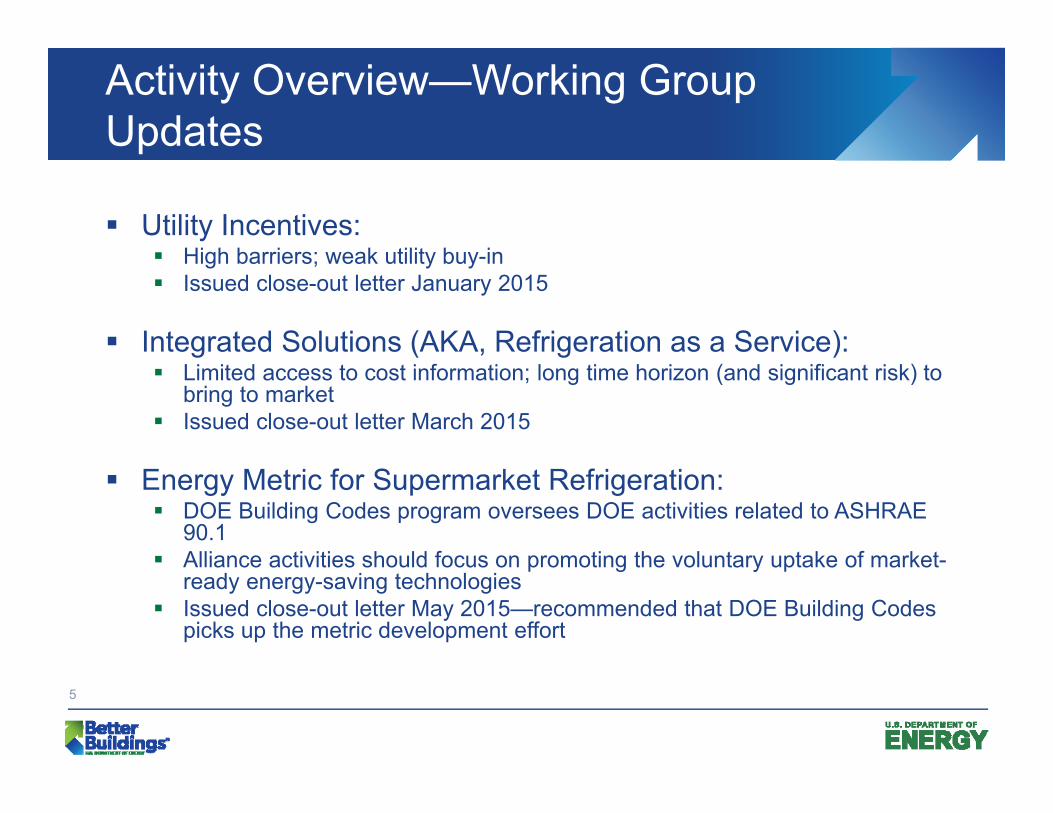
Utility Incentives: High barriers; weak utility buy-in Issued close-out letter January 2015
Integrated Solutions (AKA, Refrigeration as a Service): Limited access to cost information; long time horizon (and significant risk) to
bring to market Issued close-out letter March 2015
Energy Metric for Supermarket Refrigeration: DOE Building Codes program oversees DOE activities related to ASHRAE
90.1 Alliance activities should focus on promoting the voluntary uptake of market-
ready energy-saving technologies Issued close-out letter May 2015—recommended that DOE Building Codes
picks up the metric development effort
5
Activity Overview—Focus on HITs
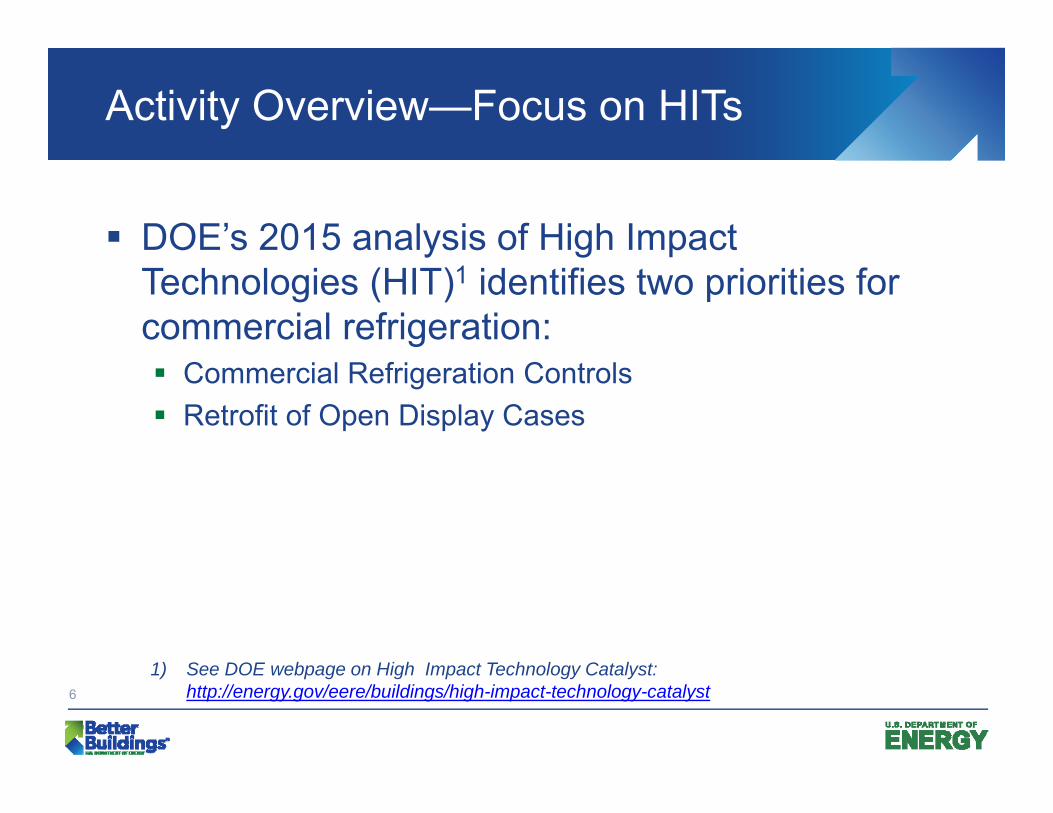
DOE’s 2015 analysis of High Impact Technologies (HIT)1 identifies two priorities for commercial refrigeration: Commercial Refrigeration Controls Retrofit of Open Display Cases
1) See DOE webpage on High Impact Technology Catalyst: http://energy.gov/eere/buildings/high-impact-technology-catalyst 6
Activity Overview—Focus on HITs
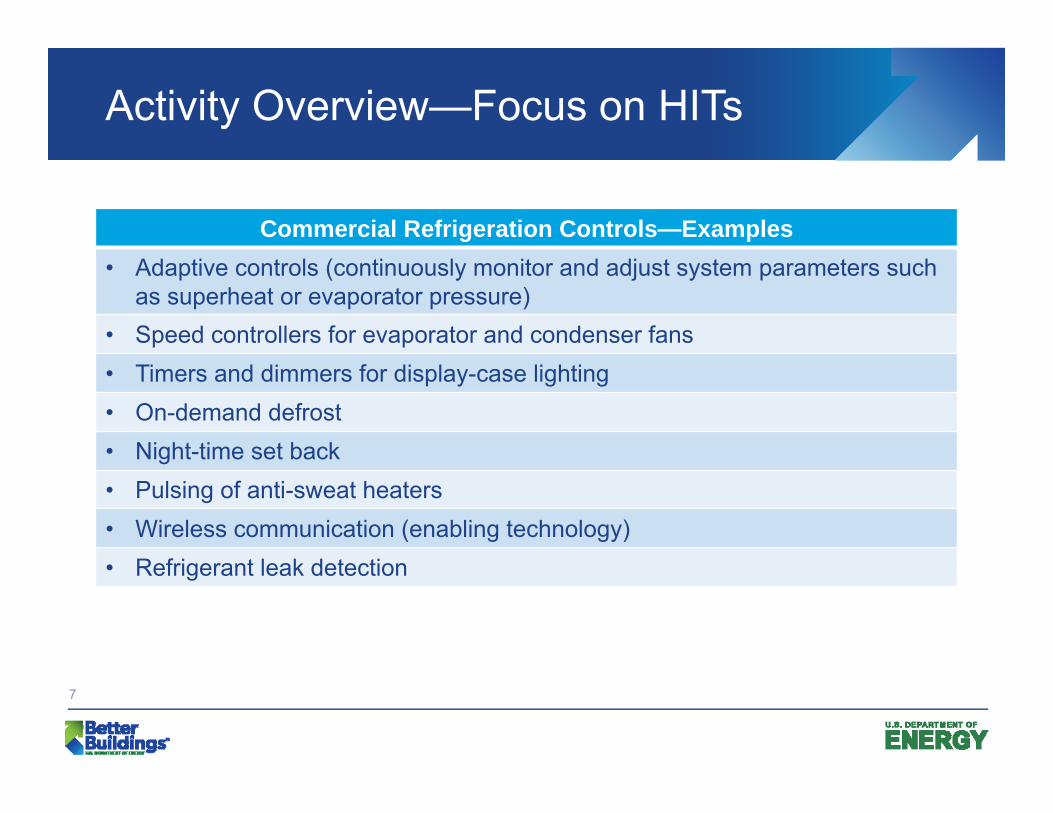
Commercial Refrigeration Controls—Examples • Adaptive controls (continuously monitor and adjust system parameters such
as superheat or evaporator pressure) • Speed controllers for evaporator and condenser fans • Timers and dimmers for display-case lighting • On-demand defrost • Night-time set back • Pulsing of anti-sweat heaters • Wireless communication (enabling technology) • Refrigerant leak detection
7
Activity Overview—Focus on HITs
Refrigeration Controls—Questions to Explore:
What specific barriers are most important to address?
What activities would be most helpful? Manufacturer/supplier challenge? Procurement specifications? End-user campaign? Demonstrations? Other?
8
Activity Overview—Focus on HITs
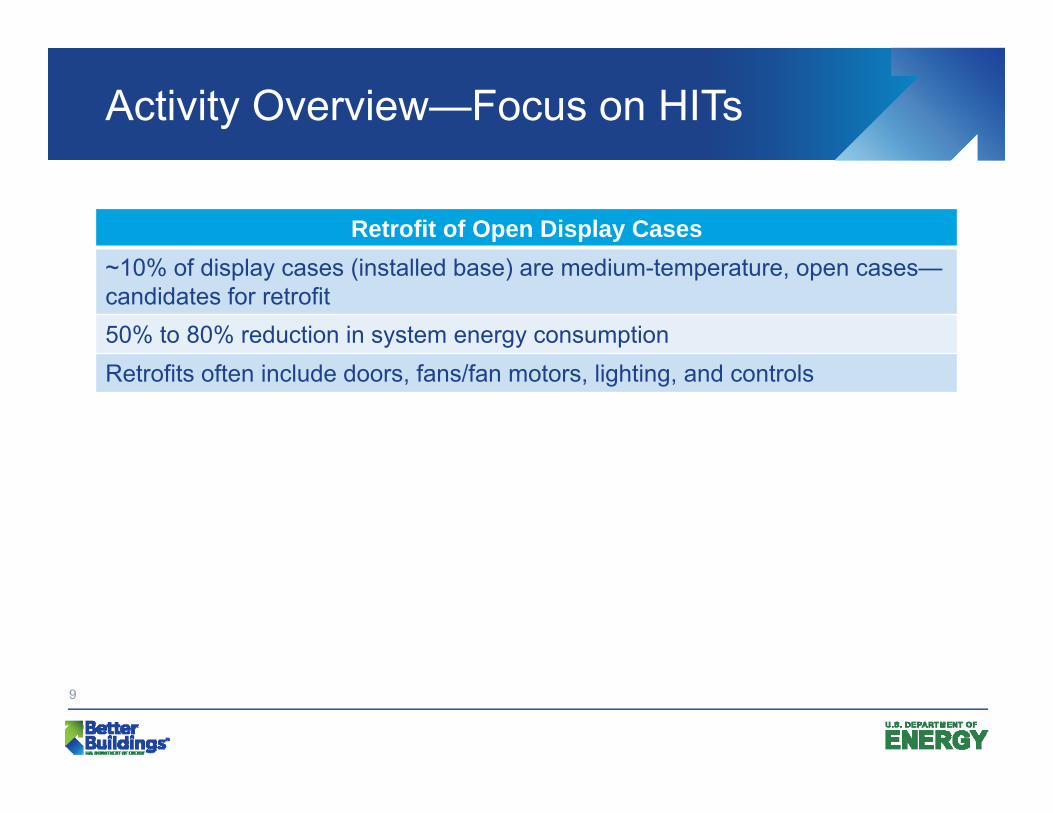
Retrofit of Open Display Cases ~10% of display cases (installed base) are medium-temperature, open cases— candidates for retrofit 50% to 80% reduction in system energy consumption Retrofits often include doors, fans/fan motors, lighting, and controls
9
Activity Overview—Focus on HITs
Case Retrofits—Questions to Explore:
We’ve already done much to support display-case retrofits. Do members need further support? If so, what is needed?
What information can you share regarding merchandising impacts?
How can we reach smaller chains and independents?
10
Speaker Presentation—Dick Lord, Carrier Corporation / Co-Chair ASHRAE SSPC 90.1
HVAC&R Efficiency Improvements Better Building Summit-2015
Richard Lord
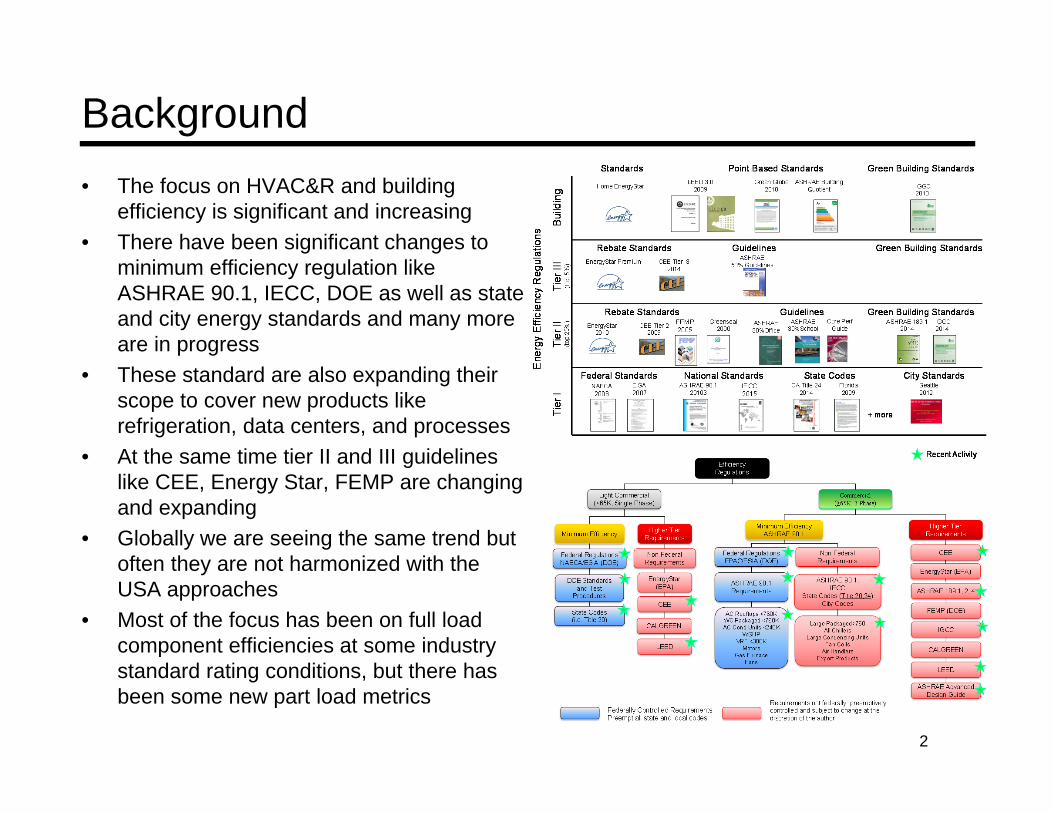
Background
• The focus on HVAC&R and building efficiency is significant and increasing
• There have been significant changes to minimum efficiency regulation like ASHRAE 90.1, IECC, DOE as well as state and city energy standards and many more are in progress
• These standard are also expanding their scope to cover new products like refrigeration, data centers, and processes
• At the same time tier II and III guidelines like CEE, Energy Star, FEMP are changing and expanding
• Globally we are seeing the same trend but often they are not harmonized with the USA approaches
• Most of the focus has been on full load component efficiencies at some industry standard rating conditions, but there has been some new part load metrics
2
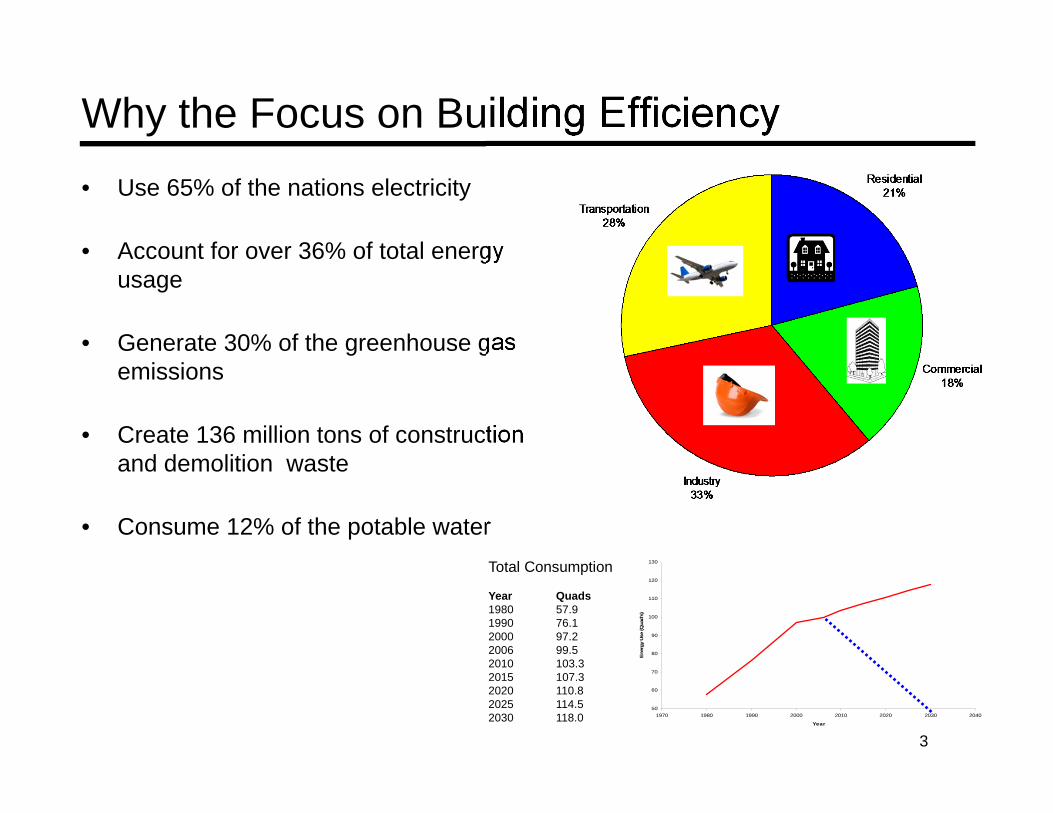
Why the Focus on Building Efficiency
• Use 65% of the nations electricity
• Account for over 36% of total energy usage
• Generate 30% of the greenhouse gas emissions
• Create 136 million tons of construction and demolition waste
• Consume 12% of the potable water Total Consumption 130
120
Year Quads 110
1980 57.9 1990 76.1
100
902000 97.2 2006 99.5 80
2010 103.3 2015 107.3 70
2020 110.8 60
Ener
gy U
se (Q
uad'
s)
1970 1980 1990 2000 2010 2020 2030 2040
Year
2025 114.5 50
2030 118.0
3
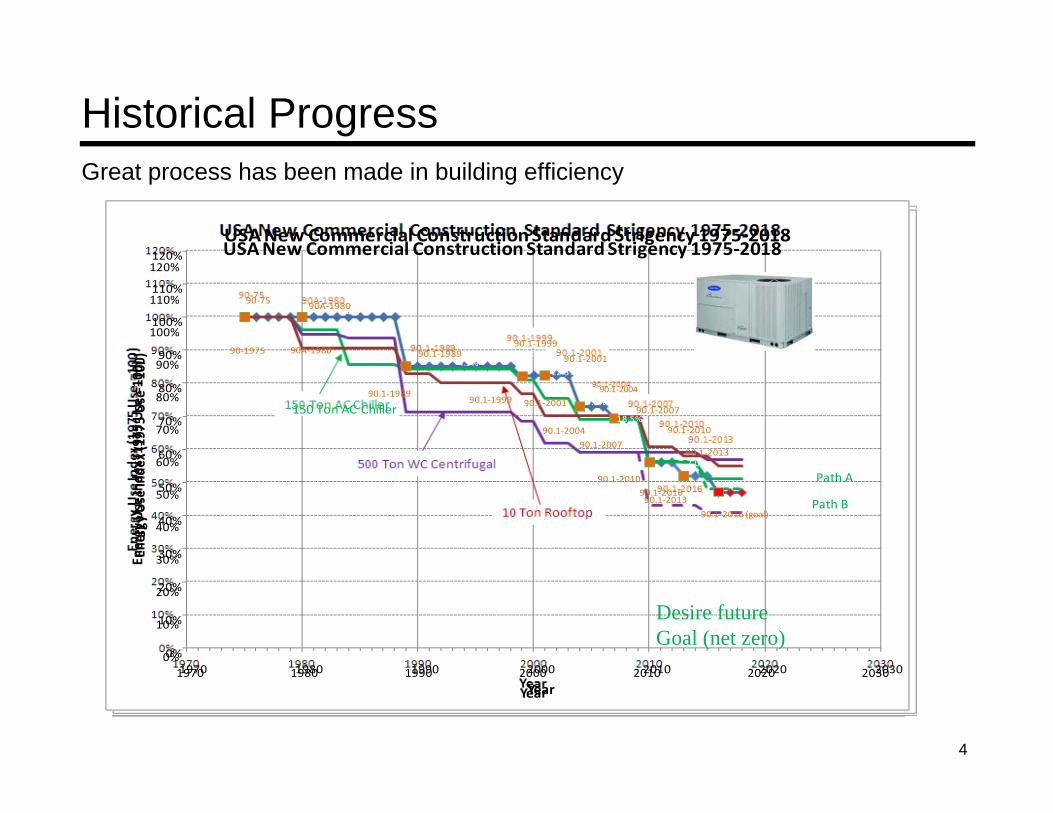
Historical Progress Great process has been made in building efficiency
USANew Commercial ConstructionStandardStrigency 1975‐2018USANew Commercial ConstructionStandardStrigency 1975‐2018120%
120%
110% 110% 90‐75 90A‐1980
14%` 100% 100%
90.1‐199990‐1975 90A‐1980 90.1‐1989 0.5%90% 90.1‐20014.5%
12.3%`90%
80% 90.1‐200490.1‐198980% 90.1‐1999 90.1‐2001 4.5%` 90.1‐2007150 Ton AC Chiller
18.5%`70% 90.1‐201070% 90.1‐2004 7.0%
90.1‐2007 90.1‐201360% 7.0%60%
Path A90.1‐2010 50% 90.1‐201650% 90.1‐2013 Path B
90.1‐2016 (goal)40%40%
30%30%
20%20%
Desire future10%10% Goal (net zero)
0%0% 1970 1980 1990 2000 2010 2020 20301970 1980 1990 2000 2010 2020 2030
YearYear
rgyU
seI
x(1975
Use=
Ene Energy
UseInde ndex
(1975Us
e=100) 100)
4
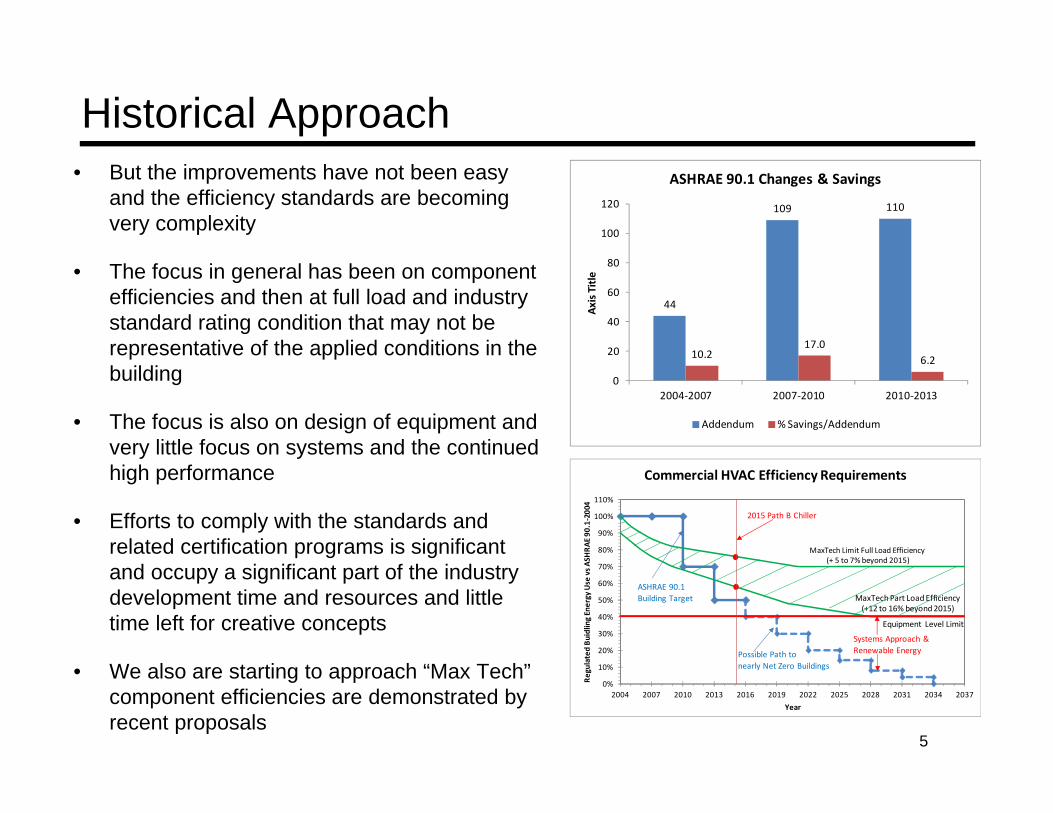
Historical Approach • But the improvements have not been easy
and the efficiency standards are becoming very complexity
• The focus in general has been on component efficiencies and then at full load and industry standard rating condition that may not be representative of the applied conditions in the building
• The focus is also on design of equipment and very little focus on systems and the continued high performance
• Efforts to comply with the standards and related certification programs is significant and occupy a significant part of the industry development time and resources and little time left for creative concepts
• We also are starting to approach “Max Tech” component efficiencies are demonstrated by recent proposals
5
0%
10%
20%
30%
40%
50%
60%
70%
80%
90%
100%
110%
2004 2007 2010 2013 2016 2019 2022 2025 2028 2031 2034 2037
Regulated Bu
idling Energy
Use
vs A
SHRA
E 90
.1‐2004
Year
Commercial HVAC Efficiency Requirements
ASHRAE 90.1 Building Target
Possible Path to nearly Net Zero Buildings
Equipment Level Limit
MaxTech Limit Full Load Efficiency (+ 5 to 7% beyond 2015)
MaxTech Part Load Efficiency (+12 to 16% beyond 2015)
Systems Approach & Renewable Energy
2015 Path B Chiller
44
109 110
10.2 17.0
6.2
0
20
40
60
80
100
120
2004‐2007 2007‐2010 2010‐2013
Axis Title
ASHRAE 90.1 Changes & Savings
Addendum % Savings/Addendum
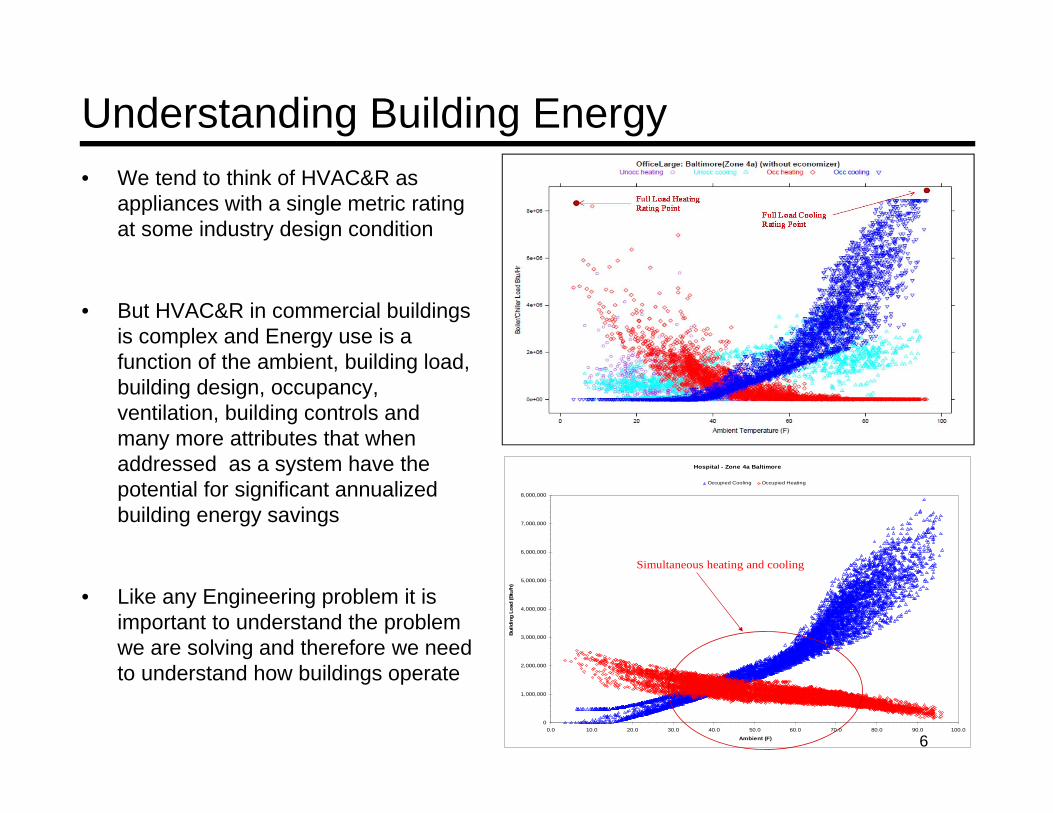
Understanding Building Energy • We tend to think of HVAC&R as
appliances with a single metric rating at some industry design condition
• But HVAC&R in commercial buildings is complex and Energy use is a function of the ambient, building load, building design, occupancy, ventilation, building controls and many more attributes that when addressed as a system have the potential for significant annualized building energy savings
• Like any Engineering problem it is important to understand the problem we are solving and therefore we need to understand how buildings operate
Bui
ldin
g Lo
ad (B
tu/h
)
8,000,000
Hospital - Zone 4a Baltimore
Occupied Cooling Occupied Heating
7,000,000
5,000,000
6,000,000
Simultaneous heating and cooling
4,000,000
3,000,000
2,000,000
1,000,000
0 0.0 10.0 20.0 30.0 40.0 50.0 60.0 70.0 80.0 90.0 100.0
Ambient (F) 6
Prescriptive Design vs Goals Standards
• Due to limited options to improve component efficiencies, standards are resorting to very complex prescriptive requirements
• For example for refrigeration condensers ASHRAE 90.1 section 6.5.11it now has the following; Design requirements for saturated condensing temperature Specific technology for condenser fan motors Defined condenser fan control Defined condenser set point control logic Floating suction pressure control logic Liquid subcooling prescriptive requirements Compressor crankcase heater control
• This may be OK for current technology but as we move to new low GWP refrigerants and new technology the above may actual not be the best options
• Standards should focus more on requirements and not design solutions. 7
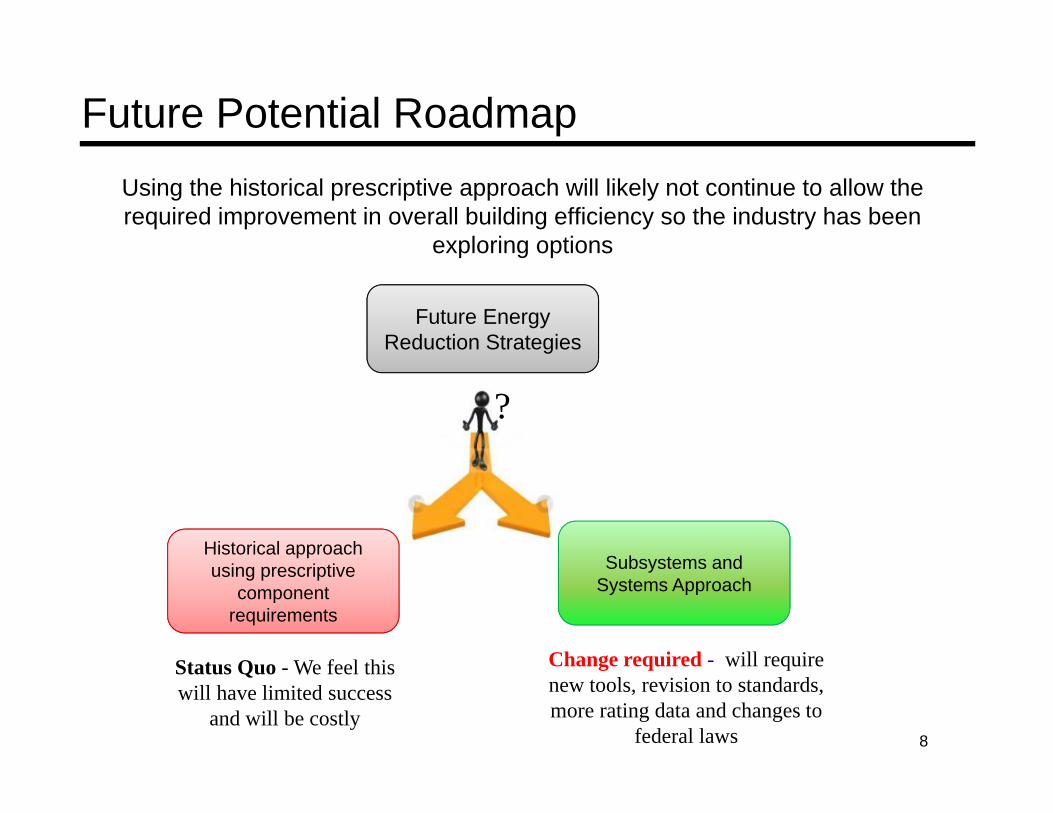
Future Potential Roadmap
Using the historical prescriptive approach will likely not continue to allow the required improvement in overall building efficiency so the industry has been
exploring options
Future Energy Reduction Strategies
Historical approach using prescriptive
component requirements
Subsystems and Systems Approach
?
Change required - will requireStatus Quo - We feel this new tools, revision to standards, will have limited success more rating data and changes to and will be costly
federal laws 8
Industry Initiatives
• Several organizations have started initiatives to look at alternate approaches to improving building efficiency thru systems and sub-systems approaches
• ASHRAE 90.1/ASHRAE 189.1 Advanced Energy Standards Committee (AES) – A special working committee has been formed to develop strategic plans and to look at where the standards should move in the future
• AHRI Systems Steering Committee (SSC) – This group was formed 3 years ago to begin to develop systems and subsystems approaches to efficiency. Recently they have complete strategic plans for each commercial section to begin the work on transition to systems and subsystems
• Alliance to Save Energy Systems Initiative (ASE) - This is a new 2 year initiative to look at a systems approach for the HCAC&R, light and overall building with a goal of producing a report on the overall benefits and recommendations to implement new approaches
• Global Initiatives – Globally there are systems initiatives underway in Europe (Second European Directive) and Canada (C873)
9
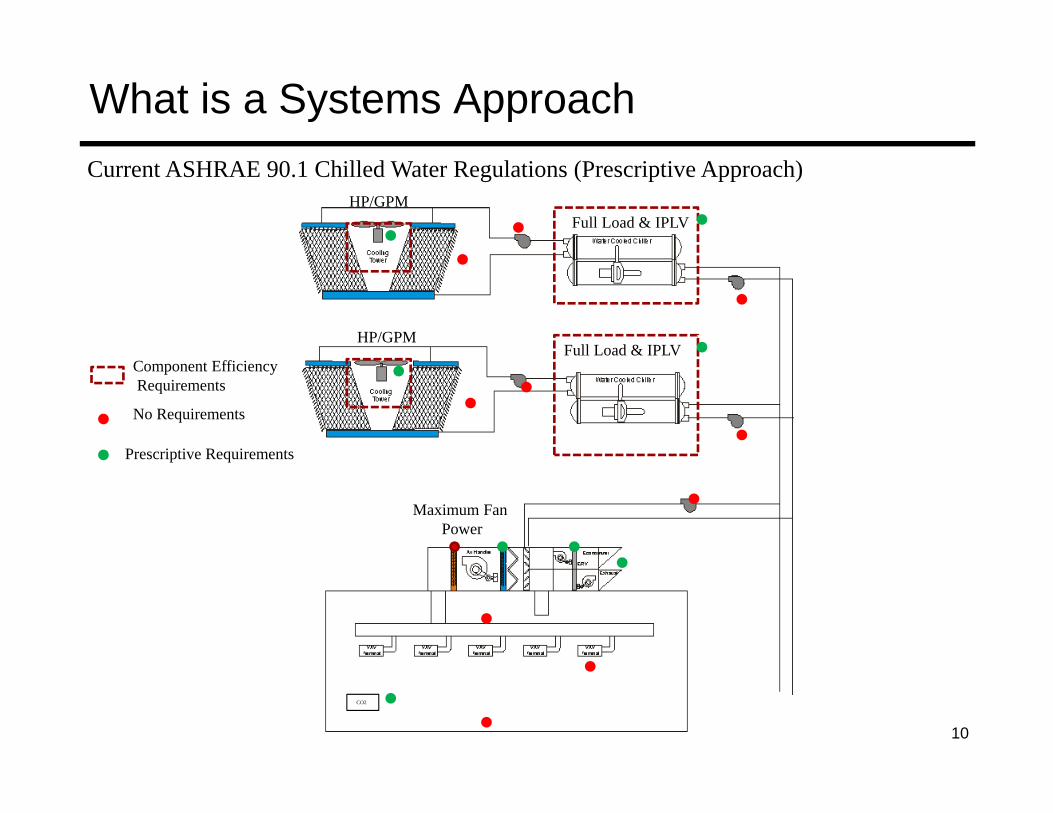
Full Load & IPLV
Full Load & IPLV HP/GPM
Maximum Fan Power
CO2
What is a Systems Approach
Current ASHRAE 90.1 Chilled Water Regulations (Prescriptive Approach) HP/GPM
Component Efficiency Requirements
No Requirements
Prescriptive Requirements
10
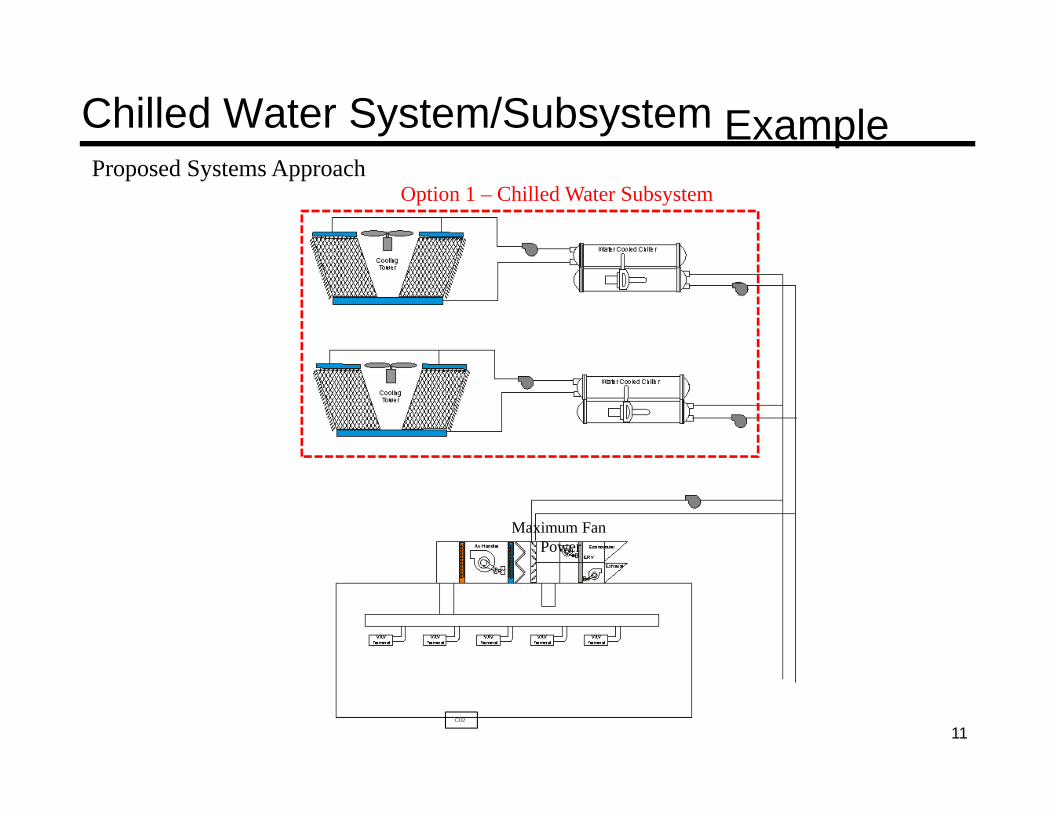
Chilled Water System/Subsystem Example Proposed Systems Approach
Option 1 – Chilled Water Subsystem
Maximum Fan Power
CO2
11
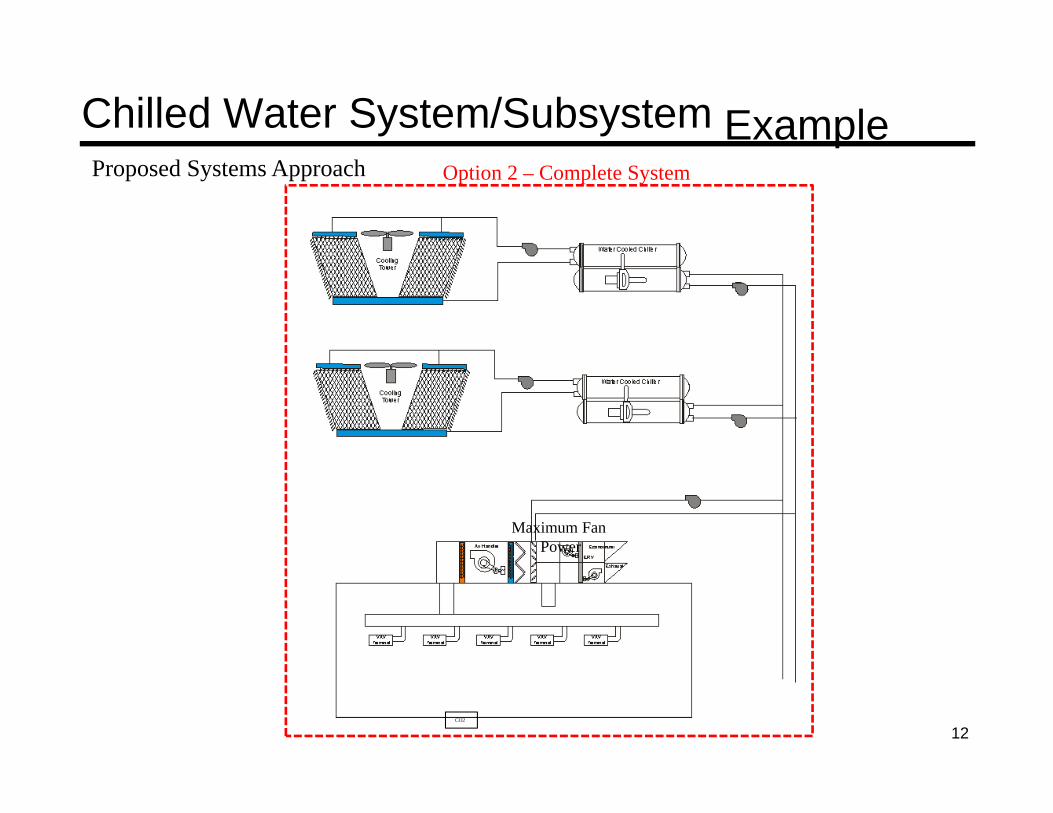
Chilled Water System/Subsystem Example Proposed Systems Approach
Maximum Fan Power
CO2
Option 2 – Complete System
12
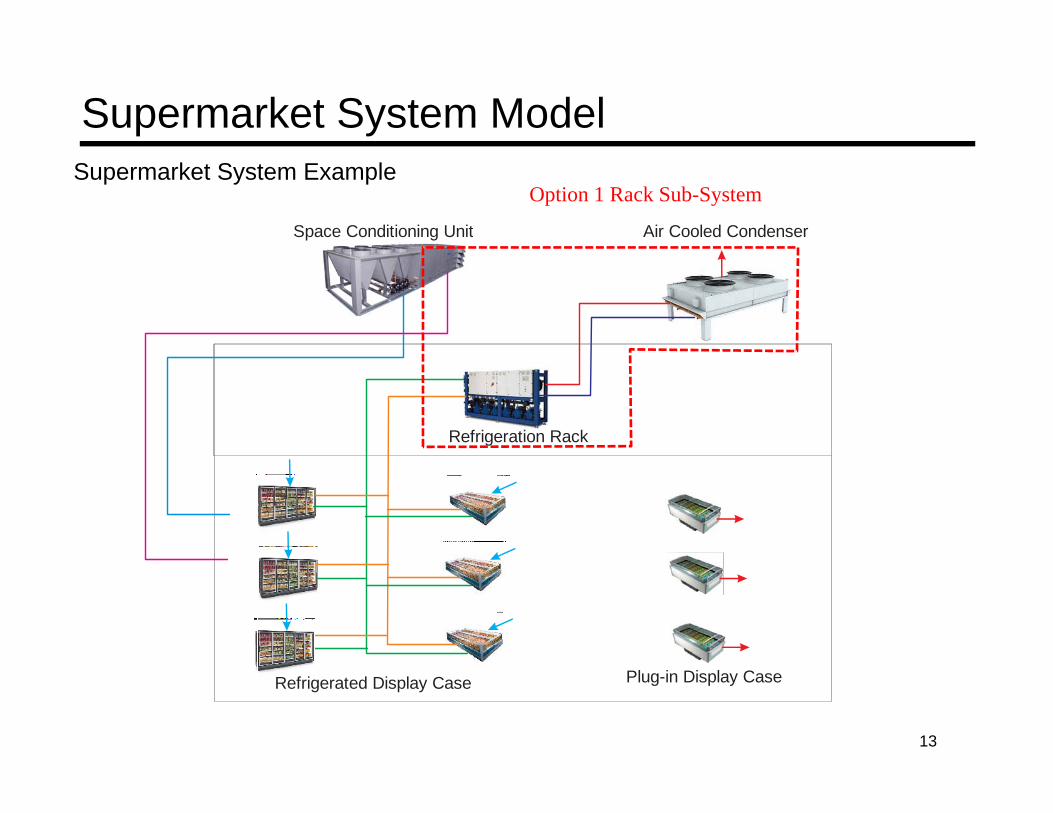
Supermarket System Model Supermarket System Example
Option 1 Rack Sub-System
Refrigeration Rack
Air Cooled Condenser
Refrigerated Display Case Plug-in Display Case
Space Conditioning Unit
13
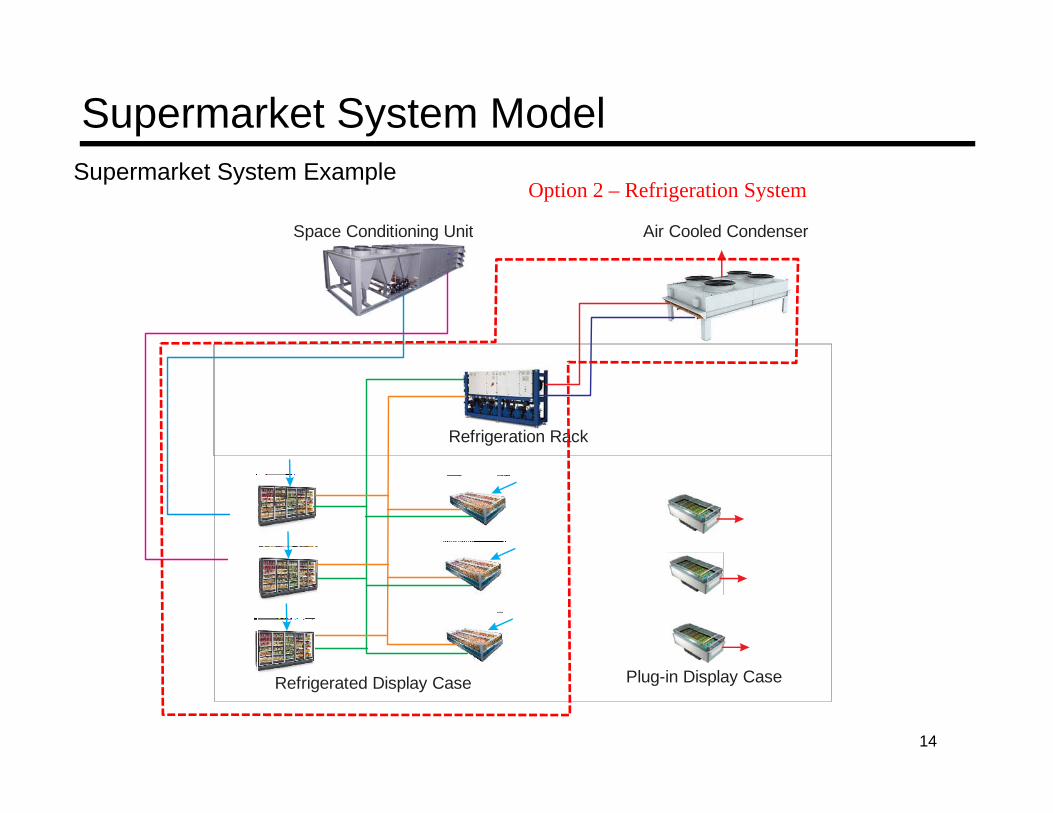
Supermarket System Model Supermarket System Example
Option 2 – Refrigeration System
Refrigeration Rack
Air Cooled Condenser
Refrigerated Display Case Plug-in Display Case
Space Conditioning Unit
14
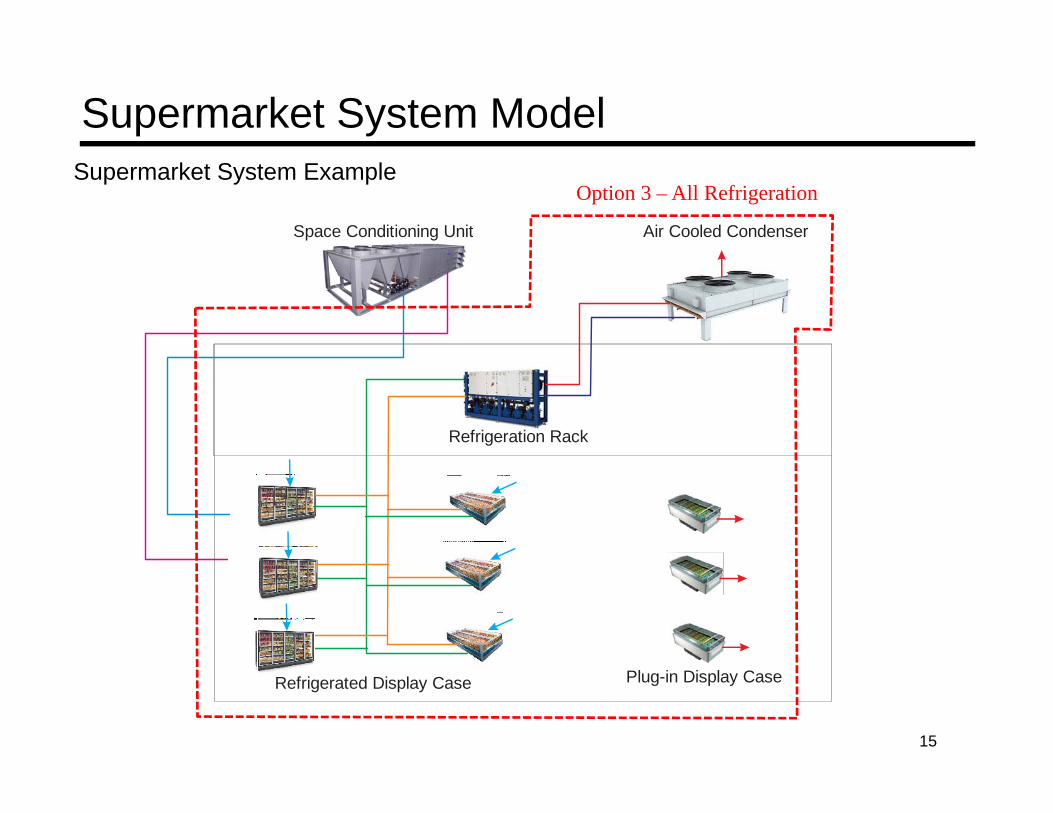
Supermarket System Model Supermarket System Example
Option 3 – All Refrigeration
Refrigeration Rack
Air Cooled Condenser
Refrigerated Display Case Plug-in Display Case
Space Conditioning Unit
15
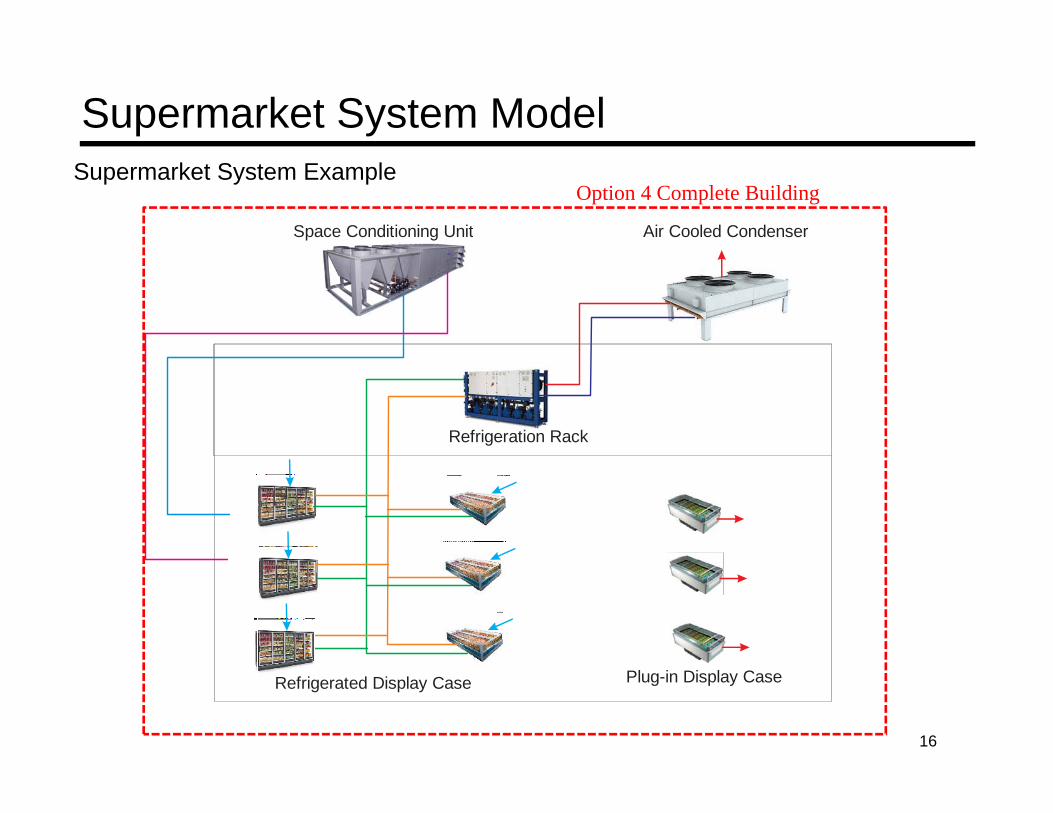
Supermarket System Model Supermarket System Example
Option 4 Complete Building
Refrigeration Rack
Air Cooled Condenser
Refrigerated Display Case Plug-in Display Case
Space Conditioning Unit
16
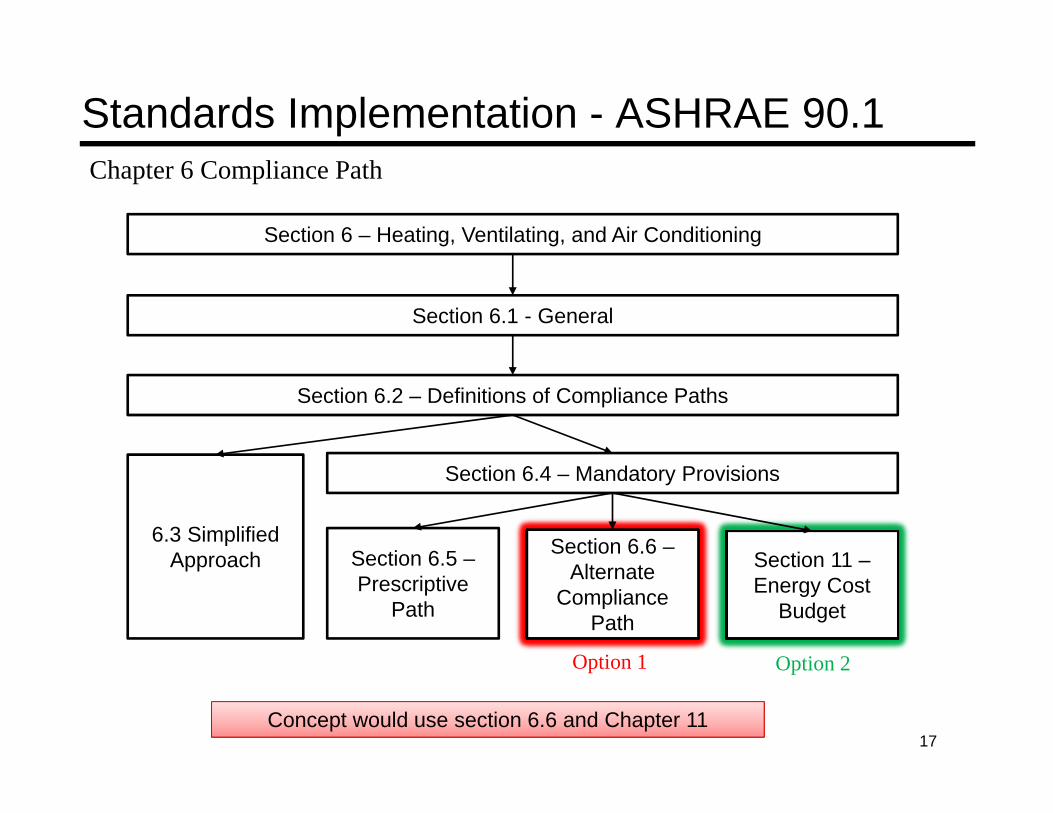
Standards Implementation - ASHRAE 90.1 Chapter 6 Compliance Path
Section 6 – Heating, Ventilating, and Air Conditioning
Section 6.1 - General
Section 6.2 – Definitions of Compliance Paths
6.3 Simplified Approach
Section 6.4 – Mandatory Provisions
Section 6.5 – Prescriptive
Path
Section 6.6 – Alternate
Compliance Path
Section 11 – Energy Cost
Budget
Concept would use section 6.6 and Chapter 11
Option 1 Option 2
17
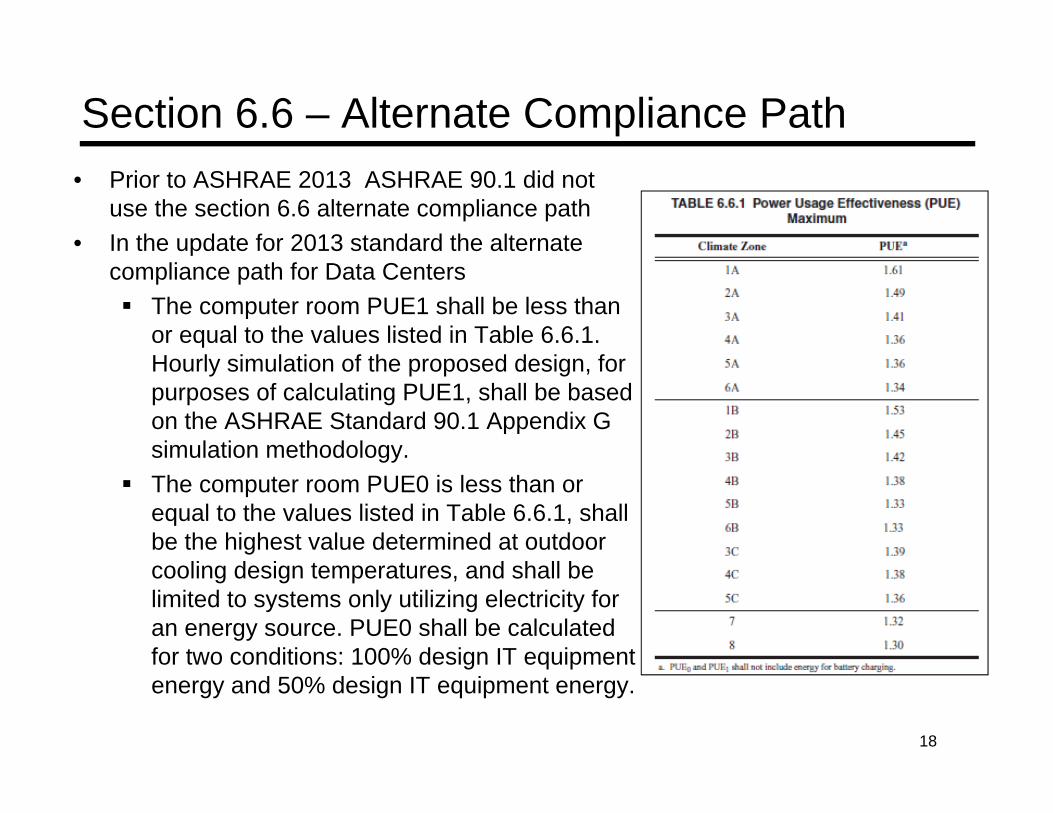
Section 6.6 – Alternate Compliance Path
• Prior to ASHRAE 2013 ASHRAE 90.1 did not use the section 6.6 alternate compliance path
• In the update for 2013 standard the alternate compliance path for Data Centers The computer room PUE1 shall be less than
or equal to the values listed in Table 6.6.1. Hourly simulation of the proposed design, for purposes of calculating PUE1, shall be based on the ASHRAE Standard 90.1 Appendix G simulation methodology.
The computer room PUE0 is less than or equal to the values listed in Table 6.6.1, shall be the highest value determined at outdoor cooling design temperatures, and shall be limited to systems only utilizing electricity for an energy source. PUE0 shall be calculated for two conditions: 100% design IT equipment energy and 50% design IT equipment energy.
18
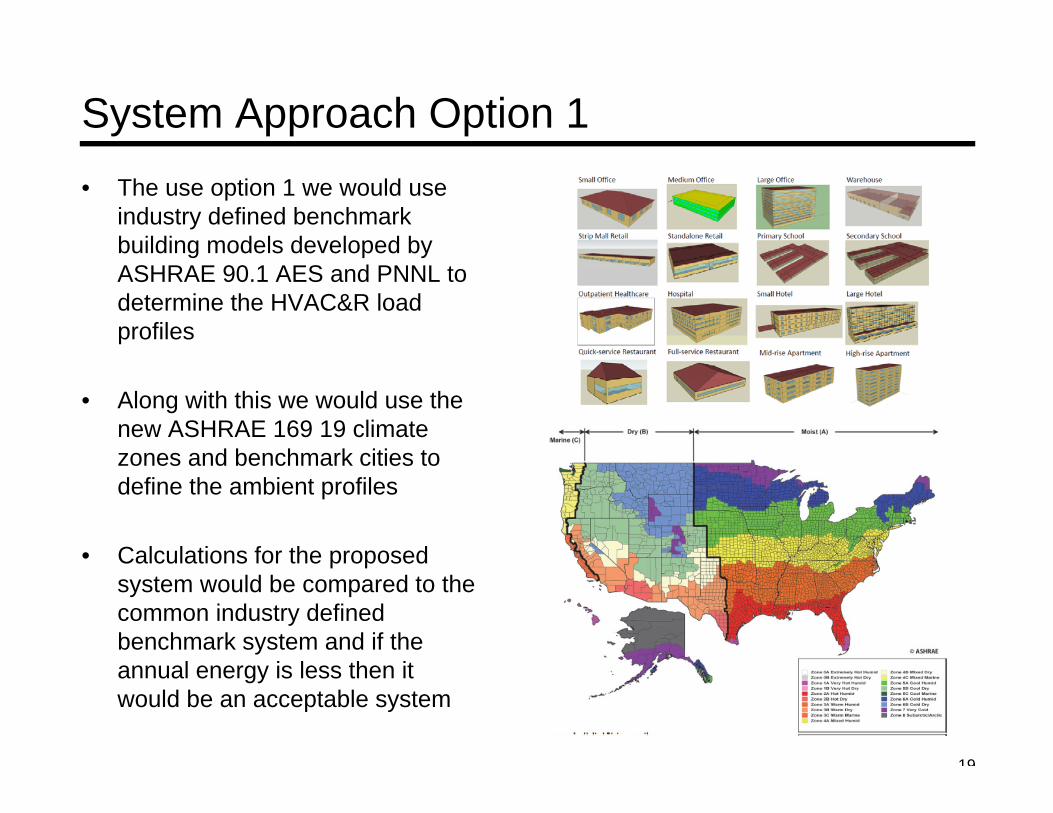
System Approach Option 1
• The use option 1 we would use industry defined benchmark building models developed by ASHRAE 90.1 AES and PNNL to determine the HVAC&R load profiles
• Along with this we would use the new ASHRAE 169 19 climate zones and benchmark cities to define the ambient profiles
• Calculations for the proposed system would be compared to the common industry defined benchmark system and if the annual energy is less then it would be an acceptable system
19
Option 2 – Full System Analysis
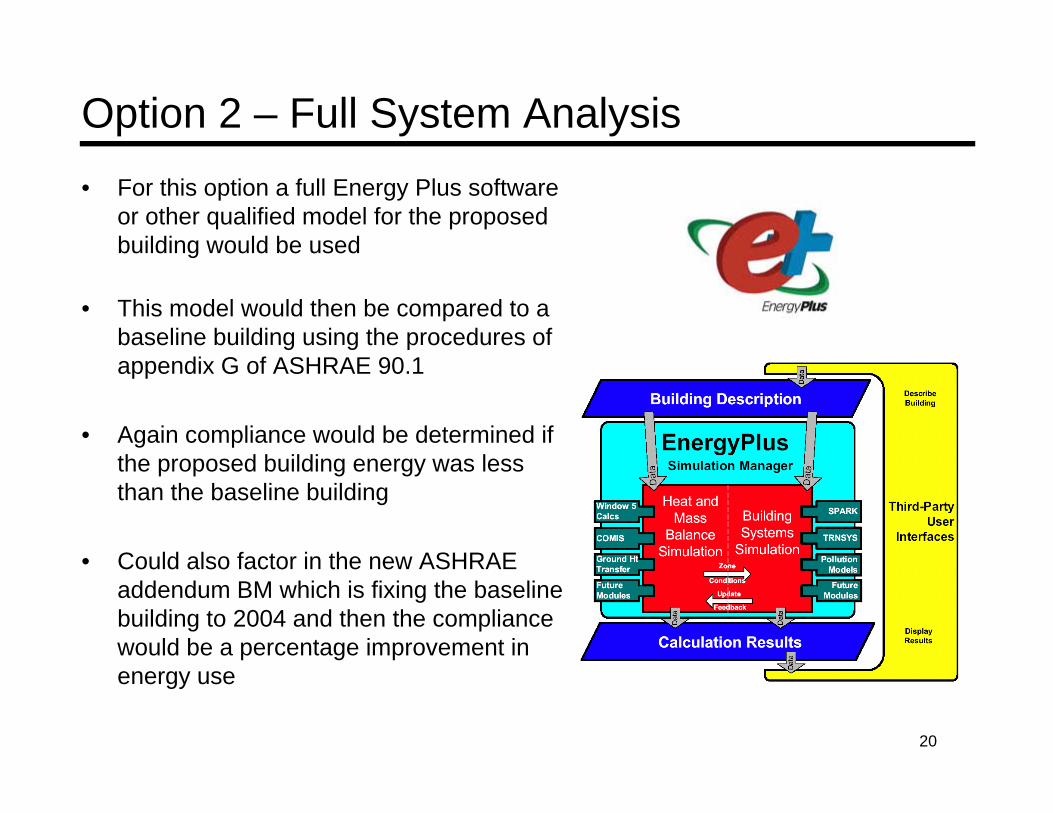
• For this option a full Energy Plus software or other qualified model for the proposed building would be used
• This model would then be compared to a baseline building using the procedures of appendix G of ASHRAE 90.1
• Again compliance would be determined if the proposed building energy was less than the baseline building
• Could also factor in the new ASHRAE addendum BM which is fixing the baseline building to 2004 and then the compliance would be a percentage improvement in energy use
20
Enabling Technology • Today only about 20% of the buildings are modeled due to the cost and
complexity.
• Typically this is done for large high end buildings and the average small building is not typically modeled and the prescriptive approach is used for compliance
• The industry is undertaking work to enabling greater use of modeling thru the following work;
Rating and certification of the complete operating map for the HVAC&R product – AHRI
Development of standards for standard representation of product performance and the electronic transfer of the data to simulation tools – ASHRAE 205P
Development of new tools that allow for easy use of option 1 and option 2 compliance methods – Carrier and AHRI
21
ASHRAE 205P Standard
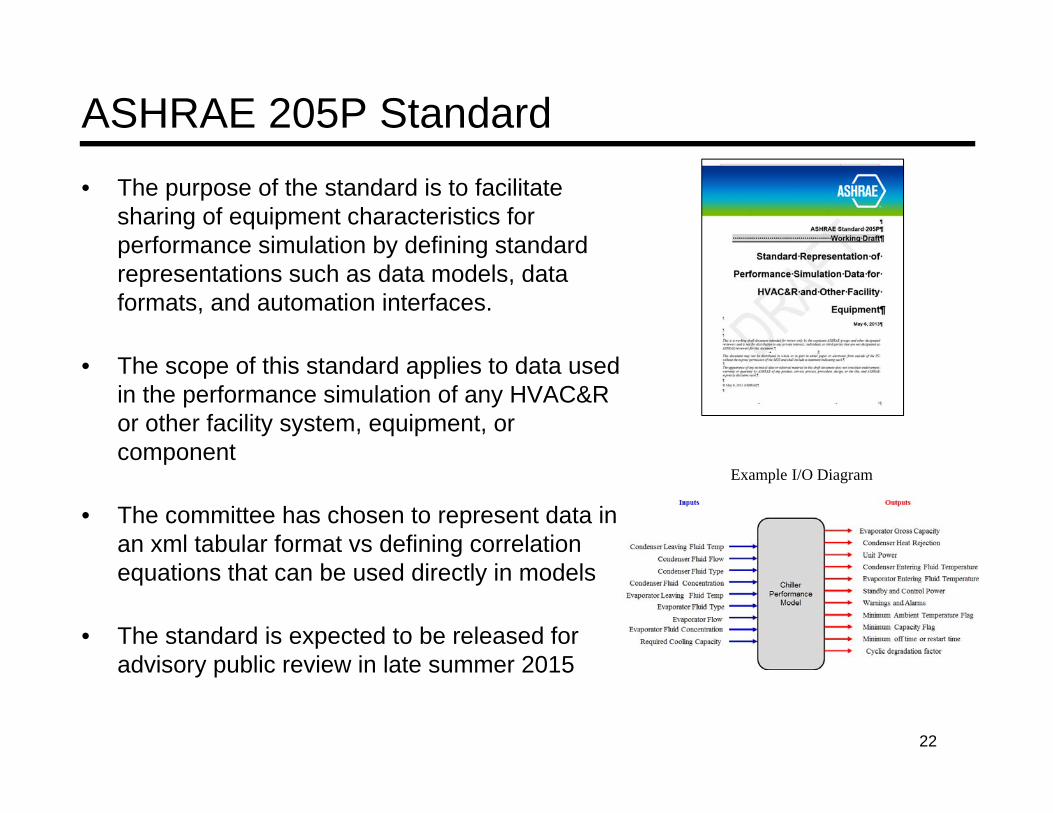
• The purpose of the standard is to facilitate sharing of equipment characteristics for performance simulation by defining standard representations such as data models, data formats, and automation interfaces.
• The scope of this standard applies to data used in the performance simulation of any HVAC&R or other facility system, equipment, or component
• The committee has chosen to represent data in an xml tabular format vs defining correlation equations that can be used directly in models
• The standard is expected to be released for advisory public review in late summer 2015
Example I/O Diagram
22
System and Subsystem Modeling Tool • At Carrier we have started to develop a tool that will be given to the industry to allow for
quick modeling and use of the systems and subsystems approach for compliance with energy standards
• Concept is to use a flexible visual Icon based system to allow for visual drawing of the systems and flow paths for air, chilled water, condenser water, hot water, etc.
• Each component in the model would have a performance correlation based on the new ASHRAE 205 Standard (Representation of Performance Simulation Data for HVAC&R and Other Facility Equipment)
• Concept is to allow for two system modeling approaches
Option 1 – Use default models and cities to allow for proof of compliance at a subsystem or system level with default equipment typical for the building
Option 2 – Use the tool to interface with Energy Plus to allow for a full building evaluation compliant with Chapter 11 or Appendix G relative to the based building requirements
23
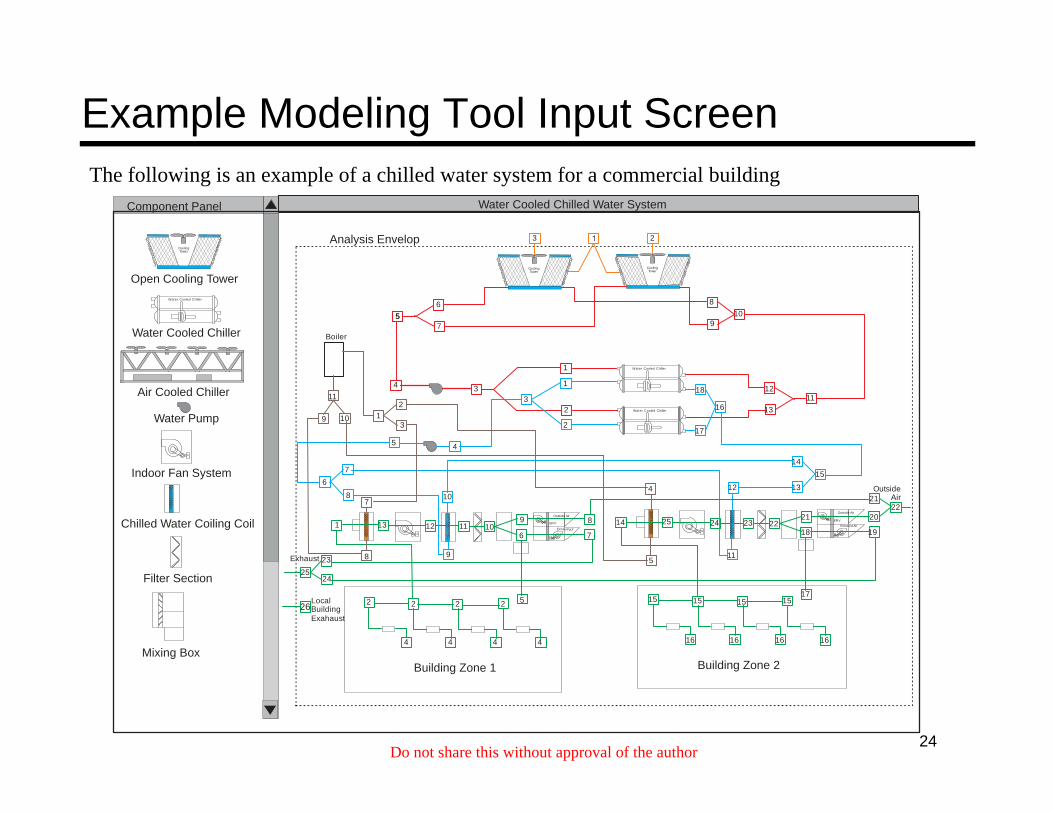
Example Modeling Tool Input Screen The following is an example of a chilled water system for a commercial building
Water Cooled Chilled Water SystemComponent Panel
3 2Analysis EnvelopCoolingTower
Cooling Tower
Cooling Tower
Open Cooling Tower Water Cooled Chiller 86
1055 97
Water Cooled Chiller Boiler
1 Water Cooled Chiller
14 3 18 12Air Cooled Chiller 11 3 11 2 16Water Cooled Chiller2 13
9 10 1Water Pump 3 2
17
5 4
14 7Indoor Fan System 15
6 4 12 13 Outside
8 10 21 Air7 22
Outside Air Outside Air 21 ERV 209 8ERV 2514 24 23 22 Exhaust Air
ExhaustA ir Chilled Water Coiling Coil 1 13 12 11 10
18 196 7
9 118Exhaust 23 5
25 24Filter Section
17 Local 2 5 15 15 15 152 2 226Building Exahaust
16 16 16 164 4 4 4
Mixing Box Building Zone 1 Building Zone 2
Do not share this without approval of the author 24

Questions
25

Speaker Presentation—Jeremy Litow, CLEAResult
Leveraging utility incentives for food retailers
Jeremy Litow
Grocery Practice Leader May 27, 2015
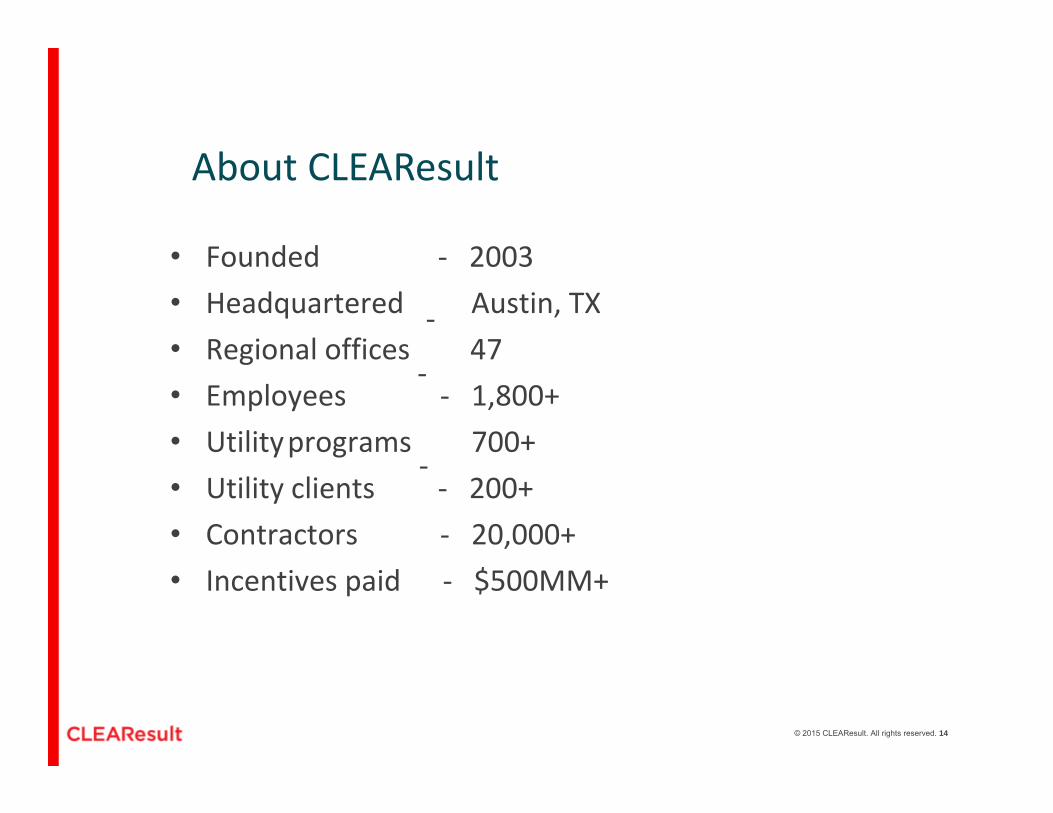
About CLEAResult
• Founded ‐ 2003
• Headquartered ‐ Austin, TX
• Regional offices ‐
47
• Employees ‐ 1,800+
• Utilityprograms ‐
700+
• Utility clients ‐ 200+
• Contractors ‐ 20,000+
• Incentives paid ‐ $500MM+
© 2015 CLEAResult. All rights reserved. 14
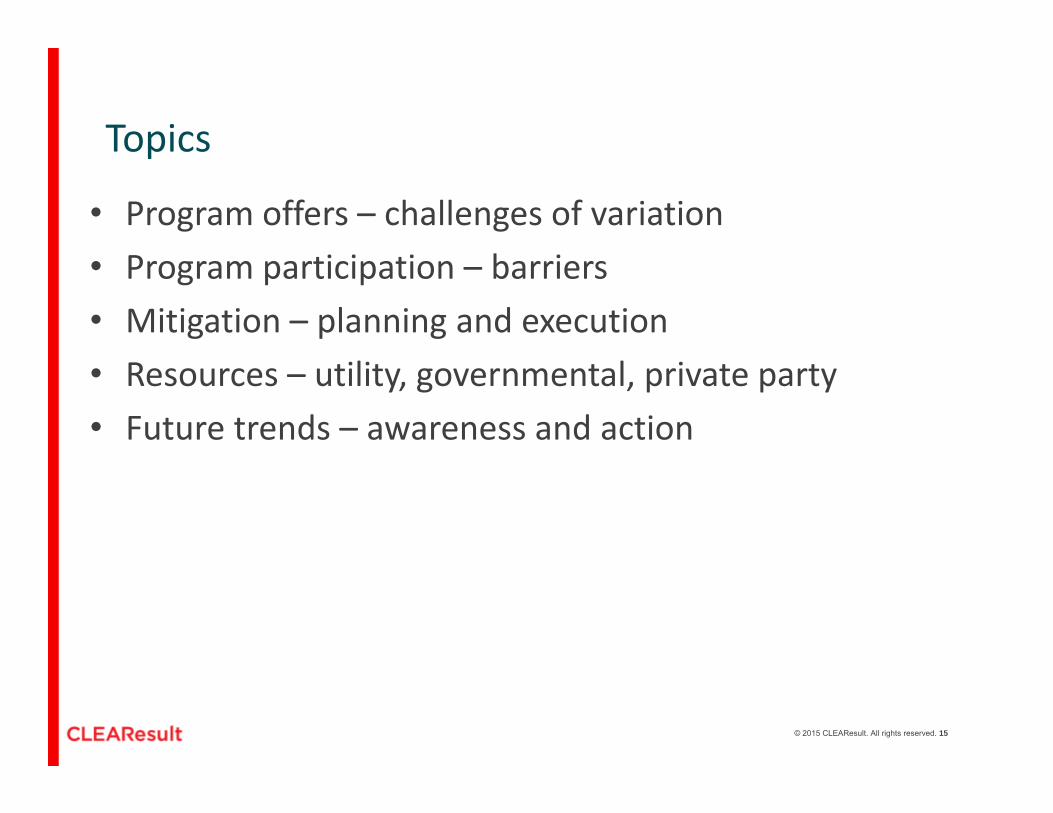
Topics
• Program offers – challenges of variation
• Program participation – barriers • Mitigation – planning and execution
• Resources – utility, governmental, private party
• Future trends – awareness and action
© 2015 CLEAResult. All rights reserved. 15
Program offers
• Prescriptive and custom
• Retrofit, new construction, retrocommissioning
• Efficiency, demand response, self generation
© 2015 CLEAResult. All rights reserved. 16
Variations and barriers to participation – why
• No national, utility style program
• Driven by regulation, which is local • Budget mismatches • Design intention to reduce risk
• Avoiding free ridership
• Subject matter limitations • Negative business impacts • Programs as rate case support
© 2015 CLEAResult. All rights reserved. 17
Mitigation
• Internal alignment – supports utility engagement • Objectives – 1 measure at 1000 sites, or 10
measures and 100 sites?
• Technical approaches – well defined package
• Aggregate data – how to target
© 2015 CLEAResult. All rights reserved. 18
© 2015 CLEAResult. All rights reserved. 19
1
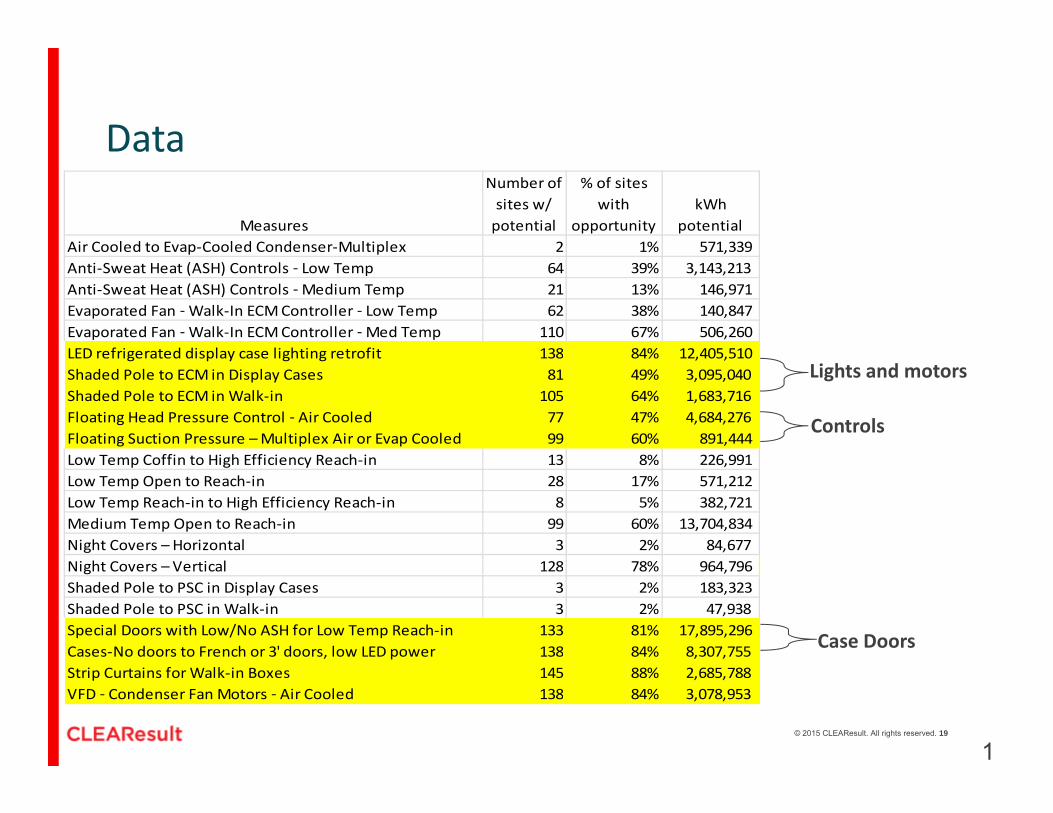
Controls
Lights and motors
Case Doors
Measures
Number of sites w/ potential
% of sites with
opportunity kWh
potential Air Cooled to Evap‐Cooled Condenser‐Multiplex 2 1% 571,339 Anti‐Sweat Heat (ASH) Controls ‐ Low Temp 64 39% 3,143,213 Anti‐Sweat Heat (ASH) Controls ‐Medium Temp 21 13% 146,971 Evaporated Fan ‐Walk‐In ECM Controller ‐ Low Temp 62 38% 140,847 Evaporated Fan ‐Walk‐In ECM Controller ‐Med Temp 110 67% 506,260 LED refrigerated display case lighting retrofit 138 84% 12,405,510 Shaded Pole to ECM in Display Cases 81 49% 3,095,040 Shaded Pole to ECM in Walk‐in 105 64% 1,683,716 Floating Head Pressure Control ‐ Air Cooled 77 47% 4,684,276 Floating Suction Pressure – Multiplex Air or Evap Cooled 99 60% 891,444 Low Temp Coffin to High Efficiency Reach‐in 13 8% 226,991 Low Temp Open to Reach‐in 28 17% 571,212 Low Temp Reach‐in to High Efficiency Reach‐in 8 5% 382,721 Medium Temp Open to Reach‐in 99 60% 13,704,834 Night Covers – Horizontal 3 2% 84,677 Night Covers – Vertical 128 78% 964,796 Shaded Pole to PSC in Display Cases 3 2% 183,323 Shaded Pole to PSC in Walk‐in 3 2% 47,938 Special Doors with Low/No ASH for Low Temp Reach‐in 133 81% 17,895,296 Cases‐No doors to French or 3' doors, low LED power 138 84% 8,307,755 Strip Curtains for Walk‐in Boxes 145 88% 2,685,788 VFD ‐ Condenser Fan Motors ‐ Air Cooled 138 84% 3,078,953
Data
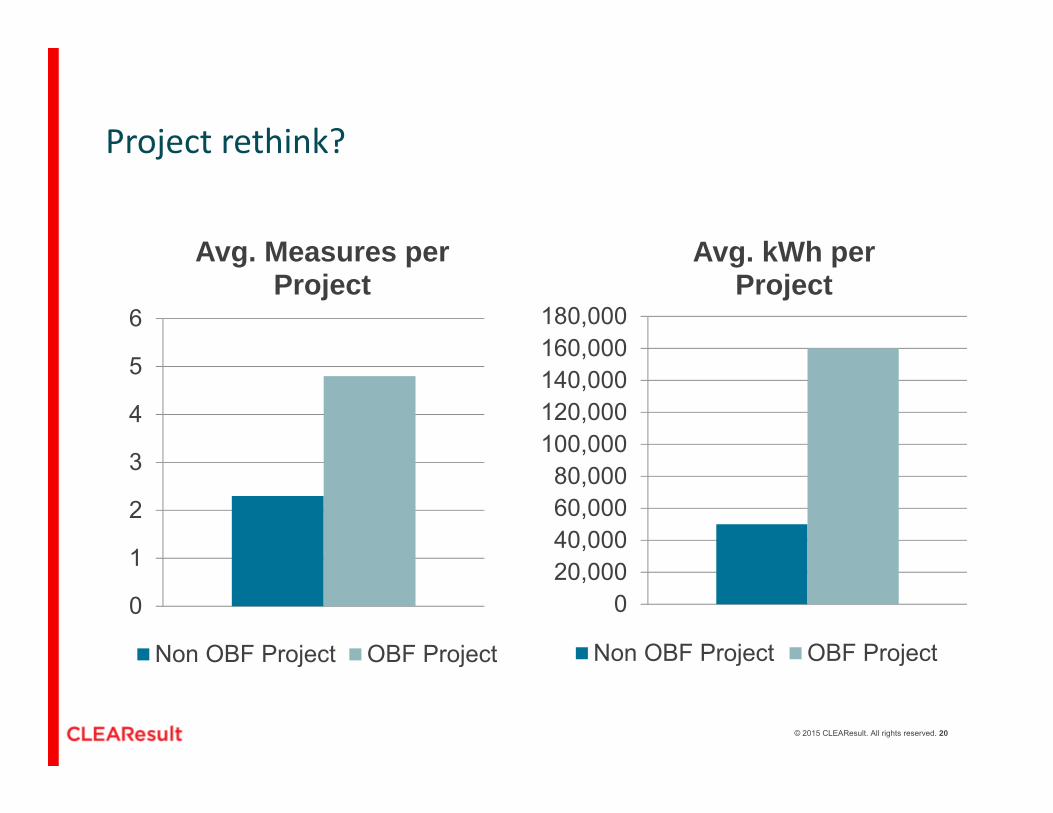
Project rethink?
Avg. Measures per Avg. kWh per Project Project
180,000 160,000
6
5 140,000 4 120,000
100,0003 80,000 2 60,000
40,0001 20,000 0 0
Non OBF Project OBF ProjectNon OBF Project OBF Project
© 2015 CLEAResult. All rights reserved. 20
© 2015 CLEAResult. All rights reserved. 21
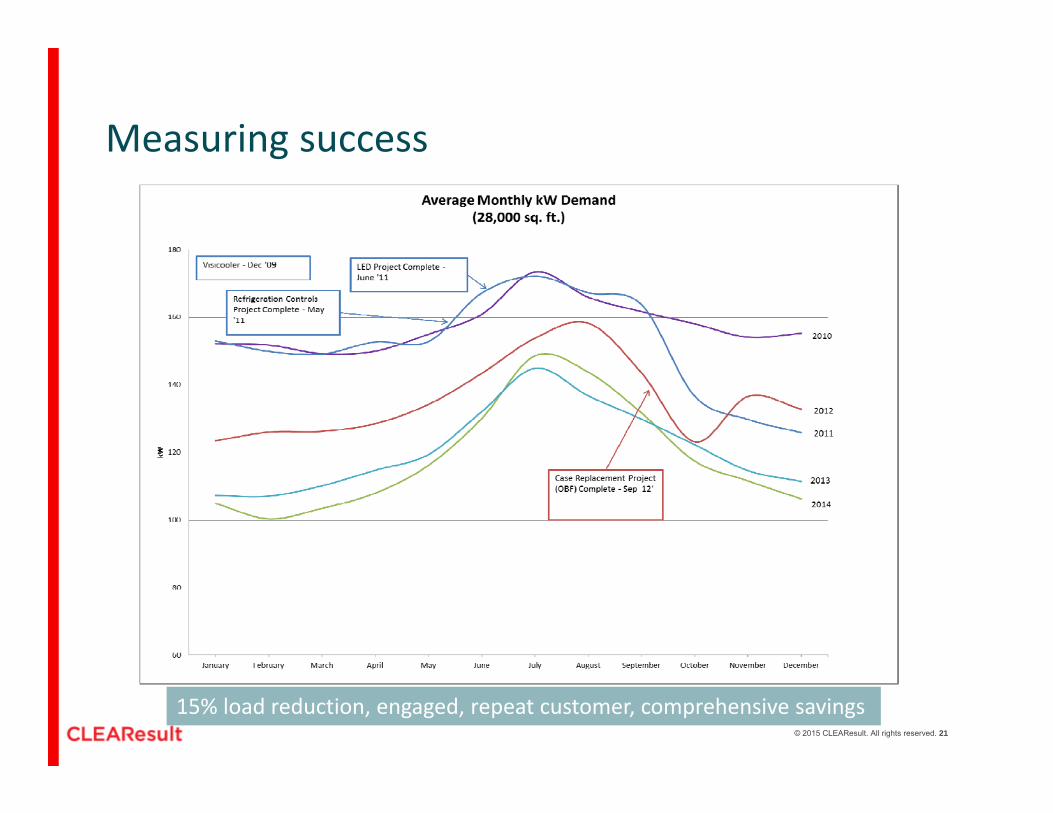
15% load reduction, engaged, repeat customer, comprehensive savings
Measuring success
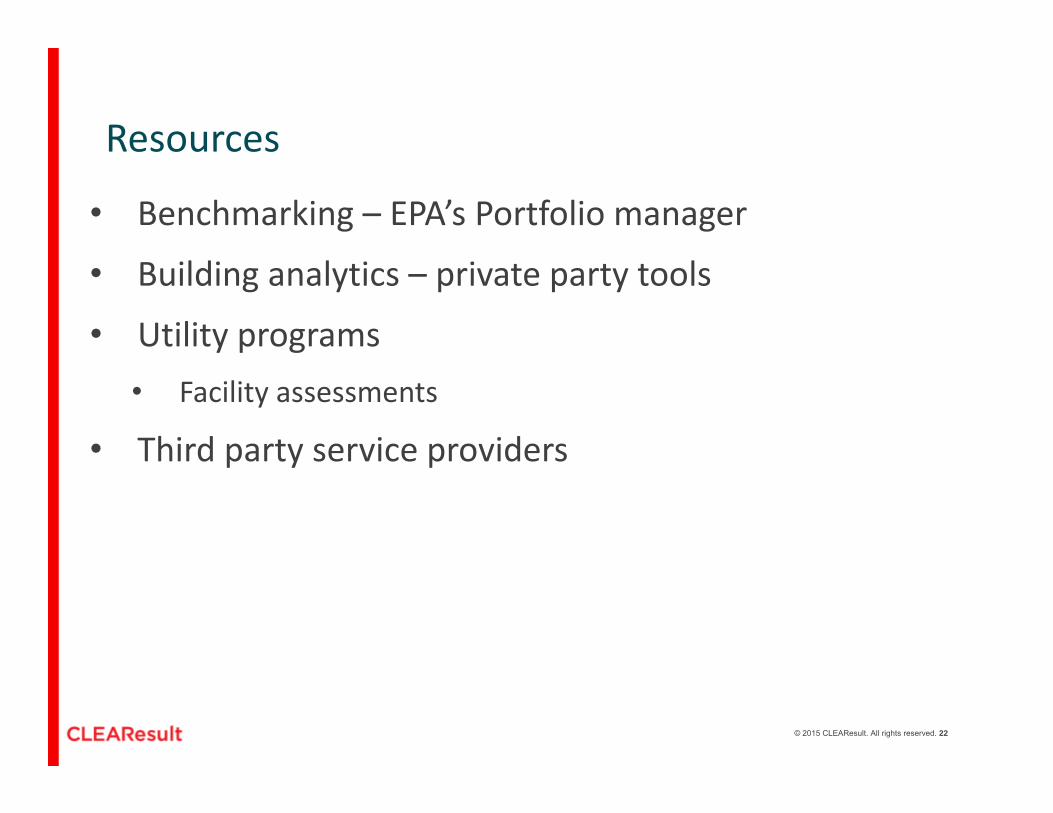
Resources
• Benchmarking – EPA’s Portfolio manager
• Building analytics – private party tools
• Utility programs • Facility assessments
• Third party service providers
© 2015 CLEAResult. All rights reserved. 22
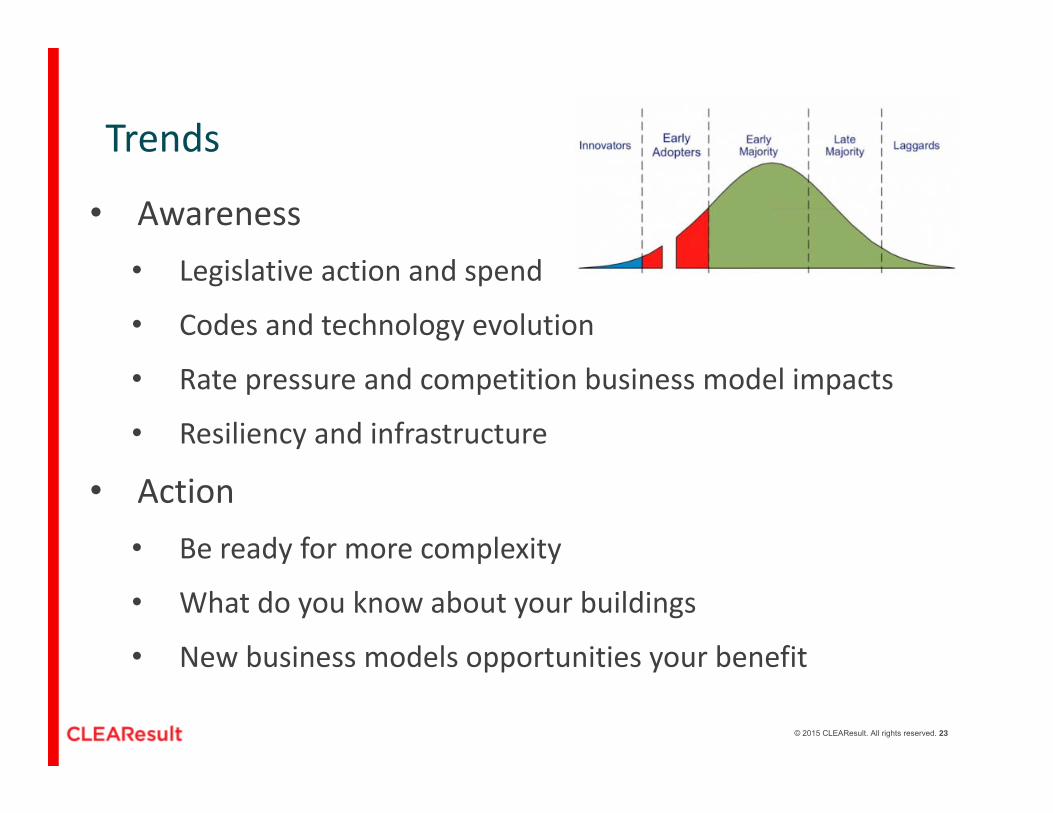
Trends
• Awareness • Legislative action and spend
• Codes and technology evolution
• Rate pressure and competition business model impacts
• Resiliency and infrastructure
• Action
• Be ready for more complexity
• What do you know about your buildings
• New business models opportunities your benefit
© 2015 CLEAResult. All rights reserved. 23

Speaker Presentation—John Wallace, Emerson Climate Technologies
Integrated SupermarketRefrigeration Presented To Better Buildings Alliance
John Wallace Director Innovation Emerson Climate Technologies Retail Solutions
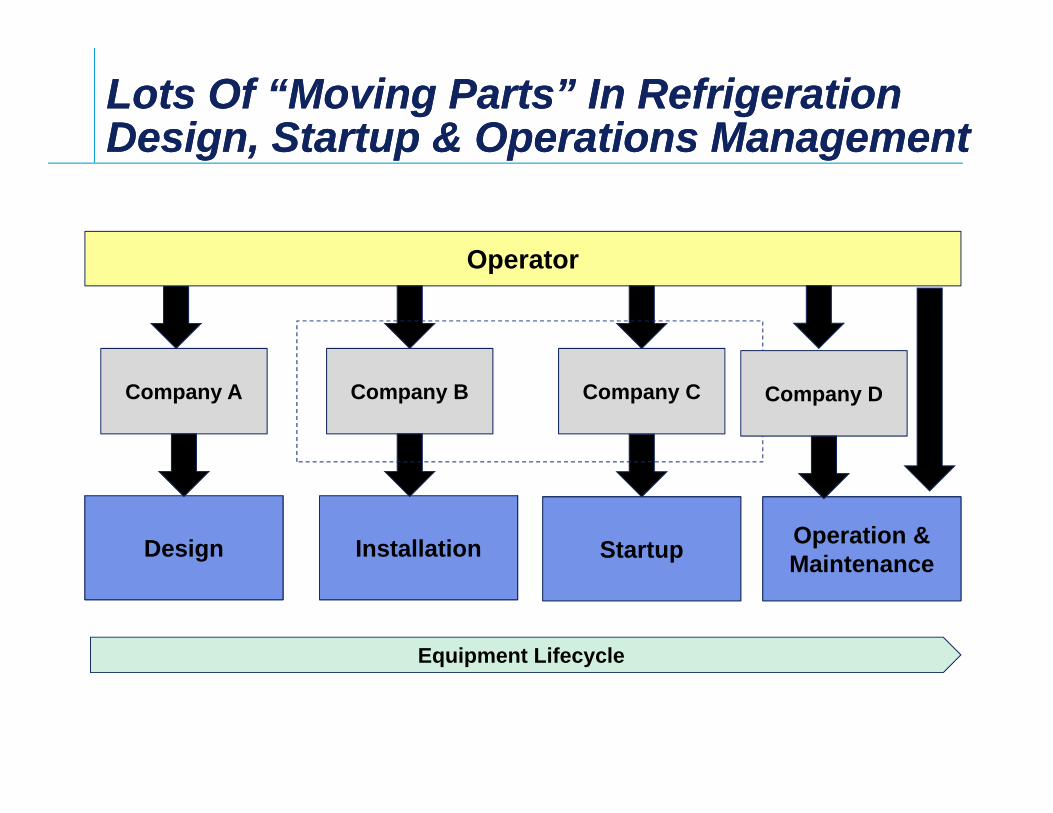
Lots Of “Moving Parts” In RefrigerationLots Of “Moving Parts” In RefrigerationDesign, Startup &Design, Startup & Operations ManagementOperations Management
Design
Company A
Operator
Installation Startup Operation & Maintenance
Company B Company C Company D
Equipment Lifecycle
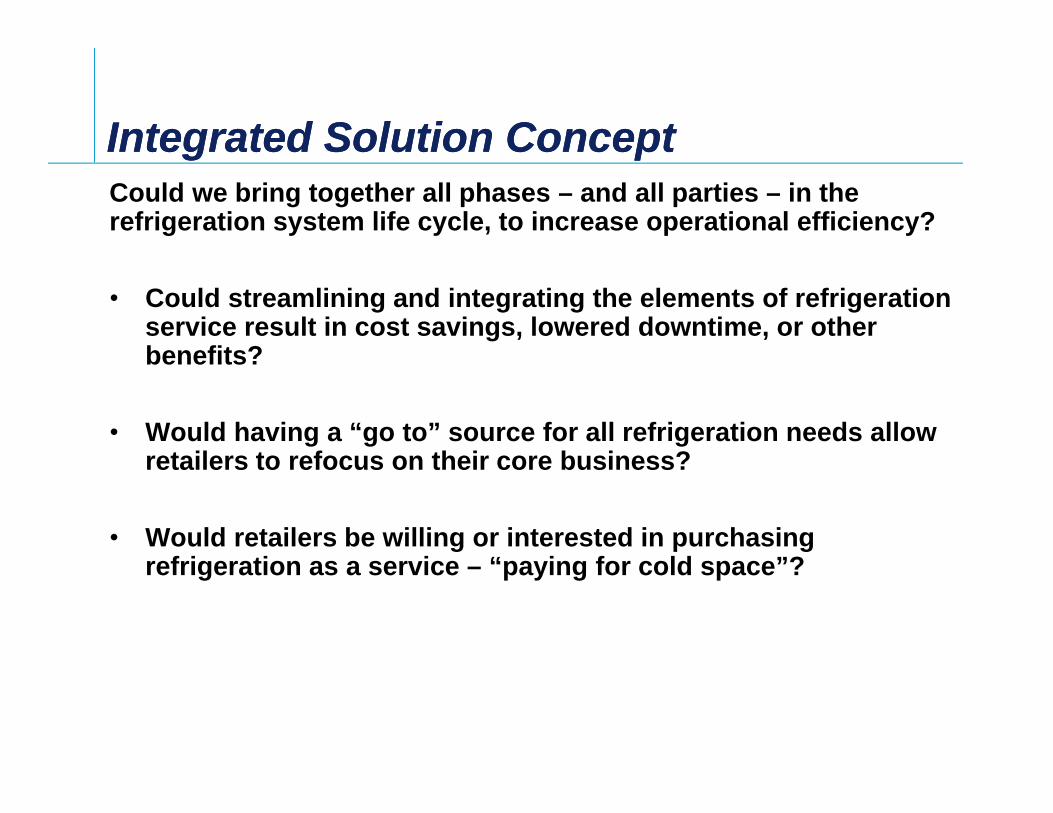
Integrated Solution ConceptIntegrated Solution Concept Could we bring together all phases – and all parties – in the refrigeration system life cycle, to increase operational efficiency?
• Could streamlining and integrating the elements of refrigerationservice result in cost savings, lowered downtime, or otherbenefits?
• Would having a “go to” source for all refrigeration needs allow retailers to refocus on their core business?
• Would retailers be willing or interested in purchasingrefrigeration as a service – “paying for cold space”?
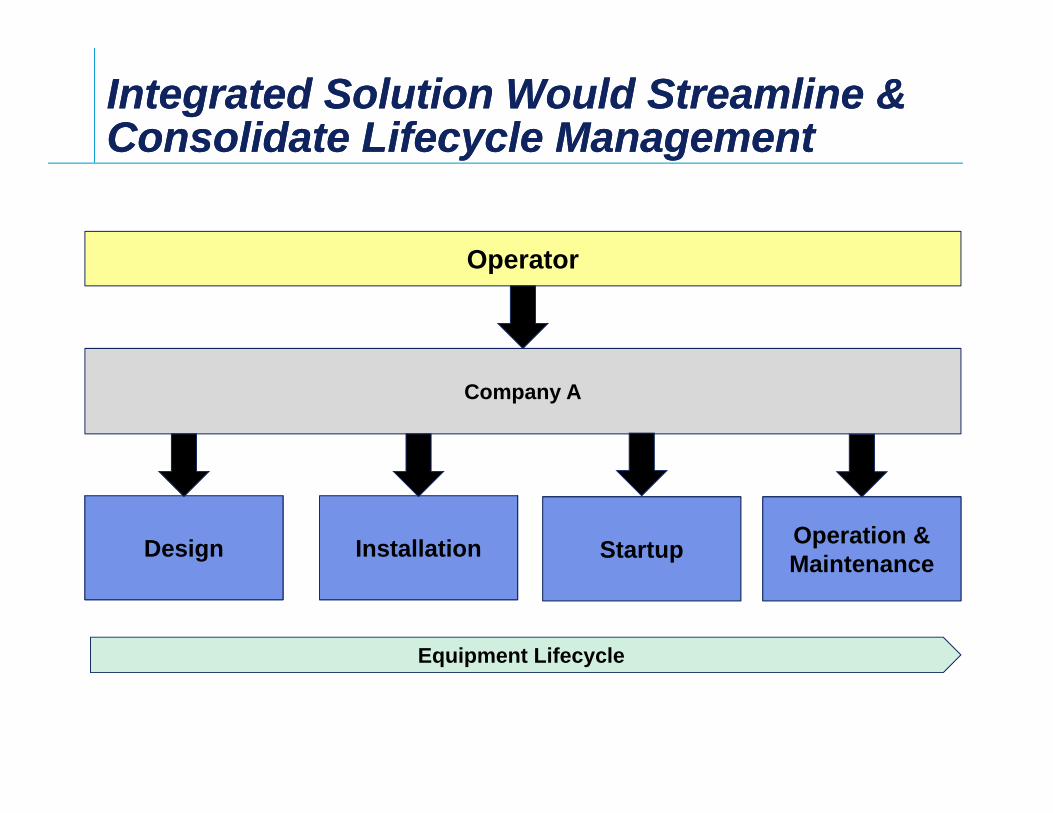
Integrated Solution Would StreamlineIntegrated Solution Would Streamline && Consolidate Lifecycle ManagementConsolidate Lifecycle Management
Operator
Design Installation Startup Operation & Maintenance
Company A
Equipment Lifecycle
Filename/Presenter-Topic: 5/22/2015
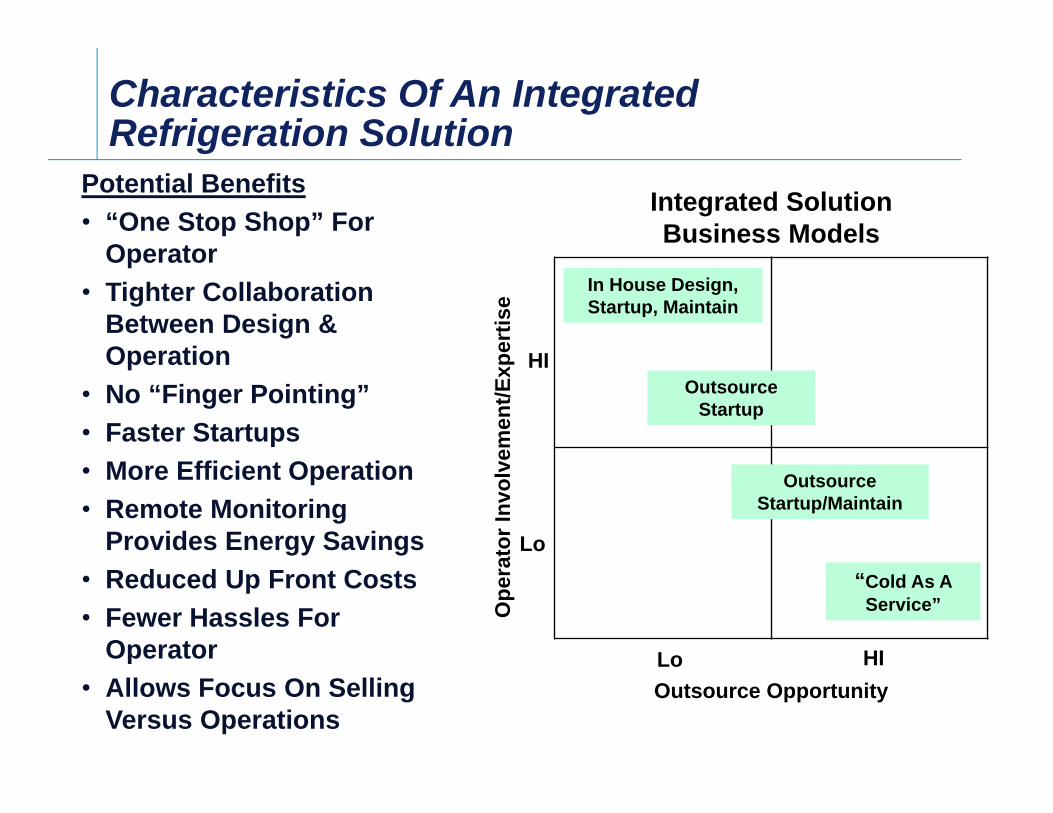
Characteristics Of An Integrated Refrigeration Solution
Potential Benefits • “One Stop Shop” For
Operator
Integrated Solution Business Models
• Tighter Collaboration Between Design &
xper
tise
In House Design, Startup, Maintain
Operation HI • No “Finger Pointing” • Faster Startups
nt/E
me
• More Efficient Operation olve
• Remote Monitoring Inv
Provides Energy Savings Lotor
• Reduced Up Front Costs
Ope
ra “Cold As A
• Fewer Hassles For Service”
Operator Lo HI • Allows Focus On Selling Outsource Opportunity
Versus Operations
Outsource Startup
Outsource Startup/Maintain
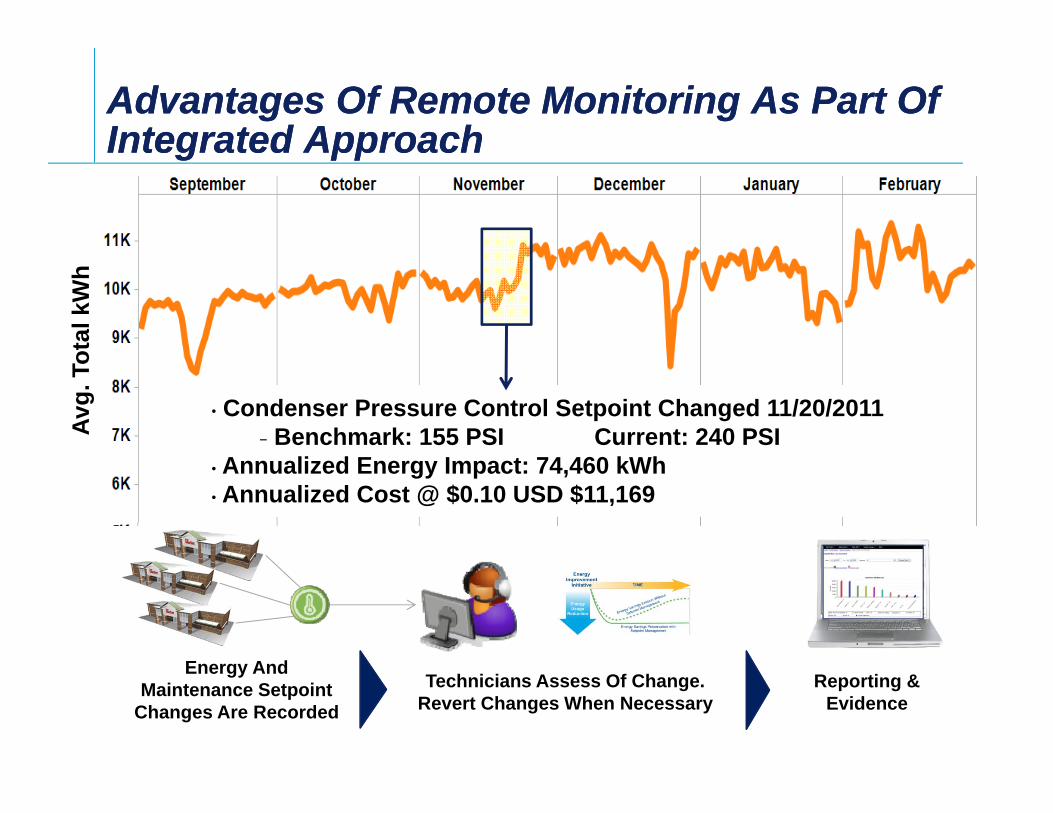
Advantages OfAdvantages Of Remote Monitoring As Part OfRemote Monitoring As Part OfIntegrated ApproachIntegrated Approach
• Condenser Pressure Control Setpoint Changed 11/20/2011 − Benchmark: 155 PSI Current: 240 PSI
• Annualized Energy Impact: 74,460 kWh • Annualized Cost @ $0.10 USD $11,169
Avg.
Tot
al k
Wh
Energy And Technicians Assess Of Change. Reporting &Maintenance Setpoint
Revert Changes When Necessary EvidenceChanges Are Recorded
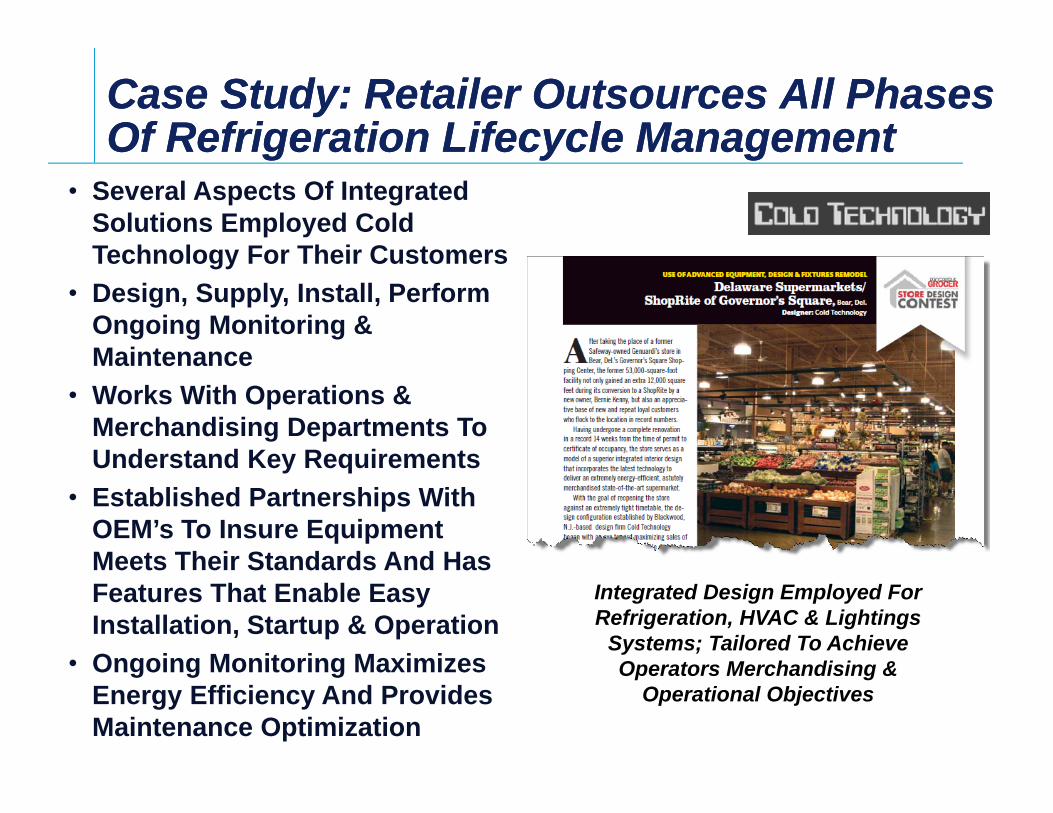
Case Study:Case Study: Retailer OutsourcesRetailer Outsources All PhasesAll Phases Of Refrigeration Lifecycle ManagementOf Refrigeration Lifecycle Management
• Several Aspects Of Integrated Solutions Employed Cold Technology For Their Customers
• Design, Supply, Install, Perform Ongoing Monitoring & Maintenance
• Works With Operations & Merchandising Departments To Understand Key Requirements
• Established Partnerships With OEM’s To Insure Equipment Meets Their Standards And Has Features That Enable Easy Installation, Startup & Operation
• Ongoing Monitoring Maximizes Energy Efficiency And Provides Maintenance Optimization
Integrated Design Employed For Refrigeration, HVAC & Lightings
Systems; Tailored To Achieve Operators Merchandising &
Operational Objectives
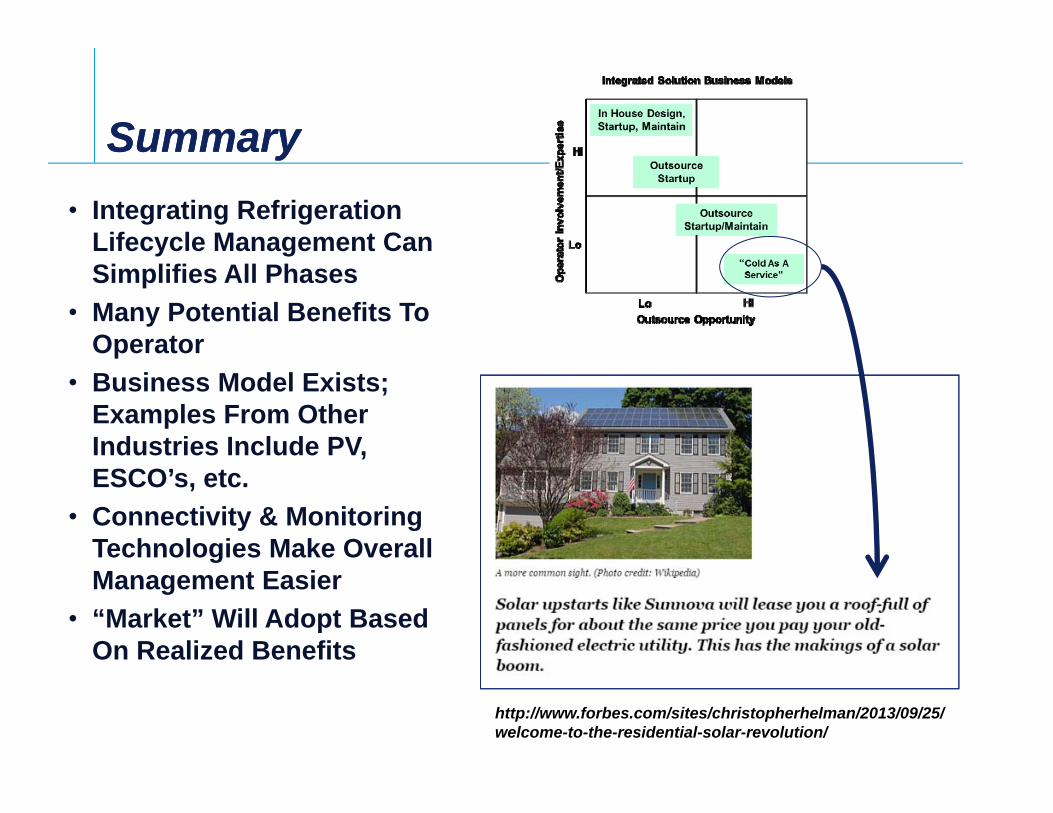
SummarySummary • Integrating Refrigeration
Lifecycle Management Can Simplifies All Phases
• Many Potential Benefits To Operator
• Business Model Exists; Examples From Other Industries Include PV, ESCO’s, etc.
• Connectivity & Monitoring Technologies Make Overall Management Easier
• “Market” Will Adopt Based On Realized Benefits
http://www.forbes.com/sites/christopherhelman/2013/09/25/ welcome-to-the-residential-solar-revolution/