Embed Size (px)
Citation preview

Maximizing the Value of Resilience
Presented by: Stephen Bourne, P.E.
ASFPM National Conference, 2018
June 21, 2018

Resilience is the New Black
2
Source: Google N-Gram Viewer
1800 1900 2000
Develop a tool to forecast resilience under current and proposed city master plans

Recovery
Natural Disaster
Recovery
Natural disasters are simulated at the size and frequency resulting from climate change.
Natural Disaster
Natural Disasters result in little drop
in prosperity
Recovery is fast due to preparedness
Natural Disasters result in large drop
in prosperity
Lack of preparedness makes it difficult to recover. Sometimes the situation worsens after the disaster.
City Prosperity
Index(UN-Specified Index
of City Wellness) Resilient City
UnresilientCity
High Rate of Improvement
Low Rate of Improvement
Business as Usual
Business as Usual
Recovers after a long time, and remains at low rate of improvement.
Resumes high rate of improvement quickly.
Business as Usual
Business as Usual
2015 2020 2025 2030 2035 2040
Quantifying Resilience

Requirements for Forecasting Resilience
• Capture interacting systems (Economy, People, Infrastructure, Natural)
• Include business-as-usual as well as disasters
• Include disasters that are representative of climate change effects
• Allow for addition of proposed strategies and measures their effect
• Include a long enough time line to measure return on investment
EmploymentForecasts jobs based on economic growth
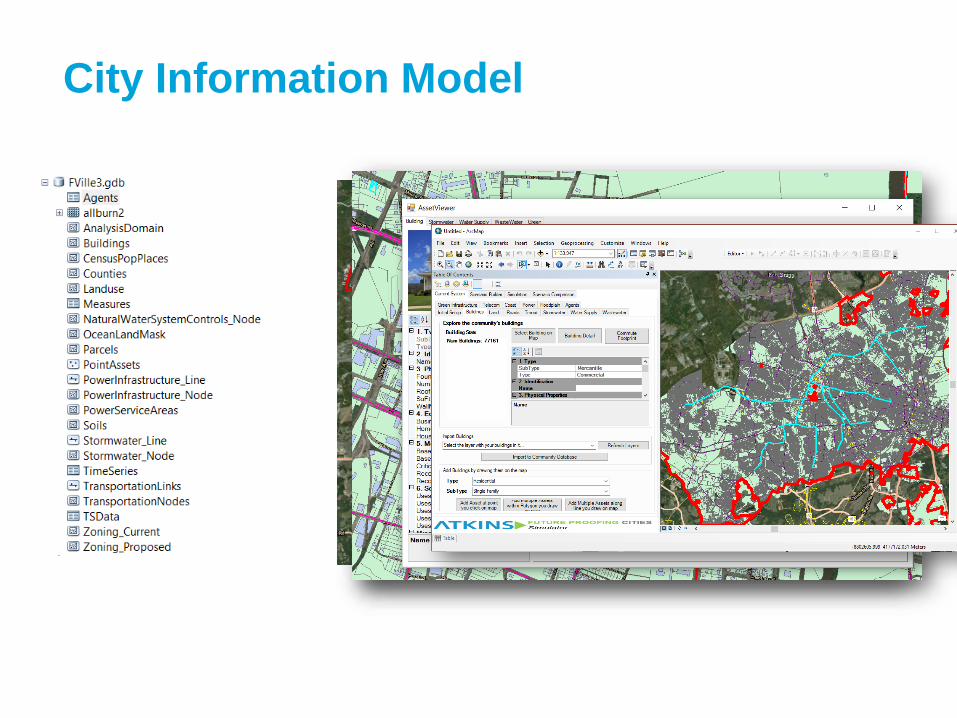
City Information Model
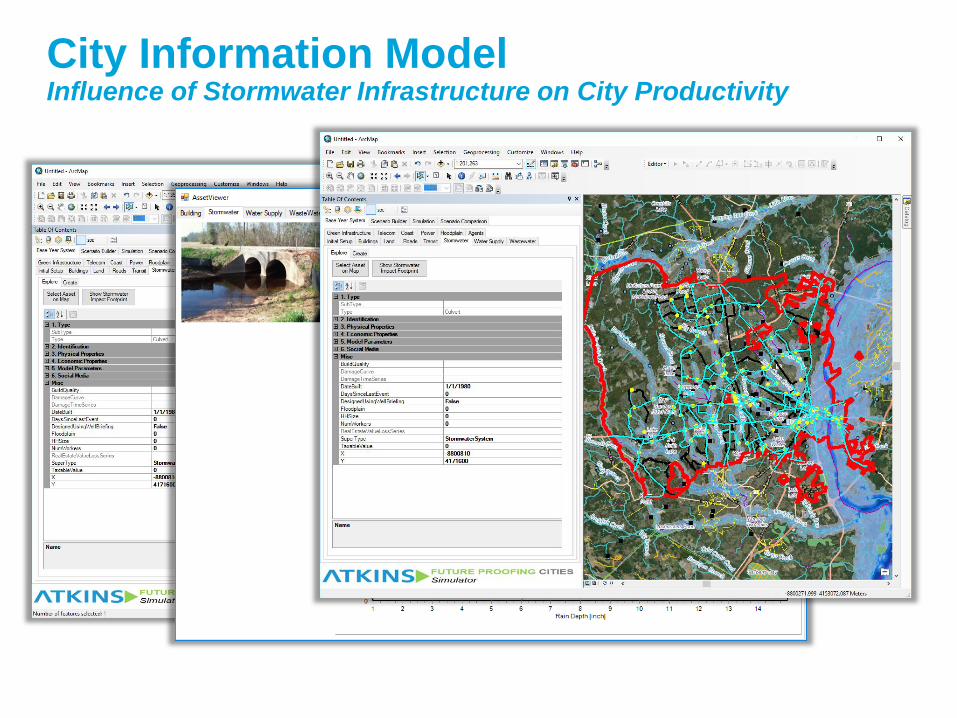
City Information Model Influence of Stormwater Infrastructure on City Productivity

27 June 2018 Future Proofing City Simulator 7
City Simulator Modeling ProcessA nested loop to capture city growth and response to hazards
Natural System
ChangesEcono-
mics
New Places of
Work
Workers
New Housing
Families
New
Infra-structure
Adjust Flood-plains
Eco-system Impacts
Carbon Footprint
Disaster?
Structures Affected
Structures Recover
Work
Comm-erceYearly Loop
(2017-2050) DailyLoop
Gradually changing threats like rising sea level 3mm per year.
EmploymentForecasts jobs based on economic growth
Percentage growth in economy year over year.
New commercial buildings are added based on growth rate.
Buildings receive an array of businesses with an array of jobs; new jobs are filled by immigrants or population entering workforce.
New workers receive housing, spouses, children.
Roads, utilities, schools, churches, are added to fulfill
new populations’ needs.
Urbanization impact to floodplains is evaluated.
Impacts to ecosystem evaluated.
Carbon footprint evaluated from daily travel, city wide
power usage, other factors.

27 June 2018 Future Proofing City Simulator 8
Natural System
ChangesEcono-
mics
New Places of
Work
Workers
New Housing
Families
New
Infra-structure
Adjust Flood-plains
Eco-system Impacts
Carbon Footprint
Disaster?
Structures Affected
Structures Recover
Work
Comm-erceYearly Loop
(2017-2050) DailyLoop
EmploymentForecasts jobs based on economic growth
In each day of the year, a forecast determines if a disaster occurs.
Structures affected by the disaster are identified through flood models, storm surge models, earthquake risk models, etc.
Damage to structures is estimated using damage curves that equate severity of disaster to cost of damage.
If a structure is affected, a recovery curve is established that governs whether the structure is productive or not in the future.
For workers whose place of work and residence are not
in recovery, the commute and daily work activities are
tracked.
Citizens conduct commerce throughout the day (grocery
shopping, etc). This is also tracked.
City Simulator Modeling ProcessA nested loop to capture city growth and response to hazards

City Simulator in Action

Prioritizing Hurricane Response in Fayetteville

Using City Simulator Concepts in
FEMA’s Mitigation Decision Support System
ROI = 𝐿𝑜𝑠𝑠𝑒𝑠 𝐴𝑣𝑜𝑖𝑑𝑒𝑑
𝐶𝑜𝑠𝑡
5
4
3
2
1
Ele
vatio
n (
ft)

Key Note
Finalist
UK EAInternational
Excellence
Award
Questions?