Embed Size (px)
Citation preview

Journal of Physics Conference Series
OPEN ACCESS
Maximum entropy fractal dimension andlacunarity in quantification of cellular rejection inmyocardial biopsy of patients submitted to hearttransplantationTo cite this article L A Neves et al 2011 J Phys Conf Ser 285 012032
View the article online for updates and enhancements
You may also likeHidden periodicity in Stripe 82 withSaraswati superclustermdasha fractal analysisVimal Raj M S Swapna and SSankararaman
-
A diffusion-based approach to obtainingthe borders of urban areasCesar Henrique Comin Filipi NascimentoSilva and Luciano da Fontoura Costa
-
Lacunarity exponentsMichael Wilkinson Marc Pradas GregHuber et al
-
This content was downloaded from IP address 218102186230 on 19022022 at 0453
Maximum entropy fractal dimension and lacunarity in quantification of cellular rejection in myocardial biopsy of patients submitted to heart transplantation
L A Neves 15 F R Oliveira 2 F A Peres 2 R D Moreira 3 A R Moriel 3 M F de Godoy 35 and L O Murta Junior6
1Universidade Estadual Paulista IGCE DEMAC Rio Claro SP Brazil 2Faculdade de Tecnologia de Satildeo Joseacute do Rio Preto Satildeo Joseacute do Rio Preto SP Brazil 3Faculdade de Medicina de Satildeo Joseacute do Rio Preto FAMERP Satildeo Joseacute do Rio Preto SP Brazil 4Instituto de Anatomia Patoloacutegica e Citopatologia Satildeo Joseacute do Rio Preto SP Brazil 5Nuacutecleo Transdisciplinar para Estudo do Caos e da Complexidade ndash NUTECC - Satildeo Joseacute do Rio Preto SP Brazil 6Universidade de Satildeo Paulo FFCLRP Depto Computaccedilatildeo e Matemaacutetica Ribeiratildeo Preto Brasil
E-mail lanevesrcunespbr
Abstract This paper presents a method for the quantification of cellular rejection in endomyocardial biopsies of patients submitted to heart transplant The model is based on automatic multilevel thresholding which employs histogram quantification techniques histogram slope percentage analysis and the calculation of maximum entropy The structures were quantified with the aid of the multi-scale fractal dimension and lacunarity for the identification of behavior patterns in myocardial cellular rejection in order to determine the most adequate treatment for each case
1 Introduction The biological vision system is one of the main means humans use to explore the world and performs complex functions in a considerably natural fashion such as the analysis interpretation recognition and classification of patterns A large number of studies have attempted to produce models with the same efficiency as the biological system However this task is highly complex especially with regard to transposing the quantification and qualification of information represented in different domains such as intensities of gray scales edges contours and textures These attributes are produced naturally by the human vision system when the signal being assessed is an image [1]
The exemplification of such difficulties is perceived in the process of assessing cardiac rejection which the International Society for Heart and Lung Transplantation [2] standardizes in four grades (0R 1R 2R 3R) among which grade 2R merits particular attention For pathologists there is a spectrum ranging from small points of inflammation involving one or two injured cells to a large degree of inflammatory infiltrate with the injury of muscle cells Even after the aforementioned standardization the difficulty in diagnosing grade 2R involves the presence of muscle cell injury Consequently some diagnostic centers do not treat 2R patients and recommend monitoring with
Dynamic Days South America 2010 IOP PublishingJournal of Physics Conference Series 285 (2011) 012032 doi1010881742-65962851012032
Published under licence by IOP Publishing Ltd 1
repeated biopsies at one-to-two-week intervals Thus cardiac rejection remains an issue of uncertainty and studies should be carried out with the aim of understanding and minimizing the difficulties involved
Models employing methods that behave similarly to natural phenomena can assist in the quantification understanding and diagnosis of cardiac rejection For such the fractal dimension and lacunarity are potential alternatives as natural descriptors of shapes and textures [3-5] The efficiency of the fractal dimension and lacunarity is enhanced when combined with one of the most interesting properties of objects in nature ndash the presentation of different characteristics when observed on different scales This association is known as the multi-scale fractal signature However the quantification and understanding of cardiac rejection using fractal methods depends on the appropriate segmentation of the region of interest
Segmentation is one of the first steps in the digital processing of images as it allows the separation of an object into parts based on a uniformity criterion [6] In order to obtain high-quality segmentation digital image processing systems primarily use thresholding which consists of determining an intensity value at which an object is best distinguished from the background In the literature there are different automatic thresholding methods based on different criteria [7-12] In many cases however a single threshold is not sufficient in furnishing adequate segmentation for the entire image In such situations variable and multilevel thresholding methods are administered Aboud Neta [13] proposes one such method but its sensitivity leads to high rates of non-significant thresholds which can compromise the assessment of the image
This paper defines a model for quantifying cardiac rejection made up of an automatic multilevel thresholding method based on maximum entropy and multi-scale fractal techniques The method allows determining appropriate thresholds for the segmentation of regions of interest in myocardial biopsies and the quantification of these regions using the fractal dimension and lacunarity This important model furnishes significant results enabling a better understanding of behavior on each rejection level
2 Methods To facilitate the understanding of the proposed model Subsection 21 describes the automatic multilevel thresholding method for the separation of the regions of interest and Subsection 22 describes the multi-scale fractal methods used to measure the complexity of the segmented regions
21 Automatic multilevel thresholding method The automatic multilevel thresholding method determines the threshold based on the identification of maximum entropy by comparing the entropies in different regions of the histogram of the image in question This method is an improvement over the approach proposed by Aboud Neta [13] allowing better control over the thresholds identified For such properties were added to the method cited such as the division of the histogram into classes analysis of the slope percentages and the determination of the threshold by the calculation of maximum entropy
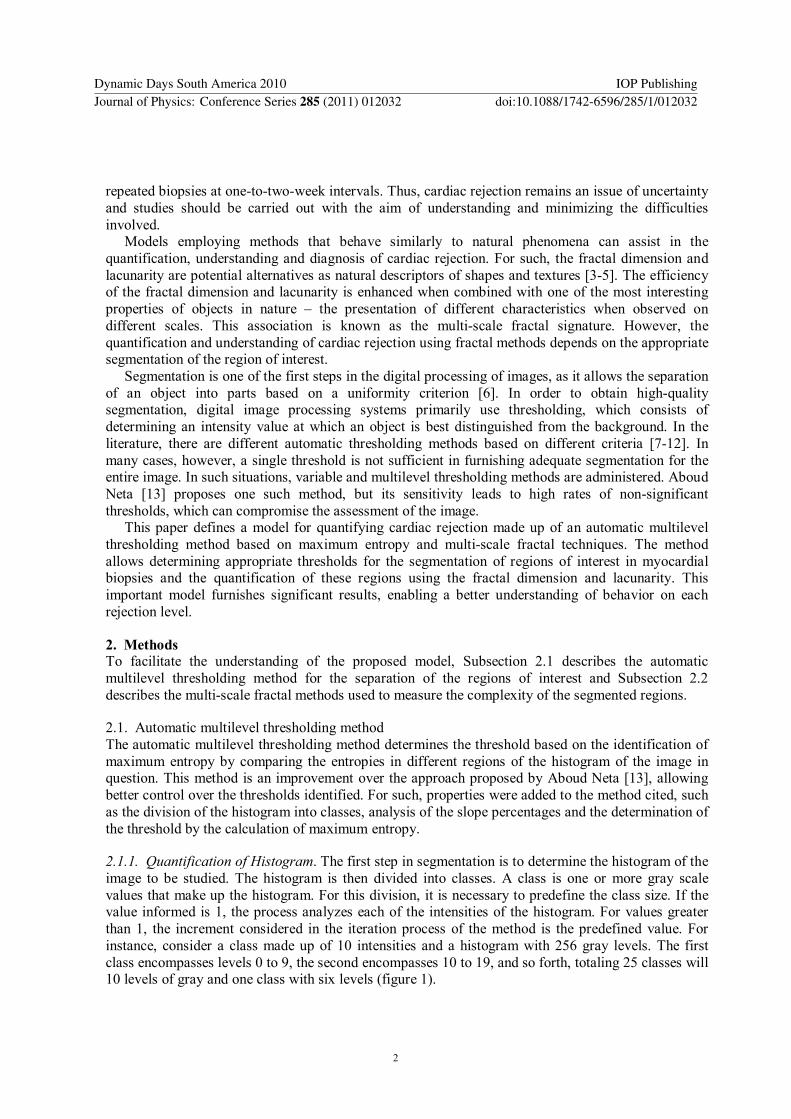
211 Quantification of Histogram The first step in segmentation is to determine the histogram of the image to be studied The histogram is then divided into classes A class is one or more gray scale values that make up the histogram For this division it is necessary to predefine the class size If the value informed is 1 the process analyzes each of the intensities of the histogram For values greater than 1 the increment considered in the iteration process of the method is the predefined value For instance consider a class made up of 10 intensities and a histogram with 256 gray levels The first class encompasses levels 0 to 9 the second encompasses 10 to 19 and so forth totaling 25 classes will 10 levels of gray and one class with six levels (figure 1)
Dynamic Days South America 2010 IOP PublishingJournal of Physics Conference Series 285 (2011) 012032 doi1010881742-65962851012032
2
Figure 1 Example of histogram divided into 26 classes ndash 25 containing 10 levels and one containing six levels vertical lines demark classes
212 Valleys Analysis This step consists of identifying what classes have valleys that are relevant to the specification of the thresholds The method automatically identifies these classes by means of sign transition analyzing the following characteristics
The mean of the points contained in the first half of the class analyzed is compared with the mean of the points in the second half of the same class If the value of the first half is smaller the values of the histogram are increasing toward a peak and the sign attributed to the class is positive Otherwise a negative sign is attributed to the class indicating movement toward a valley
The sign of the next class is determined If there is a transition from a negative to a positive sign the valley is relevant to the specification of a threshold (figure 2)
Figure 2 Example of histogram divided into 26 classes with indication of two relevant valleys to the determination of thresholds ndash one at level 50-59 and another at level 230-239
The determination of thresholds based on valley analysis may be influenced by homogeneous
regions in the histogram (with no valleys or with non-significant valleys) To solve this problem the proposed method determines that a class is relevant if it has a slope percentage greater than a
Dynamic Days South America 2010 IOP PublishingJournal of Physics Conference Series 285 (2011) 012032 doi1010881742-65962851012032
3
predefined value This value can be adjusted to the type of image being studied A slope percentage is the percentage difference between the means of the points in the first and second halves of the class being analyzed Two or more classes are grouped together when the slope percentage is lower than the predefined value This resource allows controlling the sensitivity of the method A threshold is established when the slope percentage of the class is greater than the predefined value
In the study of images of myocardial biopsies of transplant patients the values used for the input parameters for segmentation were classes of size 10 and the slope was defined at 35 These values proved sufficient for the appropriate segmentation of the regions of interest
213 Threshold identification using maximum entropy For each relevant class identified to define a valley a threshold is calculated based on entropy considering a probability of an intensity correctly segmenting a given group of objects For such the image is taken as the result of a random process in which probability p corresponds to the probability of a pixel in the image taking on an intensity value i (i=1n) [8] as shown in equations (1) and (2) The intensity or gray level of the class with the greatest entropy is identified as a threshold
i
n
ii ppH log
1
pi=ni
N
in which H is the entropy of the image n is the total number of outputs (number of gray levels in the image) pi is the probability of gray level i being found in the image ni is the number of pixels with intensity i and N is the total number of pixels in the image
22 Quantification of regions of interest The texture in an image is characterized by the repetition of a model over a region the model may be repeated exactly or with slight variations [6] The analysis of texture allows distinguishing regions with the same reflectance characteristics which is a process used for the recognition analysis description and classification of digital images There are different approaches to the study of texture described in the literature [6] The approach presented here is the quantification of textures in images of myocardial biopsies from heart-transplant patients using more natural methods such as the fractal dimension and lacunarity
221 Fractal dimension The fractal dimension is defined as a measure of the complexity of objects When applied to textures this measure allows quantifying the complexity of the organization of its pixels (how much the space is filled in) Box counting is one of the best known and employed methods for estimating the fractal dimension of objects and images [14] For the images studied this method was applied to regions segmented as ldquocell nucleirdquo with the understanding that in the case of an inflammatory process such as cellular rejection the number of cell nuclei is progressively greater and more diffusely distributed with the increase in the degree of rejection The multi-scale approach was achieved by overlaying a grid on the image analyzed The aim was to obtain the number of squares necessary to cover the image [14] For an myocardial biopsy image I as the input the number of squares that contain part of the shape I Nr(I) depends on the size of the box r equation (3) The relation defined in equation (3) allows estimating the fractal dimension D based on equation (4)
D
r rIN
r
IND r
r ln)(ln
lim 0
(1)
(3)
(2)
(4)
Dynamic Days South America 2010 IOP PublishingJournal of Physics Conference Series 285 (2011) 012032 doi1010881742-65962851012032
4
However equation (4) imposes the calculation of a limit in which box counting Nr(I) is performed for different values of r (r0=max(height width) and ri+1= ri2) [14] The approximation of a straight line is obtained from the regression (log-log graph) of Nr (I) (number of boxes occupied) by r (size of side of this box) It is possible to define D= as the fractal dimension of I [14]
222 Lacunarity Lacunarity characterizes the way the pixels are distributed and organized in a given region of the image (quantifying how the space is filled in) Lacunarity is complementary to the fractal dimension as shapes with the same fractal dimension may have different lacunarity values One of the most popular methods for estimating lacunarity is the gliding-box method [14-15] which was used in the present study
The process begins with a box with side r positioned in the upper left corner of the image and a count of the number of points in the image This process is repeated for all the lines and columns of the image producing a frequency distribution of the mass of the image The number of boxes with side r containing a mass M of the image is designated by n(Mr) with the total number of boxes counted designated by N(r) This frequency distribution is then converted into a probability distribution F(Mr) equation (5) The first (A1) and second (B2) moments of this distribution are determined in equation (6) Lacunarity (L) for a box of size r is defined in equation (7) [14]
rN
rMnrMF
rMMFA )1(
rMFMB 2)2(
2)1(
)2(
B
ArL
23 Image processing and comparison of parameters The quantifications with fractal dimension and lacunarity were performed processing part of the image database of myocardial biopsies from heart-transplant patients provided by the Nuacutecleo Transdisciplinar para Estudo do Caos e da Complexidade of the Faculdade de Medicina de Satildeo Joseacute do Rio Preto Brazil A total of 118 images with different grades of rejection were analyzed 0R (22 images) 1R (24 images) 2R (29 images) and 3R (43 images) For the image processing each biopsy was segmented using the automatic multilevel method proposed in Subsection 21 and the quantifications were performed using the methods described in Subsection 22
To validate the proposed segmentation method mean values were calculated of the thresholds gray levels and total number of pixels contained in each class of the segmented structure Three classes were considered in the images cell nuclei or cellular rejection (Class 1) heart muscle tissue (Class 2) and interstitial space or absence of structures (Class 3) The values were determined in each class and compared with those provided by Otsursquos method [7] The quantification with fractal methods was for structures segmented as Class 1
Means standard deviations and confidence intervals were calculated (with a 95 confidence level) for the fractal dimension and lacunarity attributes This procedure was performed for each rejection level (0R to 3R) in order to identify and understand the behavior in this type of image in light of the main attributes of fractal geometry
(5)
(6)
(7)
Dynamic Days South America 2010 IOP PublishingJournal of Physics Conference Series 285 (2011) 012032 doi1010881742-65962851012032
5
3 Results
31 Segmentation The segmentation method proposed here and Otsursquos method [7] were both applied to all images The comparative results are displayed in tables 1 2 and 3
Otsursquos method provided significantly higher mean values of the thresholds gray level and total number of pixels contained in each structure class One possible explanation for this difference is that Otsursquos method segmented muscle structures as being cell nuclei or cellular rejection which had a negative influence over a possible pattern recognition or quantification step Figure 3 illustrates the segmentation achieved with the proposed method and figure 4 allows comparing the results of the two segmentation methods
Table 1 Mean threshold values obtained with proposed segmentation method and Otsursquos method [7] Two thresholds were identified for the segmentation of classes of interest
Mean threshold values Classes 1 and 2 Classes 2 and 3 Otsursquos method [7] 139 203 Maximum Entropy 70 240
Table 2 Mean intensity values in each class obtained with proposed segmentation method and Otsursquos method [7]
Mean gray level Class 1 Class 2 Class 3 Otsursquos method [7] 10491 17244 23238 Maximum entropy 4112 16599 24355
Table 3 Mean pixel total in each class obtained with proposed segmentation method and Otsursquos method [7]
Mean pixel total Class 1 Class 2 Class 3 Otsursquos method [7] 52160 277376 150464 Maximum entropy 13823 408421 57756
(a) (b) (c)
Figure 3 Illustrative case of image obtained from endomyocardial biopsy of heart-transplant patient (a) prior to processing (b) result obtained with proposed segmentation method revealing cell nuclei and (c) heart muscle (gray) and interstitial spaces (white)
Dynamic Days South America 2010 IOP PublishingJournal of Physics Conference Series 285 (2011) 012032 doi1010881742-65962851012032
6
(a) (b) (c)
Figure 4 (a) Endomyocardial biopsy classified as 2R used to illustrate visual differences obtained with different segmentation methods (b) cell nuclei segmented using proposed method and (c) using Otsursquos method [7]
32 Quantification The nuclei detected (both normal myocardial cell nuclei and nuclei of inflammatory cells found in states of rejection) in each group (0r to 3R) were quantified using the fractal dimension and lacunarity The results are displayed in tables 4 and 5 Figure 5 allows viewing the behavior identified with overlapping between rejection levels
Table 4 Mean standard deviation and 95 confidence interval calculated for fractal dimensions obtained on each rejection level
Parameter 0R 1R 2R 3R Mean 1021 1135 1262 1323 Standard deviation 0140 0088 0143 0170
Confidence interval Lower value 0944 1089 1194 1257 Upper value 1097 1181 1330 1389
Table 5 Mean standard deviation and 95 confidence interval calculated for lacunarity obtained on each rejection level
Parameter 0R 1R 2R 3R Mean 1979 1865 1738 1677 Standard deviation 014 0088 014 017
Confidence interval Lower value 1903 1819 1670 1611 Upper value 2056 1911 1806 1743
Figure 5 Visualization of behavior on each cardiac rejection (CR) level (a) fractal dimension (D) (b) lacunarity (L) representation defined based on confidence intervals in tables 4 and 5
(a)
(b)
Dynamic Days South America 2010 IOP PublishingJournal of Physics Conference Series 285 (2011) 012032 doi1010881742-65962851012032
7
4 Discussion and Conclusions Based on the model used the proposed thresholding method allowed the appropriate segmentation of the myocardial biopsy images and more precise quantification of the regions of interest In comparison to Otsursquos method [7] the proposed thresholding method achieved better results as it allowed adjusting the parameters such as class size and histogram slope percentage thereby ensuring more appropriate thresholds Otsursquos method proved less flexible with a tendency toward including heart muscle and cell nuclei (of both myocytes and inflammatory cells) in the same segmentation and higher thresholds This behavior obviously implies an erroneous quantification which did not occur with the thresholding methods proposed here
The purpose of the proposed model was the quantification of regions of interest in images of myocardial biopsies from heart-transplant patients For such fractal dimension and lacunarity attributes were used Cardiac rejection can be correctly categorized if the values are close to the means of the levels (tables 4 and 5) This is no trivial task for cases in which the dimension or lacunarity is closer to the lowest or highest values of the sets This observation is based on the existing overlapping between rejection levels (figure 5) which may be explained as intermediate states in regression or progression Another characteristic was the fact that although overlapping occurred between levels 0R or 1R no overlapping was found between these levels and the more advance levels of cellular rejection (2R and 3R) (figure 5) suggesting diagnostic security and a good prognosis Patients categorized as 2R or 3R merit special attention due to the possibility of a mistaken classification and the possibility of progression or regression in cardiac rejection The quantification of these characteristics furnishes data that allow medical services to pay greater attention to heart-transplant patients with grade 2R considering the evident possibility of confusion with grade 3R
This paper presented a study on cardiac rejection levels based on multilevel thresholding with maximum entropy which ensured an appropriate quantification of each level in light of the fractal dimension and lacunarity This method allowed the successful identification of the behavior of each cellular rejection level These results are useful to the determination of earlier more effective treatments which could ensure a greater survival rate among patients submitted to heart transplantation
Acknowledgments This study was supported in part by UNESPPROP (Proacute-Reitoria de Pesquisa)
References [1] Jain A K and Duin R 2000 Statistical pattern recognition A review IEEE Transactions on
Pattern Analysis and Machine Intelligence 22 14ndash37 [2] Stewart et al 2005 Revision of the 1990 Working Formulation for the Standardization of
Nomenclature in the Diagnosis of Heart Rejection The Journal of Heart and Lung Transplantation 24 1710ndash1720
[3] Manousaki A G Manios A Tsompanaki E I and Tosca A D 2006 Use of color texture in determining the nature of melanocytic skin lesions ndash a qualitative and quantitative approach Computer in Biology and Medicine 36 419-427
[4] Dougherty G and Henebry G M 2001 Fractal signature and lacunarity in the measurement of the texture of trabecular bone in clinical CT images Medical Engineering amp Physics 23 369ndash380
[5] Borys P Krasowska M Grzywna Z J Djamgoz M B A and Mycielska M E 2008 Lacunarity as a novel measure of cancer cells behavior BioSystems 94 276ndash281
[6] Gonzalez R C and Woods R E 2008 Digital Image Processing ed 3 Prentice-Hall [7] Otsu N A 1979 Threshold selection method from gray-level histogram IEEE Transactions on
Systems Man and Cybernetics 9 1 [8] Pun T 1980 A New Method for Gray-Level Picture Thresholding Using the Entropy of the
Dynamic Days South America 2010 IOP PublishingJournal of Physics Conference Series 285 (2011) 012032 doi1010881742-65962851012032
8
Histogram Signal Processing 2 223-237 [9] Kapur J N Sahoo P K and Wong K C 1985 A new method for gray-level Picture thresholding
using the entropy of the histogram Computer Vision Graphics and Image Processing 29 273-285
[10] Abutaleb A H 1989 Automatic Thresholding of Gray-Level Pictures Using Two-Dimensional Entropy Computer Vision Graphics and Image Processing 47 22-32
[11] Beghdadi A Neacutegrate A L and De Lesegno P V 1995 Entropic Thresholding Using a Block Source Model CVGIP Graphical Models and Image Processing 57 197-205
[12] Brink A D 1996 Using spatial information as an aid to maximum entropy image threshold selection Pattern Recognition Letters 17 29-36
[13] Aboud Neta S R Dutra L V and Erthal1 G J 2008 Limiarizaccedilatildeo Automaacutetica em Histogramas Multimodais Proceeedings of the 7th Brazilian Conference on Dynamics Control and Applications (FCT ndash Unesp at Presidente Prudente Brazil 7-9 May 2008)
[14] Backes A R Bruno O M 2006 Segmentaccedilatildeo de texturas por anaacutelise de complexidade Journal of Computer Science 5(1) 87ndash95
[15] Plotnick R E Gradner R H Hargrove W W Prestegaard K and Perlmutter M 1996 Lacunarity analysis a general technique for the analysis of spatial patterns Physical Review E 53 5461-5468
Dynamic Days South America 2010 IOP PublishingJournal of Physics Conference Series 285 (2011) 012032 doi1010881742-65962851012032
9

Maximum entropy fractal dimension and lacunarity in quantification of cellular rejection in myocardial biopsy of patients submitted to heart transplantation
L A Neves 15 F R Oliveira 2 F A Peres 2 R D Moreira 3 A R Moriel 3 M F de Godoy 35 and L O Murta Junior6
1Universidade Estadual Paulista IGCE DEMAC Rio Claro SP Brazil 2Faculdade de Tecnologia de Satildeo Joseacute do Rio Preto Satildeo Joseacute do Rio Preto SP Brazil 3Faculdade de Medicina de Satildeo Joseacute do Rio Preto FAMERP Satildeo Joseacute do Rio Preto SP Brazil 4Instituto de Anatomia Patoloacutegica e Citopatologia Satildeo Joseacute do Rio Preto SP Brazil 5Nuacutecleo Transdisciplinar para Estudo do Caos e da Complexidade ndash NUTECC - Satildeo Joseacute do Rio Preto SP Brazil 6Universidade de Satildeo Paulo FFCLRP Depto Computaccedilatildeo e Matemaacutetica Ribeiratildeo Preto Brasil
E-mail lanevesrcunespbr
Abstract This paper presents a method for the quantification of cellular rejection in endomyocardial biopsies of patients submitted to heart transplant The model is based on automatic multilevel thresholding which employs histogram quantification techniques histogram slope percentage analysis and the calculation of maximum entropy The structures were quantified with the aid of the multi-scale fractal dimension and lacunarity for the identification of behavior patterns in myocardial cellular rejection in order to determine the most adequate treatment for each case
1 Introduction The biological vision system is one of the main means humans use to explore the world and performs complex functions in a considerably natural fashion such as the analysis interpretation recognition and classification of patterns A large number of studies have attempted to produce models with the same efficiency as the biological system However this task is highly complex especially with regard to transposing the quantification and qualification of information represented in different domains such as intensities of gray scales edges contours and textures These attributes are produced naturally by the human vision system when the signal being assessed is an image [1]
The exemplification of such difficulties is perceived in the process of assessing cardiac rejection which the International Society for Heart and Lung Transplantation [2] standardizes in four grades (0R 1R 2R 3R) among which grade 2R merits particular attention For pathologists there is a spectrum ranging from small points of inflammation involving one or two injured cells to a large degree of inflammatory infiltrate with the injury of muscle cells Even after the aforementioned standardization the difficulty in diagnosing grade 2R involves the presence of muscle cell injury Consequently some diagnostic centers do not treat 2R patients and recommend monitoring with
Dynamic Days South America 2010 IOP PublishingJournal of Physics Conference Series 285 (2011) 012032 doi1010881742-65962851012032
Published under licence by IOP Publishing Ltd 1
repeated biopsies at one-to-two-week intervals Thus cardiac rejection remains an issue of uncertainty and studies should be carried out with the aim of understanding and minimizing the difficulties involved
Models employing methods that behave similarly to natural phenomena can assist in the quantification understanding and diagnosis of cardiac rejection For such the fractal dimension and lacunarity are potential alternatives as natural descriptors of shapes and textures [3-5] The efficiency of the fractal dimension and lacunarity is enhanced when combined with one of the most interesting properties of objects in nature ndash the presentation of different characteristics when observed on different scales This association is known as the multi-scale fractal signature However the quantification and understanding of cardiac rejection using fractal methods depends on the appropriate segmentation of the region of interest
Segmentation is one of the first steps in the digital processing of images as it allows the separation of an object into parts based on a uniformity criterion [6] In order to obtain high-quality segmentation digital image processing systems primarily use thresholding which consists of determining an intensity value at which an object is best distinguished from the background In the literature there are different automatic thresholding methods based on different criteria [7-12] In many cases however a single threshold is not sufficient in furnishing adequate segmentation for the entire image In such situations variable and multilevel thresholding methods are administered Aboud Neta [13] proposes one such method but its sensitivity leads to high rates of non-significant thresholds which can compromise the assessment of the image
This paper defines a model for quantifying cardiac rejection made up of an automatic multilevel thresholding method based on maximum entropy and multi-scale fractal techniques The method allows determining appropriate thresholds for the segmentation of regions of interest in myocardial biopsies and the quantification of these regions using the fractal dimension and lacunarity This important model furnishes significant results enabling a better understanding of behavior on each rejection level
2 Methods To facilitate the understanding of the proposed model Subsection 21 describes the automatic multilevel thresholding method for the separation of the regions of interest and Subsection 22 describes the multi-scale fractal methods used to measure the complexity of the segmented regions
21 Automatic multilevel thresholding method The automatic multilevel thresholding method determines the threshold based on the identification of maximum entropy by comparing the entropies in different regions of the histogram of the image in question This method is an improvement over the approach proposed by Aboud Neta [13] allowing better control over the thresholds identified For such properties were added to the method cited such as the division of the histogram into classes analysis of the slope percentages and the determination of the threshold by the calculation of maximum entropy
211 Quantification of Histogram The first step in segmentation is to determine the histogram of the image to be studied The histogram is then divided into classes A class is one or more gray scale values that make up the histogram For this division it is necessary to predefine the class size If the value informed is 1 the process analyzes each of the intensities of the histogram For values greater than 1 the increment considered in the iteration process of the method is the predefined value For instance consider a class made up of 10 intensities and a histogram with 256 gray levels The first class encompasses levels 0 to 9 the second encompasses 10 to 19 and so forth totaling 25 classes will 10 levels of gray and one class with six levels (figure 1)
Dynamic Days South America 2010 IOP PublishingJournal of Physics Conference Series 285 (2011) 012032 doi1010881742-65962851012032
2
Figure 1 Example of histogram divided into 26 classes ndash 25 containing 10 levels and one containing six levels vertical lines demark classes
212 Valleys Analysis This step consists of identifying what classes have valleys that are relevant to the specification of the thresholds The method automatically identifies these classes by means of sign transition analyzing the following characteristics
The mean of the points contained in the first half of the class analyzed is compared with the mean of the points in the second half of the same class If the value of the first half is smaller the values of the histogram are increasing toward a peak and the sign attributed to the class is positive Otherwise a negative sign is attributed to the class indicating movement toward a valley
The sign of the next class is determined If there is a transition from a negative to a positive sign the valley is relevant to the specification of a threshold (figure 2)
Figure 2 Example of histogram divided into 26 classes with indication of two relevant valleys to the determination of thresholds ndash one at level 50-59 and another at level 230-239
The determination of thresholds based on valley analysis may be influenced by homogeneous
regions in the histogram (with no valleys or with non-significant valleys) To solve this problem the proposed method determines that a class is relevant if it has a slope percentage greater than a
Dynamic Days South America 2010 IOP PublishingJournal of Physics Conference Series 285 (2011) 012032 doi1010881742-65962851012032
3
predefined value This value can be adjusted to the type of image being studied A slope percentage is the percentage difference between the means of the points in the first and second halves of the class being analyzed Two or more classes are grouped together when the slope percentage is lower than the predefined value This resource allows controlling the sensitivity of the method A threshold is established when the slope percentage of the class is greater than the predefined value
In the study of images of myocardial biopsies of transplant patients the values used for the input parameters for segmentation were classes of size 10 and the slope was defined at 35 These values proved sufficient for the appropriate segmentation of the regions of interest
213 Threshold identification using maximum entropy For each relevant class identified to define a valley a threshold is calculated based on entropy considering a probability of an intensity correctly segmenting a given group of objects For such the image is taken as the result of a random process in which probability p corresponds to the probability of a pixel in the image taking on an intensity value i (i=1n) [8] as shown in equations (1) and (2) The intensity or gray level of the class with the greatest entropy is identified as a threshold
i
n
ii ppH log
1
pi=ni
N
in which H is the entropy of the image n is the total number of outputs (number of gray levels in the image) pi is the probability of gray level i being found in the image ni is the number of pixels with intensity i and N is the total number of pixels in the image
22 Quantification of regions of interest The texture in an image is characterized by the repetition of a model over a region the model may be repeated exactly or with slight variations [6] The analysis of texture allows distinguishing regions with the same reflectance characteristics which is a process used for the recognition analysis description and classification of digital images There are different approaches to the study of texture described in the literature [6] The approach presented here is the quantification of textures in images of myocardial biopsies from heart-transplant patients using more natural methods such as the fractal dimension and lacunarity
221 Fractal dimension The fractal dimension is defined as a measure of the complexity of objects When applied to textures this measure allows quantifying the complexity of the organization of its pixels (how much the space is filled in) Box counting is one of the best known and employed methods for estimating the fractal dimension of objects and images [14] For the images studied this method was applied to regions segmented as ldquocell nucleirdquo with the understanding that in the case of an inflammatory process such as cellular rejection the number of cell nuclei is progressively greater and more diffusely distributed with the increase in the degree of rejection The multi-scale approach was achieved by overlaying a grid on the image analyzed The aim was to obtain the number of squares necessary to cover the image [14] For an myocardial biopsy image I as the input the number of squares that contain part of the shape I Nr(I) depends on the size of the box r equation (3) The relation defined in equation (3) allows estimating the fractal dimension D based on equation (4)
D
r rIN
r
IND r
r ln)(ln
lim 0
(1)
(3)
(2)
(4)
Dynamic Days South America 2010 IOP PublishingJournal of Physics Conference Series 285 (2011) 012032 doi1010881742-65962851012032
4
However equation (4) imposes the calculation of a limit in which box counting Nr(I) is performed for different values of r (r0=max(height width) and ri+1= ri2) [14] The approximation of a straight line is obtained from the regression (log-log graph) of Nr (I) (number of boxes occupied) by r (size of side of this box) It is possible to define D= as the fractal dimension of I [14]
222 Lacunarity Lacunarity characterizes the way the pixels are distributed and organized in a given region of the image (quantifying how the space is filled in) Lacunarity is complementary to the fractal dimension as shapes with the same fractal dimension may have different lacunarity values One of the most popular methods for estimating lacunarity is the gliding-box method [14-15] which was used in the present study
The process begins with a box with side r positioned in the upper left corner of the image and a count of the number of points in the image This process is repeated for all the lines and columns of the image producing a frequency distribution of the mass of the image The number of boxes with side r containing a mass M of the image is designated by n(Mr) with the total number of boxes counted designated by N(r) This frequency distribution is then converted into a probability distribution F(Mr) equation (5) The first (A1) and second (B2) moments of this distribution are determined in equation (6) Lacunarity (L) for a box of size r is defined in equation (7) [14]
rN
rMnrMF
rMMFA )1(
rMFMB 2)2(
2)1(
)2(
B
ArL
23 Image processing and comparison of parameters The quantifications with fractal dimension and lacunarity were performed processing part of the image database of myocardial biopsies from heart-transplant patients provided by the Nuacutecleo Transdisciplinar para Estudo do Caos e da Complexidade of the Faculdade de Medicina de Satildeo Joseacute do Rio Preto Brazil A total of 118 images with different grades of rejection were analyzed 0R (22 images) 1R (24 images) 2R (29 images) and 3R (43 images) For the image processing each biopsy was segmented using the automatic multilevel method proposed in Subsection 21 and the quantifications were performed using the methods described in Subsection 22
To validate the proposed segmentation method mean values were calculated of the thresholds gray levels and total number of pixels contained in each class of the segmented structure Three classes were considered in the images cell nuclei or cellular rejection (Class 1) heart muscle tissue (Class 2) and interstitial space or absence of structures (Class 3) The values were determined in each class and compared with those provided by Otsursquos method [7] The quantification with fractal methods was for structures segmented as Class 1
Means standard deviations and confidence intervals were calculated (with a 95 confidence level) for the fractal dimension and lacunarity attributes This procedure was performed for each rejection level (0R to 3R) in order to identify and understand the behavior in this type of image in light of the main attributes of fractal geometry
(5)
(6)
(7)
Dynamic Days South America 2010 IOP PublishingJournal of Physics Conference Series 285 (2011) 012032 doi1010881742-65962851012032
5
3 Results
31 Segmentation The segmentation method proposed here and Otsursquos method [7] were both applied to all images The comparative results are displayed in tables 1 2 and 3
Otsursquos method provided significantly higher mean values of the thresholds gray level and total number of pixels contained in each structure class One possible explanation for this difference is that Otsursquos method segmented muscle structures as being cell nuclei or cellular rejection which had a negative influence over a possible pattern recognition or quantification step Figure 3 illustrates the segmentation achieved with the proposed method and figure 4 allows comparing the results of the two segmentation methods
Table 1 Mean threshold values obtained with proposed segmentation method and Otsursquos method [7] Two thresholds were identified for the segmentation of classes of interest
Mean threshold values Classes 1 and 2 Classes 2 and 3 Otsursquos method [7] 139 203 Maximum Entropy 70 240
Table 2 Mean intensity values in each class obtained with proposed segmentation method and Otsursquos method [7]
Mean gray level Class 1 Class 2 Class 3 Otsursquos method [7] 10491 17244 23238 Maximum entropy 4112 16599 24355
Table 3 Mean pixel total in each class obtained with proposed segmentation method and Otsursquos method [7]
Mean pixel total Class 1 Class 2 Class 3 Otsursquos method [7] 52160 277376 150464 Maximum entropy 13823 408421 57756
(a) (b) (c)
Figure 3 Illustrative case of image obtained from endomyocardial biopsy of heart-transplant patient (a) prior to processing (b) result obtained with proposed segmentation method revealing cell nuclei and (c) heart muscle (gray) and interstitial spaces (white)
Dynamic Days South America 2010 IOP PublishingJournal of Physics Conference Series 285 (2011) 012032 doi1010881742-65962851012032
6
(a) (b) (c)
Figure 4 (a) Endomyocardial biopsy classified as 2R used to illustrate visual differences obtained with different segmentation methods (b) cell nuclei segmented using proposed method and (c) using Otsursquos method [7]
32 Quantification The nuclei detected (both normal myocardial cell nuclei and nuclei of inflammatory cells found in states of rejection) in each group (0r to 3R) were quantified using the fractal dimension and lacunarity The results are displayed in tables 4 and 5 Figure 5 allows viewing the behavior identified with overlapping between rejection levels
Table 4 Mean standard deviation and 95 confidence interval calculated for fractal dimensions obtained on each rejection level
Parameter 0R 1R 2R 3R Mean 1021 1135 1262 1323 Standard deviation 0140 0088 0143 0170
Confidence interval Lower value 0944 1089 1194 1257 Upper value 1097 1181 1330 1389
Table 5 Mean standard deviation and 95 confidence interval calculated for lacunarity obtained on each rejection level
Parameter 0R 1R 2R 3R Mean 1979 1865 1738 1677 Standard deviation 014 0088 014 017
Confidence interval Lower value 1903 1819 1670 1611 Upper value 2056 1911 1806 1743
Figure 5 Visualization of behavior on each cardiac rejection (CR) level (a) fractal dimension (D) (b) lacunarity (L) representation defined based on confidence intervals in tables 4 and 5
(a)
(b)
Dynamic Days South America 2010 IOP PublishingJournal of Physics Conference Series 285 (2011) 012032 doi1010881742-65962851012032
7
4 Discussion and Conclusions Based on the model used the proposed thresholding method allowed the appropriate segmentation of the myocardial biopsy images and more precise quantification of the regions of interest In comparison to Otsursquos method [7] the proposed thresholding method achieved better results as it allowed adjusting the parameters such as class size and histogram slope percentage thereby ensuring more appropriate thresholds Otsursquos method proved less flexible with a tendency toward including heart muscle and cell nuclei (of both myocytes and inflammatory cells) in the same segmentation and higher thresholds This behavior obviously implies an erroneous quantification which did not occur with the thresholding methods proposed here
The purpose of the proposed model was the quantification of regions of interest in images of myocardial biopsies from heart-transplant patients For such fractal dimension and lacunarity attributes were used Cardiac rejection can be correctly categorized if the values are close to the means of the levels (tables 4 and 5) This is no trivial task for cases in which the dimension or lacunarity is closer to the lowest or highest values of the sets This observation is based on the existing overlapping between rejection levels (figure 5) which may be explained as intermediate states in regression or progression Another characteristic was the fact that although overlapping occurred between levels 0R or 1R no overlapping was found between these levels and the more advance levels of cellular rejection (2R and 3R) (figure 5) suggesting diagnostic security and a good prognosis Patients categorized as 2R or 3R merit special attention due to the possibility of a mistaken classification and the possibility of progression or regression in cardiac rejection The quantification of these characteristics furnishes data that allow medical services to pay greater attention to heart-transplant patients with grade 2R considering the evident possibility of confusion with grade 3R
This paper presented a study on cardiac rejection levels based on multilevel thresholding with maximum entropy which ensured an appropriate quantification of each level in light of the fractal dimension and lacunarity This method allowed the successful identification of the behavior of each cellular rejection level These results are useful to the determination of earlier more effective treatments which could ensure a greater survival rate among patients submitted to heart transplantation
Acknowledgments This study was supported in part by UNESPPROP (Proacute-Reitoria de Pesquisa)
References [1] Jain A K and Duin R 2000 Statistical pattern recognition A review IEEE Transactions on
Pattern Analysis and Machine Intelligence 22 14ndash37 [2] Stewart et al 2005 Revision of the 1990 Working Formulation for the Standardization of
Nomenclature in the Diagnosis of Heart Rejection The Journal of Heart and Lung Transplantation 24 1710ndash1720
[3] Manousaki A G Manios A Tsompanaki E I and Tosca A D 2006 Use of color texture in determining the nature of melanocytic skin lesions ndash a qualitative and quantitative approach Computer in Biology and Medicine 36 419-427
[4] Dougherty G and Henebry G M 2001 Fractal signature and lacunarity in the measurement of the texture of trabecular bone in clinical CT images Medical Engineering amp Physics 23 369ndash380
[5] Borys P Krasowska M Grzywna Z J Djamgoz M B A and Mycielska M E 2008 Lacunarity as a novel measure of cancer cells behavior BioSystems 94 276ndash281
[6] Gonzalez R C and Woods R E 2008 Digital Image Processing ed 3 Prentice-Hall [7] Otsu N A 1979 Threshold selection method from gray-level histogram IEEE Transactions on
Systems Man and Cybernetics 9 1 [8] Pun T 1980 A New Method for Gray-Level Picture Thresholding Using the Entropy of the
Dynamic Days South America 2010 IOP PublishingJournal of Physics Conference Series 285 (2011) 012032 doi1010881742-65962851012032
8
Histogram Signal Processing 2 223-237 [9] Kapur J N Sahoo P K and Wong K C 1985 A new method for gray-level Picture thresholding
using the entropy of the histogram Computer Vision Graphics and Image Processing 29 273-285
[10] Abutaleb A H 1989 Automatic Thresholding of Gray-Level Pictures Using Two-Dimensional Entropy Computer Vision Graphics and Image Processing 47 22-32
[11] Beghdadi A Neacutegrate A L and De Lesegno P V 1995 Entropic Thresholding Using a Block Source Model CVGIP Graphical Models and Image Processing 57 197-205
[12] Brink A D 1996 Using spatial information as an aid to maximum entropy image threshold selection Pattern Recognition Letters 17 29-36
[13] Aboud Neta S R Dutra L V and Erthal1 G J 2008 Limiarizaccedilatildeo Automaacutetica em Histogramas Multimodais Proceeedings of the 7th Brazilian Conference on Dynamics Control and Applications (FCT ndash Unesp at Presidente Prudente Brazil 7-9 May 2008)
[14] Backes A R Bruno O M 2006 Segmentaccedilatildeo de texturas por anaacutelise de complexidade Journal of Computer Science 5(1) 87ndash95
[15] Plotnick R E Gradner R H Hargrove W W Prestegaard K and Perlmutter M 1996 Lacunarity analysis a general technique for the analysis of spatial patterns Physical Review E 53 5461-5468
Dynamic Days South America 2010 IOP PublishingJournal of Physics Conference Series 285 (2011) 012032 doi1010881742-65962851012032
9
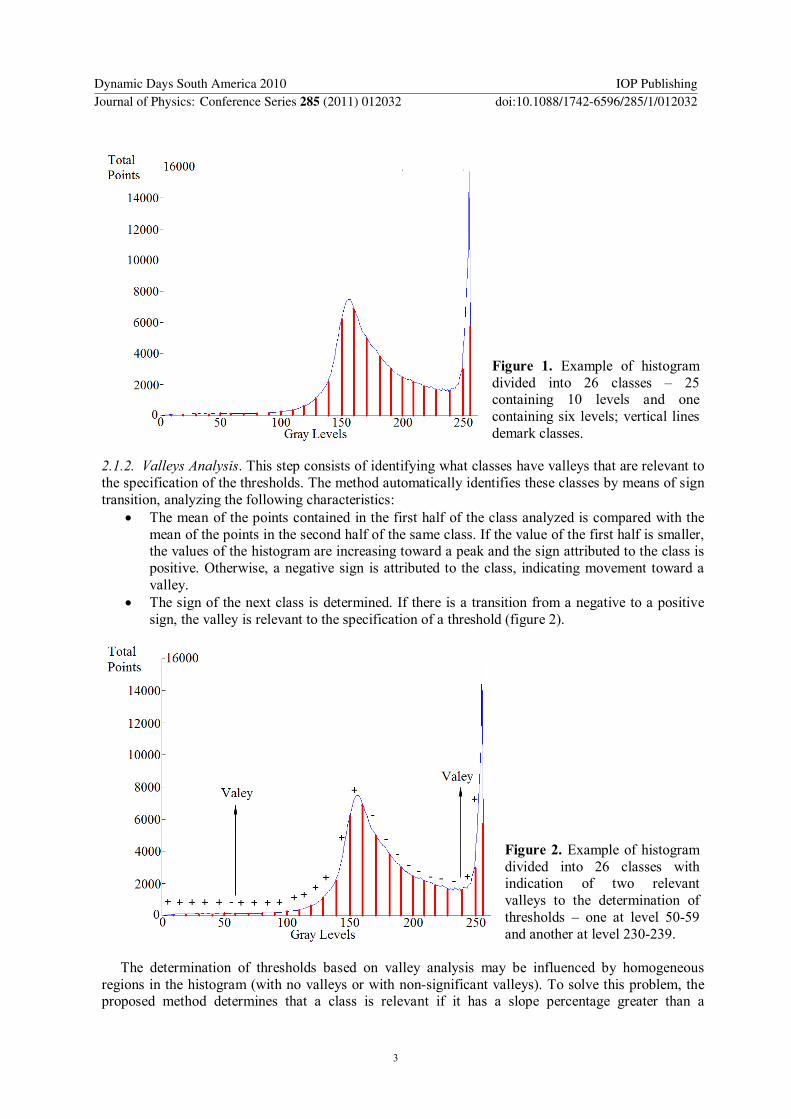
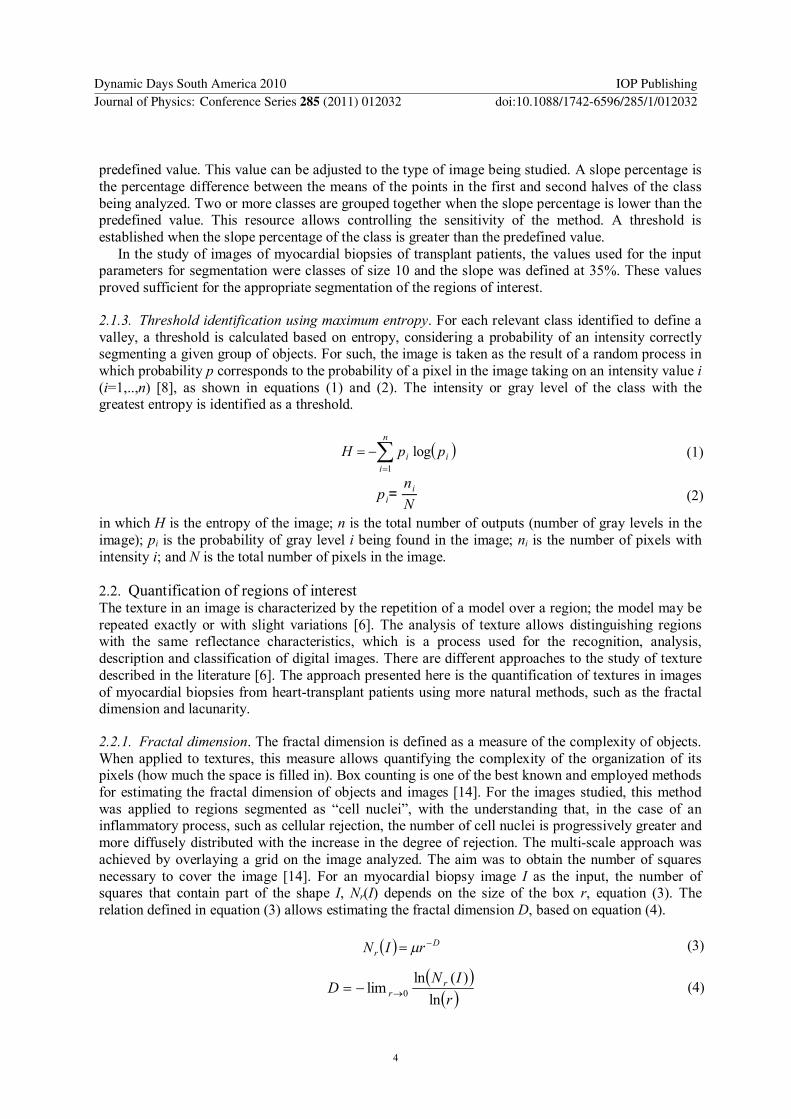
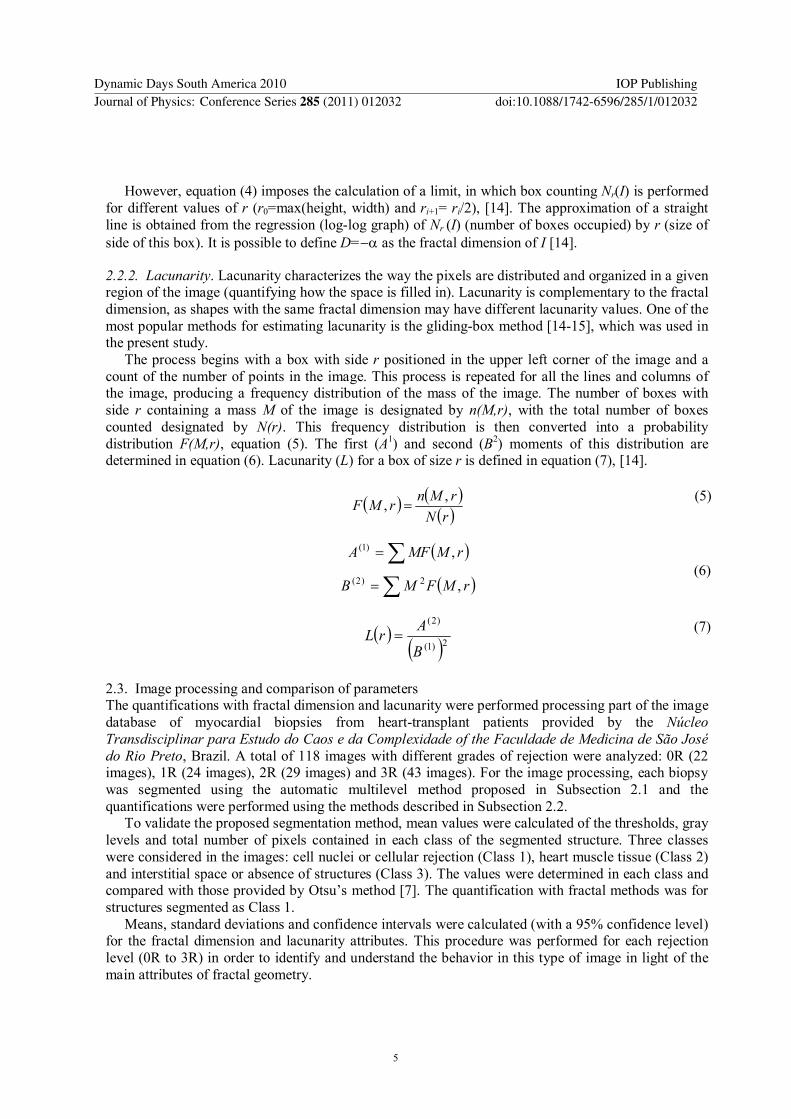
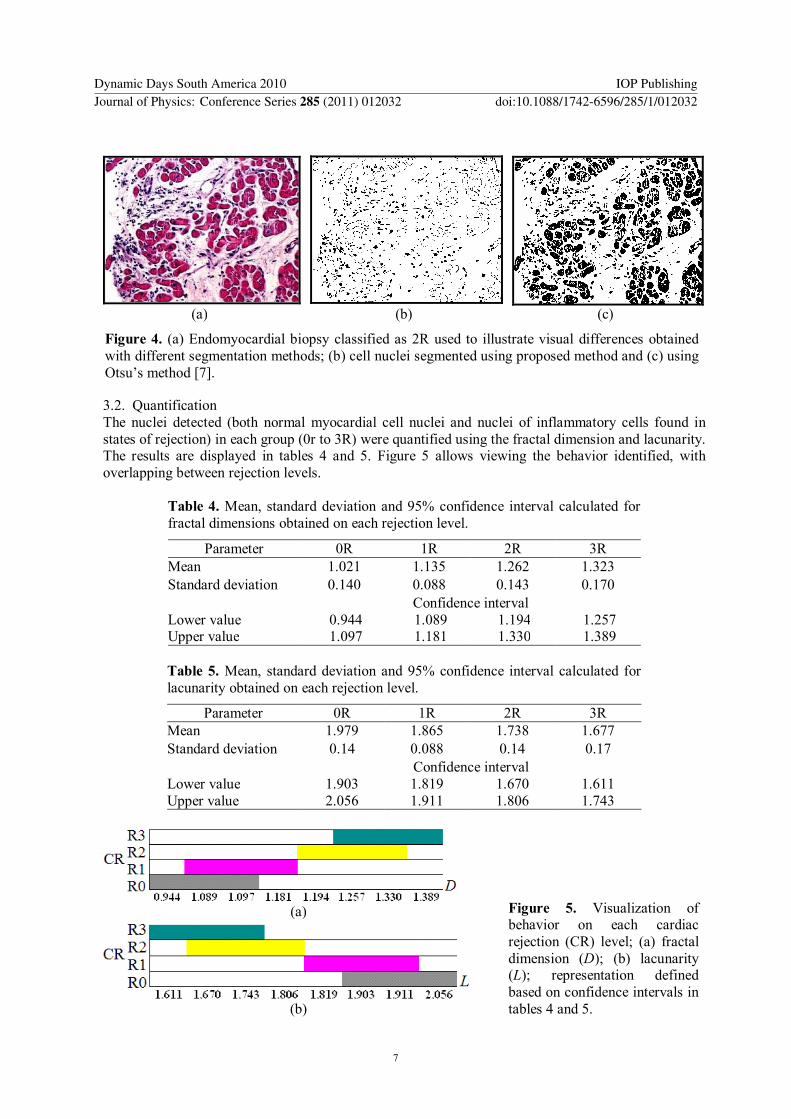

![Acr7C - Yale Universitybbm3/web_pdfs/094... · [Ref. 5(a), Chaps. 34 and 35], which measures the deviation of a fractal from being translation- 10 ally invariant. One measure of lacunarity](https://img.pdfslide.net/doc/110x75/5fd576d03f1418663569f6c2/acr7c-yale-university-bbm3webpdfs094-ref-5a-chaps-34-and-35-which.jpg)


![2 Procedural Fractal Terrains - University of Chicago · 2-5 This is a generalization of Perlin's original "chaos" function. [6] I have provided new parameters to control lacunarity](https://img.pdfslide.net/doc/110x75/5e8b54eba9f09007916d1126/2-procedural-fractal-terrains-university-of-chicago-2-5-this-is-a-generalization.jpg)