Embed Size (px)
Citation preview

Lahore University of Management Sciences
Maximum Power Point
Tracking [An optimum way to track maximum power point
of each panel in a multi solar panel system]
Annum Malik
Asad Najeeb
Joveria Baig
Muhammad Sohaib Iqbal

Signatures of Approval
Abstract
In this project, we propose a design of a Maximum Peak Power
Point tracking (MPPT) controller and its implementation using a
buck boost convertor topology. Each solar panel in a multiple
panel system will be individually monitored by multiplexing in
time and ensured that each one is operating at its maximum point
by a feedback closed loop algorithm implemented in a
microcontroller based design. Duty cycle of the buck-boost
convertor will be continuously monitored and adjusted to extract
maximum power. As verified by our simulations, this method will
be able to give an efficiency of 89.2% under mild lightning
conditions (irradiance of 0.5 Suns). The proposed project will
involve design and implementation of a new MPPT algorithm and
two input buck convertor (not used in past designs) for this
purpose. Block diagram and the detailed working of each
component will be discussed in the paper below

Signatures of approval


Problem Statement
Section at a glance…
Introduction
Statistical analysis
Solar Irradiance
Problem definition
Vision

This section will cover mostly the motivation behind under taking this particular project as our
intended research of study and the implications in future by the implementation by this new
design. Past researches in this area covered hardware aspects and designs of algorithms to
operate a single solar panel at its maximum efficiency; however they failed to incorporate the
importance of tracking of maximum power point for individual panels in a multi solar panel
system. In this paper, we propose to design a tracking system which will operate each panel in a
multiple panel system at its maximum efficiency and hence give a higher total efficiency. The
proposed design will aim to cover the aspects not targeted by previous researches and will
answer the question of feasibility of implementing solar panels over their cost. We will start by
describing the nature of problem that we are targeting in our design and its importance
1.1 Introduction:
Renewable sources of energy acquire growing importance due to massive consumption and
exhaustion of fossil fuel. Beginning with the surge in
coal use which accompanied the Industrial
Revolution, energy consumption has steadily
transitioned from wood and biomass to fossil fuels.
The early development of solar technologies
starting in the 1860s was driven by an expectation that coal would soon become scarce. However
development of solar technologies stagnated in the early 20th century in the face of the
increasing availability, economy, and utility of coal and petroleum. As time passed by,
environmental concerns gradually increased and the use of bio fuels and coal became a serious
Problem Statement

concern. Moreover, with the advent of the new technology, researchers typically started focusing
on the advantages of extraction of solar energy efficiently over other sources. Figure 1
summarizes this effectively, showing clearly that the energy received in a 24 hour span in the
form of sunlight is significantly comparable to the energy contained in the fossil fuels all around
the world.
As years passed by, the need for coal substitutes and more research into solar energy became
imperative. With the ever growing demand for energy and the transition of focus from petroleum
based fuels to solar fuels, it becomes necessary to consider the implications of using solar energy
to the economy of a developing country like Pakistan.
1.2 Statistical Analysis:
A little foray into statistics reveals that a total of 20.5
million customers stand connected to the PEPCO
system, while another 3.0 million or so are on the KESC
rolls. Out of these, 21 million fall under the category of
general customers, including both domestic and
commercial users. Around eight million of these can be
termed as affluent customers with monthly average
usage of more than 300 units. The installed load of these
customers should actually be more than 5 KW. This
translates into the requirement of a 1KW solar power systems for this category, which can cater
to at least 10-20 percent of their demands. In financial terms, a 1 KW solar PV-based system
costs Rs.500,000. Keeping in view the prevalent power tariff, the payback period for it has been
calculated to be anything between 3-10 years. Now the question arises so to why would existing
customers take the trouble and expense to go for a solar power system when they are already
using their private generators or UPS. The answer lies in the fact that UPSs in Pakistan have a
poor efficiency of 19 to 45 percent at the most, delivering highly impure power. The charging of
the standby systems adds hefty amounts to the monthly utility bills. The generators have an
efficiency of around 18 percent and remain expensive to maintain. The noise and smoke
pollution further tips the ante against generators. PV based solar power systems are almost
maintenance free, environment friendly and need no fuel at all. These statistics clearly reveal the
need for a highly efficient solar panel system to increase the efficiency of energy supplied to
household using this system and so it became sufficiently necessary for us to undertake this area
as our research of study.
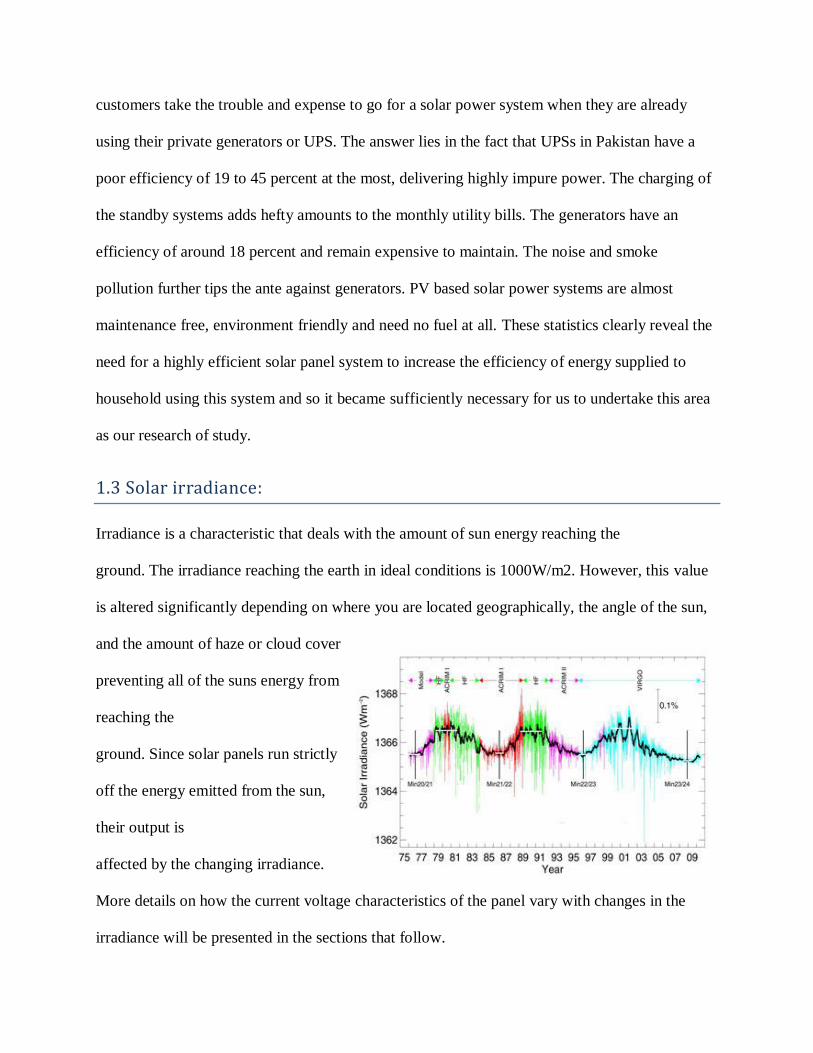
1.3 Solar irradiance:
Irradiance is a characteristic that deals with the amount of sun energy reaching the
ground. The irradiance reaching the earth in ideal conditions is 1000W/m2. However, this value
is altered significantly depending on where you are located geographically, the angle of the sun,
and the amount of haze or cloud cover
preventing all of the suns energy from
reaching the
ground. Since solar panels run strictly
off the energy emitted from the sun,
their output is
affected by the changing irradiance.
More details on how the current voltage characteristics of the panel vary with changes in the
irradiance will be presented in the sections that follow.
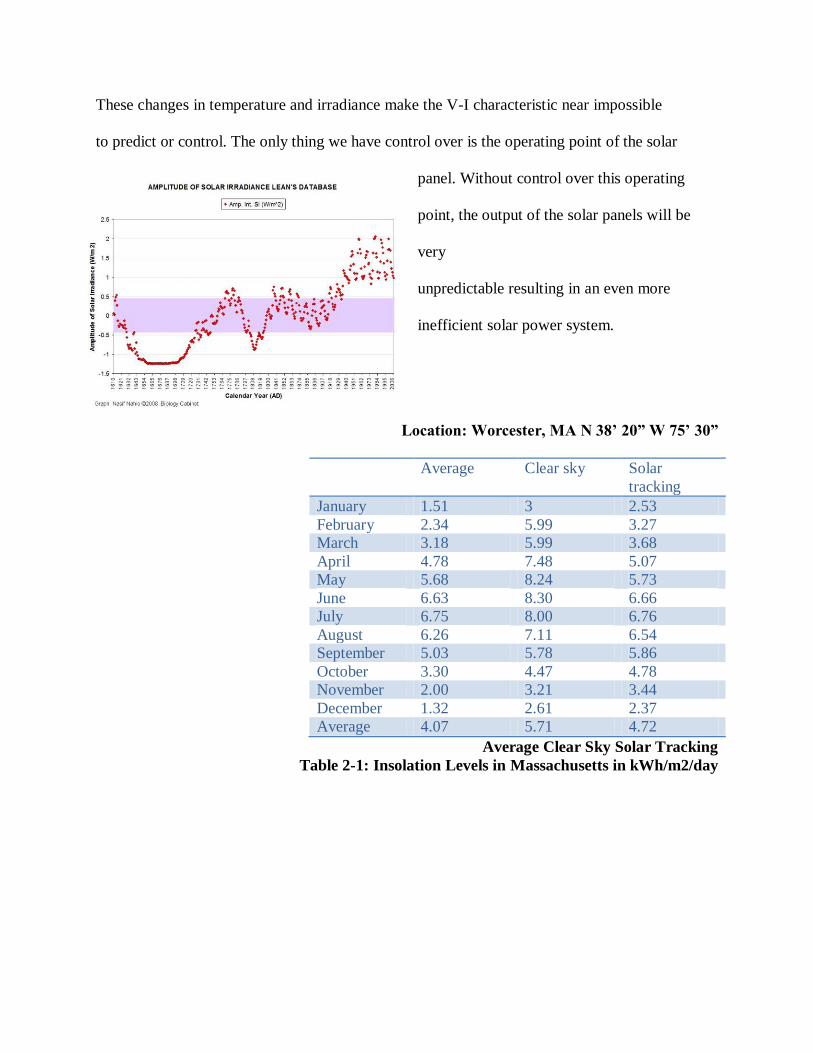
These changes in temperature and irradiance make the V-I characteristic near impossible
to predict or control. The only thing we have control over is the operating point of the solar
panel. Without control over this operating
point, the output of the solar panels will be
very
unpredictable resulting in an even more
inefficient solar power system.
Location: Worcester, MA N 38’ 20” W 75’ 30”
Average Clear sky Solar
tracking
January 1.51 3 2.53
February 2.34 5.99 3.27
March 3.18 5.99 3.68
April 4.78 7.48 5.07
May 5.68 8.24 5.73
June 6.63 8.30 6.66
July 6.75 8.00 6.76
August 6.26 7.11 6.54
September 5.03 5.78 5.86
October 3.30 4.47 4.78
November 2.00 3.21 3.44
December 1.32 2.61 2.37
Average 4.07 5.71 4.72
Average Clear Sky Solar Tracking
Table 2-1: Insolation Levels in Massachusetts in kWh/m2/day

1.4 Problem definition:
Photovoltaic arrays are used in many applications such as water pumping, battery charging,
hybrid vehicles, and grid connected PV systems. A power Voltage graph of a solar panel shows
that there is an optimum operating point where the panel is able to deliver maximum possible
power to the load at a particular voltage or current. This point varies significantly with increasing
temperature for every individual panel depending mainly on the cell temperature, irradiance and
insignificantly on some other factors. Therefore, on line tracking of the maximum power point of
a PV array is an essential part of any successful PV system. A variety of maximum power point
tracking (MPPT) methods are developed. The methods vary in implementation complexity,
sensed parameters, required number of sensors, convergence speed, and cost. The goal behind
our implementation of the solar panel is to come up with a design to operate each panel to
operate at its maximum power and to extract maximum power from the PV panels even in times
of partial shading or minimum irradiance.
1.5 Vision/Goals:
To cope up with the so formed bottleneck between the excessive demand and
limited supply of energy in Pakistan
To identify substitutes to petroleum resources
We believe macroscopic implications of a supply shock induced energy crisis
are large because energy is the resource used to exploit all other resources
Sustained energy crisis becomes a humanitarian crisis
Principles of green energy and sustainable living movements have gained
popularity

Literature Review
Section at a glance…
MPPT algorithms
Dc to dc convertors
MPPT controllers
Charge Controllers

2.0 Literature Review:
Before coming up with a design to implement an effective algorithm for maximum power point
tracking, it was necessary to perform a literary survey on existing designs of the controllers
already implemented in this area. In this section, we present existing designs and programs for
controllers implemented for single panels. Upon studying theses various techniques, it was
evident that most of them were either used to control the current or voltage indirectly rather than
controlling the voltage directly. These methods showed some serious limitations and
disadvantages that we plan to overcome in terms of simplicity, high convergence speed and
independence on PV array characteristics. Most of these algorithms failed to incorporate the
effect of sudden changes in irradiation level. Detailed explanations of current researches in this
area have been explained in this section.
2.1 MPPT algorithms
MPPTs play a very important role in a PV system since they are responsible for maximizing the
power output from a PV system for a given set of conditions of irradiance and temperature and
hence maximize array efficiency.
Thus, an MPPT can help minimize the overall system cost. Many such algorithms have been
proposed up to date, ranging from direct methods to some indirect ones, these will be discussed
in detail below and feasibility of each of these to be used will be considered to draw a conclusion
as to which of these to use in our design.
2.0 Literature review

The MPPT methods can be classified as direct and indirect methods. The direct methods include
those methods that use PV voltage and/or current measurements. These direct methods have the
advantage of being independent from the priori knowledge of the PV generator characteristics.
Thus, the operating point is independent of isolation, temperature or degradation levels. The
direct methods include the techniques of differentiation, feedback voltage, perturbation and
observation (P&O) [2], incremental conductance, as well as fuzzy logic and neural network. The
indirect methods are based on the use of a database of parameters that include data of typical P-V
curves of PV systems for different irradiances and temperatures. Details of each of these
algorithms follow in this section.
There are a number of algorithms implemented in past researches, however after considering the
feasibility of each of these, we managed to shortlist them, according to their feasibility in
practical design and reliability of data, to two different methods from which to choose our
proposed design. These two are discussed in detail below:
2.1.1 Incremental Conductance Method:
It may be observed that when a power- voltage equation is differentiated, the two sides of the
equation gives incremental conductance and conductance of the other side. This forms the basis
for this model.
3.1.1
Equations 3.1.1 above shows that using the incremental conductance model on an IV

characteristic, MPP can be tracked. From the flow chart below, (figure 3.1.1.1). The present
value and the previous value of the solar array voltage and current are used to calculate the
values of dI and dV. If dV=0 and dI=0, then the atmospheric conditions have not changed and
the MPPT is still operating at the MPP. If dV=0 and dI>0, then the amount of sunlight has
increased, raising the MPP voltage. This requires the MPPT to increase the PV array operating
voltage to track the MPP.
Conversely, if dI<0, the amount of sunlight has decreased, lowering the MPP voltage and
requiring the MPPT to decrease the PVarray operating voltage. If the changes in voltage and
current are not zero, the relationships in Equations 3.1.1 can be used to determine the direction in
which the voltage must be changed
in order to reach the MPP. If dI=dV
> _I=V, then dP=dV > 0, and the
PV array operating point is to the
left of the MPP on the P–V curve.
Thus, the PV array voltage must be
increased to reach the MPP.
Similarly, if dI=dV < _I=V, then dP=dV < 0 and the PV array operating point lies to the right of
the MPP on the P–V curve, meaning that the voltage must be reduced to reach the MPP.
This describes the primary advantage of incremental conductance over the perturb-and-observe
algorithm: incremental conductance can actually calculate the direction in which to perturb the
array’s operating point to reach the MPP, and can determine when it has actually reached the
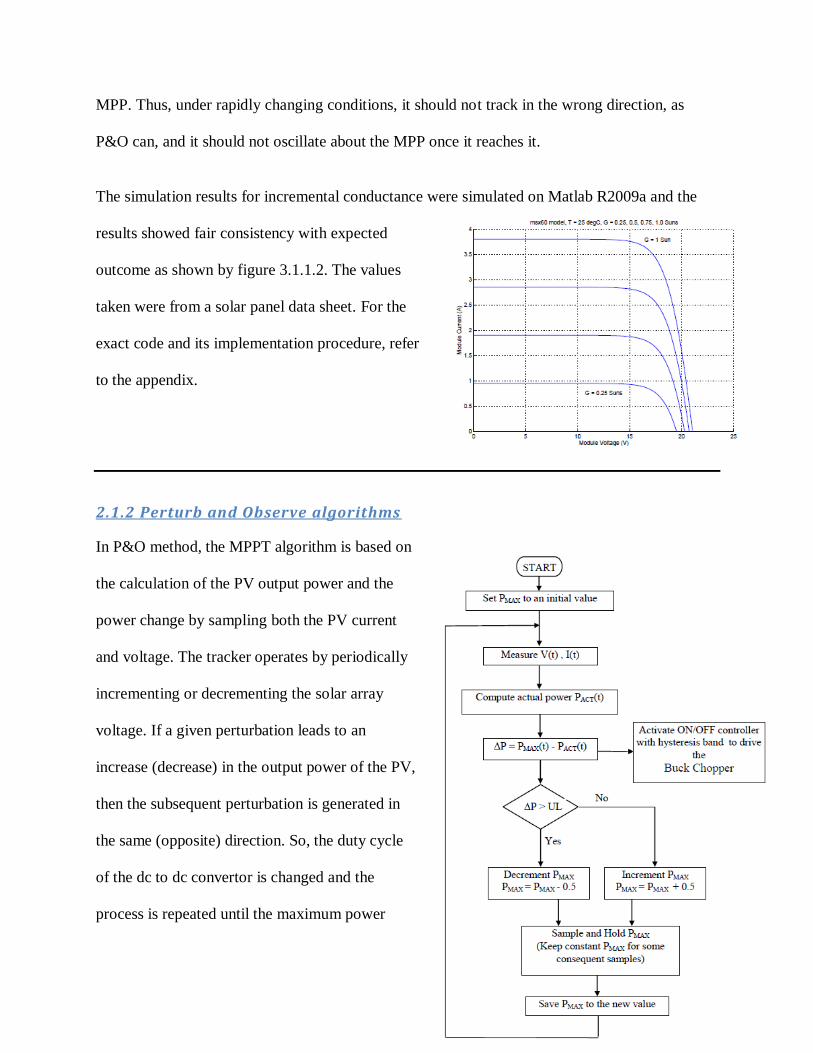
MPP. Thus, under rapidly changing conditions, it should not track in the wrong direction, as
P&O can, and it should not oscillate about the MPP once it reaches it.
The simulation results for incremental conductance were simulated on Matlab R2009a and the
results showed fair consistency with expected
outcome as shown by figure 3.1.1.2. The values
taken were from a solar panel data sheet. For the
exact code and its implementation procedure, refer
to the appendix.
2.1.2 Perturb and Observe algorithms
In P&O method, the MPPT algorithm is based on
the calculation of the PV output power and the
power change by sampling both the PV current
and voltage. The tracker operates by periodically
incrementing or decrementing the solar array
voltage. If a given perturbation leads to an
increase (decrease) in the output power of the PV,
then the subsequent perturbation is generated in
the same (opposite) direction. So, the duty cycle
of the dc to dc convertor is changed and the
process is repeated until the maximum power
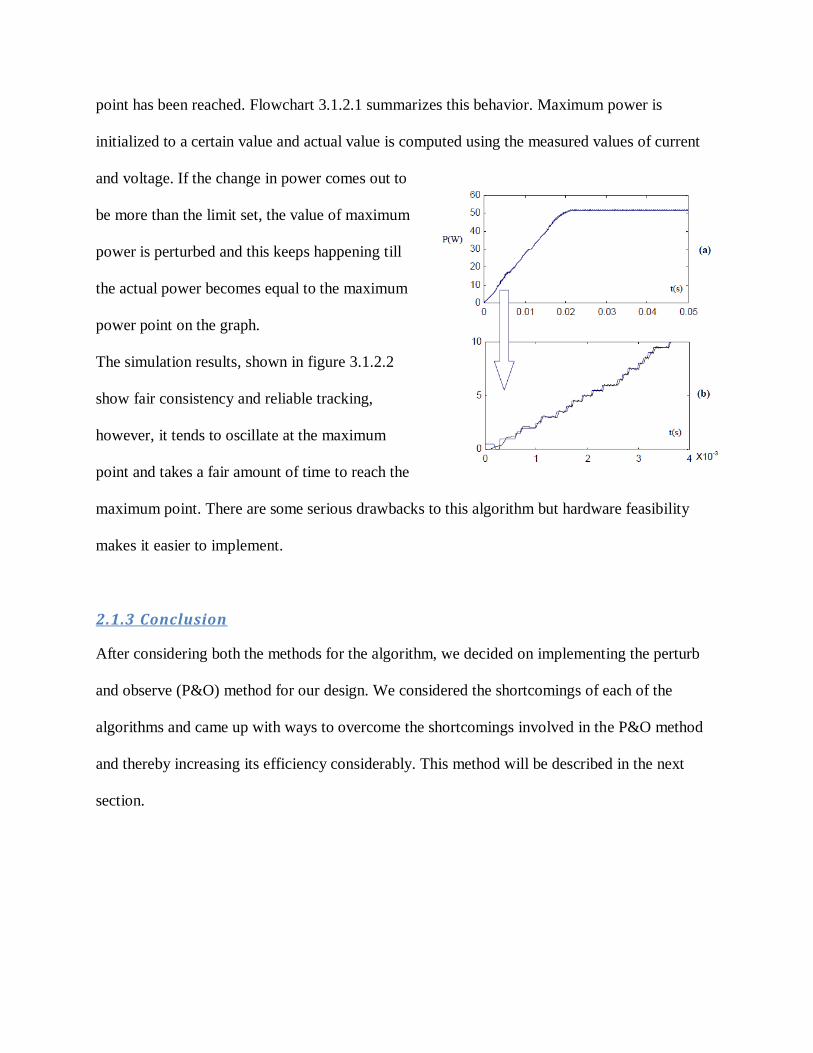
point has been reached. Flowchart 3.1.2.1 summarizes this behavior. Maximum power is
initialized to a certain value and actual value is computed using the measured values of current
and voltage. If the change in power comes out to
be more than the limit set, the value of maximum
power is perturbed and this keeps happening till
the actual power becomes equal to the maximum
power point on the graph.
The simulation results, shown in figure 3.1.2.2
show fair consistency and reliable tracking,
however, it tends to oscillate at the maximum
point and takes a fair amount of time to reach the
maximum point. There are some serious drawbacks to this algorithm but hardware feasibility
makes it easier to implement.
2.1.3 Conclusion
After considering both the methods for the algorithm, we decided on implementing the perturb
and observe (P&O) method for our design. We considered the shortcomings of each of the
algorithms and came up with ways to overcome the shortcomings involved in the P&O method
and thereby increasing its efficiency considerably. This method will be described in the next
section.

2.2 dc-dc convertors:
Since we intend to implement a multiple input DC-DC converter for our solar panels, we first
have to go through the one input simple dc-dc converter theory and then based on the current
research on multiple input dc-dc converters, we will have to design one that will work for
multiple solar panels.
Figure 1

The diagram for the buck dc-dc converter is shown in figure 1(a). The input from our solar panel
is Vd and its is passed to the rest of the circuit through a switch which can be a MOSFET. The
input to the MOSFET can be provided by a controller. The shape of the waveform at across the
diode is given in figure 1(b); The duty cycle, D, can be changed by using PWM generated by a
controller. During the on time (switch closed), the current passes through the inductor, charging
the capacitor and going through the load, which is modeled by a resistor. And during the off t ime
(switch open), the charged inductor and capacitor use their stored energy to provide current to
the load (through the diode) while keeping Vo relatively constant. The 2nd
order low pass filter is
basically there to get the average value of the waveform in figure 1(b) which is Vo. The
spectrum for Vo can be seen in figure 1(b) and we make sure to get the dc component only by
keeping the corner frequency, fc much farther away from zero frequency as shown in figure 1(c).
Now, by solving for the output voltage, Vo in terms of other parameters we get:
Vo = D * Vd
And so given that Vd, voltage from the panel is varying, we need to continuously change the
duty cycle, D to get a constant output voltage. The capacitor value is kept large so that the ripple
in output voltage is kept to a minimum. The inductor makes sure that the current flowing through
the load is almost constant too, by discharging during the time the switch is open (off time). It
can be shown that, in steady state, the average inductor current is equal to the average load
current, i.e. the average capacitor current, in steady state is zero.
This also brings up a point about the two possible modes of operation:
1. Continuous-conduction mode
2. Discontinuous-conduction mode

In continuous-conduction mode, the current through the inductor never reaches zero, i.e. the
switch closes before the current dies out.
In discontinuous-conduction mode, the current throught the inductor does die out and reaches
zero before the switch is closed.
We are going to be focused on the continuous-conduction mode for our project and it can be
shown that the relationship between Vo, Vd and D remains the same. The output current
waveform is shown in figure 2 (top part). And the circuit diagram for on time and off time is
shown in figure 2(a) and figure 2(b) respectively. (Figure 2 is on the next page).
Figure 2

Project outline
Section at a glance…
Overview
Dc to dc convertors
MPPT algorithm
Charge Controllers and overall picture

Project Outline:
3.1 Overview
3. Project Outline
4.2 Proposed MPPT algorithm
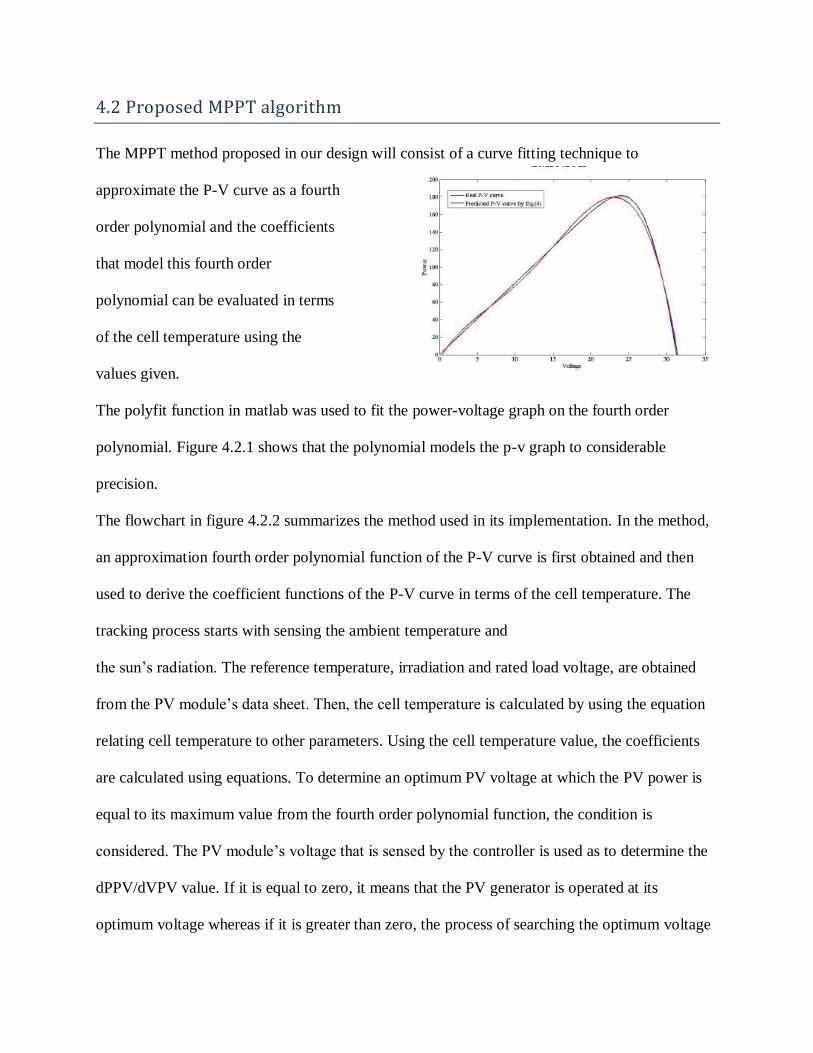
The MPPT method proposed in our design will consist of a curve fitting technique to
approximate the P-V curve as a fourth
order polynomial and the coefficients
that model this fourth order
polynomial can be evaluated in terms
of the cell temperature using the
values given.
The polyfit function in matlab was used to fit the power-voltage graph on the fourth order
polynomial. Figure 4.2.1 shows that the polynomial models the p-v graph to considerable
precision.
The flowchart in figure 4.2.2 summarizes the method used in its implementation. In the method,
an approximation fourth order polynomial function of the P-V curve is first obtained and then
used to derive the coefficient functions of the P-V curve in terms of the cell temperature. The
tracking process starts with sensing the ambient temperature and
the sun’s radiation. The reference temperature, irradiation and rated load voltage, are obtained
from the PV module’s data sheet. Then, the cell temperature is calculated by using the equation
relating cell temperature to other parameters. Using the cell temperature value, the coefficients
are calculated using equations. To determine an optimum PV voltage at which the PV power is
equal to its maximum value from the fourth order polynomial function, the condition is
considered. The PV module’s voltage that is sensed by the controller is used as to determine the
dPPV/dVPV value. If it is equal to zero, it means that the PV generator is operated at its
optimum voltage whereas if it is greater than zero, the process of searching the optimum voltage
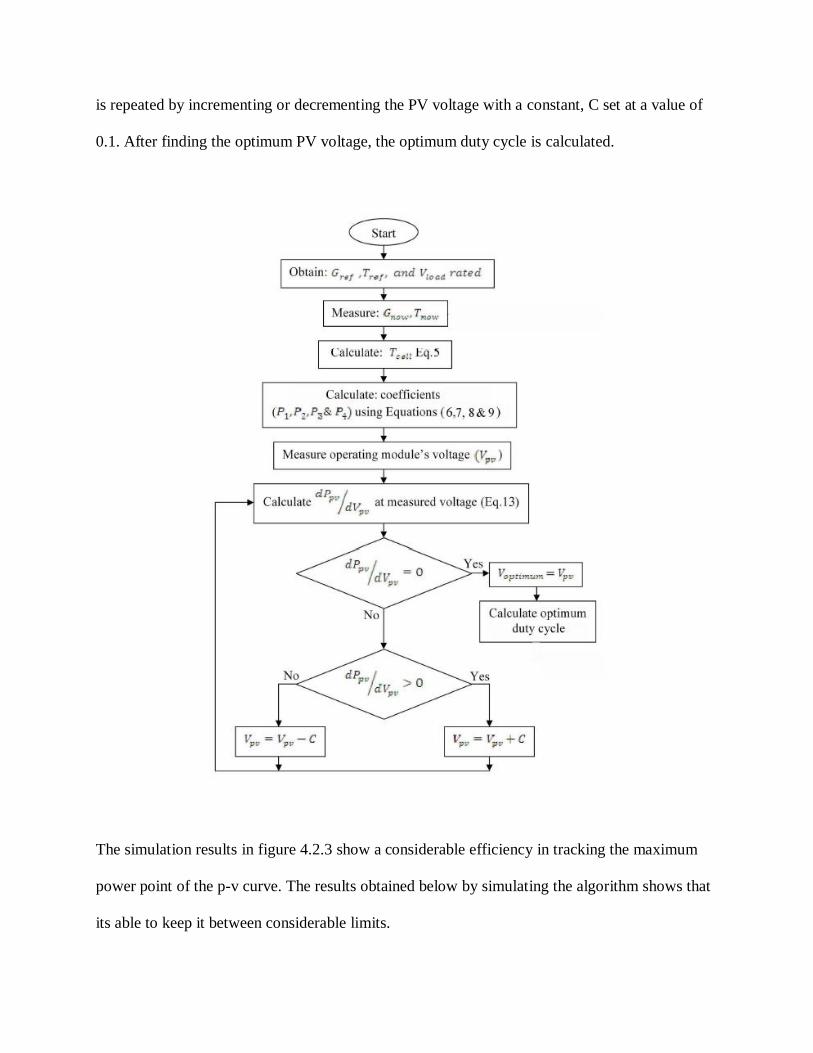
is repeated by incrementing or decrementing the PV voltage with a constant, C set at a value of
0.1. After finding the optimum PV voltage, the optimum duty cycle is calculated.
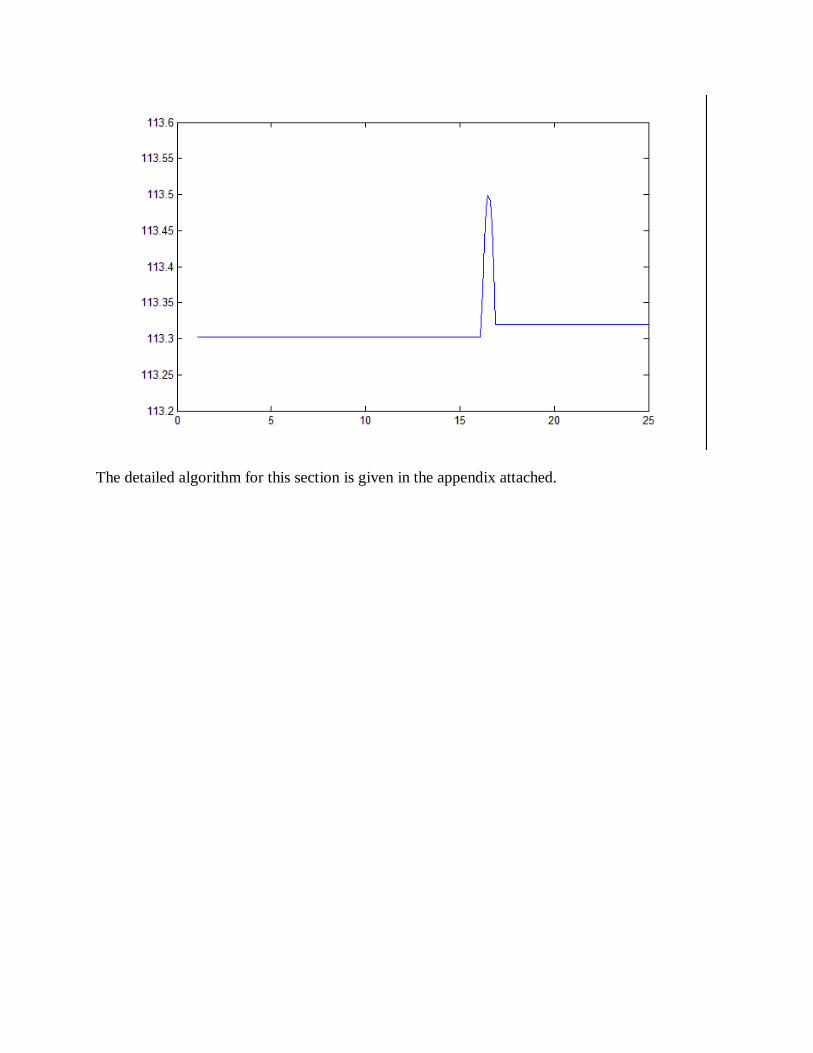
The simulation results in figure 4.2.3 show a considerable efficiency in tracking the maximum
power point of the p-v curve. The results obtained below by simulating the algorithm shows that
its able to keep it between considerable limits.
The detailed algorithm for this section is given in the appendix attached.
3.3 Proposed two input dc-dc convertors
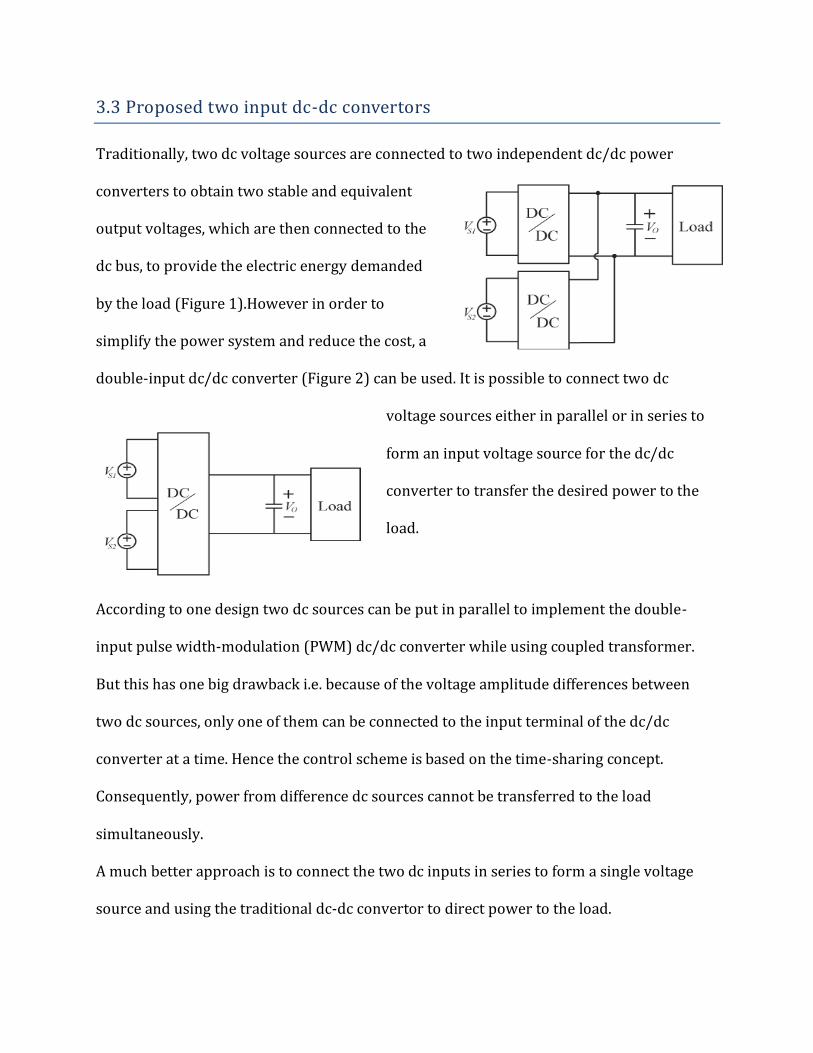
Traditionally, two dc voltage sources are connected to two independent dc/dc power
converters to obtain two stable and equivalent
output voltages, which are then connected to the
dc bus, to provide the electric energy demanded
by the load (Figure 1).However in order to
simplify the power system and reduce the cost, a
double-input dc/dc converter (Figure 2) can be used. It is possible to connect two dc
voltage sources either in parallel or in series to
form an input voltage source for the dc/dc
converter to transfer the desired power to the
load.
According to one design two dc sources can be put in parallel to implement the double-
input pulse width-modulation (PWM) dc/dc converter while using coupled transformer.
But this has one big drawback i.e. because of the voltage amplitude differences between
two dc sources, only one of them can be connected to the input terminal of the dc/dc
converter at a time. Hence the control scheme is based on the time-sharing concept.
Consequently, power from difference dc sources cannot be transferred to the load
simultaneously.
A much better approach is to connect the two dc inputs in series to form a single voltage
source and using the traditional dc-dc convertor to direct power to the load.

Look at Figure 3. Here
VHI>VO>VLO. SHI and SLO
are two power switches
which are controlled by
PWM. DLO and DHI are
the two diodes that
provide bypass path for
the inductor to flow continuously when the power switches are switched off. By applying
the PWM control scheme to the power switches SHI and SLO, the proposed double-input
dc/dc converter can draw power from two voltage sources individually or simultaneously.
The working of the circuit can be explained by dividing the working into 4 modes of
operation (depending on the status of the power switches).
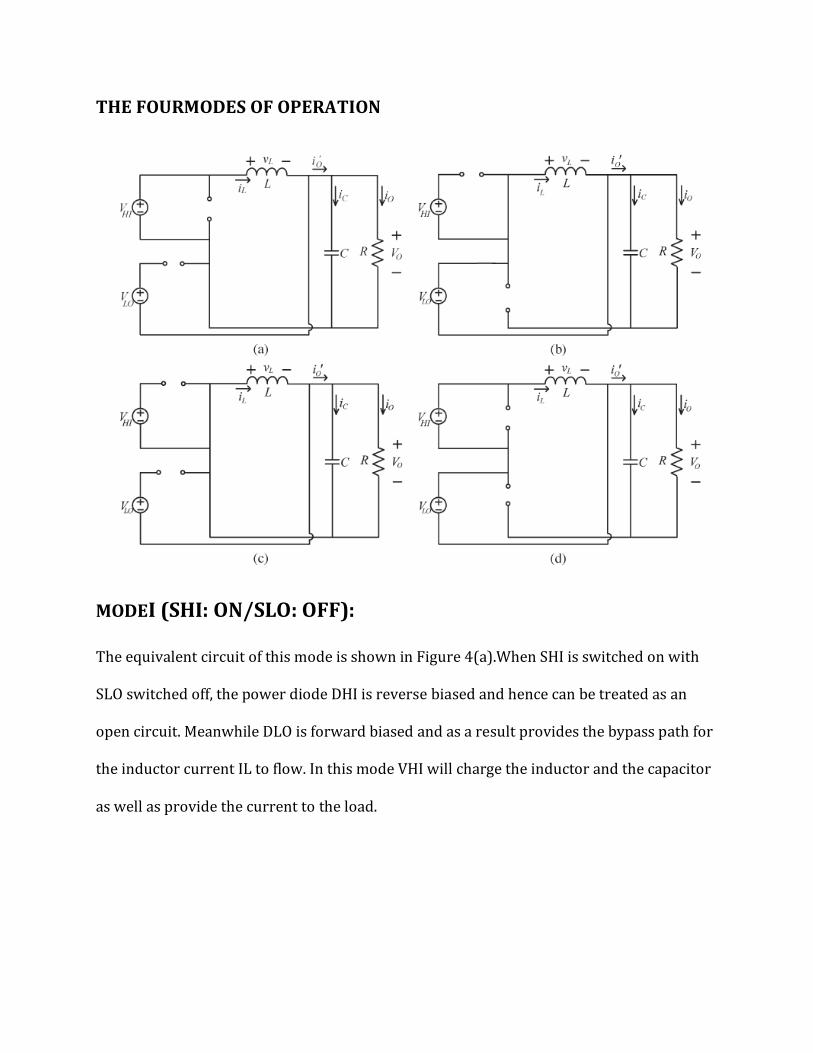
THE FOURMODES OF OPERATION
MODEI (SHI: ON/SLO: OFF):
The equivalent circuit of this mode is shown in Figure 4(a).When SHI is switched on with
SLO switched off, the power diode DHI is reverse biased and hence can be treated as an
open circuit. Meanwhile DLO is forward biased and as a result provides the bypass path for
the inductor current IL to flow. In this mode VHI will charge the inductor and the capacitor
as well as provide the current to the load.

MODE2 (SHI: OFF/SLO: ON):
The equivalent circuit of this mode is shown in Figure 4(b).When SLO is switched on with
SHI switched off, the power diode DLO is reverse biased and hence can be treated as an
open circuit. Meanwhile DHI is forward biased and as a result provides the bypass path for
the inductor current IL to flow. In this mode VLO will charge the inductor and the capacitor
as well as provide the current to the load.
MODE3 (SHI: OFF/SLO: OFF):
The equivalent circuit of this mode is shown in Figure 4(C).Here both the power switches
are switched off. Both DLO and DHI will provide the bypass current path for the inductor
current. Both the voltage sources are disconnected from the circuit and thus the energy
stored in the inductor and capacitor will be released to provide the required current to the
load.
MODE4 (SHI: ON/SLO: ON):
The equivalent circuit of this mode is shown in Figure 4(d).Here both the power switches
are switched on and both the power diodes are reverse biased. Two input voltages VOL and
VHI are connected in series to charge the inductor. The capacitor provides the current to
the load. In this mode of operation both the input voltages will transfer their energies
simultaneously.

The switching frequencies of both the power switches are fixed to be the same. SHI and SLO
are synchronized by the same turn-off transistor with the same turn-on moment. Figure 5
shows the waveforms of the key components of the circuit. Here power switches SHI and
SLO have different conducting time i.e. the duty ratio for SHI is larger than the one for SLO.
The voltage waveform across the inductor has three different levels which are determined
by the ON–OFF status of the main power switches SHI and SLO. The inductor-current
waveform also has three different current slopes based on the three different inductor
voltage values. The input currents reveal that two input voltage sources can provide
electric energy for the proposed double-input dc/dc converter individually or
simultaneously. The capacitor current will compensate the unfiltered output current which
will result in a stable dc load current.

3.4 Charge controller and overall picture

Tentative timeline

References

Appendix