Embed Size (px)
Citation preview
May, 1992 Doc: IEEE P802.11-92/S1
IEEE 802.11 Wireless Access Method and Physical Layer Specifications
Title:
Presented by:
Abstract:
Conclusion:
A Wireless MAC Protocol comparison.
Wim Diepstraten NCR SE-Utrecht NCR/AT&T Network Product Group Nieuwco.:~r:
The Netherlands 31-3402-7 6482 (V) 31-3402-39125 (Fax) Wim. Diepstraten@ U trech t. ncr .com (Email)
In this paper a several protocol comparison aspects are addressed. An analyses is provided that shows the obvious advantage of a distributed access protocol. The W A VELAN CSMNCA protocol is explained and its performance is compared against the 4-WAY LBT protocol as proposed by Ken Biba, and against an extension of the current Wavelan protocol with a MAC level recovery. Several performance analyses methodologies are proposed to build a common ground for protocol comparison. The presented results are preliminary and are based on the simulation approach described in IEEE P802.11-92/26.
It was concluded that the interference robustness and medium sharing behavior are the most important characteristics of a wireless protocol. Based on this a global analyses shows that a distributed "coordination function" is best suited to achieve automatic sharing of the available medium bandwidth, without additional coordination overhead. To improve the robustness of the protocol a MAC level recovery mechanism is very effective. In addition it is shown that CSMNCA as used by W A VELAN does have a very high throughput efficiency paired with a low transfer delay, which is similar than the perfonnance of 802.3 CSMA/CD networks. Wavelan CSMA/CA, CSMA/CA + Ack and the modified Ken Biba 4-way LBT protocol are
Printed: MAY 08, 1992 P~ge 1 By: Wim Diepstraten
May, 1992 Doc: IEEE P802.11-92/51
compared on several aspects. A Peer-To-Peer Buffered Load test methodology is proposed and allows protocols to be compared to several relevant characteristics. The relevant comparison methodologies are explained and illustrated with several simulation output charts. A Client-Server test configuration is suggested to evaluate the net performance for an application. Further work will be needed to compare the different protocols, and this will be subject for future contributivns.
Introduction:
When analyzing MAC protocols, the question is what kind of characteristics should be looked at anu, what would be the suitable method to do it. Clearly one important aspect will be the throughput and response times for the individual stations, and the capacity of the whole system. In a wireless environment in particular, the robustness for interference, and the ability to share the medium are very important characteristics which need to be analyzed when comparing different MAC protocols. This document addresses the important characteristics, and proposes a methodology to analyze them. Only the asynchronous services are evaluated. As an example_ three possible protocol implementations are compared against each other. The following protocols are used as an example:
CSMA/CA protocol as used by W A VELAN. CSMA/CA + Ack protocol extension. 4-WAY LBT protocol (a modified Ken Biba proposal)
The intention of this paper is not to arrive at a conclusion about the preferred access method, because to date not enough simulations are done to fully compare all characteristics of the protocols.
Protocol Characteristics:
The main characteristics of a protocol will depend on the type of services that the MAC layer needs to supply to a particular application. We can distinct a few different categories of applications that use two different types of services as follows:
Connectionless service. This is the type of service which most of today's wired LAN's provide, and on which the majority of Network Operating Systems and applications are based on. It is ideal for "Bursty" traffic. It is characterized by a very low response time, and is generally very tolerable for large deviations in transfer delay.
Printed: MAY 08.1992 Page 2 By: Wim Diepstraten
May, 1992 Doc: IEEE P802.11-92/51
Connection oriented service. This is a type of service that can guarantee a fixed bandwidth to an application, and is characterized by a relative long setup time for the connection, after which the data transfers are usually providing a more or less constant bit stream with relative low deviation in transfer delay. This type of services are used for applications which need real time data like voice or video, and for time bounded transfers of data in for instance an industrial environment.
This document will primarily deal with the connectionless type of service, most commonly utilized by the majority of today's Network Operating Systems. The following is a list of characteristics that need attention:
Throughput:
Total system throughput Individual station throughput as function of Network load. How is throughput shared with other Networks using the same channel. Effect of interference: From other Networks.
Transfer Delay at various load conditions. Max number of stations. Fairness.
From other sources.
Behavior/Stability under h~avy load conditions. Behavior/Stability under varying fade conditions. Effect of "Hidden" tenninals. Effect on higher layer protocols.
As concluded in IEEE P802.11-92/26 simulations will become very important to analyze the perfonnance aspects in a complex environment like Radio Lan's. The relevant Radio medium characteristics need to be modeled such that their major impact on the performance and operational robustness are factored in. This is done in the described simulation approach.
The results of the simulations need to be analyzed in such a way that the major protocol characteristics as listed above are covered.
Printed: MAY 08.1992 Page 3 By: Wim Diepstraten
May, 1992 Doc: IEEE P802.11-92/S1
Protocols considered:
In general two access protocol implementation categories can be distinguished, by the type of "Coordination Function" which is applied. The two "Coordination Function" types are:
Centralized Distributed
When the "coordination function" is centralized in nature then there is some mechanism that assures, at least in one network segment, that only one station is allowed to access the medium at anyone time. The "coordination function" can itself be located in a fixed station, like in a polling environment, or it can be traveling through all stations within a network segment (BSA) like in a token passing system.
When the "coordination function" is distributed in nature then there is a procedure defined by which individual stations are trying to access the medium resolve the contention on the medium. This applies to _ the CSMA type of random access protocols.
A wireless medium is very different from a wired medium, and most obvious is the channel separation difference and availability of bandwidth. In a wired environment the separation between different physical networks is infmite, because they run on separate cables. Increasing the system capacity can simply be achieved by increasing the system bandwidth by running extra cables. In a wireless environment however spectrum resources are scarce. The consequence is that at worst multiple networks will need to share the same band. The isolation between the different network segments (BSA's) will be dependent on the number of channels available.
In a multi frequency channel system the isolation can be relatively high and will depend on the spatial re-use distance that can be achieved with the given number of channels available. When multiple overlapping channels are used then the channel separation will depend on the transmitter and receiver design (PRY). The spurious emissions of the transmitter in a neighbor channel, and the non linear distortion generated in the receiver by a strong nearby transmitter are causing this interference. When only one frequency band is available then an other method for channelization can still be applied by using different (orthogonal) codes in a direct sequence spread spectrum system. The achievable isolation will depend on the code length used, and will be the trade-off between raw bitrate and isolation. In practice for bitrates higher than 1 Mbit the achievable isolation will be very poor compared to the dynamic range of the radio signal,
Printed: MAY 08,1992 Page 4 By: Wim Diepstraten
May, 1992 Doc: IEEE P802.11-92/51
and accurate power control mechanisms are needed to make it useful. In addition not many orthogonal codes will be available.
Bottom line, the co-channel interference in these systems can still be significant, and needs careful consideration for the protocol design. The lowest isolation will be the system which has only one channel available without any further separation provisions. Here the same medium must be shared by multiple networks unless sufficient spatial isolation can be achieved.
In all three cases the protocol has to deal with a certain co-channel interference level. Since the protocol must be able to run on different PHY's, the worst case situation needs to be considered, being the single channel environment. Please note that one of the requirements listed in the Draft 802.11 requirement document was the ability to support a single channel environment. Therefore the coverage area of a wireless LAN segment (BSA) will be interference limited rather than noise limited.
The interference tolerance of a protocol specifically the tolerance for co-channel interference will be a very important factor in the MAC protocol design. This will translate into two different aspects:
The access mechanism: The "coordination function" should be robust for interference. The transfer success: The interference situation at the intended receiver station will determine the success of the data transfer. Since it will be very hard to predict this from the transmit station or any other "coordination function" location, especially in the case of other (non co-channel) interference sources, the success of a transfer can not be guaranteed. Hence the protocol should be tolerant for lost packets.
The latter can best be achieved by a recovery mechanism on the MAC. to become independent from the recovery mechanisms used at higher protocol levels. This is because those recovery procedures are not designed for an environment where interference is dominating the packet error probability, so they are less efficient. A positive acknowledge mechanism, which will indicate to the transmitting station that the packet has been successfully received. can be used to detect that packets are lost. For the access mechanism the basic choice will be between the centralized and distributed "coordination function" . In my mind the determining factor affecting this choice is primarily the ability and efficiency to share the same medium with other networks. For "bursty" traffIc a centralized "coordination
Printed: MAY 08,1992 Page 5 By: Wim Diepstralen
May, 1992 Doc: IEEE P802.11-92/S1
function" will not be able to efficiently coordinate the medium access between multiple BSA's, especially when those BSA's are not part of the same ESA. It would involve coordination via the distribution system if any exist more or less on a per packet basis. This type of coordination could perhaps be dealt with for connection oriented traffic, but still a big problem remain between multiple ESA' s. In any event this type of "coordination function" will be pretty complex and relatively inefficient (for bursty traffic). This is where a distributed "coordination function" can be very efficient because it provides for automatic sharing of the medium without any added complexity (for the coordination). A further advantage is that at a low average network load which is typical for most LANs today, the transfer delay is very low and provides for a "snappy" response. An other factor which needs to be considered is the amount of bandwidth needed for the "coordination function" on the Wireless medium and on the distribution system (backbone network). To give an example: a token passing scheme would continuously use scarce bandwidth even when no load is applied to the system. This will seriously effect the sharing of the channel with neighbor BSA's.
Coordination Function type Conclusion:
The main characteristic for a Wireless MAC protocol is its robustness for interference, and related to that the ability to share a single medium with other networks efficiently. A global analyses shows that for "Bursty" data traffic typical for the connectionless services used by most Network Operating systems today, a distributed "coordination function" promises low response times and more or less automatic sharing of the medium between overlapping networks. This allows for a graceful degradation in throughput per individual network. Apart from this access mechanism it will always be necessary to have a method of dealing with lost packets, and a MAC level recovery mechanism will therefore be essential to achieve adequate robustness. To allow the implementation of a MAC level recovery mechanism a lost packet detection mechanism is needed, which can be done with a relative simple positive Acknowledge facility.
Printed: MAY 08,1992 Page 6 By: Wim Diepstraten
May, 1992 Doc: IEEE P802.11-92/51
Possible "distributed" access methods.
In wired LAN environments CSMNCD is accepted to be a very effective medium access method. In a radio environment it is however not practical to implement the CD function because of the extreme high dynamic range required. The WAVELAN product on the market today uses CSMNCA, which is CSMA combined with a collision avoidance strategy. This provides for a medium use efficiency near the CSMA/CD efficiency. The 4-WA Y LBT protocol proposed by Ken Biba is also a distributed type of access protocol.
CSMNCA explained:
The main access mechanism is I-persistent CSMA. First of all the medium is sensed for valid Spread Spectrum carrier, and when silence is sensed during the duration of a slot, the medium will be accessed. When the medium is sensed busy, then the transmitter will defer until the end of the packet. Normally in CSMA a deferring station would access the medium immediately after the IFS (inter frame space) period. At medium to high network load, there is however a high probability that more stations were deferring on the same packet, and when they both access the medium after the IFS period this will result in a collision, assuming that at the intended receivers both signals will interfere with each other. This is the situation which CSMNCA is trying to avoid. A deferring station will at the end of the packet start a random backoff sequence which is designed to significantly reduce the probability that the multiple deferring stations will collide. So when a station senses a busy network it will use p-persistent CSMA right after the IFS.
CSMNCA Performance:
Figures 1 compares the W A VELAN CSMA/CA performance with ALOHA and slotted CSMA which is run on the same W A VELAN PHY. As shown, the efficiency of the protocol is very good, and reaches approximately 87% of the 2 Mbps raw bitrate for long packets. This is similar to the efficiency of CSMNCD parameterised according to the 802.3 standard. It should be noted that part of the overhead is due to the training time required by the PHY to select the best antenna (for antenna diversity), and achieve proper synchronization. The slotting time relates to the time required for proper Spread Spectrum signal detection on a particular antenna. Given the low medium propagation delay, the slotting time can be much lower than used in the 802.3 CSMA/CD networks today. For Wavelan the slottime is in the order of 10% of the 802.3 standard. This clearly shows that a distributed access method can achieve high efficiency, paired with low transfer delay, and is stable even under high load conditions.
Printed: MAY 08,1992 Page 7 By: Wim DiepstrJten
May, 1992 Doc: IEEE P802.11-92/S1
Comparing MAC protocols.
The W A VELAN CSMNCA access method is used further to compare it against possible alternatives.
One clear alternative is to extend the CSMA/CA access method with a MAC level recovery mechanism based on a packet loss detection by means of an Acknowledgement of successful reception of the MSDU by the intended receiver. The other distributed control protocol under analyses is the 4-WA Y LBT protocol as proposed by Ken Biba in Doc IEEE P802.11-91/92. The described protocol has been adapted in certain area's, and is run on the Wavelan PHY, so that a direct comparison between the MAC protocols is possible. The intention of this paper is not to arrive at a conclusion about the preferred access method, because to date not enough simulations are done to fully compare all characteristics of the protocols. The rest of the paper is intended to describe the possible methodology for comparing the protocols on several aspects.
4-WAY LBT Protocol modifications:
The 4-WAY LBT protocol proposal of Ken Biba in Doc IEEE P802.11/91-92 is changed in some area's as explained below:
The RTS, crs, DATA and Ack frame structures are changed a bit in size to reflect the following:
The preamble is eff~ctively longer to reflect the training length requirements of the W A VELAN PHY. The crs and ACK packets contain the source address of the original transmitter that is captured by the intended receiver.
The document was unclear about the behavior of the receiver when it receives aRTS packet. The document suggest that when a station is receiving a valid RTS addressed to that station, then it will send back the CTS packet. This is changed, so that the crs packet is only returned when the station is enabled to transmit by the "Net allocation vector", to prevent it from interfering with on-going transfers in a nearby network.
Printed: MAY 08.1992 Page 8 By: Wim Diepstraten
May, 1992 Doc: IEEE P802.11-92/51
Simulation environment:
The simulation program as described in doc IEEE P802.11-92/26 was extended to include the modified 4-WAY LBT protocol from Ken Biba. All the different protocol derivates shown here are controlled by setting different parameters in the simulation program. In addition some changes were made to the reporting facilities, and the results are imported into SigmaPlot version 4.1 and processed to provide the graphical output as shown in the appendix. This allows for postprocessing of the large amount of simulation results, and makes it possible to correlate all kind of situations with the different parameter sets used.
Simulations performed:
The three protocols CSMNCA, CSMNCA + Ack, and 4-WAY LBT are being compared against each other with various type of simulations:
Throughput and Transfer delay versus Buffered Load. with 100% Long packets (Novell length). with a 60% Short packet + 40% Long Packet mix (Novell lengths).
Throughput and transfer delay versus the number of stations. Max throughput as function of the PHY preamble length. Medium sharing behavior (at high load).
Throughput and Transfer delay versus distance between two networks. Throughput and Transfer delay versus distance between two networks in a multi floor environment. Individual station behavior in various multi network environments. "Hidden Station" behavior.
Throughput in a high load Novell environment (Client Server).
All simulations are based on the W A VELAN PHY which provides a 2 Mbps raw bitrate data channel.
Printed: MAY 08.1992 Page 9 By: Wim Diepstraten
May, 1992 Doc: IEEE P802.11-92/S1
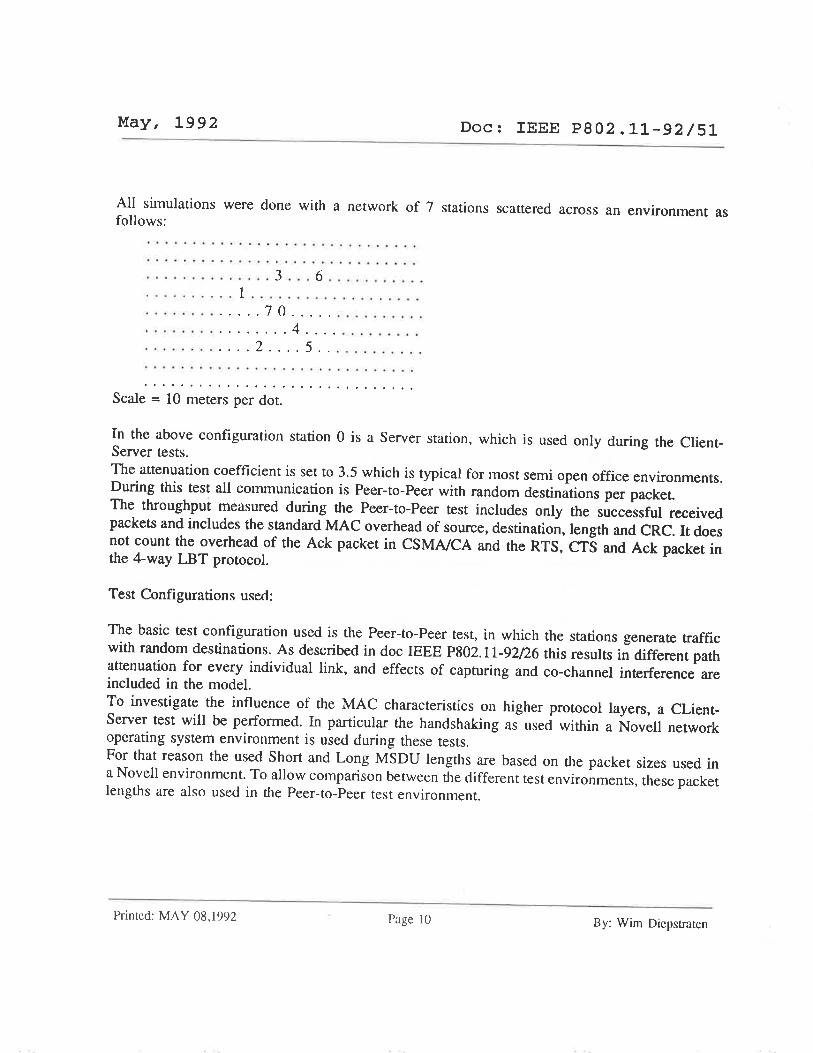
All simulations were done with a network of 7 stations scattered across an environment as follows:
· ...... . ..... . 3 . . . 6 . . . .... ... . · .. . .... . . 1 . . .. . . . ... . ... . . . . . · ... . . . .. .. . . 70 .. . .. . .. . . . . . . . · .. . ... .. . ..... . 4 .... . . .... . . . · . . . .. .. . . .. 2 .... 5 . . .. ..... . . .
Scale = 10 meters per dot.
In the above configuration station 0 is a Server station, which is used only during the ClientServer tests. The attenuation coefficient is set to 3.5 which is typical for most semi open office environments. During this test all communication is Peer-to-Peer with random destinations per packet. The throughput measured during the Peer-to-Peer test includes only the successful received packets and includes the standard MAC overhead of source, destination, length and CRC. It does not count the overhead of the Ack packet in CSMA/CA and the RTS, crs and Ack packet in the 4-way LBT protocol.
Test Configurations used:
The basic test configuration used is the Peer-to-Peer test, in which the stations generate traffic with random destinations. As described in doc IEEE P802.11-92/26 this results in different path attenuation for every individual link, and effects of capturing and co-channel interference are included in the model. To investigate the influence of the MAC characteristics on higher protocol layers, a CLientServer test will be performed. In particular the handshaking as used within a Novell network operating system environment is used during these tests. For that reason the used Short and Long MSDU lengths are based on the packet sizes used in a Novell environment. To allow comparison between the different test environments, these packet lengths are also used in the Peer-to-Peer test environment.
Printed: MAY 08,1992 Page 10 By: Wim Diepstraten
May, 1992 Doc: IEEE P802.11-92/51
Buffered Load:
In a simulation environment it is not practical to apply a Poisson distribution function to generate traffic for the medium. Also in a real "Bursty" traffic environment this approach is not realistic. In the simulation we have to deal with a (fixed) number of stations that want to get a certain amount of data through the medium. In real applications the actual traffic source is a transaction or a large file which take a number of packets to complete a communication session. In reality a new packet will not be generated until the previous packet has been transferred. The MAC protocol needs to resolve the contention between all the stations who have packets to transmit. This is the load offered to the "coordination function", and is what I called the "Buffered Load". The buffered load is generated and calculated as follows:
Traffic generation model:
! =======================! ++++++++++++++++++! xxxxxxx! Random delay Access delay Xmit delay
Random delay
++ Access delay
xx Xmit delay
Used to control the "buffered load" during the test, It IS generated randomly with a fixed minimum time of in this case 1 msec. This represents the minimum processing time that is needed to generate a new packet by a station. This will be the time required for the MAC to gain access to the medium. This is the time required to transmit the total packet, at a given raw bitrate.
The buffered load per station is = l/(A verage Random + Xmit) * Average Packet length
For the total system the buffered load will be the buffered load per station times the number of active stations. In words the buffered load represents the average amount of data waiting to be transmitted across the medium. It would be the maximum achievable throughput when the access delay is zero. It should be noted however that for the protocols which have a MAC level recovery function, the access time includes the extra time needed for this recovery. The advantage of this approach is that the transfer delay in an overload situation does still have a meaning and shows the actual average response times achieved at this network load level. It also gives a good overview of the stability of the protocol Ullder high load conditions.
Printed: MAY 08.1992 Page 1 1 By: Wim Diepstraten
May, 1992 Doc: IEEE P802.11-92/S1
I would like to propose that this "Buffered Load" definition is used to produce the Throughput and Transfer Delay versus Buffered Load curve.
Throughput and Transfer delay versus Buffered Load curves:
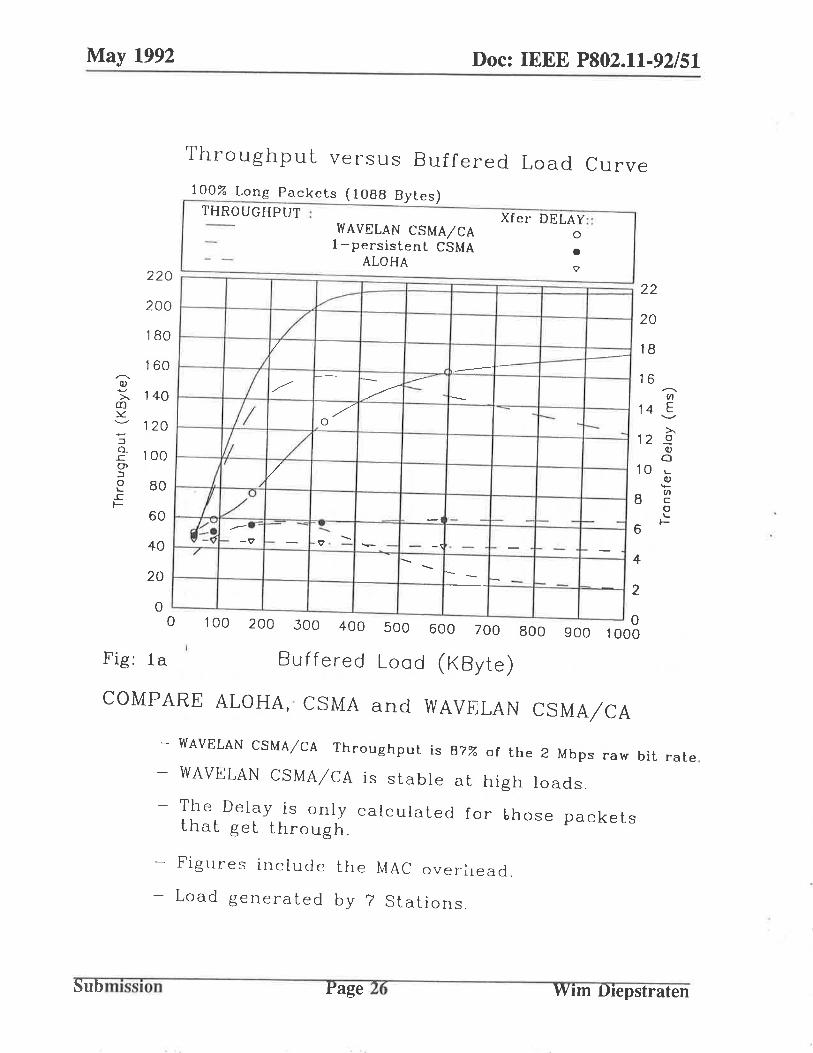
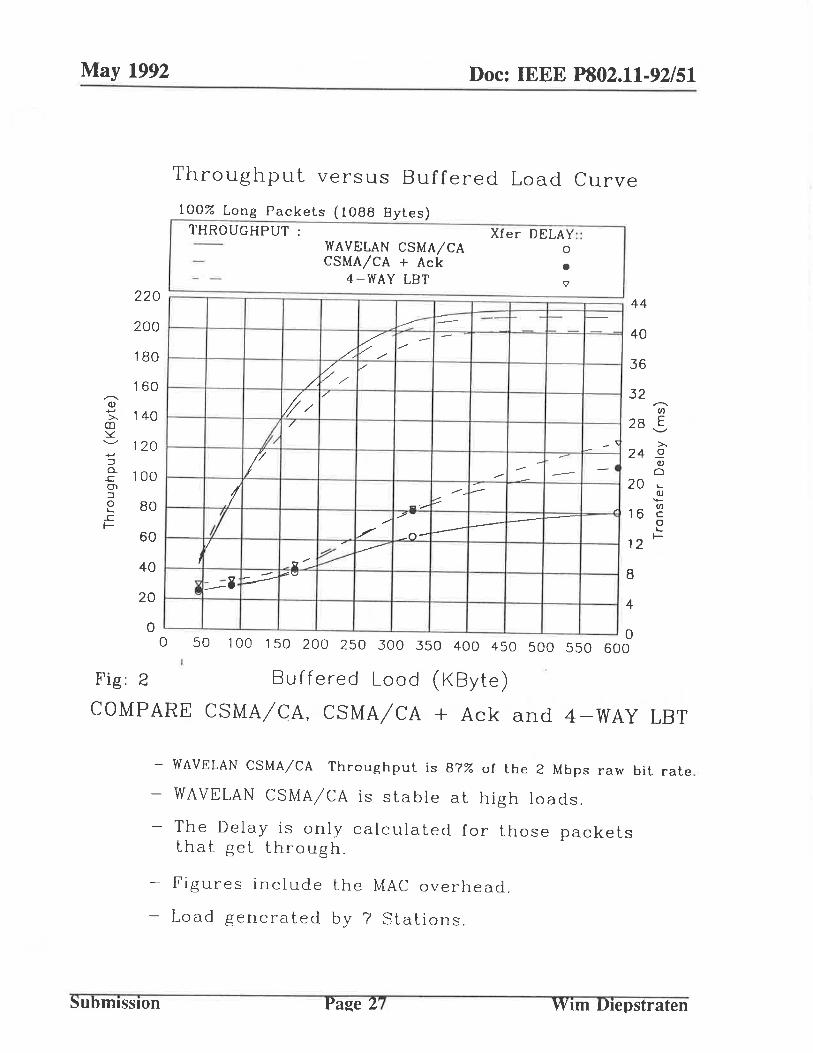
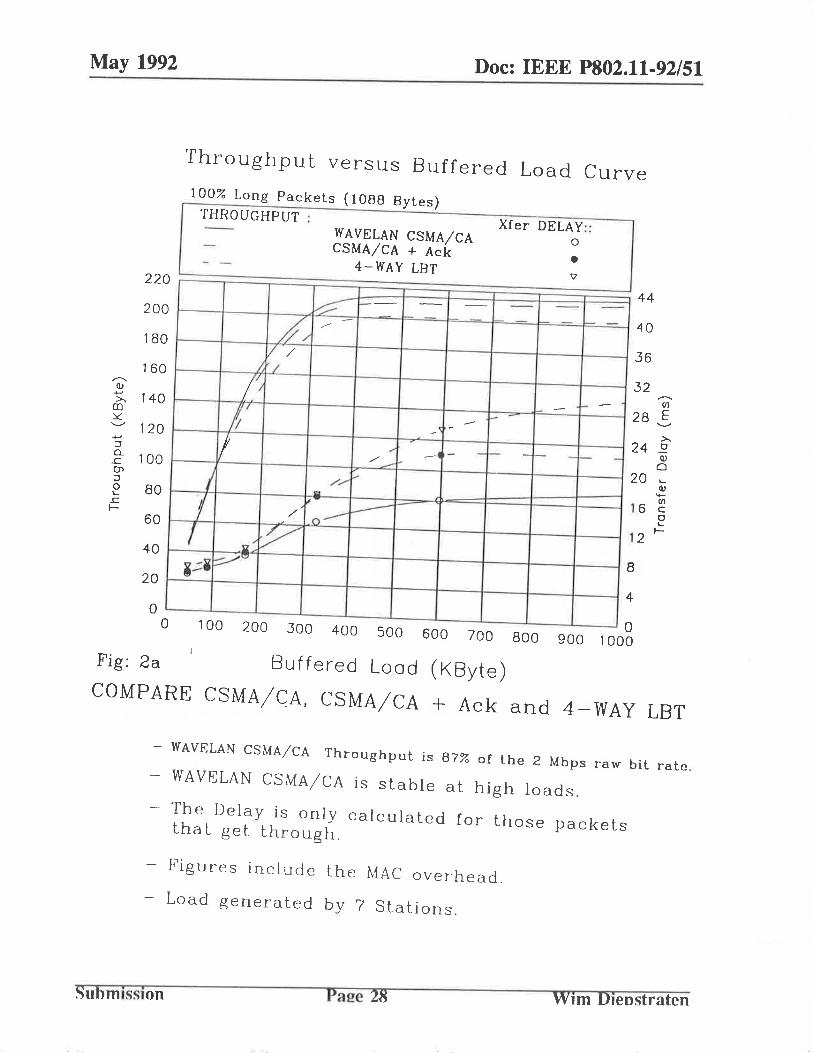
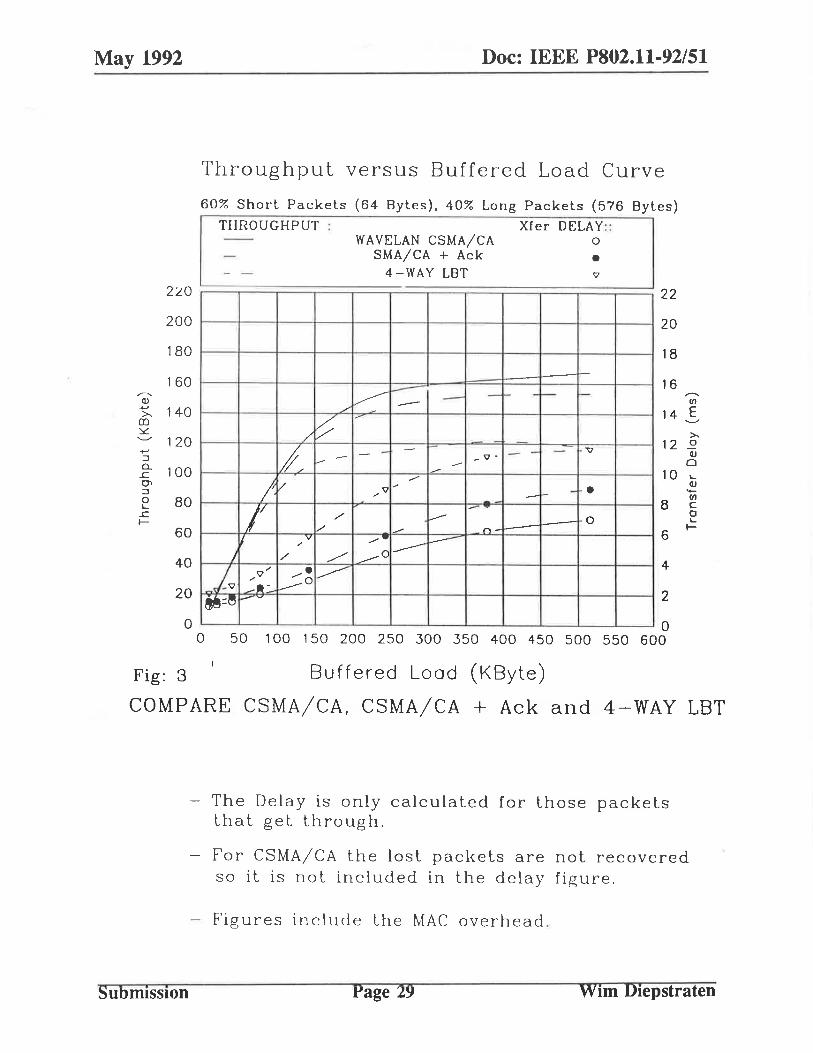
Figure 1 compares the performance of CSMNCA with slotted I-persistent CSMA and ALOHA for a lK data + Novell + MAC overhead packet size of 1088 Bytes to set a reference. Figure la is the same with somewhat adapted load axis to show the stability at high overload conditions. Figure 2 and 2a compares the performance of CSMNCA with CSMA/CA + Ack and the modified 4-WA Y LBT protocol of Ken Biba. Figure 3 compares the 3 protocols in a more realistic network environment which is typical for Novell traffic. The load consist of 60% Short Novell(+MAC overhead) packets of 64 Bytes, and 40% of Long Novell Packets based on a data contents of .5 KByte, resulting in 576 Bytes.
CSMNCA shows a higher throughput than both other protocols, but it should be noted that the lost packets are not recovered by the MAC itself so this must be resolved at higher protocol levels. This will effectively result in a lower performance when this is taken into account compared to the CSMNCA + Ack protocol. The results show that the 4-WAY LBT has a lower perfonnance which is due to the higher MSDU overhead, and the effect of the PHY training overhead which will be shown later.
Throughput and transfer delay versus the number of stations.
An other relevant parameter in the behavior of an access protocol is the total number of stations for which the contention needs to be resolved. This is especially relevant when those stations apply a high load burst to the network. The probability of successful access resolution in a distributed access protocol will decrease when the number of stations accessing the medium at the same time increases. Typically a network is dimensioned such that the average load is relative low, so that on average a very good response time is achieved. The probability that at a certain point in time n stations are accessing the medium simultaneously will depend on the application, and will be very low for high values of n. In other words: the probability that the protocol needs to resolve access contention between 10 stations in a network with 100 stations will generally be very low. ~-Iowever in a single channel wireless environment where all BSA's need to share the same band, the total population of stations which "hear" each other is larger then the number of stations belonging to the same BSA. This will depend on the propagation characteristics of the
Printed: MAY 08,1992 Page 12 By: Wim Diepstraten
May, 1992 Doc: IEEE P802.11-92/S1
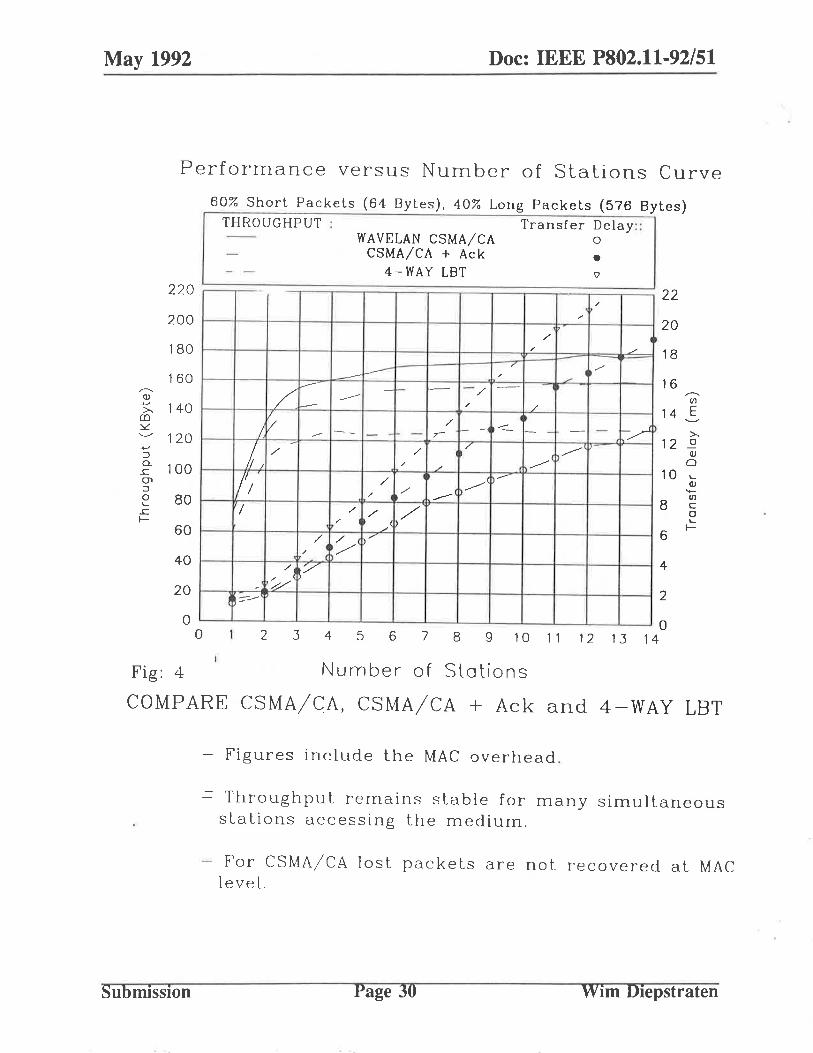
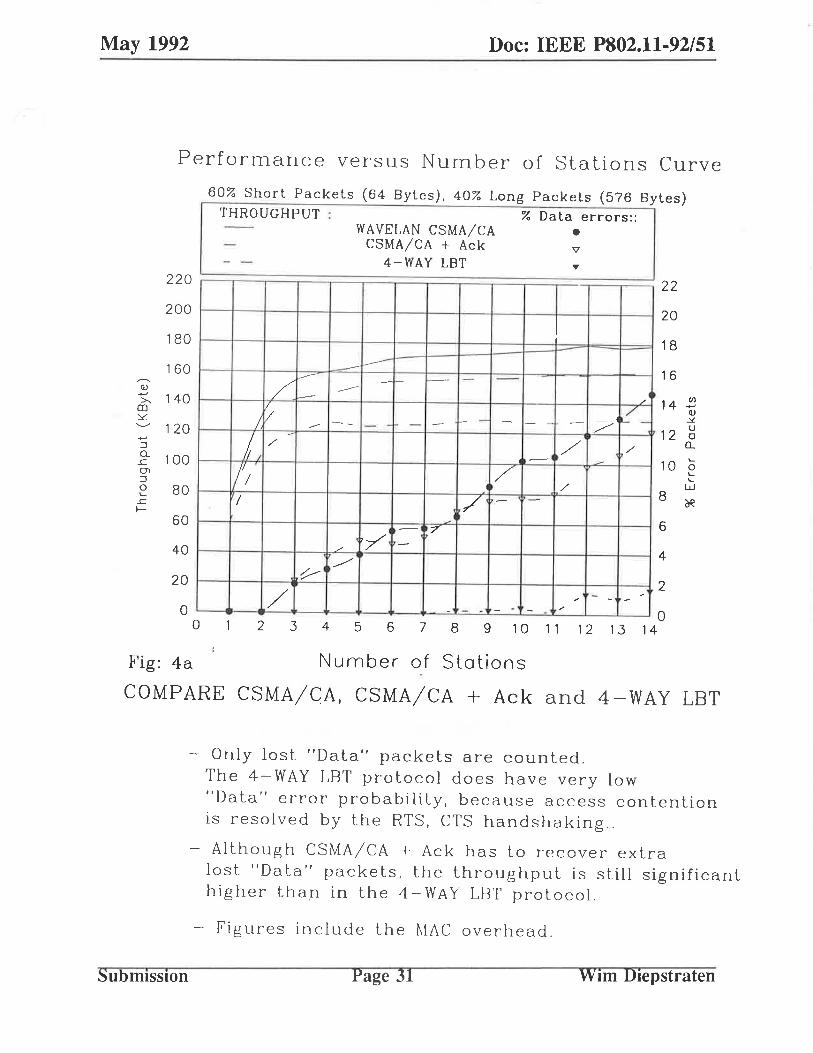
environment, and the total station density. The relation between throughput, delay and number of stations doing simultaneous access needs to be analyzed. This is done in figure 4 with the diagram showing the total throughput and the delay as function of the number of stations. In addition to that, Figure 4a shows the percentage lost packets encountered. In CSMNCA those packets are not recovered, so this neeas to be resolved on higher protocol layers, resulting in a lower average response time as shown in the diagram. This is also the reason why CSMNCA and one of the reasons why the 4-WA Y LBT protocol show a lower throughput performance and a higher transfer delay.
Delay distribution:
Currently the simulation program does not have sufficient provisions to evaluate the delay distribution. It does average the delay on a per station basis, and this is again averaged on a per network basis as shown in the various figures. This is however one of the characteristics that need to be analyzed when comparing protocols. Further simulation program development and simulation effort is needed in this area.
Dependency on PHY
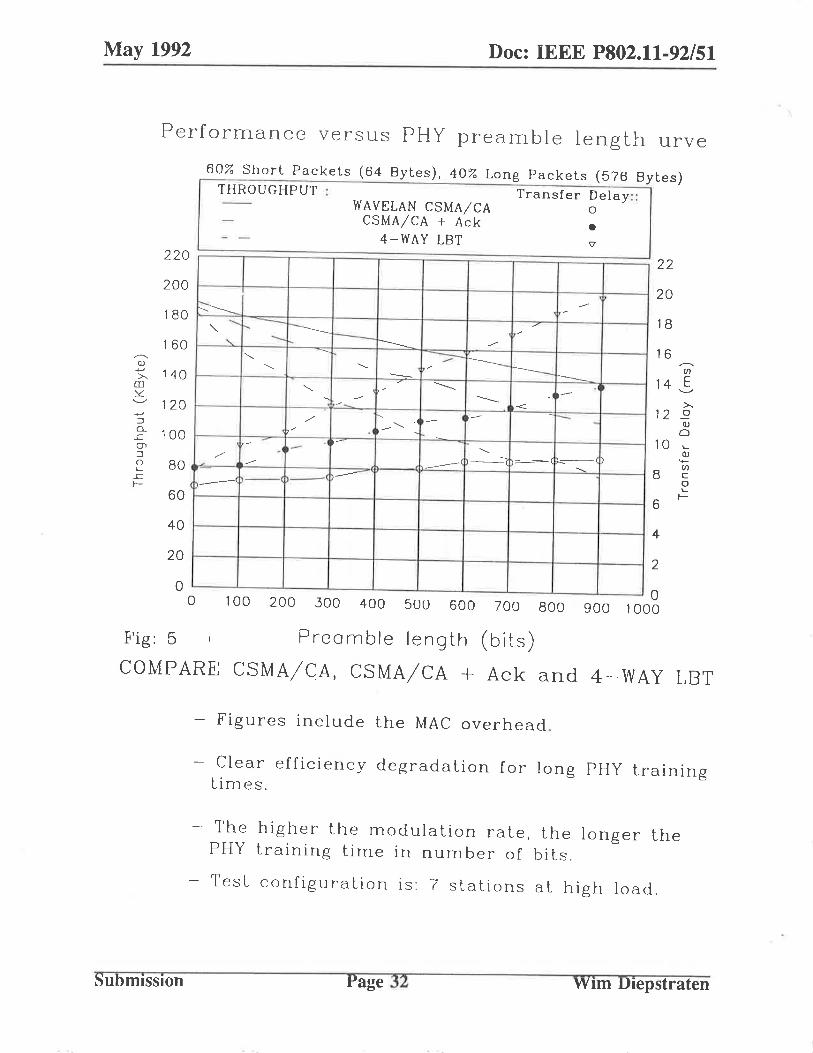
The main parameter which will have influence on the MAC protocol performance is the preamble length needed to allow the PHY to achieve sufficient quality of service. This is in effect the training time needed in the PHY to obtain sufficient synchronization for a good quality demodulation. This will particular have a large influence on High speed systems. When for instance an equalizer needs to be trained to allow the high modulation rates, then this will need extra preamble time in the MAC. Even when the absolute time to achieve synchronization stays the same when increasing the data rate of a system, will increase the overhead percentage, because the overhead expressed in bittimes will increase with the same ratio. To analyze the dependency on this a simulation is needed that shows the throughput as function of the PHY related preamble time. This simulation is done at high load situations, because there the effect is dominant. This is shown in figure 5. As is obvious from the diagram the 4-WAY LBT protocol is highly effected by the preamble length, because one MSDU transfer translates into 4 packets on the medium, which each need to train the PHY.
Printed: MAY 08,1992 Page 13 By: Wim Diepstraten
May, 1992 Doc: IEEE P802.11-92/51
Medium Sharing Behavior
In wire1ess the multi network behavior is essential especially when only one frequency band is available. It is important to share the (single) medium as efficient as possible, also when multiple ESA's overlap. Related to that is also the fairness of access that individual stations experience.
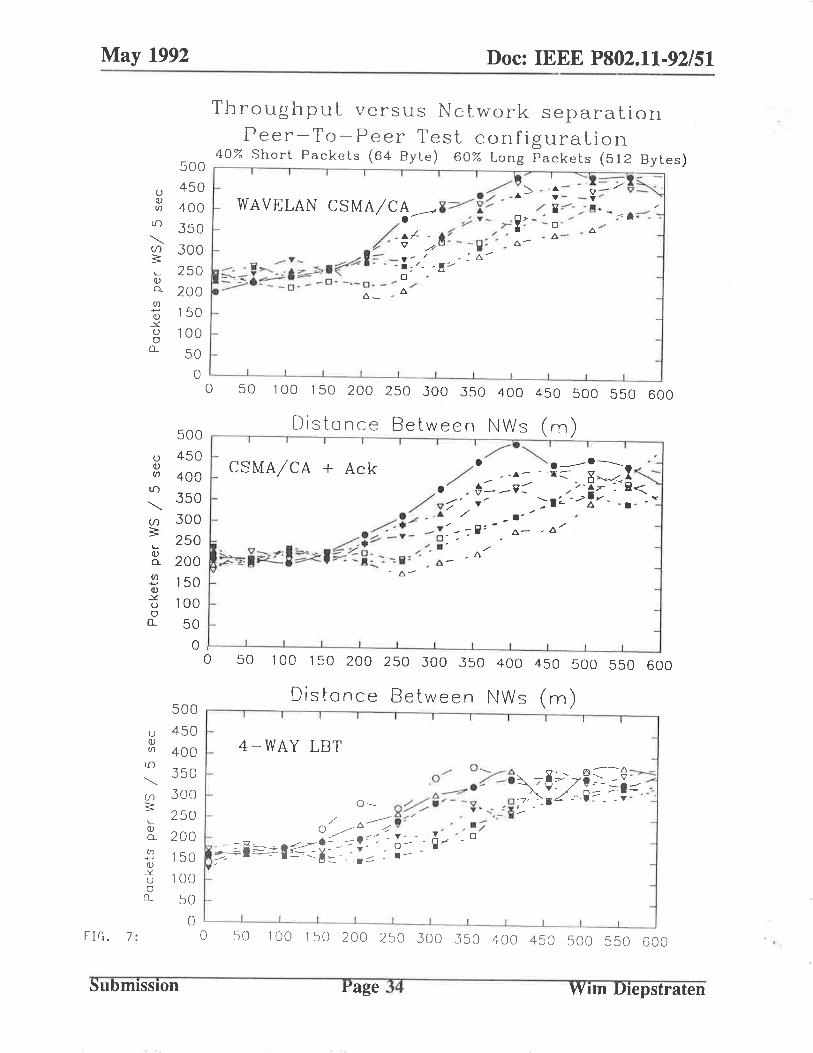
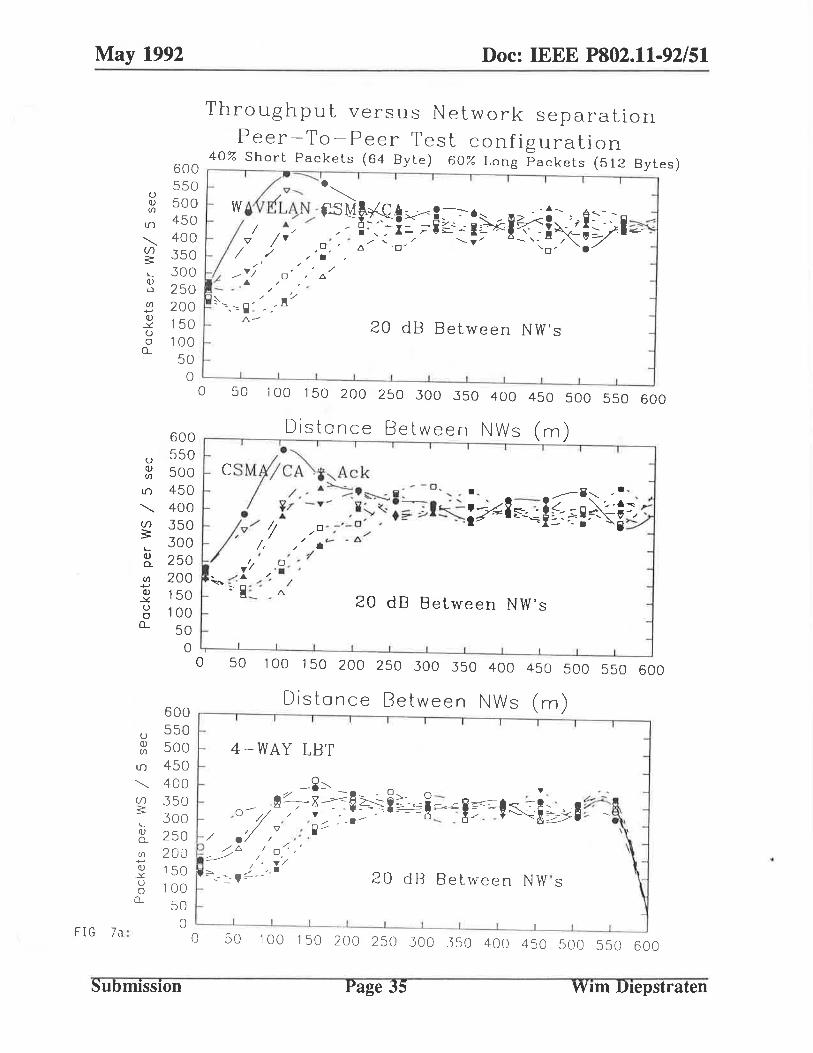
This should be evaluated for both the fully and partly overlapping case. For this purpose a simulation is set up for two networks, in which the distance between both networks can be varied. Because the simulation program takes into account every individual attenuation path between all the stations of the two networks, the co-channel interference effects are automatically included. The simulation configuration uses 2 networks of seven stations each, with variable distance between the networks. In addition an extra attenuation can be specified between the networks to simulate that both networks are on a different floor, or in different area's separated by a thick wall. For each of the three protocols 2 sets of simulations are run.
With a additional separation of 0 and 20 dB. With varying the distance between the networks from 5 to 605 meters in steps of 50 meters. A 60% Short and 40% Long MSDU mix is used throughout the tests. Test duration is 5 seconds per point.
This way all possible situations can be evaluated. It does contain both fully and partly overlapping situations, and contains "Hidden Station" situations. For instance the test configuration with 20 dB network separation offset in particular does contain a lot of "Hidden Station" situations.
The results need to be looked at in several ways to evaluated the different aspects:
Throughput and delay versus network separation distance. Figures 6 This gives a global overview of the total capacity and how effectively it is shared. Also shown on the same page is the number of "Data" packets lost per individual station over the total test period of 5 seconds. However if part of the stations have a lousy performance because the access scheme is unfair, this would hardly show up on the total throughput perfonnance, because then the bandwidth would be used up by other stations. Individual station performance. The total network throughput performance does not sufficiently show all the effects of the network overlap, and the fairness between the stations. For this purpose the number of
Printed: MAY 08.1992 Page 14 By: Wim Diepstraten
May, 1992 Doc: IEEE P802.11-92/S1
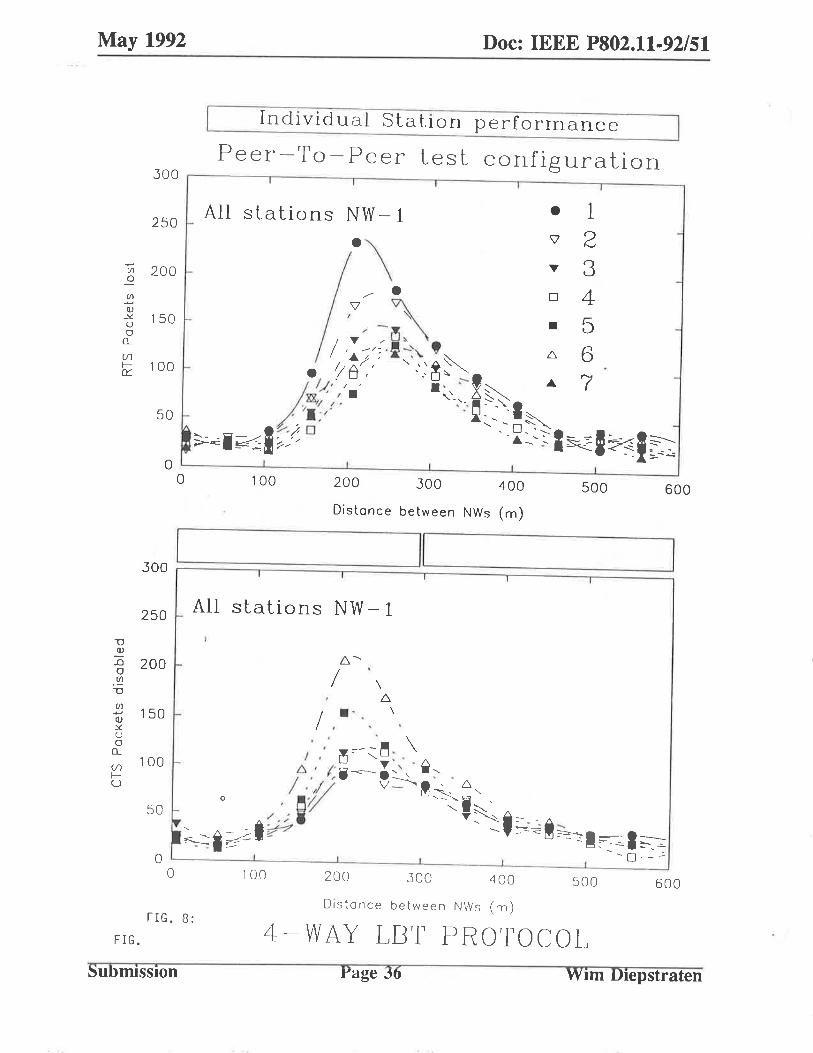
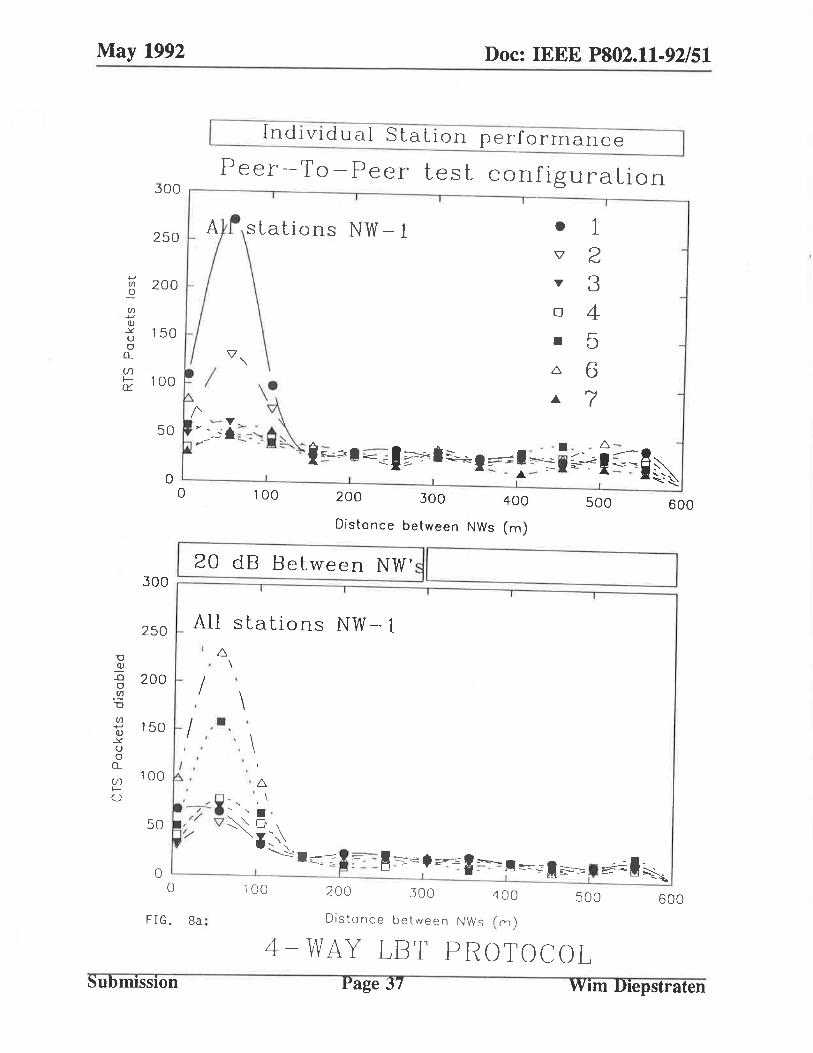
successfully transferred packets per individual station is given in Figure 7. They show how fair the bandwidth is divided over the different stations in the fully overlapping case. In the partially overlapping case there will be a large deviation between stations, because some of the stations need to share with stations of both networks while other stations do not see the other network or see only part of the stations of the other network. For the CSMNCA protocols the cause of the errors can be analyzed, by looking at the number of collisions and number of overjammed packets per station. For the 4-W A Y LBT Protocol two other values are of interest which give equivalent information. These are the number of lost RTS packets, which is equivalent to the collision count, and the number of times no crs packets could be returned because the destination station was not enabled to transmit. This is shown in Figure 8 and 8a.
The detailed information is needed to get a good feeling for the most dominant factors influencing the individual performance. They can also be used to optimize the different parameters of a given protocol.
Result evaluation: As is shown in the total network throughput graphs, there is no significant difference in the sharing behavior between the 3 evaluated protocols. A difference would be expected however for the 4-WA Y LBT protocol, because this protocol effectively prevents any parallel transmissions in an area around both the transmitter and the receiver, while the CSMNCA protocols do this only around the transmitter. The difference can possibly be explained by the setting of the CRS level and minimum reliable receive level. When looking at the individual station throughput in figure 7, then it shows that there is less variation between the stations in the 4-WAY LBT protocol than the CSMNCA protocols. Further analyses of the results are still needed for a good comparison. A preliminary conclusion is that the extra overhead involved in the 4-WAY LBT protocol to prevent the loss of a "Data" packet is less efficient then CSMNCA + Ack. So accepting loss of bandwidth of a long "Data" packet is and retransmit the packet is more bandwidth efficient than the continuous overhead for every packet.
Printed: MAY 08,1992 Page IS By: Wim Diepstraten
May, 1992 Doc: IEEE P802.11-92/51
Throughput in a Novell environment:
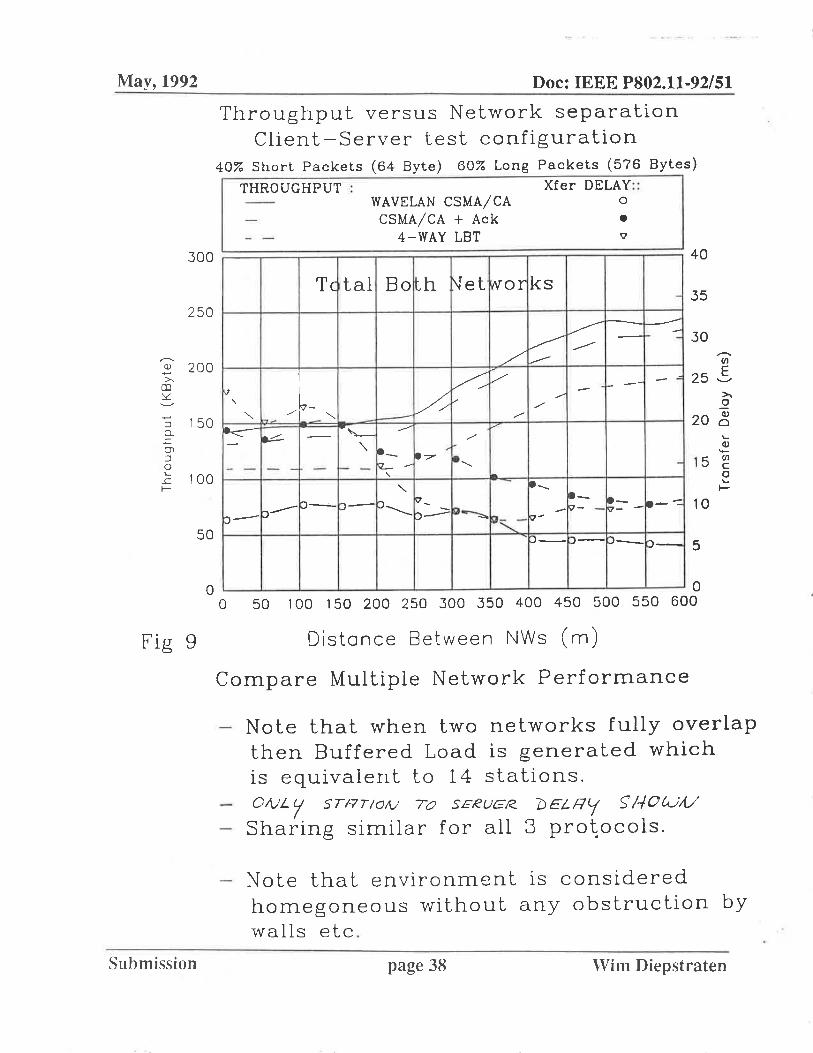
A separate class of simulations will be needed to evaluate the effect of the MAC protocol on higher level protocol layers, and to investigate the performance under several traffic load conditions. One of such traffic models is included in the simulation model and represents the Novell Perform3 test. This test puts a high load on the network, and models the Netware transport protocol NCP (Network Core Protocol). This test is very representative for a Client-Server environment in which all traffic is between a station and a server station, with Request!Response handshaking per packet.
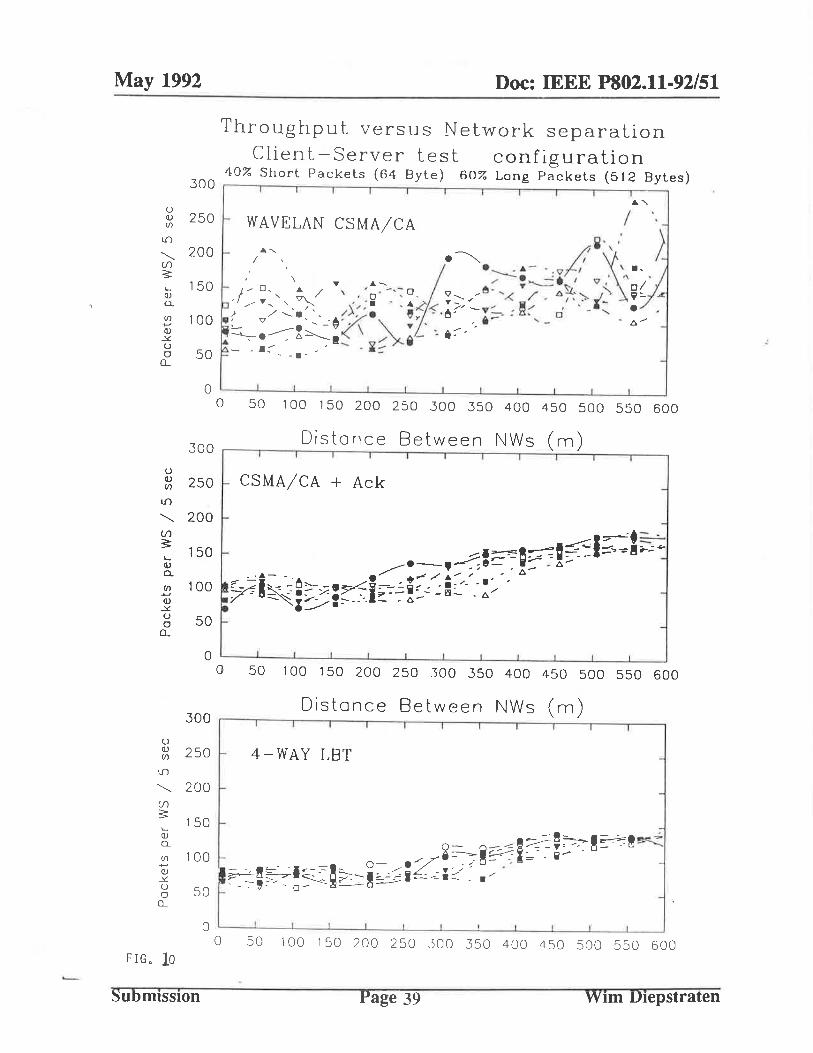
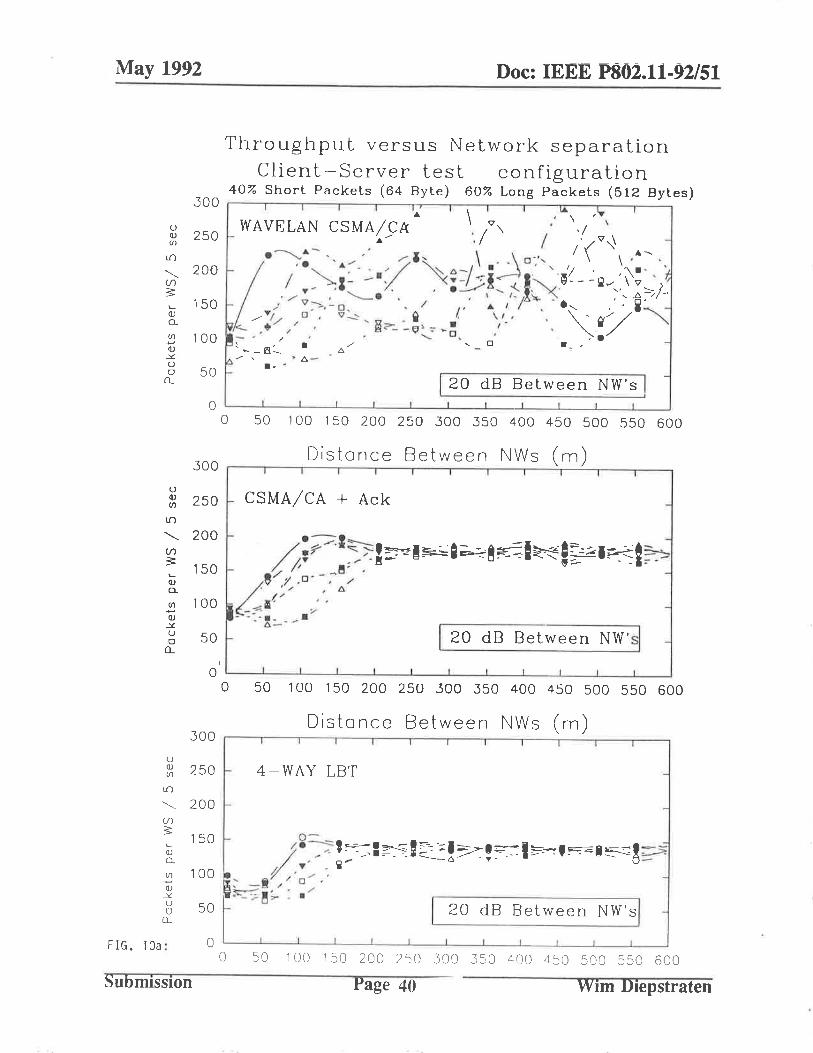
The total throughput performance is shown in figures 9 and 9a, which in this case show the net application data, so without the Novell handshaking overhead and MAC overhead. In such a configuration the effect is that all the traffic in a network runs via the Server, which means that the server typically generates 50% of all the packets. The consequence is that the throughput relations and the error probability can be much different from the figures resulting from the Peer-to-Peer test configuration. This is because the buffered load and the average number of stations who are simultaneously accessing the medium is less than 50% than in the Peer-to-Peer configuration. This is because on average more than half the stations are waiting for a response of the Server station before they can generate the next MSDU. This difference is also demonstrated in doc IEEE P802.11-91/125, which shows the throughput and lost package probability as function of the number of stations for both a Peer-to-Peer and Client-Server configuration. A comparison of the individual station performance is shown in figures 10 and lOa, which shows only the number of packets received from the server. An other aspect that is the effect of a lost packet on the higher layer protocol. This is however only relevant when this higher layer protocol needs to recover from this. In the case where the lost package detection and recovery is done in the MAC, like in the CSMNCA+Ack and 4-WAY LBT protocol, this would be much less of an issue, and the result would only be a longer response time for that station, so a bit lower throughput. The effect of this is very visible in the individual performance of the CSMNCA protocol, which need recovery from the higher protocol layers. The effect is a pretty large deviation in individual performance, because of the long timeout period used in the higher layers to detect the occurrence of a lost packet.
The protocols with MAC recovery do however increase the "Buffered Load" on the medium when many lost packets need to be recovered. This is an effect which is not visible in a Peer-toPeer test configuration, but becomes more visible in a Client-Server test.
An other aspect that will impact the result is the physical location of the Server, especially in a multi network test. It will make a di~ference when the Server is located in the middle or near the edge of a network.
Prinled: MAY 08,1992 Page 16 By: Wim Diepstraten
May, 1992 Doc: IEEE P802.11-92/51
Bottom line is that we have to look at the individual station performance rather than the total network throughput performance. This is because a poor perfonning station will have a low impact on the total throughput, because other stations will use the bandwidth that becomes available when a poor perfonning station is waiting for a time-out.
Other simulations needed:
In addition to the test configurations discussed, simulations would be needed to test the effect of other interfering sources like microwave ovens etc. As already indicated previously also the transfer delay distribution, or at least the maximum delay a station encounters should be looked at. This will help also in optimizing the backoff algorithms for CSMNCA and the lost packet recovery retry procedure.
Conclusion:
It was concluded that the interference robustness and medium sharing behavior are the most important characteristics of a wireless protocol. Based on this a global analyses shows that a distributed "coordination function" is best suited to achieve automatic sharing of the available medium bandwidth, without additional coordination overhead. To improve the robustness of the protocol a MAC level recovery mechanism is very effective. In addition it is shown that CSMNCA as used by W A VELAN does have a very high throughput efficiency paired with a low transfer delay, which is similar than the performance of 802.3 CSMNCD networks. Wavelan CSMNCA, CSMNCA + Ack and the modified Ken Biba 4-way LBT protocol are compared on several aspects. A Peer-To-Peer Buffered Load test methodology is proposed and allows protocols to be compared to several relevant characteristics. The relevant comparison methodologies are explained and illustrated with several simulation output charts. A Client-Server test configuration is suggested to evaluate the net performance for an application. Further work will be needed to compare the different protocols, and this will be subject for future contributions.
Printed: MAY 08,1992 Page 17 By: Wim Diepstralen
May, 1992 Doc: IEEE P802.11-92/S1
*
*
*
*
*
*
*
WIRELESS MAC PROTOCOL COMPARISON
What are the most import~t characteristics of a Wireless MAC Protocol
Global selection of the type of protocol most suitable to meet the most important characteristics.
Comparing Distributed Access Protocols
Defme the type of simulations needed
Explain the test configurations
Describe the comparison methodology
Discuss the performance results
Printed: MAY 08,1992 Page 18 By: Wim Diepstraten
May, 1992 Doc: IEEE P802.11-92/S1
What are the most important characteristics of a Wireless MAC Protocol
* Protocol characteristics needed for data
Bursty traffic requires low response times
Need high average throughput
Can tolerate large transfer delay variations
* Services used for data
Printed: MAY 08,1992
Connectionless service most commonly used by todays Network Operating Systems.
Isochronous not considered during comparison
Page 19 By: Wim Diepstraten
May, 1992 Doc: IEEE P802.11-92/S1
*
*
*
*
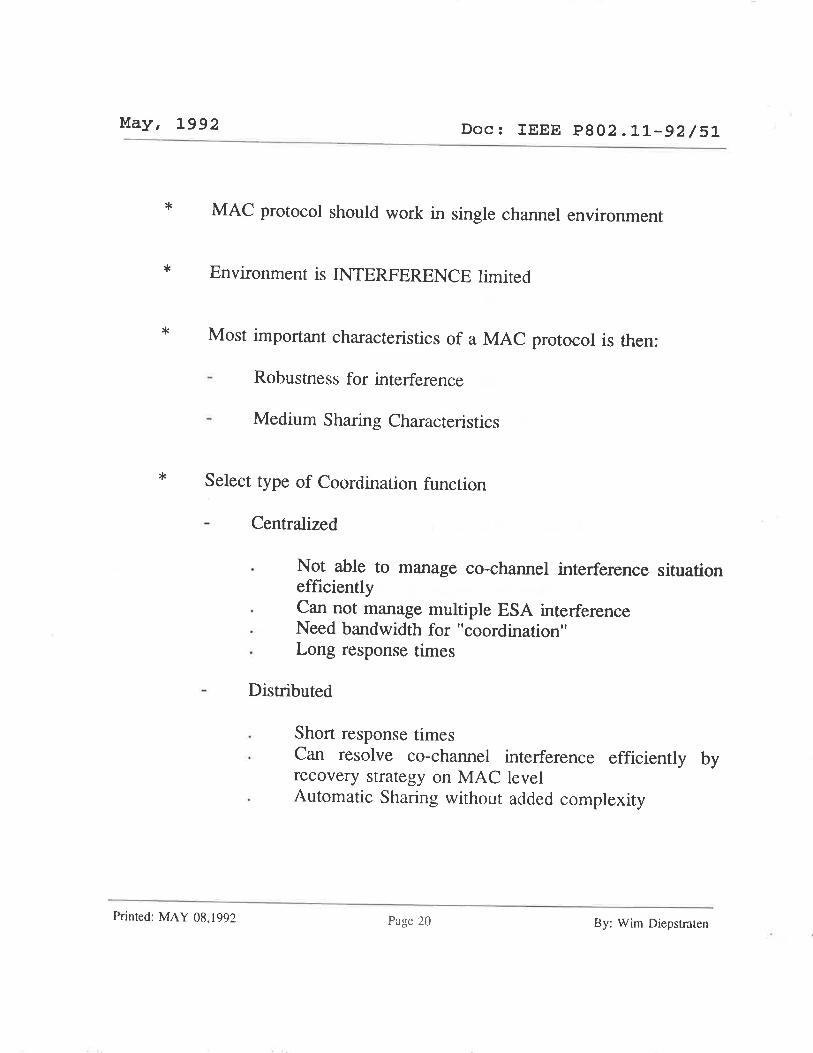
MAC protocol should work in single channel environment
Environment is INTERFERENCE limited
Most important characteristics of a MAC protocol is then:
Robustness for interference
Medium Sharing Characteristics
Select type of Coordination function
Centralized
Not able to manage co-channel interference situation efficientl y Can not manage multiple ESA interference Need bandwidth for "coordination" Long response times
Distributed
Short response times Can resolve co-channel interference efficiently by recovery strategy on MAC level Automatic Sharing without added complexity
Printed: MAY 08,1992 Pnge 20 By: Wim Diepstrnten
May, 1992 Doc: IEEE P802.11-92/51
*
*
*
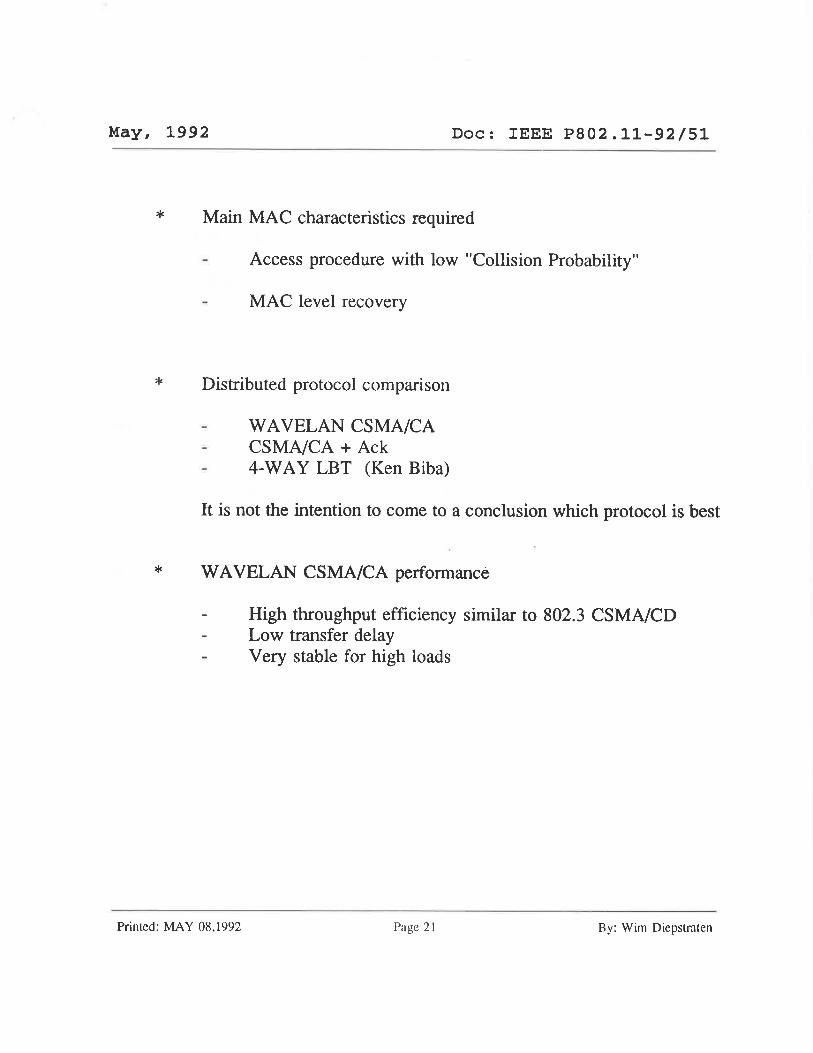
Main MAC characteristics required
Access procedure with low "Collision Probability"
MAC level recovery
Distributed protocol comparison
W A VELAN CSMA/CA CSMA/CA + Ack 4-WAY LBT (Ken Biba)
It is not the intention to come to a conclusion which protocol is best
W A V ELAN CSMA/CA perfonnance
High throughput efficiency similar to 802.3 CSMA/CD Low transfer delay Very stable for high loads
Printed: MAY 08.1992 Page 2 1 By: Wim Diepstraten
May, 1992 Doc: IEEE P802.11-92/51
* Simulation environment
Simulation model explained in Doc IEEE 802.11/92-26
Graphical post processing with SigmaPlot 4.1
* Simulations performed
Printed: MAY 08 .1992
Peer-to ?~er tests Throughput and Transfer Delay versus Buffered Load Throughput and Transfer Delay versus number of stations. Throughput as function of the PHY preamble length. Medium sharing behavior (at high load). Look at individual station behavior. o Multiple Networks o Multi Floor o "Hidden Stations"
Client -Server Throughput in a high load Novell environment (Perform3 test) Individual station
Page 22 By: Wim Diepstraten
May, 1992 Doc: IEEE P802.11-92/S1
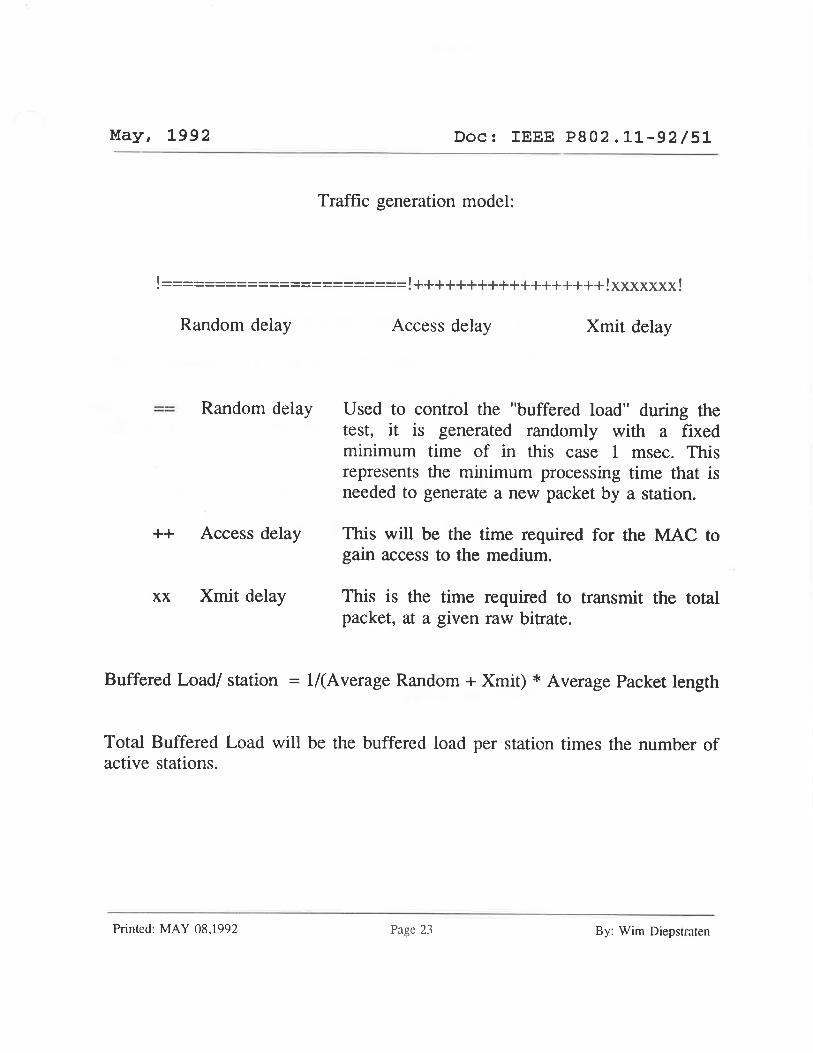
Traffic generation model:
!=======================!++++++++++++++++++!xxxxxxx!
Random delay
Random delay
++ Access delay
xx Xmit delay
Access delay Xmit delay
U sed to control the "buffered load" during the test, it is generated randomly with a fixed minimum time of in this case 1 msec. This represents the minimum processing time that is needed to generate a new packet by a station.
This will be the time required for the MAC to gain access to the medium.
This is the time required to transmit the total packet, at a given raw bitrate.
Buffered Load/ station = l/(A verage Random + Xmit) * Average Packet length
Total Buffered Load will be the buffered load per station times the number of acti ve stations.
Printed : MAY 08.1992 Page 23 By: Wim Diepstraten
May, 1992 Doc: IEEE PB02.11-92/S1
* Results:
CSMA/CA is very efficient
All protocols share medium gracefully
4-WAY LBT is highly effected by PHY preamble length
Lost bandwidth due to lost "Data" in CSMA/CA + Ack does cost less than the lost "Data" prevention overhead needed in the 4-WAY LBT protocol
4-WAY LBT performs better for hidden stations
There is still lost "Data" in 4-WAY LBT protocol
* Conclusion
Printed: MAY 08,1992
Distributed access protocols can efficiently operate in a Wireless environment They have superior characteristics for interference robustness and medium sharing.
Page 24 By: Wim Dicpstraten
May 1992 Doc: IEEE P802.11-92/S1
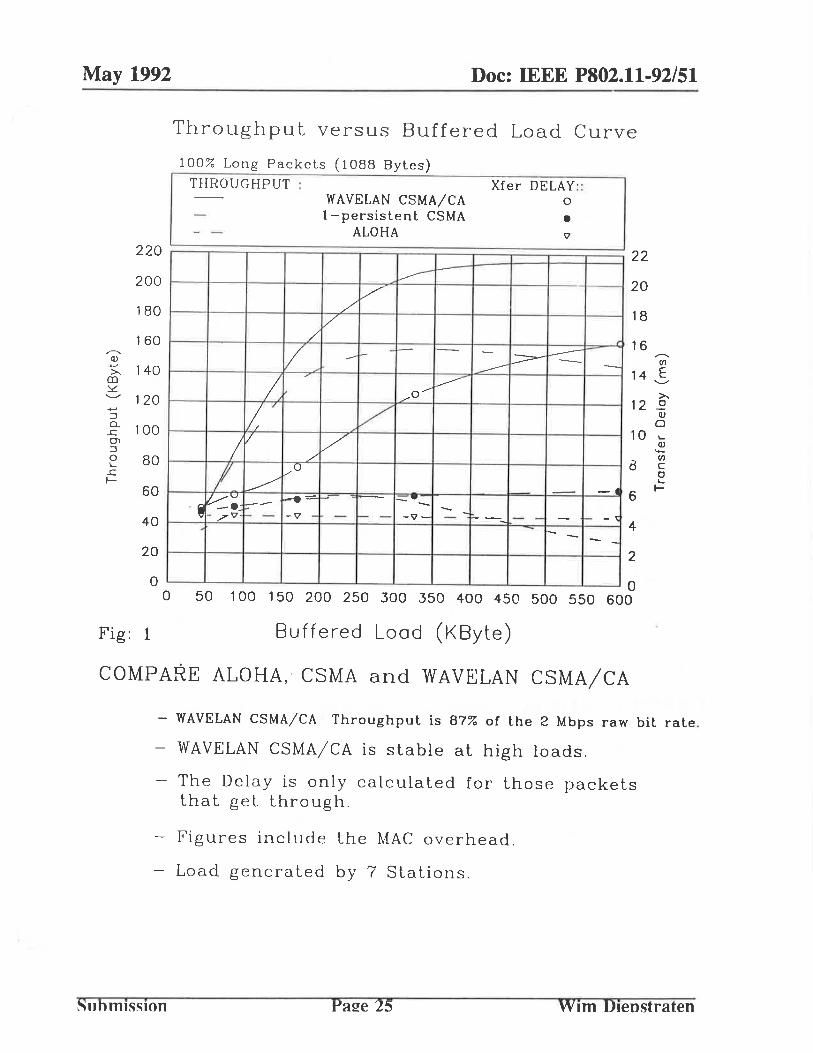
Throughput versus Buffered Load Curve
100% Long Packets (1 OBB Bytes)
THROUGHPUT : Xfer DELAY :: - WAVELAN CSMA/CA ° - l-persistent CSMA • - - ALOHA V'
220 22
200 ~ ..-
/ - 20
180 ./ V
18
160 ,--..
<1> ...., 140 >..
en ~ "---' 120 ..... :J Q. 100 ..c CJl :J 0 80 I-..c f-
60
40
/
/ -- f-- - ----~ ~ - -
I~ _"'_0..., ~
j/ V j/
/' /'
1-~ / 0
- -I ~'-' -e= :...: ~ ... -
. @ -- ----- -::..-- 7V' - - -V' - t- - -V'- r- -_ - - - r- -~ r- _
16 ----VI
14 E '---'
>. 12 ~
Q)
0 10 I...
Q) "-
a VI c 0 I...
6 f-
4 - -
20 2
o 0 o 50 100 150 200 250 300 350 400 450 500 550 600
Fig: 1 Buffered Load (KByte) I
COMPARE ALOHA,· CSMA and WAVELAN CSMA/CA
- WAVELAN CSMA/CA Throughput is 87% of the 2 Mbps raw bit rate .
Suhmission
WAVELAN CSMA/CA is slable al high loads.
The Delay is only calculated for those packets that gel through.
Figures include the MAC overhead.
Load generated by 7 Stations.
Pa~e 25 Wim Dienstraten
May 1992 Doc: IEEE P802.11·92/51
Throughput versus Buffered Load Curve 100% Long Packets (1088 Bytes)
THROUGHPUT : Xfer DELAY :: - WAVELAN CSMA/CA 0 - 1-persistent CSMA • - - ALOHA <7
220 22
200
180
V-/
V
20
18
160 ,...-...
Q) ....., 140 >.
CD ~ '--' 120 +' :J 0.. 100 .£: CJ'I :J 0 80 ~
.£: I-
60
40
/ --.--I -
/ ~ .,/' -/1 0/ -r-- r- -:l L: ! V
/
! ~o -~ - - i- - t- - i- -i:v ---= ~ - ~ -:3 ........ - -~ I- - I- - ... -c- -<7 f- - <7 . - - - . -
/ --
16 r-..
(fJ
14 E '--'
>. 12 E
Q)
0 10 \..,
Q) ..... 8
(fJ c: 0 ~
6 I-
4 --20 - - ~ - - 2
o 0 o 100 200 300 400 500 600 700 800 900 1000
Fig: la Buffered Load (KByte)
COMPARE ALOHA, ' CSMA and WAVELAN CSMA/CA
- WAVELAN CSMA/CA Throughput is 87% of the 2 Mbps raw bit rate .
Submission
WAVELAN CSMA/CA is stable at high loads.
The Delay is only calculated for those packets that get through.
Figures include the MAC overllead.
Load generated by 7 Stations.
Page 26 Wim Diepstraten
May 1992 Doc: IEEE P802.11-92/51
,--.,. <1l .->,
m ~ '--'
+-' :J 0.. .!: 0> :J 0 L.
..c I-
220
200
180
160
140
120
100
80
60
40
20
Throughput versus Buffered Load Curve
100% Long Packets (1088 Bytes)
THROUGHPUT: - WAVE LAN CSMA/CA - CSMA/CA + Ack
- - 4-WAY LBT
-::-f:::.:.-
~ -- -/
/
./
~/ ,/
/. ~ V
1//
t /
f ,j
g '''''' :::::: ----
I // .7
f..-----.0-V ~ ---I ,lit",..,. ~
i :-=i ;::..-::::- ...,0
Xfer DELAY: : 0
• 'V
--I- - -
--------- -v
f..---
I--
- - ~
-~
44
40
36
32 ...-.. (f)
28 E '--'
>. 24 ~
<1l o
20 ~ <1l -(f) 16 c o L.
12 I--
8
4
o 0 o 50 100 150 200 250 300 350 400 450 500 550 600
Fig: 2 Buffered Load (KByte)
COMPARE CSMA/CA, CSMA/CA + Ack and 4-WAY LET
- WAVE LAN CSMA/CA Throughput is 87% of the 2 Mbps raw bit rate .
WAVELAN CSMA/CA is stable at high loads .
The Delay is only calculated for those packets that get through .
- Figures include the MAC overhead .
Load generated by 7 Stations .
Submission Wim Diepstraten
May 1992 Doc: IEEE P802.11-92/51
r--... Cl) ~
>. m ~ '--"
~
:J 0... .c Q'1 :J 0 '-.c f-
220
200
180
160
140
120
100
80
60
40
20
Throughput versus Buffered Load Curve 100% Long Packets (1088 Bytes)
THROUGHPUT: - WAVELAN CSMA/CA - CSMA/CA + Ack - - 4-WAY LBT
~ ~-
// -/'
V / b J /1/
t' ---/1 -~ -! " - -
/ -
L / /" a
.I i-' -----/ .0_--,
.li V a..::i ~'"
Xfer DELAY:: 0
• V'
~ -
- --f-
- f- - I- - - -
44
40
36
32 ,........ \11
28 E '--"
>. 24 E
<U o
20 L. Cl)
'+\11
16 c a L.
12 f-
8
4 o
0 o 100 200 300 400 500 600 700 800 900 1000 Fig: 2a Buffered Load (KByte)
COMPARE CSMA/CA, CSMA/CA + Ack and 4-WAY LET
- WAVE LAN CSMA/CA Throughput is 87% of the 2 Mbps raw bit rate . - WAVELAN CSMA/CA is stable at high loads .
The Delay is only calculated for those packets that get through.
- Figures include the MAC overhead . - Load generated by 7 Stations.
Suhmission Pa~e 28 wim Dieostraten
May 1992
2:£0
200
180
160 .r--....
Q) -'-' 140 >.. co ::"c '--'" 120 +' :::J Q..
100 £ 0> :::J 0 80 ~
£ f-
60
40
Doc: IEEE P802.11-92/S1
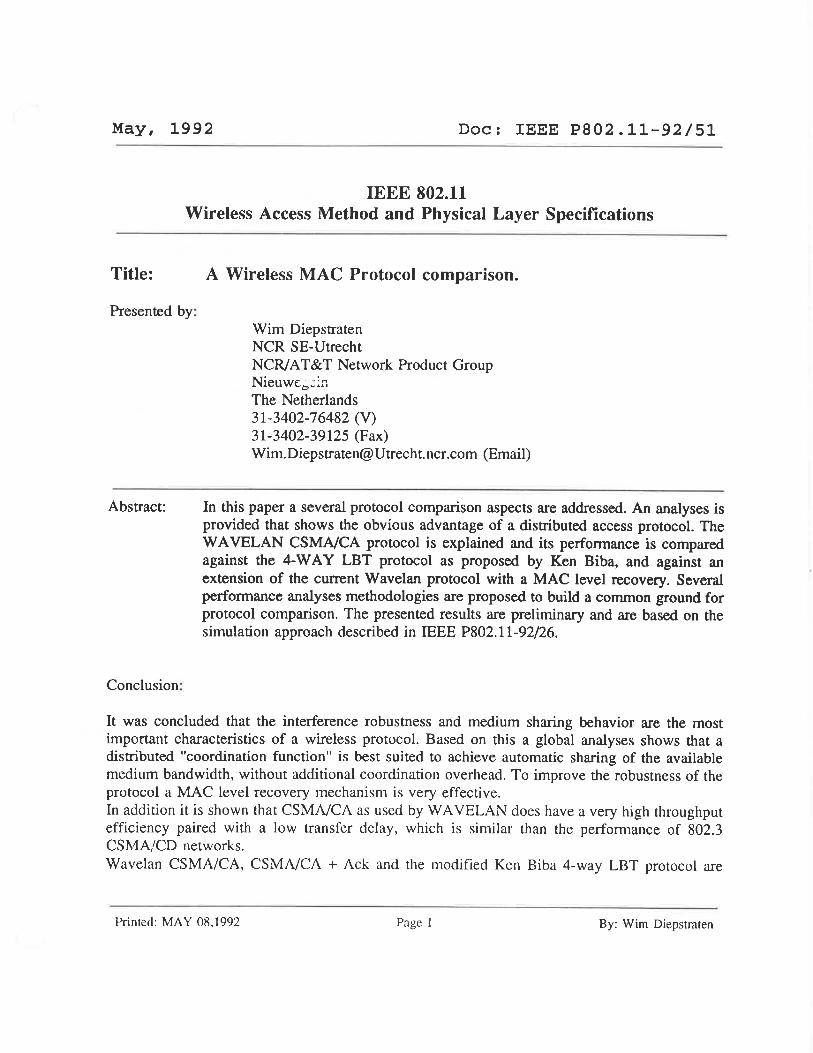
Throughput versus Buffered Load Curve
60% Short Packets (64 Bytes), 40% Long Packets (576 Bytes)
THROUGHPUT : --- -
./
/ ~ If -- -
) 1/
J/ / /
'I ",v
/ / /" ,/\1/ /- 1.------
Xfer DELAY :: WAVE LAN CSMA/CA ° SMA/CA + Ack •
4-WAY LBT \1
~ ~ - - - - f-- I---1.0-
- - - - - - v _\1-------\1-- - - - --- -- - ° -- n-fo----1------____ 0
22
20
18
16 .r--....
(/I
14 E '--'"
>.. 12 .9
ClJ o
10 .... ClJ "-(/I
8 c: o .... f-
6
4
20 ./v ----____ 0
I~::e :--~ 2
o 0 o 50 100 150 200 250 300 350 400 450 500 550 600
Fig: 3 Buffered Load (KByte)
COMPARE CSMA/CA, CSMA/CA + Ack and 4-WAY LET
Submission
- The Delay is only calculated for those packets that get through.
For CSMA/CA the lost packets are not recovered so it is not included in the delay figure.
- Figures include the MAC overhead .
Page 29 Wim Diepstraten
May 1992 Doc: IEEE P802.11-92/51
Performance versus Number of Stations Curve
60% Short Packets (64 Bytes), 40% Long Packets (576 Bytes)
THROUGHPUT : Transfer Delay :: -- WAVELAN CSMA/CA 0
- CSMA/CA + Ack • - - 4-WAY LBT "l
220 22 .-
200 -'
20 /
180 " ...,- 18
160 r--..
OJ ...... 1 4-0 >-en ~ '-" 120 +-' ::J Q. 100 L (J'I ::J 0 80 I.... L f-
60
~ " ./
--- ,- ,.-
/ --- ~ f- r---- - /
----i-- .- /
)j / _ -1 <-- ~/p - - - - --- - - - - r
j / / /
~.........-.-
./
.........- (
1// / , .......
.........-.- / ---I / / ~/ / /(
/ / .( ~ ..... .- /
16 ,.-....
Vl
14 E ..........
>-12 ~
OJ 0
10 I....
OJ --8
Vl c: a I....
6 f-
40 / :/ 4
20 - // cp :::--
2
o 0 o 2 3 4 5 6 7 8 9 10 11 12 13 14
Fig: 4 Number of Stations
COMPARE CSMA/CA, CSMA/CA + Ack and 4-WAY LET
Submission
Figures include the MAC overhead .
- Throughput remains stable for many simultaneous stations accessing the medium.
- For CSMA/ CA lost pa c kets are not recovered at MAC level.
Page 30 Wim Diepstraten
May 1992 Doc: IEEE P802.11-92/S1
Performance versus Number of Stations Curve
60% Short Packe ts (64 Bytes). 40% Long Packets (576 Bytes)
THROUGHPUT : % Data errors:: - W A VELAN CSMA/CA • - CSMA/CA + Ack "7
- - 4-WAY LBT ... 220 22
200 20
180 18
160 ----Q) +-' 140 >, co ~ "-" 120 +-' ::l 0.. 100 L (j1 ::l 0 80 L. L f-
-~ /
V - I- - ------~ "
;1 -- - - - - f- - - - - - / ? ---j - / /' /' - -1/1 7
/
I / - -
16
14 Ul
+-' Q)
.::,t.
12 u 0
0...
10 L.
0 '-'-w
8 ~
60
40 -7" ~;7
/' -6
4 .,/
20 ?- 2
/ - - -,.. -- - - - - - , -o 0
o 2,3 4 5 6 7 8 9 10 11 12 13 14
Fig: 4a Number of Stations
COMPARE CSMA/CA, CSMA/CA + Ack and 4-WAY LET
- Only lost "Data" packets are counted .
Submission
The 4- WAY LET protocol does have very low "Data" error probability, because access contention is resolved by the RTS. CTS handshaking ..
- Although CSMA/ CA + Ack has to recover extra lost "D a ta" pa c kets, the throughput is still significant higher than in the 4-WAY LET protocol.
- Figures include the ~fAC overhead.
Page 31 Wim Diepstraten
May 1992 Doc: IEEE P802.11-92/51
Performance versus PHY preamble length urve 60% Short Packets (64 Bytes), 40% Long Packets (576 Bytes)
THROUGHPUT : Transfer Delay :: -- WAVELAN CSMA/CA 0 - CSMA/CA + Ack • - - 4-WAY LBT <:7
220 22
200 20
180
160 r---.,
Q) +-J 140 >, ill ~ '---' 120 +-J
:::J Cl. 100 -'= CJ)
:::J 0 80 '-
-'= f--
60
~ ----" ............ - i---- .... r-- -
"- - - r-- ....-"'- --- ~ .-----,
----..- r---- 1-----
"'- - ---...., --- ----.1-
-- -< / r-- - - I- -...- -' - -- ,
/ ----, =-=-( 1'=---- ----- .....
(D----( p-( b--
18
16 -----(f)
14 E '---'
>,
12 ~ ClJ
0 10 ....
ClJ .... 8
(f)
c 0 ....
6 f--
40 4
20 2
o 0 o 100 200 300 400 500 600 700 800 900 1000
Fig: 5 Preamble length (bits) COMPARE CSMA/CA, CSMA/CA + Ack and 4-WAY LET
Submission
Figures include the MAC overhead .
Clear efficiency degradation for long PHY training times.
- The higher the modulation rate, the longer the PHY training time in number of bits.
- Test configuration is: 7 stations at high load.
Page 32 Wim Diepstraten
May 1992
400
.350
.300 ---..
Q) ....., >-. 250 m
Y: '--./
....., 200 ::J
a.. -'= CJl ::J
150 0 "--'= t-
100
50
Doc: IEEE P802.11-92/51
.1..1..1..1. VUS.L.LtJu" V '-'.I. uUu l',-,,, •• V.L nO. u'-'tJu..L u.".LV.L.L
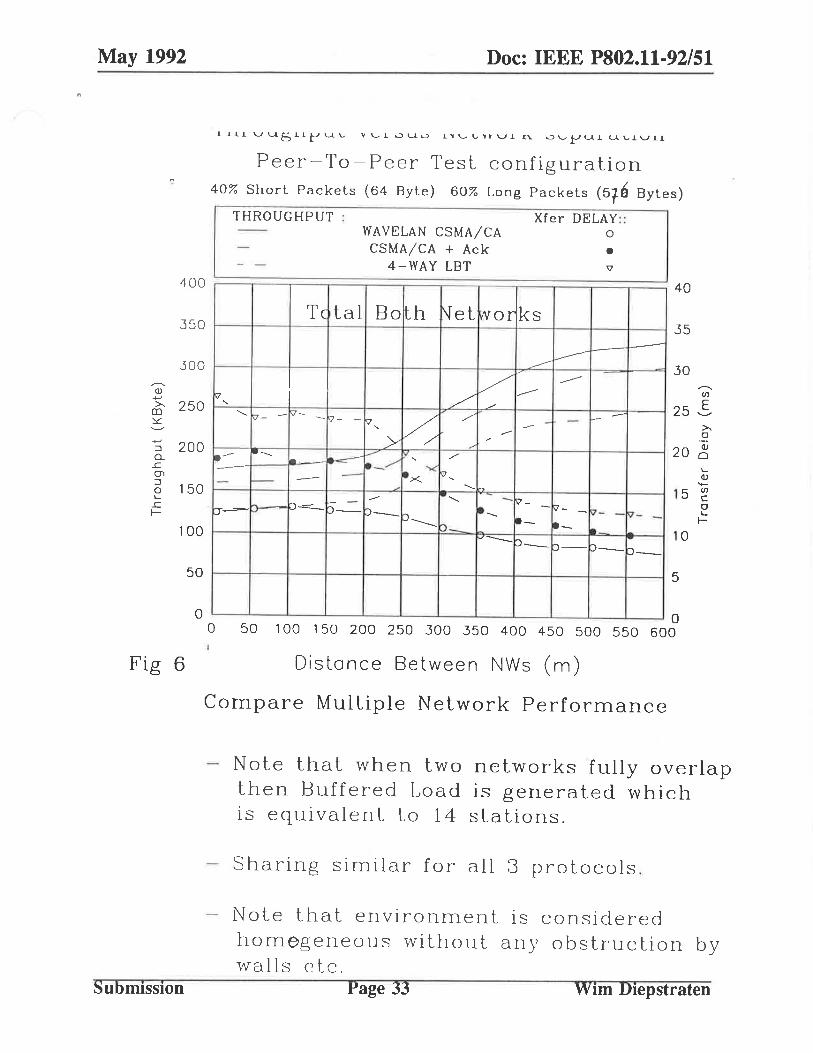
Peer-To-Peer Test configuration 40% Short Packets (64 Byte) 60% Long Packets (519 Bytes)
THROUGHPUT : - WAVELAN CSMA/CA - CSMA/CA + Ack - - 4-WAY LBT
Tc tal Bo lh Net wor
P, / /
,.-'- 'C1- - 1'7- - p- v::: /
- 'V ....
>- --,
~ --.-...
loa I.,-=--- -- .... ----1- - e_/
~ ><. '>< <J .... -- ~ '- h
I- - -- '- --p---=--iJ h-=-p-o_ p-- ~--
D_ 1'"-'-
Xfer DELAY:: 0
e 'C1
ks
---1----
------------- -
e- -
'C1 __
p- - p- -e- ~- • 0_ p-p-
i"- -
p-
40
.35
.30 ..-....
Ul
25 ....s >. a
20 ~
'+-
15 ~
10
5
a I..... t-
o 0 o 50 100 150 200 250 300 .350 400 450 500 550 600
Fig 6 Distance Between NWs (m)
Submission
Compare Multiple Network Performance
Note that when two networks fully overlap then Buffered Load is generated which is equivalent to 14 stations.
Sharing similar for all 3 protocols .
Note that environment is considered homegeneous without any obstruction by walls e t c.
Page 33 Wim Diepstraten
May 1992 Doc: IEEE P802.11-92/51
u v Vl
Lf)
""-(/)
~ I.....
v a. (f)
-+-' v
.::.:. u 0
0...
u v (f)
Lf)
""-(/)
~ I.....
v a. (f)
-+-' V
.::.:. u 0
0...
u v (f)
Lf)
'" (f)
~ l-
v a. (f)
-+-' Q)
..Y u 0
0...
FIG. 7:
500
450 400
Throughput versus Network separation Peer-To-Peer Test configuration
40% Short Packets (64 Byte) 60% Long Packets (512 Bytes )
350 -
300 250
200 150 -
100
50 0
0 50 100 150 200 250 300 350 400 450 500 550 600
500 Distance Between NWs (m)
450
400
350
300
250
200
150
100
50
0 0 50 100 150 200 250 300 350 400 450 500 550 600
Distance Between NWs (m) 500
450
400 4-WAY LBT
350
300
250
200
150
100
50
0 0 50 100 150 200 250 300 350 400 450 500 550 600
Submission Page 34 Wim Diepstraten
May 1992
u
600 550
CIJ 500 (f)
If) 450 '-..... 400 (f) 350 ~ '- 300 ~ 250 2 200 CIJ ~ U o
0...
150 100 50
Doc: IEEE P802.11-92/S1
Throughput versus Network separation Peer-To-Peer Test configuration
40% Short Packets (64 Byte) 60% Long Packets (512 Bytes)
- /Q-::--.~ W,-ViL~N/-~Ml~t~:~., --j~i-- ;;t~~,-II- -;
~ / • " ,. - ~" ~ I;:. ;- i ;:::- ...: I ~ ,- -~ ~/...:. ~ :::. / • .:-- .
/ . "'.,./ ,," '-...... - ,- /, / 'C1 0' 6 '0' '0' • I ,/ ,.'.' , y/' ,"; /
'/ __ I 0 ' 6 r . • ; i" - . " , ~ .. \~~: "." JII!/
6-20 dB Between NW's
o ~--~--~~~~ __ ~ __ ~ __ ~ __ ~ __ ~ __ ~ __ ~ __ ~ o 50 100 150 200 250 300 350 400 450 500 550 600
600 Distance Between NWs (m)
u 550 CIJ 500 (f)
If) 450 '-..... 400 (f) 350 3:
300 '-CIJ 250 a. (f) 200
+-' CIJ 150 ~ u 100 0
20 dB Between NW's 0... 50
0 0 50 100 150 200 250 300 350 400 450 500 550 600
600 Distance Between NWs (m)
u 550 CIJ 500 (f) 4-WAY LBT
If) 450 '-..... 400 (f) 350 ~
300 '-CIJ 250 a. (f) 200
-+-'
CIJ 150 ..::£ u 100 -0
0... 50 0 FIG 7a: 0 50 100 150 200 250 300 350 400 450 500 550 600
Submission Page 35 Wim Diepstraten
May 1992 Doc: IEEE P802.11-92/S1
300
250
-+-'
200 (I)
.2 (I)
-+-' Q) ~ 150 u 0
Cl..
U1 f- 100 0:::
50
0 0
Individu a l Station performance
Peer-To-Peer test configuration
All stations NW-l
100 200 300 400
Distance between NWs (m)
• 1 'V 2 T 3 o 4 • 5
6
500
250 I- All stations NW - 1
"0 Q)
.0 200-o (f)
"0
1'] 150 -Q) ~
c o
Cl.. (/) 1 00 lf-U
/ \ 6.
/ .•... \ .
' .' -- -' ~ \ I, (!i' " :. /\
6 ' / ' i --- T,' ' ., / " ~~~"' 6
o , ~'// - ~i~ '
600
50 - / ' I T~" :-.' " IY. , j _ -.. ~ '- --'~~~.~._ ~ ~. - - ~ ::""'" ==-.-:
' . - - 0 -o I j I' -
o 100 200 30e 400 500 600
Distance betwee n NWs (m) FIG. 8:
FIG. 4-vVA Y LET PROTOCOL Submission Page 36 Wim Diepstraten
May 1992
-+-' U1 o
U1 -+-' Q)
.::.:. u o
Q
(fJ
300
250
200
150
~ 100
Doc: IEEE P802.11·92/51
Individua l Station p e rformance
Peer-To-Peer test configuration
A l' stations NW-1 • 1 \l 2 .." 3 0 4 • 5
100 200 300 400 500 600
Distance between NWs (m)
I 20 dB Between Nw'~1 300 ~--------------------~
"U ~ .0 0 U1
"U
U1 +' Q)
.::.:. u 0
Q
(fJ f-U
250
200
150
100
50
0 0
All stations NW-1 I f:,. . \
I \
I • . . ." ". \ . I •
100 200 300 400 500
FIG. 8a: Distance between NWs (m)
4 - vVA Y LET PROTOCOL
600
Submission Page 37 Wim Diepstraten
May, 1992
300
250
.--.. (j) 200 ...... >-.
CD :::.:::
...... 150 :::J
Q..
.c 0' :::J 0 ...
100 ..c l-
SO
Doc: IEEE P802.11-92/51
Throughput versus Network separation Client-Server test configuration
40% Short Packets (64 Byte) 60% Long Packets (576 Bytes)
THROUGHPUT: - WAVELAN CSMA/CA - CSMA/CA + Ack - - 4-WAY LBT
Tc tal Eo th Net wor
/ ~ ./' p
~ , rv- v
" .... ./
" - ./
~ ',-- ----f-"
~ - ./ - " 1-_ -'7'" '"
- - - - - - - ~- ie, , Ia
" 0-------p-p---v,
0-0-- o~ ~ "'"-::". ~,,-
Xfer DELAY:: 0
e <:l
ks -
~ --' ~
V - -:
------- - .:: - I-- -,/
./
-!e- e_
~=- -e- -: p~ ..- v- -
p-o-p-'"'
40
35
30 ...-,.
(I)
25 ~ >. o
20 ~ ... (j)
'+-
15 ~ o ... ~
10
5
o 0 o 50 100 150 200 250 300 350 400 450 500 550 600
Fig 9 Distance Between NWs (m)
Submission
Compare Multiple Network Performance
Note that when two networks fully overlap then Buffered Load is generated which is equivalent to 14 stations. ONL'I STF1TIO/tJ To S£/2UE'R.. DELR'-j :; /I 0 LV;{/
Sharing similar for all 3 pro~ocols.
Note that environment is considered homegoneous without any obstruction by walls etc.
page 38 ,\-Vim Diepstraten
May 1992 Doc: IEEE P802.11-92/S1
Throughput versus Network separation Client-Server test configuration
40% Short Packets (64 Byte) 60% Long Packets (512 Bytes) 300 r---'---'---'---'---'---~--~---r---r---.--~--~
u Q) 250 V1
L.{)
'-.... 200 (f)
~
'- 150 Q)
a.. V1 100 -+-' Q)
-'" u a 50
Q
0 0 50 100 150 200 250 300 350 400 450 500 550 600
Distance Between NWs (m) 300 r---r-I--r-I--'-I--~I--~!--~r---~--'-I~T-~~ __ ~I __ ~
u ~ 250 r CSMA/CA + Ack -
If)
'-.... 200 t-(f)
~ 150 r Q)
a.. C/)
-+-' Q)
-'" u a
Q
100
o I i I I I I i
-
-
G 50 100 150 200 250 300 350 400 450 500 550 600
Distance Between NWs (m) 300 r---'-I--'-I--'---~I--~r----~I--'-I--'-I--'---'---~I---'
u ~ 250 r 4-WAY LET
'-.... 200 t(f)
~ 'Q)
a.. V1
-+-' Q)
-'" u a
Q
o I i i i
o 50 100 150 200 250 300 350 400 450 500 550 600
Submission Page 39 W im Diepstraten
May 1992
FIG.
JOO
u Q) 250 (f)
"- 200 (f)
~
'-Q) Q
(f) -+-' Q)
.;,,: u o
Q
u Q) (f)
If)
"-(f)
~ '-Q)
Q
(f) -+-' Q)
.;,,: u 0
CL
u Q) (f)
Lfl
"-(f)
~ L Q)
Q
Ul -+-' Q)
.;,,: u 0
Q
lOa:
150
100
50
0
JOO
250
200
150
100
50
0
JOO
250
200
150
100
50
0
Submission
Doc: IEEE P802.11-92/51
Throughput versus Network separation Client-Server test configuration
40% Short Packets (64 Byte) 60% Long Packets (512 Bytes)
WAVELAN CSMA/CA· '. ('V\ /: '.1' ./ . . 'V~
_ __...... - .. /" ", I... \ .. \0 '" I( \ ....... .
! / ' :~i~' .:./ ":<;=b~:1I~.~( -~~~,:~:~!~, , '" . '---- . . ;1'>0. .• '0' , v "->-. - 0 • / ,. I ...... ' • -....... -
./ T; D' , v ~ Q I. \ I , • , \. - Q'/ / " <... .. / / /. ... g?:.. ~ I;l ' ':' - ~ I . ",. / - .' / ' ' ...... . . , -~ __ a~ - t::;/ .... 0 •••
Between NW's!
0 50 100 150 200 250 .300 .350 400 450 500 550 600
Distance Between NWs (m)
CSMA/CA + Ack
20 dB Between NW'sl
I
0 50 100 150 200 250 .300 .350 400 450 500 550 600
Distance Between NWs (m)
4-WAY LBT
0 50 100 150 200 250 300 350 dOO 450 500 550 600
Page 40 wim Diepstraten