Embed Size (px)
Citation preview
IN V E S T O R P R E S E N T AT IO N MA Y 2 0 2 0
v
MAY 2020
Investor Presentation
IN V E S T O R P R E S E N T AT IO N MA Y 2 0 2 0
Disclaimers
2
NON-GAAP FINANCIAL MEASURES
As required by the rules of the Securities and Exchange Commission ("SEC"), we provide reconciliations of the non-GAAP financial measures contained in this presentation to the most directly comparable measure under GAAP,
which are set forth in the financial tables attached to this document.
This document contains the following non-GAAP financial measures: earnings before interest, taxes, depreciation and amortization (“EBITDA”), adjusted EBITDA and adjusted EBITDA margin for the three-month periods ended
March 31, 2020 and 2019 on a consolidated basis and for our transportation and logistics segments; EBITDA, adjusted EBITDA and adjusted EBITDA excluding truckload for the twelve-month periods ended December 31, 2019,
2018, 2017, 2016 and 2015; free cash flow for the three-month periods ended March 31, 2020 and 2019, and the twelve-month periods ended December 31, 2019, 2018, 2017, 2016 and 2015; adjusted net income attributable to
common shareholders and adjusted earnings per share (basic and diluted) (“adjusted EPS”) for the three-month periods ended March 31, 2020 and 2019; adjusted operating income and adjusted operating ratio for our North
American less-than-truckload business for the three- and twelve-month periods ended March 31, 2020 and 2019; and organic revenue and organic revenue growth for the three-month periods ended March 31, 2020 and 2019, on a
consolidated basis.
We believe that the above adjusted financial measures facilitate analysis of our ongoing business operations because they exclude items that may not be reflective of, or are unrelated to, XPO and its business segments' core
operating performance, and may assist investors with comparisons to prior periods and assessing trends in our underlying businesses. Other companies may calculate these non-GAAP financial measures differently, and therefore
our measures may not be comparable to similarly titled measures of other companies. These non-GAAP financial measures should only be used as supplemental measures of our operating performance.
Adjusted EBITDA, adjusted net income attributable to common shareholders and adjusted EPS include adjustments for transaction and integration, as well as restructuring costs. Transaction and integration adjustments are
generally incremental costs that result from an actual or planned acquisition or divestiture and may include transaction costs, consulting fees, retention awards, and, in the case of acquisitions, internal salaries and wages (to the
extent the individuals are assigned full-time to integration and transformation activities) and certain costs related to integrating and converging IT systems. Restructuring costs primarily relate to severance costs associated with
business optimization initiatives. Management uses these non-GAAP financial measures in making financial, operating and planning decisions and evaluating XPO's and each business segment's ongoing performance.
We believe that free cash flow is an important measure of our ability to repay maturing debt or fund other uses of capital that we believe will enhance stockholder value. We calculate free cash flow as adjusted net cash provided by
operating activities, less payment for purchases of property and equipment plus proceeds from sale of property and equipment, with adjusted net cash provided by operating activities defined as net cash provided by operating
activities plus cash collected on deferred purchase price receivables. We believe that EBITDA, adjusted EBITDA, adjusted EBITDA margin and adjusted EBITDA excluding truckload improve comparability from period to period by
removing the impact of our capital structure (interest and financing expenses), asset base (depreciation and amortization), tax impacts and other adjustments as set out in the attached tables that management has determined are
not reflective of core operating activities and thereby assist investors with assessing trends in our underlying businesses. We believe that adjusted net income attributable to common shareholders and adjusted EPS improve the
comparability of our operating results from period to period by removing the impact of certain costs and gains that management has determined are not reflective of our core operating activities. We believe that adjusted operating
income and adjusted operating ratio for our North American less-than-truckload business improves the comparability of our operating results from period to period by (i) removing the impact of certain restructuring costs and
amortization expenses and (ii) including the impact of pension income incurred in the reporting period as set out in the attached tables. We believe that organic revenue is an important measure because it excludes the impact of
the following items: foreign currency exchange rate fluctuations, fuel surcharges and revenue associated with our direct postal injection service in last mile.
FORWARD-LOOKING STATEMENTS
This document includes forward-looking statements within the meaning of Section 27A of the Securities Act of 1933, as amended, and Section 21E of the Securities Exchange Act of 1934, as amended, including our future growth
prospects for EBITDA in our North American less-than-truckload business and our company’s potential profit growth opportunity. All statements other than statements of historical fact are, or may be deemed to be, forward-looking
statements. In some cases, forward-looking statements can be identified by the use of forward-looking terms such as "anticipate," "estimate," "believe," "continue," "could," "intend," "may," "plan," "potential," "predict," "should,"
"will," "expect," "objective," "projection," "forecast," "goal," "guidance," "outlook," "effort," "target," "trajectory" or the negative of these terms or other comparable terms. However, the absence of these words does not mean that the
statements are not forward-looking. These forward-looking statements are based on certain assumptions and analyses made by us in light of our experience and our perception of historical trends, current conditions and expected
future developments, as well as other factors we believe are appropriate in the circumstances.
These forward-looking statements are subject to known and unknown risks, uncertainties and assumptions that may cause actual results, levels of activity, performance or achievements to be materially different from any future
results, levels of activity, performance or achievements expressed or implied by such forward-looking statements. Factors that might cause or contribute to a material difference include the risks discussed in our filings with the SEC
and the following: the severity, magnitude, duration and aftereffects of the COVID-19 pandemic and government responses to the COVID-19 pandemic; public health crises, (including COVID-19); economic conditions generally;
competition and pricing pressures; our ability to align our investments in capital assets, including equipment, service centers and warehouses, to our customers' demands; our ability to successfully integrate and realize anticipated
synergies, cost savings and profit improvement opportunities with respect to acquired companies; our ability to develop and implement suitable information technology systems and prevent failures in or breaches of such systems;
our substantial indebtedness; our ability to raise debt and equity capital; our ability to implement our cost and revenue initiatives; our ability to maintain positive relationships with our network of third-party transportation providers;
our ability to attract and retain qualified drivers; litigation, including litigation related to alleged misclassification of independent contractors and securities class actions; labor matters, including our ability to manage our
subcontractors, and risks associated with labor disputes at our customers and efforts by labor organizations to organize our employees; risks associated with our self-insured claims; risks associated with defined benefit plans for
our current and former employees; fluctuations in currency exchange rates; fluctuations in fixed and floating interest rates; fuel price and fuel surcharge changes; issues related to our intellectual property rights; governmental
regulation, including trade compliance laws, as well as changes in international trade policies and tax regimes; and governmental or political actions, including the United Kingdom's exit from the European Union; and natural
disasters, terrorist attacks or similar incidents. All forward-looking statements set forth in this document are qualified by these cautionary statements and there can be no assurance that the actual results or developments
anticipated by us will be realized or, even if substantially realized, that they will have the expected consequences to or effects on us or our business or operations. Forward-looking statements set forth in this document speak only
as of the date hereof, and we do not undertake any obligation to update forward-looking statements to reflect subsequent events or circumstances, changes in expectations or the occurrence of unanticipated events, except to the
extent required by law.
IN V E S T O R P R E S E N T AT IO N MA Y 2 0 2 0 3
Statement on the COVID-19 pandemic
XPO is widely considered to be an essential business with a responsibility to keep goods moving through supply chains.
Our company and most of our facilities remain open as we continue to serve our customers.
The special measures we’ve taken in response to COVID-19 are designed to ensure the well-being of our employees:
▪ Globally, our people are working remotely if able to do so.
▪ For employees who need to work on site, we follow the guidance of the World Health Organization, the US Centers
for Disease Control, local regulators, and our own health and safety protocols.
▪ Social distancing and PPE guidelines are in effect at all XPO workplaces.
▪ Our facilities worldwide engage in ongoing cleaning of high-touch areas, as well as deep cleaning of any facility
likely to have been exposed to COVID-19.
▪ We added Pandemic Paid Sick Leave to our US and Canadian benefits packages and cover the cost of
COVID-19 testing.
▪ We guarantee up to three additional paid days for employees of an XPO facility that closes temporarily for deep
cleaning.
▪ We continue to provide alternate work arrangements for employees when medically advisable.
▪ We added Frontline Employee Appreciation Pay to our US and Canadian benefits packages.
▪ We expanded access to mental health counseling services.
Whether COVID-19 is driving permanent changes in behavior, or will prove more temporary, XPO will be even more
tightly bonded by this experience. We’re ready to serve our customers through the fits and starts of the recovery,
however long that takes, and help move the world forward.
May 4, 2020
IN V E S T O R P R E S E N T AT IO N MA Y 2 0 2 0
Table of contents
4
▪ Investor highlights
▪ Company overview
▪ Financial highlights and key metrics
▪ Business overview
– North American contract logistics
– European contract logistics
– North American less-than-truckload
– North American transportation
– European transportation
▪ Supplemental materials
– Company recognitions
– People-first culture
– Commitment to sustainability
– Leadership team
– Business glossary
– Financial reconciliation tables
IN V E S T O R P R E S E N T AT IO N MA Y 2 0 2 0
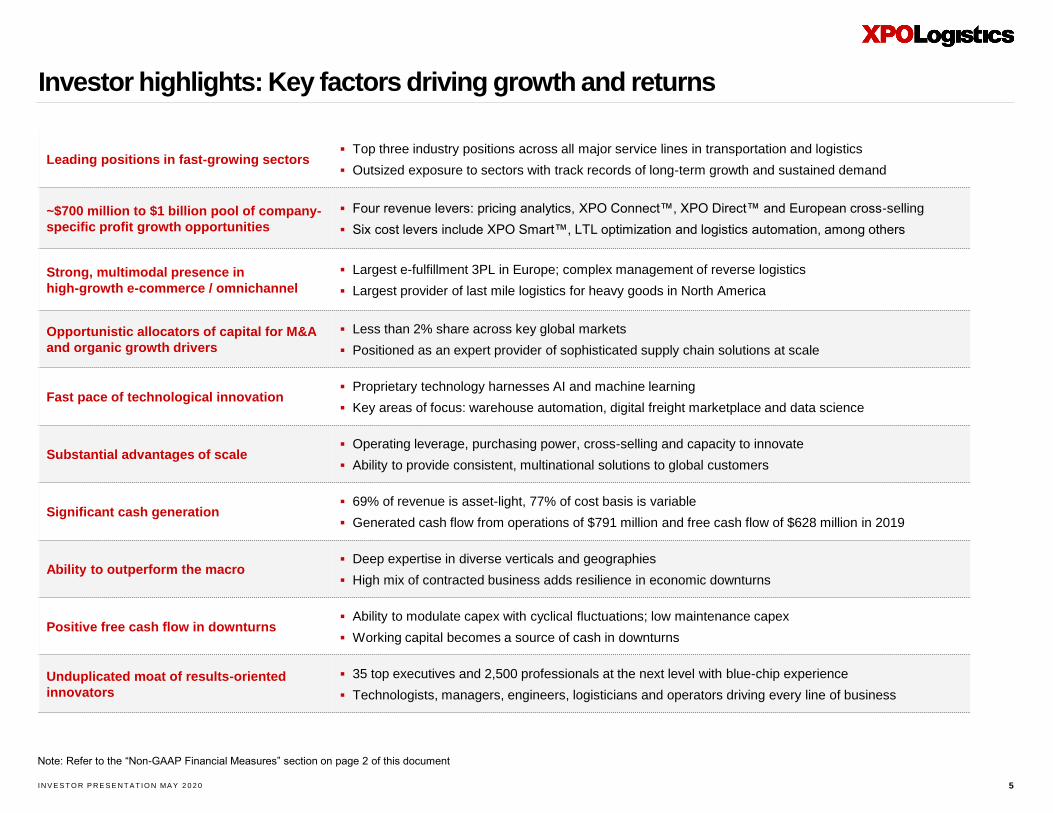
Investor highlights: Key factors driving growth and returns
5
Leading positions in fast-growing sectors▪ Top three industry positions across all major service lines in transportation and logistics
▪ Outsized exposure to sectors with track records of long-term growth and sustained demand
~$700 million to $1 billion pool of company-
specific profit growth opportunities
▪ Four revenue levers: pricing analytics, XPO Connect™, XPO Direct™ and European cross-selling
▪ Six cost levers include XPO Smart™, LTL optimization and logistics automation, among others
Strong, multimodal presence in
high-growth e-commerce / omnichannel
▪ Largest e-fulfillment 3PL in Europe; complex management of reverse logistics
▪ Largest provider of last mile logistics for heavy goods in North America
Opportunistic allocators of capital for M&A
and organic growth drivers
▪ Less than 2% share across key global markets
▪ Positioned as an expert provider of sophisticated supply chain solutions at scale
Fast pace of technological innovation ▪ Proprietary technology harnesses AI and machine learning
▪ Key areas of focus: warehouse automation, digital freight marketplace and data science
Substantial advantages of scale ▪ Operating leverage, purchasing power, cross-selling and capacity to innovate
▪ Ability to provide consistent, multinational solutions to global customers
Significant cash generation▪ 69% of revenue is asset-light, 77% of cost basis is variable
▪ Generated cash flow from operations of $791 million and free cash flow of $628 million in 2019
Ability to outperform the macro▪ Deep expertise in diverse verticals and geographies
▪ High mix of contracted business adds resilience in economic downturns
Positive free cash flow in downturns▪ Ability to modulate capex with cyclical fluctuations; low maintenance capex
▪ Working capital becomes a source of cash in downturns
Unduplicated moat of results-oriented
innovators
▪ 35 top executives and 2,500 professionals at the next level with blue-chip experience
▪ Technologists, managers, engineers, logisticians and operators driving every line of business
Note: Refer to the “Non-GAAP Financial Measures” section on page 2 of this document
IN V E S T O R P R E S E N T AT IO N MA Y 2 0 2 0
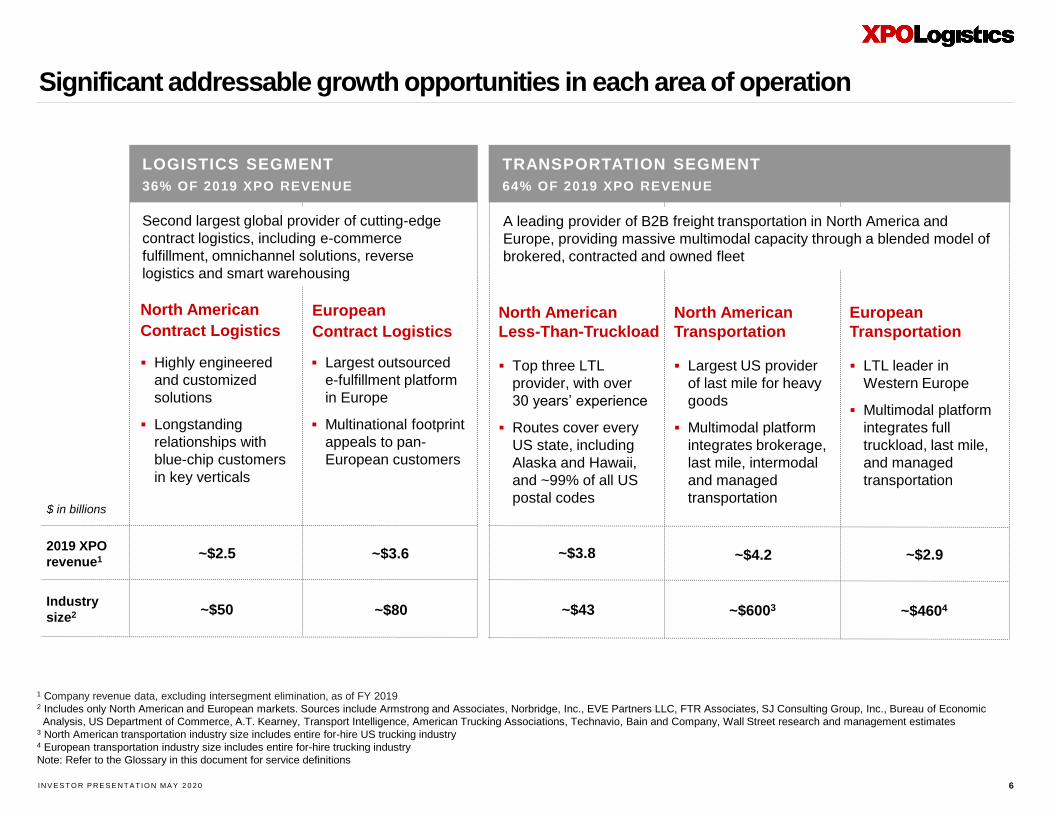
Significant addressable growth opportunities in each area of operation
6
1 Company revenue data, excluding intersegment elimination, as of FY 20192 Includes only North American and European markets. Sources include Armstrong and Associates, Norbridge, Inc., EVE Partners LLC, FTR Associates, SJ Consulting Group, Inc., Bureau of Economic
Analysis, US Department of Commerce, A.T. Kearney, Transport Intelligence, American Trucking Associations, Technavio, Bain and Company, Wall Street research and management estimates3 North American transportation industry size includes entire for-hire US trucking industry4 European transportation industry size includes entire for-hire trucking industry
Note: Refer to the Glossary in this document for service definitions
▪ Highly engineered
and customized
solutions
▪ Longstanding
relationships with
blue-chip customers
in key verticals
North American
Contract Logistics
▪ Largest outsourced
e-fulfillment platform
in Europe
▪ Multinational footprint
appeals to pan-
European customers
European
Contract Logistics
▪ Top three LTL
provider, with over
30 years’ experience
▪ Routes cover every
US state, including
Alaska and Hawaii,
and ~99% of all US
postal codes
North American
Less-Than-Truckload
▪ Largest US provider
of last mile for heavy
goods
▪ Multimodal platform
integrates brokerage,
last mile, intermodal
and managed
transportation
North American
Transportation
▪ LTL leader in
Western Europe
▪ Multimodal platform
integrates full
truckload, last mile,
and managed
transportation
European
Transportation
64% OF 2019 XPO REVENUE
TRANSPORTATION SEGMENT
2019 XPO
revenue1 ~$3.6 ~$3.8~$2.5 ~$2.9~$4.2
Industry
size2 ~$50 ~$80 ~$43 ~$6003 ~$4604
$ in billions
36% OF 2019 XPO REVENUE
LOGISTICS SEGMENT
Second largest global provider of cutting-edge
contract logistics, including e-commerce
fulfillment, omnichannel solutions, reverse
logistics and smart warehousing
A leading provider of B2B freight transportation in North America and
Europe, providing massive multimodal capacity through a blended model of
brokered, contracted and owned fleet
IN V E S T O R P R E S E N T AT IO N MA Y 2 0 2 0
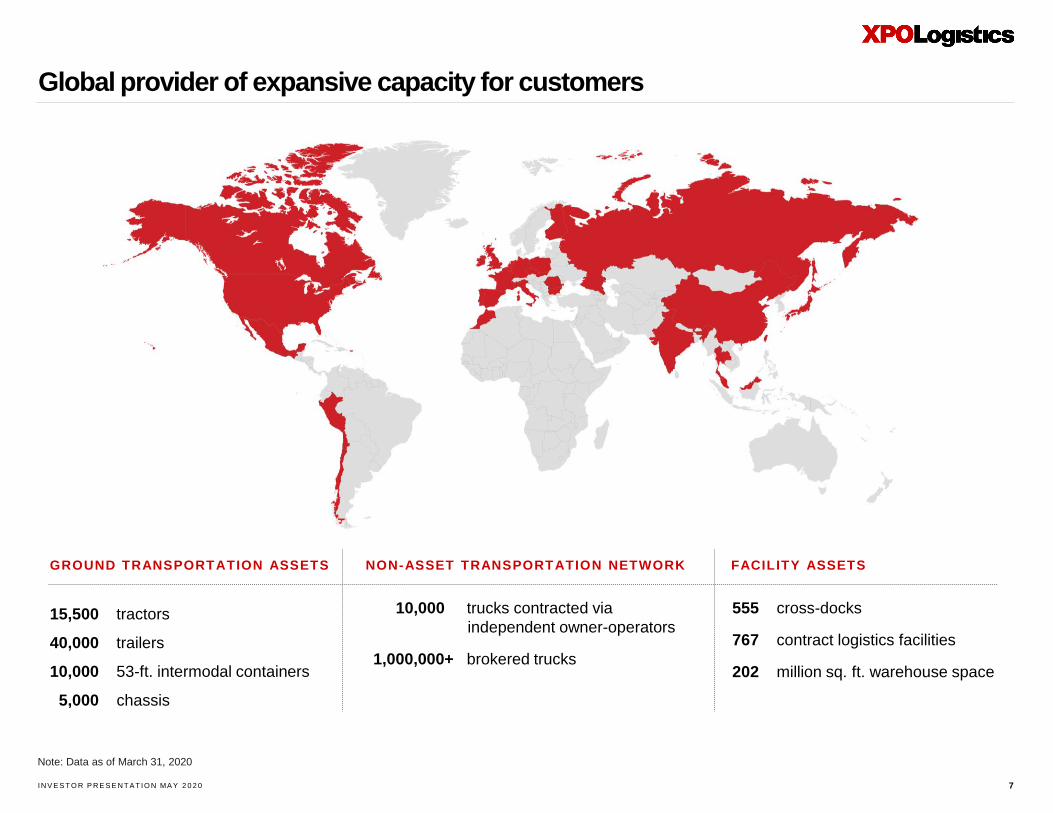
Global provider of expansive capacity for customers
7
GROUND TRANSPORTATION ASSETS NON-ASSET TRANSPORTATION NETWORK FACILITY ASSETS
10,000 trucks contracted via
independent owner-operators
1,000,000+ brokered trucks
555 cross-docks
767 contract logistics facilities
202 million sq. ft. warehouse space
15,500 tractors
40,000 trailers
10,000 53-ft. intermodal containers
5,000 chassis
Note: Data as of March 31, 2020

IN V E S T O R P R E S E N T AT IO N MA Y 2 0 2 0
Key metrics
8
US59%
France12%
UK12%
Spain5%
Other12%
REVENUE BY MIX1
Asset-Based
31%
Asset-Light
69%
2019 revenue: $16.6 billion
REVENUE BY GEOGRAPHY1
1 Geographic and mix data as of FY 2019; key statistics as of March 31, 2020
CUSTOMERS
Over 50,000
EMPLOYEES
~97,000
LOCATIONS
1,506
COUNTRIES OF
OPERATION
30
IN V E S T O R P R E S E N T AT IO N MA Y 2 0 2 0
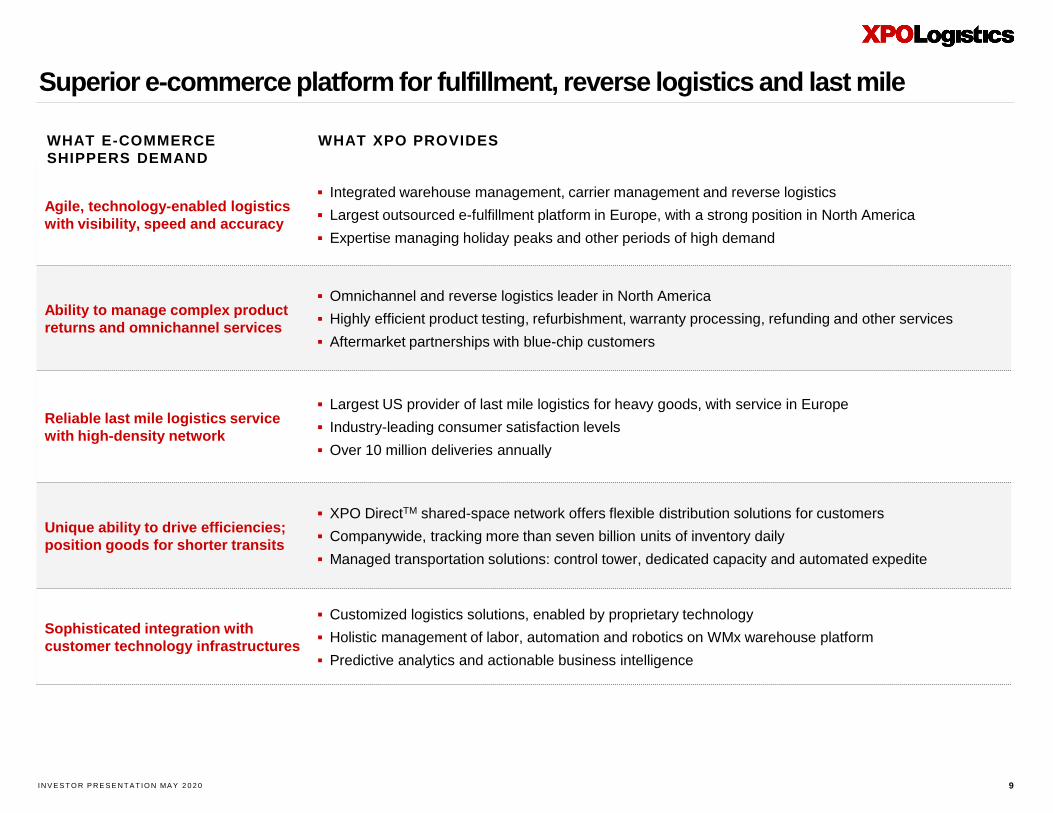
Superior e-commerce platform for fulfillment, reverse logistics and last mile
9
Agile, technology-enabled logistics
with visibility, speed and accuracy
▪ Integrated warehouse management, carrier management and reverse logistics
▪ Largest outsourced e-fulfillment platform in Europe, with a strong position in North America
▪ Expertise managing holiday peaks and other periods of high demand
Ability to manage complex product
returns and omnichannel services
▪ Omnichannel and reverse logistics leader in North America
▪ Highly efficient product testing, refurbishment, warranty processing, refunding and other services
▪ Aftermarket partnerships with blue-chip customers
Reliable last mile logistics service
with high-density network
▪ Largest US provider of last mile logistics for heavy goods, with service in Europe
▪ Industry-leading consumer satisfaction levels
▪ Over 10 million deliveries annually
Unique ability to drive efficiencies;
position goods for shorter transits
▪ XPO DirectTM shared-space network offers flexible distribution solutions for customers
▪ Companywide, tracking more than seven billion units of inventory daily
▪ Managed transportation solutions: control tower, dedicated capacity and automated expedite
Sophisticated integration with
customer technology infrastructures
▪ Customized logistics solutions, enabled by proprietary technology
▪ Holistic management of labor, automation and robotics on WMx warehouse platform
▪ Predictive analytics and actionable business intelligence
WHAT XPO PROVIDESWHAT E-COMMERCE
SHIPPERS DEMAND
IN V E S T O R P R E S E N T AT IO N MA Y 2 0 2 0
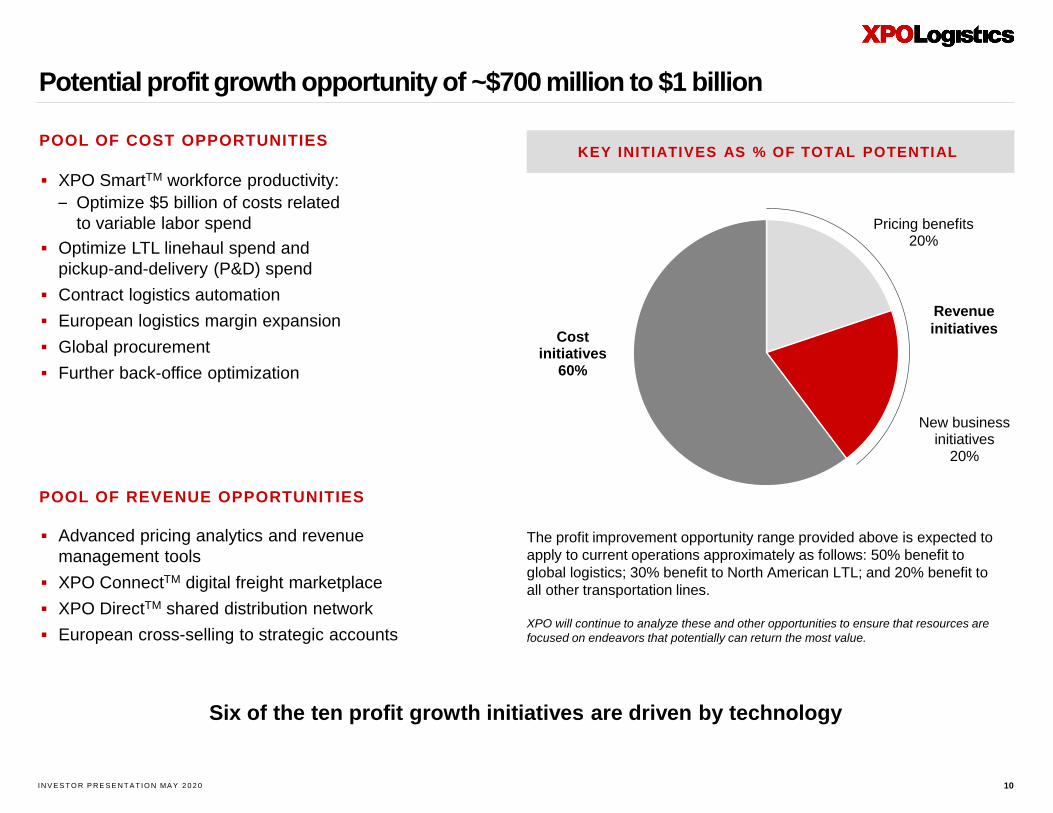
Potential profit growth opportunity of ~$700 million to $1 billion
10
Six of the ten profit growth initiatives are driven by technology
POOL OF COST OPPORTUNITIES
Pricing benefits20%
New business initiatives
20%
Cost initiatives
60%
Revenue
initiatives
KEY INITIATIVES AS % OF TOTAL POTENTIAL
The profit improvement opportunity range provided above is expected to
apply to current operations approximately as follows: 50% benefit to
global logistics; 30% benefit to North American LTL; and 20% benefit to
all other transportation lines.
XPO will continue to analyze these and other opportunities to ensure that resources are
focused on endeavors that potentially can return the most value.
▪ XPO SmartTM workforce productivity:
– Optimize $5 billion of costs related
to variable labor spend
▪ Optimize LTL linehaul spend and
pickup-and-delivery (P&D) spend
▪ Contract logistics automation
▪ European logistics margin expansion
▪ Global procurement
▪ Further back-office optimization
POOL OF REVENUE OPPORTUNITIES
▪ Advanced pricing analytics and revenue
management tools
▪ XPO ConnectTM digital freight marketplace
▪ XPO DirectTM shared distribution network
▪ European cross-selling to strategic accounts
IN V E S T O R P R E S E N T AT IO N MA Y 2 0 2 0
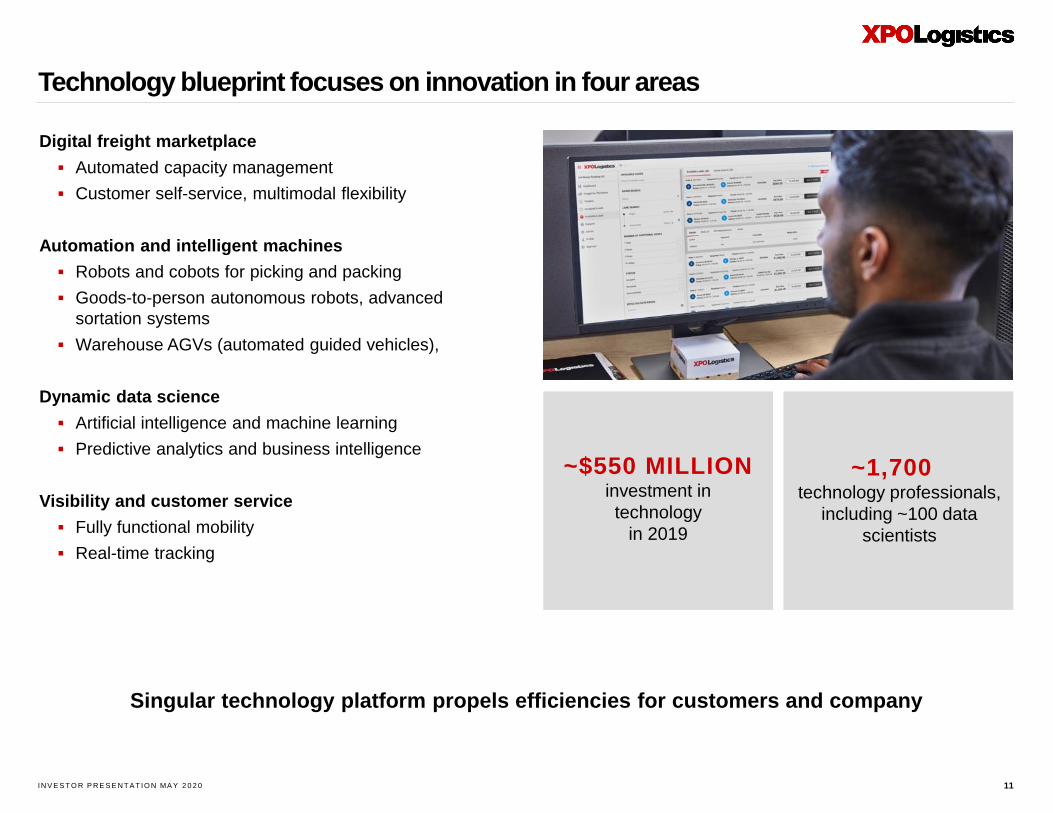
Technology blueprint focuses on innovation in four areas
11
Singular technology platform propels efficiencies for customers and company
Digital freight marketplace
▪ Automated capacity management
▪ Customer self-service, multimodal flexibility
Automation and intelligent machines
▪ Robots and cobots for picking and packing
▪ Goods-to-person autonomous robots, advanced
sortation systems
▪ Warehouse AGVs (automated guided vehicles),
Dynamic data science
▪ Artificial intelligence and machine learning
▪ Predictive analytics and business intelligence
Visibility and customer service
▪ Fully functional mobility
▪ Real-time tracking
~$550 MILLIONinvestment in
technology
in 2019
~1,700technology professionals,
including ~100 data
scientists
IN V E S T O R P R E S E N T AT IO N MA Y 2 0 2 0
Key applications of automation and data science in XPO operations
12
CONTRACT LOGISTICS
▪ Proprietary technology suite
manages all distribution
processes and warehouse
operations
▪ Provides in-house control of
robotics and other automation
▪ XPO Smart™ tools improve
labor planning, forecasting and
inventory control
▪ Integrates last mile with
contract logistics for retail,
e-commerce, omnichannel and
manufacturing customers on
XPO Direct™
LESS-THAN-TRUCKLOAD
▪ Network optimization tools
improve LTL linehaul, pickup
and delivery, and routing
▪ XPO Smart™ tools improve
efficiency of dock operations
▪ Proprietary algorithms with
machine learning assimilate
constant inflows of data
▪ Visibility facilitates selling LTL
across more verticals
LAST MILE
▪ Digital management of home
deliveries on XPO Connect LM
platform is seamless for
consumers
▪ Self-service capabilities
facilitate scheduling and
change management
▪ Immediate feedback loops
capture actionable consumer
input post-delivery
▪ Augmented reality shows how
items look in the home pre-
delivery
TRUCK BROKERAGE
▪ Proprietary XPO ConnectTM
marketplace drives end-to-end
efficiency in freight transactions
▪ Fully automated, multimodal
platform is underpinned by
proprietary Freight Optimizer
technology
▪ Automates carrier matching;
leverages machine learning
▪ Reduces empty miles; lowers
environmental impact
IN V E S T O R P R E S E N T AT IO N MA Y 2 0 2 0
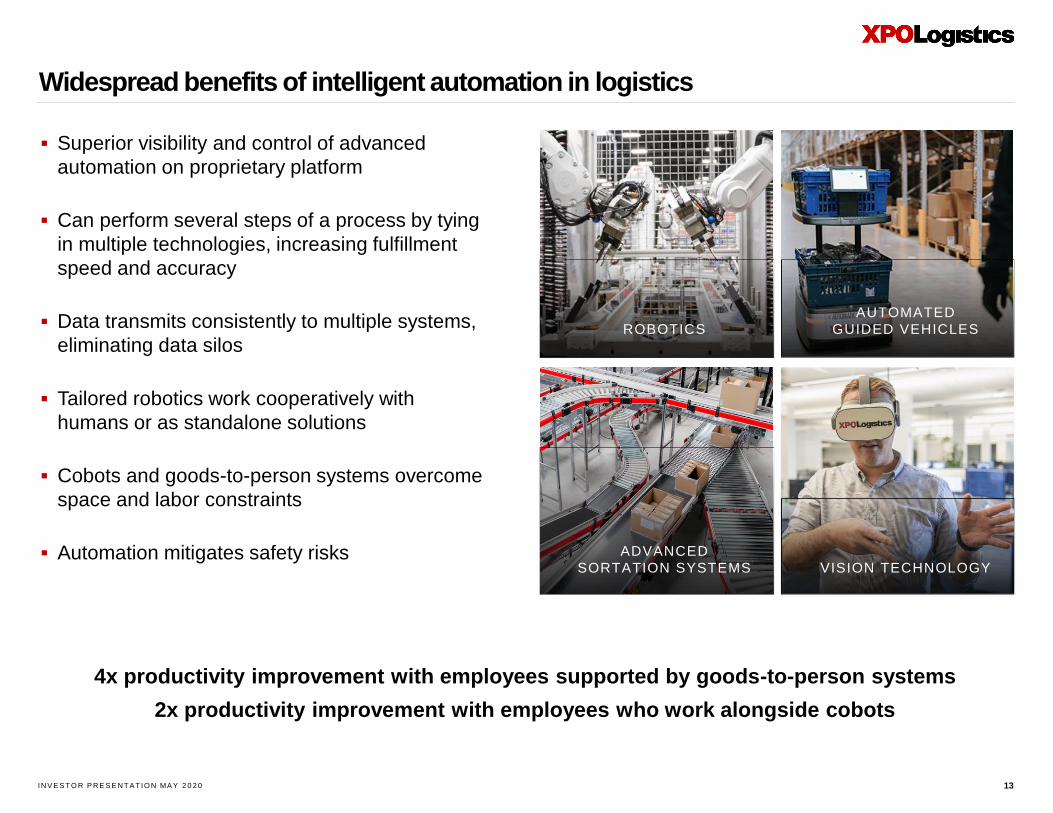
Widespread benefits of intelligent automation in logistics
13
▪ Superior visibility and control of advanced
automation on proprietary platform
▪ Can perform several steps of a process by tying
in multiple technologies, increasing fulfillment
speed and accuracy
▪ Data transmits consistently to multiple systems,
eliminating data silos
▪ Tailored robotics work cooperatively with
humans or as standalone solutions
▪ Cobots and goods-to-person systems overcome
space and labor constraints
▪ Automation mitigates safety risks
4x productivity improvement with employees supported by goods-to-person systems
2x productivity improvement with employees who work alongside cobots
AUTOMATED
GUIDED VEHICLESROBOTICS
ADVANCED
SORTATION SYSTEMS VISION TECHNOLOGY

IN V E S T O R P R E S E N T AT IO N MA Y 2 0 2 0
XPO Connect™ is at the forefront of transportation automation
14
Expands revenue and margins
▪ Automates load-tendering, pricing, bidding, buying and
tracking
▪ Unlocks cross-selling opportunities across modes
▪ Penetrates tier-two and tier-three customer bases
▪ Leverages almost a decade of industry data
Improves capacity management
▪ Provides deep visibility into available capacity
▪ Enhances access through self-service dashboard tools,
preferences and BI analytics
Heightens internal efficiency
▪ Reduces need for redundant systems
▪ Establishes architecture for continuous innovation
▪ More than 43,000 registered carriers
▪ Optimizes freight-matching by sourcing the best carriers for
each load profile
▪ Brokerage automation integrates Freight Optimizer and
Drive XPOTM carrier app
▪ Intermodal automation integrates Rail Optimizer and
supports drayage network
▪ Last mile automation integrates
XPO Connect LM and Ship XPOTM
VALUE CREATIONXPO CONNECTTM PLATFORM
Achieved 21% increase in brokerage loads per head over the past year
IN V E S T O R P R E S E N T AT IO N MA Y 2 0 2 0 15
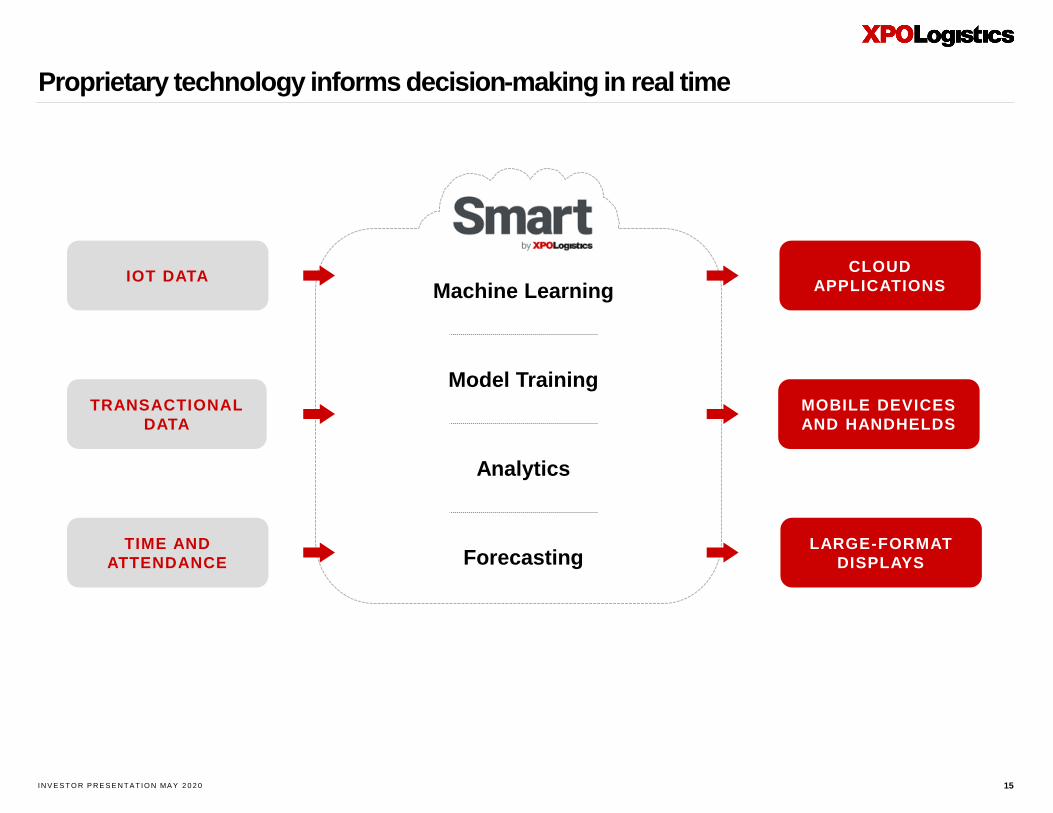
Proprietary technology informs decision-making in real time
Forecasting
Analytics
Model Training
Machine Learning
TIME AND
ATTENDANCE
CLOUD
APPLICATIONSIOT DATA
MOBILE DEVICES
AND HANDHELDS
TRANSACTIONAL
DATA
LARGE-FORMAT
DISPLAYS
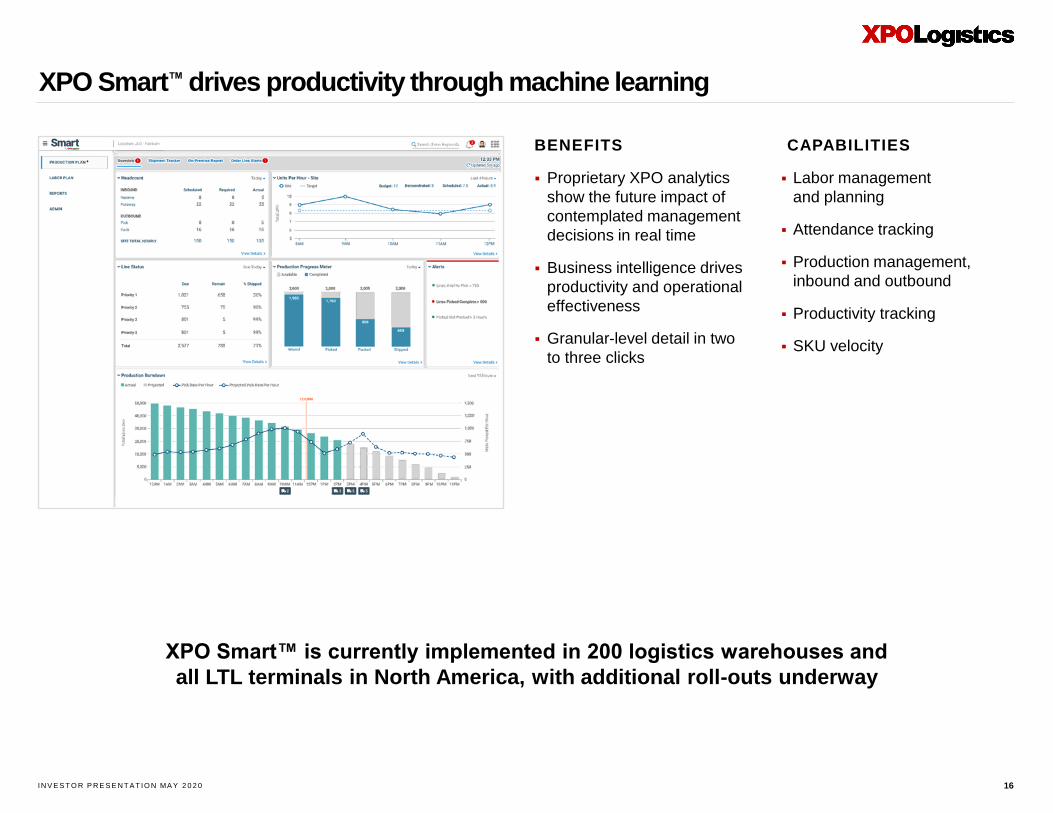
IN V E S T O R P R E S E N T AT IO N MA Y 2 0 2 0 16
BENEFITS
▪ Proprietary XPO analytics
show the future impact of
contemplated management
decisions in real time
▪ Business intelligence drives
productivity and operational
effectiveness
▪ Granular-level detail in two
to three clicks
CAPABILITIES
▪ Labor management
and planning
▪ Attendance tracking
▪ Production management,
inbound and outbound
▪ Productivity tracking
▪ SKU velocity
XPO Smart™ drives productivity through machine learning
XPO Smart™ is currently implemented in 200 logistics warehouses and
all LTL terminals in North America, with additional roll-outs underway

IN V E S T O R P R E S E N T AT IO N MA Y 2 0 2 0
Financial highlights and key metrics
IN V E S T O R P R E S E N T AT IO N MA Y 2 0 2 0
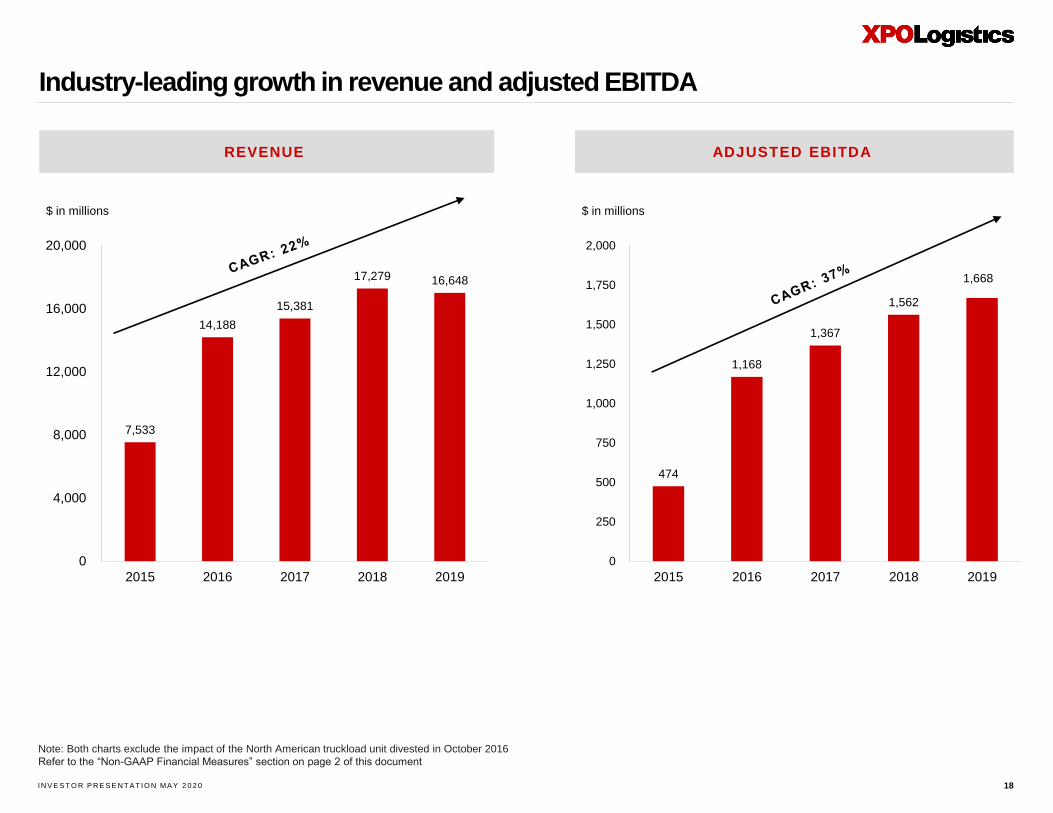
Industry-leading growth in revenue and adjusted EBITDA
18
Note: Both charts exclude the impact of the North American truckload unit divested in October 2016
Refer to the “Non-GAAP Financial Measures” section on page 2 of this document
7,533
14,188
15,381
17,279 16,648
0
4,000
8,000
12,000
16,000
20,000
2015 2016 2017 2018 2019
474
1,168
1,367
1,562
1,668
0
250
500
750
1,000
1,250
1,500
1,750
2,000
2015 2016 2017 2018 2019
$ in millions$ in millions
ADJUSTED EBITDAREVENUE
IN V E S T O R P R E S E N T AT IO N MA Y 2 0 2 0
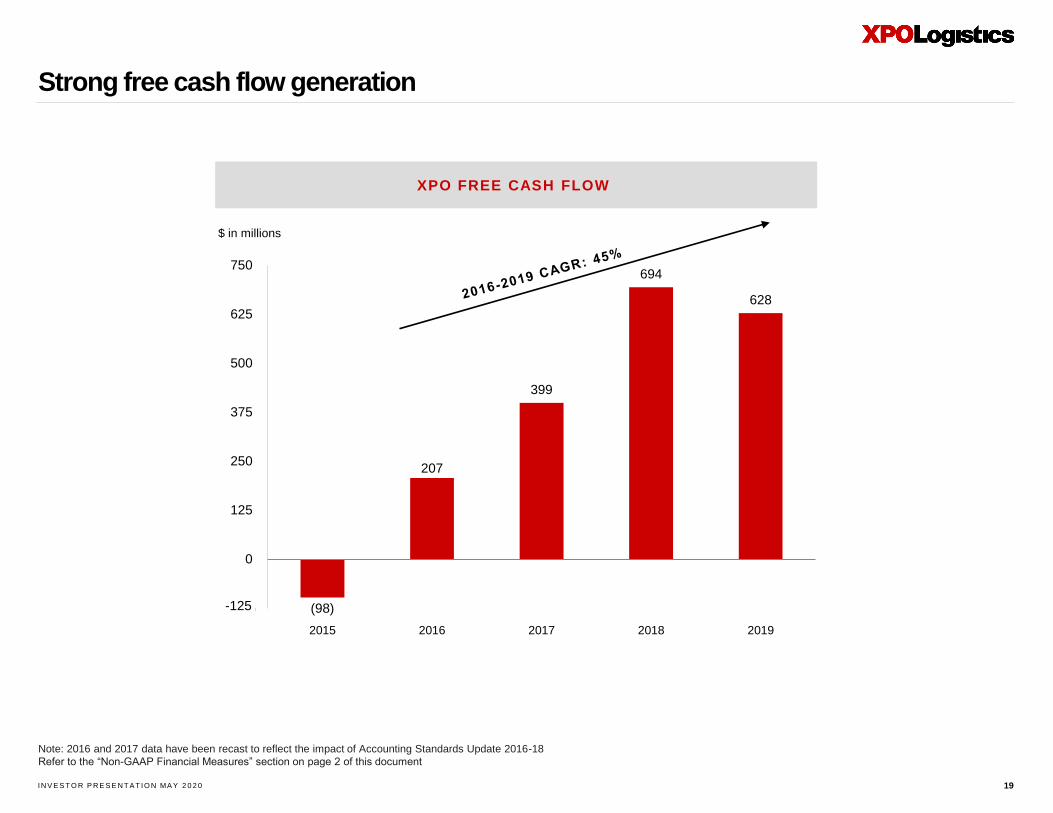
Strong free cash flow generation
19
$ in millions
XPO FREE CASH FLOW
(98)
207
399
694
628
-125
0
125
250
375
500
625
750
2015 2016 2017 2018 2019
-125
Note: 2016 and 2017 data have been recast to reflect the impact of Accounting Standards Update 2016-18
Refer to the “Non-GAAP Financial Measures” section on page 2 of this document
IN V E S T O R P R E S E N T AT IO N MA Y 2 0 2 0
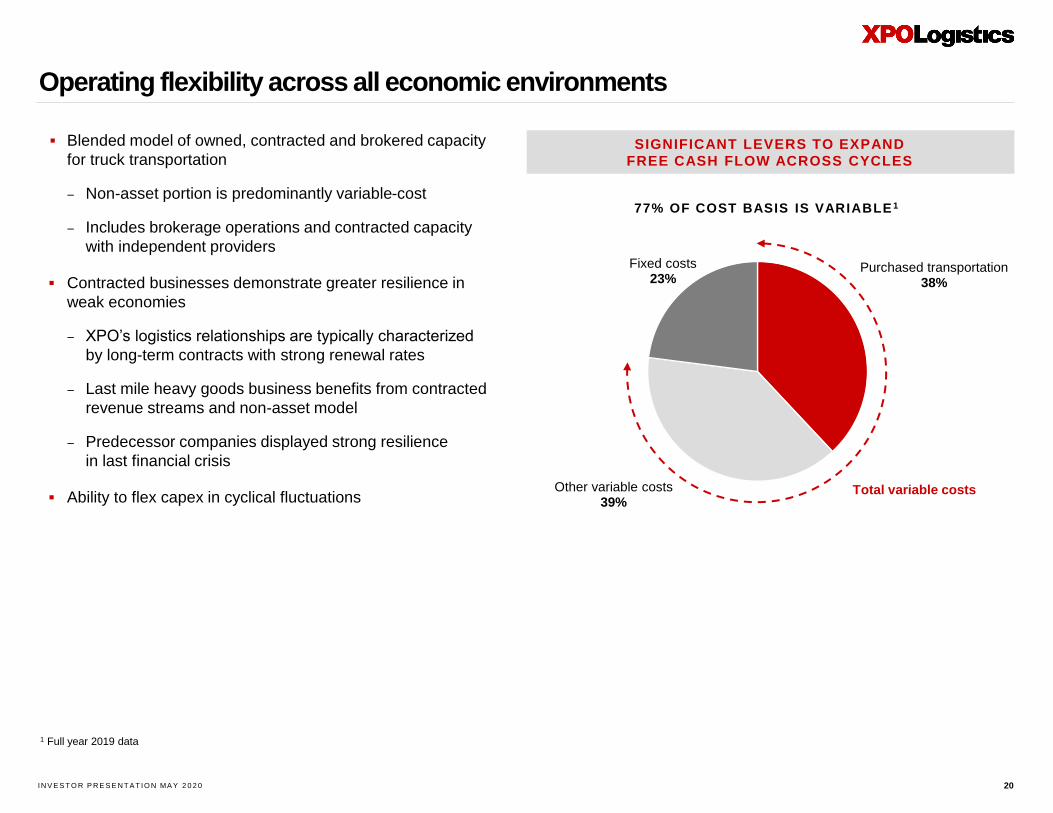
Operating flexibility across all economic environments
20
▪ Blended model of owned, contracted and brokered capacity
for truck transportation
– Non-asset portion is predominantly variable-cost
– Includes brokerage operations and contracted capacity
with independent providers
▪ Contracted businesses demonstrate greater resilience in
weak economies
– XPO’s logistics relationships are typically characterized
by long-term contracts with strong renewal rates
– Last mile heavy goods business benefits from contracted
revenue streams and non-asset model
– Predecessor companies displayed strong resilience
in last financial crisis
▪ Ability to flex capex in cyclical fluctuations
1 Full year 2019 data
77% OF COST BASIS IS VARIABLE 1
Purchased transportation38%
Other variable costs39%
Fixed costs23%
Total variable costs
SIGNIFICANT LEVERS TO EXPAND
FREE CASH FLOW ACROSS CYCLES
IN V E S T O R P R E S E N T AT IO N MA Y 2 0 2 0
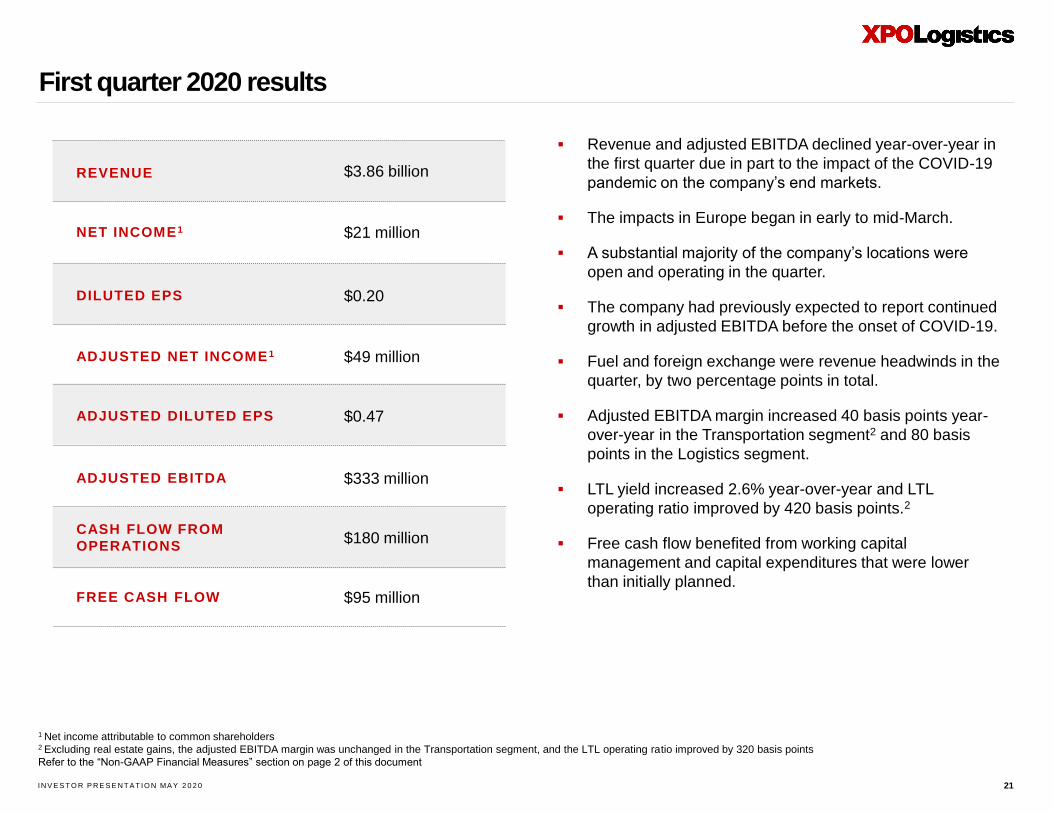
First quarter 2020 results
21
REVENUE $3.86 billion
NET INCOME1 $21 million
DILUTED EPS $0.20
ADJUSTED NET INCOME 1 $49 million
ADJUSTED DILUTED EPS
ADJUSTED EBITDA $333 million
CASH FLOW FROM
OPERATIONS$180 million
FREE CASH FLOW $95 million
$0.47
1 Net income attributable to common shareholders2 Excluding real estate gains, the adjusted EBITDA margin was unchanged in the Transportation segment, and the LTL operating ratio improved by 320 basis points
Refer to the “Non-GAAP Financial Measures” section on page 2 of this document
▪ Revenue and adjusted EBITDA declined year-over-year in
the first quarter due in part to the impact of the COVID-19
pandemic on the company’s end markets.
▪ The impacts in Europe began in early to mid-March.
▪ A substantial majority of the company’s locations were
open and operating in the quarter.
▪ The company had previously expected to report continued
growth in adjusted EBITDA before the onset of COVID-19.
▪ Fuel and foreign exchange were revenue headwinds in the
quarter, by two percentage points in total.
▪ Adjusted EBITDA margin increased 40 basis points year-
over-year in the Transportation segment2 and 80 basis
points in the Logistics segment.
▪ LTL yield increased 2.6% year-over-year and LTL
operating ratio improved by 420 basis points.2
▪ Free cash flow benefited from working capital
management and capital expenditures that were lower
than initially planned.
IN V E S T O R P R E S E N T AT IO N MA Y 2 0 2 0
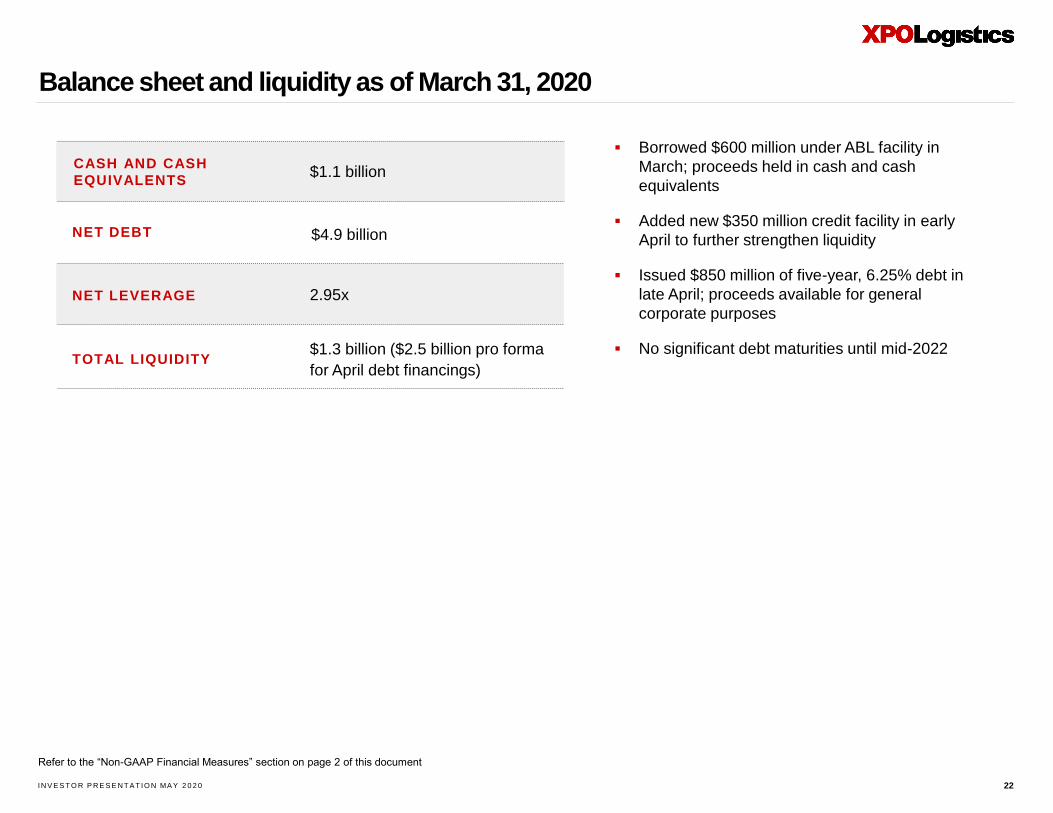
Balance sheet and liquidity as of March 31, 2020
22
CASH AND CASH
EQUIVALENTS$1.1 billion
NET DEBT $4.9 billion
NET LEVERAGE 2.95x
TOTAL LIQUIDITY$1.3 billion ($2.5 billion pro forma
for April debt financings)
Refer to the “Non-GAAP Financial Measures” section on page 2 of this document
▪ Borrowed $600 million under ABL facility in
March; proceeds held in cash and cash
equivalents
▪ Added new $350 million credit facility in early
April to further strengthen liquidity
▪ Issued $850 million of five-year, 6.25% debt in
late April; proceeds available for general
corporate purposes
▪ No significant debt maturities until mid-2022
IN V E S T O R P R E S E N T AT IO N MA Y 2 0 2 0
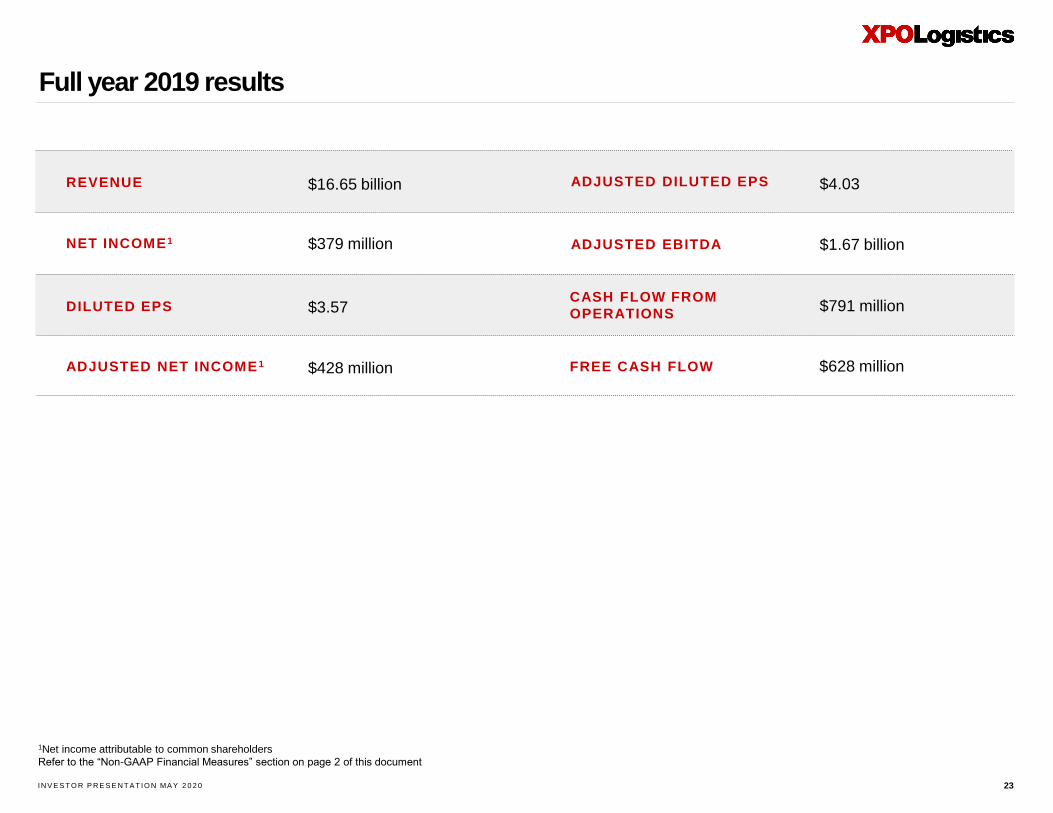
Full year 2019 results
23
REVENUE $16.65 billion
NET INCOME1 $379 million
DILUTED EPS $3.57
ADJUSTED NET INCOME 1 $428 million
ADJUSTED DILUTED EPS
ADJUSTED EBITDA $1.67 billion
CASH FLOW FROM
OPERATIONS$791 million
FREE CASH FLOW $628 million
$4.03
1Net income attributable to common shareholders
Refer to the “Non-GAAP Financial Measures” section on page 2 of this document
IN V E S T O R P R E S E N T AT IO N MA Y 2 0 2 0
Share repurchase program
24
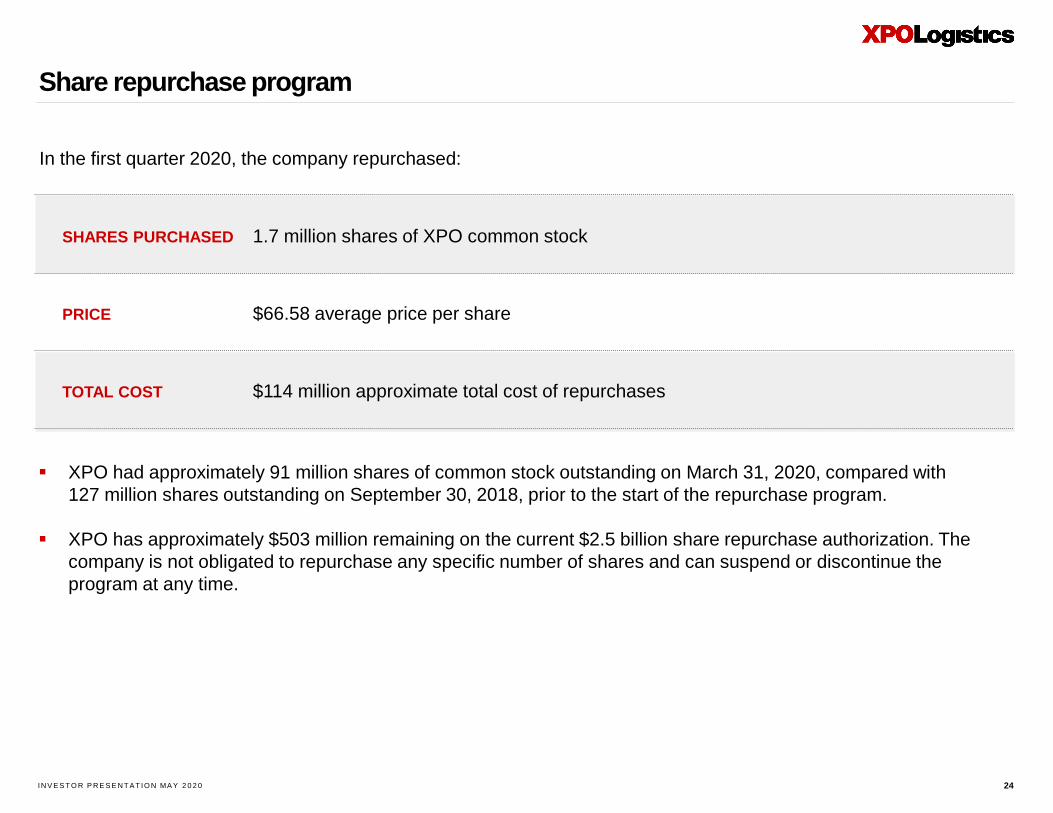
In the first quarter 2020, the company repurchased:
SHARES PURCHASED 1.7 million shares of XPO common stock
PRICE $66.58 average price per share
TOTAL COST $114 million approximate total cost of repurchases
▪ XPO had approximately 91 million shares of common stock outstanding on March 31, 2020, compared with
127 million shares outstanding on September 30, 2018, prior to the start of the repurchase program.
▪ XPO has approximately $503 million remaining on the current $2.5 billion share repurchase authorization. The
company is not obligated to repurchase any specific number of shares and can suspend or discontinue the
program at any time.
IN V E S T O R P R E S E N T AT IO N MA Y 2 0 2 0
Business overview:North American contract logisticsAmericas and Asia
IN V E S T O R P R E S E N T AT IO N MA Y 2 0 2 0
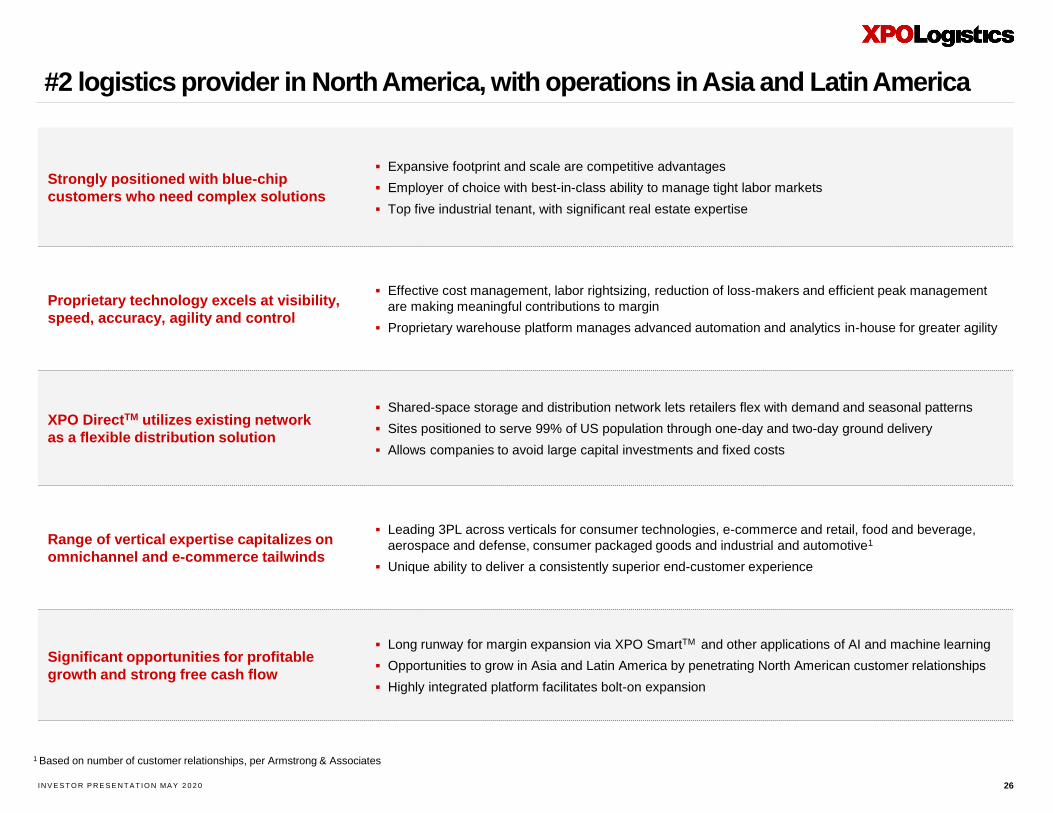
#2 logistics provider in North America, with operations in Asia and Latin America
26
Strongly positioned with blue-chip
customers who need complex solutions
▪ Expansive footprint and scale are competitive advantages
▪ Employer of choice with best-in-class ability to manage tight labor markets
▪ Top five industrial tenant, with significant real estate expertise
Proprietary technology excels at visibility,
speed, accuracy, agility and control
▪ Effective cost management, labor rightsizing, reduction of loss-makers and efficient peak management
are making meaningful contributions to margin
▪ Proprietary warehouse platform manages advanced automation and analytics in-house for greater agility
XPO DirectTM utilizes existing network
as a flexible distribution solution
▪ Shared-space storage and distribution network lets retailers flex with demand and seasonal patterns
▪ Sites positioned to serve 99% of US population through one-day and two-day ground delivery
▪ Allows companies to avoid large capital investments and fixed costs
Range of vertical expertise capitalizes on
omnichannel and e-commerce tailwinds
▪ Leading 3PL across verticals for consumer technologies, e-commerce and retail, food and beverage,
aerospace and defense, consumer packaged goods and industrial and automotive1
▪ Unique ability to deliver a consistently superior end-customer experience
Significant opportunities for profitable
growth and strong free cash flow
▪ Long runway for margin expansion via XPO SmartTM and other applications of AI and machine learning
▪ Opportunities to grow in Asia and Latin America by penetrating North American customer relationships
▪ Highly integrated platform facilitates bolt-on expansion
1 Based on number of customer relationships, per Armstrong & Associates
IN V E S T O R P R E S E N T AT IO N MA Y 2 0 2 0
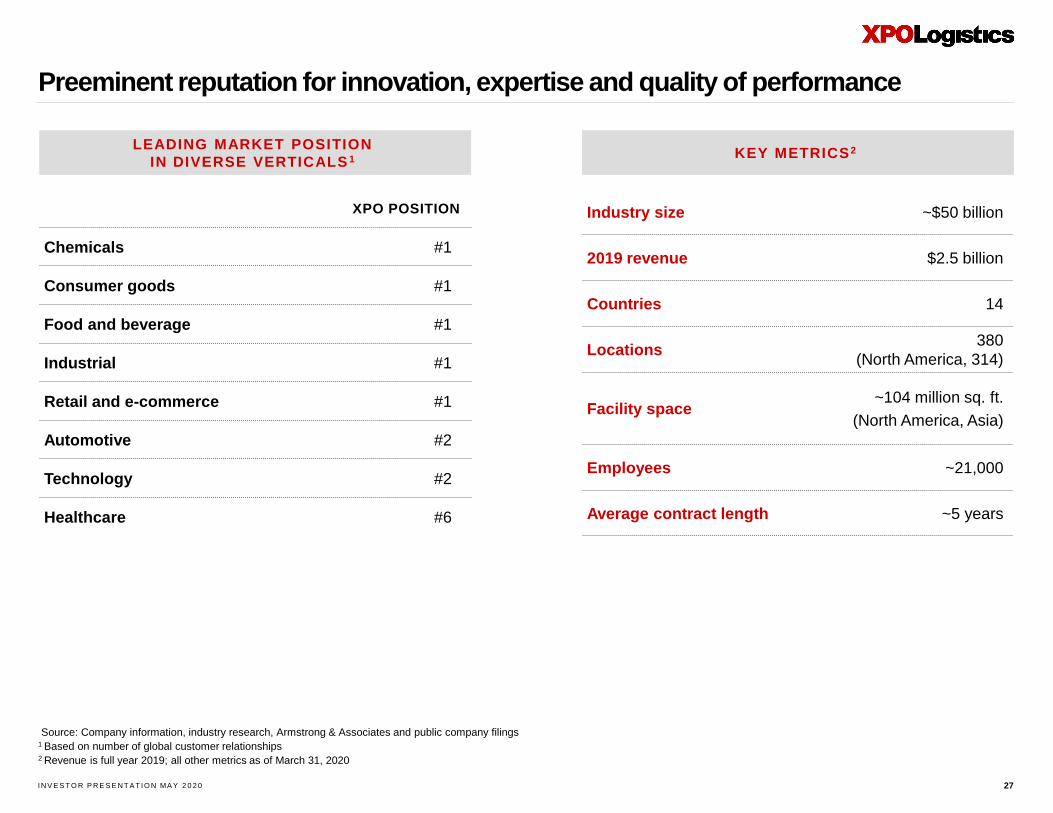
Preeminent reputation for innovation, expertise and quality of performance
Industry size ~$50 billion
2019 revenue $2.5 billion
Countries 14
Locations380
(North America, 314)
Facility space~104 million sq. ft.
(North America, Asia)
Employees ~21,000
Average contract length ~5 years
XPO POSITION
Chemicals #1
Consumer goods #1
Food and beverage #1
Industrial #1
Retail and e-commerce #1
Automotive #2
Technology #2
Healthcare #6
LEADING MARKET POSITION
IN DIVERSE VERTICALS 1 KEY METRICS2
27
Source: Company information, industry research, Armstrong & Associates and public company filings1 Based on number of global customer relationships2 Revenue is full year 2019; all other metrics as of March 31, 2020
IN V E S T O R P R E S E N T AT IO N MA Y 2 0 2 0 28
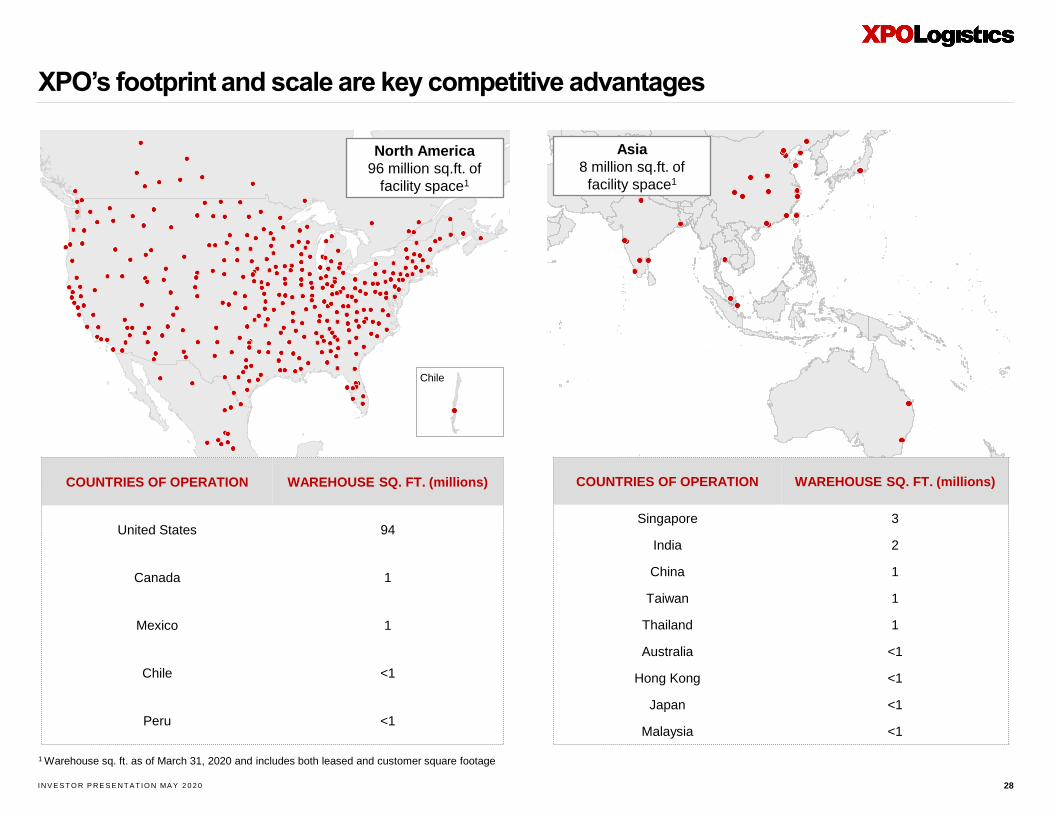
1 Warehouse sq. ft. as of March 31, 2020 and includes both leased and customer square footage
XPO’s footprint and scale are key competitive advantages
North America
96 million sq.ft. of
facility space1
Chile
Asia
8 million sq.ft. of
facility space1
COUNTRIES OF OPERATION WAREHOUSE SQ. FT. (millions)
United States 94
Canada 1
Mexico 1
Chile <1
Peru <1
COUNTRIES OF OPERATION WAREHOUSE SQ. FT. (millions)
Singapore 3
India 2
China 1
Taiwan 1
Thailand 1
Australia <1
Hong Kong <1
Japan <1
Malaysia <1
IN V E S T O R P R E S E N T AT IO N MA Y 2 0 2 0 29
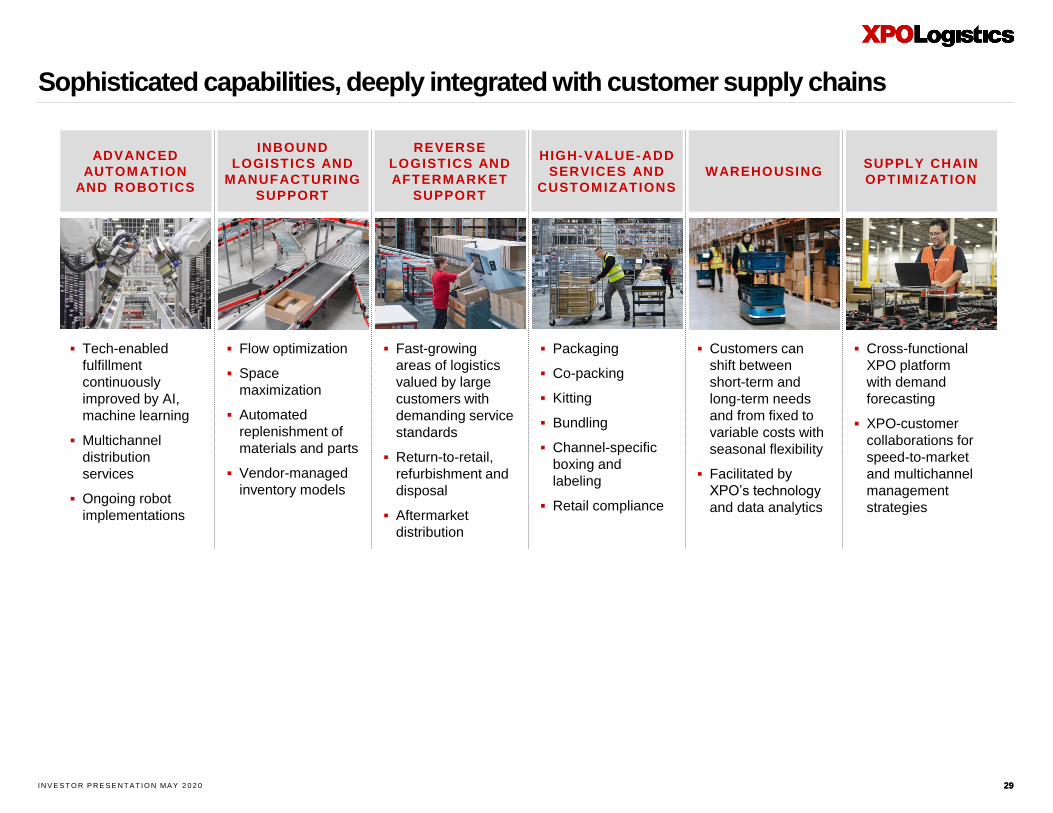
Sophisticated capabilities, deeply integrated with customer supply chains
29
ADVANCED
AUTOM ATION
AND ROBOTICS
INBOUND
LOGISTICS AND
MANUFACTURING
SUPPORT
REVERSE
LOGISTICS AND
AFTERM ARKET
SUPPORT
WAREHOUSING
▪ Tech-enabled
fulfillment
continuously
improved by AI,
machine learning
▪ Multichannel
distribution
services
▪ Ongoing robot
implementations
SUPPLY CHAIN
OPTIMIZATION
HIGH-VALUE-ADD
SERVICES AND
CUSTOMIZATIONS
▪ Flow optimization
▪ Space
maximization
▪ Automated
replenishment of
materials and parts
▪ Vendor-managed
inventory models
▪ Fast-growing
areas of logistics
valued by large
customers with
demanding service
standards
▪ Return-to-retail,
refurbishment and
disposal
▪ Aftermarket
distribution
▪ Packaging
▪ Co-packing
▪ Kitting
▪ Bundling
▪ Channel-specific
boxing and
labeling
▪ Retail compliance
▪ Customers can
shift between
short-term and
long-term needs
and from fixed to
variable costs with
seasonal flexibility
▪ Facilitated by
XPO’s technology
and data analytics
▪ Cross-functional
XPO platform
with demand
forecasting
▪ XPO-customer
collaborations for
speed-to-market
and multichannel
management
strategies
IN V E S T O R P R E S E N T AT IO N MA Y 2 0 2 0
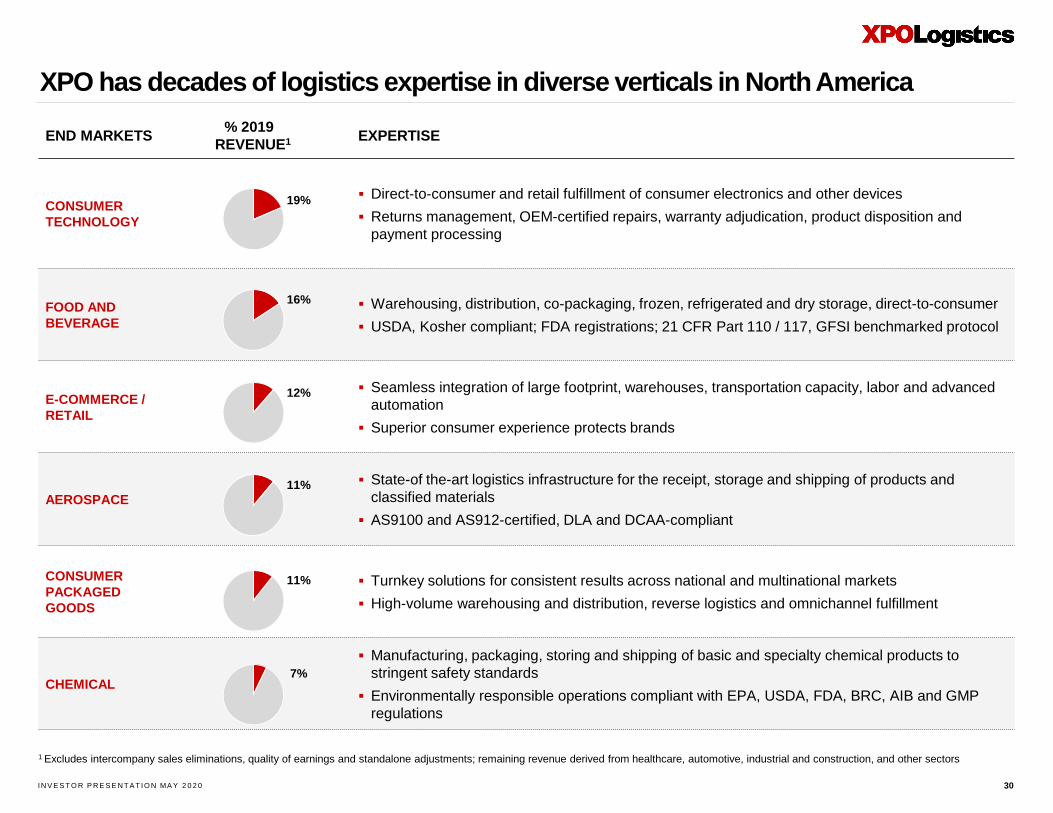
XPO has decades of logistics expertise in diverse verticals in North America
30
END MARKETS% 2019
REVENUE1 EXPERTISE
CONSUMER
TECHNOLOGY
▪ Direct-to-consumer and retail fulfillment of consumer electronics and other devices
▪ Returns management, OEM-certified repairs, warranty adjudication, product disposition and
payment processing
FOOD AND
BEVERAGE
▪ Warehousing, distribution, co-packaging, frozen, refrigerated and dry storage, direct-to-consumer
▪ USDA, Kosher compliant; FDA registrations; 21 CFR Part 110 / 117, GFSI benchmarked protocol
E-COMMERCE /
RETAIL
▪ Seamless integration of large footprint, warehouses, transportation capacity, labor and advanced
automation
▪ Superior consumer experience protects brands
AEROSPACE
▪ State-of the-art logistics infrastructure for the receipt, storage and shipping of products and
classified materials
▪ AS9100 and AS912-certified, DLA and DCAA-compliant
CONSUMER
PACKAGED
GOODS
▪ Turnkey solutions for consistent results across national and multinational markets
▪ High-volume warehousing and distribution, reverse logistics and omnichannel fulfillment
CHEMICAL
▪ Manufacturing, packaging, storing and shipping of basic and specialty chemical products to
stringent safety standards
▪ Environmentally responsible operations compliant with EPA, USDA, FDA, BRC, AIB and GMP
regulations
7%
11%
11%
12%
16%
19%
1 Excludes intercompany sales eliminations, quality of earnings and standalone adjustments; remaining revenue derived from healthcare, automotive, industrial and construction, and other sectors
IN V E S T O R P R E S E N T AT IO N MA Y 2 0 2 0
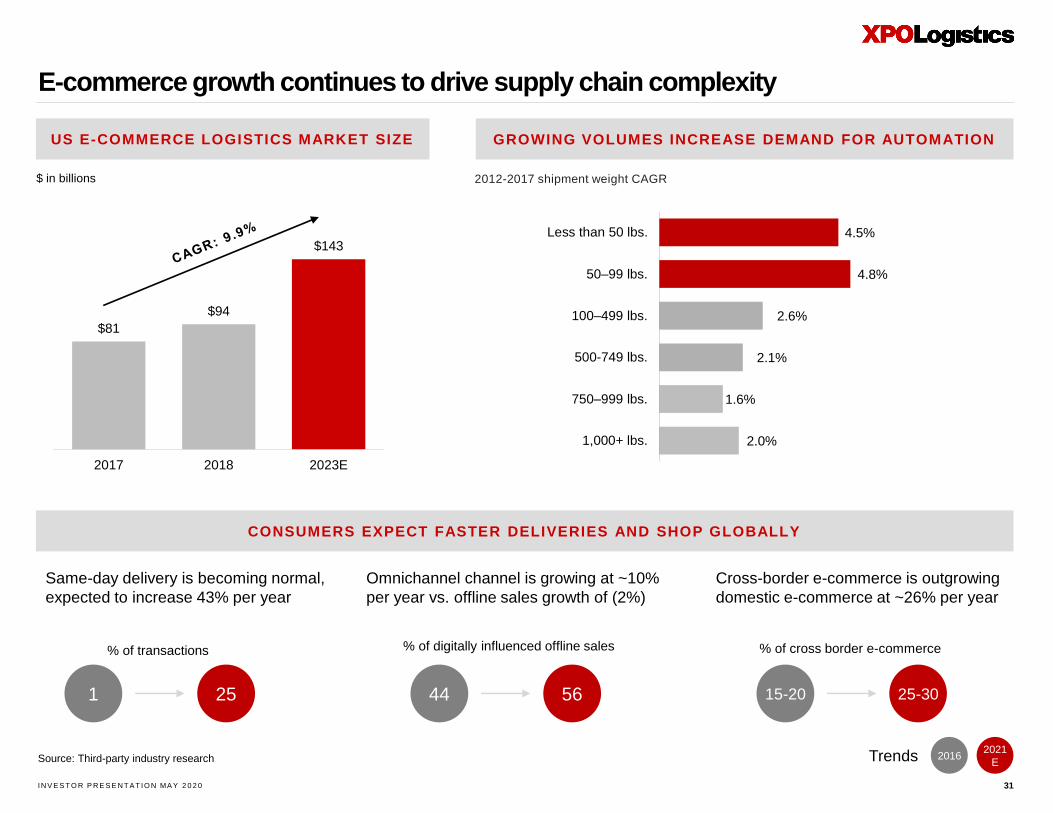
$81
$94
$143
2017 2018 2023E
US E-COMMERCE LOGISTICS MARKET SIZE GROWING VOLUMES INCREASE DEMAND FOR AUTOMATION
E-commerce growth continues to drive supply chain complexity
31
CONSUMERS EXPECT FASTER DELIVERIES AND SHOP GLOBALLY
$ in billions
Source: Third-party industry research
2.0%
1.6%
2.1%
2.6%
4.8%
4.5%
1,000+ lbs.
750–999 lbs.
500-749 lbs.
100–499 lbs.
50–99 lbs.
Less than 50 lbs.
2012-2017 shipment weight CAGR
Same-day delivery is becoming normal,
expected to increase 43% per year
Omnichannel channel is growing at ~10%
per year vs. offline sales growth of (2%)
Cross-border e-commerce is outgrowing
domestic e-commerce at ~26% per year
% of transactions % of digitally influenced offline sales % of cross border e-commerce
1 25 44 56 15-20 25-30
20162021
ETrends
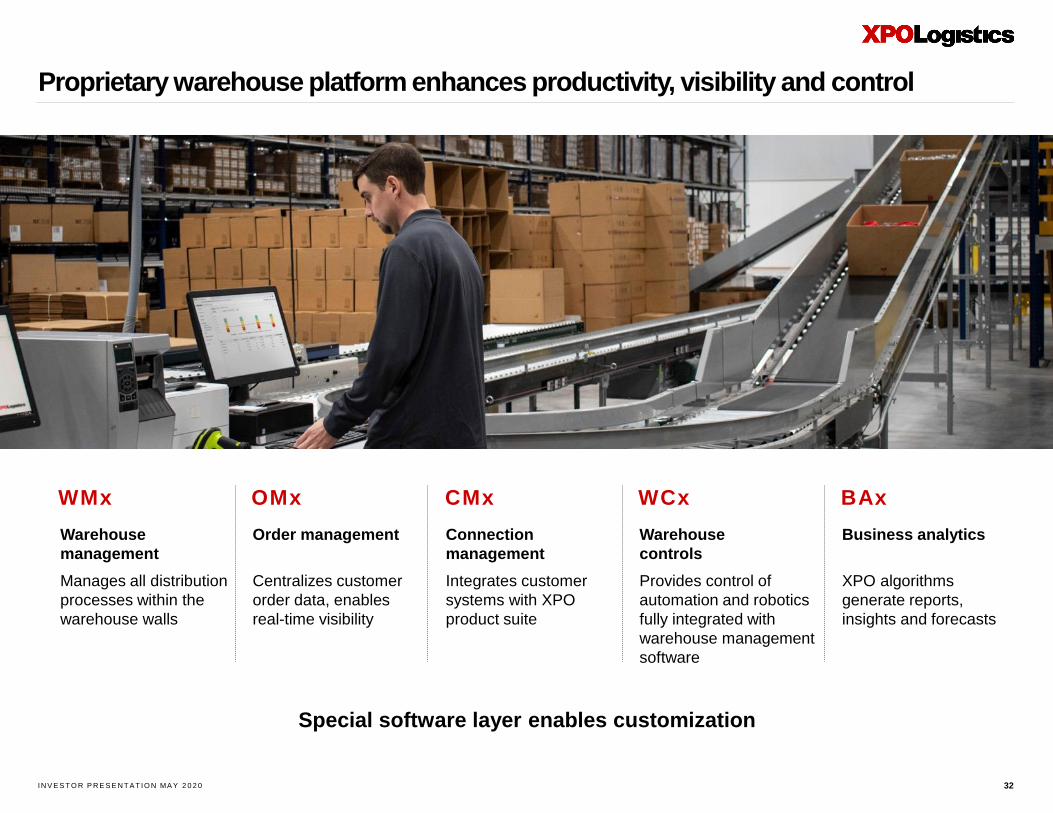
IN V E S T O R P R E S E N T AT IO N MA Y 2 0 2 0 32
Special software layer enables customization
Warehouse
management
Manages all distribution
processes within the
warehouse walls
WMx
Order management
Centralizes customer
order data, enables
real-time visibility
OMx
Connection
management
Integrates customer
systems with XPO
product suite
CMx
Warehouse
controls
Provides control of
automation and robotics
fully integrated with
warehouse management
software
WCx
Business analytics
XPO algorithms
generate reports,
insights and forecasts
BAx
Proprietary warehouse platform enhances productivity, visibility and control
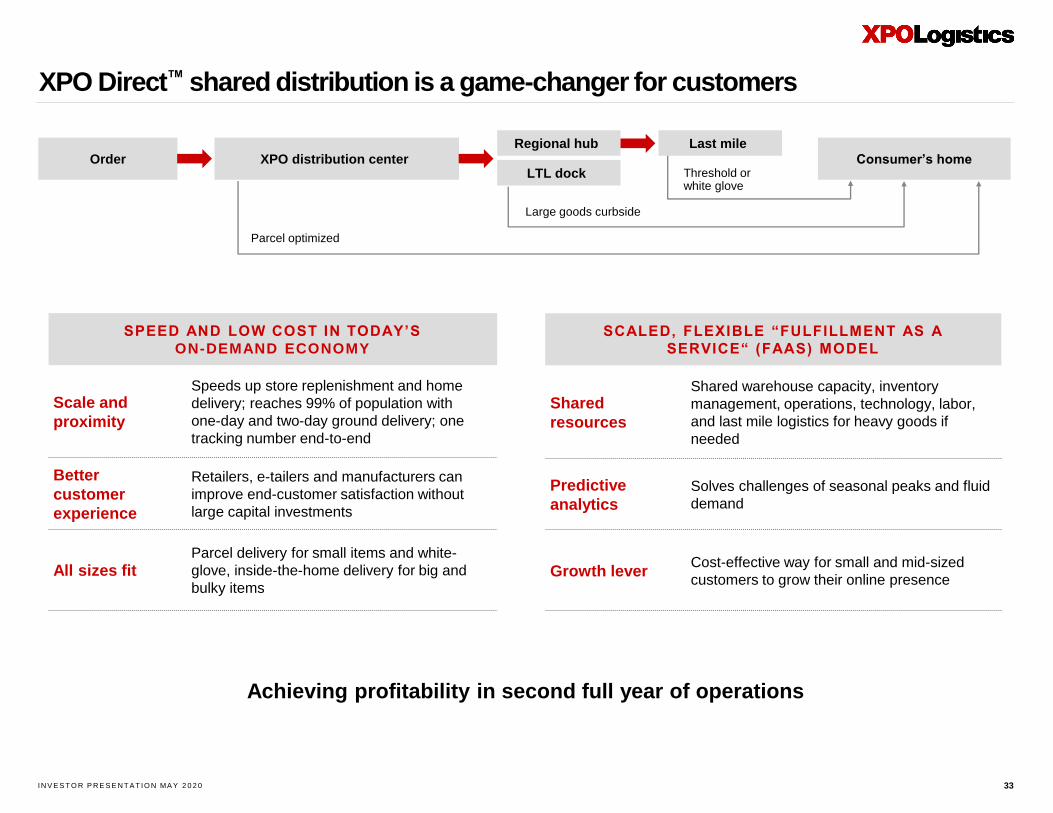
IN V E S T O R P R E S E N T AT IO N MA Y 2 0 2 0
XPO Direct™ shared distribution is a game-changer for customers
33
Scale and
proximity
Speeds up store replenishment and home
delivery; reaches 99% of population with
one-day and two-day ground delivery; one
tracking number end-to-end
Better
customer
experience
Retailers, e-tailers and manufacturers can
improve end-customer satisfaction without
large capital investments
All sizes fitParcel delivery for small items and white-
glove, inside-the-home delivery for big and
bulky items
SPEED AND LOW COST IN TODAY’S
ON-DEMAND ECONOMY
SCALED, FLEXIBLE “FULFILLMENT AS A
SERVICE“ (FAAS) MODEL
Order XPO distribution center
Regional hub
LTL dockConsumer’s home
Parcel optimized
Large goods curbside
Threshold orwhite glove
Last mile
Achieving profitability in second full year of operations
Shared
resources
Shared warehouse capacity, inventory
management, operations, technology, labor,
and last mile logistics for heavy goods if
needed
Predictive
analytics
Solves challenges of seasonal peaks and fluid
demand
Growth leverCost-effective way for small and mid-sized
customers to grow their online presence
IN V E S T O R P R E S E N T AT IO N MA Y 2 0 2 0
Business overview:European contract logistics
IN V E S T O R P R E S E N T AT IO N MA Y 2 0 2 0
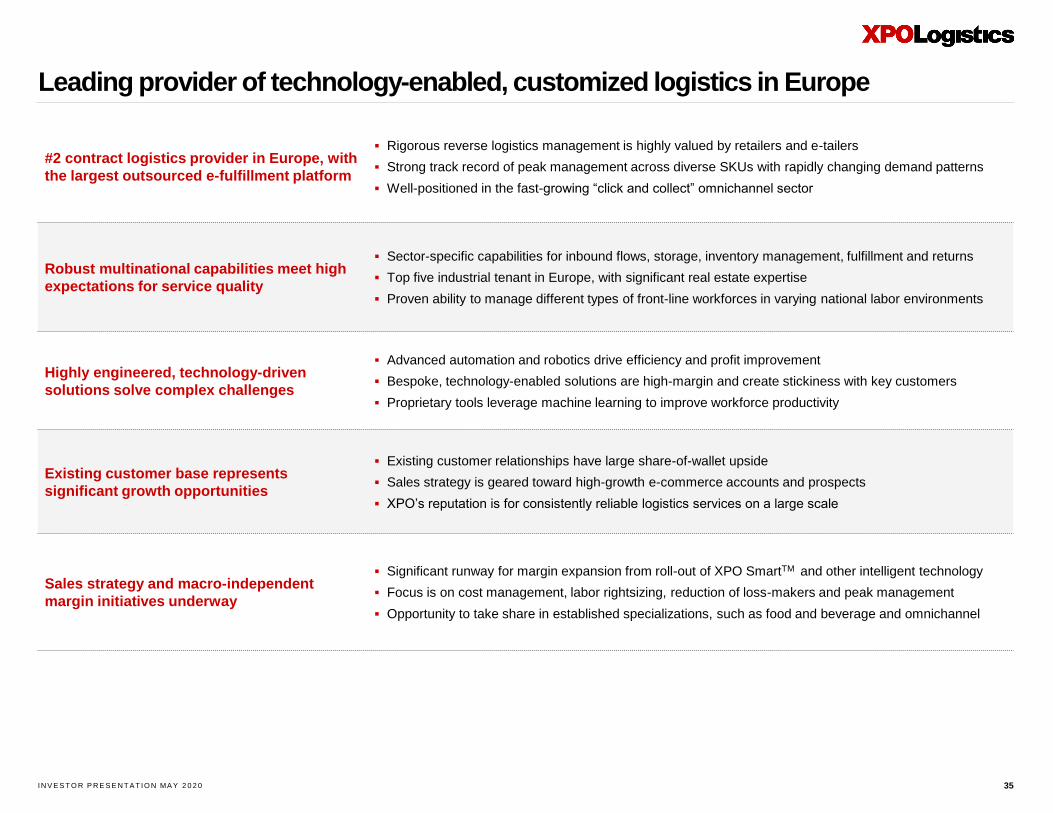
Leading provider of technology-enabled, customized logistics in Europe
35
#2 contract logistics provider in Europe, with
the largest outsourced e-fulfillment platform
▪ Rigorous reverse logistics management is highly valued by retailers and e-tailers
▪ Strong track record of peak management across diverse SKUs with rapidly changing demand patterns
▪ Well-positioned in the fast-growing “click and collect” omnichannel sector
Robust multinational capabilities meet high
expectations for service quality
▪ Sector-specific capabilities for inbound flows, storage, inventory management, fulfillment and returns
▪ Top five industrial tenant in Europe, with significant real estate expertise
▪ Proven ability to manage different types of front-line workforces in varying national labor environments
Highly engineered, technology-driven
solutions solve complex challenges
▪ Advanced automation and robotics drive efficiency and profit improvement
▪ Bespoke, technology-enabled solutions are high-margin and create stickiness with key customers
▪ Proprietary tools leverage machine learning to improve workforce productivity
Existing customer base represents
significant growth opportunities
▪ Existing customer relationships have large share-of-wallet upside
▪ Sales strategy is geared toward high-growth e-commerce accounts and prospects
▪ XPO’s reputation is for consistently reliable logistics services on a large scale
Sales strategy and macro-independent
margin initiatives underway
▪ Significant runway for margin expansion from roll-out of XPO SmartTM and other intelligent technology
▪ Focus is on cost management, labor rightsizing, reduction of loss-makers and peak management
▪ Opportunity to take share in established specializations, such as food and beverage and omnichannel
IN V E S T O R P R E S E N T AT IO N MA Y 2 0 2 0
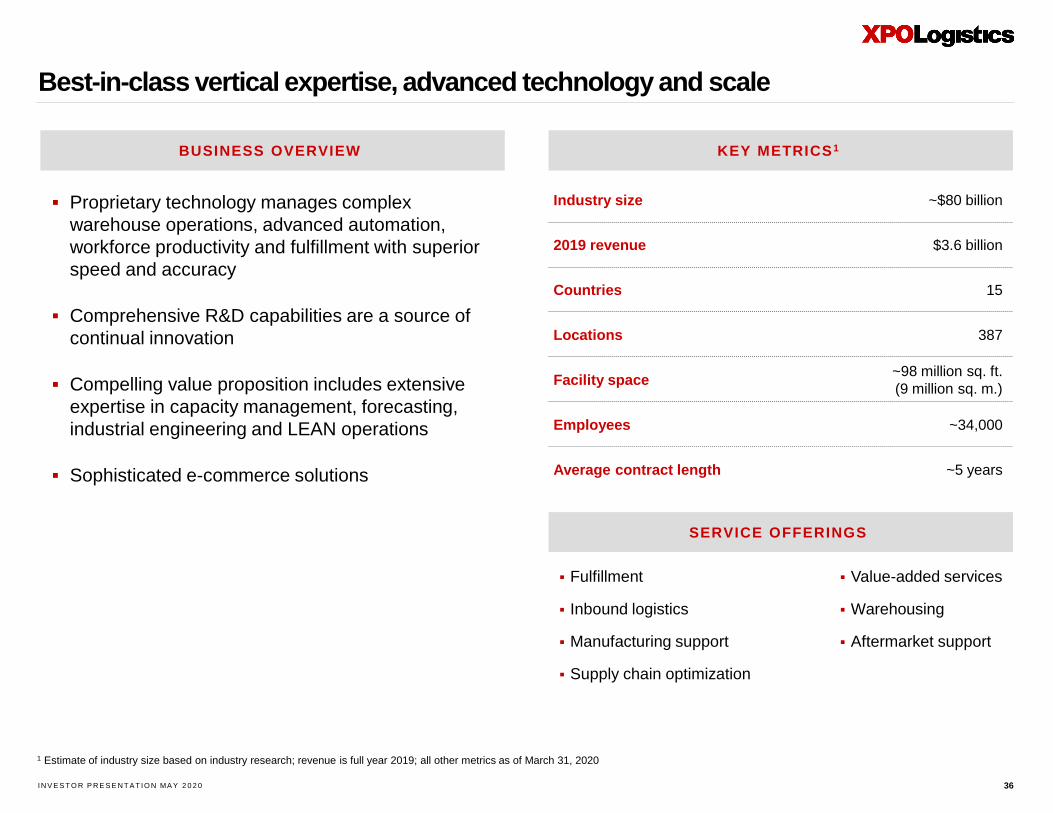
Best-in-class vertical expertise, advanced technology and scale
KEY METRICS1
36
Industry size ~$80 billion
2019 revenue $3.6 billion
Countries 15
Locations 387
Facility space~98 million sq. ft.
(9 million sq. m.)
Employees ~34,000
Average contract length ~5 years
▪ Proprietary technology manages complex
warehouse operations, advanced automation,
workforce productivity and fulfillment with superior
speed and accuracy
▪ Comprehensive R&D capabilities are a source of
continual innovation
▪ Compelling value proposition includes extensive
expertise in capacity management, forecasting,
industrial engineering and LEAN operations
▪ Sophisticated e-commerce solutions
BUSINESS OVERVIEW
▪ Fulfillment
▪ Inbound logistics
▪ Manufacturing support
▪ Supply chain optimization
SERVICE OFFERINGS
▪ Value-added services
▪ Warehousing
▪ Aftermarket support
1 Estimate of industry size based on industry research; revenue is full year 2019; all other metrics as of March 31, 2020
IN V E S T O R P R E S E N T AT IO N MA Y 2 0 2 0 37
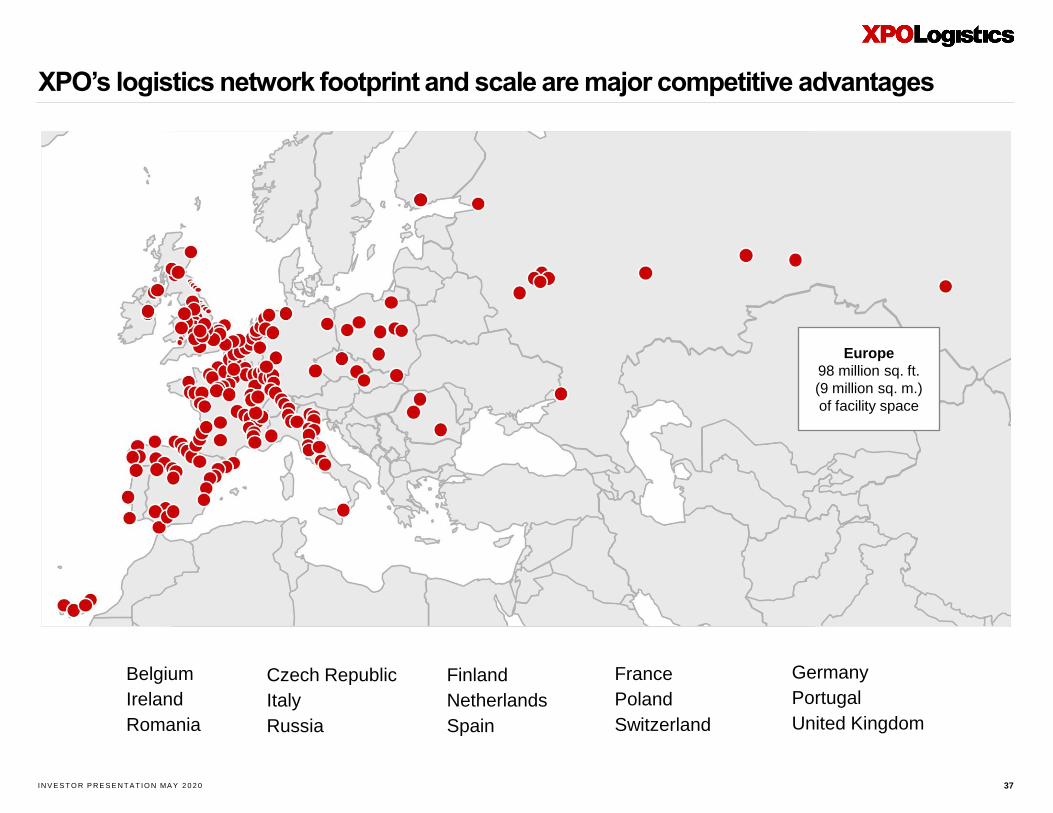
XPO’s logistics network footprint and scale are major competitive advantages
Europe
98 million sq. ft.
(9 million sq. m.)
of facility space
Belgium
Ireland
Romania
Czech Republic
Italy
Russia
Finland
Netherlands
Spain
France
Poland
Switzerland
Germany
Portugal
United Kingdom
IN V E S T O R P R E S E N T AT IO N MA Y 2 0 2 0
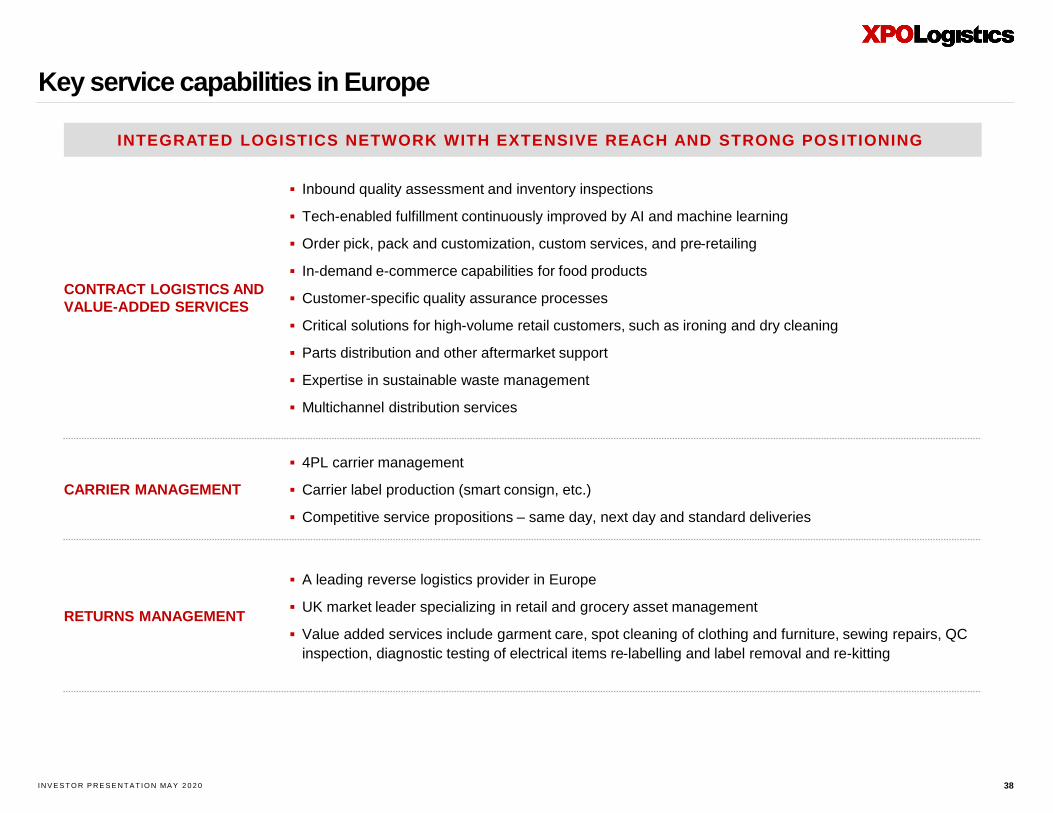
CONTRACT LOGISTICS AND
VALUE-ADDED SERVICES
▪ Inbound quality assessment and inventory inspections
▪ Tech-enabled fulfillment continuously improved by AI and machine learning
▪ Order pick, pack and customization, custom services, and pre-retailing
▪ In-demand e-commerce capabilities for food products
▪ Customer-specific quality assurance processes
▪ Critical solutions for high-volume retail customers, such as ironing and dry cleaning
▪ Parts distribution and other aftermarket support
▪ Expertise in sustainable waste management
▪ Multichannel distribution services
CARRIER MANAGEMENT
▪ 4PL carrier management
▪ Carrier label production (smart consign, etc.)
▪ Competitive service propositions – same day, next day and standard deliveries
RETURNS MANAGEMENT
▪ A leading reverse logistics provider in Europe
▪ UK market leader specializing in retail and grocery asset management
▪ Value added services include garment care, spot cleaning of clothing and furniture, sewing repairs, QC
inspection, diagnostic testing of electrical items re-labelling and label removal and re-kitting
Key service capabilities in Europe
38
INTEGRATED LOGISTICS NETWORK WITH EXTENSIVE REACH AND STRONG POS ITIONING
IN V E S T O R P R E S E N T AT IO N MA Y 2 0 2 0
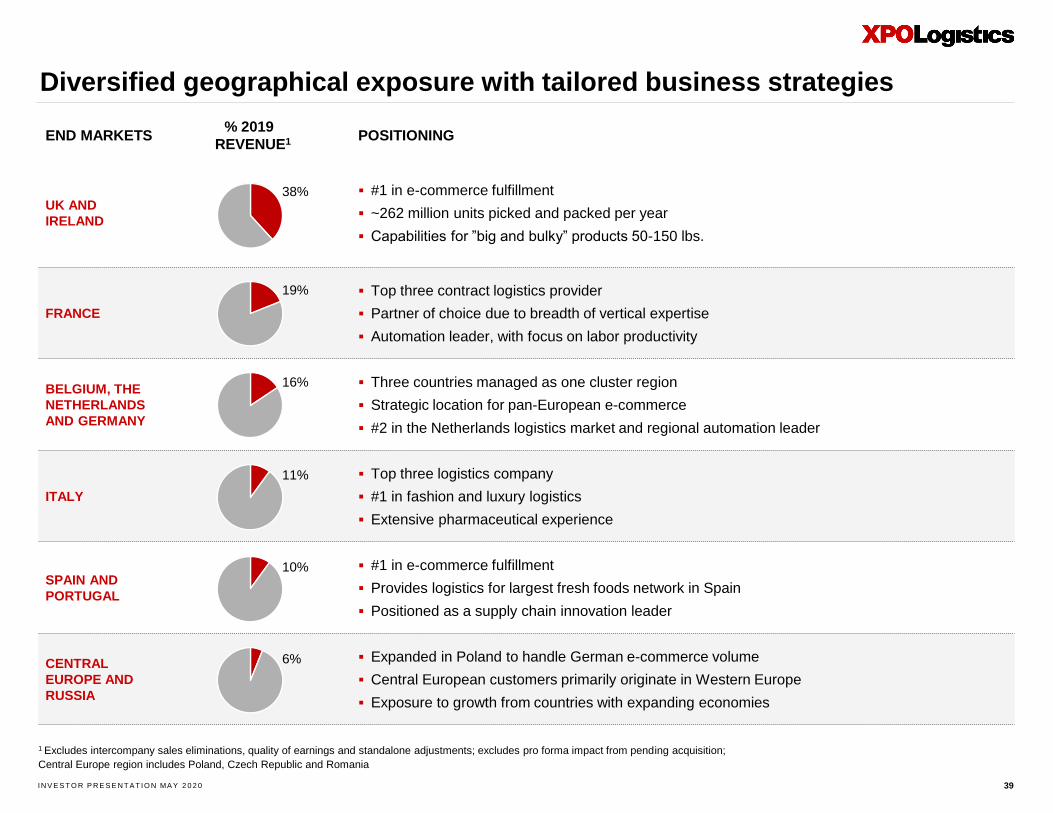
Diversified geographical exposure with tailored business strategies
39
END MARKETS% 2019
REVENUE1 POSITIONING
UK AND
IRELAND
▪ #1 in e-commerce fulfillment
▪ ~262 million units picked and packed per year
▪ Capabilities for ”big and bulky” products 50-150 lbs.
FRANCE
▪ Top three contract logistics provider
▪ Partner of choice due to breadth of vertical expertise
▪ Automation leader, with focus on labor productivity
BELGIUM, THE
NETHERLANDS
AND GERMANY
▪ Three countries managed as one cluster region
▪ Strategic location for pan-European e-commerce
▪ #2 in the Netherlands logistics market and regional automation leader
ITALY
▪ Top three logistics company
▪ #1 in fashion and luxury logistics
▪ Extensive pharmaceutical experience
SPAIN AND
PORTUGAL
▪ #1 in e-commerce fulfillment
▪ Provides logistics for largest fresh foods network in Spain
▪ Positioned as a supply chain innovation leader
CENTRAL
EUROPE AND
RUSSIA
▪ Expanded in Poland to handle German e-commerce volume
▪ Central European customers primarily originate in Western Europe
▪ Exposure to growth from countries with expanding economies
1 Excludes intercompany sales eliminations, quality of earnings and standalone adjustments; excludes pro forma impact from pending acquisition;
Central Europe region includes Poland, Czech Republic and Romania
38%
19%
16%
11%
10%
6%
IN V E S T O R P R E S E N T AT IO N MA Y 2 0 2 0
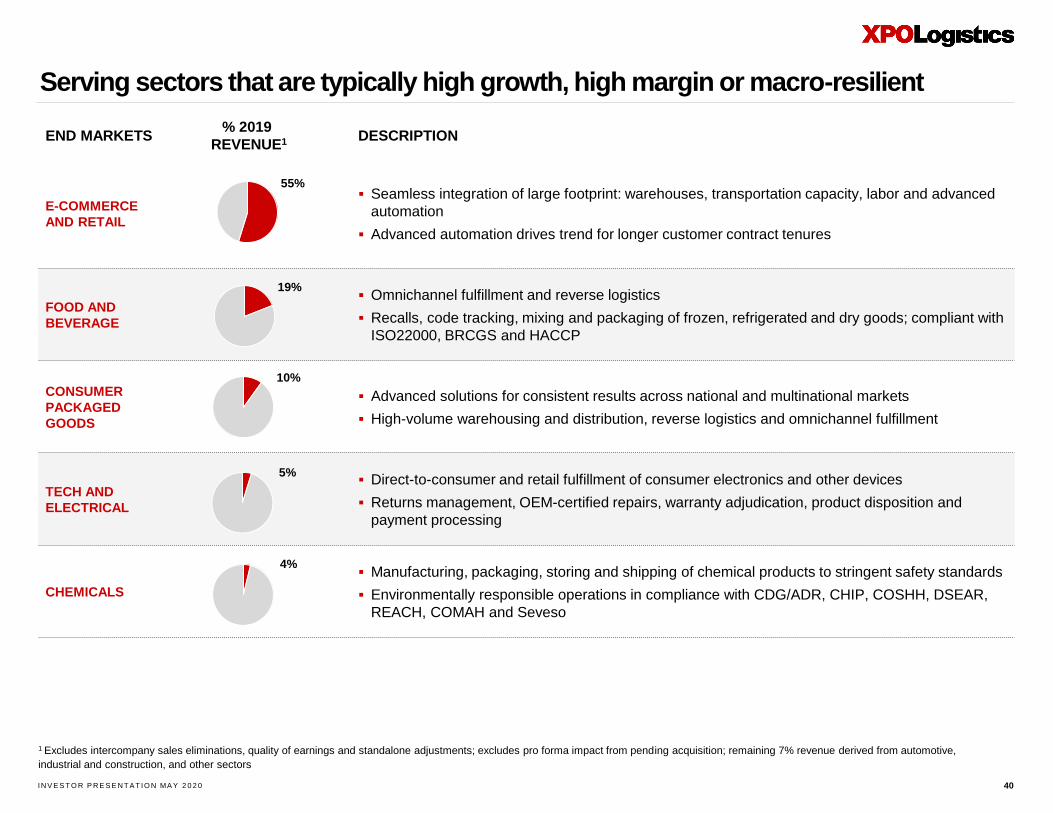
Serving sectors that are typically high growth, high margin or macro-resilient
40
END MARKETS% 2019
REVENUE1 DESCRIPTION
E-COMMERCE
AND RETAIL
▪ Seamless integration of large footprint: warehouses, transportation capacity, labor and advanced
automation
▪ Advanced automation drives trend for longer customer contract tenures
FOOD AND
BEVERAGE
▪ Omnichannel fulfillment and reverse logistics
▪ Recalls, code tracking, mixing and packaging of frozen, refrigerated and dry goods; compliant with
ISO22000, BRCGS and HACCP
CONSUMER
PACKAGED
GOODS
▪ Advanced solutions for consistent results across national and multinational markets
▪ High-volume warehousing and distribution, reverse logistics and omnichannel fulfillment
TECH AND
ELECTRICAL
▪ Direct-to-consumer and retail fulfillment of consumer electronics and other devices
▪ Returns management, OEM-certified repairs, warranty adjudication, product disposition and
payment processing
CHEMICALS
▪ Manufacturing, packaging, storing and shipping of chemical products to stringent safety standards
▪ Environmentally responsible operations in compliance with CDG/ADR, CHIP, COSHH, DSEAR,
REACH, COMAH and Seveso
1 Excludes intercompany sales eliminations, quality of earnings and standalone adjustments; excludes pro forma impact from pending acquisition; remaining 7% revenue derived from automotive,
industrial and construction, and other sectors
4%
5%
10%
19%
55%
IN V E S T O R P R E S E N T AT IO N MA Y 2 0 2 0
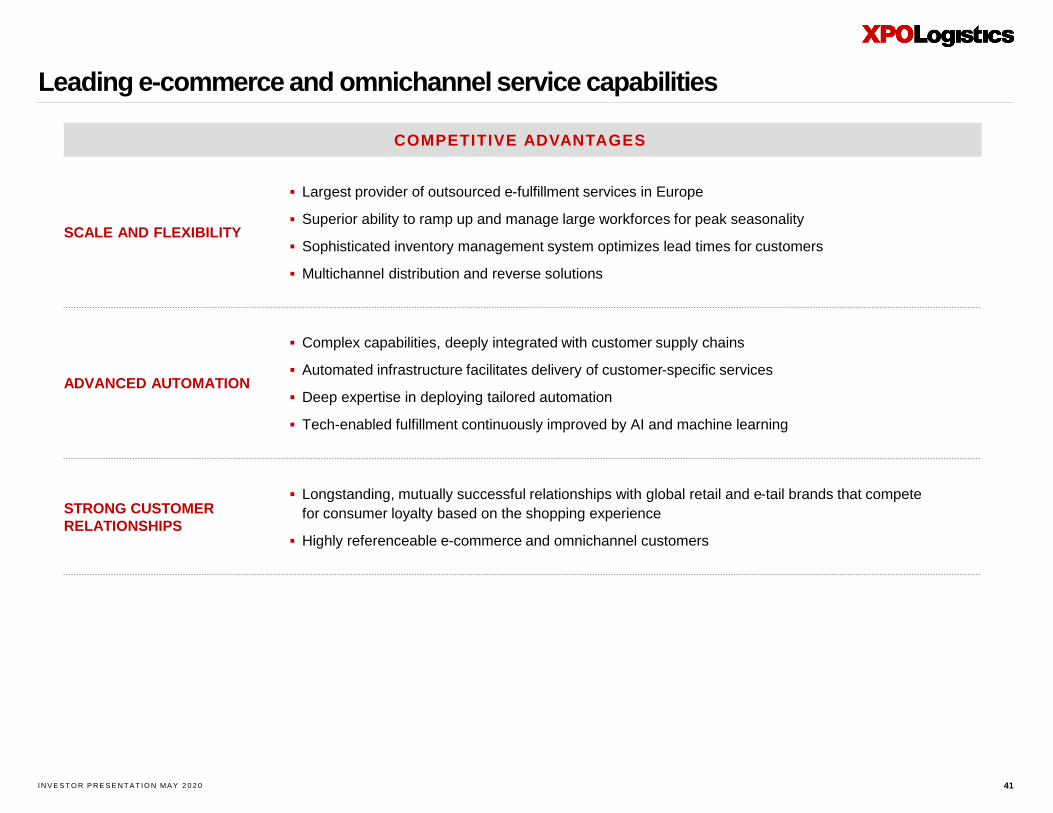
SCALE AND FLEXIBILITY
▪ Largest provider of outsourced e-fulfillment services in Europe
▪ Superior ability to ramp up and manage large workforces for peak seasonality
▪ Sophisticated inventory management system optimizes lead times for customers
▪ Multichannel distribution and reverse solutions
ADVANCED AUTOMATION
▪ Complex capabilities, deeply integrated with customer supply chains
▪ Automated infrastructure facilitates delivery of customer-specific services
▪ Deep expertise in deploying tailored automation
▪ Tech-enabled fulfillment continuously improved by AI and machine learning
STRONG CUSTOMER
RELATIONSHIPS
▪ Longstanding, mutually successful relationships with global retail and e-tail brands that compete
for consumer loyalty based on the shopping experience
▪ Highly referenceable e-commerce and omnichannel customers
Leading e-commerce and omnichannel service capabilities
41
COMPETITIVE ADVANTAGES
IN V E S T O R P R E S E N T AT IO N MA Y 2 0 2 0
Business overview:North American less-than-truckload
IN V E S T O R P R E S E N T AT IO N MA Y 2 0 2 0
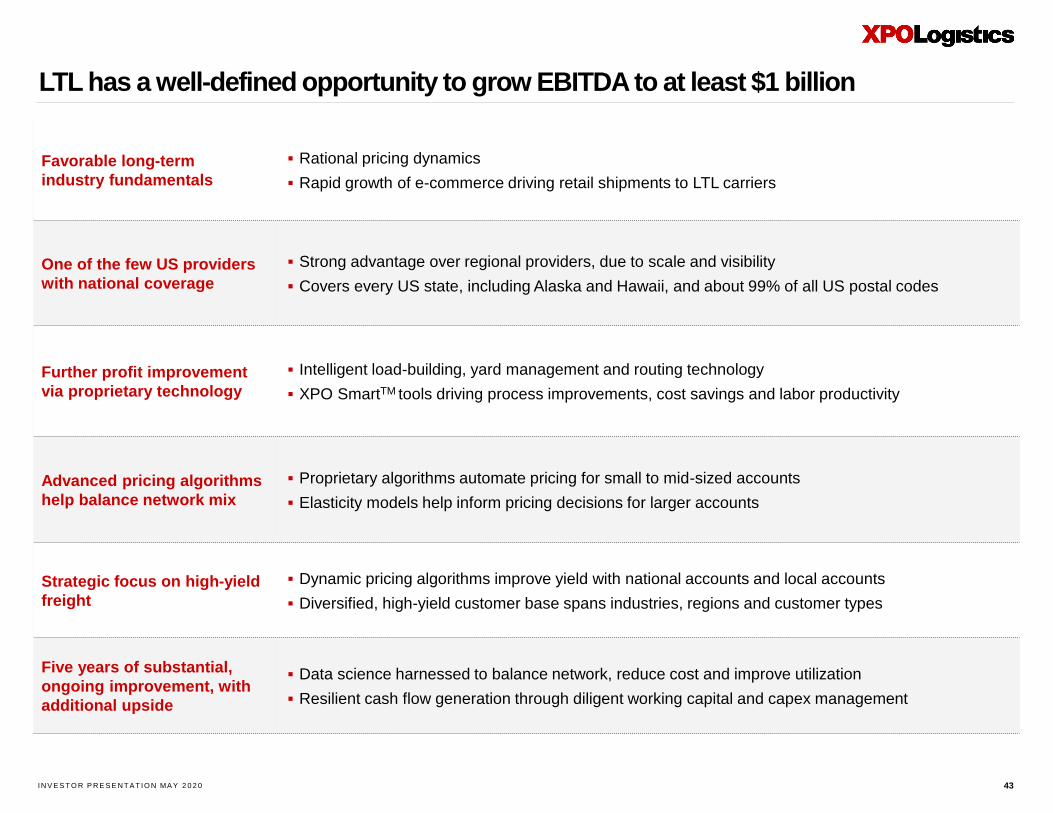
LTL has a well-defined opportunity to grow EBITDA to at least $1 billion
43
Favorable long-term
industry fundamentals
▪ Rational pricing dynamics
▪ Rapid growth of e-commerce driving retail shipments to LTL carriers
One of the few US providers
with national coverage
▪ Strong advantage over regional providers, due to scale and visibility
▪ Covers every US state, including Alaska and Hawaii, and about 99% of all US postal codes
Further profit improvement
via proprietary technology
▪ Intelligent load-building, yard management and routing technology
▪ XPO SmartTM tools driving process improvements, cost savings and labor productivity
Advanced pricing algorithms
help balance network mix
▪ Proprietary algorithms automate pricing for small to mid-sized accounts
▪ Elasticity models help inform pricing decisions for larger accounts
Strategic focus on high-yield
freight
▪ Dynamic pricing algorithms improve yield with national accounts and local accounts
▪ Diversified, high-yield customer base spans industries, regions and customer types
Five years of substantial,
ongoing improvement, with
additional upside
▪ Data science harnessed to balance network, reduce cost and improve utilization
▪ Resilient cash flow generation through diligent working capital and capex management
IN V E S T O R P R E S E N T AT IO N MA Y 2 0 2 0
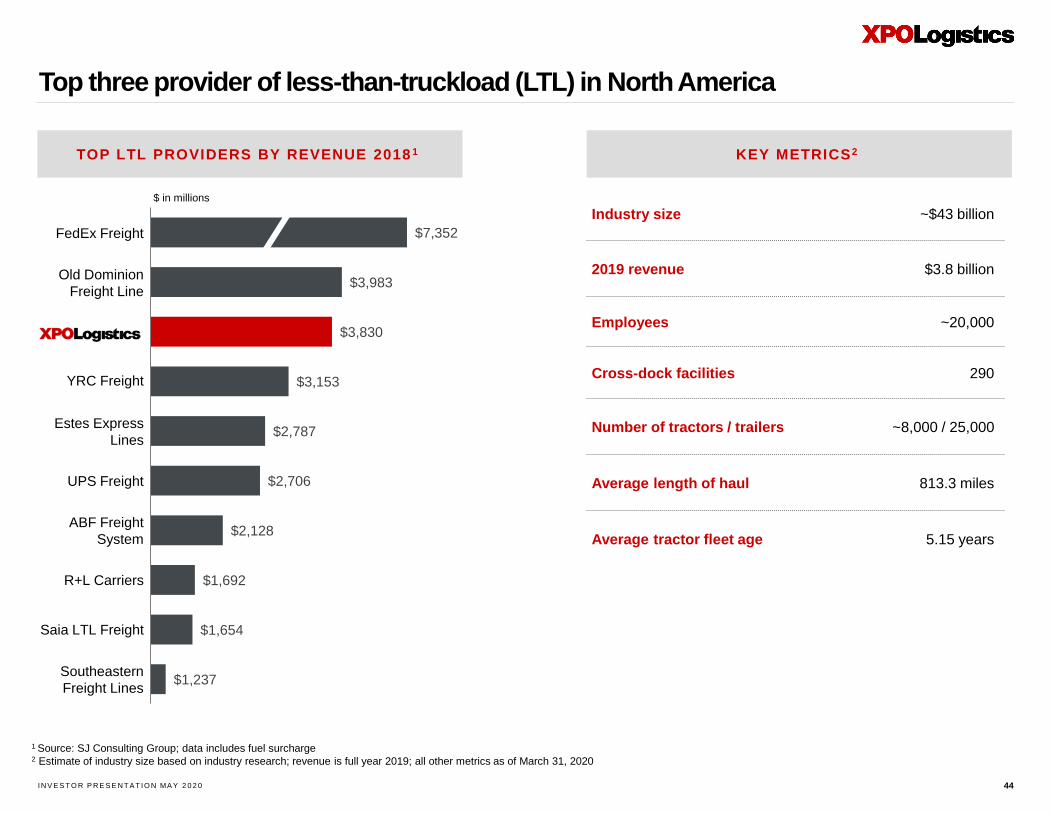
Top three provider of less-than-truckload (LTL) in North America
44
KEY METRICS2
1 Source: SJ Consulting Group; data includes fuel surcharge 2 Estimate of industry size based on industry research; revenue is full year 2019; all other metrics as of March 31, 2020
Industry size ~$43 billion
2019 revenue $3.8 billion
Employees ~20,000
Cross-dock facilities 290
Number of tractors / trailers ~8,000 / 25,000
Average length of haul 813.3 miles
Average tractor fleet age 5.15 years
TOP LTL PROVIDERS BY REVENUE 2018 1
$1,237
$1,654
$1,692
$2,128
$2,706
$2,787
$3,153
$3,830
$3,983
$7,352
Southeastern
Freight Lines
FedEx Freight
Old Dominion
Freight Line
YRC Freight
Estes Express
Lines
UPS Freight
ABF Freight
System
R+L Carriers
Saia LTL Freight
$ in millions
IN V E S T O R P R E S E N T AT IO N MA Y 2 0 2 0
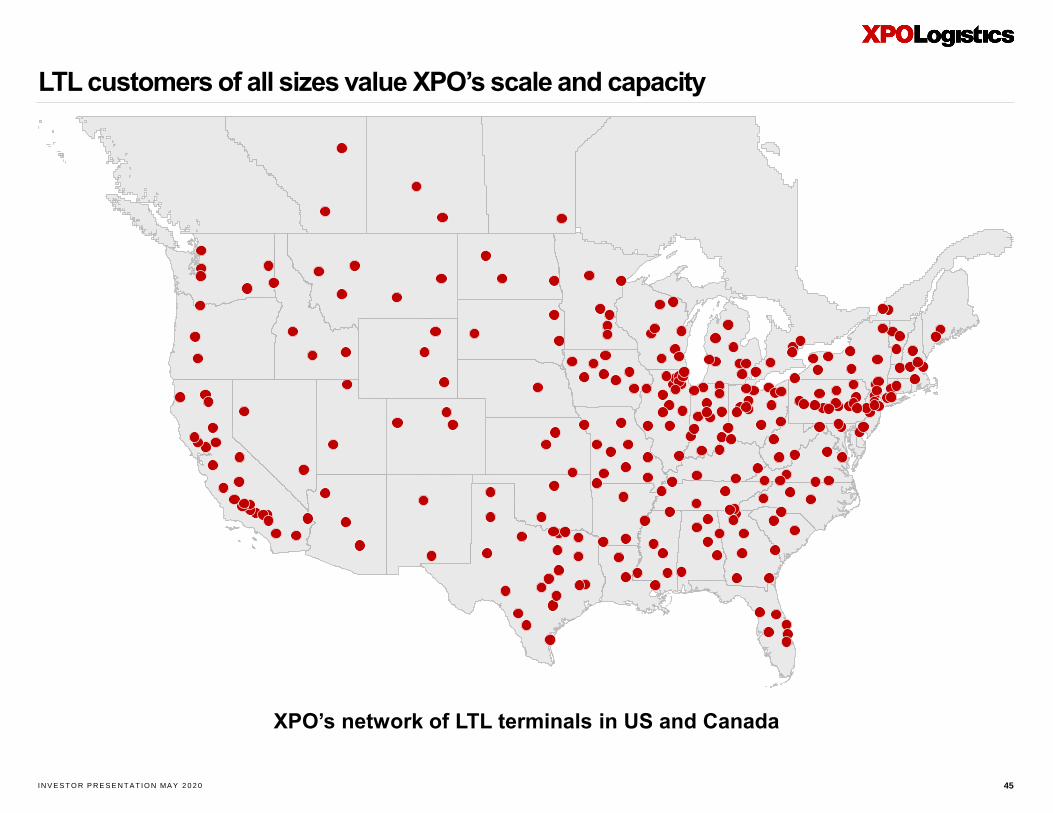
LTL customers of all sizes value XPO’s scale and capacity
45
XPO’s network of LTL terminals in US and Canada
IN V E S T O R P R E S E N T AT IO N MA Y 2 0 2 0
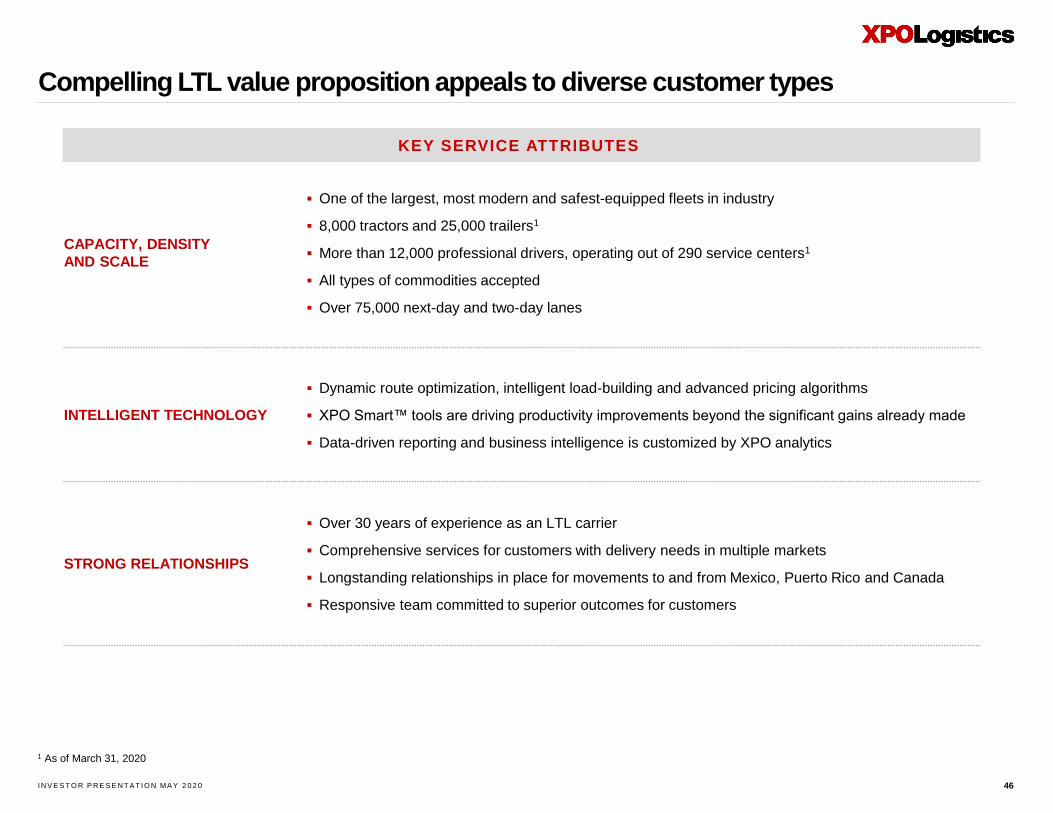
CAPACITY, DENSITY
AND SCALE
▪ One of the largest, most modern and safest-equipped fleets in industry
▪ 8,000 tractors and 25,000 trailers1
▪ More than 12,000 professional drivers, operating out of 290 service centers1
▪ All types of commodities accepted
▪ Over 75,000 next-day and two-day lanes
INTELLIGENT TECHNOLOGY
▪ Dynamic route optimization, intelligent load-building and advanced pricing algorithms
▪ XPO Smart™ tools are driving productivity improvements beyond the significant gains already made
▪ Data-driven reporting and business intelligence is customized by XPO analytics
STRONG RELATIONSHIPS
▪ Over 30 years of experience as an LTL carrier
▪ Comprehensive services for customers with delivery needs in multiple markets
▪ Longstanding relationships in place for movements to and from Mexico, Puerto Rico and Canada
▪ Responsive team committed to superior outcomes for customers
Compelling LTL value proposition appeals to diverse customer types
46
KEY SERVICE ATTRIBUTES
1 As of March 31, 2020
IN V E S T O R P R E S E N T AT IO N MA Y 2 0 2 0
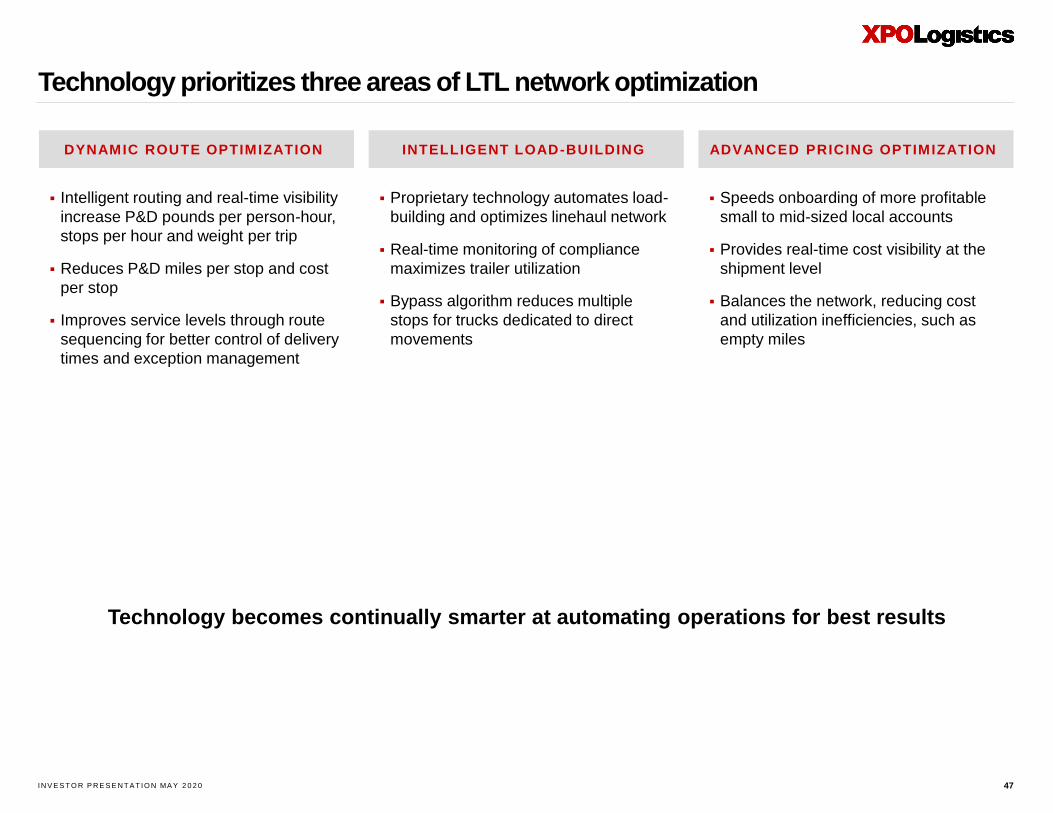
Technology prioritizes three areas of LTL network optimization
47
DYNAMIC ROUTE OPTIMIZATION INTELLIGENT LOAD-BUILDING ADVANCED PRICING OPTIMIZATION
Technology becomes continually smarter at automating operations for best results
▪ Intelligent routing and real-time visibility
increase P&D pounds per person-hour,
stops per hour and weight per trip
▪ Reduces P&D miles per stop and cost
per stop
▪ Improves service levels through route
sequencing for better control of delivery
times and exception management
▪ Proprietary technology automates load-
building and optimizes linehaul network
▪ Real-time monitoring of compliance
maximizes trailer utilization
▪ Bypass algorithm reduces multiple
stops for trucks dedicated to direct
movements
▪ Speeds onboarding of more profitable
small to mid-sized local accounts
▪ Provides real-time cost visibility at the
shipment level
▪ Balances the network, reducing cost
and utilization inefficiencies, such as
empty miles
IN V E S T O R P R E S E N T AT IO N MA Y 2 0 2 0
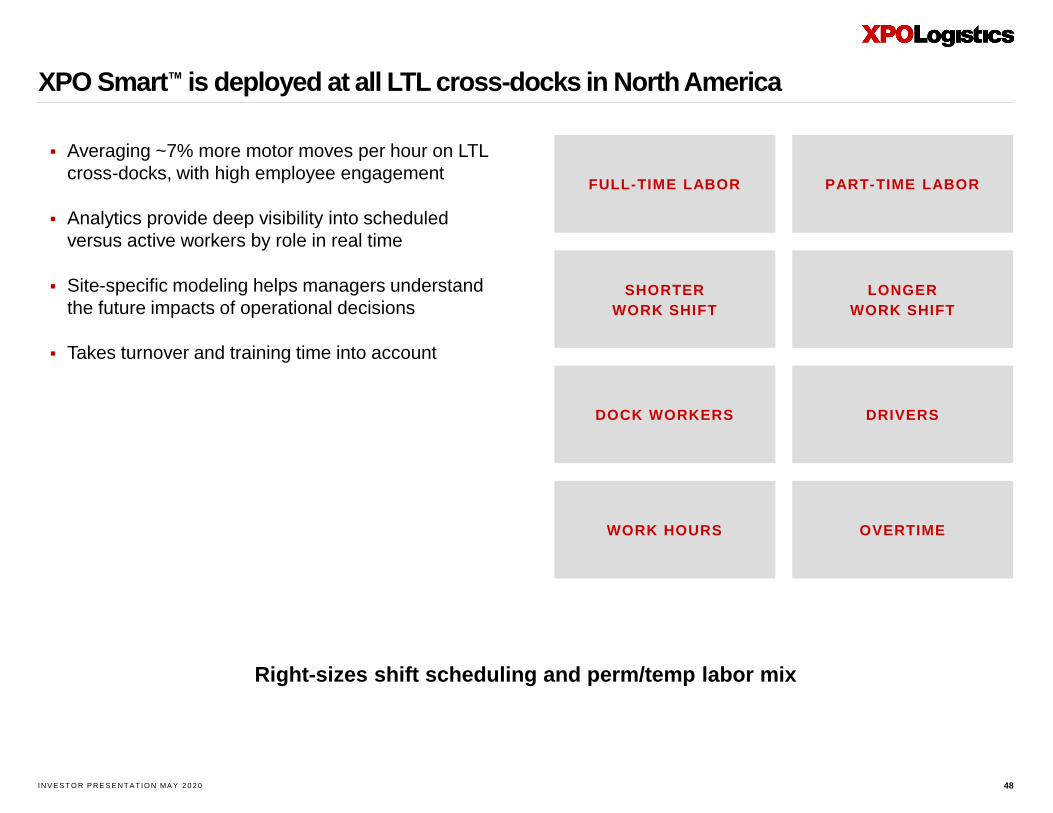
XPO Smart™ is deployed at all LTL cross-docks in North America
48
▪ Averaging ~7% more motor moves per hour on LTL
cross-docks, with high employee engagement
▪ Analytics provide deep visibility into scheduled
versus active workers by role in real time
▪ Site-specific modeling helps managers understand
the future impacts of operational decisions
▪ Takes turnover and training time into account
FULL-TIME LABOR PART-TIME LABOR
SHORTER
WORK SHIFT
LONGER
WORK SHIFT
DOCK WORKERS DRIVERS
WORK HOURS OVERTIME
Right-sizes shift scheduling and perm/temp labor mix
IN V E S T O R P R E S E N T AT IO N MA Y 2 0 2 0
Business overview:North American transportationTruck brokerage / expedite
Intermodal / drayage
Last mile
Managed transportation
IN V E S T O R P R E S E N T AT IO N MA Y 2 0 2 0
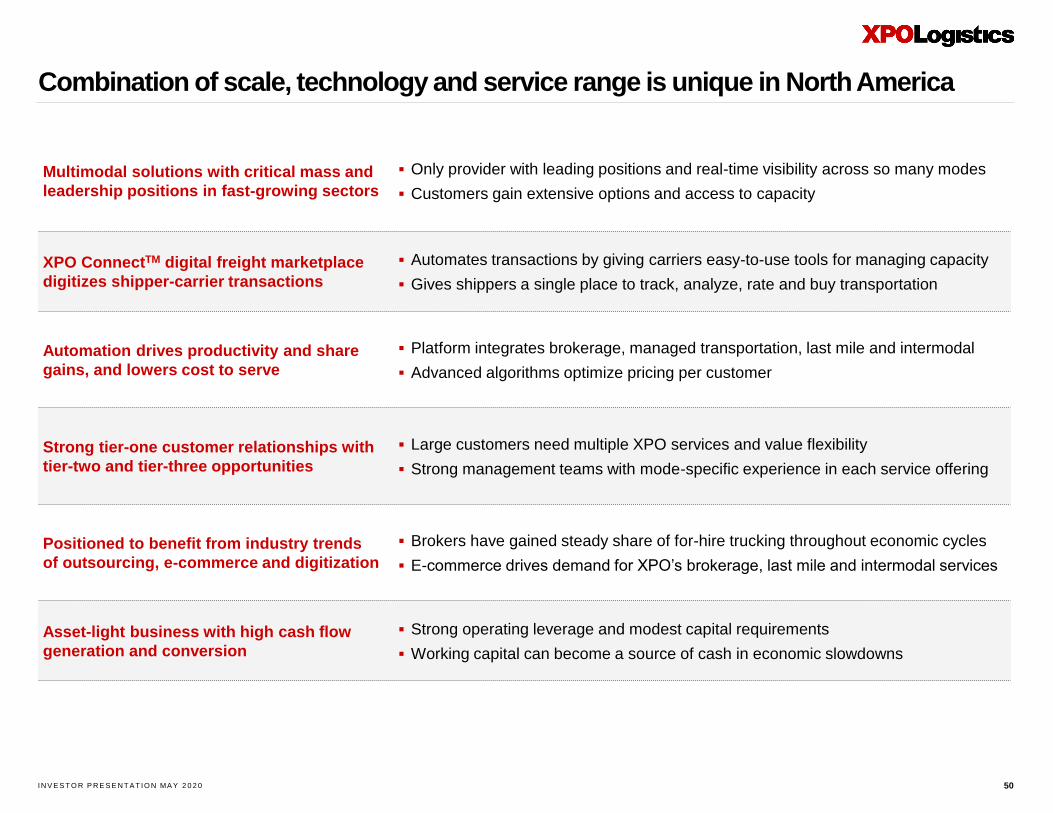
Combination of scale, technology and service range is unique in North America
50
Multimodal solutions with critical mass and
leadership positions in fast-growing sectors
▪ Only provider with leading positions and real-time visibility across so many modes
▪ Customers gain extensive options and access to capacity
XPO ConnectTM digital freight marketplace
digitizes shipper-carrier transactions
▪ Automates transactions by giving carriers easy-to-use tools for managing capacity
▪ Gives shippers a single place to track, analyze, rate and buy transportation
Automation drives productivity and share
gains, and lowers cost to serve
▪ Platform integrates brokerage, managed transportation, last mile and intermodal
▪ Advanced algorithms optimize pricing per customer
Strong tier-one customer relationships with
tier-two and tier-three opportunities
▪ Large customers need multiple XPO services and value flexibility
▪ Strong management teams with mode-specific experience in each service offering
Positioned to benefit from industry trends
of outsourcing, e-commerce and digitization
▪ Brokers have gained steady share of for-hire trucking throughout economic cycles
▪ E-commerce drives demand for XPO’s brokerage, last mile and intermodal services
Asset-light business with high cash flow
generation and conversion
▪ Strong operating leverage and modest capital requirements
▪ Working capital can become a source of cash in economic slowdowns
IN V E S T O R P R E S E N T AT IO N MA Y 2 0 2 0
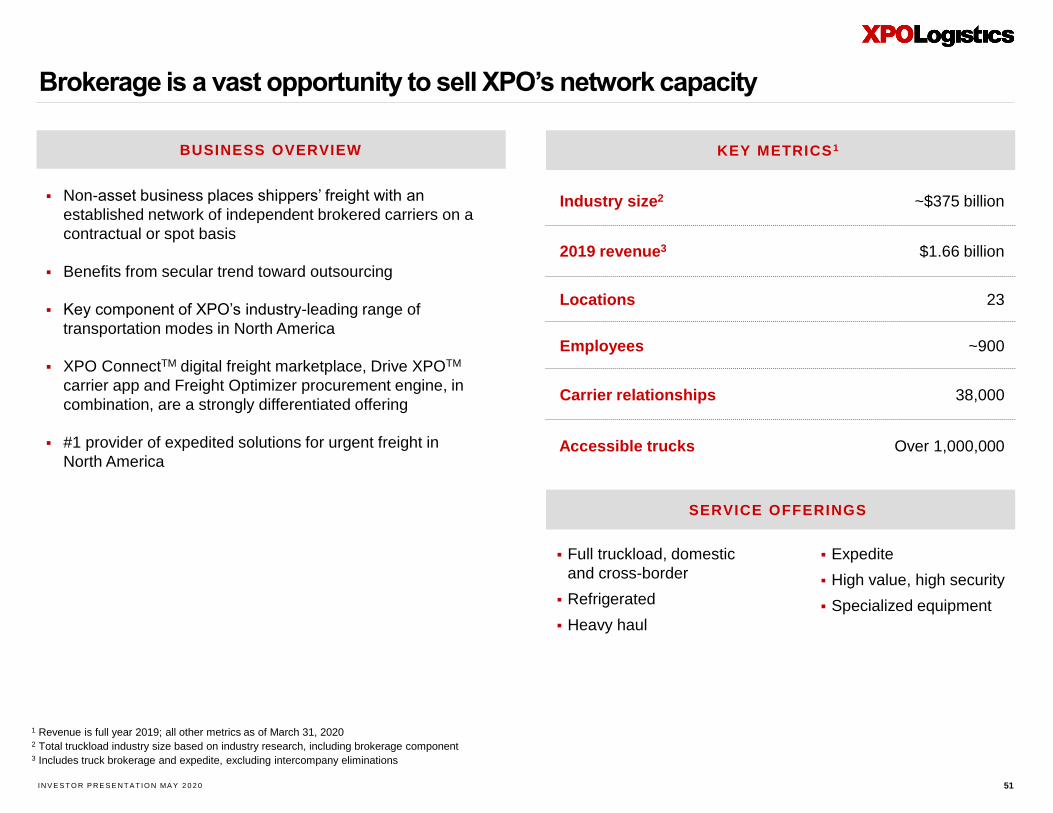
Brokerage is a vast opportunity to sell XPO’s network capacity
51
KEY METRICS1
Industry size2 ~$375 billion
2019 revenue3 $1.66 billion
Locations 23
Employees ~900
Carrier relationships 38,000
Accessible trucks Over 1,000,000
1 Revenue is full year 2019; all other metrics as of March 31, 20202 Total truckload industry size based on industry research, including brokerage component3 Includes truck brokerage and expedite, excluding intercompany eliminations
▪ Full truckload, domestic
and cross-border
▪ Refrigerated
▪ Heavy haul
SERVICE OFFERINGS
▪ Non-asset business places shippers’ freight with an
established network of independent brokered carriers on a
contractual or spot basis
▪ Benefits from secular trend toward outsourcing
▪ Key component of XPO’s industry-leading range of
transportation modes in North America
▪ XPO ConnectTM digital freight marketplace, Drive XPOTM
carrier app and Freight Optimizer procurement engine, in
combination, are a strongly differentiated offering
▪ #1 provider of expedited solutions for urgent freight in
North America
BUSINESS OVERVIEW
▪ Expedite
▪ High value, high security
▪ Specialized equipment
IN V E S T O R P R E S E N T AT IO N MA Y 2 0 2 0
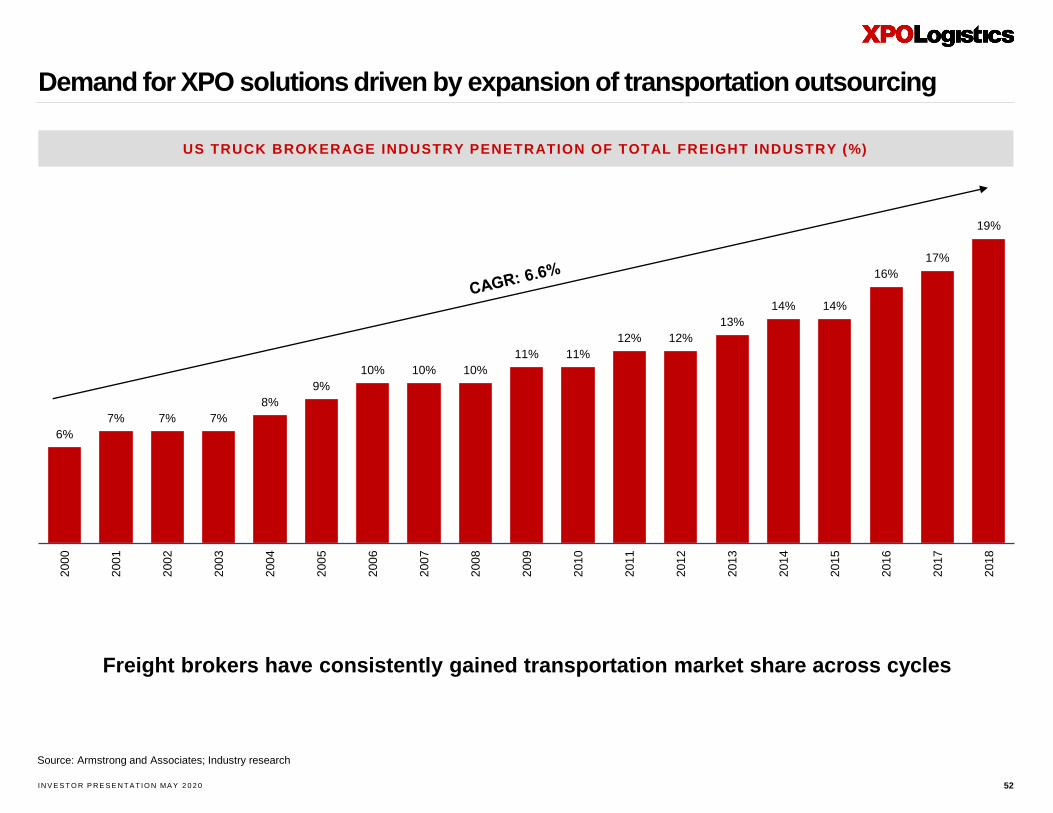
Demand for XPO solutions driven by expansion of transportation outsourcing
52
6%
7% 7% 7%
8%
9%
10% 10% 10%
11% 11%
12% 12%
13%
14% 14%
16%
17%
19%
200
0
200
1
200
2
200
3
200
4
200
5
200
6
200
7
200
8
200
9
201
0
201
1
201
2
201
3
201
4
201
5
201
6
201
7
201
8
US TRUCK BROKERAGE INDUSTRY PENETRATION OF TOTAL FREIGHT INDUSTRY (%)
Source: Armstrong and Associates; Industry research
Freight brokers have consistently gained transportation market share across cycles
IN V E S T O R P R E S E N T AT IO N MA Y 2 0 2 0
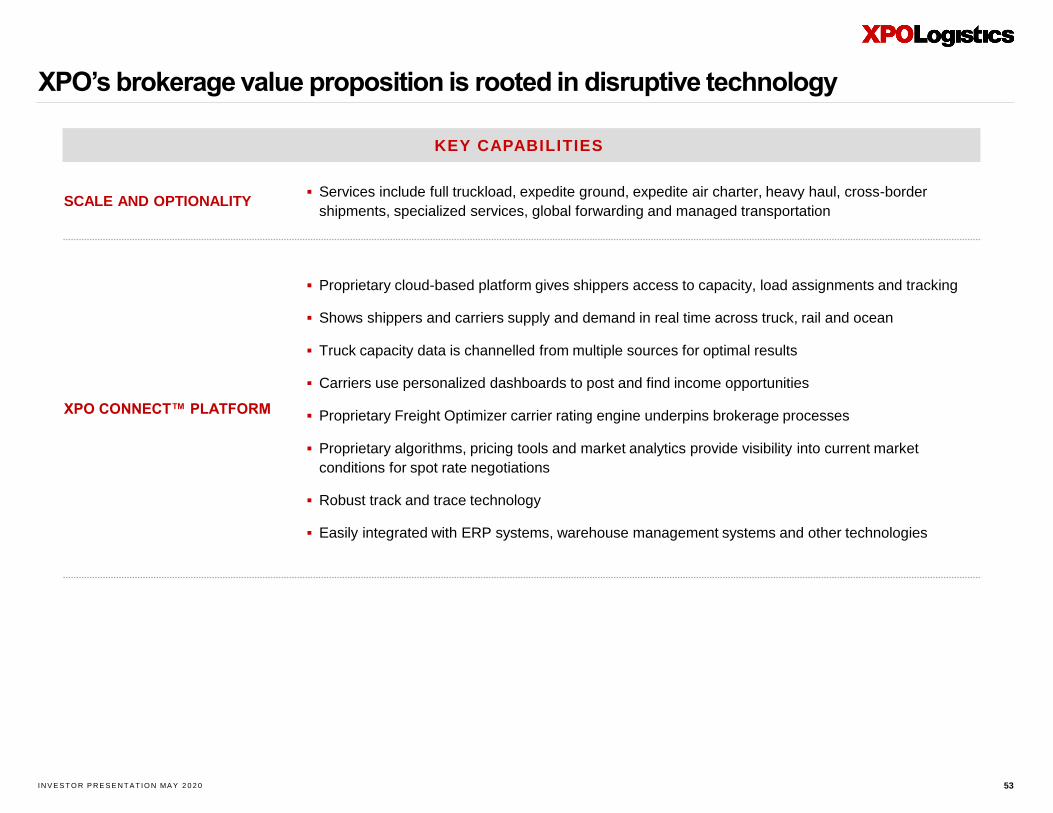
SCALE AND OPTIONALITY▪ Services include full truckload, expedite ground, expedite air charter, heavy haul, cross-border
shipments, specialized services, global forwarding and managed transportation
XPO CONNECT™ PLATFORM
▪ Proprietary cloud-based platform gives shippers access to capacity, load assignments and tracking
▪ Shows shippers and carriers supply and demand in real time across truck, rail and ocean
▪ Truck capacity data is channelled from multiple sources for optimal results
▪ Carriers use personalized dashboards to post and find income opportunities
▪ Proprietary Freight Optimizer carrier rating engine underpins brokerage processes
▪ Proprietary algorithms, pricing tools and market analytics provide visibility into current market
conditions for spot rate negotiations
▪ Robust track and trace technology
▪ Easily integrated with ERP systems, warehouse management systems and other technologies
XPO’s brokerage value proposition is rooted in disruptive technology
53
KEY CAPABILITIES

IN V E S T O R P R E S E N T AT IO N MA Y 2 0 2 0
Drives efficiency, volume and margin through cutting-edge connectivity
54
CUSTOMERSCARRIERS
DRIVE XPO™ APP
CARRIER INTERFACE
CARRIER MOBILE
INTERFACE
REAL-TIME
TRACKING ENGINE
CUSTOMER
INTERFACE
CUSTOMER MOBILE
INTERFACE
ROUTE OPTIMIZATION
FREIGHT
OPTIMIZATION
CONNECT LM
IN V E S T O R P R E S E N T AT IO N MA Y 2 0 2 0 55
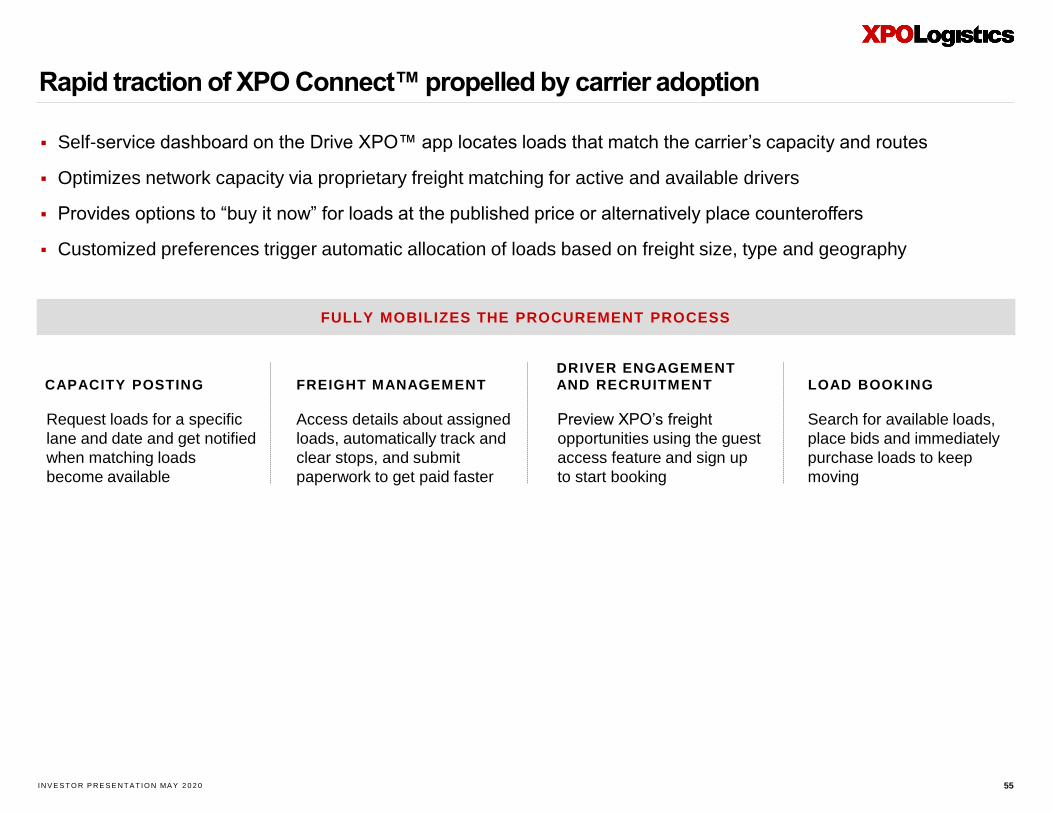
FULLY MOBILIZES THE PROCUREMENT PROCESS
Preview XPO’s freight
opportunities using the guest
access feature and sign up
to start booking
DRIVER ENGAGEMENT
AND RECRUITMENT
Search for available loads,
place bids and immediately
purchase loads to keep
moving
LOAD BOOKING
Request loads for a specific
lane and date and get notified
when matching loads
become available
CAPACITY POSTING
Access details about assigned
loads, automatically track and
clear stops, and submit
paperwork to get paid faster
FREIGHT MANAGEMENT
Rapid traction of XPO Connect™ propelled by carrier adoption
▪ Self-service dashboard on the Drive XPO™ app locates loads that match the carrier’s capacity and routes
▪ Optimizes network capacity via proprietary freight matching for active and available drivers
▪ Provides options to “buy it now” for loads at the published price or alternatively place counteroffers
▪ Customized preferences trigger automatic allocation of loads based on freight size, type and geography
IN V E S T O R P R E S E N T AT IO N MA Y 2 0 2 0
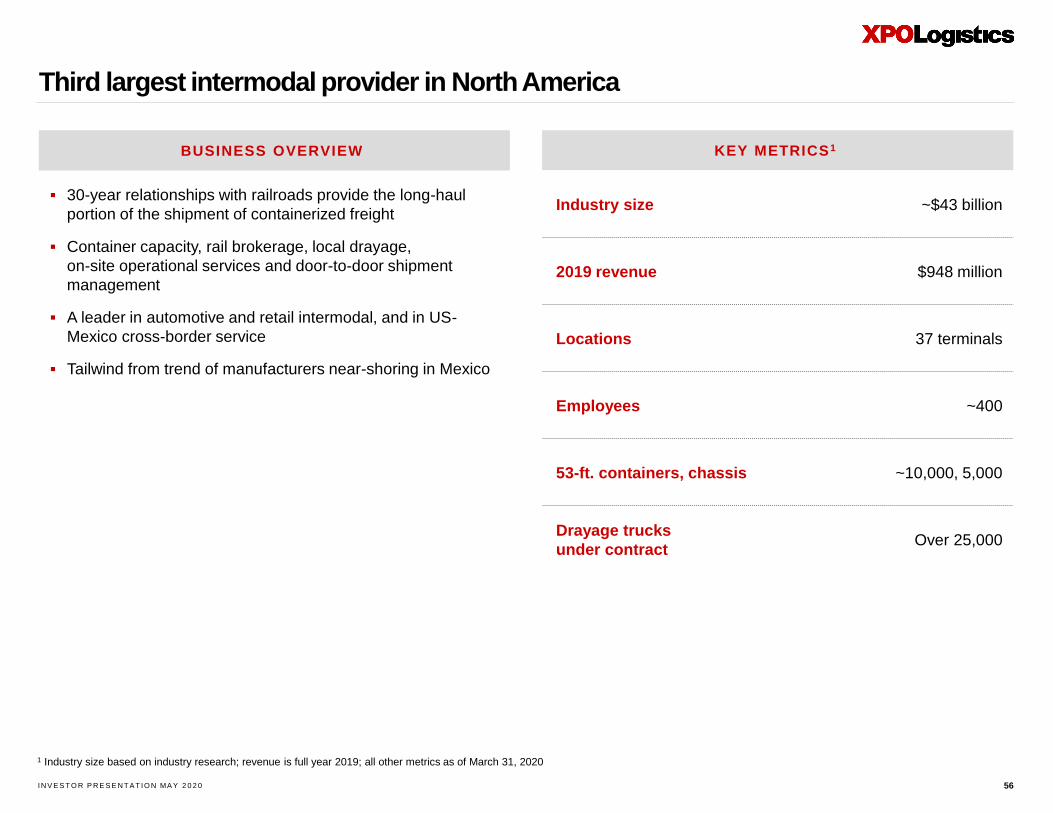
Third largest intermodal provider in North America
56
Industry size ~$43 billion
2019 revenue $948 million
Locations 37 terminals
Employees ~400
53-ft. containers, chassis ~10,000, 5,000
Drayage trucks
under contractOver 25,000
KEY METRICS1
▪ 30-year relationships with railroads provide the long-haul
portion of the shipment of containerized freight
▪ Container capacity, rail brokerage, local drayage,
on-site operational services and door-to-door shipment
management
▪ A leader in automotive and retail intermodal, and in US-
Mexico cross-border service
▪ Tailwind from trend of manufacturers near-shoring in Mexico
BUSINESS OVERVIEW
1 Industry size based on industry research; revenue is full year 2019; all other metrics as of March 31, 2020
IN V E S T O R P R E S E N T AT IO N MA Y 2 0 2 0
Unique competitive advantages differentiate XPO’s intermodal offering
57
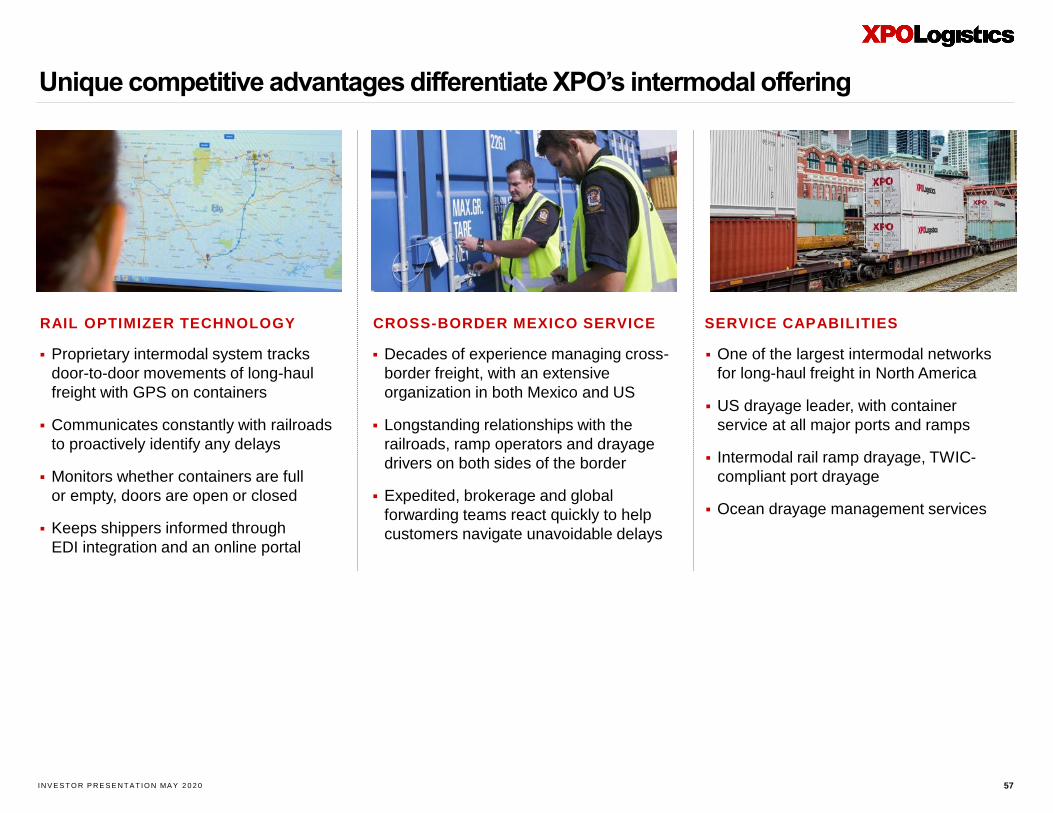
▪ Proprietary intermodal system tracks
door-to-door movements of long-haul
freight with GPS on containers
▪ Communicates constantly with railroads
to proactively identify any delays
▪ Monitors whether containers are full
or empty, doors are open or closed
▪ Keeps shippers informed through
EDI integration and an online portal
▪ Decades of experience managing cross-
border freight, with an extensive
organization in both Mexico and US
▪ Longstanding relationships with the
railroads, ramp operators and drayage
drivers on both sides of the border
▪ Expedited, brokerage and global
forwarding teams react quickly to help
customers navigate unavoidable delays
▪ One of the largest intermodal networks
for long-haul freight in North America
▪ US drayage leader, with container
service at all major ports and ramps
▪ Intermodal rail ramp drayage, TWIC-
compliant port drayage
▪ Ocean drayage management services
RAIL OPTIMIZER TECHNOLOGY CROSS-BORDER MEXICO SERVICE SERVICE CAPABILITIES
IN V E S T O R P R E S E N T AT IO N MA Y 2 0 2 0
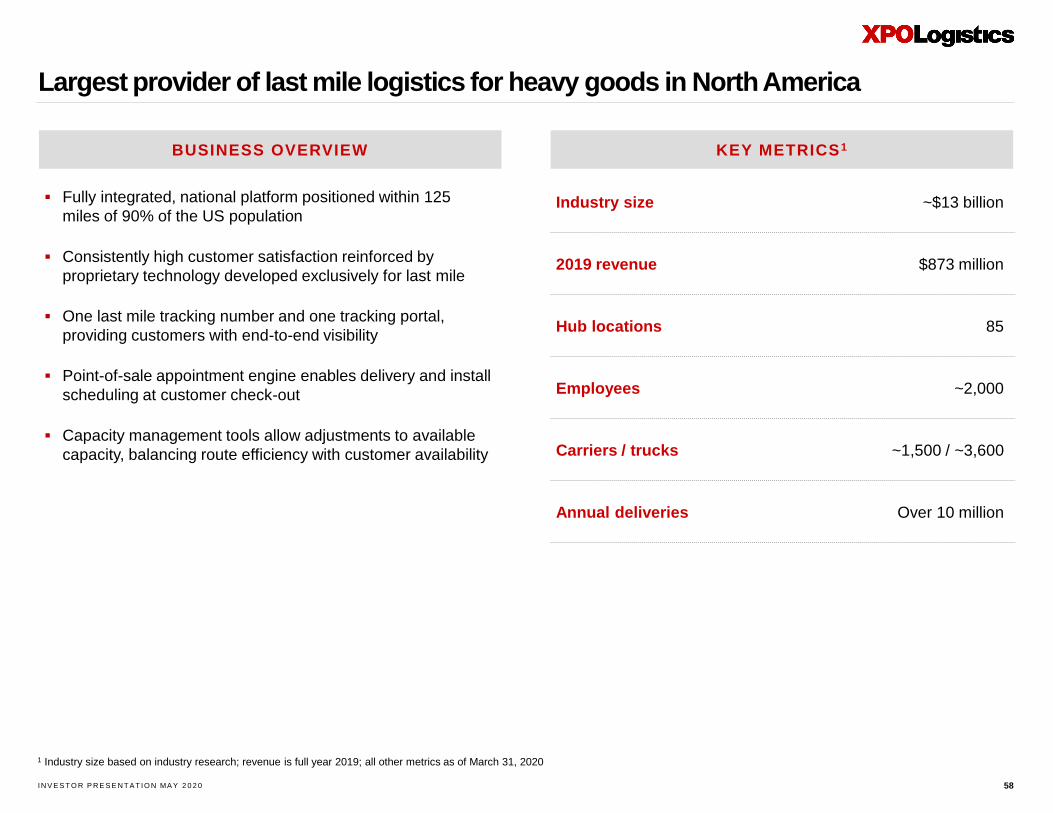
Largest provider of last mile logistics for heavy goods in North America
58
Industry size ~$13 billion
2019 revenue $873 million
Hub locations 85
Employees ~2,000
Carriers / trucks ~1,500 / ~3,600
Annual deliveries Over 10 million
▪ Fully integrated, national platform positioned within 125
miles of 90% of the US population
▪ Consistently high customer satisfaction reinforced by
proprietary technology developed exclusively for last mile
▪ One last mile tracking number and one tracking portal,
providing customers with end-to-end visibility
▪ Point-of-sale appointment engine enables delivery and install
scheduling at customer check-out
▪ Capacity management tools allow adjustments to available
capacity, balancing route efficiency with customer availability
BUSINESS OVERVIEW KEY METRICS1
1 Industry size based on industry research; revenue is full year 2019; all other metrics as of March 31, 2020
IN V E S T O R P R E S E N T AT IO N MA Y 2 0 2 0
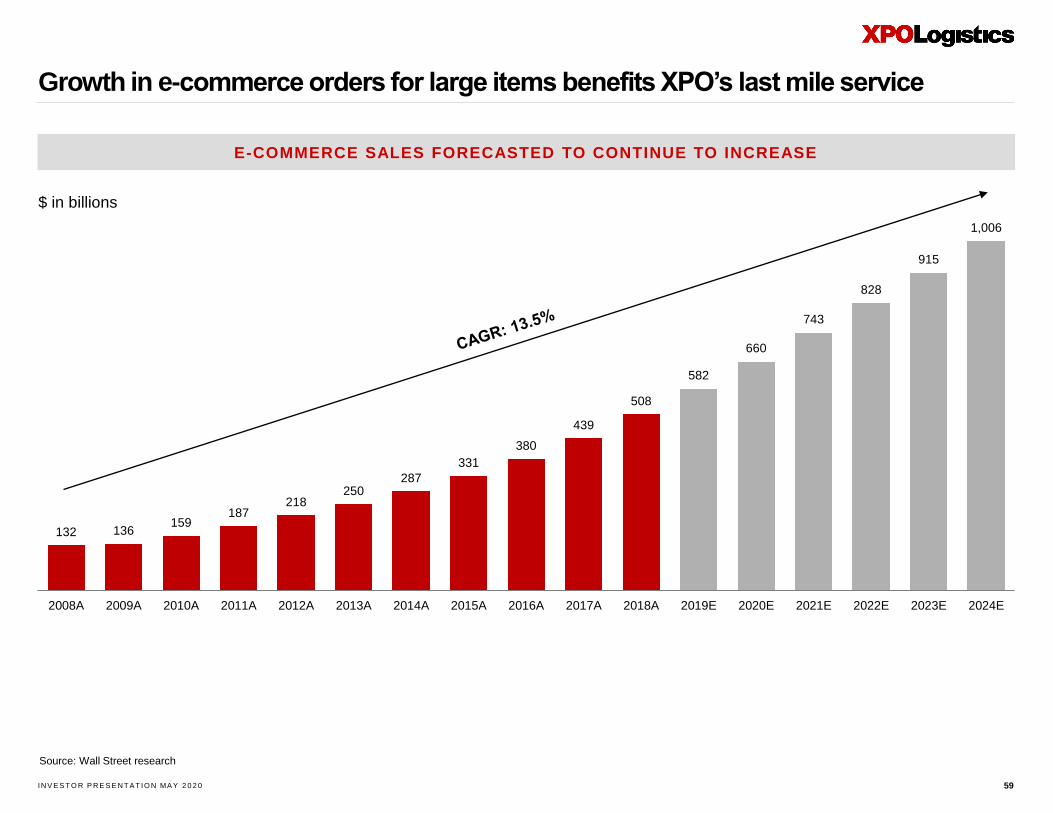
Growth in e-commerce orders for large items benefits XPO’s last mile service
59
132 136 159
187 218
250 287
331
380
439
508
582
660
743
828
915
1,006
2008A 2009A 2010A 2011A 2012A 2013A 2014A 2015A 2016A 2017A 2018A 2019E 2020E 2021E 2022E 2023E 2024E
E-COMMERCE SALES FORECASTED TO CONTINUE TO INCREASE
$ in billions
Source: Wall Street research
IN V E S T O R P R E S E N T AT IO N MA Y 2 0 2 0
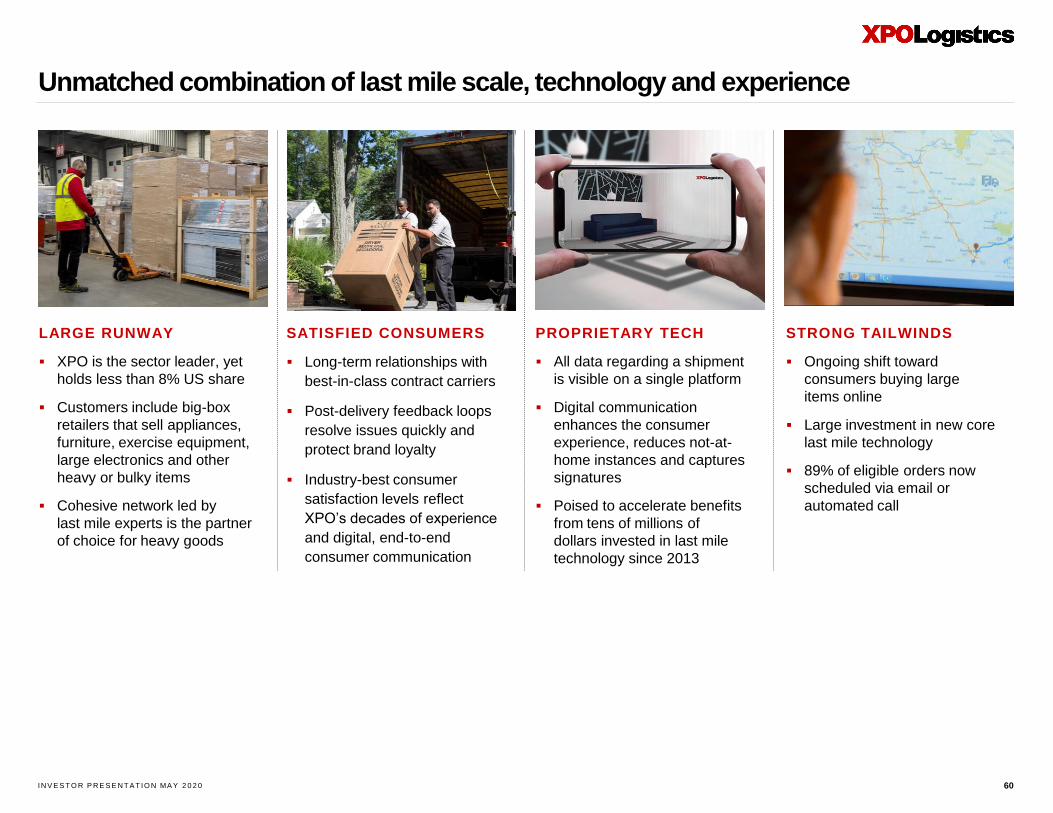
Unmatched combination of last mile scale, technology and experience
60
▪ Long-term relationships with
best-in-class contract carriers
▪ Post-delivery feedback loops
resolve issues quickly and
protect brand loyalty
▪ Industry-best consumer
satisfaction levels reflect
XPO’s decades of experience
and digital, end-to-end
consumer communication
▪ XPO is the sector leader, yet
holds less than 8% US share
▪ Customers include big-box
retailers that sell appliances,
furniture, exercise equipment,
large electronics and other
heavy or bulky items
▪ Cohesive network led by
last mile experts is the partner
of choice for heavy goods
▪ All data regarding a shipment
is visible on a single platform
▪ Digital communication
enhances the consumer
experience, reduces not-at-
home instances and captures
signatures
▪ Poised to accelerate benefits
from tens of millions of
dollars invested in last mile
technology since 2013
▪ Ongoing shift toward
consumers buying large
items online
▪ Large investment in new core
last mile technology
▪ 89% of eligible orders now
scheduled via email or
automated call
LARGE RUNWAY SATISFIED CONSUMERS PROPRIETARY TECH STRONG TAILWINDS
IN V E S T O R P R E S E N T AT IO N MA Y 2 0 2 0
Top five global provider of managed transportation
61
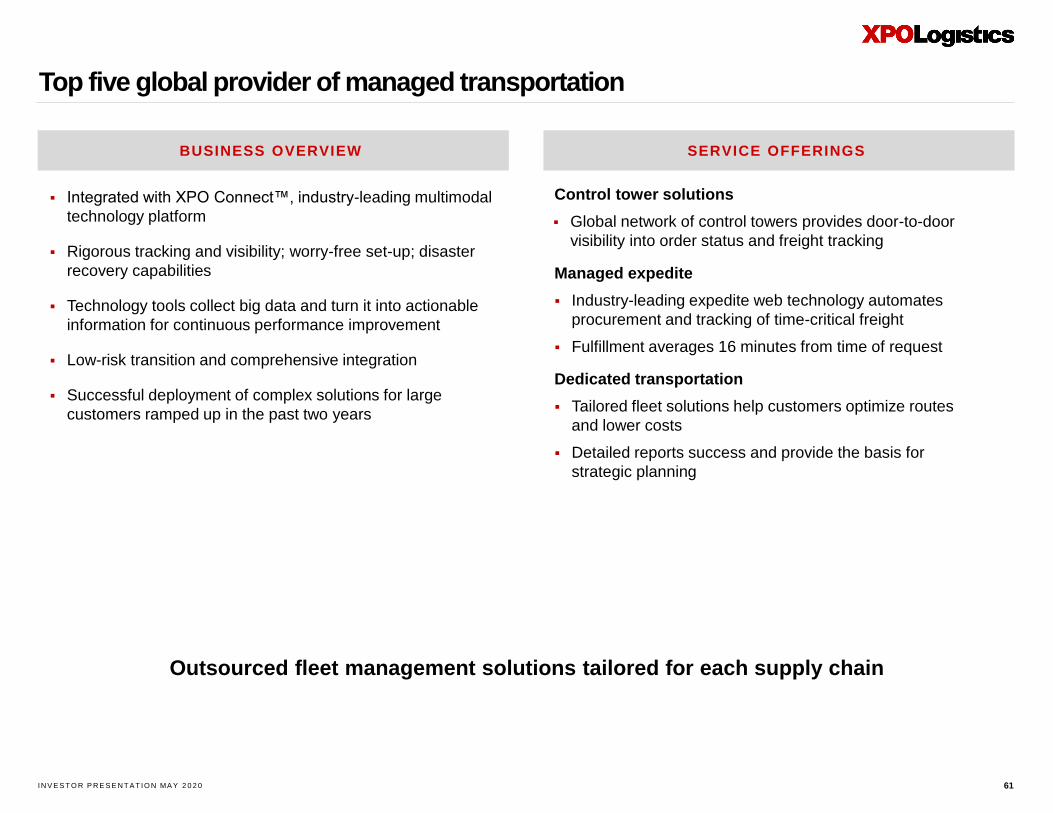
▪ Integrated with XPO Connect™, industry-leading multimodal
technology platform
▪ Rigorous tracking and visibility; worry-free set-up; disaster
recovery capabilities
▪ Technology tools collect big data and turn it into actionable
information for continuous performance improvement
▪ Low-risk transition and comprehensive integration
▪ Successful deployment of complex solutions for large
customers ramped up in the past two years
Control tower solutions
▪ Global network of control towers provides door-to-door
visibility into order status and freight tracking
Managed expedite
▪ Industry-leading expedite web technology automates
procurement and tracking of time-critical freight
▪ Fulfillment averages 16 minutes from time of request
Dedicated transportation
▪ Tailored fleet solutions help customers optimize routes
and lower costs
▪ Detailed reports success and provide the basis for
strategic planning
BUSINESS OVERVIEW SERVICE OFFERINGS
Outsourced fleet management solutions tailored for each supply chain
IN V E S T O R P R E S E N T AT IO N MA Y 2 0 2 0
Business overview:European transportationTruck brokerage
Dedicated truckload
Less-than-truckload
Managed transportation
Last mile
IN V E S T O R P R E S E N T AT IO N MA Y 2 0 2 0
Leading positions in fast-growing sectors
63
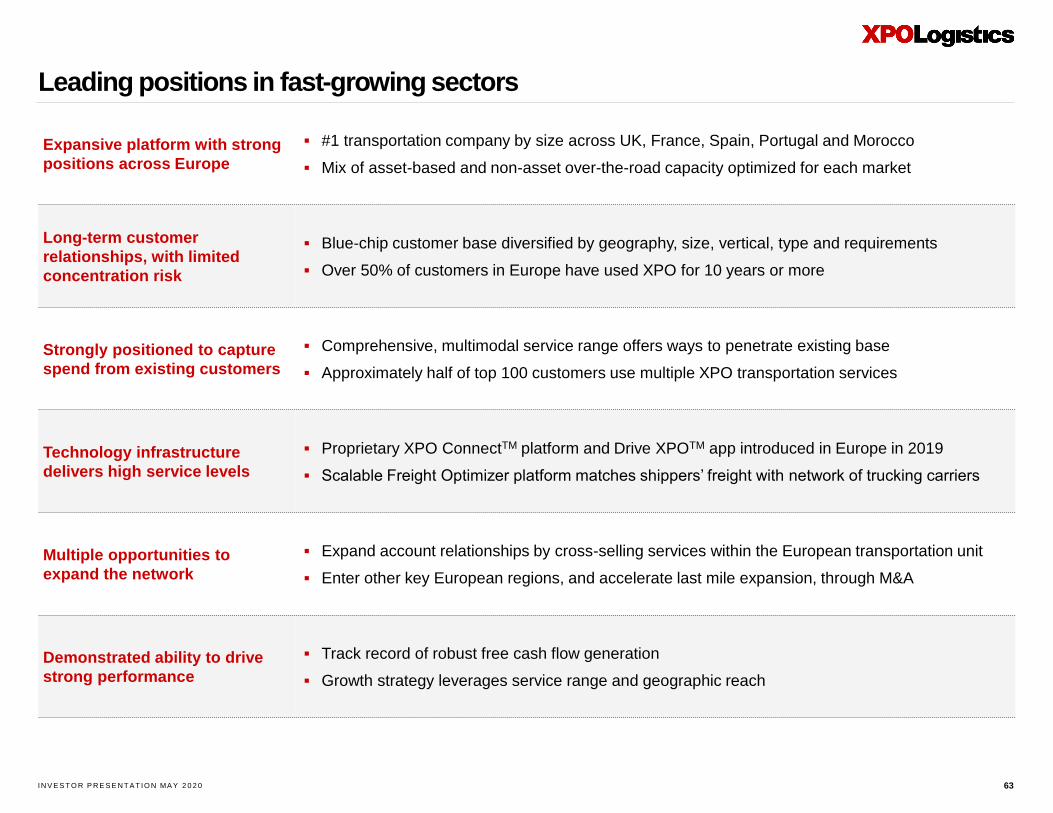
Expansive platform with strong
positions across Europe
▪ #1 transportation company by size across UK, France, Spain, Portugal and Morocco
▪ Mix of asset-based and non-asset over-the-road capacity optimized for each market
Long-term customer
relationships, with limited
concentration risk
▪ Blue-chip customer base diversified by geography, size, vertical, type and requirements
▪ Over 50% of customers in Europe have used XPO for 10 years or more
Strongly positioned to capture
spend from existing customers
▪ Comprehensive, multimodal service range offers ways to penetrate existing base
▪ Approximately half of top 100 customers use multiple XPO transportation services
Technology infrastructure
delivers high service levels
▪ Proprietary XPO ConnectTM platform and Drive XPOTM app introduced in Europe in 2019
▪ Scalable Freight Optimizer platform matches shippers’ freight with network of trucking carriers
Multiple opportunities to
expand the network
▪ Expand account relationships by cross-selling services within the European transportation unit
▪ Enter other key European regions, and accelerate last mile expansion, through M&A
Demonstrated ability to drive
strong performance
▪ Track record of robust free cash flow generation
▪ Growth strategy leverages service range and geographic reach
IN V E S T O R P R E S E N T AT IO N MA Y 2 0 2 0
Leading provider of truck brokerage and LTL transportation in Europe
64
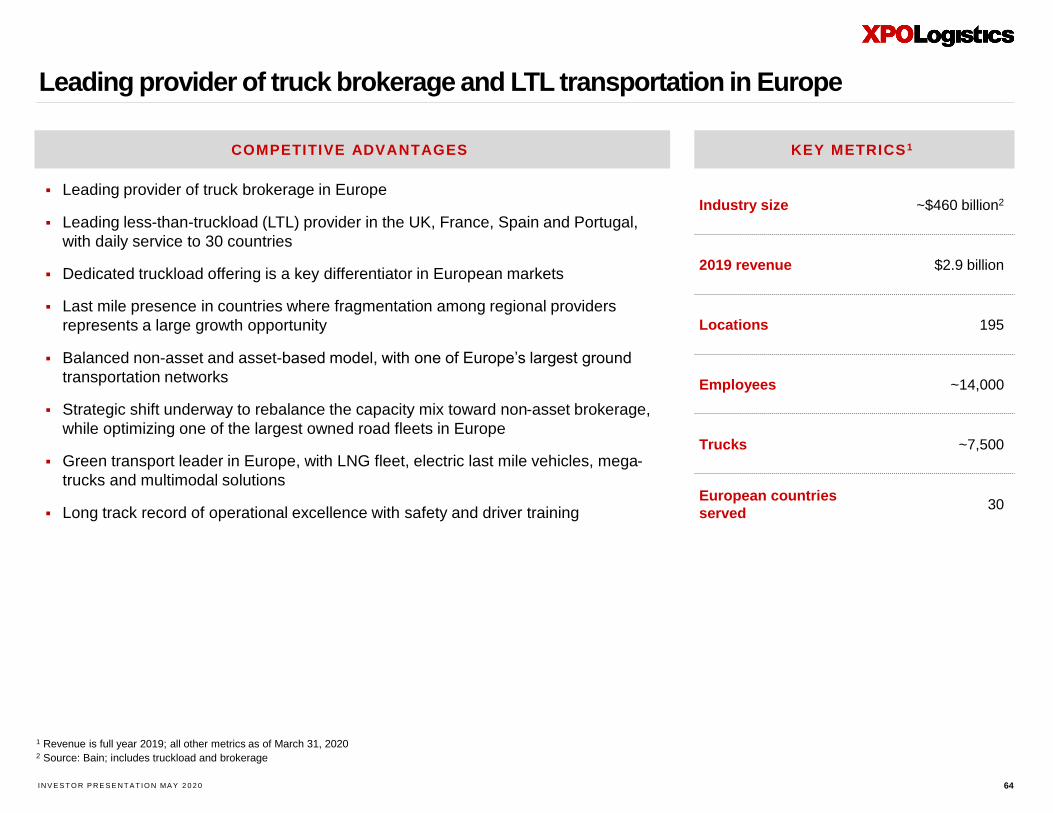
▪ Leading provider of truck brokerage in Europe
▪ Leading less-than-truckload (LTL) provider in the UK, France, Spain and Portugal,
with daily service to 30 countries
▪ Dedicated truckload offering is a key differentiator in European markets
▪ Last mile presence in countries where fragmentation among regional providers
represents a large growth opportunity
▪ Balanced non-asset and asset-based model, with one of Europe’s largest ground
transportation networks
▪ Strategic shift underway to rebalance the capacity mix toward non-asset brokerage,
while optimizing one of the largest owned road fleets in Europe
▪ Green transport leader in Europe, with LNG fleet, electric last mile vehicles, mega-
trucks and multimodal solutions
▪ Long track record of operational excellence with safety and driver training
Industry size ~$460 billion2
2019 revenue $2.9 billion
Locations 195
Employees ~14,000
Trucks ~7,500
European countries
served30
KEY METRICS1COMPETITIVE ADVANTAGES
1 Revenue is full year 2019; all other metrics as of March 31, 20202 Source: Bain; includes truckload and brokerage

IN V E S T O R P R E S E N T AT IO N MA Y 2 0 2 0
TAILORED GROWTH STRATEGIES FOR XPO’S LARGEST MARKETS BY % OF REVENUE 1
XPO’s transportation network covers over 90% of Europe’s GDP
65
FRANCE
UNITED
KINGDOM
AND IRELAND
SPAIN AND
PORTUGAL
26%
17%
46%
▪ Blended model of XPO-owned trucks and contracted independent
carriers for less-than-truckload
▪ Last mile logistics offering for heavy goods
▪ Non-dedicated truckload business being phased out and replaced by
truck brokerage, which is demonstrating strong growth
▪ Rapid growth of dedicated truckload being driven by increasing
business from large contracts
▪ XPO-owned trucks and employee drivers
▪ Last mile logistics offering for heavy goods
▪ Overnight distribution service for auto dealer networks
▪ Independent carrier contractors utilize XPO-branded equipment
▪ Last mile service provided as a subcontracted model
▪ LTL and brokerage models in strong deployment
1 Full year 2019 data
IN V E S T O R P R E S E N T AT IO N MA Y 2 0 2 0
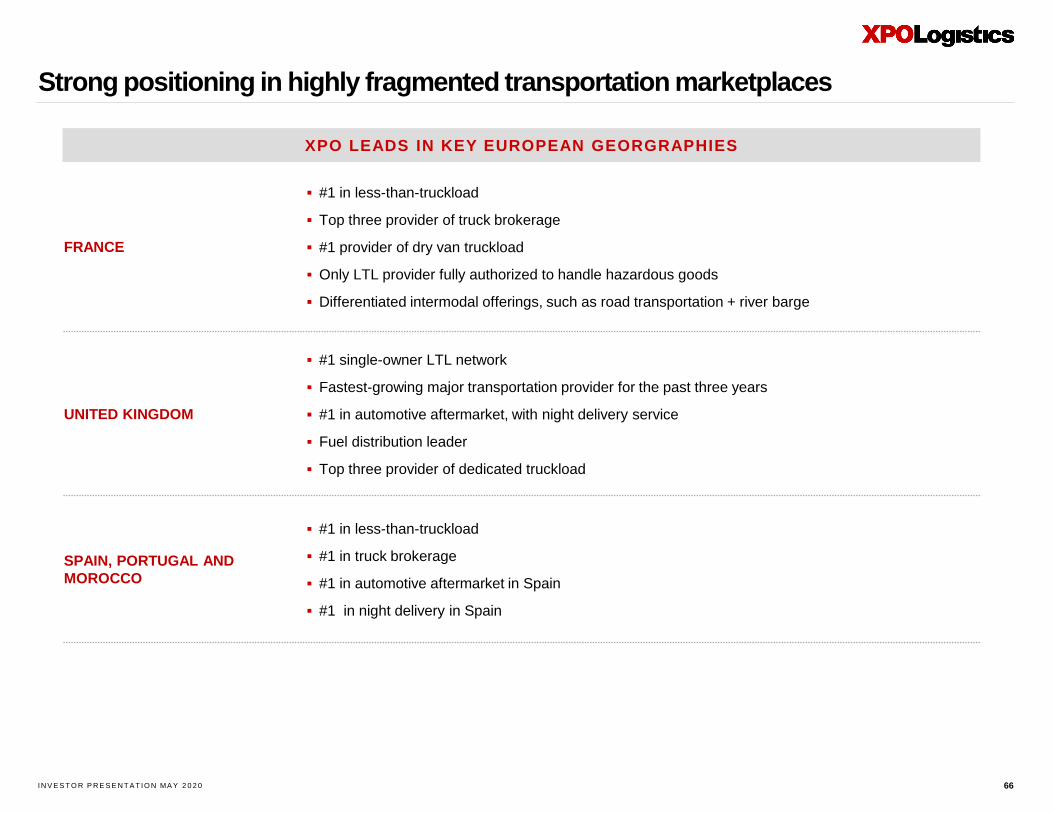
FRANCE
▪ #1 in less-than-truckload
▪ Top three provider of truck brokerage
▪ #1 provider of dry van truckload
▪ Only LTL provider fully authorized to handle hazardous goods
▪ Differentiated intermodal offerings, such as road transportation + river barge
UNITED KINGDOM
▪ #1 single-owner LTL network
▪ Fastest-growing major transportation provider for the past three years
▪ #1 in automotive aftermarket, with night delivery service
▪ Fuel distribution leader
▪ Top three provider of dedicated truckload
SPAIN, PORTUGAL AND
MOROCCO
▪ #1 in less-than-truckload
▪ #1 in truck brokerage
▪ #1 in automotive aftermarket in Spain
▪ #1 in night delivery in Spain
Strong positioning in highly fragmented transportation marketplaces
66
XPO LEADS IN KEY EUROPEAN GEORGRAPHIES
IN V E S T O R P R E S E N T AT IO N MA Y 2 0 2 0
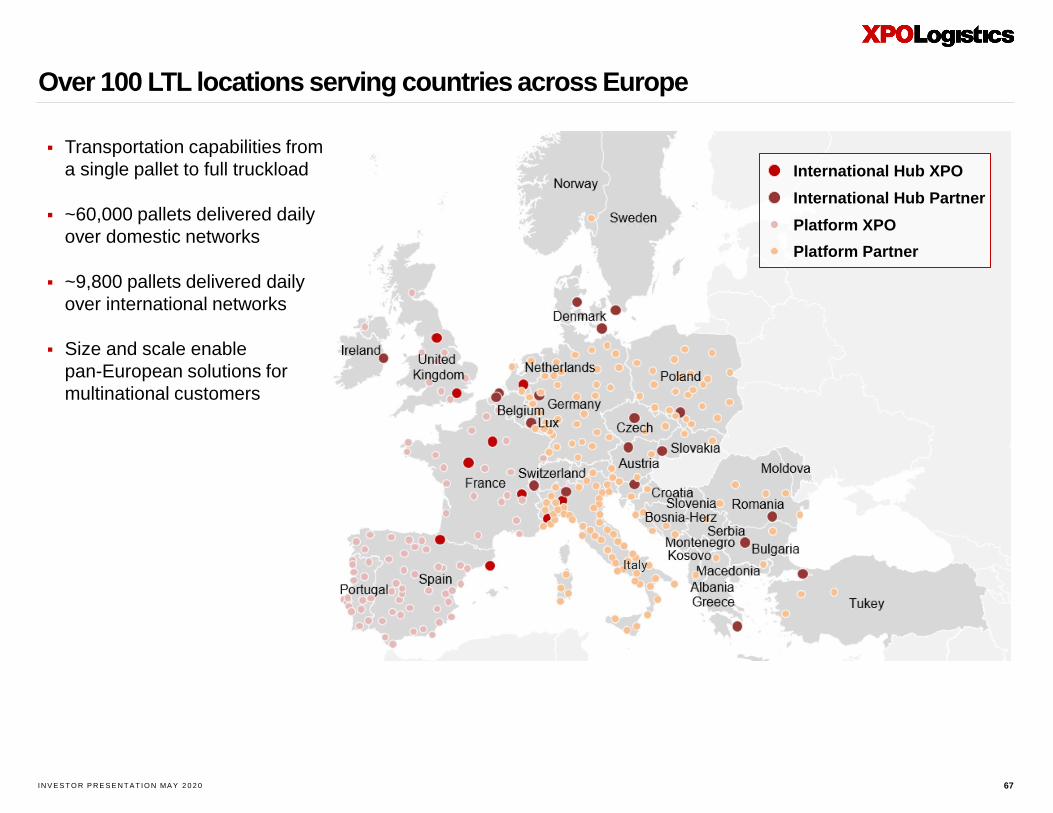
Over 100 LTL locations serving countries across Europe
67
International Hub XPO
International Hub Partner
Platform XPO
Platform Partner
▪ Transportation capabilities from
a single pallet to full truckload
▪ ~60,000 pallets delivered daily
over domestic networks
▪ ~9,800 pallets delivered daily
over international networks
▪ Size and scale enable
pan-European solutions for
multinational customers
IN V E S T O R P R E S E N T AT IO N MA Y 2 0 2 0
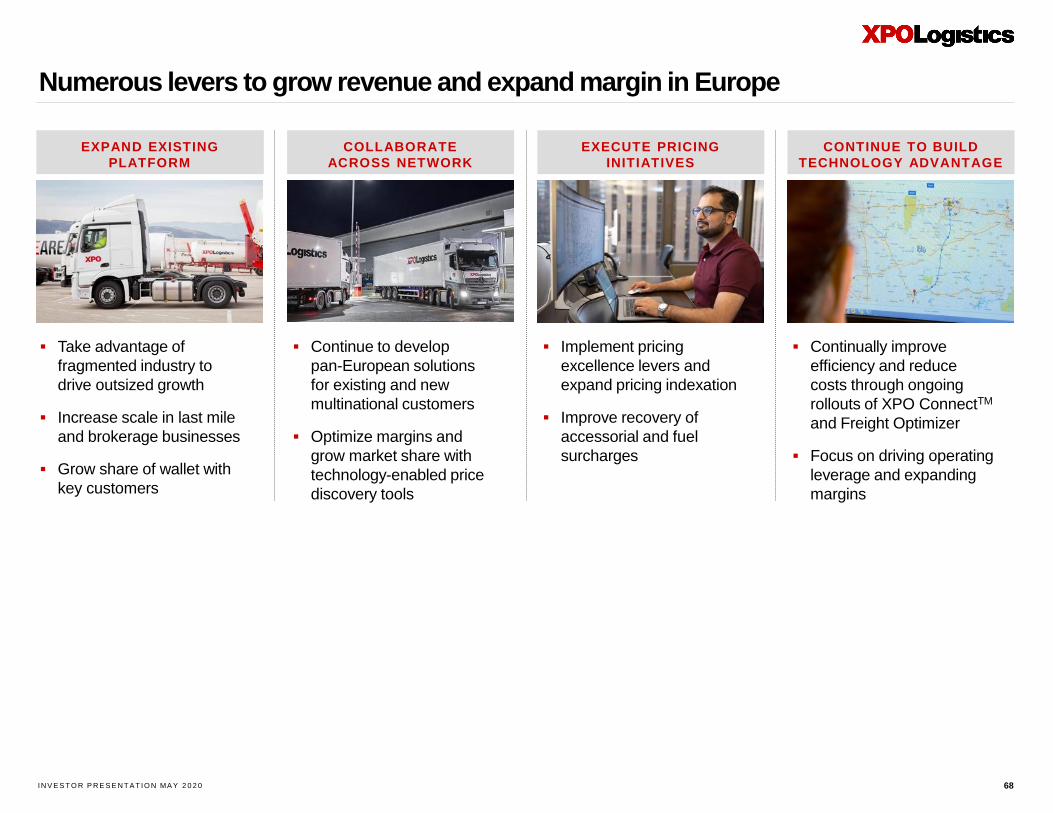
Numerous levers to grow revenue and expand margin in Europe
EXPAND EXISTING
PLATFORM
COLLABORATE
ACROSS NETWORK
CONTINUE TO BUILD
TECHNOLOGY ADVANTAGE
EXECUTE PRICING
INITIATIVES
▪ Take advantage of
fragmented industry to
drive outsized growth
▪ Increase scale in last mile
and brokerage businesses
▪ Grow share of wallet with
key customers
▪ Continue to develop
pan-European solutions
for existing and new
multinational customers
▪ Optimize margins and
grow market share with
technology-enabled price
discovery tools
▪ Implement pricing
excellence levers and
expand pricing indexation
▪ Improve recovery of
accessorial and fuel
surcharges
▪ Continually improve
efficiency and reduce
costs through ongoing
rollouts of XPO ConnectTM
and Freight Optimizer
▪ Focus on driving operating
leverage and expanding
margins
68

IN V E S T O R P R E S E N T AT IO N MA Y 2 0 2 0
Investor highlights: Key factors driving growth and returns
69
Leading positions in fast-growing sectors▪ Top three industry positions across all major service lines in transportation and logistics
▪ Outsized exposure to sectors with track records of long-term growth and sustained demand
~$700 million to $1 billion pool of company-
specific profit growth opportunities
▪ Four revenue levers: pricing analytics, XPO Connect™, XPO Direct™ and European cross-selling
▪ Six cost levers include XPO Smart™, LTL optimization and logistics automation, among others
Strong, multimodal presence in
high-growth e-commerce / omnichannel
▪ Largest e-fulfillment 3PL in Europe; complex management of reverse logistics
▪ Largest provider of last mile logistics for heavy goods in North America
Opportunistic allocators of capital for M&A
and organic growth drivers
▪ Less than 2% share across key global markets
▪ Positioned as an expert provider of sophisticated supply chain solutions at scale
Fast pace of technological innovation ▪ Proprietary technology harnesses AI and machine learning
▪ Key areas of focus: warehouse automation, digital freight marketplace and data science
Substantial advantages of scale ▪ Operating leverage, purchasing power, cross-selling and capacity to innovate
▪ Ability to provide consistent, multinational solutions to global customers
Significant cash generation▪ 69% of revenue is asset-light, 77% of cost basis is variable
▪ Generated cash flow from operations of $791 million and free cash flow of $628 million in 2019
Ability to outperform the macro▪ Deep expertise in diverse verticals and geographies
▪ High mix of contracted business adds resilience in economic downturns
Positive free cash flow in downturns▪ Ability to modulate capex with cyclical fluctuations; low maintenance capex
▪ Working capital becomes a source of cash in downturns
Unduplicated moat of results-oriented
innovators
▪ 35 top executives and 2,500 professionals at the next level with blue-chip experience
▪ Technologists, managers, engineers, logisticians and operators driving every line of business
Note: Refer to the “Non-GAAP Financial Measures” section on page 2 of this document

IN V E S T O R P R E S E N T AT IO N MA Y 2 0 2 0
Supplementalmaterials
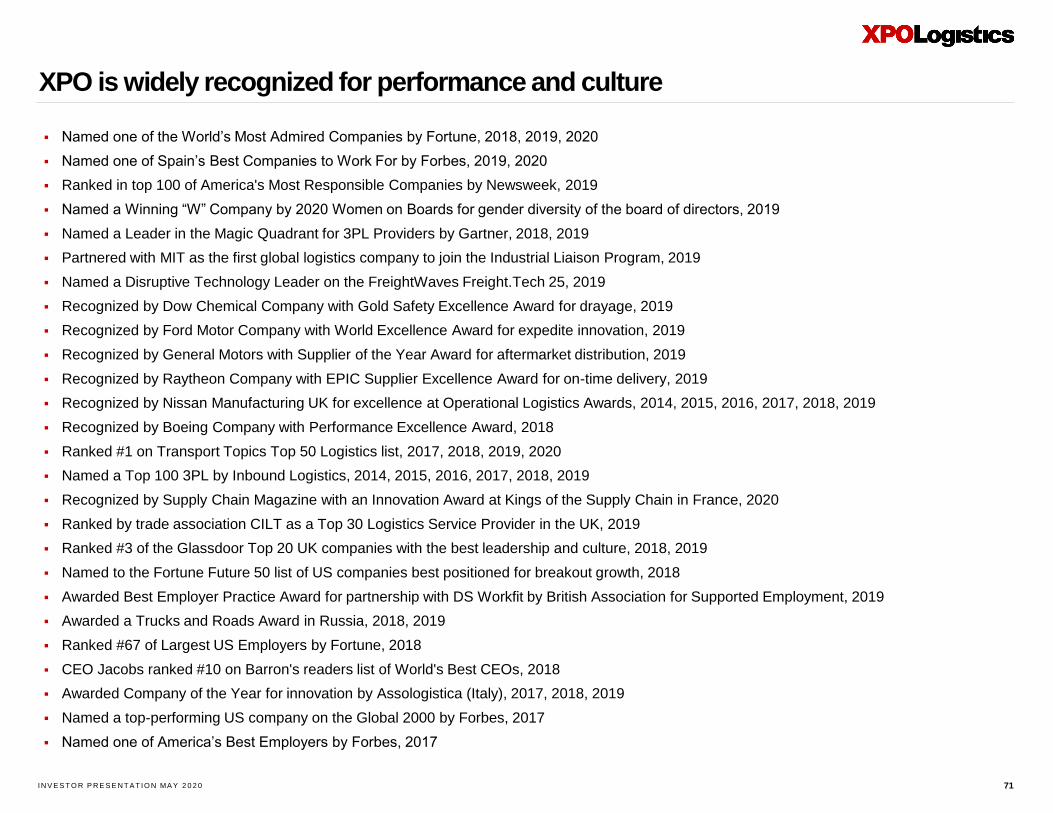
IN V E S T O R P R E S E N T AT IO N MA Y 2 0 2 0
XPO is widely recognized for performance and culture
71
▪ Named one of the World’s Most Admired Companies by Fortune, 2018, 2019, 2020
▪ Named one of Spain’s Best Companies to Work For by Forbes, 2019, 2020
▪ Ranked in top 100 of America's Most Responsible Companies by Newsweek, 2019
▪ Named a Winning “W” Company by 2020 Women on Boards for gender diversity of the board of directors, 2019
▪ Named a Leader in the Magic Quadrant for 3PL Providers by Gartner, 2018, 2019
▪ Partnered with MIT as the first global logistics company to join the Industrial Liaison Program, 2019
▪ Named a Disruptive Technology Leader on the FreightWaves Freight.Tech 25, 2019
▪ Recognized by Dow Chemical Company with Gold Safety Excellence Award for drayage, 2019
▪ Recognized by Ford Motor Company with World Excellence Award for expedite innovation, 2019
▪ Recognized by General Motors with Supplier of the Year Award for aftermarket distribution, 2019
▪ Recognized by Raytheon Company with EPIC Supplier Excellence Award for on-time delivery, 2019
▪ Recognized by Nissan Manufacturing UK for excellence at Operational Logistics Awards, 2014, 2015, 2016, 2017, 2018, 2019
▪ Recognized by Boeing Company with Performance Excellence Award, 2018
▪ Ranked #1 on Transport Topics Top 50 Logistics list, 2017, 2018, 2019, 2020
▪ Named a Top 100 3PL by Inbound Logistics, 2014, 2015, 2016, 2017, 2018, 2019
▪ Recognized by Supply Chain Magazine with an Innovation Award at Kings of the Supply Chain in France, 2020
▪ Ranked by trade association CILT as a Top 30 Logistics Service Provider in the UK, 2019
▪ Ranked #3 of the Glassdoor Top 20 UK companies with the best leadership and culture, 2018, 2019
▪ Named to the Fortune Future 50 list of US companies best positioned for breakout growth, 2018
▪ Awarded Best Employer Practice Award for partnership with DS Workfit by British Association for Supported Employment, 2019
▪ Awarded a Trucks and Roads Award in Russia, 2018, 2019
▪ Ranked #67 of Largest US Employers by Fortune, 2018
▪ CEO Jacobs ranked #10 on Barron's readers list of World's Best CEOs, 2018
▪ Awarded Company of the Year for innovation by Assologistica (Italy), 2017, 2018, 2019
▪ Named a top-performing US company on the Global 2000 by Forbes, 2017
▪ Named one of America’s Best Employers by Forbes, 2017
IN V E S T O R P R E S E N T AT IO N MA Y 2 0 2 0
Highlights of XPO’s people-first culture in 2019
72
▪ Launched a partnership with a leading healthcare network for women and families to offer supplemental health services
from over 1,400 practitioners in 20 specialties through a virtual clinic
▪ Achieved a Recordable Incident Rate (RIR) of 1.176 in North American logistics operations, well below industry average
▪ Implemented five employee engagement surveys for hourly and salaried employees that generated 54,000 responses
subsequently reviewed by management, with numerous suggestions adopted as action plans
▪ Introduced a tuition reimbursement benefit to provide up to $5,250 annually for employees pursuing continuing education
▪ Partnered with the Susan G. Komen Foundation, a leading non-profit breast cancer organization, to engage employees
and encourage them to do routine testing
▪ Continued robust recruitment initiatives and received more than 64,000 online job applications per month
▪ Hired 50 young people from the XPO Graduate Program in Europe, bringing total program hires to 300
▪ Participated in the 2019 International Pride celebration in New York City with a float piloted by an XPO driver
XPO’S PREGNANCY CARE AND FAMILY BONDING BENEFITS ARE PROGRESSIVE IN ANY INDUSTRY
▪ Any XPO employee, male or female, receives up to six weeks of 100% paid postnatal leave as the primary caregiver
▪ Women receive up to 20 days of 100% paid prenatal leave for health and wellness
▪ “Automatic yes" pregnancy accommodations are granted on request; more extensive accommodations are easily
arranged with input from a doctor
▪ XPO guarantees that a woman will continue to be paid her regular base wage rate, and will remain eligible for wage
increases, while her pregnancy accommodations are in effect
▪ All program enhancements provided at no additional cost to employees
XPO’s latest Sustainability Report is available online at sustainability.xpo.com
IN V E S T O R P R E S E N T AT IO N MA Y 2 0 2 0
Strongly committed to sustainability in transportation and logistics
73
▪ XPO initiated collaborative research and development project with General State Administration of Spain to
capture data about environmental and safety performance of duo-trailer vehicles, 2020
▪ Renewed three-year commitment to the CO2 Charter in France, extending 10-year commitment to sustainability
▪ Awarded the label “Objectif CO2” for outstanding environmental performance of transport operations by the
French Ministry of the Environment and the French Environment and Energy Agency
▪ Named a Top 75 Green Supply Chain Partner by Inbound Logistics for 2016, 2017, 2018, 2019
▪ Large investments in fuel-efficient Freightliner Cascadia tractors in North America (EPA 2013-compliant and
GHG14-compliant SCR technology); and 100 Stralis Natural Power Euro VI tractors in Europe, which combine
liquified and compressed natural gas (LNG/CNG) to reduce NOx emissions below the Euro VI standard
▪ One of the most modern fleets in Europe: 98% compliant with Euro V, EEV and Euro VI standards, with an
average truck age of approximately three years
▪ Government-approved mega-trucks in Spain can reduce CO2 emissions up to 20%
▪ Drivers train in responsible eco-driving and fuel usage reduction techniques
▪ North American LTL locations implementing phased upgrades to LED lighting
▪ Experimenting with diesel alternatives such as diesel-electric hybrids; piloting zero-emission electric vans in
Europe for last mile service
CarbonNET, our proprietary, cloud-based calculator, helps our operations document
emission sources, activity data and CO2 calculations
TRANSPORTATION
IN V E S T O R P R E S E N T AT IO N MA Y 2 0 2 0
Strongly committed to sustainability in transportation and logistics (cont.)
74
▪ By the end of 2020, nearly 75% of XPO’s total space in Europe will operate LED lighting systems
▪ XPO’s warehouse of the future for Nestlé in the UK will begin operating in mid-2020, equipped with
environmentally friendly ammonia refrigeration systems, LED lighting, air-source heat pumps for
administration areas and rainwater harvesting
▪ Numerous XPO facilities are ISO14001-certified to high standards for environmental management
▪ Waste mitigation measures, such as electronic waybills and documentation, are instilled in daily operations
to reduce paper and other waste products
▪ Energy efficiency evaluations are performed prior to selecting warehouses to lease, and energy efficient
equipment is purchased when feasible
▪ 79% of material handling devices used in our logistics sites operate on battery power instead of fuel
▪ Millions of electronic components and batteries are recycled annually as a byproduct of reverse
logistics operations
▪ Packaging engineers ensure that the optimal carton size is used for each product slated for distribution
▪ Recycled packaging is purchased when feasible
▪ Reusable kitting tools are utilized for the installation of parts in customer operations, manufactured by XPO
We operate our business with high regard for the environment and our stakeholders
LOGISTICS
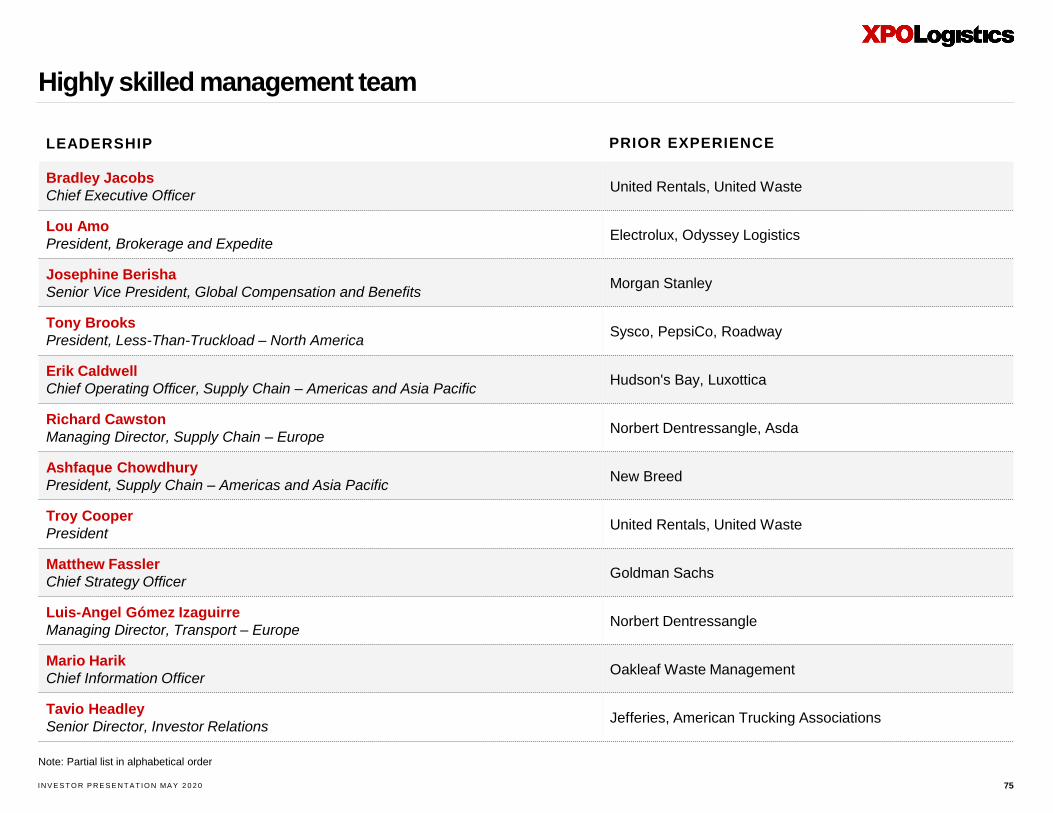
IN V E S T O R P R E S E N T AT IO N MA Y 2 0 2 0
Highly skilled management team
75
Bradley Jacobs
Chief Executive OfficerUnited Rentals, United Waste
Lou Amo
President, Brokerage and ExpediteElectrolux, Odyssey Logistics
Josephine Berisha
Senior Vice President, Global Compensation and BenefitsMorgan Stanley
Tony Brooks
President, Less-Than-Truckload – North AmericaSysco, PepsiCo, Roadway
Erik Caldwell
Chief Operating Officer, Supply Chain – Americas and Asia PacificHudson's Bay, Luxottica
Richard Cawston
Managing Director, Supply Chain – EuropeNorbert Dentressangle, Asda
Ashfaque Chowdhury
President, Supply Chain – Americas and Asia Pacific New Breed
Troy Cooper
PresidentUnited Rentals, United Waste
Matthew Fassler
Chief Strategy OfficerGoldman Sachs
Luis-Angel Gómez Izaguirre
Managing Director, Transport – EuropeNorbert Dentressangle
Mario Harik
Chief Information OfficerOakleaf Waste Management
Tavio Headley
Senior Director, Investor RelationsJefferies, American Trucking Associations
LEADERSHIP
Note: Partial list in alphabetical order
PRIOR EXPERIENCE
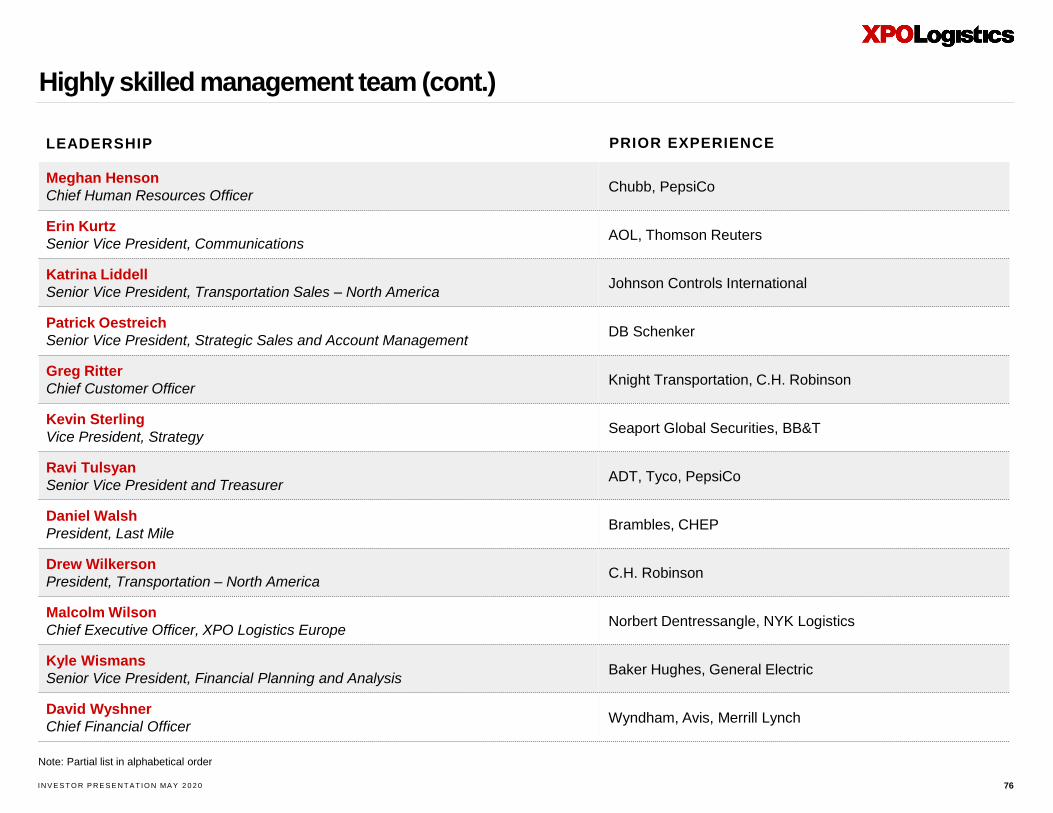
IN V E S T O R P R E S E N T AT IO N MA Y 2 0 2 0
Highly skilled management team (cont.)
76
Meghan Henson
Chief Human Resources OfficerChubb, PepsiCo
Erin Kurtz
Senior Vice President, Communications AOL, Thomson Reuters
Katrina Liddell
Senior Vice President, Transportation Sales – North AmericaJohnson Controls International
Patrick Oestreich
Senior Vice President, Strategic Sales and Account ManagementDB Schenker
Greg Ritter
Chief Customer OfficerKnight Transportation, C.H. Robinson
Kevin Sterling
Vice President, StrategySeaport Global Securities, BB&T
Ravi Tulsyan
Senior Vice President and TreasurerADT, Tyco, PepsiCo
Daniel Walsh
President, Last MileBrambles, CHEP
Drew Wilkerson
President, Transportation – North AmericaC.H. Robinson
Malcolm Wilson
Chief Executive Officer, XPO Logistics EuropeNorbert Dentressangle, NYK Logistics
Kyle Wismans
Senior Vice President, Financial Planning and AnalysisBaker Hughes, General Electric
David Wyshner
Chief Financial OfficerWyndham, Avis, Merrill Lynch
LEADERSHIP PRIOR EXPERIENCE
Note: Partial list in alphabetical order
IN V E S T O R P R E S E N T AT IO N MA Y 2 0 2 0
Business glossary
77
▪ Contract Logistics: An asset-light, technology-enabled business characterized by long-term contractual relationships with high
renewal rates, low cyclicality and a high-value-add component that minimizes commoditization. Contracts are typically structured as
either fixed-variable, cost-plus or gain-share. XPO services include highly engineered solutions, e-fulfillment, reverse logistics,
packaging, factory support, aftermarket support, warehousing and distribution for customers in aerospace, manufacturing, retail, life
sciences, chemicals, food and beverage, and cold chain. Reverse logistics, also known as returns management, refers to processes
associated with managing the flow of returned goods back through contract logistics facilities: for example, unwanted e-commerce
purchases, food transport equipment or defective goods. Reverse logistics services can include cleaning, inspection, refurbishment,
restocking, warranty processing and other lifecycle services.
▪ Expedite: A non-asset business that facilitates time-critical, high-value or high-security shipments, usually on very short notice.
Revenue is either contractual or transactional, primarily driven by unforeseen supply chain disruptions or just-in-time inventory
demand for raw materials, parts or goods. XPO provides three types of expedite service: ground transportation via a network of
independent contract carriers; air charter transportation facilitated by proprietary, a web-based technology that solicits bids and
assigns loads to aircraft; and a transportation management system (TMS) network that is the largest web-based expedite
management system in North America.
▪ Freight Brokerage: A variable cost business that facilitates the trucking of freight by procuring carriers through the use of proprietary
technology, typically referred to as a TMS (transportation management system). Freight brokerage net revenue is the spread
between the price to the shipper and the cost of purchased transportation. In North America, XPO has a non-asset freight brokerage
business, with a network of 38,000 independent carriers. In Europe, XPO generates over €1 billion in freight brokerage revenue
annually, with capacity provided by an asset-light mix of owned fleet and independent carriers.
▪ Global Forwarding: A non-asset business that facilitates freight shipments by ground, air and ocean. Shipments may have origins
and destinations within North America, to or from North America, or between foreign locations. Services are provided through a
network of market experts who provide local oversight in thousands of key trade areas worldwide. XPO’s global forwarding service
can arrange shipments with no restrictions as to size, weight or mode, and is OTI and NVOCC licensed.
IN V E S T O R P R E S E N T AT IO N MA Y 2 0 2 0
Business glossary (cont.)
78
▪ Intermodal: An asset-light business that facilitates the movement of long-haul, containerized freight by rail, often with a drayage
(trucking) component at either end. Intermodal is a variable cost business, with revenue generated by a mix of contractual and spot
market transactions. Net revenue equates to the spread between the price to the shipper and the cost of purchasing rail and truck
transportation. Two factors are driving growth in intermodal in North America: rail transportation is less expensive and more fuel
efficient per mile than long-haul trucking, and rail is a key mode of transportation in and out of Mexico, where the manufacturing base
is booming due to a trend toward near-shoring.
▪ Last Mile: An asset-light business that facilitates the delivery of goods to their final destination, most often to consumer households.
XPO specializes in two areas of last mile service: arranging the delivery and installation of heavy goods such as appliances, furniture
and electronics, often with a white glove component; and providing logistics solutions to retailers and distributors to support their e-
commerce supply chains and omnichannel distribution strategies. Capacity is sourced from a network of independent contract
carriers and technicians.
▪ Less-Than-Truckload (LTL): The transportation of a quantity of freight that is larger than a parcel, but too small to require an
entire truck, and is often shipped on a pallet. LTL shipments are priced according to the weight of the freight, its commodity class
(which is generally determined by its cube/weight ratio and the description of the product), and mileage within designated lanes. An
LTL carrier typically operates a hub-and-spoke network that allows for the consolidation of multiple shipments for different customers
in single trucks.
▪ Managed Transportation: A service provided to shippers who want to outsource some or all of their transportation modes, together
with associated activities. This can include freight handling such as consolidation and deconsolidation, labor planning, inbound and
outbound shipment facilitation, documentation and customs management, claims processing, and 3PL supplier management, among
other things.
▪ Truckload: The ground transportation of cargo provided by a single shipper in an amount that requires the full limit of the trailer,
either by dimension or weight. Cargo typically remains on a single vehicle from the point of origin to the destination and is not
handled en route. See Freight Brokerage on the prior page for additional details.
IN V E S T O R P R E S E N T AT IO N MA Y 2 0 2 0
Business glossary (cont.)
79
▪ XPO Connect™: XPO’s fully automated, self-learning digital freight marketplace connects shippers and carriers directly, as well as
through company operations. XPO Connect™ gives customers comprehensive visibility across multiple transportation modes in real
time, including fluctuations in capacity, spot rates by geography and digital negotiating through an automated counteroffer feature.
Shippers can assign loads to carriers and track the freight through one, secure login. Carriers use the Drive XPO™ app from the road
to interact with shippers and with XPO. The app also serves as a geo-locator and supports voice-to-text communications. XPO has
deployed XPO Connect™ in North America and Europe for truckload freight, with additional capabilities for last mile customers and
independent contractors engaged in the home delivery of heavy goods.
▪ XPO Direct™: XPO’s national, shared-space distribution network gives retail, e-commerce, omnichannel and manufacturing
customers new ways to distribute their goods. XPO Direct™ warehouses serve as stockholding sites and cross-docks that can be
utilized by multiple customers at the same time. Transportation needs are supported by XPO’s brokered, contracted and owned
capacity. B2C and B2B customers essentially rent XPO’s capacity for contract logistics, last mile, LTL, labor, technology,
transportation and storage. They can position inventories fluidly across markets without the capital investment of adding distribution
centers, while XPO uses its existing assets and supplier relationships as growth levers. The XPO Direct™ network encompasses
over 90 facilities in North America.
▪ XPO Smart™: XPO’s technology suite of optimization tools improve labor productivity, intelligent warehouse management and
demand forecasting in the company’s logistics and transportation operations. XPO Smart labor productivity tools interface with the
company’s proprietary warehouse management system to forecast optimal staffing levels day-by-day and shift-by-shift. In addition,
the warehouse management system facilitates the integration of robotics and other advanced automation, enabling XPO to start up
customer logistics projects or expand existing implementations with a high degree of efficiency. The integrated technology provides
an intelligent, single solution that combines key supply chain applications, including unified order management and intuitive
dashboard tools that analyze trends and guide decision-making.
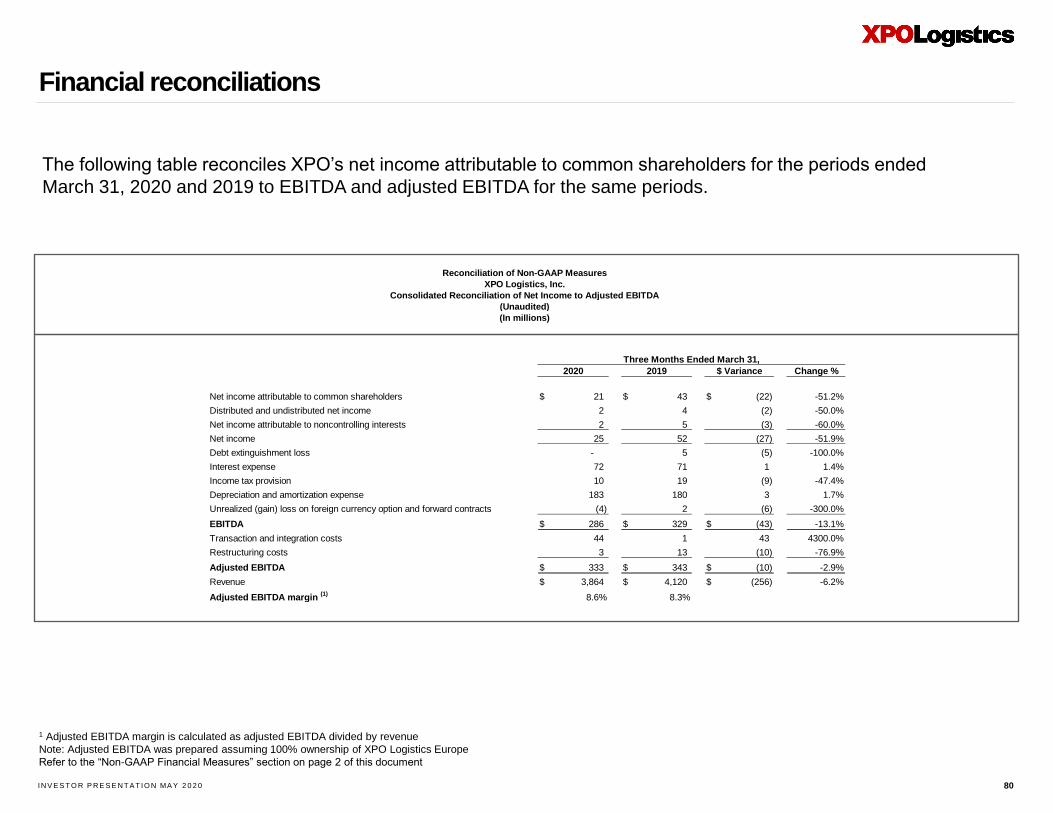
IN V E S T O R P R E S E N T AT IO N MA Y 2 0 2 0
Financial reconciliations
80
The following table reconciles XPO’s net income attributable to common shareholders for the periods ended
March 31, 2020 and 2019 to EBITDA and adjusted EBITDA for the same periods.
1 Adjusted EBITDA margin is calculated as adjusted EBITDA divided by revenue
Note: Adjusted EBITDA was prepared assuming 100% ownership of XPO Logistics Europe
Refer to the “Non-GAAP Financial Measures” section on page 2 of this document
Change % Change %
Net income attributable to common shareholders $ 122 $ 138 $ (16) -11.6% $ 165 $ 205 $ (40) -19.5%
Distributed and undistributed net income 13 11 2 18.2% 17 17 - 0.0%
Net income attributable to noncontrolling interests 10 10 - 0.0% 15 16 (1) -6.3%
Net income 145 159 (14) -8.8% 197 238 (41) -17.2%
Debt extinguishment loss - - - 0.0% 5 10 (5) -50.0%
Interest expense 72 55 17 30.9% 143 114 29 25.4%
Income tax provision 46 54 (8) -14.8% 65 54 11 20.4%
Depreciation and amortization expense 180 177 3 1.7% 360 348 12 3.4%
Unrealized loss (gain) on foreign currency option and forward contracts 7 (16) 23 -143.8% 9 (12) 21 -175.0%
EBITDA $ 450 $ 429 $ 21 4.9% $ 779 $ 752 $ 27 3.6%
Transaction, integration and rebranding costs 1 8 (7) -87.5% 2 15 (13) -86.7%
Restructuring costs 4 - 4 100.0% 17 - 17 100.0%
Adjusted EBITDA $ 455 $ 437 $ 18 4.1% $ 798 $ 767 $ 31 4.0%
Reconciliation of Non-GAAP Measures
XPO Logistics, Inc.
Consolidated Reconciliation of Net Income to Adjusted EBITDA
(Unaudited)
(In millions)
Three Months Ended June 30, Six Months Ended June 30,
2019 2018 $ Variance 2019 2018 $ Variance
Change %
Net income attributable to common shareholders $ 21 $ 43 $ (22) -51.2%
Distributed and undistributed net income 2 4 (2) -50.0%
Net income attributable to noncontrolling interests 2 5 (3) -60.0%
Net income 25 52 (27) -51.9%
Debt extinguishment loss - 5 (5) -100.0%
Interest expense 72 71 1 1.4%
Income tax provision 10 19 (9) -47.4%
Depreciation and amortization expense 183 180 3 1.7%
Unrealized (gain) loss on foreign currency option and forward contracts (4) 2 (6) -300.0%
EBITDA $ 286 $ 329 $ (43) -13.1%
Transaction and integration costs 44 1 43 4300.0%
Restructuring costs 3 13 (10) -76.9%
Adjusted EBITDA $ 333 $ 343 $ (10) -2.9%
Revenue $ 3,864 $ 4,120 $ (256) -6.2%
Adjusted EBITDA margin (1)
8.6% 8.3%
$ Variance
Three Months Ended March 31,
2020 2019
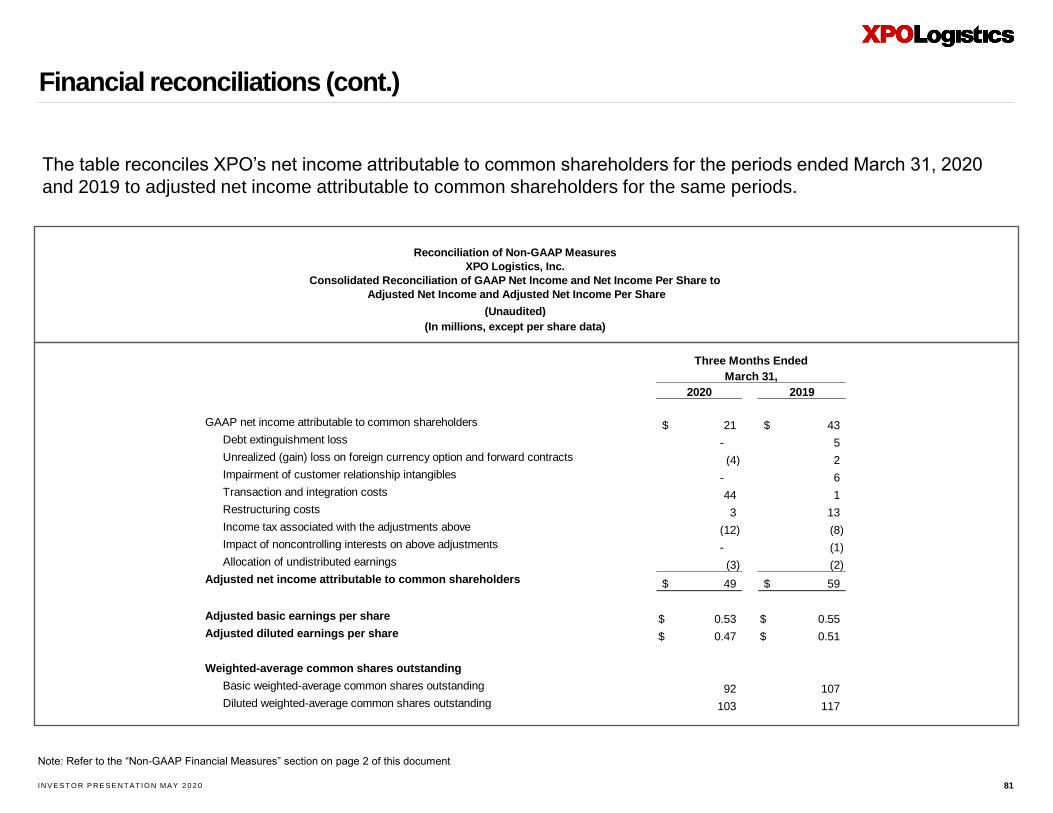
IN V E S T O R P R E S E N T AT IO N MA Y 2 0 2 0
Financial reconciliations (cont.)
81
Note: Refer to the “Non-GAAP Financial Measures” section on page 2 of this document
Reconciliation of Non-GAAP Measures
XPO Logistics, Inc.
Consolidated Reconciliation of GAAP Net Income and Net Income Per Share to
Adjusted Net Income and Adjusted Net Income Per Share
(Unaudited)
(In millions, except per share data)
The table reconciles XPO’s net income attributable to common shareholders for the periods ended March 31, 2020
and 2019 to adjusted net income attributable to common shareholders for the same periods.
GAAP net income attributable to common shareholders $ 21 $ 43
Debt extinguishment loss - 5
Unrealized (gain) loss on foreign currency option and forward contracts (4) 2
Impairment of customer relationship intangibles - 6
Transaction and integration costs 44 1
Restructuring costs 3 13
Income tax associated with the adjustments above (12) (8)
Impact of noncontrolling interests on above adjustments - (1)
Allocation of undistributed earnings (3) (2)
Adjusted net income attributable to common shareholders $ 49 $ 59
Adjusted basic earnings per share $ 0.53 $ 0.55
Adjusted diluted earnings per share $ 0.47 $ 0.51
Weighted-average common shares outstanding
Basic weighted-average common shares outstanding 92 107
Diluted weighted-average common shares outstanding 103 117
2020 2019
March 31,
Three Months Ended
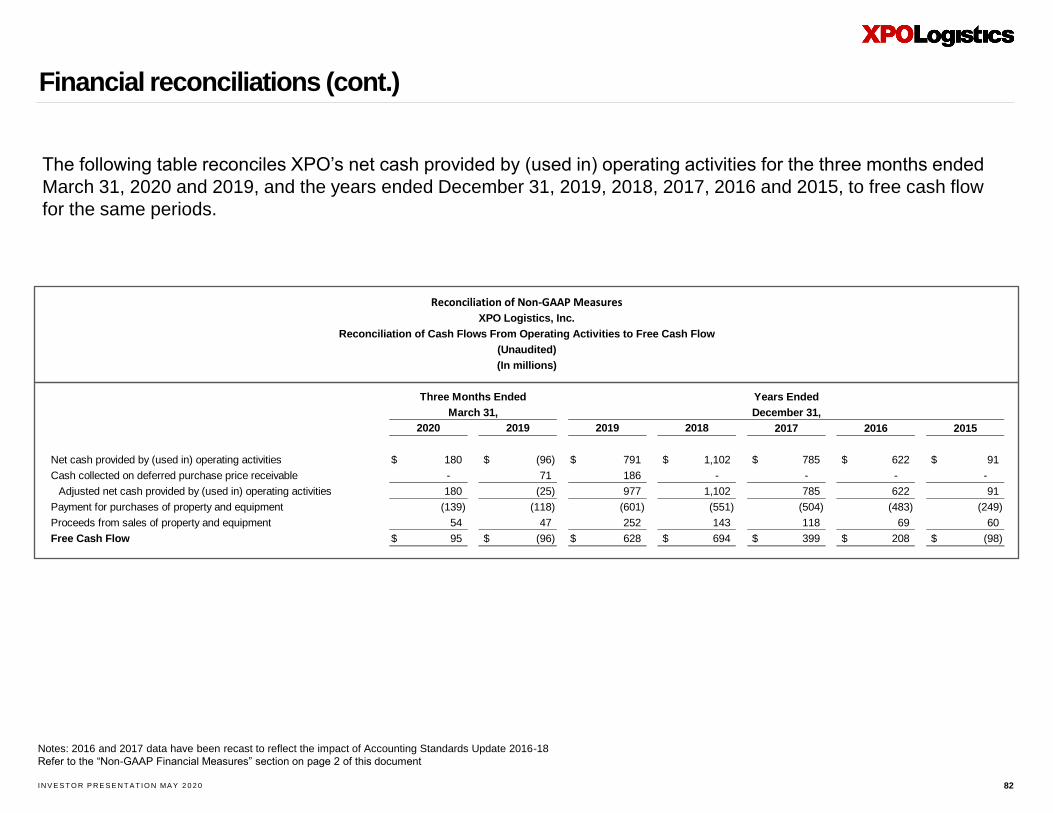
IN V E S T O R P R E S E N T AT IO N MA Y 2 0 2 0
Financial reconciliations (cont.)
82
Notes: 2016 and 2017 data have been recast to reflect the impact of Accounting Standards Update 2016-18
Refer to the “Non-GAAP Financial Measures” section on page 2 of this document
The following table reconciles XPO’s net cash provided by (used in) operating activities for the three months ended
March 31, 2020 and 2019, and the years ended December 31, 2019, 2018, 2017, 2016 and 2015, to free cash flow
for the same periods.
Net cash provided by (used in) operating activities $ 180 $ (96) $ 791 $ 1,102 $ 785 $ 622 $ 91
Cash collected on deferred purchase price receivable - 71 186 - - - -
Adjusted net cash provided by (used in) operating activities 180 (25) 977 1,102 785 622 91
Payment for purchases of property and equipment (139) (118) (601) (551) (504) (483) (249)
Proceeds from sales of property and equipment 54 47 252 143 118 69 60
Free Cash Flow $ 95 $ (96) $ 628 $ 694 $ 399 $ 208 $ (98)
December 31,
2019 2018
Reconciliation of Non-GAAP Measures
20152020 2017 2016
XPO Logistics, Inc.
Reconciliation of Cash Flows From Operating Activities to Free Cash Flow
(Unaudited)
(In millions)
2019
Three Months Ended
March 31,
Years Ended
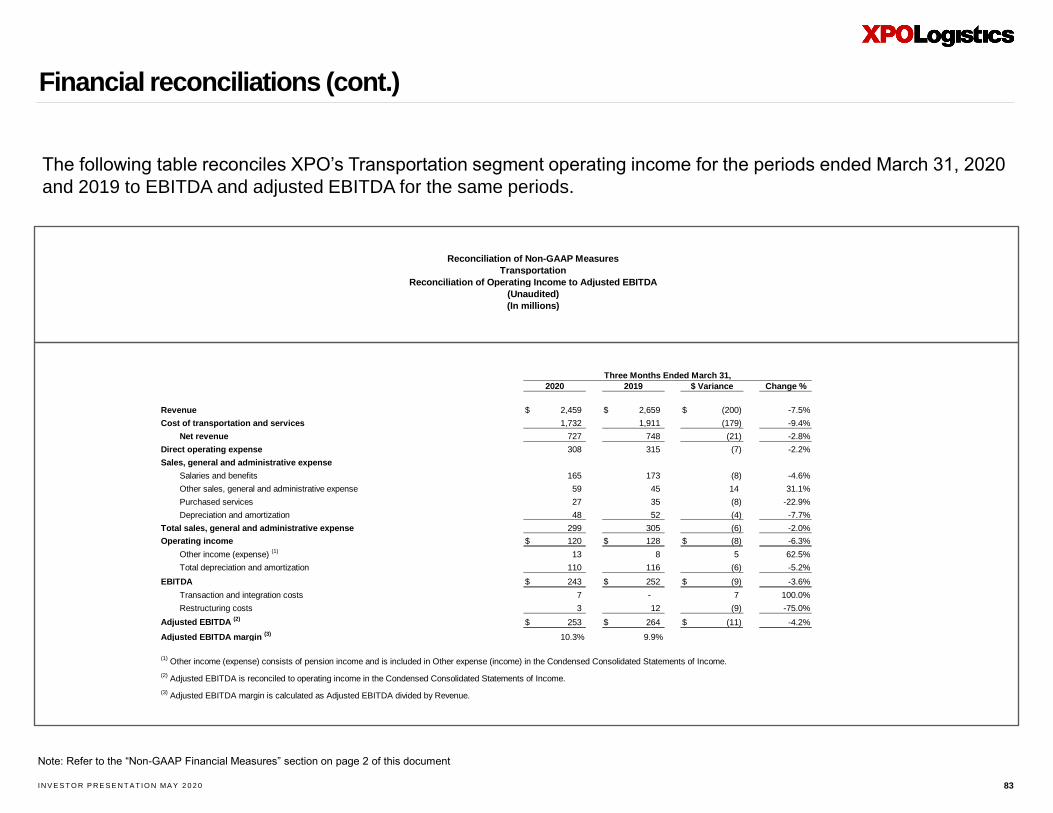
IN V E S T O R P R E S E N T AT IO N MA Y 2 0 2 0
Financial reconciliations (cont.)
83
Note: Refer to the “Non-GAAP Financial Measures” section on page 2 of this document
The following table reconciles XPO’s Transportation segment operating income for the periods ended March 31, 2020
and 2019 to EBITDA and adjusted EBITDA for the same periods.
Transportation
Reconciliation of Operating Income to Adjusted EBITDA
(Unaudited)
(In millions)
Reconciliation of Non-GAAP Measures
Change %
Revenue $ 2,459 $ 2,659 $ (200) -7.5%
Cost of transportation and services 1,732 1,911 (179) -9.4%
Net revenue 727 748 (21) -2.8%
Direct operating expense 308 315 (7) -2.2%
Sales, general and administrative expense
Salaries and benefits 165 173 (8) -4.6%
Other sales, general and administrative expense 59 45 14 31.1%
Purchased services 27 35 (8) -22.9%
Depreciation and amortization 48 52 (4) -7.7%
Total sales, general and administrative expense 299 305 (6) -2.0%
Operating income $ 120 $ 128 $ (8) -6.3%
Other income (expense) (1)
13 8 5 62.5%
Total depreciation and amortization 110 116 (6) -5.2%
EBITDA $ 243 $ 252 $ (9) -3.6%
Transaction and integration costs 7 - 7 100.0%
Restructuring costs 3 12 (9) -75.0%
Adjusted EBITDA (2)
$ 253 $ 264 $ (11) -4.2%
Adjusted EBITDA margin (3)
10.3% 9.9%
$ Variance
(1) Other income (expense) consists of pension income and is included in Other expense (income) in the Condensed Consolidated Statements of Income.
(2) Adjusted EBITDA is reconciled to operating income in the Condensed Consolidated Statements of Income.
(3) Adjusted EBITDA margin is calculated as Adjusted EBITDA divided by Revenue.
Three Months Ended March 31,
2020 2019
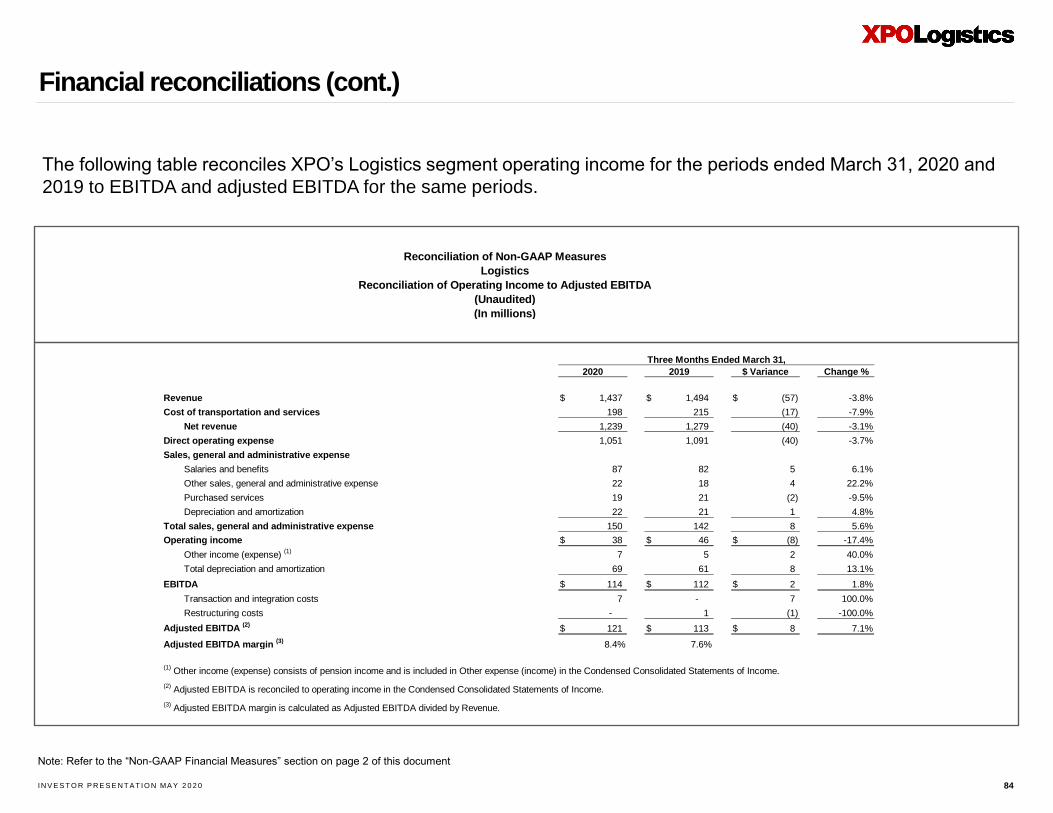
IN V E S T O R P R E S E N T AT IO N MA Y 2 0 2 0
Financial reconciliations (cont.)
84
Note: Refer to the “Non-GAAP Financial Measures” section on page 2 of this document
The following table reconciles XPO’s Logistics segment operating income for the periods ended March 31, 2020 and
2019 to EBITDA and adjusted EBITDA for the same periods.
Logistics
Reconciliation of Operating Income to Adjusted EBITDA
(Unaudited)
(In millions)
Reconciliation of Non-GAAP Measures
Change %
Revenue $ 1,437 $ 1,494 $ (57) -3.8%
Cost of transportation and services 198 215 (17) -7.9%
Net revenue 1,239 1,279 (40) -3.1%
Direct operating expense 1,051 1,091 (40) -3.7%
Sales, general and administrative expense
Salaries and benefits 87 82 5 6.1%
Other sales, general and administrative expense 22 18 4 22.2%
Purchased services 19 21 (2) -9.5%
Depreciation and amortization 22 21 1 4.8%
Total sales, general and administrative expense 150 142 8 5.6%
Operating income $ 38 $ 46 $ (8) -17.4%
Other income (expense) (1)
7 5 2 40.0%
Total depreciation and amortization 69 61 8 13.1%
EBITDA $ 114 $ 112 $ 2 1.8%
Transaction and integration costs 7 - 7 100.0%
Restructuring costs - 1 (1) -100.0%
Adjusted EBITDA (2)
$ 121 $ 113 $ 8 7.1%
Adjusted EBITDA margin (3)
8.4% 7.6%
$ Variance
(1) Other income (expense) consists of pension income and is included in Other expense (income) in the Condensed Consolidated Statements of Income.
(2) Adjusted EBITDA is reconciled to operating income in the Condensed Consolidated Statements of Income.
(3) Adjusted EBITDA margin is calculated as Adjusted EBITDA divided by Revenue.
Three Months Ended March 31,
2020 2019
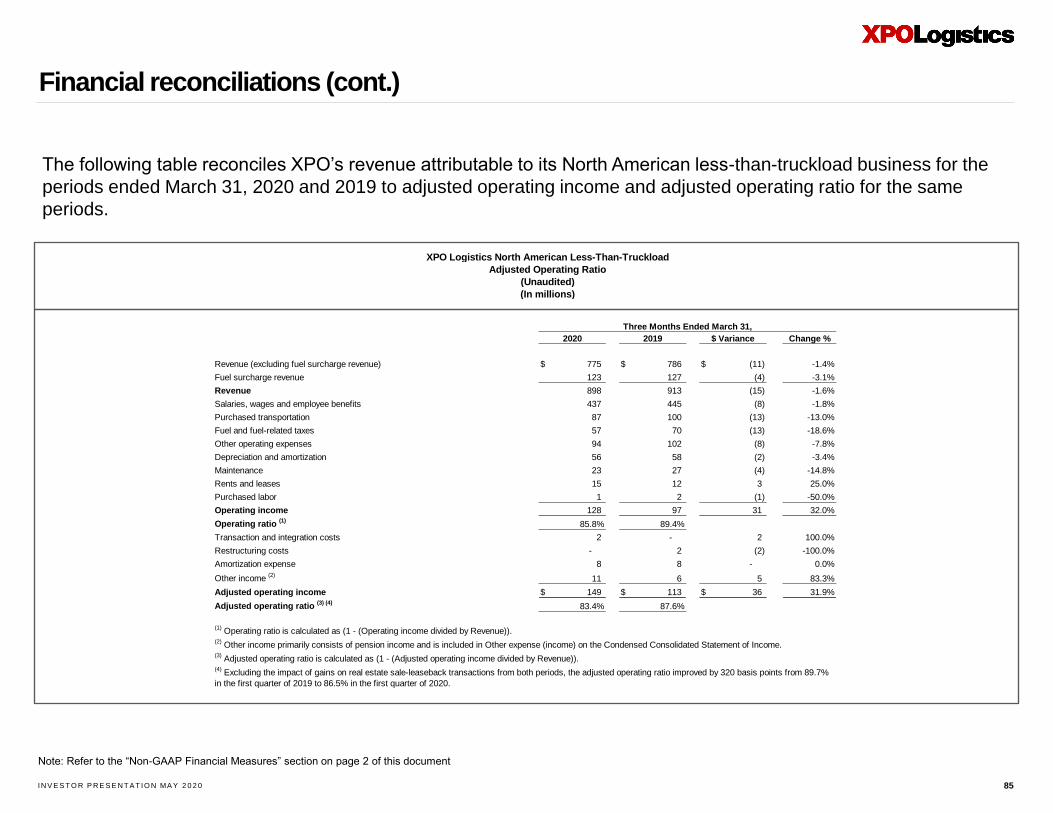
IN V E S T O R P R E S E N T AT IO N MA Y 2 0 2 0
Financial reconciliations (cont.)
85
Note: Refer to the “Non-GAAP Financial Measures” section on page 2 of this document
XPO Logistics North American Less-Than-Truckload
Adjusted Operating Ratio
(Unaudited)
(In millions)
The following table reconciles XPO’s revenue attributable to its North American less-than-truckload business for the
periods ended March 31, 2020 and 2019 to adjusted operating income and adjusted operating ratio for the same
periods.
Change %
Revenue (excluding fuel surcharge revenue) $ 775 $ 786 $ (11) -1.4%
Fuel surcharge revenue 123 127 (4) -3.1%
Revenue 898 913 (15) -1.6%
Salaries, wages and employee benefits 437 445 (8) -1.8%
Purchased transportation 87 100 (13) -13.0%
Fuel and fuel-related taxes 57 70 (13) -18.6%
Other operating expenses 94 102 (8) -7.8%
Depreciation and amortization 56 58 (2) -3.4%
Maintenance 23 27 (4) -14.8%
Rents and leases 15 12 3 25.0%
Purchased labor 1 2 (1) -50.0%
Operating income 128 97 31 32.0%
Operating ratio (1)
85.8% 89.4%
Transaction and integration costs 2 - 2 100.0%
Restructuring costs - 2 (2) -100.0%
Amortization expense 8 8 - 0.0%
Other income (2)
11 6 5 83.3%
Adjusted operating income $ 149 $ 113 $ 36 31.9%
Adjusted operating ratio (3) (4)
83.4% 87.6%
(1) Operating ratio is calculated as (1 - (Operating income divided by Revenue)).
(2) Other income primarily consists of pension income and is included in Other expense (income) on the Condensed Consolidated Statement of Income.
(3) Adjusted operating ratio is calculated as (1 - (Adjusted operating income divided by Revenue)).
(4) Excluding the impact of gains on real estate sale-leaseback transactions from both periods, the adjusted operating ratio improved by 320 basis points from 89.7%
in the first quarter of 2019 to 86.5% in the first quarter of 2020.
Three Months Ended March 31,
2020 2019 $ Variance
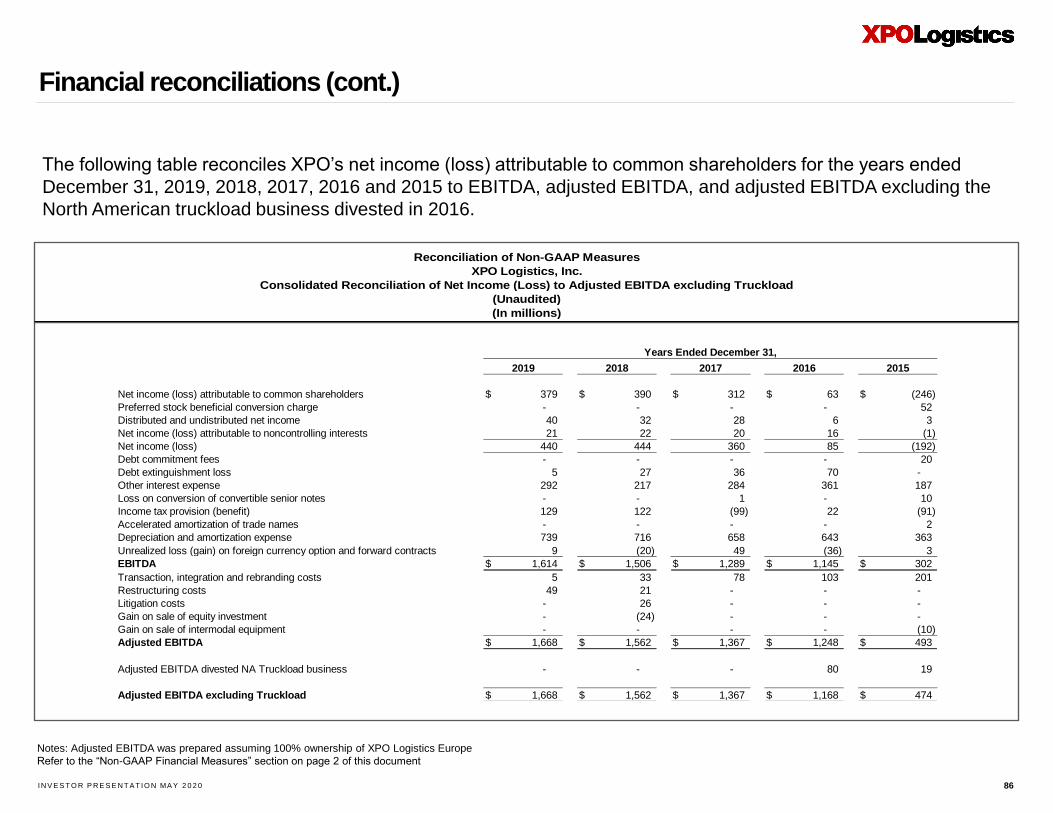
IN V E S T O R P R E S E N T AT IO N MA Y 2 0 2 0
Financial reconciliations (cont.)
86
Notes: Adjusted EBITDA was prepared assuming 100% ownership of XPO Logistics Europe
Refer to the “Non-GAAP Financial Measures” section on page 2 of this document
The following table reconciles XPO’s net income (loss) attributable to common shareholders for the years ended
December 31, 2019, 2018, 2017, 2016 and 2015 to EBITDA, adjusted EBITDA, and adjusted EBITDA excluding the
North American truckload business divested in 2016.
Reconciliation of Non-GAAP Measures
XPO Logistics, Inc.
Consolidated Reconciliation of Net Income (Loss) to Adjusted EBITDA excluding Truckload
(Unaudited)
(In millions)
Net income (loss) attributable to common shareholders $ 379 $ 390 $ 312 $ 63 $ (246)
Preferred stock beneficial conversion charge - - - - 52
Distributed and undistributed net income 40 32 28 6 3
Net income (loss) attributable to noncontrolling interests 21 22 20 16 (1)
Net income (loss) 440 444 360 85 (192)
Debt commitment fees - - - - 20
Debt extinguishment loss 5 27 36 70 -
Other interest expense 292 217 284 361 187
Loss on conversion of convertible senior notes - - 1 - 10
Income tax provision (benefit) 129 122 (99) 22 (91)
Accelerated amortization of trade names - - - - 2
Depreciation and amortization expense 739 716 658 643 363
Unrealized loss (gain) on foreign currency option and forward contracts 9 (20) 49 (36) 3
EBITDA $ 1,614 $ 1,506 $ 1,289 $ 1,145 $ 302
Transaction, integration and rebranding costs 5 33 78 103 201
Restructuring costs 49 21 - - -
Litigation costs - 26 - - -
Gain on sale of equity investment - (24) - - -
Gain on sale of intermodal equipment - - - - (10)
Adjusted EBITDA $ 1,668 $ 1,562 $ 1,367 $ 1,248 $ 493
Adjusted EBITDA divested NA Truckload business - - - 80 19
Adjusted EBITDA excluding Truckload $ 1,668 $ 1,562 $ 1,367 $ 1,168 $ 474
2017 20152019
Years Ended December 31,
20162018
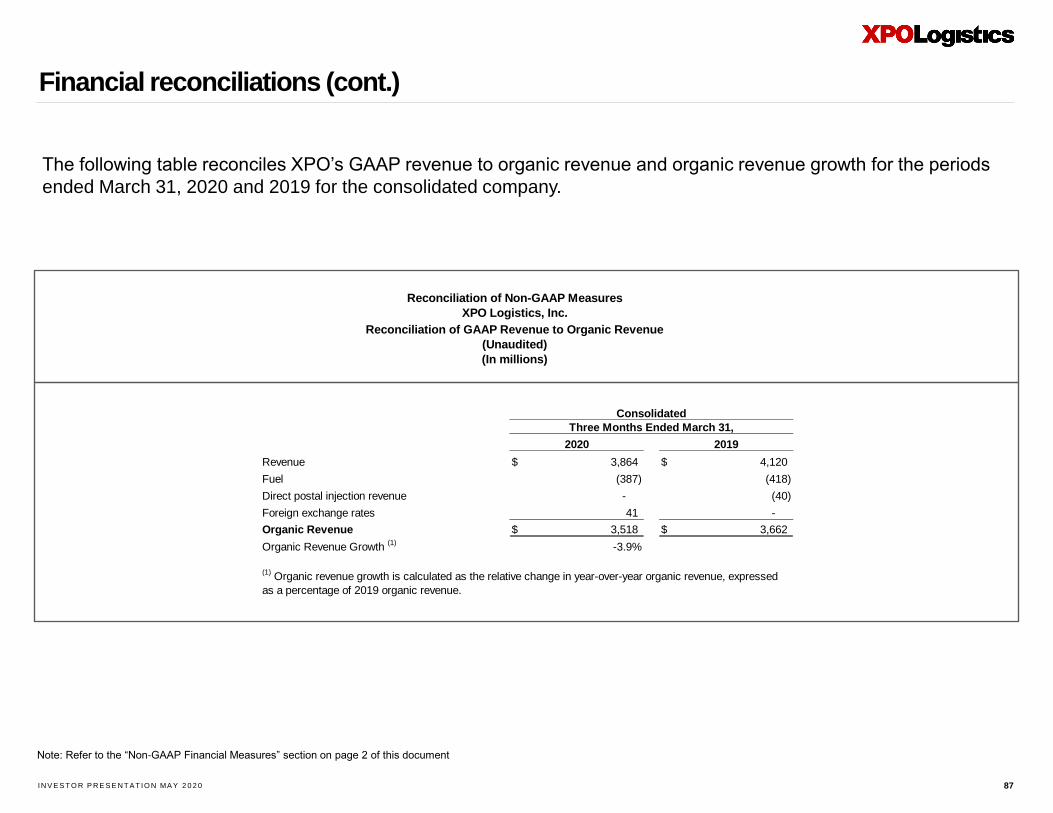
IN V E S T O R P R E S E N T AT IO N MA Y 2 0 2 0
Financial reconciliations (cont.)
87
Note: Refer to the “Non-GAAP Financial Measures” section on page 2 of this document
Reconciliation of Non-GAAP Measures
XPO Logistics, Inc.
Reconciliation of GAAP Revenue to Organic Revenue
(Unaudited)
(In millions)
The following table reconciles XPO’s GAAP revenue to organic revenue and organic revenue growth for the periods
ended March 31, 2020 and 2019 for the consolidated company.
Revenue $ 3,864 $ 4,120
Fuel (387) (418)
Direct postal injection revenue - (40)
Foreign exchange rates 41 -
Organic Revenue $ 3,518 $ 3,662
Organic Revenue Growth (1)
-3.9%
2020 2019
(1) Organic revenue growth is calculated as the relative change in year-over-year organic revenue, expressed
as a percentage of 2019 organic revenue.
Consolidated
Three Months Ended March 31,