Embed Size (px)
Citation preview

1
May 5, 2015

2
Michael J. Chewens Senior Executive Vice President and Chief Financial Officer

3
Timothy L. Brenner Executive Vice President and President of Wealth Management

4
Jeffrey M. Levy Executive Vice President and President of Commercial Banking

5
F. Sheldon Prentice Executive Vice President, General Counsel and Corporate Secretary

6
David E. Raven Executive Vice President, President of Retail Banking and President of Pennsylvania

7
Catherine M. Scarlett Executive Vice President and Chief Human Resources Officer

8
Joseph R. Stagliano Executive Vice President and Chief Information Officer

9
Howard L. Atkinson Executive Vice President, Strategic Operations

10
Jack H. Webb Executive Vice President, Strategic Support

11 11

12 12
2014 Financial Highlights

13
Record Performance in 2014
$75.1 Million Record Net Income

14
$54.8
$69.9
$75.8
$35.0
$45.0
$55.0
$65.0
$75.0
$85.0
2012 2013 2014
Core Net Income In Millions
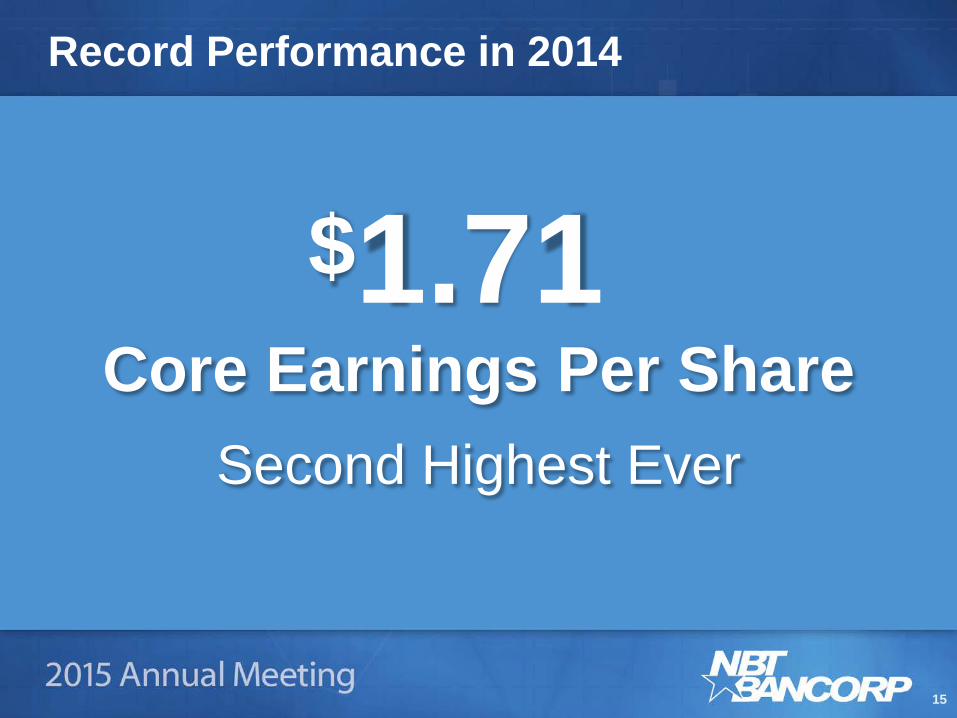
15
Record Performance in 2014
Core Earnings Per Share
Second Highest Ever
$1.71

16
$1.63
$1.65
$1.71
$1.56
$1.60
$1.64
$1.68
$1.72
2012 2013 2014
Core Earnings Per Share

17
Record Performance in 2014
• Net Interest Income $251.9 Million
• Core Noninterest Income $105.9 Million

18
Record Performance in 2014
• Total Assets $7.8 Billion
• Loans at $5.6 Billion
• Deposits at $6.3 Billion

19
Sale of Ownership Interest
Springstone • Niche consumer lending line of business • Providing financing options for K–12 private
education and elective medical procedures • Formed in 2006 • Located in Boston • NBT invested in 2007 with a
20% ownership interest
20
Sale of Ownership Interest
Springstone • Sold 20% ownership interest in April 2014
• $25 million total gain on initial investment of $3 million
• Leveraged gain to restructure long-term borrowings

21
$3.79
$4.44
$4.02
$4.25
$3.50
$3.70
$3.90
$4.10
$4.30
$4.50
2011 2012 2013 2014
Loan balances shown without acquired portfolios
Performance Drivers: Organic Loan Growth In Billions

22
2014 Diversified Loan Portfolio
44% Commercial
Lending
36% Consumer Lending
20% Residential Mortgages

23
Record Performance in 2014
U.S. Small Business Administration
Top Large Community Lender
4th Straight Year

24
$4.44$4.25$4.02$3.79
$0.26
$1.15$1.15
$2.50
$3.50
$4.50
$5.50
$6.50
2011 2012 2013 2014
Acquired Loans
Originated Loans
Performance Drivers: Organic Loan Growth In Billions

25
$1,400$1,297
$1,103$963
$3
$37
$187$270
$700
$900
$1,100
$1,300
$1,500
$1,700
2011 2012 2013 2014
Acquired DDA
DDA Balance
Excluding acquisitions, growth in 2012, 2013 and 2014 was 14.6%, 17.6% and 8.0%, respectively.
% Growth 18.0% 30.2% 12.5% (as compared to previous year)
Performance Drivers: DDA Deposit Growth Average Balances In Millions
26
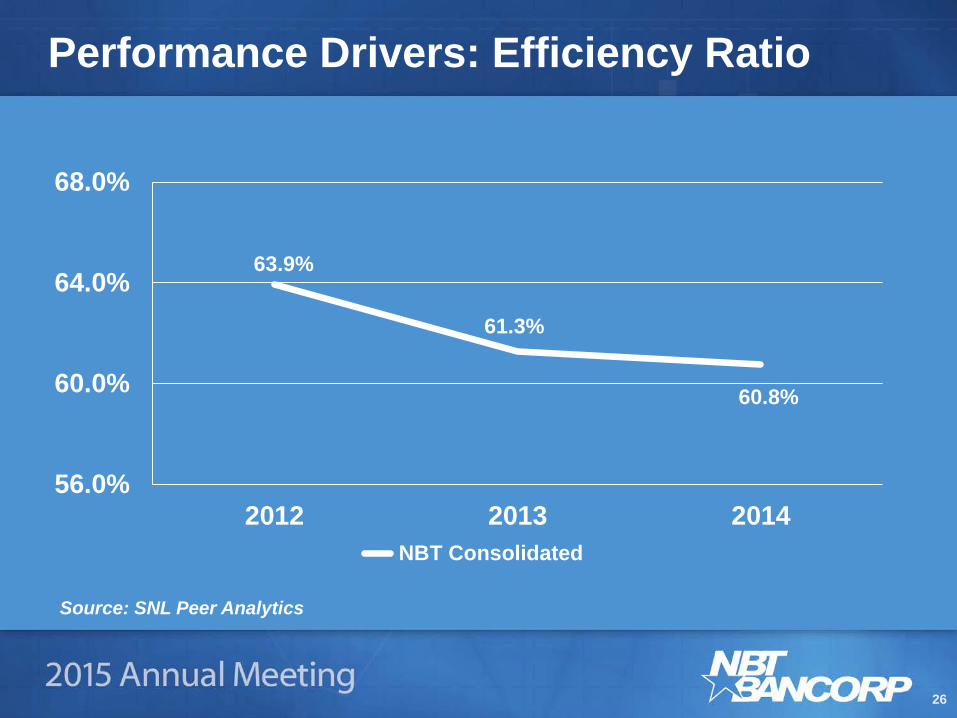
Performance Drivers: Efficiency Ratio
Source: SNL Peer Analytics
63.9%
61.3%
60.8%
56.0%
60.0%
64.0%
68.0%
2012 2013 2014 NBT Consolidated

27 27
Strong, Sustained Financial Performance

28
Peer Group Listing
Company Ticker Location
Berkshire Hills Bancorp Inc. BHLB Pittsfield, MA
Brookline Bancorp Inc. BRKL Boston, MA
Community Bank System Inc. CBU De Witt, NY
Flagstar Bancorp Inc. FBC Troy, MI
First Commonwealth Financial FCF Indiana, PA
Flushing Financial Corp. FFIC Lake Success, NY
First Midwest Bancorp Inc. FMBI Itasca, IL
F.N.B. Corp. FNB Hermitage, PA
Independent Bank Corp. INDB Rockland, MA
MB Financial Inc. MBFI Chicago, IL
NBT Bancorp Inc. NBTB Norwich, NY
Company Ticker Location
National Penn Bancshares Inc. NPBC Boyertown, PA
Northwest Bancshares, Inc. NWBI Warren, PA
Old National Bancorp ONB Evansville, IN
Provident Financial Services PFS Jersey City, NJ
Park National Corp. PRK Newark, OH
PrivateBancorp Inc. PVTB Chicago, IL
S&T Bancorp Inc. STBA Indiana, PA
Tompkins Financial Corporation TMP Ithaca, NY
TrustCo Bank Corp NY TRST Glenville, NY
UMB Financial Corp. UMBF Kansas City, MO

29
Components of Profitability
• Core Return on Average Assets
• Core Return on Average Tangible Equity
• Net Interest Margin
• Efficiency Ratio
• Nonperforming Assets to Total Assets

30
Relative Average Ranking Year Ended December 31, 2014
Ratios
Relative Peer Ranking
Core Return on Average Tangible Equity 3 Core Return on Average Assets 9 Net Interest Margin 5 Efficiency Ratio 10 Nonperforming Assets to Total Assets 8 NBTB Average Ranking 7.0

31
Peer Group Relative Average Ranking Year Ended December 31, 2014
CBUNBTB TM
PNPB
C
FNB
PVTB
STBA
MBFIIN
DBONB
BRKLPFS PRK
BHLBTR
STFM
BIFF
ICUMBFNW
BIFC
FFB
C
3.0
7.0 7.4 7.6 9.0 9.2 9.6
11.4
8.2
2
4
6
8
10
12
14
16
18
20
8.2 8.2
10.2 10.6 12.2 12.2
13.0 13.4 14.6
17.0 17.8
20.6

32
Peer Group Relative Average Ranking Five-Year Average (2010 to 2014)
CBUNBTBSTB
A
FNB
BRKLTM
PIN
DBNPB
C
PRKONB
BHLB PFSTR
STFF
ICUMBFMBFIPVT
BNW
BIFM
BIFC
FFB
C
2.8
6.2 6.6 7.6
9.4 9.8 10.2 11.6
8.8
2
4
6
8
10
12
14
16
18
20
7.8 8.0
11.0 11.2 12.0 12.6
13.6 14.4 14.6 15.2
16.6
20.8

33 33
NBT Bancorp Stock

34
• Traded on NASDAQ Global Select Market
• Ticker Symbol: NBTB
• Institutional Ownership: 44%
• Average Daily Volume: 100,000
NBT Bancorp Stock

35
-12%
-10%
-8%
-6%
-4%
-2%
0%
2%
4%
6%
NASDAQ Financial Index NBTB
Relative Performance One Year | For the Period from 12/31/2013 to 12/31/2014
1 Year % Increase: NASDAQ 5.05% NBTB 5.07%

36
Relative Performance Five Years | For the Period from 12/31/2009 to 12/31/2014
0%
10%
20%
30%
40%
50%
60%
70%
80%
90%
NASDAQ Financial Index NBTB
5 Year % Increase: NASDAQ 79.54% NBTB 55.31%

37
Relative Performance Ten Years | For the Period from 12/31/2004 to 12/31/2014
-30%
-15%
0%
15%
30%
45%
NASDAQ Financial Index NBTB
10 Year % Increase: NASDAQ 42.55% NBTB 45.83%

38
Annualized Total Shareholder Return One Year | For the Period From 12/31/2013 to 12/31/2014
21.1
1%
15.6
0%
12.1
8%
11.3
5%
9.71
%
9.22
%
9.00
%
7.99
%
-10.
13%
-19.
83%-4
.58%
-3.2
9%
-3.2
0%
-0.8
4%
-0.5
9%
-0.0
6%
0.70
%
0.91
%4.29
%
5.07
%
5.10
%
-25%
-20%
-15%
-10%
-5%
0%
5%
10%
15%
20%
25%
STBA
PVTB
INDB
TMP
FNB
PRK
BRKLFC
FTR
STNBTBMBFIFF
ICBHLB ONBFM
BICBUPF
SNPB
CNW
BIUMBF
FBC

39
Annualized Total Shareholder Return Five Years | For the Period From 12/31/2009 to 12/31/2014
15.4
2%
15.2
3%
14.6
9%
10.3
2%
9.61
%
8.44
%
9.20
%
30.3
8%
19.7
9%
12.3
3%
11.7
5%18.6
9%
17.5
0%
18.9
0%
16.6
2%
15.7
1%
-23.
48%
4.00
%
6.67
%
7.61
%
7.92
%
-25%
-20%
-15%
-10%
-5%
0%
5%
10%
15%
20%
25%
30%
35%
PVTB FNB
CBUIN
DBFC
FFF
ICNPBC
PFSSTB
APRKTM
PMBFIFM
BIUMBFNBTBBHLBNW
BITR
STONB
BRKLFB
C
40
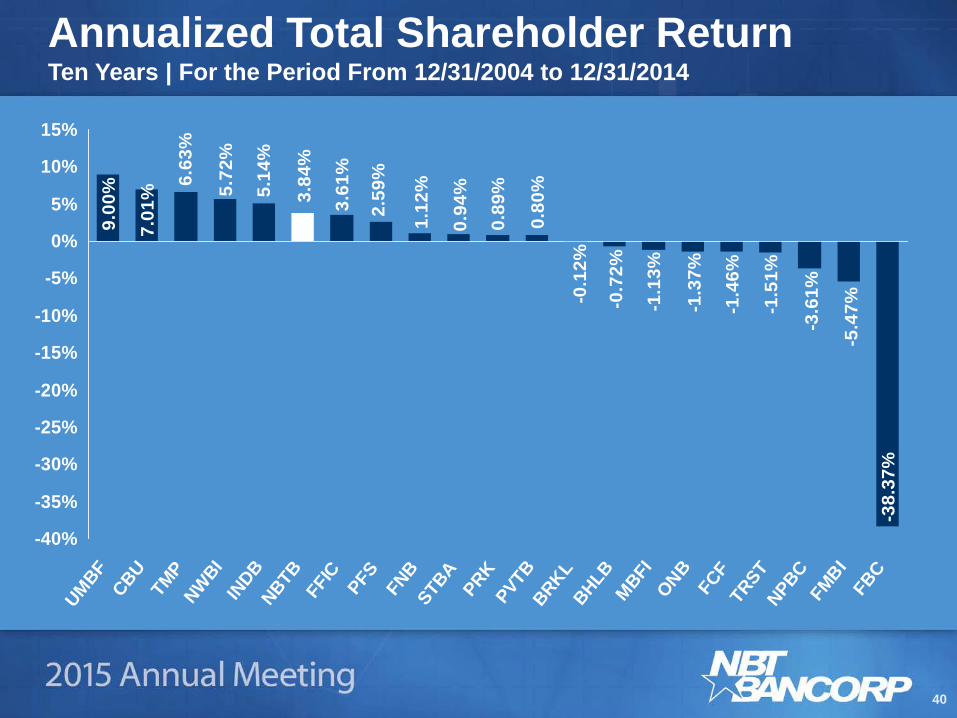
Annualized Total Shareholder Return Ten Years | For the Period From 12/31/2004 to 12/31/2014
-38.
37%
9.00
%
7.01
%
0.89
%
0.80
%5.72
%
5.14
%
6.63
%
3.84
%
2.59
%
1.12
%
0.94
%
3.61
%
-1.1
3%
-0.7
2%
-0.1
2%
-1.3
7%
-1.4
6%
-1.5
1%
-3.6
1%
-5.4
7%
-40%
-35%
-30%
-25%
-20%
-15%
-10%
-5%
0%
5%
10%
15%
UMBFCBUTM
PNW
BIIN
DBNBTBFF
ICPFS FN
BSTB
APRK
PVTBBRKLBHLBMBFIONBFC
FTR
STNPBCFM
BIFB
C

41
Peer Group Dividend Yield As of December 31, 2014
Median is 3.04% Source: SNL Financial
1.70
%
1.87
%
2.96
%
2.70
%
2.42
%
2.24
%
0.00
%
0.12
%
1.65
%
4.18
%
4.25
%
2.96
%
3.04
%
3.04
%
3.15
%
3.20
%
3.32
%
3.39
%
3.60
%
3.62
%4.15
%
0.00%
1.00%
2.00%
3.00%
4.00%
5.00%
PRKNPBCNW
BITR
STFN
BBRKL
PFSNBTB CBU
FCF
TMP
ONBFF
ICBHLBSTB
AIN
DBFM
BIMBFI
UMBFPVTB FB
C

42
Dividend Yield: NBT vs. Peer Median
2.00%2.25%2.50%2.75%3.00%3.25%3.50%3.75%4.00%4.25%4.50%4.75%5.00%
2010 2011 2012 2013 2014 NBTB Peer Median
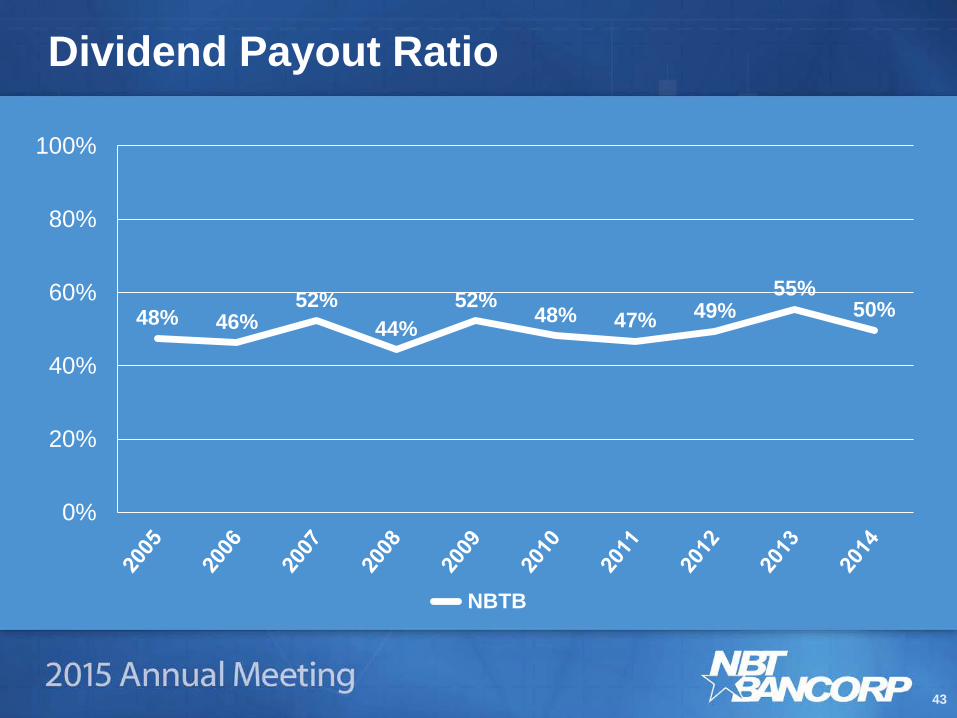
43
Dividend Payout Ratio
48% 46% 52%
44% 52%
48% 47% 49% 55%
50%
0%
20%
40%
60%
80%
100%
NBTB

44 44
External Validation

45
Analyst Reports
NBTB is a very profitable and high performing company. ’’
’’

46
Analyst Reports
We remain positive on NBT’s fundamentals and believe the company should continue to post solid profitability and credit quality metrics. ’’
’’

47
Analyst Reports
We view NBT Bancorp Inc. as a well-run institution with strong credit metrics… ’’
’’

48 48
Business Initiatives

49 49
NBT in New England

50
NBT in New England

51
Portland, Maine
NBT in New England
Rutland, Vermont

52
NBT in New England
• Presence in 4 states • 16 locations • 94 employees • Over $700 million
in loans

53 53
Digital Banking

54
Digital Banking
• Deposit Automation at ATMs • Mobile Banking Enhancements • Digital Branches

55
Self Service Transactions
0
5,000
10,000
15,000
20,000
25,000
30,000
35,000
40,000
1Q14 2Q14 3Q14 4Q14 1Q15

56 56
Compliance

57
Compliance
Recent Local Enforcement Actions

58
Compliance
• Dodd-Frank, CFPB and consumer activism • Expanded investment in compliance • Unfair, Deceptive or Abusive Acts
and Practices (UDAAP)
• Consumer impact • Over 1,800 compliance experts • Compliance as a competitive advantage

59 59
First Quarter 2015 Highlights
60
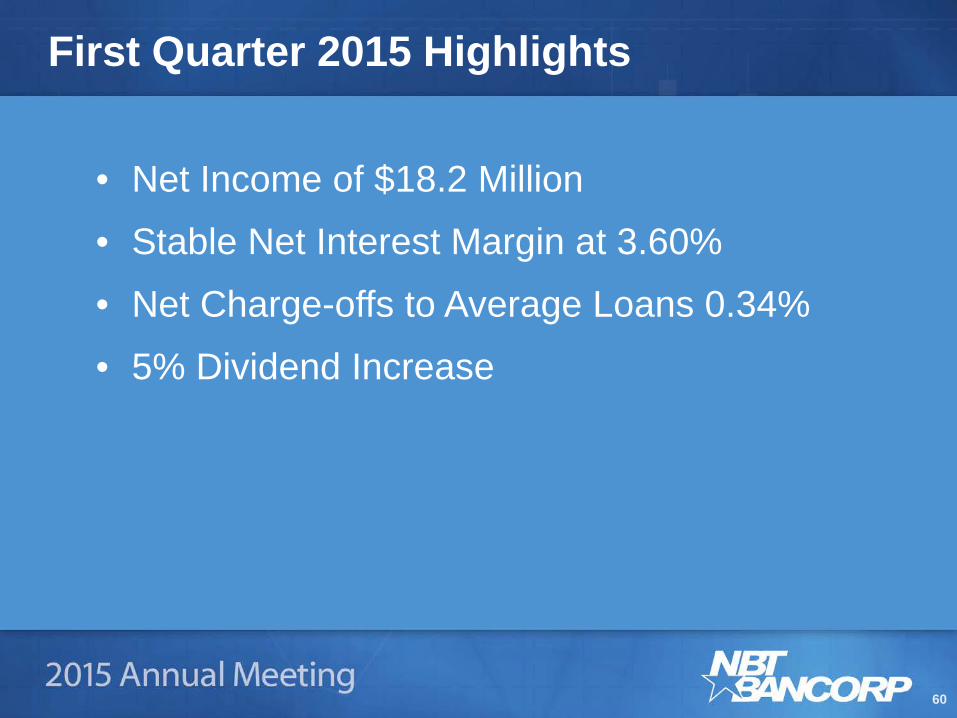
First Quarter 2015 Highlights
• Net Income of $18.2 Million
• Stable Net Interest Margin at 3.60%
• Net Charge-offs to Average Loans 0.34%
• 5% Dividend Increase

61 61