Embed Size (px)
Citation preview
FIRST QUARTER 2020 RESULTSMAY 5, 2020
2
SAFE HARBOR DISCLOSURE
The statements contained herein that are not historical facts are forward-looking statements including, but not limited to statements about: (1) projections of revenues, expenses, income or loss, earnings or loss per share, cash flow, orother financial items; (2) statements of our plans and objectives, including those related to releases of products or services and restructuring activities; (3) statements of future financial or operating performance, including the impact oftax items thereon; and (4) statements of assumptions underlying such statements. Activision Blizzard, Inc. generally uses words such as “outlook,” “forecast,” “will,” “could,” “should,” “would,” “to be,” “plan,” “aims,” “believes,” “may,”“might,” “expects,” “intends,” “seeks,” “anticipates,” “estimate,” “future,” “positioned,” “potential,” “project,” “remain,” “scheduled,” “set to,” “subject to,” “upcoming,” and other similar words and expressions to help identify forward-looking statements. Forward-looking statements are subject to business and economic risks, reflect management’s current expectations, estimates, and projections about our business, and are inherently uncertain and difficult to predict.
We caution that a number of important factors, many of which are beyond our control, could cause our actual future results and other future circumstances to differ materially from those expressed in any forward-looking statements.Such factors include, but are not limited to: the ongoing global impact of a novel strain of coronavirus which emerged in December 2019 (“COVID-19”) (including, without limitation, the potential for significant short- and long-term globalunemployment and economic weakness and a resulting impact on global discretionary spending; potential strain on the retailers and distributors who sell our physical product to customers; effects on our ability to release our content ina timely manner; the impact of large-scale intervention by the Federal Reserve and other central banks around the world, including the impact on interest rates; and volatility in foreign exchange rates); our ability to consistently deliverpopular, high-quality titles in a timely manner, which has been made more difficult as a result of the COVID-19 pandemic; concentration of revenue among a small number of franchises; our ability to satisfy the expectations of consumerswith respect to our brands, games, services, and/or business practices; our ability to attract, retain and motivate skilled personnel; rapid changes in technology and industry standards; competition, including from other forms ofentertainment; increasing importance of revenues derived from digital distribution channels; risks associated with the retail sales business model; the continued growth in the scope and complexity of our business, including the diversionof management time and attention to issues relating to the operations of our newly acquired or started businesses and the potential impact of our expansion into new businesses on our existing businesses; substantial influence of third-party platform providers over our products and costs; risks associated with transitions to next-generation consoles; success and availability of video game consoles manufactured by third parties; risks associated with the free-to-playbusiness model, including dependence on a relatively small number of consumers for a significant portion of revenues and profits from any given game; our ability to realize the expected financial and operational benefits of, andeffectively implement and manage, our previously-announced restructuring actions; our ability to quickly adjust our cost structure in response to sudden changes in demand; risks and costs associated with legal proceedings; intellectualproperty claims; changes in tax rates or exposure to additional tax liabilities, as well as the outcome of current or future tax disputes; our ability to sell products at assumed pricing levels; reliance on external developers for developmentof some of our software products; the amount of our debt and the limitations imposed by the covenants in the agreements governing our debt; the seasonality in the sale of our products; counterparty risks relating to customers,licensees, licensors, and manufacturers, which have been magnified as a result of the COVID-19 pandemic; risks associated with our use of open source software; piracy and unauthorized copying of our products; insolvency or businessfailure of any of our partners, which has been magnified as a result of the COVID-19 pandemic; risks and uncertainties of conducting business outside the United States (“U.S.”); increasing regulation of our business, products, anddistribution in key territories; compliance with continually evolving laws and regulations concerning data privacy; reliance on servers and networks to operate our games and our proprietary online gaming service; potential data breachesand other cybersecurity risks; and the other factors identified in “Risk Factors” included in Part I, Item 1A of our Annual Report on Form 10-K for the year ended December 31, 2019 and this Quarterly Report on Form 10-Q.
The forward-looking statements contained herein are based on information available to Activision Blizzard, Inc. as of the date of this filing and we assume no obligation to update any such forward-looking statements. Although theseforward-looking statements are believed to be true when made, they may ultimately prove to be incorrect. These statements are not guarantees of our future performance and are subject to risks, uncertainties, and other factors, someof which are beyond our control and may cause actual results to differ materially from current expectations.
Please review our SEC filings on Form 10-K and Form 10-Q
3
As a supplement to our financial measures presented in accordance with U.S. Generally Accepted Accounting Principles (“GAAP”), Activision Blizzard presents certain non-GAAP measures of financial performance.These non-GAAP financial measures are not intended to be considered in isolation from, as a substitute for, or as more important than, the financial information prepared and presented in accordance with GAAP.In addition, these non-GAAP measures have limitations in that they do not reflect all of the items associated with the company’s results of operations as determined in accordance with GAAP.
Activision Blizzard provides net income (loss), earnings (loss) per share and operating margin data and guidance both including (in accordance with GAAP) and excluding (non-GAAP) certain items. When relevant,the company also provides constant FX information to provide a framework for assessing how our underlying businesses performed excluding the effect of foreign currency rate fluctuations. In addition, ActivisionBlizzard provides EBITDA (defined as GAAP net income (loss) before interest (income) expense, income taxes, depreciation and amortization) and adjusted EBITDA (defined as non-GAAP operating margin (see non-GAAP financial measure below) before depreciation). The non-GAAP financial measures exclude the following items, as applicable in any given reporting period and our outlook:
expenses related to share-based compensation; the amortization of intangibles from purchase price accounting; fees and other expenses related to acquisitions, including related debt financings, and refinancing of long-term debt, including penalties and the write off of unamortized discount and deferred financing
costs; restructuring and related charges; other non-cash charges from reclassification of certain cumulative translation adjustments into earnings as required by GAAP; the income tax adjustments associated with any of the above items (tax impact on non-GAAP pre-tax income is calculated under the same accounting principles applied to the GAAP pre-tax income under ASC
740, which employs an annual effective tax rate method to the results); and significant discrete tax-related items, including amounts related to changes in tax laws (including the Tax Cuts and Jobs Act enacted in December 2017), amounts related to the potential or final resolution of
tax positions, and other unusual or unique tax-related items and activities.
In the future, Activision Blizzard may also consider whether other items should also be excluded in calculating the non-GAAP financial measures used by the company. Management believes that the presentation ofthese non-GAAP financial measures provides investors with additional useful information to measure Activision Blizzard’s financial and operating performance. In particular, the measures facilitate comparison ofoperating performance between periods and help investors to better understand the operating results of Activision Blizzard by excluding certain items that may not be indicative of the company’s core business,operating results or future outlook. Additionally, we consider quantitative and qualitative factors in assessing whether to adjust for the impact of items that may be significant or that could affect an understandingof our ongoing financial and business performance or trends. Internally, management uses these non-GAAP financial measures, along with others, in assessing the company’s operating results, and measuringcompliance with the requirements of the company’s debt financing agreements, as well as in planning and forecasting.
Activision Blizzard’s non-GAAP financial measures are not based on a comprehensive set of accounting rules or principles, and the terms non-GAAP net income, non-GAAP earnings per share, non-GAAP operatingmargin, and non-GAAP or adjusted EBITDA do not have a standardized meaning. Therefore, other companies may use the same or similarly named measures, but exclude different items, which may not provideinvestors a comparable view of Activision Blizzard’s performance in relation to other companies.
Management compensates for the limitations resulting from the exclusion of these items by considering the impact of the items separately and by considering Activision Blizzard’s GAAP, as well as non-GAAP,results and outlook, and by presenting the most comparable GAAP measures directly ahead of non-GAAP measures, and by providing a reconciliation that indicates and describes the adjustments made.
USE OF NON-GAAP MEASURES

5
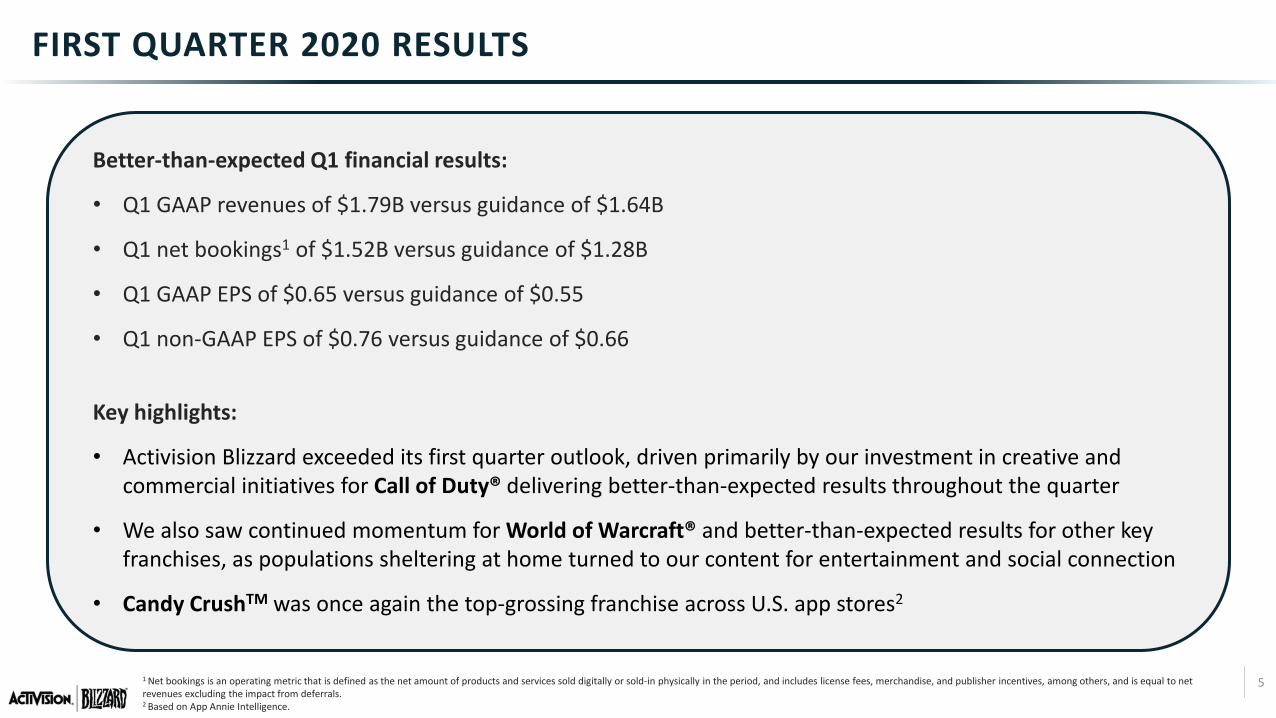
FIRST QUARTER 2020 RESULTS
Better-than-expected Q1 financial results:
• Q1 GAAP revenues of $1.79B versus guidance of $1.64B
• Q1 net bookings1 of $1.52B versus guidance of $1.28B
• Q1 GAAP EPS of $0.65 versus guidance of $0.55
• Q1 non-GAAP EPS of $0.76 versus guidance of $0.66
Key highlights:
• Activision Blizzard exceeded its first quarter outlook, driven primarily by our investment in creative and commercial initiatives for Call of Duty® delivering better-than-expected results throughout the quarter
• We also saw continued momentum for World of Warcraft® and better-than-expected results for other key franchises, as populations sheltering at home turned to our content for entertainment and social connection
• Candy CrushTM was once again the top-grossing franchise across U.S. app stores2
1 Net bookings is an operating metric that is defined as the net amount of products and services sold digitally or sold-in physically in the period, and includes license fees, merchandise, and publisher incentives, among others, and is equal to net revenues excluding the impact from deferrals.2 Based on App Annie Intelligence.
6
OUR RESPONSE TO COVID-19
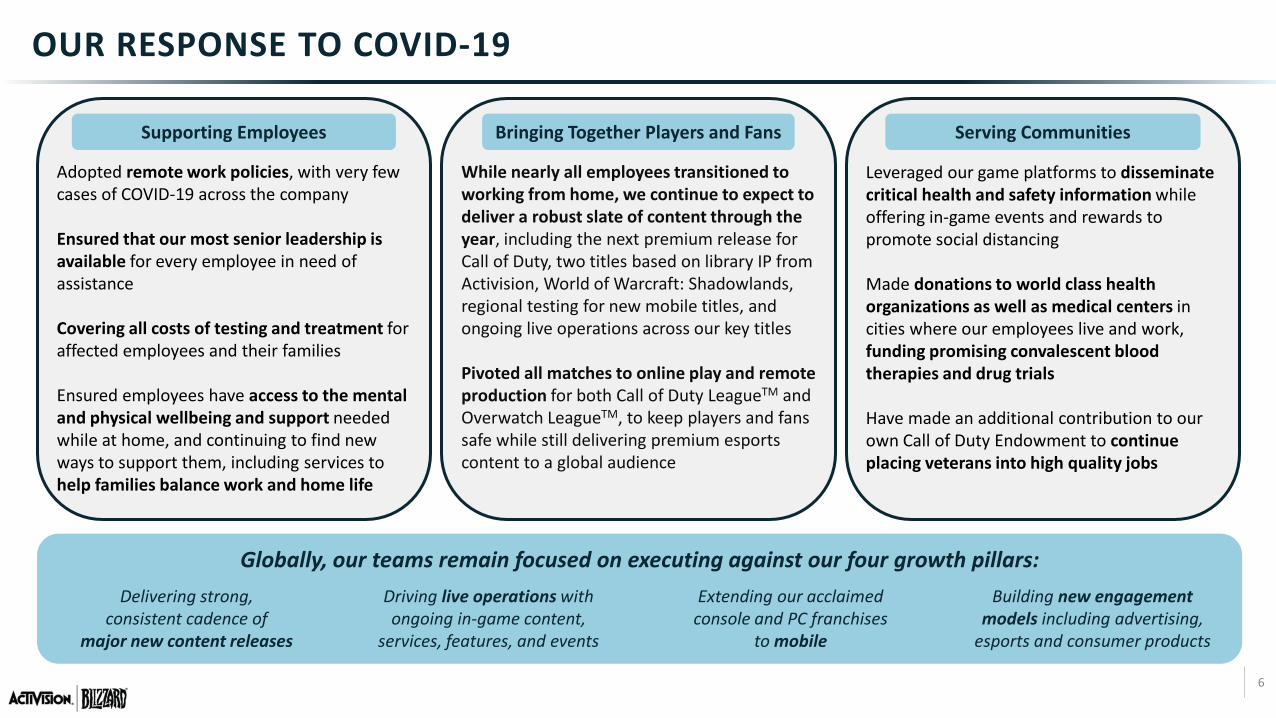
Supporting Employees Bringing Together Players and Fans Serving Communities
Adopted remote work policies, with very few cases of COVID-19 across the company
Ensured that our most senior leadership is available for every employee in need of assistance
Covering all costs of testing and treatment for affected employees and their families
Ensured employees have access to the mental and physical wellbeing and support needed while at home, and continuing to find new ways to support them, including services to help families balance work and home life
While nearly all employees transitioned to working from home, we continue to expect to deliver a robust slate of content through the year, including the next premium release for Call of Duty, two titles based on library IP from Activision, World of Warcraft: Shadowlands, regional testing for new mobile titles, and ongoing live operations across our key titles
Pivoted all matches to online play and remote production for both Call of Duty LeagueTM and Overwatch LeagueTM, to keep players and fans safe while still delivering premium esports content to a global audience
Leveraged our game platforms to disseminate critical health and safety information while offering in-game events and rewards to promote social distancing
Made donations to world class health organizations as well as medical centers in cities where our employees live and work, funding promising convalescent blood therapies and drug trials
Have made an additional contribution to our own Call of Duty Endowment to continue placing veterans into high quality jobs
Globally, our teams remain focused on executing against our four growth pillars:Delivering strong,
consistent cadence of major new content releases
Driving live operations with ongoing in-game content,
services, features, and events
Extending our acclaimed console and PC franchises
to mobile
Building new engagement models including advertising,
esports and consumer products
7
Monthly Active Users1 of 102M
1 MAUs defined as number of individuals who accessed a particular game in a given month averaged across the number of months in a respective period. Refer to the definition included in today’s earnings release for additional details.2 In-game net bookings primarily includes the net amount of downloadable content and microtransactions sold during the period, and is equal to in-game net revenues excluding the impact from deferrals.
ACTIVISION
• In both January and February, Call of Duty: Modern Warfare® saw substantial Y/Y growth in engagement, sell-through, and in-game net bookings2
• Warzone brought in 60M+ players since the March 10 launch
• Life-to-date, Modern Warfare has sold through more units and has more players than any prior Call of Duty title at this point after its release
• In Q1, Modern Warfare unit sell-through achieved franchise record levels for outside of a launch quarter. Following substantial Y/Y growth versus the prior title in January and February, unit sell-through accelerated in March, driven by upgrades from Warzone
• Q1 in-game net bookings2 for Modern Warfare more than doubled Y/Y versus Black Ops 4
• Momentum continued in April with the launch of Season 3 in-game content, which is the best-performing season to-date for both engagement and player investment
• Call of Duty Mobile continued to build on last October’s breakout launch with new content, features and events aimed at optimizing engagement, retention and player investment
• The game saw increased reach and engagement in March, driven by an accelerated cadence of compelling content and events, and rising demand from stay-at-home tailwinds
• April’s Season 5 delivered the highest monthly in-game net bookings2 since Season 1
8
BLIZZARDMonthly Active Users1 of 32M
• After doubling in the second half of 2019, World of Warcraft’s active player community2 increased further in Q1, as the team continued to deliver more content between expansions than ever before
• Reach and engagement were particularly strong as regions introduced shelter-at-home measures through the quarter, with momentum increasing further in April
• Increased engagement in modern WoW drove accelerating pre-sales for the upcoming Shadowlandsexpansion, slated for the second half of this year
1 MAUs defined as number of individuals who accessed a particular game in a given month averaged across the number of months in a respective period. Refer to the definition included in today’s earnings release for additional details.2 Defined as players with monthly or longer-term subscriptions.
• Hearthstone® engagement improved sequentially, driven by the new Battlegrounds mode launched in November, and strong execution in live operations
• Overwatch® engagement increased meaningfully in March as its latest seasonal event coincided with stay-at-home effects
• Diablo® ImmortalTM, developed for mobile in partnership with NetEase, remains on track to begin regional testing in the middle of the year
9
KINGMonthly Active Users1 of 273M
• In Q1, MAUs1 grew M/M in January and February, and then accelerated further in March as shelter-at-home conditions came into effect
• Payer trends improved in January and February and stepped up further in both March and April. With increased engagement and payer conversion, King’s in-game net bookings2 grew by a low double-digit percentage Y/Y in April
• In Q1, advertising net bookings3 grew more than 75% Y/Y. While the business saw slower growth in March, against the backdrop of a sudden decline in demand across the digital advertising sector, net bookings continued to grow Y/Y in March and grew over 20% Y/Y in April
1 MAUs defined as number of individuals who accessed a particular game in a given month averaged across the number of months in a respective period. Refer to the definition included in today’s earnings release for additional details.2 In-game net bookings primarily includes the net amount of downloadable content and microtransactions sold during the period, and is equal to in-game net revenues excluding the impact from deferrals.3 Net bookings is an operating metric that is defined as the net amount of products and services sold digitally or sold-in physically in the period, and includes license fees, merchandise, and publisher incentives,among others and is equal to net revenues excluding the impact from deferrals.4 Based on App Annie Intelligence.
• In Q1, Candy Crush franchise MAUs1 grew Y/Y in each month of the quarter, with double-digit growth in March
• The Candy Crush community played more game rounds than in any quarter since Activision Blizzard’s acquisition of King
• Candy Crush SagaTM and the wider Candy Crush franchise were again the top-grossing title and franchise on US app stores4
10
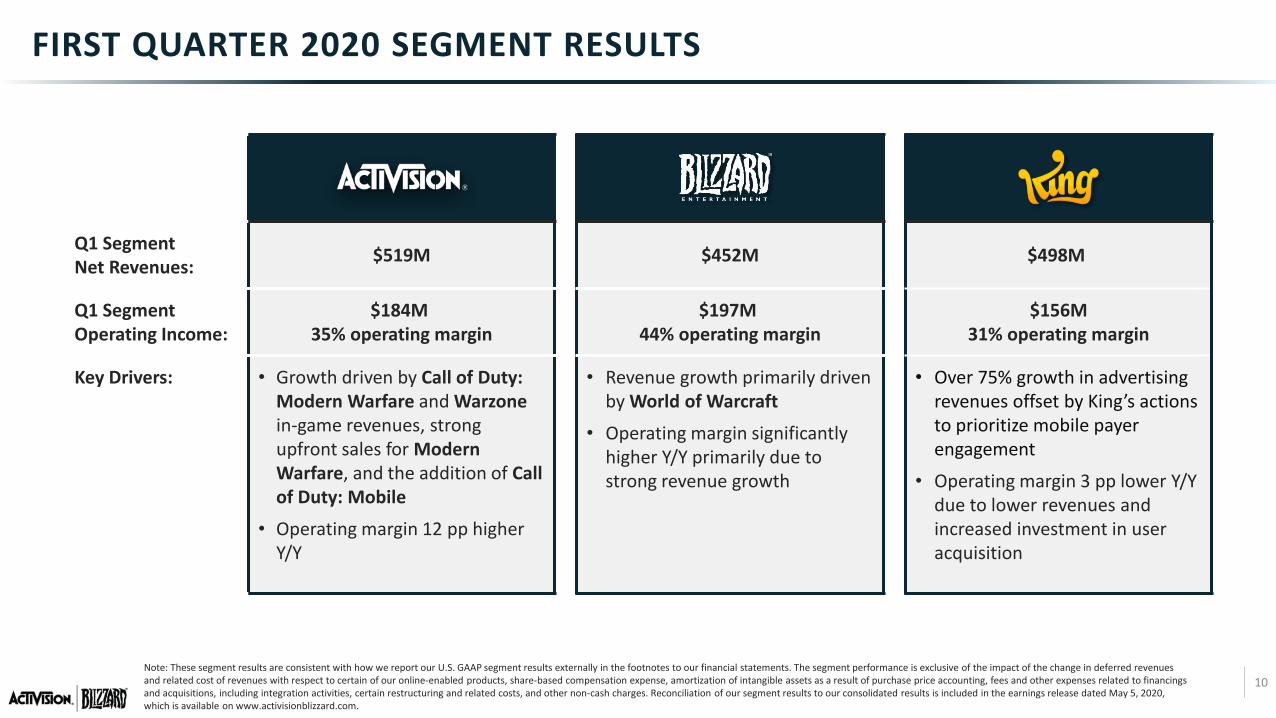
FIRST QUARTER 2020 SEGMENT RESULTS
Note: These segment results are consistent with how we report our U.S. GAAP segment results externally in the footnotes to our financial statements. The segment performance is exclusive of the impact of the change in deferred revenues and related cost of revenues with respect to certain of our online-enabled products, share-based compensation expense, amortization of intangible assets as a result of purchase price accounting, fees and other expenses related to financings and acquisitions, including integration activities, certain restructuring and related costs, and other non-cash charges. Reconciliation of our segment results to our consolidated results is included in the earnings release dated May 5, 2020, which is available on www.activisionblizzard.com.
Q1 Segment Net Revenues: $519M $452M $498M
Q1 Segment Operating Income:
$184M35% operating margin
$197M44% operating margin
$156M31% operating margin
Key Drivers: • Growth driven by Call of Duty: Modern Warfare and Warzonein-game revenues, strong upfront sales for Modern Warfare, and the addition of Call of Duty: Mobile
• Operating margin 12 pp higher Y/Y
• Revenue growth primarily driven by World of Warcraft
• Operating margin significantly higher Y/Y primarily due to strong revenue growth
• Over 75% growth in advertising revenues offset by King’s actions to prioritize mobile payer engagement
• Operating margin 3 pp lower Y/Y due to lower revenues and increased investment in user acquisition
11
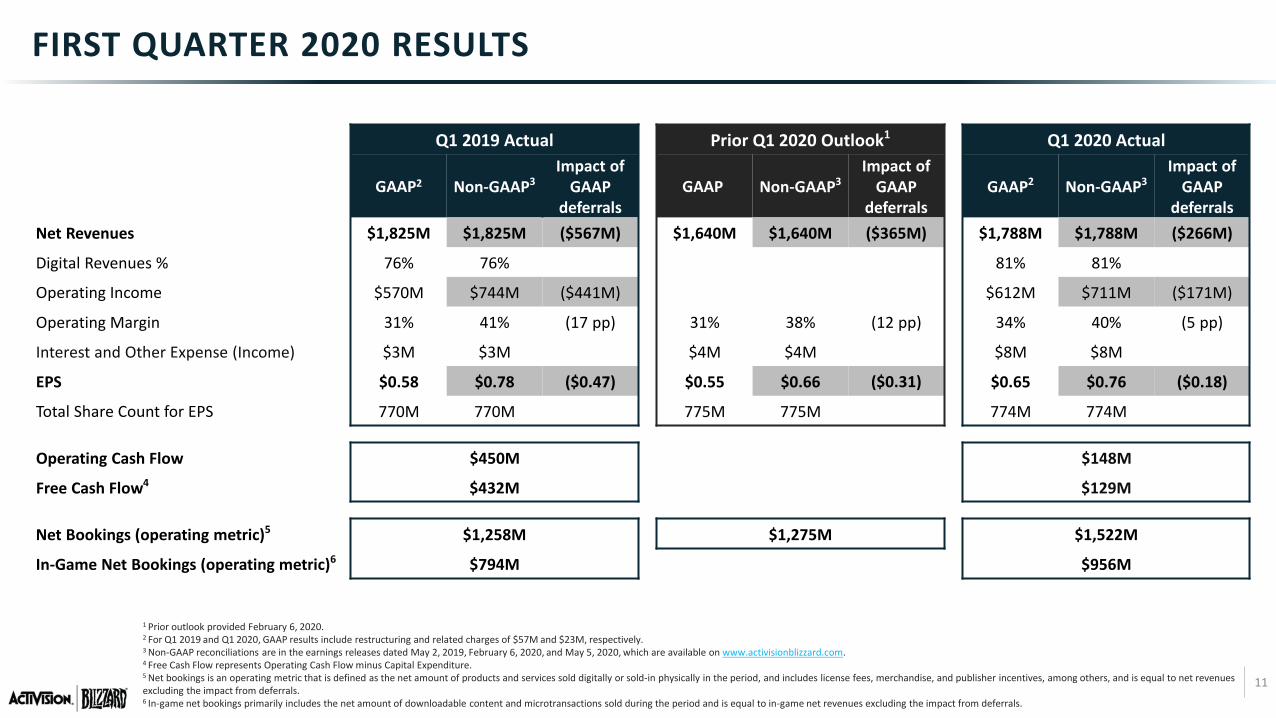
FIRST QUARTER 2020 RESULTS
1 Prior outlook provided February 6, 2020. 2 For Q1 2019 and Q1 2020, GAAP results include restructuring and related charges of $57M and $23M, respectively.3 Non-GAAP reconciliations are in the earnings releases dated May 2, 2019, February 6, 2020, and May 5, 2020, which are available on www.activisionblizzard.com. 4 Free Cash Flow represents Operating Cash Flow minus Capital Expenditure. 5 Net bookings is an operating metric that is defined as the net amount of products and services sold digitally or sold-in physically in the period, and includes license fees, merchandise, and publisher incentives, among others, and is equal to net revenues excluding the impact from deferrals.6 In-game net bookings primarily includes the net amount of downloadable content and microtransactions sold during the period and is equal to in-game net revenues excluding the impact from deferrals.
Q1 2019 Actual Prior Q1 2020 Outlook1 Q1 2020 Actual
GAAP2 Non-GAAP3Impact of
GAAP deferrals
GAAP Non-GAAP3Impact of
GAAP deferrals
GAAP2 Non-GAAP3Impact of
GAAP deferrals
Net Revenues $1,825M $1,825M ($567M) $1,640M $1,640M ($365M) $1,788M $1,788M ($266M)
Digital Revenues % 76% 76% 81% 81%
Operating Income $570M $744M ($441M) $612M $711M ($171M)
Operating Margin 31% 41% (17 pp) 31% 38% (12 pp) 34% 40% (5 pp)
Interest and Other Expense (Income) $3M $3M $4M $4M $8M $8M
EPS $0.58 $0.78 ($0.47) $0.55 $0.66 ($0.31) $0.65 $0.76 ($0.18)
Total Share Count for EPS 770M 770M 775M 775M 774M 774M
Operating Cash Flow $450M $148M
Free Cash Flow4 $432M $129M
Net Bookings (operating metric)5 $1,258M $1,275M $1,522M
In-Game Net Bookings (operating metric)6 $794M $956M
12
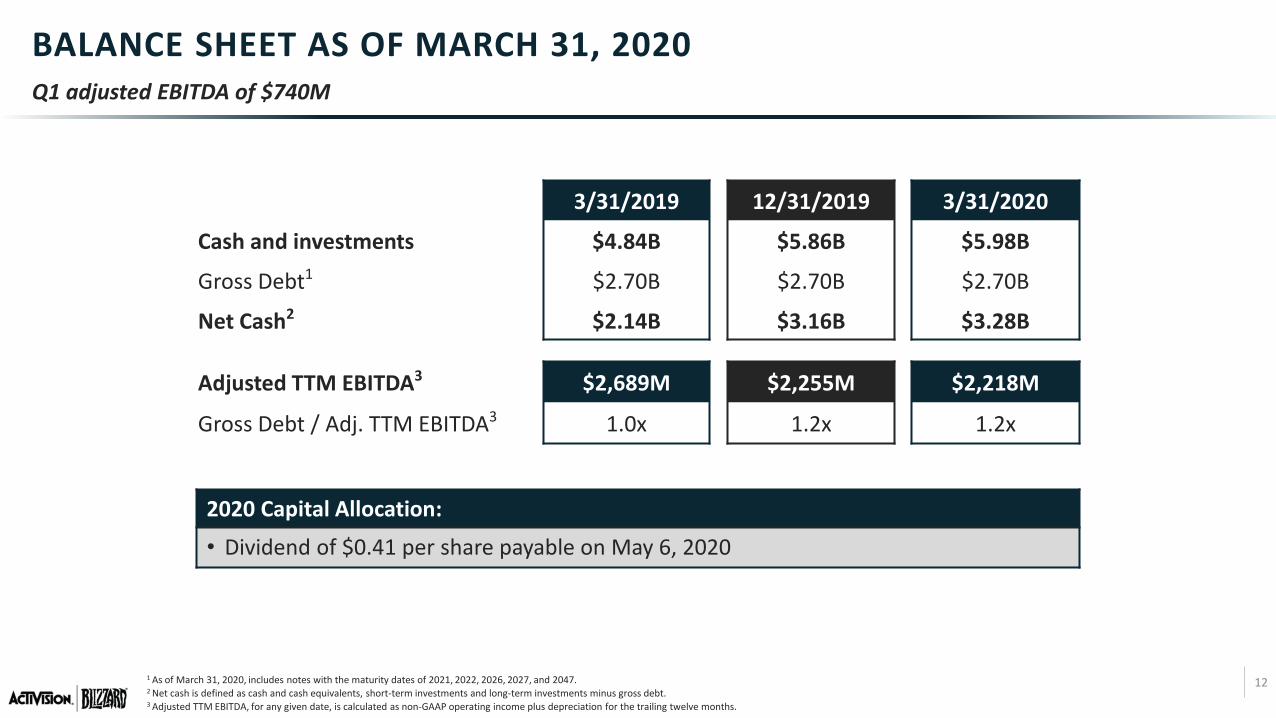
BALANCE SHEET AS OF MARCH 31, 2020Q1 adjusted EBITDA of $740M
1 As of March 31, 2020, includes notes with the maturity dates of 2021, 2022, 2026, 2027, and 2047.2 Net cash is defined as cash and cash equivalents, short-term investments and long-term investments minus gross debt.3 Adjusted TTM EBITDA, for any given date, is calculated as non-GAAP operating income plus depreciation for the trailing twelve months.
3/31/2019 12/31/2019 3/31/2020
Cash and investments $4.84B $5.86B $5.98B
Gross Debt1 $2.70B $2.70B $2.70B
Net Cash2 $2.14B $3.16B $3.28B
Adjusted TTM EBITDA3 $2,689M $2,255M $2,218M
Gross Debt / Adj. TTM EBITDA3 1.0x 1.2x 1.2x
2020 Capital Allocation:
• Dividend of $0.41 per share payable on May 6, 2020
13
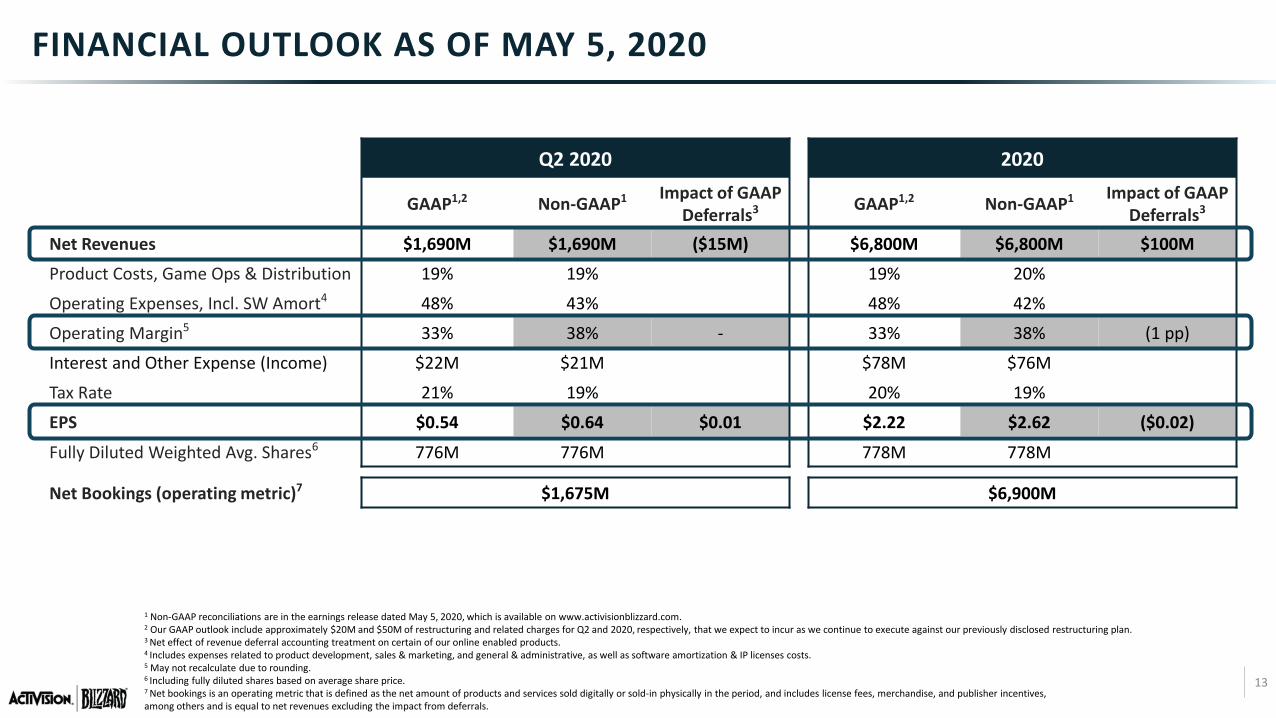
FINANCIAL OUTLOOK AS OF MAY 5, 2020
1 Non-GAAP reconciliations are in the earnings release dated May 5, 2020, which is available on www.activisionblizzard.com. 2 Our GAAP outlook include approximately $20M and $50M of restructuring and related charges for Q2 and 2020, respectively, that we expect to incur as we continue to execute against our previously disclosed restructuring plan.3 Net effect of revenue deferral accounting treatment on certain of our online enabled products. 4 Includes expenses related to product development, sales & marketing, and general & administrative, as well as software amortization & IP licenses costs. 5 May not recalculate due to rounding.6 Including fully diluted shares based on average share price.7 Net bookings is an operating metric that is defined as the net amount of products and services sold digitally or sold-in physically in the period, and includes license fees, merchandise, and publisher incentives,among others and is equal to net revenues excluding the impact from deferrals.
Q2 2020 2020
GAAP1,2 Non-GAAP1 Impact of GAAP Deferrals3 GAAP1,2 Non-GAAP1 Impact of GAAP
Deferrals3
Net Revenues $1,690M $1,690M ($15M) $6,800M $6,800M $100M
Product Costs, Game Ops & Distribution 19% 19% 19% 20%
Operating Expenses, Incl. SW Amort4 48% 43% 48% 42%
Operating Margin5 33% 38% - 33% 38% (1 pp)
Interest and Other Expense (Income) $22M $21M $78M $76M
Tax Rate 21% 19% 20% 19%
EPS $0.54 $0.64 $0.01 $2.22 $2.62 ($0.02)
Fully Diluted Weighted Avg. Shares6 776M 776M 778M 778M
Net Bookings (operating metric)7 $1,675M $6,900M
Q&AMAY 5, 2020