Embed Size (px)
Citation preview
Investment products are: NOT FDIC INSURED – NO BANK GUARANTEE – MAY LOSE VALUE
May 7, 2014
BMO Economy and MarketsRetrospective and Perspective

BMO Economy and Markets: Retrospective and Perspective • May 7, 20141
Retrospective and PerspectiveApril – Post weather beating, economic data improves
Review
TOTAL RETURNS (as of 04/30/2014) April YTD 2014 2013
S&P 500® Index 0.74 2.56 32.38
STOXX Europe 600 Index 1.64 4.28 21.56
MSCI Emerging Markets Index 0.33 -0.10 -2.60
U.S. 10-Yr Treasury 0.88 4.29 -7.84
Sources: Bloomberg L.P., BMO Global Asset Management
April wiped some sweat off investors’ brows as weather did appear to be the culpritbehind weaker economic results in the first two to three months of 2014. April datatook some pressure off, as a number of key economic readings improved.U.S.: Perhaps the most encouraging numbers came from the two most recent jobsreports, as non-farm payrolls rose 203,000 in March and in April jumped to 288,000.There was also broad participation in hiring across sectors including constructionand manufacturing, not just the usual hospitality and retail components. Reportsalso indicated that earned income and hours worked inched higher.Outside of hiring, there were other positives of note. Manufacturing activity stayed inpositive territory, and durable goods orders and industrial production also improved.Companies like Boeing, Caterpillar and General Electric each posted profit andsales results that bettered expectations. Auto sales jumped back from a 15.3 millionannual rate to over 16 million.Two-thirds of S&P 500® Index companies that have reported earnings for the firstquarter exceeded expectations, even though 40% of S&P companies reported theirbusiness was negatively affected by weather.Housing continued to show a mixed bag of results and some metrics here may alsobe weather related. Existing home sales slowed for the third month in a row. But onthe other hand, building permits and housing starts improved. So stay tuned.With this economic reassurance, large cap stocks did well, but mid and small capstocks struggled. Biotech and social media really suffered; stocks may also havebeen spooked by the geopolitics of Ukraine/Russia, etc. Investment grade bondsand Treasuries did well for the month, as yields lowered.Europe: On balance, better news came out of Europe during the month. The EUreported both manufacturing and service results that continue to stay above aneutral reading of 50. Germany in particular came in with improved numbers forservices and manufacturing, including gains in industrial production, which nowstands at a three-year high. Retail sales also moved up nicely in Germany. TheUnited Kingdom continues to post improved results across both the retail andindustrial components of their economy, too.Perhaps one of the big shockers in Europe for the month was Greece, whichbrought a five-year sovereign bond to market; and it was priced to yield 4.95%, a farcry from the 37% rate peak of just a few years ago; and the bond was over-subscribed.
The European Central Bank kept rates unchanged at 0.25%. While on hold for sometime, they continue to watch and hope for sign of some increase in inflation andupticks in growth. In spite of the proximity to the Ukraine and the reliance on energysupplies from Russia which run through Ukraine, EU stocks ended up 1.6% for themonth.Emerging Markets (EM): The MSCI Emerging Market Index, which is dominated bythe BRIC countries, was up only 0.3% in April. While China reported better-than-expected GDP growth at 7.4% and retail sales grew 12% year-over-year, concernsremain regarding China’s long-term growth rate and the rapid expansion of credit thathas occurred.In Russia, the conflict over Ukraine clobbered Russian equities and the ruble. Theeconomy, which was slowing already, is now near recession. The central bankraised rates from 5.5% to 7.25% in an attempt to buttress the currency, etc. ─ afurther drag on EM performance.Brazil raised interest rates again and inflation finally started to ease a bit. In addition,their index of economic activity posted a modest gain. In India, national electionsloom; an effective pro-reform platform could be a tailwind for India.Japan: Value-added sales tax went from 5 to 8% on April 1. It will take a few monthsto judge its impact, but it’s a critical watch point.
Important forward-looking issues:• Progress on resolving Ukraine conflict• India’ s election results• Second quarter GDP in U.S. and interest rate direction
BMO Economy and Markets: Retrospective and Perspective • May 7, 20142
Highlighted Chart
32.4
59.4
25.5
22.2
19.1
15.6 21
.6
35.7
29.7
27.8
-15.
5
6.2 10
.7
-3.9
2.6
-11.
5
0.5 5.
0
1.9
14.1
15.1
8.8
6.0 6.9
0.2
-13.
1
6.2
-4.2
0.7
-3.5
0.5 2.6
3.1
-0.7
0.4
-1.7
-7.8
1.6 2.4
-4.6
0.1
-0.3
-20
-10
0
10
20
30
40
50
60
70U
.S.
Japa
n
Ger
man
y
Fran
ce
U.K
.
Portu
gal
Italy
Irela
nd
Gre
ece
Spai
n
Braz
il
Rus
sia
Indi
a
Chi
na
Tota
l Ret
urn
(%)
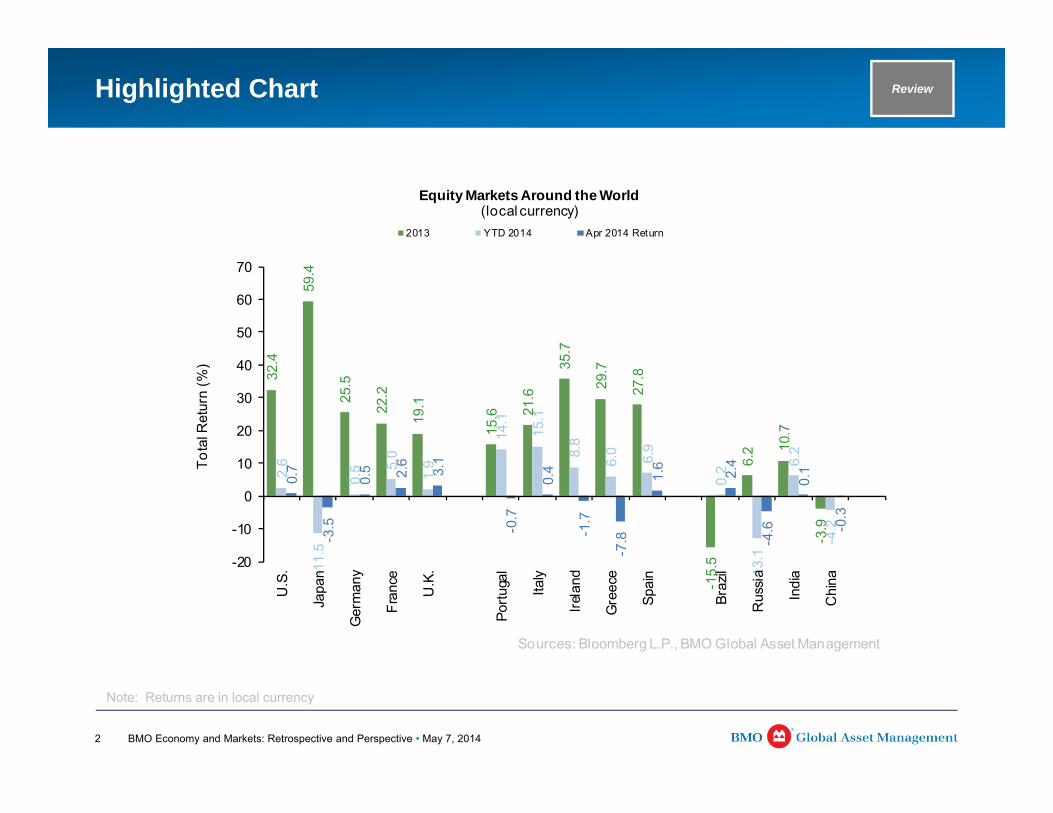
Equity Markets Around the World(local currency)
2013 YTD 2014 Apr 2014 Return
Sources: Bloomberg L.P., BMO Global Asset Management
Review
Note: Returns are in local currency
BMO Economy and Markets: Retrospective and Perspective • May 7, 20143
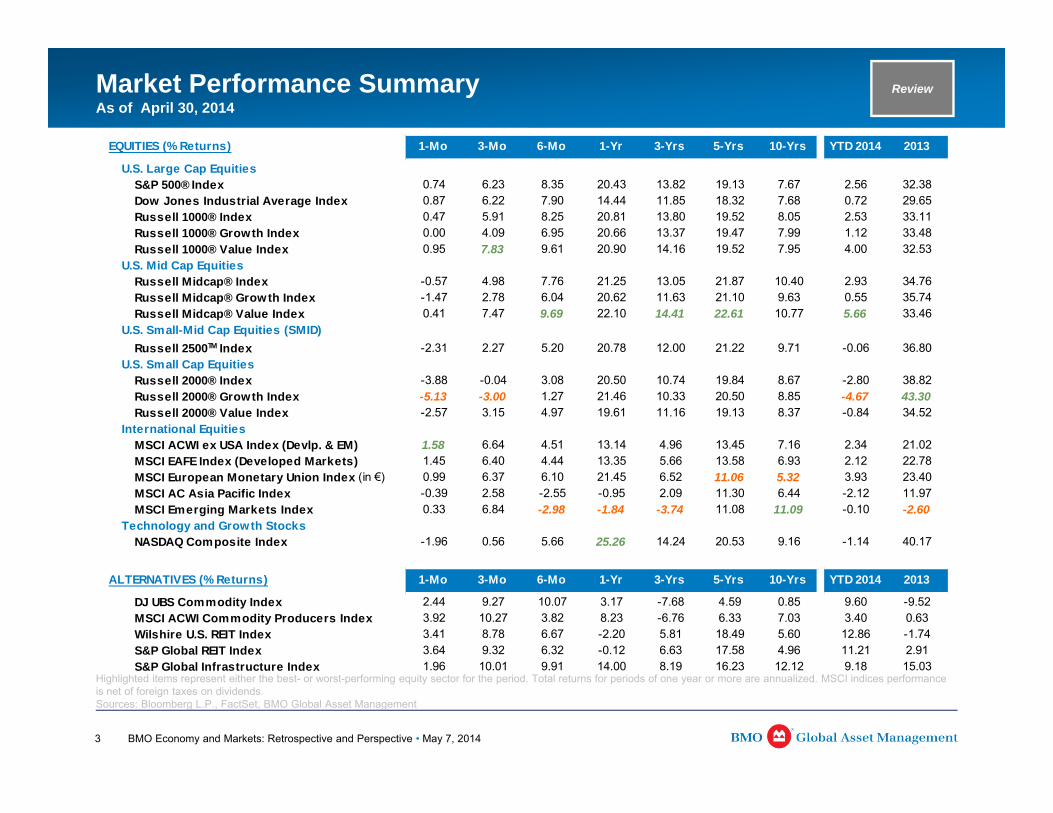
Highlighted items represent either the best- or worst-performing equity sector for the period. Total returns for periods of one year or more are annualized. MSCI indices performance is net of foreign taxes on dividends. Sources: Bloomberg L.P., FactSet, BMO Global Asset Management
Market Performance SummaryAs of April 30, 2014
Review
EQUITIES (% Returns) 1-Mo 3-Mo 6-Mo 1-Yr 3-Yrs 5-Yrs 10-Yrs YTD 2014 2013
U.S. Large Cap EquitiesS&P 500® Index 0.74 6.23 8.35 20.43 13.82 19.13 7.67 2.56 32.38Dow Jones Industrial Average Index 0.87 6.22 7.90 14.44 11.85 18.32 7.68 0.72 29.65Russell 1000® Index 0.47 5.91 8.25 20.81 13.80 19.52 8.05 2.53 33.11Russell 1000® Growth Index 0.00 4.09 6.95 20.66 13.37 19.47 7.99 1.12 33.48Russell 1000® Value Index 0.95 7.83 9.61 20.90 14.16 19.52 7.95 4.00 32.53
U.S. Mid Cap EquitiesRussell Midcap® Index -0.57 4.98 7.76 21.25 13.05 21.87 10.40 2.93 34.76Russell Midcap® Growth Index -1.47 2.78 6.04 20.62 11.63 21.10 9.63 0.55 35.74Russell Midcap® Value Index 0.41 7.47 9.69 22.10 14.41 22.61 10.77 5.66 33.46
U.S. Small-Mid Cap Equities (SMID)Russell 2500TM Index -2.31 2.27 5.20 20.78 12.00 21.22 9.71 -0.06 36.80
U.S. Small Cap EquitiesRussell 2000® Index -3.88 -0.04 3.08 20.50 10.74 19.84 8.67 -2.80 38.82Russell 2000® Growth Index -5.13 -3.00 1.27 21.46 10.33 20.50 8.85 -4.67 43.30Russell 2000® Value Index -2.57 3.15 4.97 19.61 11.16 19.13 8.37 -0.84 34.52
International EquitiesMSCI ACWI ex USA Index (Devlp. & EM) 1.58 6.64 4.51 13.14 4.96 13.45 7.16 2.34 21.02MSCI EAFE Index (Developed Markets) 1.45 6.40 4.44 13.35 5.66 13.58 6.93 2.12 22.78MSCI European Monetary Union Index (in €) 0.99 6.37 6.10 21.45 6.52 11.06 5.32 3.93 23.40MSCI AC Asia Pacific Index -0.39 2.58 -2.55 -0.95 2.09 11.30 6.44 -2.12 11.97MSCI Emerging Markets Index 0.33 6.84 -2.98 -1.84 -3.74 11.08 11.09 -0.10 -2.60
Technology and Growth StocksNASDAQ Composite Index -1.96 0.56 5.66 25.26 14.24 20.53 9.16 -1.14 40.17
ALTERNATIVES (% Returns) 1-Mo 3-Mo 6-Mo 1-Yr 3-Yrs 5-Yrs 10-Yrs YTD 2014 2013
DJ UBS Commodity Index 2.44 9.27 10.07 3.17 -7.68 4.59 0.85 9.60 -9.52MSCI ACWI Commodity Producers Index 3.92 10.27 3.82 8.23 -6.76 6.33 7.03 3.40 0.63Wilshire U.S. REIT Index 3.41 8.78 6.67 -2.20 5.81 18.49 5.60 12.86 -1.74S&P Global REIT Index 3.64 9.32 6.32 -0.12 6.63 17.58 4.96 11.21 2.91S&P Global Infrastructure Index 1.96 10.01 9.91 14.00 8.19 16.23 12.12 9.18 15.03
BMO Economy and Markets: Retrospective and Perspective • May 7, 20144
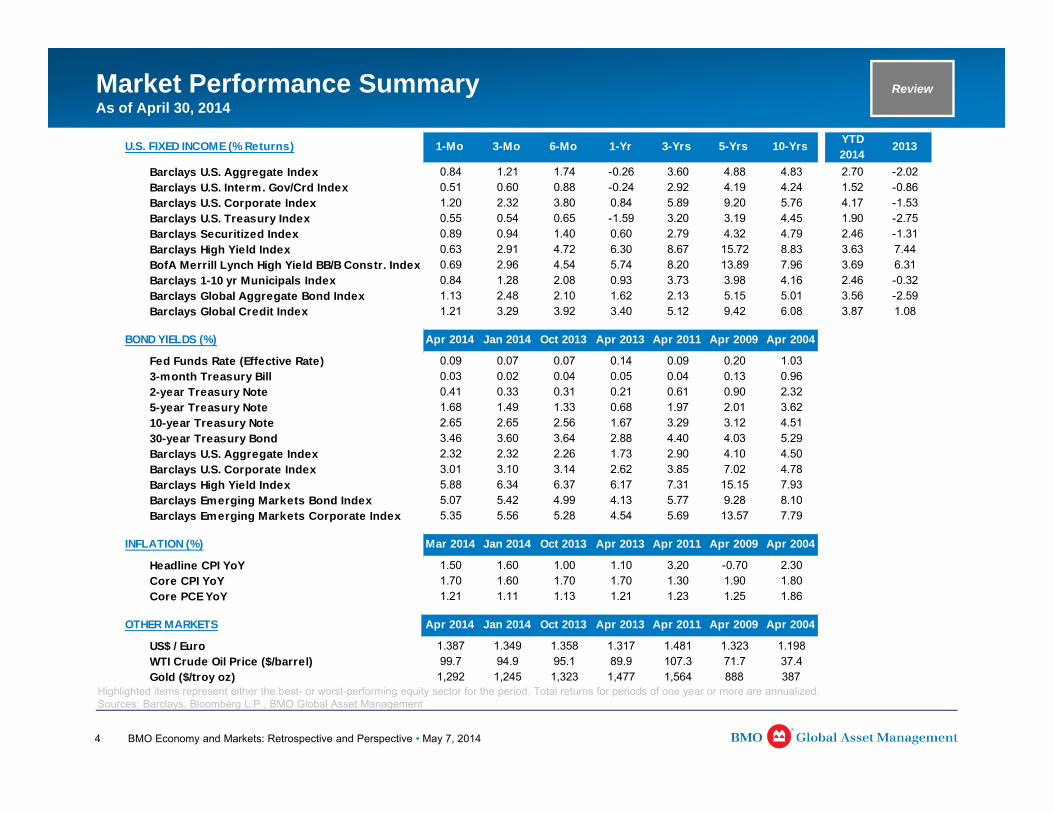
Highlighted items represent either the best- or worst-performing equity sector for the period. Total returns for periods of one year or more are annualized. Sources: Barclays, Bloomberg L.P., BMO Global Asset Management
ReviewMarket Performance SummaryAs of April 30, 2014
U.S. FIXED INCOME (% Returns) 1-Mo 3-Mo 6-Mo 1-Yr 3-Yrs 5-Yrs 10-Yrs YTD 2014
2013
Barclays U.S. Aggregate Index 0.84 1.21 1.74 -0.26 3.60 4.88 4.83 2.70 -2.02Barclays U.S. Interm. Gov/Crd Index 0.51 0.60 0.88 -0.24 2.92 4.19 4.24 1.52 -0.86Barclays U.S. Corporate Index 1.20 2.32 3.80 0.84 5.89 9.20 5.76 4.17 -1.53Barclays U.S. Treasury Index 0.55 0.54 0.65 -1.59 3.20 3.19 4.45 1.90 -2.75Barclays Securitized Index 0.89 0.94 1.40 0.60 2.79 4.32 4.79 2.46 -1.31Barclays High Yield Index 0.63 2.91 4.72 6.30 8.67 15.72 8.83 3.63 7.44BofA Merrill Lynch High Yield BB/B Constr. Index 0.69 2.96 4.54 5.74 8.20 13.89 7.96 3.69 6.31Barclays 1-10 yr Municipals Index 0.84 1.28 2.08 0.93 3.73 3.98 4.16 2.46 -0.32Barclays Global Aggregate Bond Index 1.13 2.48 2.10 1.62 2.13 5.15 5.01 3.56 -2.59Barclays Global Credit Index 1.21 3.29 3.92 3.40 5.12 9.42 6.08 3.87 1.08
BOND YIELDS (%) Apr 2014 Jan 2014 Oct 2013 Apr 2013 Apr 2011 Apr 2009 Apr 2004
Fed Funds Rate (Effective Rate) 0.09 0.07 0.07 0.14 0.09 0.20 1.033-month Treasury Bill 0.03 0.02 0.04 0.05 0.04 0.13 0.962-year Treasury Note 0.41 0.33 0.31 0.21 0.61 0.90 2.325-year Treasury Note 1.68 1.49 1.33 0.68 1.97 2.01 3.6210-year Treasury Note 2.65 2.65 2.56 1.67 3.29 3.12 4.5130-year Treasury Bond 3.46 3.60 3.64 2.88 4.40 4.03 5.29Barclays U.S. Aggregate Index 2.32 2.32 2.26 1.73 2.90 4.10 4.50Barclays U.S. Corporate Index 3.01 3.10 3.14 2.62 3.85 7.02 4.78Barclays High Yield Index 5.88 6.34 6.37 6.17 7.31 15.15 7.93Barclays Emerging Markets Bond Index 5.07 5.42 4.99 4.13 5.77 9.28 8.10Barclays Emerging Markets Corporate Index 5.35 5.56 5.28 4.54 5.69 13.57 7.79
INFLATION (%) Mar 2014 Jan 2014 Oct 2013 Apr 2013 Apr 2011 Apr 2009 Apr 2004
Headline CPI YoY 1.50 1.60 1.00 1.10 3.20 -0.70 2.30Core CPI YoY 1.70 1.60 1.70 1.70 1.30 1.90 1.80Core PCE YoY 1.21 1.11 1.13 1.21 1.23 1.25 1.86
OTHER MARKETS Apr 2014 Jan 2014 Oct 2013 Apr 2013 Apr 2011 Apr 2009 Apr 2004
US$ / Euro 1.387 1.349 1.358 1.317 1.481 1.323 1.198WTI Crude Oil Price ($/barrel) 99.7 94.9 95.1 89.9 107.3 71.7 37.4Gold ($/troy oz) 1,292 1,245 1,323 1,477 1,564 888 387
BMO Economy and Markets: Retrospective and Perspective • May 7, 20145
0.1
2.0
-0.1
-0.8
-0.2
-0.8
-1.0 -0.5 0.0 0.5 1.0 1.5 2.0 2.5
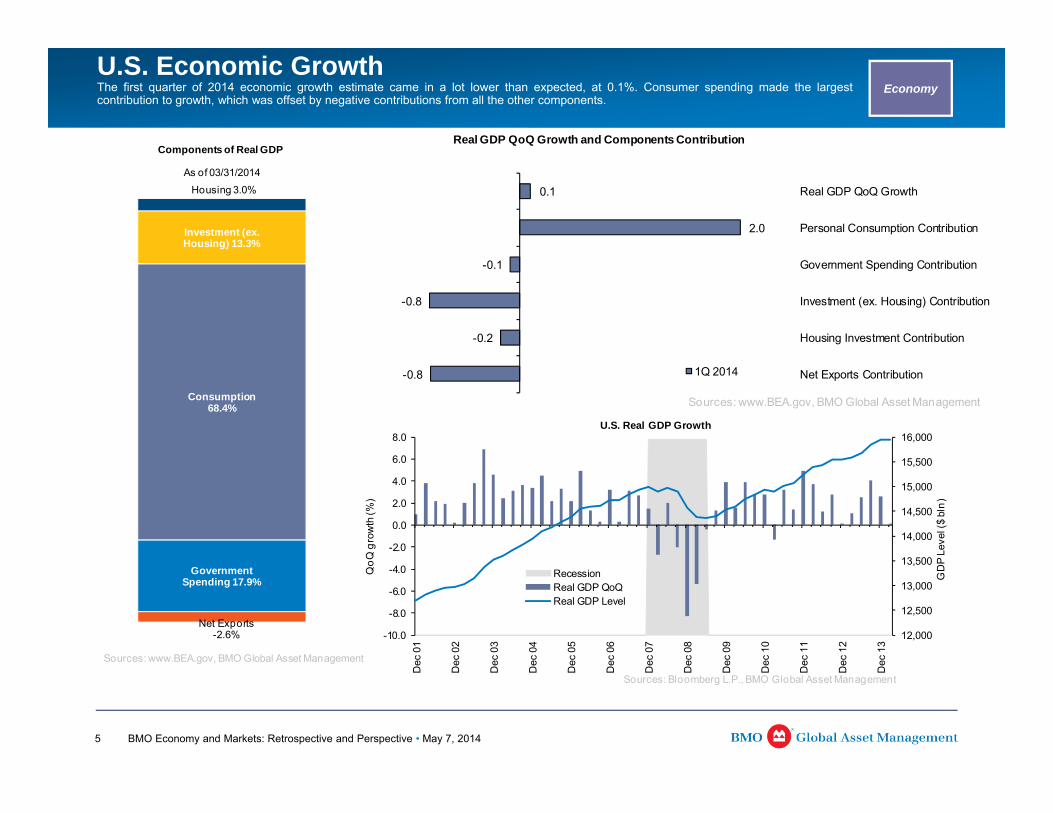
Real GDP QoQ Growth
Personal Consumption Contribution
Government Spending Contribution
Investment (ex. Housing) Contribution
Housing Investment Contribution
Net Exports Contribution
Real GDP QoQ Growth and Components Contribution
1Q 2014
Sources: www.BEA.gov, BMO Global Asset Management
Government Spending 17.9%
Consumption 68.4%
Investment (ex. Housing) 13.3%
Housing 3.0%
Net Exports-2.6%
Components of Real GDP
Sources: www.BEA.gov, BMO Global Asset Management
As of 03/31/2014
12,000
12,500
13,000
13,500
14,000
14,500
15,000
15,500
16,000
-10.0
-8.0
-6.0
-4.0
-2.0
0.0
2.0
4.0
6.0
8.0
Dec
01
Dec
02
Dec
03
Dec
04
Dec
05
Dec
06
Dec
07
Dec
08
Dec
09
Dec
10
Dec
11
Dec
12
Dec
13
GD
P Le
vel (
$ bl
n)
QoQ
gro
wth
(%)
U.S. Real GDP Growth
RecessionReal GDP QoQReal GDP Level
Sources: Bloomberg L.P., BMO Global Asset Management
U.S. Economic GrowthThe first quarter of 2014 economic growth estimate came in a lot lower than expected, at 0.1%. Consumer spending made the largestcontribution to growth, which was offset by negative contributions from all the other components.
Economy
BMO Economy and Markets: Retrospective and Perspective • May 7, 20146
-10-9-8-7-6-5-4-3-2-10
-1,100
-900
-700
-500
-300
-100
100
300
500
700D
ec 0
6
Jun
07
Dec
07
Jun
08
Dec
08
Jun
09
Dec
09
Jun
10
Dec
10
Jun
11
Dec
11
Jun
12
Dec
12
Jun
13
Dec
13
Cum
ulat
ive
(mill
jobs
)
Mon
thly
(thou
sand
jobs
)
Job Gain/Losses
MonthlyCumulative
Sources: Bloomberg L.P., BMO Global Asset Management
5%
28%
15%
11%
10%
7%
5%
4%
3%
1%
1%
-2%
-3%
-4%
-6%
2%
6%
4%
3%
2%
2%
2%
2%
1%
1%
1%
0%
3%
0%
-1%
Total Non-Farm Payrolls
Natural Res./Mining
Professional and Business Services
Leisure and Hospitality
Education and Health Services
Transportation and Warehousing
Retail
Wholesale
Other Services
Manufacturing
Finance, Insurance, and Real Estate
Utilities
Construction
Govt Payrolls
Information
Payrolls Change by Industry
5-Yr Payroll Change
1-Yr Payroll Change
Sources: Bloomberg L.P., BMO Global Asset Management
As of 04/30/2014
250300
350400
450
500550
600650
700
2.02.53.03.54.04.55.05.56.06.57.0
Dec
06
Dec
07
Dec
08
Dec
09
Dec
10
Dec
11
Dec
12
Dec
13
Initi
al C
laim
s (4
wee
k av
g, in
thou
sand
s)
Con
tinui
ng C
laim
s (th
ousa
nds)
Jobless Claims
Continuing ClaimsInitial Jobless Claims
Sources: Bloomberg L.P., BMO Global Asset Management
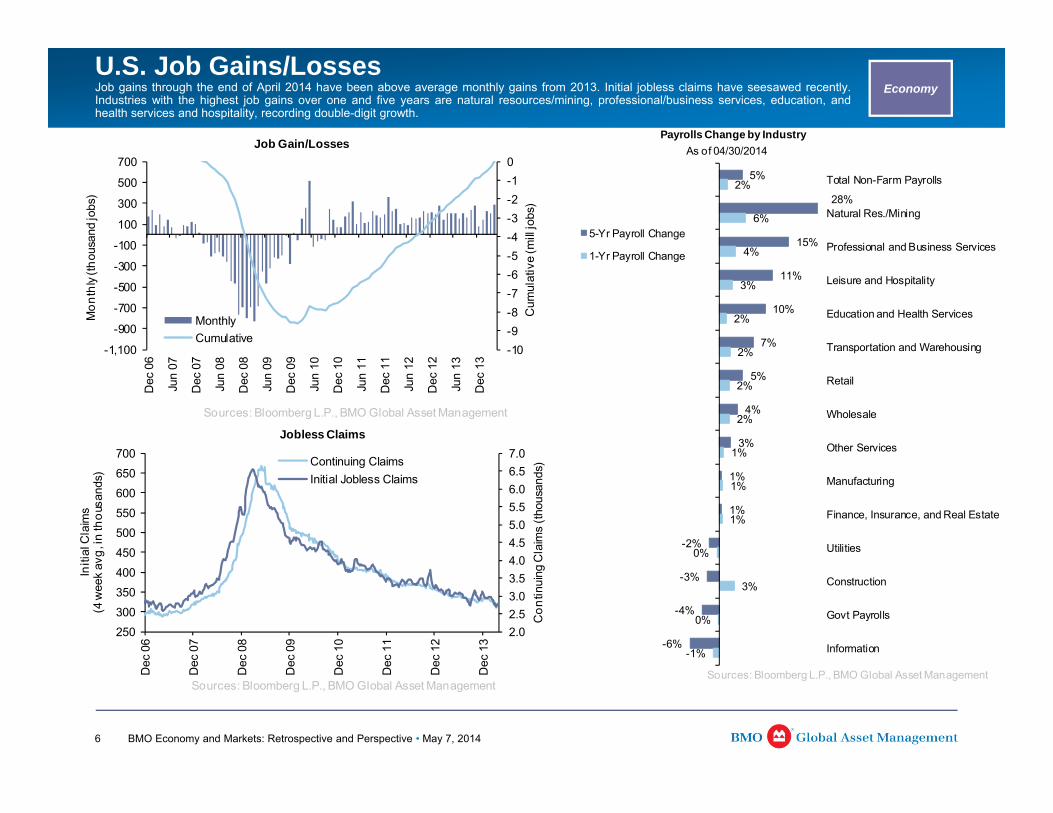
EconomyU.S. Job Gains/LossesJob gains through the end of April 2014 have been above average monthly gains from 2013. Initial jobless claims have seesawed recently.Industries with the highest job gains over one and five years are natural resources/mining, professional/business services, education, andhealth services and hospitality, recording double-digit growth.

BMO Economy and Markets: Retrospective and Perspective • May 7, 20147
-4.0
0.0
4.0
8.0
12.0
16.0
1997
1998
1999
2000
2001
2002
2003
2004
2005
2006
2007
2008
2009
2010
2011
2012
2013
Developed Countries CPI (YoY %)
World EuropeG10 Countries U.S.
Sources: Bloomberg L.P., BMO Global Asset Management
World Economic Growth and InflationYear-over-year Eurozone economic growth crossed into positive territory in fourth quarter 2013, after seven straight quarters of economiccontraction. China’s GDP growth in first quarter 2014 was 7.4%, slightly below the prior quarter growth of 7.7%. While world inflation has beendeclining slightly since the end of third quarter 2011, Japan, India and even China have seen higher inflation.
-15.0
-10.0
-5.0
0.0
5.0
10.0
15.0
2006
2007
2008
2009
2010
2011
2012
2013
YoY
GD
P G
row
th (%
)
Real GDP Growth for Developed Countries
Eurozone Germany France Japan
Sources: Bloomberg L.P., BMO Global Asset Management
-15.0
-10.0
-5.0
0.0
5.0
10.0
15.0
20.0
2006
2007
2008
2009
2010
2011
2012
2013
YoY
GD
P G
row
th (%
)
Real GDP Growth for BRIC Countries
Brazil Russia India China
Sources: Bloomberg L.P., BMO Global Asset Management
Economy
-4.0
0.0
4.0
8.0
12.0
16.0
1997
1998
1999
2000
2001
2002
2003
2004
2005
2006
2007
2008
2009
2010
2011
2012
2013
Emerging Markets CPI (YoY %)
WorldBRICU.S.ChinaIndia
Sources: Bloomberg L.P., BMO Global Asset Management
BMO Economy and Markets: Retrospective and Perspective • May 7, 20148
Total returns are based on Russell-style indicesperformance and include dividends. Graphs depictprice levels only. Sources: Bloomberg L.P., BMOGlobal Asset Management.
550
650
750
850
950
1,050
1,150
Dec 11 Mar 12 Jun 12 Sep 12 Dec 12 Mar 13 Jun 13 Sep 13 Dec 13 Mar 14
Inde
x Le
vel
Large Cap Stocks
Russell 1000® Index2012:
16.4% TR
2013 : 33.1% TR
Sources: Bloomberg L.P., BMO Global Asset Management
YTD 2014 : 2.5% TR
600
700
800
900
1,000
1,100
1,200
1,300
Dec 11 Mar 12 Jun 12 Sep 12 Dec 12 Mar 13 Jun 13 Sep 13 Dec 13 Mar 14
Inde
x Le
vel
Small Cap Stocks
Russell 2000® Index
Sources: Bloomberg L.P., BMO Global Asset Management
2012: 16.4% TR
2013 : 38.8% TR
YTD 2014 : -2.8% TR
YTD4/30/2014
Value Blend Grow th
Larg
e
4.0 2.5 1.1
Mid 5.7 2.9 0.5
Smal
l
-0.8 -2.8 -4.7
Total Returns (%)
2013Value Blend Grow th
Larg
e
32.5 33.1 33.5
Mid 33.5 34.8 35.7
Smal
l
34.5 38.8 43.3
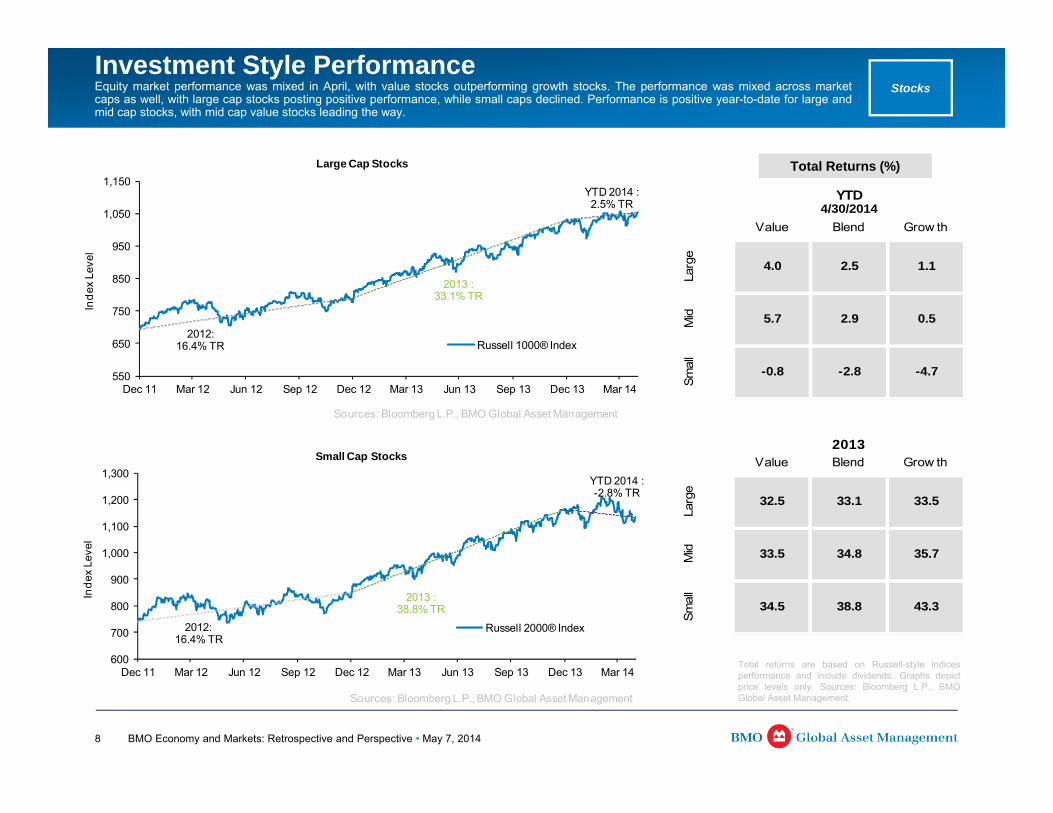
StocksInvestment Style PerformanceEquity market performance was mixed in April, with value stocks outperforming growth stocks. The performance was mixed across marketcaps as well, with large cap stocks posting positive performance, while small caps declined. Performance is positive year-to-date for large andmid cap stocks, with mid cap value stocks leading the way.
BMO Economy and Markets: Retrospective and Perspective • May 7, 20149
*Data begins in June 1988. Data based onRussell-style indices. Earnings are estimatedearnings for the next 12 months (NTM).Sources: FactSet, BMO Global AssetManagement.
0.30x
0.40x
0.50x
0.60x
0.70x
0.80x
0.90x
1.00x
1.10x
Jun 88 Jun 90 Jun 92 Jun 94 Jun 96 Jun 98 Jun 00 Jun 02 Jun 04 Jun 06 Jun 08 Jun 10 Jun 12
Valu
e PE
/ G
row
th P
E
Value vs. Growth Price to NTM Earnings
Russell 1000® Value PE / Russell 1000® Growth PE
Value / Growth Avg. since Jun '88 Growth Cheaper
Value Cheaper
Sources: FactSet, BMO Global Asset Management
0.40x
0.50x
0.60x
0.70x
0.80x
0.90x
1.00x
1.10x
1.20x
1.30x
1.40x
Jun 88 Jun 90 Jun 92 Jun 94 Jun 96 Jun 98 Jun 00 Jun 02 Jun 04 Jun 06 Jun 08 Jun 10 Jun 12
Smal
l Cap
PE
/ Lar
ge C
ap P
E .
Small vs. Large Price to NTM Earnings
Russell 2000® PE / Russell 1000® PE
Small / Large Avg. since Jun '88
Sources: FactSet, BMO Global Asset Management
Large Cap Cheaper
Small Cap Cheaper
Current P/E (Avg. P/E)
Value Blend Grow th
Larg
e 14.3 (13.5)
15.6 (15.9)
17.2 (19.7)
Mid 16.1
(13.8)17.3
(15.6)18.7
(19.5)
Smal
l 16.4 (13.7)
17.9 (15.5)
19.7 (18.0)
Current PE as % of Avg PE
Value Blend Grow th
Larg
e
106.3% 98.0% 87.2%
Mid 116.8% 110.9% 95.9%
Smal
l
119.1% 115.1% 109.6%
P/E vs. Long Term Average* As of 4/30/2014
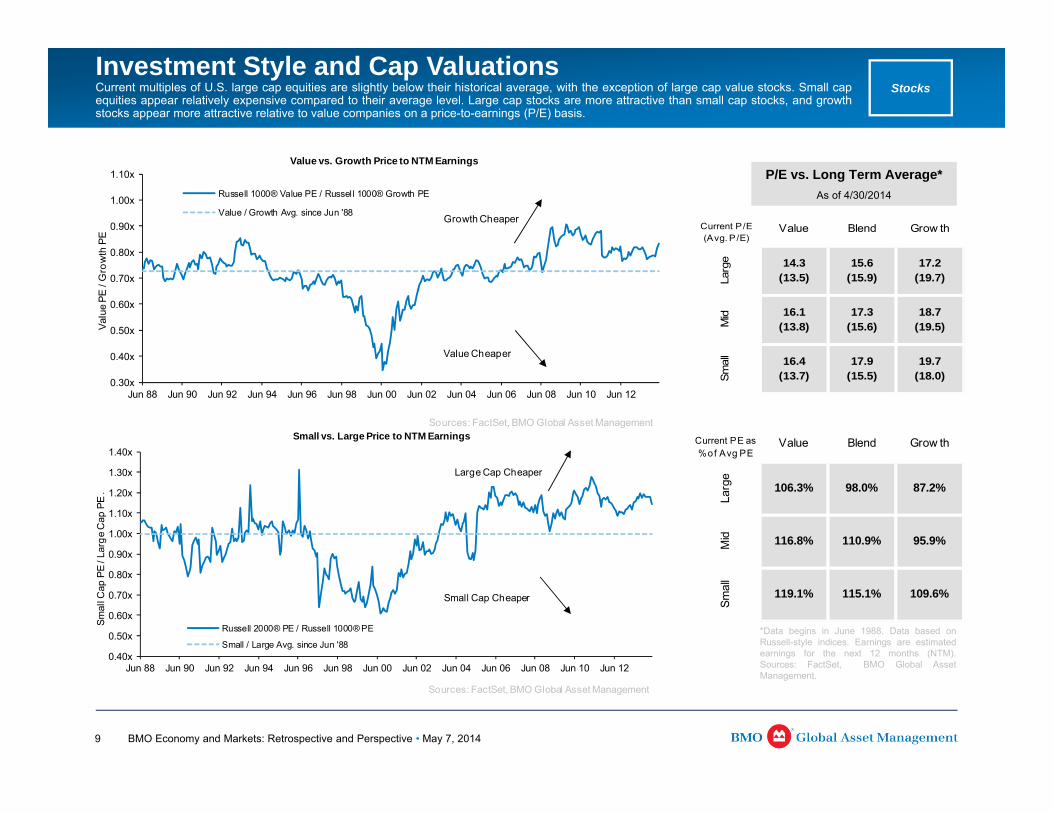
StocksInvestment Style and Cap ValuationsCurrent multiples of U.S. large cap equities are slightly below their historical average, with the exception of large cap value stocks. Small capequities appear relatively expensive compared to their average level. Large cap stocks are more attractive than small cap stocks, and growthstocks appear more attractive relative to value companies on a price-to-earnings (P/E) basis.
BMO Economy and Markets: Retrospective and Perspective • May 7, 201410
As of 04/30/2014 Russell Index Materials and
Processing Utilities Consumer Staples Energy Producer
Durables Health Care Consumer Discretionary Financials Technology
MTD 0.5% 0.5% 2.8% 2.6% 5.2% 1.2% -0.8% -1.2% -1.5% 0.1%
YTD 2014 2.5% 3.0% 8.9% 4.1% 6.7% 1.8% 5.1% -3.2% 0.7% 3.3%
2013 33.1% 25.2% 15.2% 27.7% 25.5% 41.9% 42.3% 41.9% 34.8% 27.6%
MTD -3.9% -2.6% -0.5% -0.2% 3.3% -3.3% -8.5% -3.9% -2.9% -7.0%
YTD 2014 -2.8% -1.9% 3.7% 2.8% 10.4% -2.2% -5.0% -7.2% -2.1% -6.6%
2013 38.8% 28.0% 21.8% 47.7% 35.0% 43.5% 51.7% 44.9% 31.4% 41.3%
LARG
E CA
P E
QUI
TIES
SMAL
L CA
P E
QUI
TIES
4.4%5.6%
7.9%
10.0%
11.3%
12.3%16.2%
18.1%
15.6%
Russell 1000® Index Composition
7.1%3.7%
3.9%
6.5%
14.7%
13.5%17.9%
24.1%
13.9%
Russell 2000® Index Composition
Sources: Bloomberg L.P., BMO Global Asset Management. Sector break-down based on Russell categories.
Materials and Processing
Utilities
Consumer Staples
Energy
Producer Durables
Health Care
Consumer Discretionary
Financials
Technology
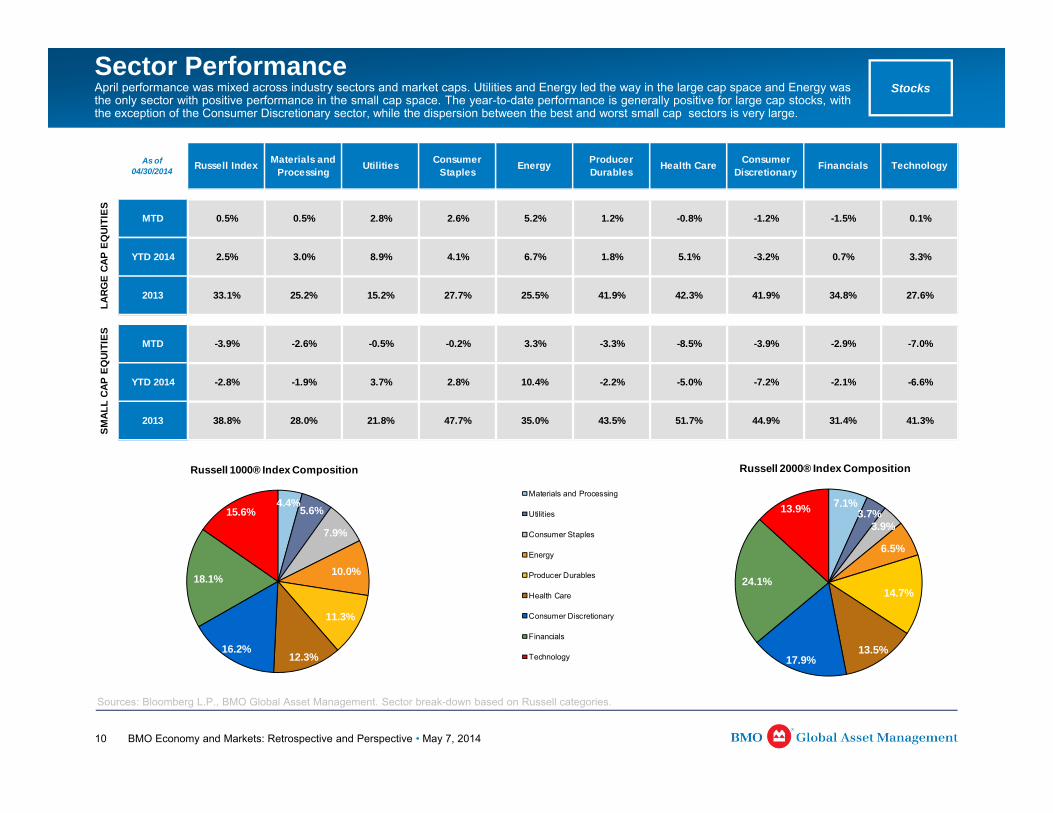
StocksSector PerformanceApril performance was mixed across industry sectors and market caps. Utilities and Energy led the way in the large cap space and Energy wasthe only sector with positive performance in the small cap space. The year-to-date performance is generally positive for large cap stocks, withthe exception of the Consumer Discretionary sector, while the dispersion between the best and worst small cap sectors is very large.

BMO Economy and Markets: Retrospective and Perspective • May 7, 201411
0.60.8
0.50.3 0.5
0.91.2 1.2
0.60.5
1.2
0.70.4
0.9 0.9
2.3
2.8 2.9
1.9
2.7
1.6
0.9
1.8
2.5
4.2 4.03.6
0.00
0.50
1.00
1.50
2.00
2.50
3.00
3.50
4.00
4.50U.S. Treasury U.S. Agg. Agencies ABS CMBS MBS Corporates Non-Corp HY
Bon
ds T
otal
Ret
urns
(%) 1-Mo 3-Mo YTD (04/30/2014)
Sources: Barclays, BMO Global Asset Management
Bonds
23 17 14 1733 41 48
22NA
5235 30
69
25
135
195
261
40 37 33
83
9
113142
223
0
50
100
150
200
250
300
U.S. Treasury U.S. Agg. Agencies ABS CMBS MBS Corporates Non-Corp HYBon
ds E
xces
s R
etur
ns v
s. T
reas
ury
Bon
ds W
ith S
imila
r Dur
atio
n (b
ps)
1-Mo 3-Mo YTD (04/30/2014)
Sources: Barclays, BMO Global Asset Management
U.S. Bond Market PerformanceBond performance was positive in April and year-to-date due to tighter spreads and lower yields. Compared to U.S. Treasury bonds with similar durations, all bond sectors posted positive performance in April and year-to-date.

BMO Economy and Markets: Retrospective and Perspective • May 7, 201412
U.S. BondsU.S. Treasury yields declined slightly in April. The 10-year U.S. Treasury yield decreased 38 basis points (bps) in 2014 and posted a strong return of 4.29% year-to-date. The tax-exempt market continues to benefit from light new issuance supply and little investor selling activity. Demand remains strong as the taxable equivalent yield on municipal bonds looks especially attractive .
Bonds
2.132.88
3.76
5.16
3.29
4.14
5.22
7.17
0.0
1.0
2.0
3.0
4.0
5.0
6.0
7.0
8.0
Aaa Aa A Baa
(%)
Total Returns of the Taxable and Non-Taxable Bonds
U.S. Aggregate Bond Index (Taxable)
Municipals Index (Non-Taxable)
Sources: Barclays, BMO Global Asset Management
YTD (04/30/2014)
300
400
500
600
700
800
900
1,000
100
150
200
250
300
350
400
Mar
10
Jun
10
Sep
10
Dec
10
Mar
11
Jun
11
Sep
11
Dec
11
Mar
12
Jun
12
Sep
12
Dec
12
Mar
13
Jun
13
Sep
13
Dec
13
Hig
h Yi
eld
OAS
(bps
)
Inve
stm
ent G
rade
OAS
(bps
)
Corporate Bonds OAS Level
CorporatesFinancialsHY
Sources: Barclays, BMO Global Asset Management
0.0
0.5
1.0
1.5
2.0
2.5
3.0
3.5
4.0
4.5
3 m
o6
mo
2 yr
5 yr
10 y
r
20 y
r
30 y
r
Yiel
d (%
)
AAA Municipals and Treasury Yield Curves
Municipals Curve on 04/30/2014
Treasury Curve on 04/30/2014
Sources: Bloomberg L.P., BMO Global Asset Management
0.0
1.5
3.0
4.5
6.0
Dec
05
Jun
06
Dec
06
Jun
07
Dec
07
Jun
08
Dec
08
Jun
09
Dec
09
Jun
10
Dec
10
Jun
11
Dec
11
Jun
12
Dec
12
Jun
13
Dec
13
(%)U.S. Treasury Yields
3-Mo T-Bill2-Yr Tsy Note10-Yr Tsy Note
Sources: Bloomberg L.P., BMO Global Asset Management

BMO Economy and Markets: Retrospective and Perspective • May 7, 201413
Alternative Assets
0
500
1,000
1,500
2,000
0
50
100
150
200
250
Dec
91
Dec
92
Dec
93
Dec
94
Dec
95
Dec
96
Dec
97
Dec
98
Dec
99
Dec
00
Dec
01
Dec
02
Dec
03
Dec
04
Dec
05
Dec
06
Dec
07
Dec
08
Dec
09
Dec
10
Dec
11
Dec
12
Dec
13
Stoc
k In
dex
Leve
l
Com
mod
ities
Inde
x Lev
ell
Commodities and Stocks
DJ UBS Commodity Index
S&P 500® Index
Sources: Bloomberg L.P., BMO Global Asset Management
As of 04/30/2014
DJ UBS Agriculture Subindex
DJ UBS Livestock Subindex
DJ UBS Grains Subindex
DJ UBS Energy Subindex
DJ UBS Precious Metals
Subindex
DJ UBS Industrial
Metals Subindex
DJ UBS Commodity
IndexS&P 500® Index
MTD 3.5 -1.6 3.2 3.0 -0.1 3.0 2.4 0.7
YTD 2014 20.6 14.5 19.8 7.3 5.3 -1.7 9.6 2.6
2013 -14.3 -3.6 -16.9 5.1 -30.8 -13.7 -9.5 32.4
Sources: Bloomberg L.P., BMO Global Asset Management
CommoditiesThe DJ UBS Commodity Index has outperformed the S&P 500® Index year-to-date and posted slightly positive returns in April, but performance was mixed across the sub-sectors. The decoupling trend against equities, which began in 2011, has continued.
BMO Economy and Markets: Retrospective and Perspective • May 7, 201414
0
500
1,000
1,500
2,000
0
50
100
150
200
250
300
Dec
99
Dec
00
Dec
01
Dec
02
Dec
03
Dec
04
Dec
05
Dec
06
Dec
07
Dec
08
Dec
09
Dec
10
Dec
11
Dec
12
Dec
13
Stoc
k In
dex
Leve
l
REI
T In
dex
Leve
l .
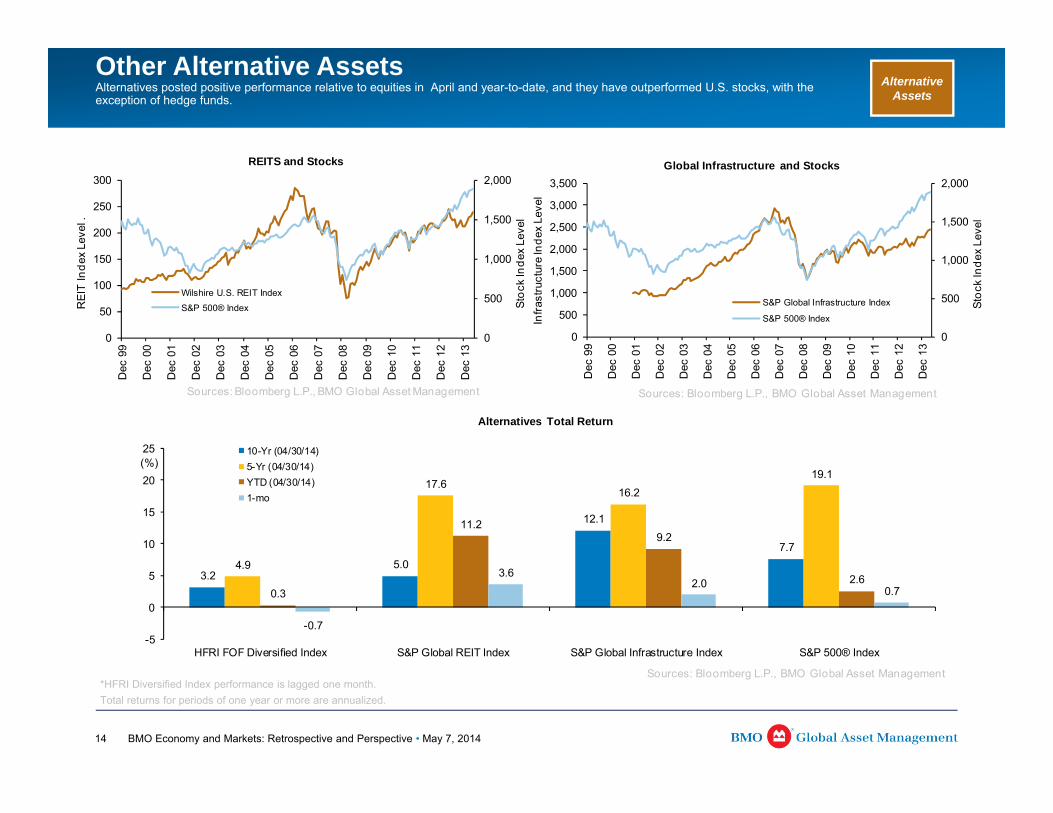
REITS and Stocks
Wilshire U.S. REIT Index
S&P 500® Index
Sources: Bloomberg L.P., BMO Global Asset Management
0
500
1,000
1,500
2,000
0
500
1,000
1,500
2,000
2,500
3,000
3,500
Dec
99
Dec
00
Dec
01
Dec
02
Dec
03
Dec
04
Dec
05
Dec
06
Dec
07
Dec
08
Dec
09
Dec
10
Dec
11
Dec
12
Dec
13
Stoc
k In
dex
Leve
l
Infra
stru
ctur
e In
dex
Leve
l
Global Infrastructure and Stocks
S&P Global Infrastructure Index
S&P 500® Index
Sources: Bloomberg L.P., BMO Global Asset Management
3.25.0
12.1
7.74.9
17.616.2
19.1
0.3
11.29.2
2.6
-0.7
3.62.0
0.7
-5
0
5
10
15
20
25
HFRI FOF Diversified Index S&P Global REIT Index S&P Global Infrastructure Index S&P 500® Index
(%)
Alternatives Total Return
10-Yr (04/30/14)5-Yr (04/30/14)YTD (04/30/14)1-mo
Sources: Bloomberg L.P., BMO Global Asset Management*HFRI Diversified Index performance is lagged one month. Total returns for periods of one year or more are annualized.
Alternative Assets
Other Alternative AssetsAlternatives posted positive performance relative to equities in April and year-to-date, and they have outperformed U.S. stocks, with the exception of hedge funds.
BMO Economy and Markets: Retrospective and Perspective • May 7, 201415
Sandy Lincoln Chief Market Strategist
Bob Decker, CFA Director, Quantitative Strategies
Irina Pacheco, CFA Vice President, Quantitative Strategies
Investment Strategy Group

BMO Economy and Markets: Retrospective and Perspective • May 7, 201416
Index Definitions
Equity IndicesS&P 500® IndexThe S&P 500® Index is an unmanaged index of large-cap common stocks.Dow Jones Industrial AverageThe Dow Jones Industrial Average is a price-weighted average of 30 significant stocks traded on theNew York Stock Exchange and the Nasdaq.Russell 1000® IndexRussell 1000® Index consists of approximately 1,000 of the largest companies in the U.S. equitymarkets.Russell 1000® Growth IndexRussell 1000® Growth Index measures the performance of those Russell 1000 Companies with higherprice-to-book ratios and higher forecasted growth values.Russell 1000® Value IndexRussell 1000® Value Index measures the performance of those Russell 1000 Companies with lowerprice-to-book ratios and lower forecasted growth values.Russell Midcap® IndexRussell Midcap® Index measures the performance of the smallest 800 U.S. companies in the Russell1000 Index.Russell Midcap® Growth IndexRussell Midcap® Growth Index measures the performance of those Russell Midcap companies withhigher price-to-book ratios and higher forecasted growth values.Russell Midcap® Value IndexRussell Midcap® Value Index measures the performance of those Russell Midcap companies withlower price-to-book ratios and lower forecasted growth values.Russell 2500TM IndexThe Russell 2500TM Index measures the performance of the small to mid-cap segment of the U.S.equity universe. It is a subset of the Russell 3000® Index.Russell 2000® IndexRussell 2000® Index is an unmanaged index that measures the performance of the smallest 2000U.S. companies in the Russell 3000® Index.Russell 2000® Growth IndexRussell 2000® Growth Index measures the performance of those Russell 2000 Companies with higherprice-to-book ratios and higher forecasted growth values.Russell 2000® Value IndexRussell 2000® Value Index measures the performance of those Russell 2000 Companies with lowerprice-to-book ratios and lower forecasted growth values.MSCI ACWI ex USA IndexThe MSCI ACWI Index is a free float-adjusted market capitalization weighted index that is designed tomeasure the equity market performance of developed and emerging markets.
Investments cannot be made in an index.
MSCI EAFE Index (Developed Markets)The MSCI EAFE Index Europe, Australasia, and Far East Index (EAFE) is a standard unmanagedforeign securities index representing major non-U.S. stock markets, as monitored by Morgan StanleyCapital International.MSCI European Monetary Union IndexThe MSCI EMU (European Economic and Monetary Union) Index is a free float-adjusted marketcapitalization weighted index that is designed to measure the equity market performance of countrieswithin EMU.MSCI AC Asia Pacific IndexThe MSCI AC Asia Pacific Index is a free float-adjusted market capitalization weighted index that isdesigned to measure the equity market performance of Asia and Pacific region.MSCI Emerging Markets IndexThe MSCI Emerging Markets Index is a market capitalization weighted index comprised of over 800companies representative of the market structure of the emerging countries in Europe, Latin America,Africa, Middle East and Asia. Prior to January 1, 2002, the returns of the MSCI Emerging MarketsIndex were presented before application of withholding taxes.NASDAQ Composite IndexThe NASDAQ Composite Index is a market-cap weighted index of the more than 3,000 commonequities listed on the Nasdaq stock exchange.STOXX Europe 600 IndexThe STOXX Europe Index represents 600 large, mid, and small capitalization companies across 18countries of the European Region.Deutsche Borse AG German Stock IndexThe Deutsche Borse AG German Stock Index (DAX) is a total return index of 30 selected Germanblue chip stocks traded on the Frankfurt Stock Exchange. The equities use free float shares in theindex calculation.CAC 40 IndexCAC 40 Index is a modified cap-weighted index of 40 companies on the Paris Bourse.Shanghai Stock IndexShanghai Stock Exchange Composite Index is a capitalization-weighted index. The index tracks thedaily price performance of all A-shares and B-shares listed on the Shanghai Stock Exchange.Hang Seng IndexThe Hang Seng Index is a free-float capitalization-weighted index of selection of companies from theStock Exchange of Hong Kong. The components of the index are divided into four sub-indexes:Commerce and Industry, Finance, Utilities, and Properties. The index was developed with a base levelof 100 as of July 31, 1964NIKKEI 225 IndexThe Nikkei-225 Stock Average is a price-weighted average of 225 top-rated Japanese companieslisted in the First Section of the Tokyo Stock Exchange.

BMO Economy and Markets: Retrospective and Perspective • May 7, 201417
Fixed Income IndicesBarclays U.S. Aggregate IndexBarclays U.S. Aggregate Bond Index is an unmanaged index that covers theU.S. investment-grade fixed-rate bond market, including government and creditsecurities, agency mortgage pass-through securities, asset-backed securitiesand commercial mortgage-based securities.Barclays U.S. Interm. Gov/Crd IndexBarclays Intermediate U.S. Government/Credit Index (Barclays Int Gov’t/Credit)is an unmanaged index comprised of government and corporate bonds ratedBBB or higher with maturities between 1-10 years.Barclays U.S. Corporate IndexThe Barclays U.S. Corporate Bond Index is designed to measure theperformance of the U.S. corporate bond market.Barclays U.S. Treasury IndexThe Barclays U.S. Treasury Index is an unmanaged index that includes a broadrange of U.S. Treasury obligations and is considered representative of U.S.Treasury bond performance overall.Barclays Securitized IndexThe Barclays U.S. Securitized Bond Index is an unmanaged index of asset-backed securities, collateralized mortgage-backed securities (ERISA-eligible),and fixed-rate mortgage-backed securities.Barclays High Yield IndexThe Barclays U.S. Corporate High-Yield Bond Index is an unmanaged indexthat covers the USD-denominated, non-investment-grade, fixed-rate, taxablecorporate bond market.BofA Merrill Lynch High Yield BB/B Constr. IndexThe BofA Merrill Lynch BB-B Global High Yield Index is a subset of The BofAMerrill Lynch Global High Yield Index including all securities rated BB1 throughB3, inclusive.
Barclays 1-10 yr Municipals IndexThe Barclays 1-10 Year Municipal Blend Index is a market value-weightedindex which covers the short and intermediate components of the BarclaysMunicipal Bond Index—an unmanaged, market value-weighted index whichcovers the U.S. investment-grade tax-exempt bond market.Investments cannot be made in an index.
Barclays Global Aggregate Bond IndexThe Barclays Global Aggregate Bond Index is an index of global government,government-related agencies, corporate and securitized fixed-incomeinvestments.Barclays Global Credit IndexThe Barclays Global Credit Index is the credit component of the Barclays GlobalAggregate Index, an index of global government, government-related agencies,corporate and securitized fixed-income investments.
Index Definitions
BMO Economy and Markets: Retrospective and Perspective • May 7, 201418
Alternative Investments IndicesDJ UBS Commodity IndexThe Dow Jones-UBS Commodity Index is composed of commodities traded onU.S. exchanges.MSCI ACWI Commodity Producers IndexThe MSCI ACWI Commodity Producers Index is a component of the broaderMSCI Commodity Producers Indices and covers large, mid and small capcompanies across 45 Developed and Emerging Markets.Wilshire US REIT IndexThe Wilshire US REIT Index measures U.S. publicly traded Real EstateInvestment Trusts. It is a subset of the Wilshire US Real Estate SecuritiesIndex.S&P Global REIT IndexThe S&P Global REIT Index measures the performance of real estateinvestment trusts in both developed and emerging markets.S&P Global Infrastructure IndexThe S&P Global Infrastructure Index provides liquid and tradable exposure to75 companies from around the world that represent the listed infrastructureuniverse including utilities, transportation and energy.
Other IndicesS&P/Case-Shiller 20-City IndexThe S&P/Case-Shiller 20-City Index is a composite index of the home priceindex for 20 major metropolitan statistical areas in the U.S.CPI IndexThe Consumer Price Index is a measure that examines the weighted average ofprices of a basket of consumer goods and services, such as transportation,food and medical care.HFRI FOF Diversified IndexThe Hedge Fund Research Diversified Index invests in a variety of strategiesamong multiple hedge funds managers. A fund in the HFRI FOF DiversifiedIndex tends to show minimal loss in down markets while achieving superiorreturns in up markets.Investments cannot be made in an index.
Index Definitions
BMO Economy and Markets: Retrospective and Perspective • May 7, 201419
Disclosures
For further information, please visit our website at www.bmogam.com
This is not intended to serve as a complete analysis of every material fact regarding any company, industry or security. The opinions expressed here reflect ourjudgment at this date and are subject to change. Information has been obtained from sources we consider to be reliable, but we cannot guarantee the accuracy.This publication is prepared for general information only. This material does not constitute investment advice and is not intended as an endorsement of any specificinvestment. It does not have regard to the specific investment objectives, financial situation and the particular needs of any specific person who may receive thisreport. Investors should seek advice regarding the appropriateness of investing in any securities or investment strategies discussed or recommended in this reportand should understand that statements regarding future prospects may not be realized. Investment involves risk. Market conditions and trends will fluctuate. Thevalue of an investment as well as income associated with investments may rise or fall. Accordingly, investors may receive back less than originally invested.Investments cannot be made in an index. Past performance is not necessarily a guide to future performance.
BMO Global Asset Management is the brand name for various affiliated entities of BMO Financial Group that provide investment management, retirement, and trust and custody services. Certain of the products and services offered under the brand name BMO Global Asset Management are designed specifically for various categories of investors in a number of different countries and regions and may not be available to all investors. Products and services are only offered to such investors in those countries and regions in accordance with applicable laws and regulations. BMO Financial Group is a service mark of Bank of Montreal (BMO).
Investment products are: NOT FDIC INSURED – NO BANK GUARANTEE – MAY LOSE VALUE
©2014 BMO Financial Corp.