Embed Size (px)
Citation preview

Q1 2018
Earnings
PresentationMay 9, 2018
Confidential, not for distribution or publication without express consent of ADT
2
Forward Looking Statements
ADT has made statements in this presentation and other reports, filings, and other public written and verbal announcements that are forward-looking
and therefore subject to risks and uncertainties. All statements, other than statements of historical fact, included in this document are, or could be,
“forward-looking statements” within the meaning of the Private Securities Litigation Reform Act of 1995 and are made in reliance on the safe harbor
protections provided thereunder. These forward-looking statements relate to anticipated financial performance, management’s plans and objectives
for future operations, business prospects, outcome of regulatory proceedings, market conditions and other matters. Any forward-looking statement
made in this press release speaks only as of the date on which it is made. ADT undertakes no obligation to publicly update or revise any forward-
looking statement, whether as a result of new information, future developments or otherwise. Forward-looking statements can be identified by
various words such as “expects,” “intends,” “will,” “anticipates,” “believes,” “confident,” “continue,” “propose,” “seeks,” “could,” “may,” “should,”
“estimates,” “forecasts,” “might,” “goals,” “objectives,” “targets,” “planned,” “projects,” and similar expressions. These forward-looking statements are
based on management’s current beliefs and assumptions and on information currently available to management. ADT cautions that these statements
are subject to risks and uncertainties, many of which are outside of ADT’s control, and could cause future events or results to be materially different
from those stated or implied in this document, including among others, risk factors that are described in the Company’s Annual Report on Form 10-K
and other filings with the Securities and Exchange Commission, including the sections entitled “Risk Factors” and “Management’s Discussion and
Analysis of Financial Condition and Results of Operations” contained therein.
Confidential, not for distribution or publication without express consent of ADT
Q1 Performance Highlights
3
Continue to Reduce
Attrition
Acquire New
Customers More
Efficiently
Maintain Solid
Revenue Growth
Optimize Adjusted
EBITDA and Cash
Flow
Grow Commercial
Business
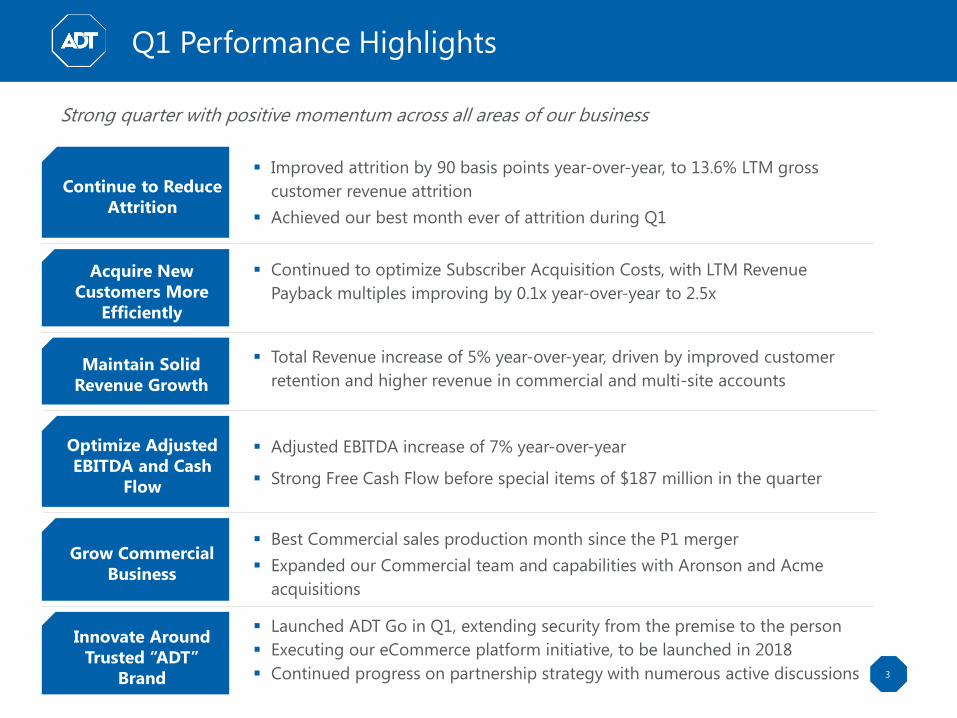
▪ Improved attrition by 90 basis points year-over-year, to 13.6% LTM gross
customer revenue attrition
▪ Achieved our best month ever of attrition during Q1
▪ Continued to optimize Subscriber Acquisition Costs, with LTM Revenue
Payback multiples improving by 0.1x year-over-year to 2.5x
▪ Total Revenue increase of 5% year-over-year, driven by improved customer
retention and higher revenue in commercial and multi-site accounts
▪ Adjusted EBITDA increase of 7% year-over-year
▪ Strong Free Cash Flow before special items of $187 million in the quarter
▪ Best Commercial sales production month since the P1 merger
▪ Expanded our Commercial team and capabilities with Aronson and Acme
acquisitions
Strong quarter with positive momentum across all areas of our business
Innovate Around
Trusted “ADT”
Brand
▪ Launched ADT Go in Q1, extending security from the premise to the person
▪ Executing our eCommerce platform initiative, to be launched in 2018
▪ Continued progress on partnership strategy with numerous active discussions
Confidential, not for distribution or publication without express consent of ADT
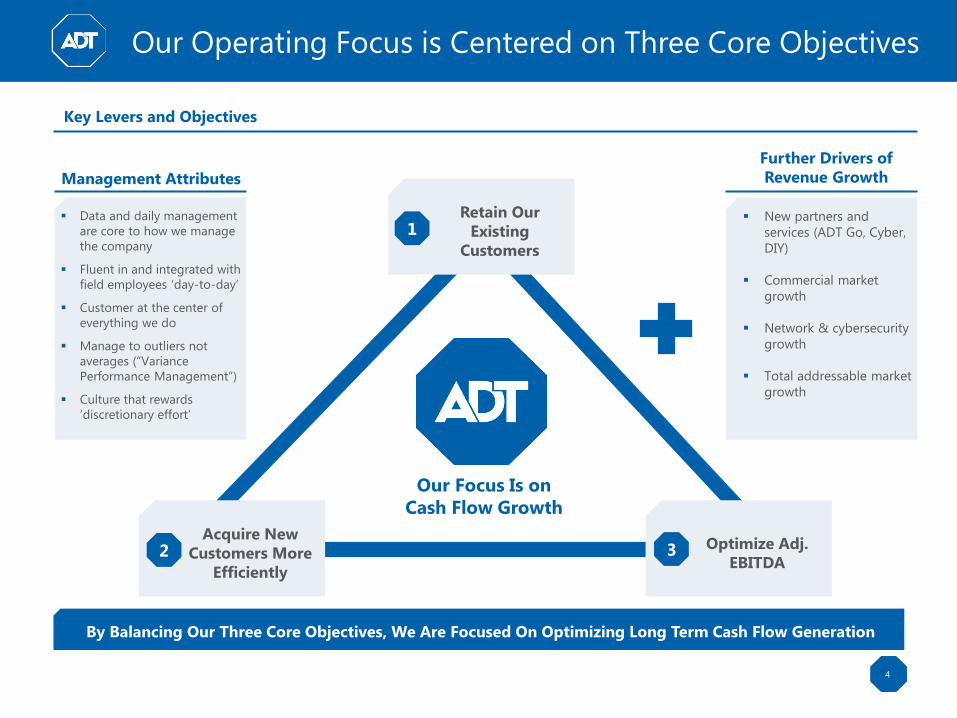
By Balancing Our Three Core Objectives, We Are Focused On Optimizing Long Term Cash Flow Generation
Our Operating Focus is Centered on Three Core Objectives
4
Key Levers and Objectives
Management Attributes
Acquire New
Customers More
Efficiently
2 Optimize Adj.
EBITDA
Our Focus Is on
Cash Flow Growth
Retain Our
Existing
Customers
1
3
▪ New partners and
services (ADT Go, Cyber,
DIY)
▪ Commercial market
growth
▪ Network & cybersecurity
growth
▪ Total addressable market
growth
Further Drivers of
Revenue Growth
▪ Data and daily management
are core to how we manage
the company
▪ Fluent in and integrated with
field employees ‘day-to-day’
▪ Customer at the center of
everything we do
▪ Manage to outliers not
averages (“Variance
Performance Management”)
▪ Culture that rewards
‘discretionary effort’
Confidential, not for distribution or publication without express consent of ADT
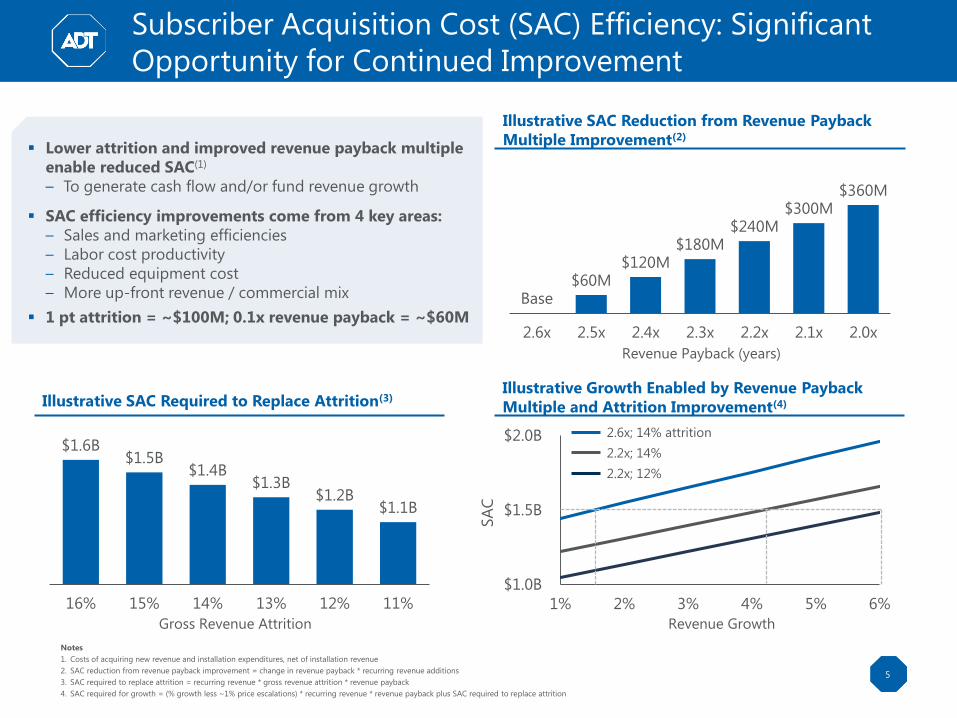
$1.0B
$1.5B
$2.0B
1% 2% 3% 4% 5% 6%
Subscriber Acquisition Cost (SAC) Efficiency: Significant
Opportunity for Continued Improvement
5
Illustrative SAC Reduction from Revenue Payback
Multiple Improvement(2)
Illustrative SAC Required to Replace Attrition(3)Illustrative Growth Enabled by Revenue Payback
Multiple and Attrition Improvement(4)
$1.6B $1.5B
$1.4B $1.3B
$1.2B $1.1B
16% 15% 14% 13% 12% 11%
Base$60M
$120M $180M
$240M $300M
$360M
2.6x 2.5x 2.4x 2.3x 2.2x 2.1x 2.0x
2.6x; 14% attrition
Revenue Growth
SA
C
Gross Revenue Attrition
Revenue Payback (years)
Notes
1. Costs of acquiring new revenue and installation expenditures, net of installation revenue
2. SAC reduction from revenue payback improvement = change in revenue payback * recurring revenue additions
3. SAC required to replace attrition = recurring revenue * gross revenue attrition * revenue payback
4. SAC required for growth = (% growth less ~1% price escalations) * recurring revenue * revenue payback plus SAC required to replace attrition
2.2x; 14%
2.2x; 12%
▪ Lower attrition and improved revenue payback multiple
enable reduced SAC(1)
– To generate cash flow and/or fund revenue growth
▪ SAC efficiency improvements come from 4 key areas:
– Sales and marketing efficiencies
– Labor cost productivity
– Reduced equipment cost
– More up-front revenue / commercial mix
▪ 1 pt attrition = ~$100M; 0.1x revenue payback = ~$60M
Confidential, not for distribution or publication without express consent of ADT
6
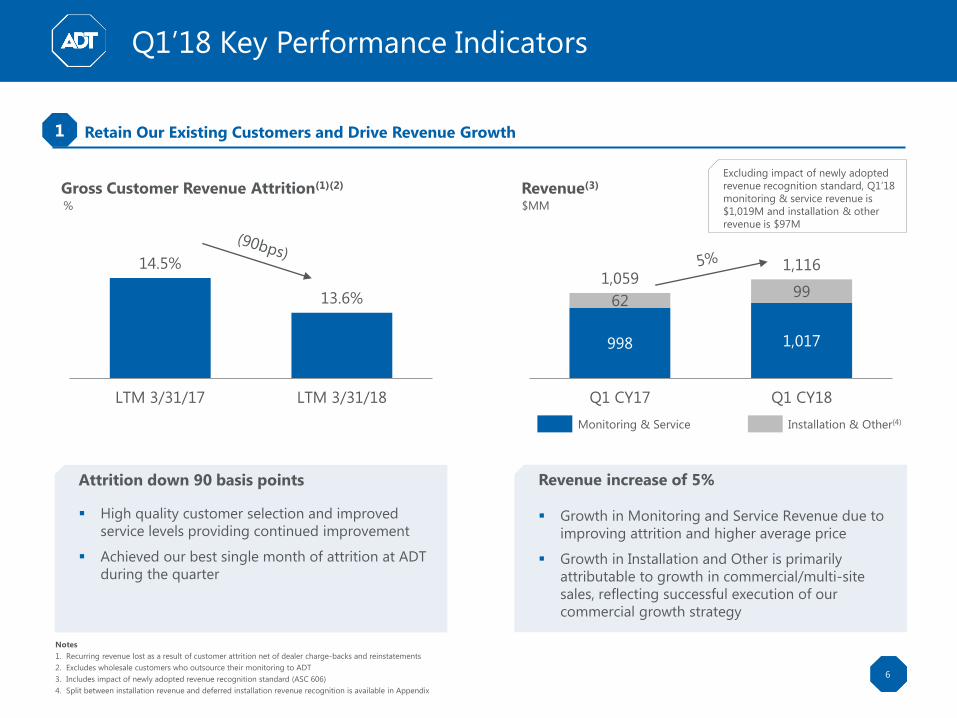
Revenue(3)Gross Customer Revenue Attrition(1)(2)
Q1’18 Key Performance Indicators
Retain Our Existing Customers and Drive Revenue Growth
% $MM
14.5%
13.6%
LTM 3/31/17 LTM 3/31/18
Notes
1. Recurring revenue lost as a result of customer attrition net of dealer charge-backs and reinstatements
2. Excludes wholesale customers who outsource their monitoring to ADT
3. Includes impact of newly adopted revenue recognition standard (ASC 606)
4. Split between installation revenue and deferred installation revenue recognition is available in Appendix
Installation & Other(4)Monitoring & Service
998 1,017
6299
1,0591,116
Q1 CY17 Q1 CY18
Attrition down 90 basis points
▪ High quality customer selection and improved
service levels providing continued improvement
▪ Achieved our best single month of attrition at ADT
during the quarter
Revenue increase of 5%
▪ Growth in Monitoring and Service Revenue due to
improving attrition and higher average price
▪ Growth in Installation and Other is primarily
attributable to growth in commercial/multi-site
sales, reflecting successful execution of our
commercial growth strategy
1
Excluding impact of newly adopted
revenue recognition standard, Q1’18
monitoring & service revenue is
$1,019M and installation & other
revenue is $97M
Confidential, not for distribution or publication without express consent of ADT
7
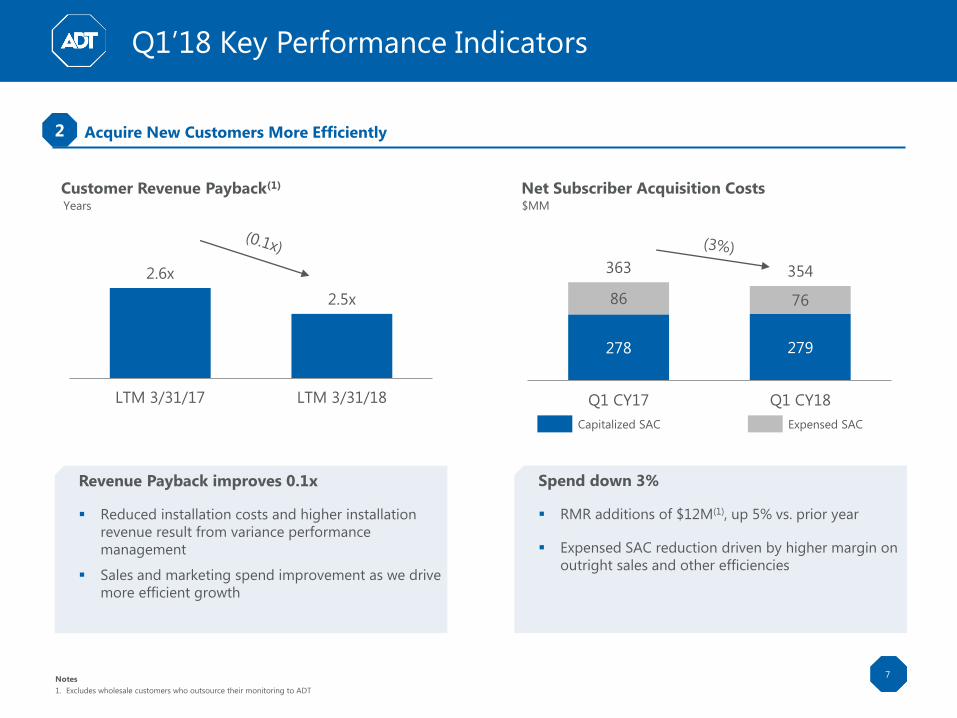
Net Subscriber Acquisition CostsCustomer Revenue Payback(1)
Q1’18 Key Performance Indicators
Years $MM
2.6x
2.5x
LTM 3/31/17 LTM 3/31/18
Notes
1. Excludes wholesale customers who outsource their monitoring to ADT
278 279
86 76
363 354
Q1 CY17 Q1 CY18
Revenue Payback improves 0.1x
▪ Reduced installation costs and higher installation
revenue result from variance performance
management
▪ Sales and marketing spend improvement as we drive
more efficient growth
Spend down 3%
▪ RMR additions of $12M(1), up 5% vs. prior year
▪ Expensed SAC reduction driven by higher margin on
outright sales and other efficiencies
Expensed SACCapitalized SAC
Acquire New Customers More Efficiently2
Confidential, not for distribution or publication without express consent of ADT
8
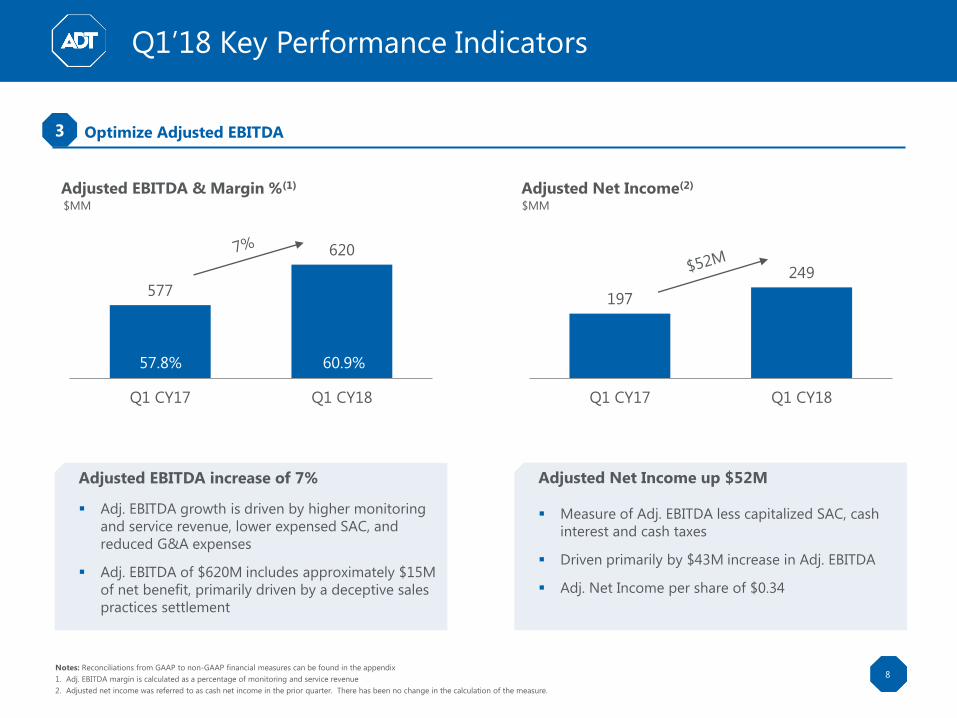
Adjusted Net Income(2)Adjusted EBITDA & Margin %(1)
Q1’18 Key Performance Indicators
$MM $MM
197
249
Q1 CY17 Q1 CY18
Adjusted EBITDA increase of 7%
▪ Adj. EBITDA growth is driven by higher monitoring
and service revenue, lower expensed SAC, and
reduced G&A expenses
▪ Adj. EBITDA of $620M includes approximately $15M
of net benefit, primarily driven by a deceptive sales
practices settlement
Adjusted Net Income up $52M
▪ Measure of Adj. EBITDA less capitalized SAC, cash
interest and cash taxes
▪ Driven primarily by $43M increase in Adj. EBITDA
▪ Adj. Net Income per share of $0.34
Optimize Adjusted EBITDA3
Notes: Reconciliations from GAAP to non-GAAP financial measures can be found in the appendix
1. Adj. EBITDA margin is calculated as a percentage of monitoring and service revenue
2. Adjusted net income was referred to as cash net income in the prior quarter. There has been no change in the calculation of the measure.
57.8%59.5%
normalized
577
620
Q1 CY17 Q1 CY18
57.8% 60.9%
Confidential, not for distribution or publication without express consent of ADT
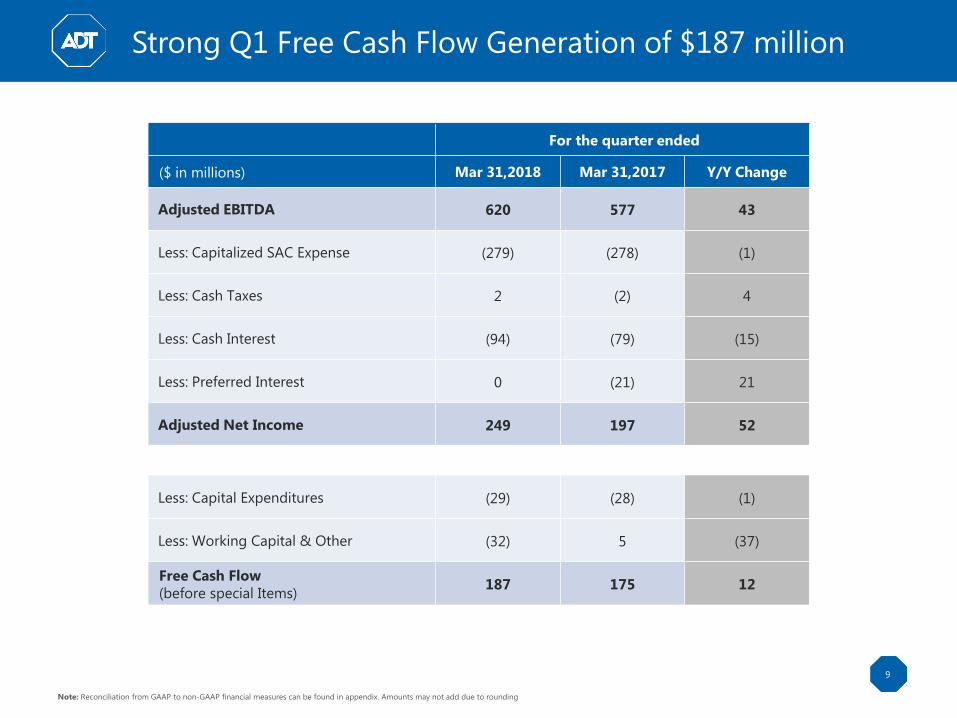
Strong Q1 Free Cash Flow Generation of $187 million
9
Note: Reconciliation from GAAP to non-GAAP financial measures can be found in appendix. Amounts may not add due to rounding
For the quarter ended
($ in millions) Mar 31,2018 Mar 31,2017 Y/Y Change
Adjusted EBITDA 620 577 43
Less: Capitalized SAC Expense (279) (278) (1)
Less: Cash Taxes 2 (2) 4
Less: Cash Interest (94) (79) (15)
Less: Preferred Interest 0 (21) 21
Adjusted Net Income 249 197 52
Less: Capital Expenditures (29) (28) (1)
Less: Working Capital & Other (32) 5 (37)
Free Cash Flow
(before special Items)187 175 12
Confidential, not for distribution or publication without express consent of ADT
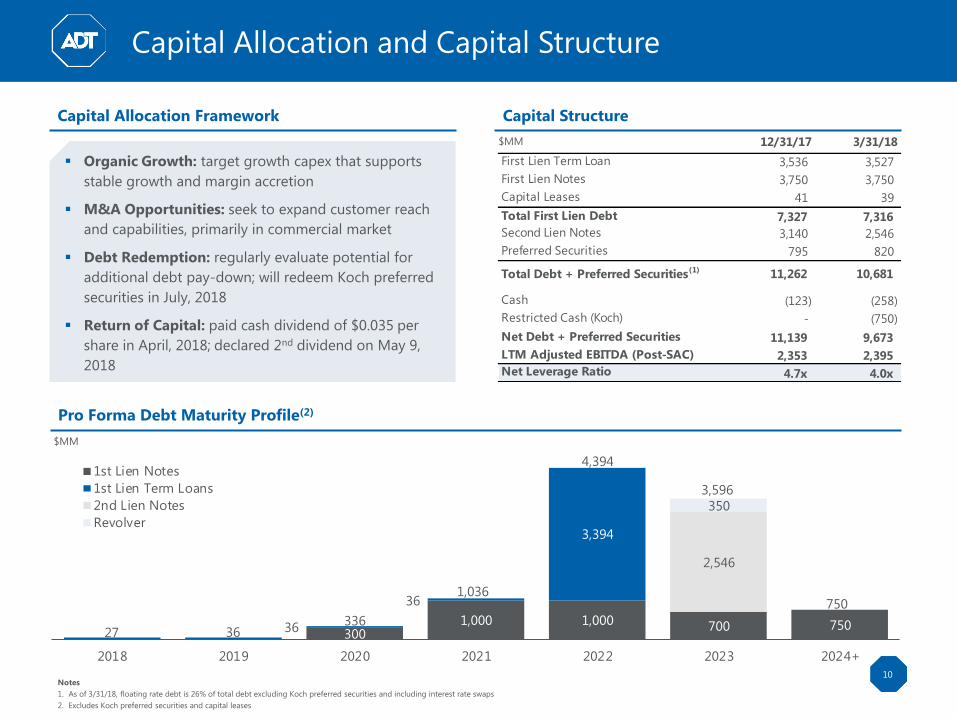
12/31/17 3/31/18
First Lien Term Loan 3,536 3,527
First Lien Notes 3,750 3,750
Capital Leases 41 39
Total First Lien Debt 7,327 7,316
Second Lien Notes 3,140 2,546
Preferred Securities 795 820
Total Debt + Preferred Securities(1) 11,262 10,681
Cash (123) (258)
Restricted Cash (Koch) - (750)
Net Debt + Preferred Securities 11,139 9,673
LTM Adjusted EBITDA (Post-SAC) 2,353 2,395
Net Leverage Ratio 4.7x 4.0x
$MM
Capital Allocation and Capital Structure
10
Pro Forma Debt Maturity Profile(2)
$MM
Capital StructureCapital Allocation Framework
▪ Organic Growth: target growth capex that supports
stable growth and margin accretion
▪ M&A Opportunities: seek to expand customer reach
and capabilities, primarily in commercial market
▪ Debt Redemption: regularly evaluate potential for
additional debt pay-down; will redeem Koch preferred
securities in July, 2018
▪ Return of Capital: paid cash dividend of $0.035 per
share in April, 2018; declared 2nd dividend on May 9,
2018
Notes
1. As of 3/31/18, floating rate debt is 26% of total debt excluding Koch preferred securities and including interest rate swaps
2. Excludes Koch preferred securities and capital leases
3001,000 1,000 700 75036
36
3,394
2,546
350
27 36336
1,036
4,394
3,596
750
2018 2019 2020 2021 2022 2023 2024+
1st Lien Notes
1st Lien Term Loans
2nd Lien Notes
Revolver
$MM
Confidential, not for distribution or publication without express consent of ADT
11
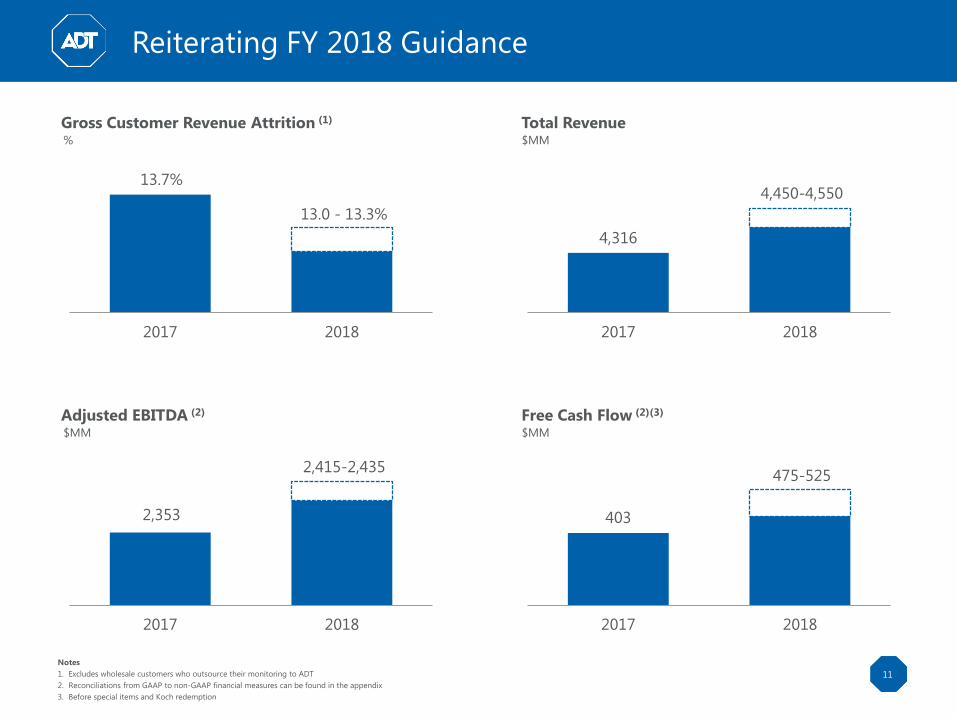
Reiterating FY 2018 Guidance
Gross Customer Revenue Attrition (1)
%
13.7%
2017 2018
13.0 - 13.3%
Total Revenue$MM
4,316
2017 2018
4,450-4,550
Adjusted EBITDA (2)
$MM
2,353
2017 2018
2,415-2,435
Free Cash Flow (2)(3)
$MM
403
2017 2018
475-525
Notes
1. Excludes wholesale customers who outsource their monitoring to ADT
2. Reconciliations from GAAP to non-GAAP financial measures can be found in the appendix
3. Before special items and Koch redemption
Confidential, not for distribution or publication without express consent of ADT
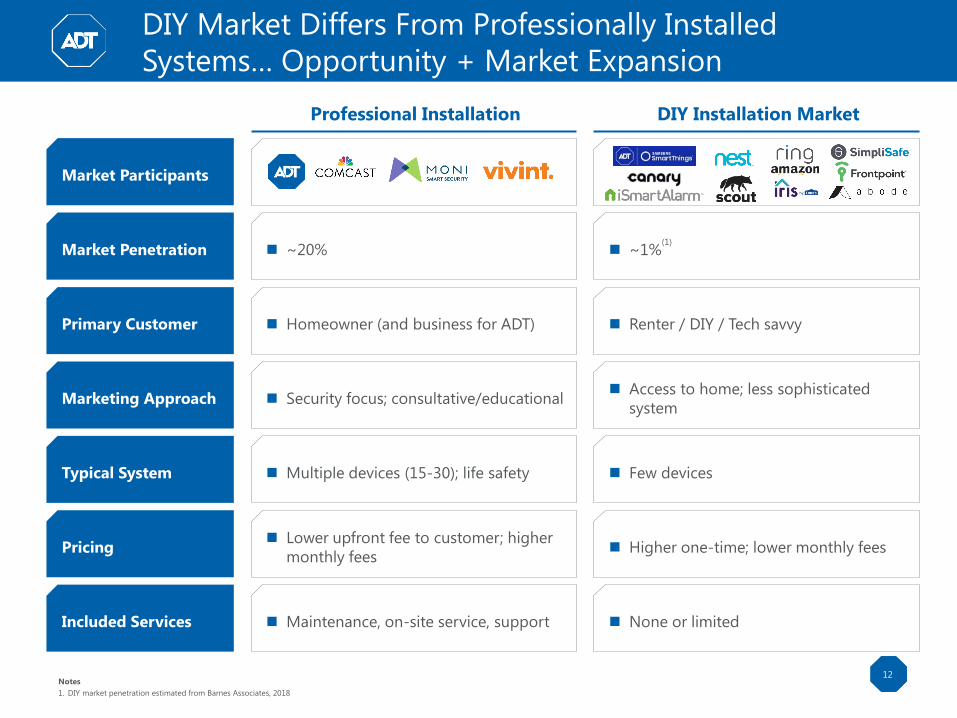
Primary Customer Homeowner (and business for ADT)
Professional Installation DIY Installation Market
Market Participants
Market Penetration ~20% ~1%(1)
Marketing Approach Security focus; consultative/educational Access to home; less sophisticated
system
Typical System Multiple devices (15-30); life safety Few devices
Included Services Maintenance, on-site service, support None or limited
12
Pricing Lower upfront fee to customer; higher
monthly fees Higher one-time; lower monthly fees
Notes
1. DIY market penetration estimated from Barnes Associates, 2018
DIY Market Differs From Professionally Installed
Systems… Opportunity + Market Expansion
Renter / DIY / Tech savvy
Confidential, not for distribution or publication without express consent of ADT
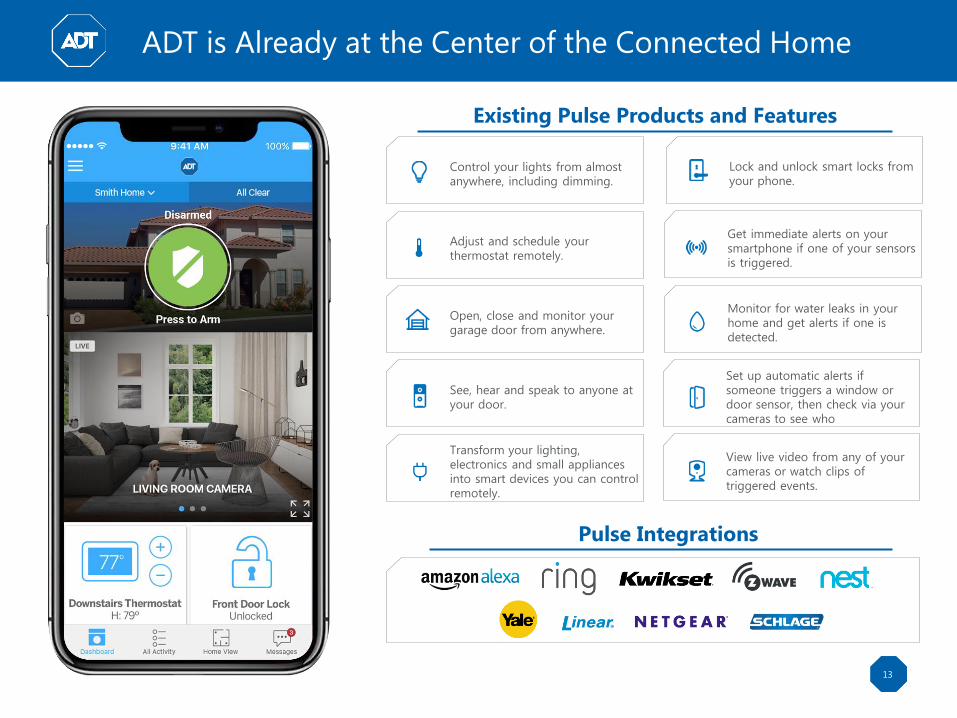
Existing Pulse Products and Features
13
Open, close and monitor your garage door from anywhere.
Adjust and schedule your thermostat remotely.
Control your lights from almost anywhere, including dimming.
See, hear and speak to anyone at your door.
Transform your lighting, electronics and small appliances into smart devices you can control remotely.
Monitor for water leaks in your home and get alerts if one is detected.
View live video from any of your cameras or watch clips of triggered events.
ADT is Already at the Center of the Connected Home
Get immediate alerts on your smartphone if one of your sensors is triggered.
Lock and unlock smart locks from your phone.
Set up automatic alerts if someone triggers a window or door sensor, then check via your cameras to see who
Pulse Integrations
Confidential, not for distribution or publication without express consent of ADT
Q&A
14

Appendix:GAAP to Non-GAAP
Reconciliations
Confidential, not for distribution or publication without express consent of ADT
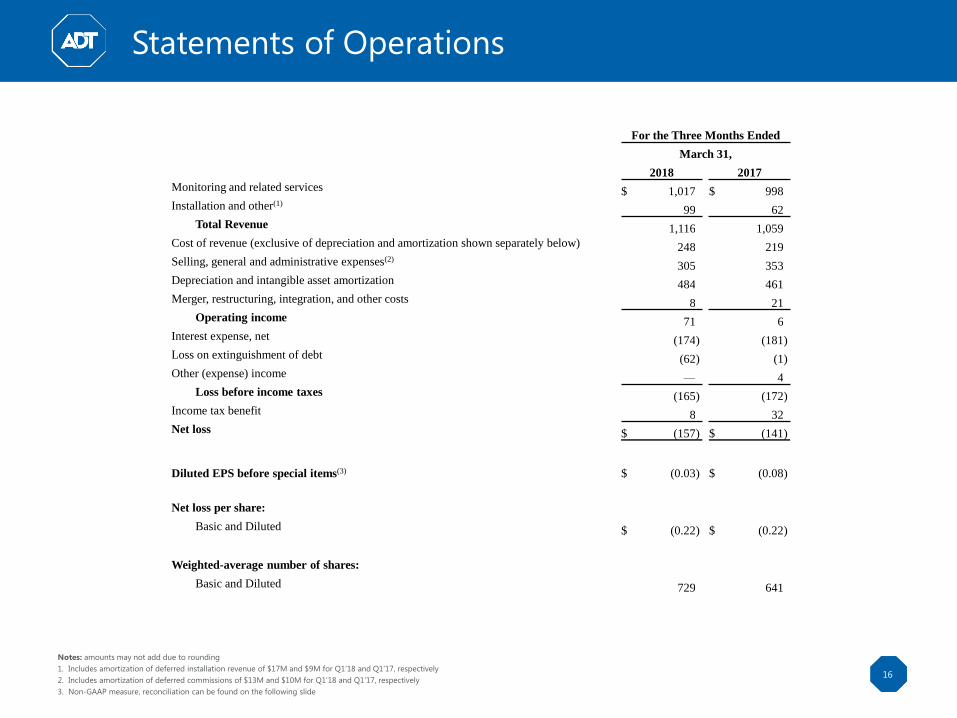
Statements of Operations
16
Notes: amounts may not add due to rounding
1. Includes amortization of deferred installation revenue of $17M and $9M for Q1’18 and Q1’17, respectively
2. Includes amortization of deferred commissions of $13M and $10M for Q1’18 and Q1’17, respectively
3. Non-GAAP measure, reconciliation can be found on the following slide
For the Three Months Ended
March 31,
2018 2017
Monitoring and related services $ 1,017 $ 998
Installation and other(1)99 62
Total Revenue 1,116 1,059
Cost of revenue (exclusive of depreciation and amortization shown separately below) 248 219
Selling, general and administrative expenses(2)305 353
Depreciation and intangible asset amortization 484 461
Merger, restructuring, integration, and other costs 8 21
Operating income 71 6
Interest expense, net (174) (181)
Loss on extinguishment of debt (62) (1)
Other (expense) income — 4
Loss before income taxes (165) (172)
Income tax benefit 8 32
Net loss $ (157) $ (141)
Diluted EPS before special items(3) $ (0.03) $ (0.08)
Net loss per share:
Basic and Diluted $ (0.22) $ (0.22)
Weighted-average number of shares:
Basic and Diluted 729 641
Confidential, not for distribution or publication without express consent of ADT
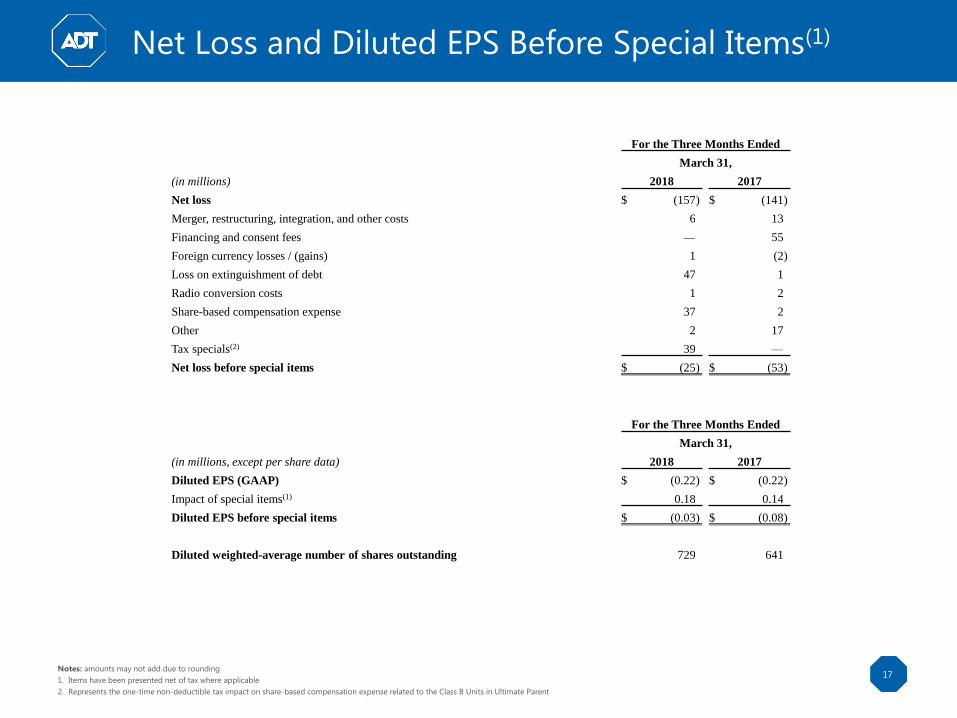
Net Loss and Diluted EPS Before Special Items(1)
17Notes: amounts may not add due to rounding
1. Items have been presented net of tax where applicable
2. Represents the one-time non-deductible tax impact on share-based compensation expense related to the Class B Units in Ultimate Parent
For the Three Months Ended
March 31,
(in millions) 2018 2017
Net loss $ (157) $ (141)
Merger, restructuring, integration, and other costs 6 13
Financing and consent fees — 55
Foreign currency losses / (gains) 1 (2)
Loss on extinguishment of debt 47 1
Radio conversion costs 1 2
Share-based compensation expense 37 2
Other 2 17
Tax specials(2) 39 —
Net loss before special items $ (25) $ (53)
For the Three Months Ended
March 31,
(in millions, except per share data) 2018 2017
Diluted EPS (GAAP) $ (0.22) $ (0.22)
Impact of special items(1) 0.18 0.14
Diluted EPS before special items $ (0.03) $ (0.08)
Diluted weighted-average number of shares outstanding 729 641
Confidential, not for distribution or publication without express consent of ADT
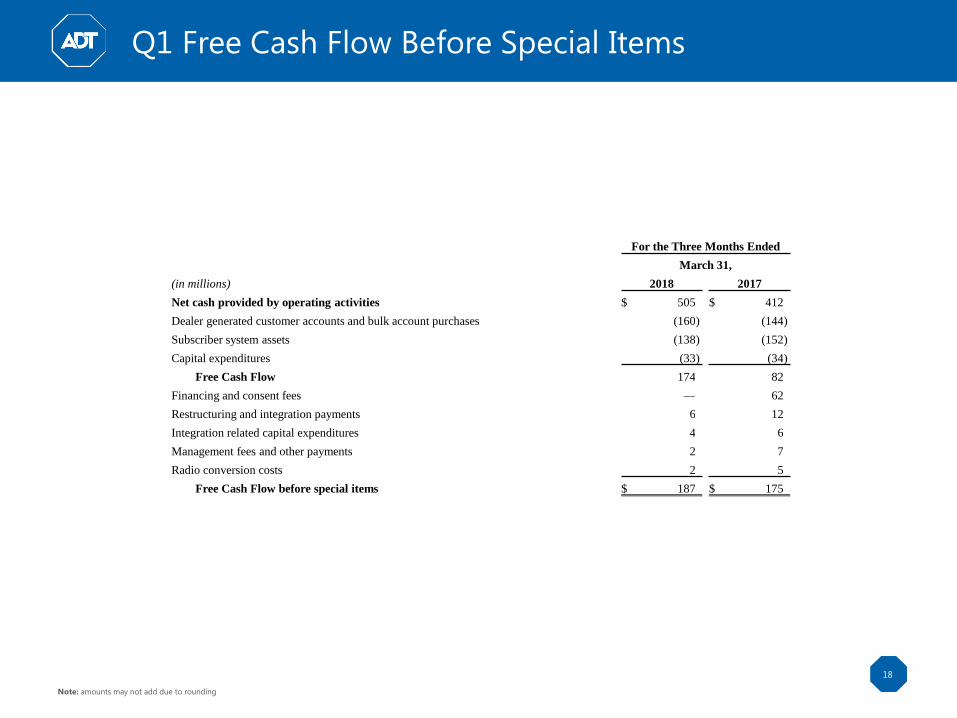
Q1 Free Cash Flow Before Special Items
18
Note: amounts may not add due to rounding
For the Three Months Ended
March 31,
(in millions) 2018 2017
Net cash provided by operating activities $ 505 $ 412
Dealer generated customer accounts and bulk account purchases (160) (144)
Subscriber system assets (138) (152)
Capital expenditures (33) (34)
Free Cash Flow 174 82
Financing and consent fees — 62
Restructuring and integration payments 6 12
Integration related capital expenditures 4 6
Management fees and other payments 2 7
Radio conversion costs 2 5
Free Cash Flow before special items $ 187 $ 175
Confidential, not for distribution or publication without express consent of ADT
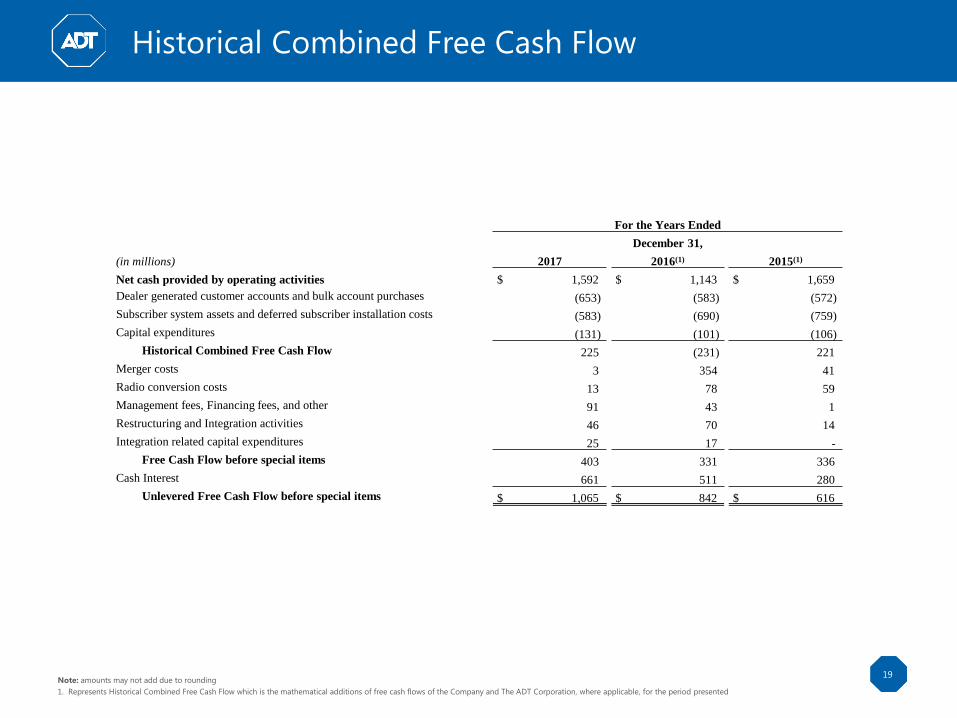
Historical Combined Free Cash Flow
19Note: amounts may not add due to rounding
1. Represents Historical Combined Free Cash Flow which is the mathematical additions of free cash flows of the Company and The ADT Corporation, where applicable, for the period presented
For the Years Ended
December 31,
(in millions) 2017 2016(1) 2015(1)
Net cash provided by operating activities $ 1,592 $ 1,143 $ 1,659
Dealer generated customer accounts and bulk account purchases (653) (583) (572)
Subscriber system assets and deferred subscriber installation costs (583) (690) (759)
Capital expenditures (131) (101) (106)
Historical Combined Free Cash Flow 225 (231) 221
Merger costs 3 354 41
Radio conversion costs 13 78 59
Management fees, Financing fees, and other 91 43 1
Restructuring and Integration activities 46 70 14
Integration related capital expenditures 25 17 -
Free Cash Flow before special items 403 331 336
Cash Interest 661 511 280
Unlevered Free Cash Flow before special items $ 1,065 $ 842 $ 616
Confidential, not for distribution or publication without express consent of ADT
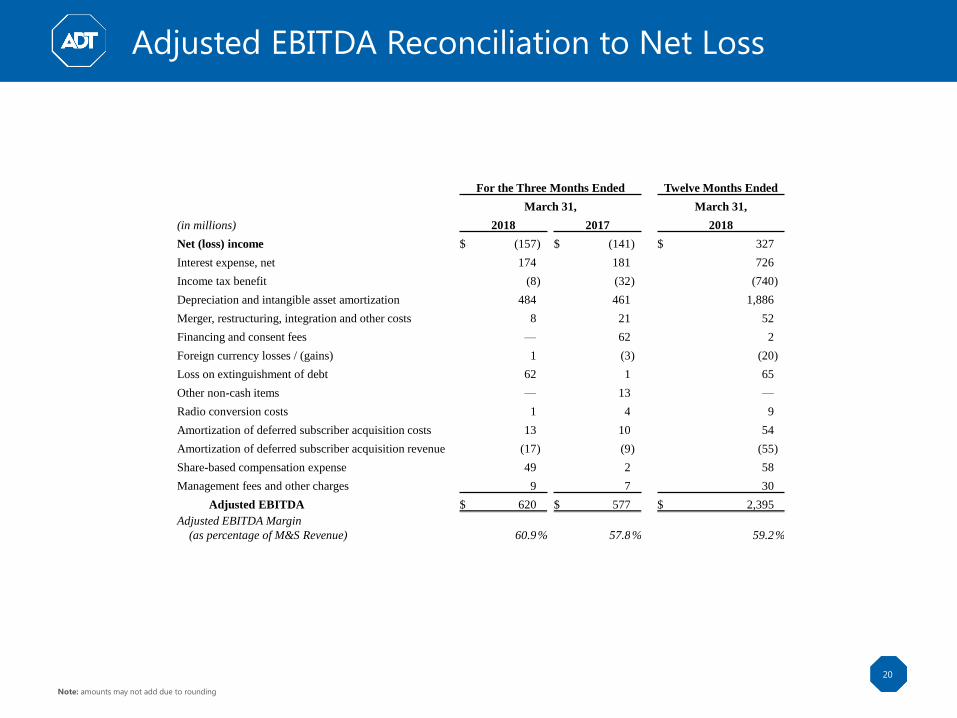
Adjusted EBITDA Reconciliation to Net Loss
20
Note: amounts may not add due to rounding
For the Three Months Ended Twelve Months Ended
March 31, March 31,
(in millions) 2018 2017 2018
Net (loss) income $ (157) $ (141) $ 327
Interest expense, net 174 181 726
Income tax benefit (8) (32) (740)
Depreciation and intangible asset amortization 484 461 1,886
Merger, restructuring, integration and other costs 8 21 52
Financing and consent fees — 62 2
Foreign currency losses / (gains) 1 (3) (20)
Loss on extinguishment of debt 62 1 65
Other non-cash items — 13 —
Radio conversion costs 1 4 9
Amortization of deferred subscriber acquisition costs 13 10 54
Amortization of deferred subscriber acquisition revenue (17) (9) (55)
Share-based compensation expense 49 2 58
Management fees and other charges 9 7 30
Adjusted EBITDA $ 620 $ 577 $ 2,395
Adjusted EBITDA Margin
(as percentage of M&S Revenue) 60.9% 57.8% 59.2%
Confidential, not for distribution or publication without express consent of ADT
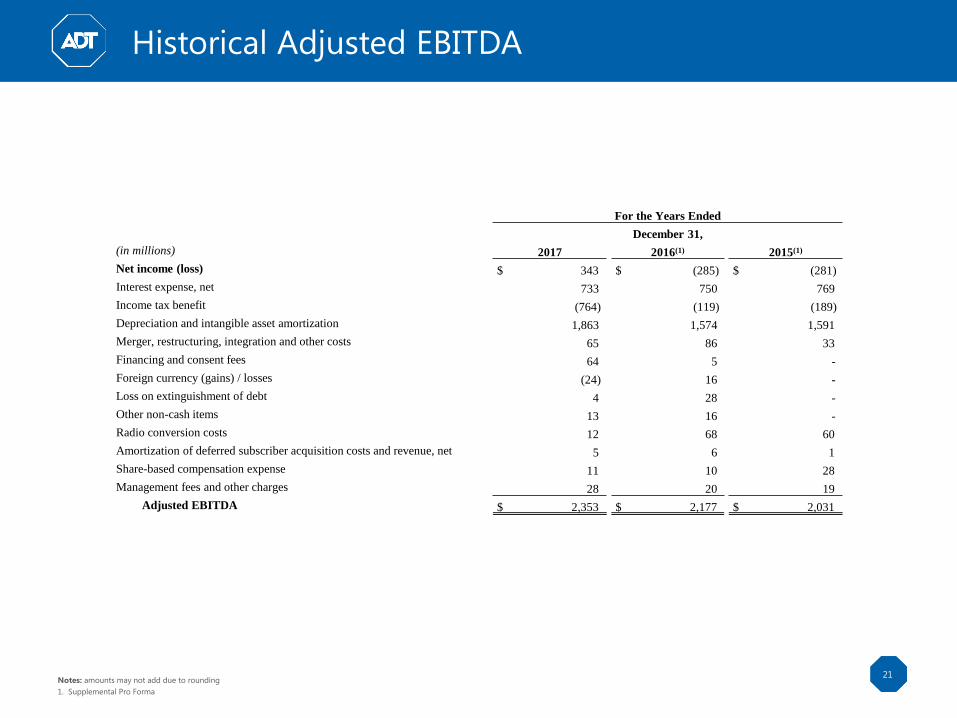
Historical Adjusted EBITDA
21Notes: amounts may not add due to rounding
1. Supplemental Pro Forma
For the Years Ended
December 31,
(in millions) 2017 2016(1) 2015(1)
Net income (loss) $ 343 $ (285) $ (281)
Interest expense, net 733 750 769
Income tax benefit (764) (119) (189)
Depreciation and intangible asset amortization 1,863 1,574 1,591
Merger, restructuring, integration and other costs 65 86 33
Financing and consent fees 64 5 -
Foreign currency (gains) / losses (24) 16 -
Loss on extinguishment of debt 4 28 -
Other non-cash items 13 16 -
Radio conversion costs 12 68 60
Amortization of deferred subscriber acquisition costs and revenue, net 5 6 1
Share-based compensation expense 11 10 28
Management fees and other charges 28 20 19
Adjusted EBITDA $ 2,353 $ 2,177 $ 2,031
Confidential, not for distribution or publication without express consent of ADT
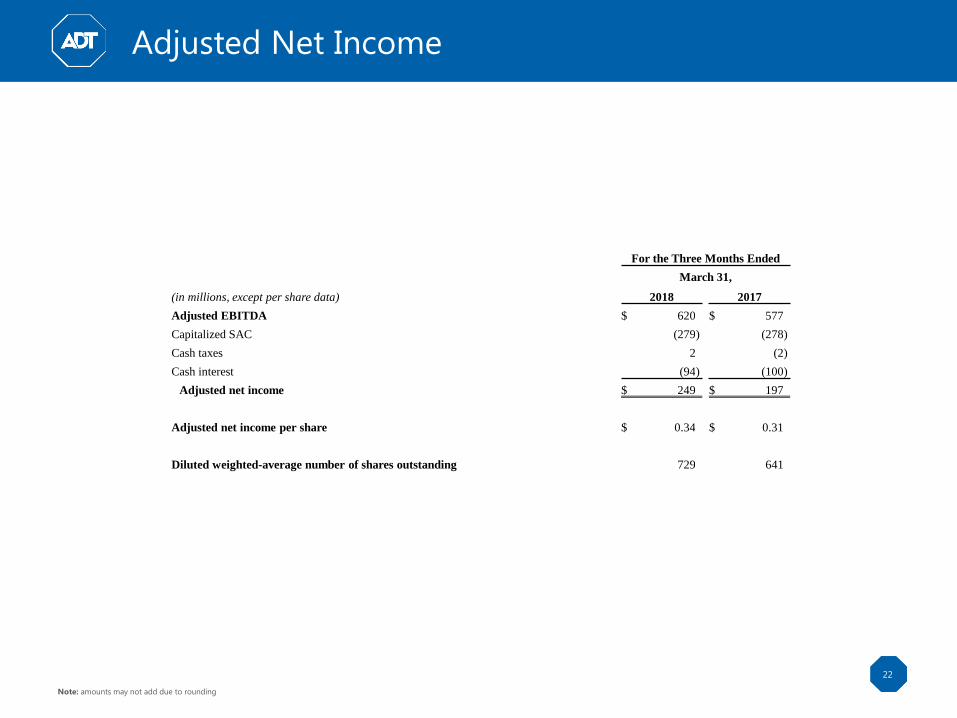
Adjusted Net Income
22
Note: amounts may not add due to rounding
For the Three Months Ended
March 31,
(in millions, except per share data) 2018 2017
Adjusted EBITDA $ 620 $ 577
Capitalized SAC (279) (278)
Cash taxes 2 (2)
Cash interest (94) (100)
Adjusted net income $ 249 $ 197
Adjusted net income per share $ 0.34 $ 0.31
Diluted weighted-average number of shares outstanding 729 641
Confidential, not for distribution or publication without express consent of ADT
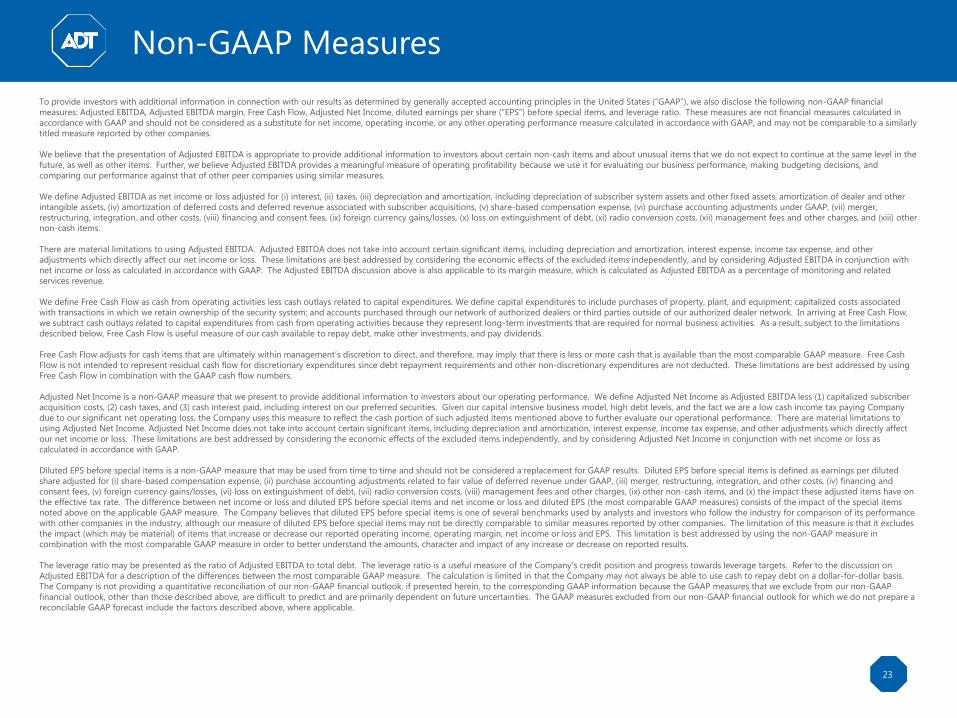
Non-GAAP Measures
23
To provide investors with additional information in connection with our results as determined by generally accepted accounting principles in the United States (“GAAP”), we also disclose the following non-GAAP financial
measures: Adjusted EBITDA, Adjusted EBITDA margin, Free Cash Flow, Adjusted Net Income, diluted earnings per share (“EPS”) before special items, and leverage ratio. These measures are not financial measures calculated in
accordance with GAAP and should not be considered as a substitute for net income, operating income, or any other operating performance measure calculated in accordance with GAAP, and may not be comparable to a similarly
titled measure reported by other companies.
We believe that the presentation of Adjusted EBITDA is appropriate to provide additional information to investors about certain non-cash items and about unusual items that we do not expect to continue at the same level in the
future, as well as other items. Further, we believe Adjusted EBITDA provides a meaningful measure of operating profitability because we use it for evaluating our business performance, making budgeting decisions, and
comparing our performance against that of other peer companies using similar measures.
We define Adjusted EBITDA as net income or loss adjusted for (i) interest, (ii) taxes, (iii) depreciation and amortization, including depreciation of subscriber system assets and other fixed assets, amortization of dealer and other
intangible assets, (iv) amortization of deferred costs and deferred revenue associated with subscriber acquisitions, (v) share-based compensation expense, (vi) purchase accounting adjustments under GAAP, (vii) merger,
restructuring, integration, and other costs, (viii) financing and consent fees, (ix) foreign currency gains/losses, (x) loss on extinguishment of debt, (xi) radio conversion costs, (xii) management fees and other charges, and (xiii) other
non-cash items.
There are material limitations to using Adjusted EBITDA. Adjusted EBITDA does not take into account certain significant items, including depreciation and amortization, interest expense, income tax expense, and other
adjustments which directly affect our net income or loss. These limitations are best addressed by considering the economic effects of the excluded items independently, and by considering Adjusted EBITDA in conjunction with
net income or loss as calculated in accordance with GAAP. The Adjusted EBITDA discussion above is also applicable to its margin measure, which is calculated as Adjusted EBITDA as a percentage of monitoring and related
services revenue.
We define Free Cash Flow as cash from operating activities less cash outlays related to capital expenditures. We define capital expenditures to include purchases of property, plant, and equipment; capitalized costs associated
with transactions in which we retain ownership of the security system; and accounts purchased through our network of authorized dealers or third parties outside of our authorized dealer network. In arriving at Free Cash Flow,
we subtract cash outlays related to capital expenditures from cash from operating activities because they represent long-term investments that are required for normal business activities. As a result, subject to the limitations
described below, Free Cash Flow is useful measure of our cash available to repay debt, make other investments, and pay dividends.
Free Cash Flow adjusts for cash items that are ultimately within management’s discretion to direct, and therefore, may imply that there is less or more cash that is available than the most comparable GAAP measure. Free Cash
Flow is not intended to represent residual cash flow for discretionary expenditures since debt repayment requirements and other non-discretionary expenditures are not deducted. These limitations are best addressed by using
Free Cash Flow in combination with the GAAP cash flow numbers.
Adjusted Net Income is a non-GAAP measure that we present to provide additional information to investors about our operating performance. We define Adjusted Net Income as Adjusted EBITDA less (1) capitalized subscriber
acquisition costs, (2) cash taxes, and (3) cash interest paid, including interest on our preferred securities. Given our capital intensive business model, high debt levels, and the fact we are a low cash income tax paying Company
due to our significant net operating loss, the Company uses this measure to reflect the cash portion of such adjusted items mentioned above to further evaluate our operational performance. There are material limitations to
using Adjusted Net Income. Adjusted Net Income does not take into account certain significant items, including depreciation and amortization, interest expense, income tax expense, and other adjustments which directly affect
our net income or loss. These limitations are best addressed by considering the economic effects of the excluded items independently, and by considering Adjusted Net Income in conjunction with net income or loss as
calculated in accordance with GAAP.
Diluted EPS before special items is a non-GAAP measure that may be used from time to time and should not be considered a replacement for GAAP results. Diluted EPS before special items is defined as earnings per diluted
share adjusted for (i) share-based compensation expense, (ii) purchase accounting adjustments related to fair value of deferred revenue under GAAP, (iii) merger, restructuring, integration, and other costs, (iv) financing and
consent fees, (v) foreign currency gains/losses, (vi) loss on extinguishment of debt, (vii) radio conversion costs, (viii) management fees and other charges, (ix) other non-cash items, and (x) the impact these adjusted items have on
the effective tax rate. The difference between net income or loss and diluted EPS before special items and net income or loss and diluted EPS (the most comparable GAAP measures) consists of the impact of the special items
noted above on the applicable GAAP measure. The Company believes that diluted EPS before special items is one of several benchmarks used by analysts and investors who follow the industry for comparison of its performance
with other companies in the industry, although our measure of diluted EPS before special items may not be directly comparable to similar measures reported by other companies. The limitation of this measure is that it excludes
the impact (which may be material) of items that increase or decrease our reported operating income, operating margin, net income or loss and EPS. This limitation is best addressed by using the non-GAAP measure in
combination with the most comparable GAAP measure in order to better understand the amounts, character and impact of any increase or decrease on reported results.
The leverage ratio may be presented as the ratio of Adjusted EBITDA to total debt. The leverage ratio is a useful measure of the Company’s credit position and progress towards leverage targets. Refer to the discussion on
Adjusted EBITDA for a description of the differences between the most comparable GAAP measure. The calculation is limited in that the Company may not always be able to use cash to repay debt on a dollar-for-dollar basis.
The Company is not providing a quantitative reconciliation of our non-GAAP financial outlook, if presented herein, to the corresponding GAAP information because the GAAP measures that we exclude from our non-GAAP
financial outlook, other than those described above, are difficult to predict and are primarily dependent on future uncertainties. The GAAP measures excluded from our non-GAAP financial outlook for which we do not prepare a
reconcilable GAAP forecast include the factors described above, where applicable.

Appendix:Supplemental
Investor Materials

Confidential, not for distribution or publication without express consent of ADT
54%
6% 6% 6%
TraditionalComp
Cable /Telecom 1
Cable /Telecom 2
25
Service is Our Business and Our Key Competitive Advantage
Notes
1. Harris Brand Tracking Research, January 2017
2. Presented as of 12/31/2017; excludes wholesale customers who outsource their monitoring to ADT. We service ~8MM customers, which include ~7.2MM owned and ~0.8M contracts monitored but not
owned. Contracts monitored but not owned are primarily part of legacy P1 wholesale business
ADT is the Trusted Security Provider and Service is Our Biggest Competitive Advantage and Differentiator
Protect Connect Delivered Via ADT Services
Our Expansive National Footprint
Distribution Center
National Account Center
Boca Raton
Disaster
Recovery
Center
Locations Monitoring Centers Corporate Headquarters
200+ Branch Locations
~7.2MMCustomers (2)
~2MM+Annual Service Visits
~18,000Total Employees
Iconic Brand with Unparalleled Recognition
% of Consumers Surveyed Who Viewed ADT as the Best
Brand vs. Other Competitors (1)
✓ Intrusion
✓ Life safety / fire
✓ Video & access control
✓ PERs
✓ Cybersecurity
✓ Interactive platform
✓ ADT Go
✓ Technology partners
✓ Installation and same day service
✓ Fire inspection and maintenance
✓ Monitoring and analytics
✓ IoT device installation and maintenance
✓ Video / Mobile / Wearables
~4,600Technicians
Confidential, not for distribution or publication without express consent of ADT
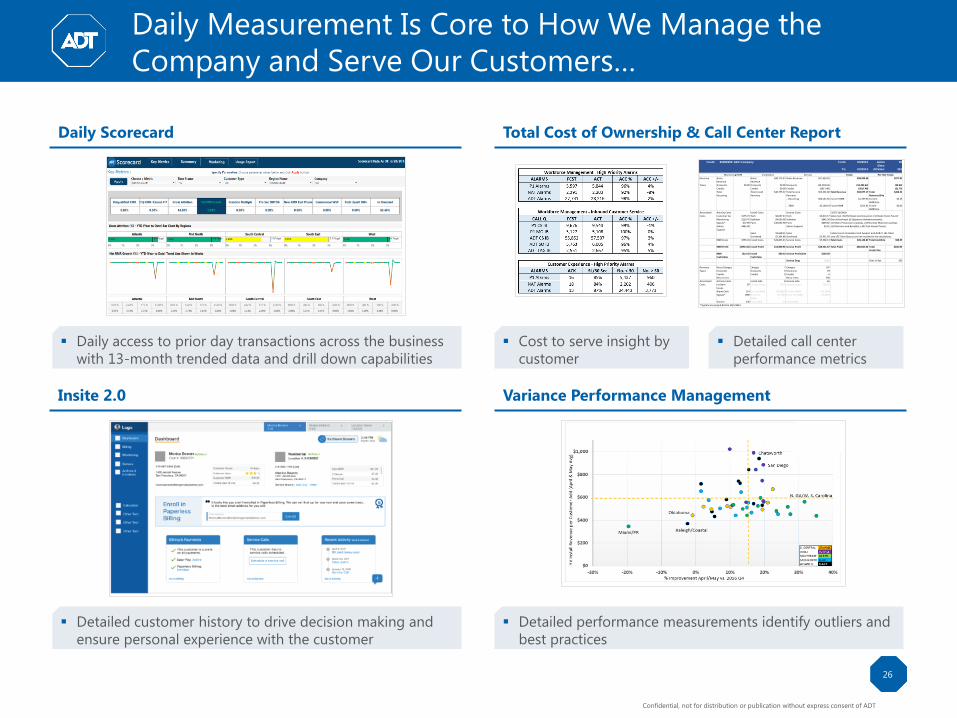
Daily Measurement Is Core to How We Manage the
Company and Serve Our Customers…
26
Cust#: 60282969 From: 9/1/2013 Active
Sites:
92
To: 9/1/2014 All Sites: 353
Revenue Gross
Revenue
Gross
Revenue
$40,775.37 Gross Revenue $57,323.91 $98,099.28 $277.90
Types Discounts $0.00 Discounts $0.00 Discounts ($3,404.63) ($3,404.63) ($9.64)
Credits Credits $0.00 Credits ($617.48) ($617.48) ($1.75)
Total
Recurring
Total Install
Revenue
$40,775.37 Total Service
Revenue
$53,301.80 Total Revenue $94,077.17 Total
Revenue/Site
$266.51
...Recurring $50,141.62 Current RMR $1,197.94 Current
RMR/Site
$3.39
...T&M $3,160.18 Future RMR $212.51 Future
RMR/Site
$0.60
Associated Activity Costs Install Costs Service Costs
Costs Customer Svc $175.74 Tech $6,637.44 Tech $4,613.17
Monitoring $119.70 Sublabor $4,630.00 Sublabor $842.30
Signals* $17.89 Parts $10,634.98 Parts $669.82
Admin
Support
$442.00 Admin Support $3.25
Sales $2,618.11 Sales
Overhead $2,304.88 Overhead $1,431.59
RMR Costs $755.33 Install Costs $26,825.41 Service Costs $7,560.13 Total Costs $35,140.87 Total Cost/Site $99.55
RMR Profit ($755.33) Install Profit $13,949.96 Service Profit $45,741.67 Total Profit $58,936.30 Total
Profit/Site
$166.96
RMR
Profit/Site
($2.14) Install
Profit/Site
$39.52 Service Profit/Site $129.58
Service Drag 8.8% Sites in Rpt 353
Revenue Recur Charges Charges 7 Charges 707
Types Discounts Discounts 0 Discounts 29
Credits Credits 0 Credits 6
Recur Lines Recur Lines 704
Associated Activity Costs Install Jobs 8 Service Jobs 65
Costs Incident
Issues
87 Lawson Hours 279.1 Lawson Hours 183.62
Alarm Calls 114 On-Site (MM) 169.8832 On-Site (MM) 119.2664
Signals* 1789 Drive Hrs
(MM)
25.7165 Drive Hrs (MM) 61.6835
Actions 136 Parts (MM) 22 Parts (MM) 5
and L55 (Tech Bonus) are not included in the calculations.
* Signals are purged before 10/1/2013
COSTS LEGEND:
Sales Cost: DCOM (Sales Commissions); L31 (Sales Team Payroll
Direct Overhead: EE (Expenses Reimbursements);
L10 (Non-Productive Loading), L18 (Exempt Material Loading),
L20 (Pension and Benefits), L30 (Tech Payroll Taxes)
Indirect costs (including Tech Support and AC&T), L45 (Fleet
ABC Company
Monitoring/RMR Installation Service Totals Per-Site Totals
Daily Scorecard
Insite 2.0
Total Cost of Ownership & Call Center Report
Variance Performance Management
▪ Daily access to prior day transactions across the business
with 13-month trended data and drill down capabilities
▪ Detailed customer history to drive decision making and
ensure personal experience with the customer
▪ Detailed performance measurements identify outliers and
best practices
▪ Cost to serve insight by
customer
▪ Detailed call center
performance metrics

Confidential, not for distribution or publication without express consent of ADT
…And a Vastly Improved Customer Experience Is at
the Core of Our Transformation
27
>90
<1
Historical Target
Minutes
Call Abandonment Rate
>10%
<1%
Historical Target
Employee Turnover (1)
Historical Target
Longest Call Wait Time
% of Customers
<20%
Historical Target
Same-Day / Next-Day Service (2)
>60%
~40%
New Approach to Customer Care
%
%
65%
Source Company Data
Notes
1. Call center employees only
2. For commercial customers, our expectation is same-day service. Some residential customers elect to receive next-day service
▪ Engagement with the frontline
▪ Delivery of an exceptional customer
experience
▪ Focus on daily management of the
business
Confidential, not for distribution or publication without express consent of ADT
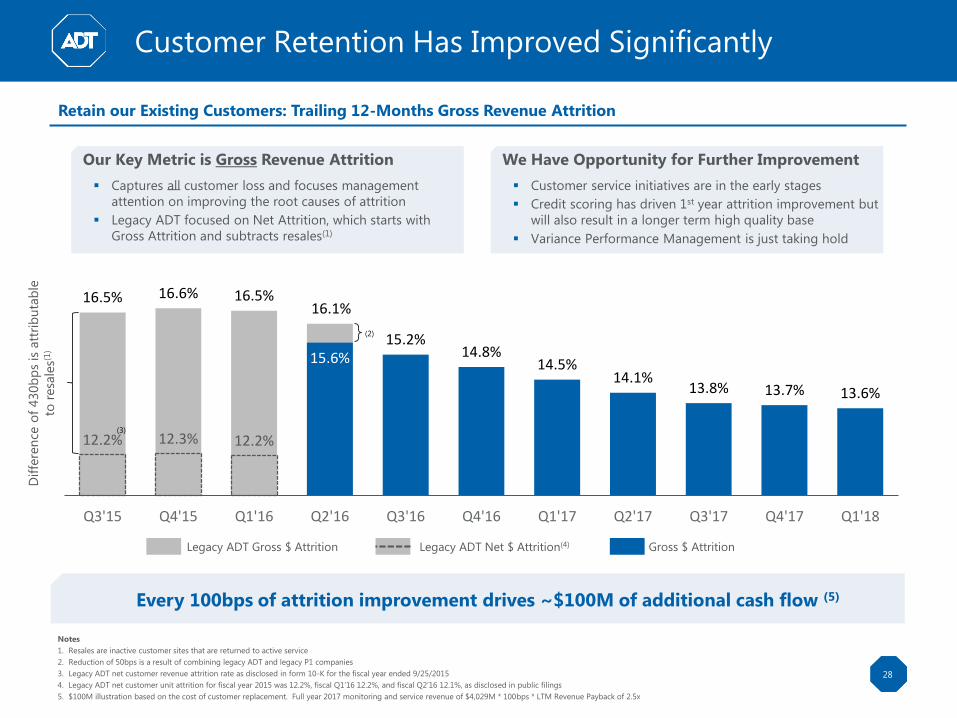
16.5% 16.6% 16.5%16.1%
15.6%15.2%
14.8%14.5%
14.1%13.8% 13.7% 13.6%
12.2% 12.3% 12.2%
Q3'15 Q4'15 Q1'16 Q2'16 Q3'16 Q4'16 Q1'17 Q2'17 Q3'17 Q4'17 Q1'18
(2)
(3)
Customer Retention Has Improved Significantly
28
Retain our Existing Customers: Trailing 12-Months Gross Revenue Attrition
Our Key Metric is Gross Revenue Attrition
▪ Captures all customer loss and focuses management
attention on improving the root causes of attrition
▪ Legacy ADT focused on Net Attrition, which starts with
Gross Attrition and subtracts resales(1)
We Have Opportunity for Further Improvement
▪ Customer service initiatives are in the early stages
▪ Credit scoring has driven 1st year attrition improvement but
will also result in a longer term high quality base
▪ Variance Performance Management is just taking hold
Gross $ AttritionLegacy ADT Net $ Attrition(4)Legacy ADT Gross $ Attrition
Every 100bps of attrition improvement drives ~$100M of additional cash flow (5)
Notes
1. Resales are inactive customer sites that are returned to active service
2. Reduction of 50bps is a result of combining legacy ADT and legacy P1 companies
3. Legacy ADT net customer revenue attrition rate as disclosed in form 10-K for the fiscal year ended 9/25/2015
4. Legacy ADT net customer unit attrition for fiscal year 2015 was 12.2%, fiscal Q1’16 12.2%, and fiscal Q2’16 12.1%, as disclosed in public filings
5. $100M illustration based on the cost of customer replacement. Full year 2017 monitoring and service revenue of $4,029M * 100bps * LTM Revenue Payback of 2.5x
Dif
fere
nce
of
430b
ps
is a
ttri
bu
tab
le
to r
esa
les(1
)

Confidential, not for distribution or publication without express consent of ADT
Our Efficient Customer Acquisition Approach
Net Subscriber Acquisition Costs (‘SAC’) are down substantially and Revenue Payback improved from 2.7x to 2.5x since 2015(1)
Our Focus on RMR
Commercial /
Multi-Site
Residential /
Small Business
Investment (SAC) $1M $1M
Revenue Payback 1.5x 2.5x
RMR Added (4) $56K $33K
Gross Attrition 10% 14%
Unlevered IRR 30%+ 20%+
New RMR per Site $100 $50
Customers Added 556 667
▪ Our focus is on adding high quality
new recurring monthly revenue (RMR)
▪ New RMR can come from new
customers or existing sites
▪ Attractive economics with differing
return and attrition profiles across
customer types
Customer Profile (2)
Commercial
Residential Small Business Large / Multi-Site
Customer Count(3) ~6,500K >500K >200K
Ending RMR $285M $29M $17M
New RMR $42M $5M $2M
Revenue Payback ~2.6x ~2.4x ~1.5x
Gross Attrition ~14% ~15% ~9%-12%
Typical Revenue/Site $40-$55 $50-$65 $50-$120+
Notes
1. Comparing to pre-acquisition Legacy ADT for FY2015
2. Metrics are for the period ended Dec 31, 2017, excluding wholesale customers who outsource their monitoring to ADT
3. Total customer count of 7.2M as of Dec 31, 2017, which is comparable to reported Legacy ADT customer count of 6,565K and P1 customer count of 890K for a combined 7,455K as of Dec 31, 2015. Customer
count excludes wholesale customers who outsource their monitoring to ADT. Customer count is defined as distinct count of sites with billed RMR
4. Recurring monthly revenue added = investment (SAC) ÷ revenue payback ÷ 12 months
▪ Improved quality
and efficiency of SAC
with credit scoring,
higher upfront install
revenue and more
efficient marketing
Progress to
Date
Opportunity
▪ Increased RMR
base >10% since
2015 through new
additions and
penetration of
existing customers
▪ Started to leverage
the legacy P1
Commercial and
Multi Site playbook
and account base
▪ Build from a higher
quality ‘right-sized’
base of RMR adds
▪ Enhance
capabilities with new
offerings and
technology
▪ Opportunity for
add-on RMR based
services to small
businesses including
Video and Cyber
▪ Build out our sales
and install workforce
▪ ‘Tuck-in’
acquisitions with
operators that join
the ‘new ADT’
Illustrative Incremental
$1M Investment
29
Confidential, not for distribution or publication without express consent of ADT
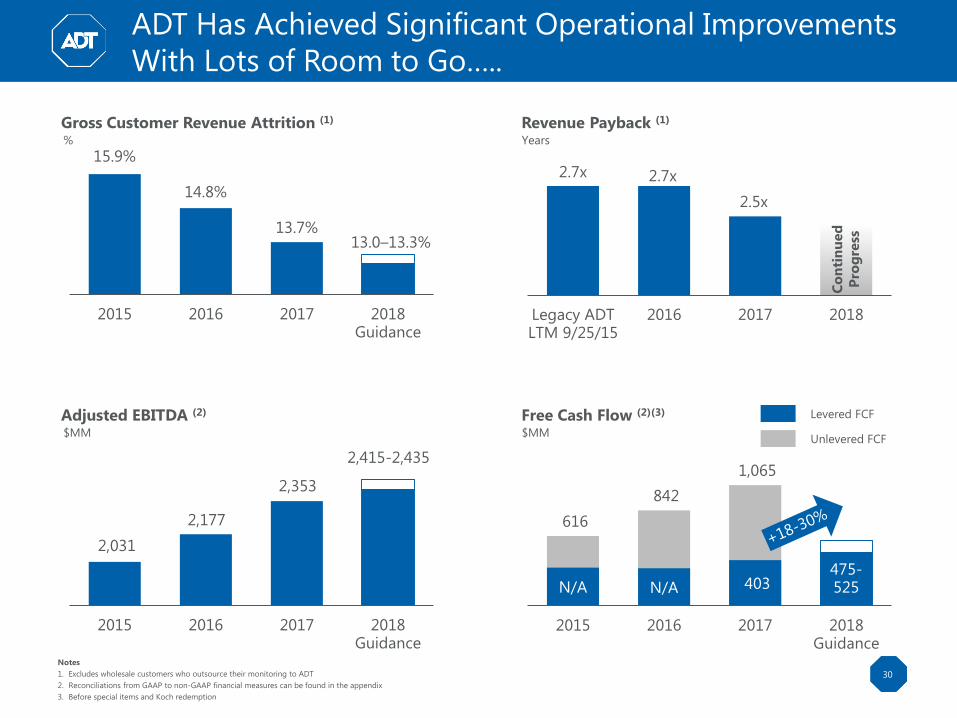
2.7x 2.7x
2.5x
Legacy ADTLTM 9/25/15
2016 2017 2018
ADT Has Achieved Significant Operational Improvements
With Lots of Room to Go…..
30
15.9%
14.8%
13.7%13.0–13.3%
2015 2016 2017 2018Guidance
Gross Customer Revenue Attrition (1)
%
Notes
1. Excludes wholesale customers who outsource their monitoring to ADT
2. Reconciliations from GAAP to non-GAAP financial measures can be found in the appendix
3. Before special items and Koch redemption
Revenue Payback (1)
Years
Adjusted EBITDA (2)
$MM
Free Cash Flow (2)(3)
$MM
2,415-2,435
2,031
2,177
2,353
2015 2016 2017 2018Guidance
616
842
1,065
N/A N/A 403 475-525
2015 2016 2017 2018Guidance
Unlevered FCF
Levered FCF
Co
nti
nu
ed
Pro
gre
ss
Confidential, not for distribution or publication without express consent of ADT
31
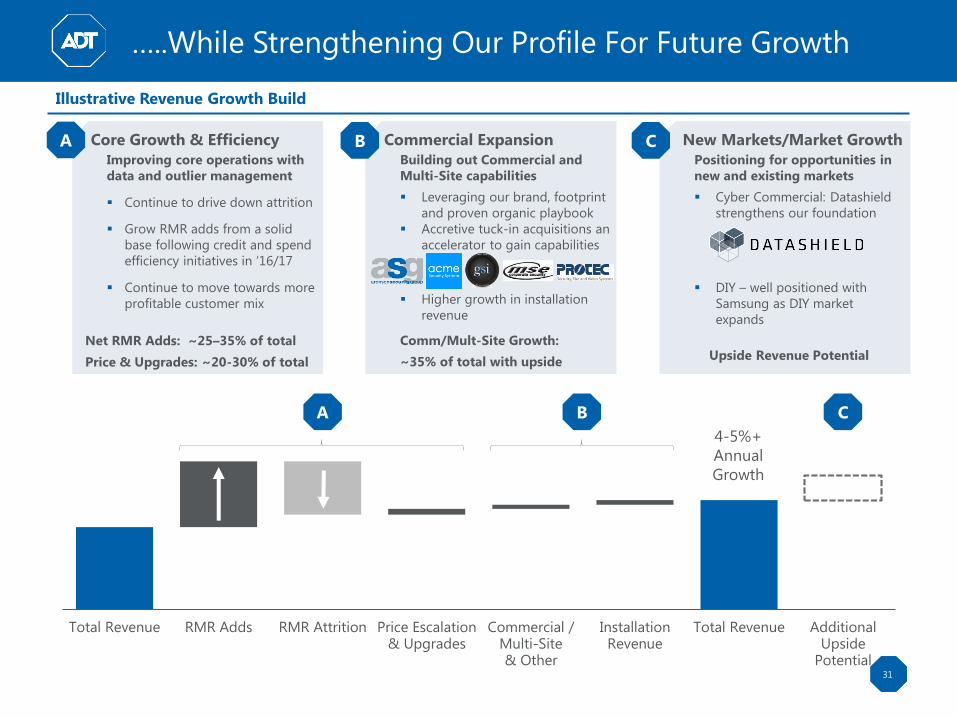
…..While Strengthening Our Profile For Future Growth
Illustrative Revenue Growth Build
Total Revenue RMR Adds RMR Attrition Price Escalation& Upgrades
Commercial /Multi-Site& Other
InstallationRevenue
Total Revenue AdditionalUpside
Potential
A B C
Core Growth & Efficiency
Improving core operations with
data and outlier management
▪ Continue to drive down attrition
▪ Grow RMR adds from a solid
base following credit and spend
efficiency initiatives in ‘16/17
▪ Continue to move towards more
profitable customer mix
Net RMR Adds: ~25–35% of total
Price & Upgrades: ~20-30% of total
A Commercial Expansion
Building out Commercial and
Multi-Site capabilities
▪ Leveraging our brand, footprint
and proven organic playbook
▪ Accretive tuck-in acquisitions an
accelerator to gain capabilities
▪ Higher growth in installation
revenue
Comm/Mult-Site Growth:
~35% of total with upside
B New Markets/Market Growth
Positioning for opportunities in
new and existing markets
▪ Cyber Commercial: Datashield
strengthens our foundation
▪ DIY – well positioned with
Samsung as DIY market
expands
Upside Revenue Potential
C
4-5%+
Annual
Growth