Embed Size (px)
Citation preview
Kirin Group
Financial Results for the 1Q 2019
May 9, 2019
Kirin Holdings Company, Limited
© Kirin Holdings Company, Limited 2
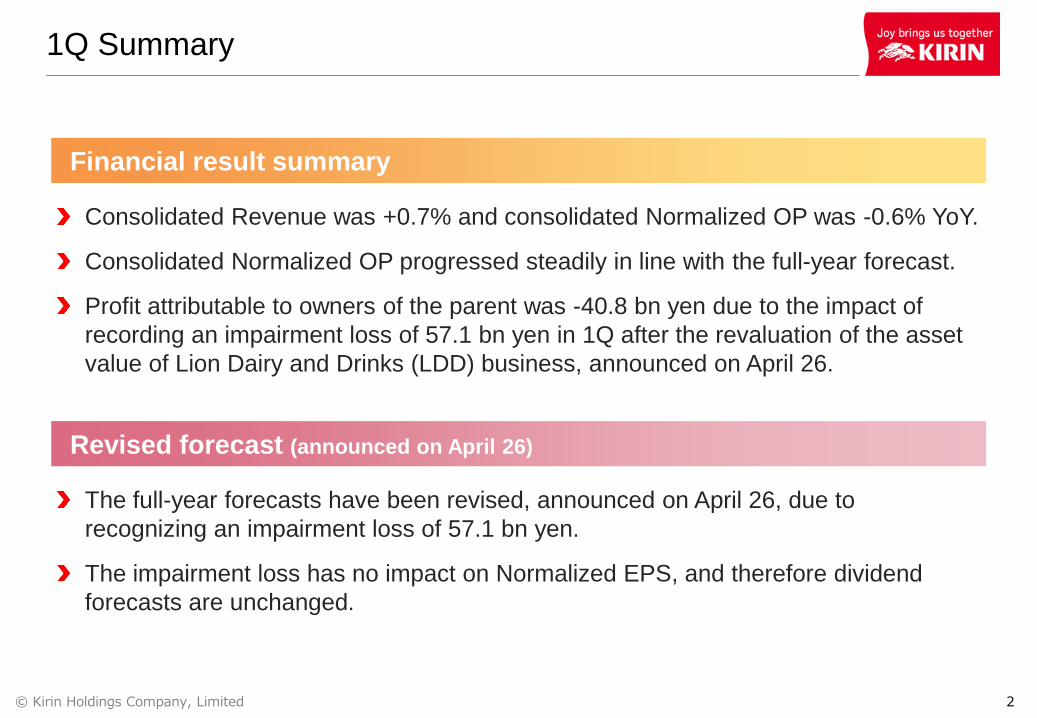
1Q Summary
Consolidated Revenue was +0.7% and consolidated Normalized OP was -0.6% YoY.
Consolidated Normalized OP progressed steadily in line with the full-year forecast.
Profit attributable to owners of the parent was -40.8 bn yen due to the impact of
recording an impairment loss of 57.1 bn yen in 1Q after the revaluation of the asset
value of Lion Dairy and Drinks (LDD) business, announced on April 26.
Financial result summary
The full-year forecasts have been revised, announced on April 26, due to
recognizing an impairment loss of 57.1 bn yen.
The impairment loss has no impact on Normalized EPS, and therefore dividend
forecasts are unchanged.
Revised forecast (announced on April 26)
© Kirin Holdings Company, Limited 3
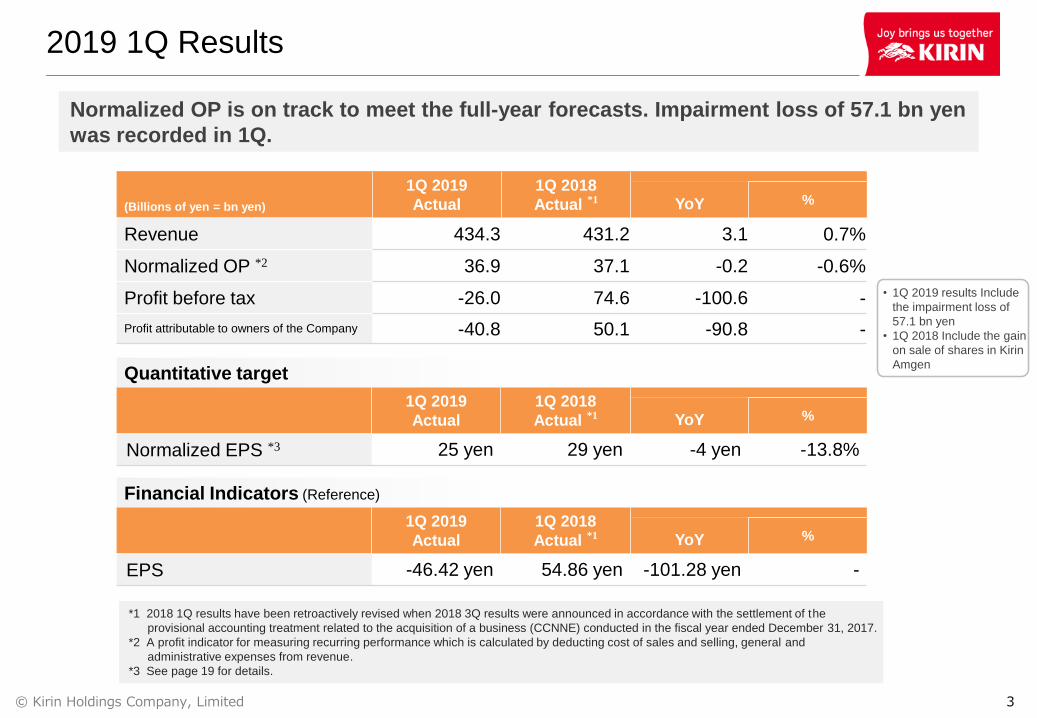
2019 1Q Results
*1 2018 1Q results have been retroactively revised when 2018 3Q results were announced in accordance with the settlement of the
provisional accounting treatment related to the acquisition of a business (CCNNE) conducted in the fiscal year ended December 31, 2017.
*2 A profit indicator for measuring recurring performance which is calculated by deducting cost of sales and selling, general and
administrative expenses from revenue.
*3 See page 19 for details.
(Billions of yen = bn yen)
1Q 2019
Actual
1Q 2018
Actual *1 YoY %
Revenue 434.3 431.2 3.1 0.7%
Normalized OP *2 36.9 37.1 -0.2 -0.6%
Profit before tax -26.0 74.6 -100.6 -
Profit attributable to owners of the Company -40.8 50.1 -90.8 -
Quantitative target
1Q 2019
Actual
1Q 2018
Actual *1 YoY %
Normalized EPS *3 25 yen 29 yen -4 yen -13.8%
Financial Indicators (Reference)
1Q 2019
Actual
1Q 2018
Actual *1 YoY %
EPS -46.42 yen 54.86 yen -101.28 yen -
Normalized OP is on track to meet the full-year forecasts. Impairment loss of 57.1 bn yen
was recorded in 1Q.
• 1Q 2019 results Include
the impairment loss of
57.1 bn yen
• 1Q 2018 Include the gain
on sale of shares in Kirin
Amgen
© Kirin Holdings Company, Limited 4
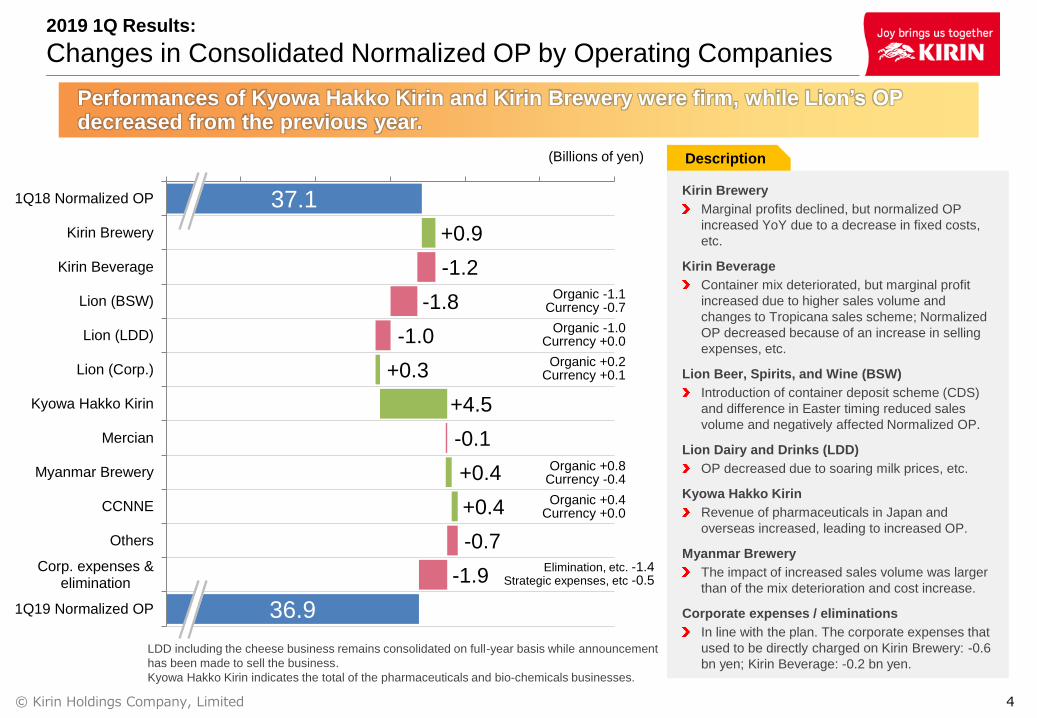
37.1
36.9
+0.9
-1.2
-1.8
-1.0
+0.3
+4.5
-0.1
+0.4
+0.4
-0.7
-1.9
20.0 25.0 30.0 35.0 40.0 45.0 50.0
1Q18 Normalized OP
Kirin Brewery
Kirin Beverage
Lion (BSW)
Lion (LDD)
Lion (Corp.)
Kyowa Hakko Kirin
Mercian
Myanmar Brewery
CCNNE
Others
Corp. expenses &elimination
1Q19 Normalized OP
2019 1Q Results:
Changes in Consolidated Normalized OP by Operating Companies
Description
Kirin Brewery
Marginal profits declined, but normalized OP
increased YoY due to a decrease in fixed costs,
etc.
Kirin Beverage
Container mix deteriorated, but marginal profit
increased due to higher sales volume and
changes to Tropicana sales scheme; Normalized
OP decreased because of an increase in selling
expenses, etc.
Lion Beer, Spirits, and Wine (BSW)
Introduction of container deposit scheme (CDS)
and difference in Easter timing reduced sales
volume and negatively affected Normalized OP.
Lion Dairy and Drinks (LDD)
OP decreased due to soaring milk prices, etc.
Kyowa Hakko Kirin
Revenue of pharmaceuticals in Japan and
overseas increased, leading to increased OP.
Myanmar Brewery
The impact of increased sales volume was larger
than of the mix deterioration and cost increase.
Corporate expenses / eliminations
In line with the plan. The corporate expenses that
used to be directly charged on Kirin Brewery: -0.6
bn yen; Kirin Beverage: -0.2 bn yen.
Performances of Kyowa Hakko Kirin and Kirin Brewery were firm, while Lion’s OPdecreased from the previous year.
(Billions of yen)
LDD including the cheese business remains consolidated on full-year basis while announcement
has been made to sell the business.
Kyowa Hakko Kirin indicates the total of the pharmaceuticals and bio-chemicals businesses.
Elimination, etc. -1.4Strategic expenses, etc -0.5
Organic -1.1Currency -0.7
Organic -1.0Currency +0.0
Organic +0.2Currency +0.1
Organic +0.8Currency -0.4
Organic +0.4Currency +0.0
© Kirin Holdings Company, Limited 5
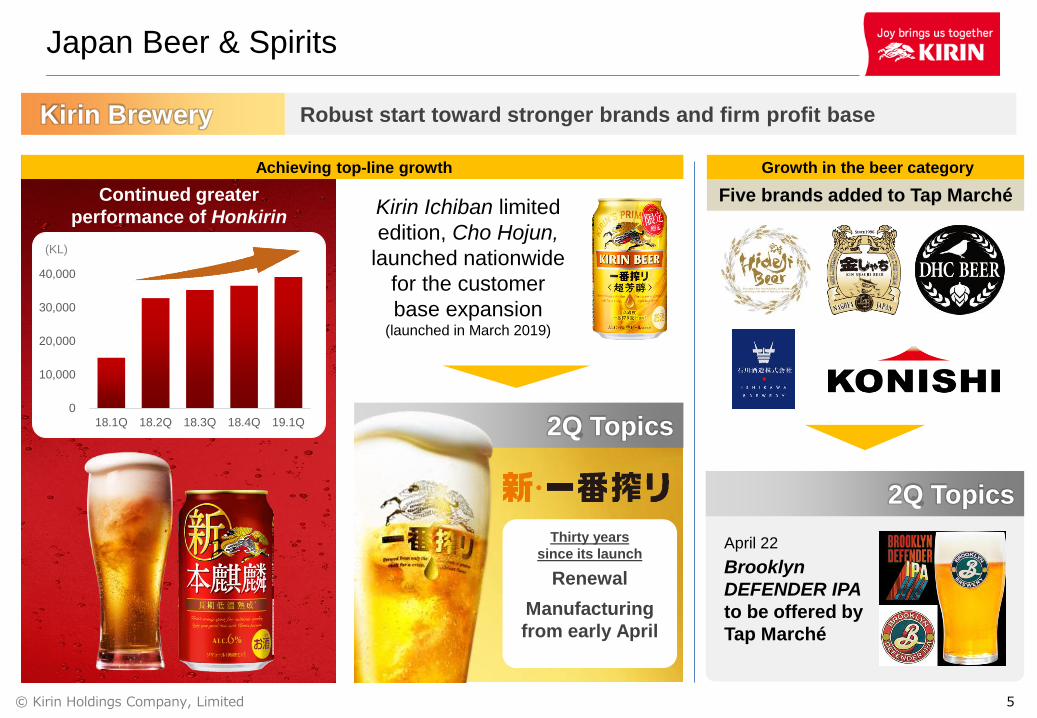
Japan Beer & Spirits
Kirin Brewery Robust start toward stronger brands and firm profit base
April 22
Brooklyn
DEFENDER IPA
to be offered by
Tap Marché
Five brands added to Tap Marché
2Q Topics
Honkirin: Increase
Coverage
Thirty years
since its launch
Renewal
Manufacturing
from early April
Kirin Ichiban limited
edition, Cho Hojun,
launched nationwide
for the customer
base expansion(launched in March 2019)
Achieving top-line growth
Continued greater
performance of Honkirin
0
10,000
20,000
30,000
40,000
18.1Q 18.2Q 18.3Q 18.4Q 19.1Q
(KL)
Growth in the beer category
2Q Topics
© Kirin Holdings Company, Limited 6
Japan Non-alcoholic Beverages
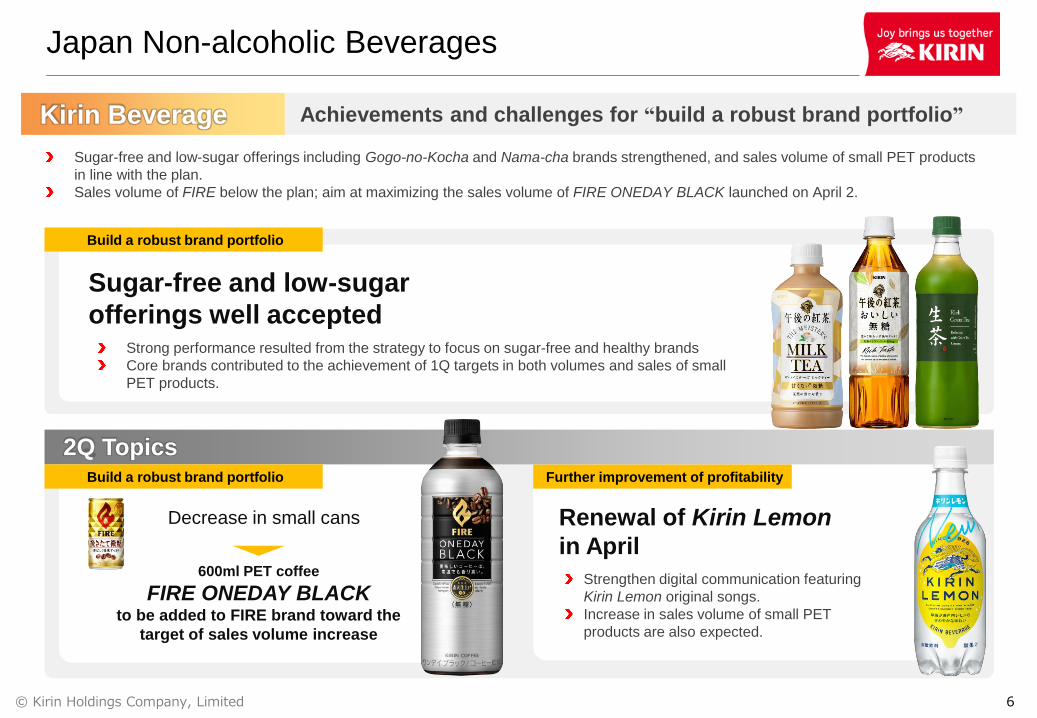
Kirin Beverage Achievements and challenges for “build a robust brand portfolio”
Sugar-free and low-sugar offerings including Gogo-no-Kocha and Nama-cha brands strengthened, and sales volume of small PET products
in line with the plan.
Sales volume of FIRE below the plan; aim at maximizing the sales volume of FIRE ONEDAY BLACK launched on April 2.
Sugar-free and low-sugar
offerings well accepted
Decrease in small cans
600ml PET coffee
FIRE ONEDAY BLACKto be added to FIRE brand toward the
target of sales volume increase
Strong performance resulted from the strategy to focus on sugar-free and healthy brands
Core brands contributed to the achievement of 1Q targets in both volumes and sales of small
PET products.
XXX
Further improvement of profitability
Renewal of Kirin Lemon
in April
2Q TopicsBuild a robust brand portfolio
Build a robust brand portfolio
Strengthen digital communication featuring
Kirin Lemon original songs.
Increase in sales volume of small PET
products are also expected.
© Kirin Holdings Company, Limited 7
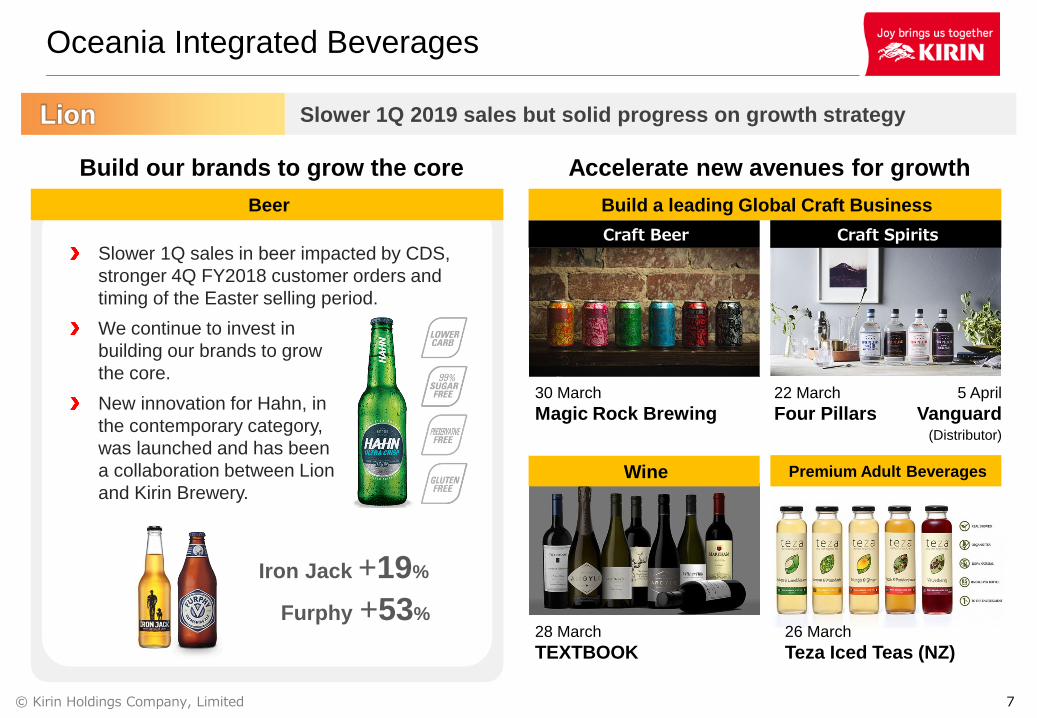
Oceania Integrated Beverages
Lion Slower 1Q 2019 sales but solid progress on growth strategy
28 March
TEXTBOOK
Craft Beer
Wine
Build our brands to grow the core Accelerate new avenues for growth
Build a leading Global Craft Business
Premium Adult Beverages
22 March
Four Pillars
26 March
Teza Iced Teas (NZ)
30 March
Magic Rock Brewing5 April
Vanguard
Craft Spirits
Beer
Iron Jack +19%
Furphy +53%
Slower 1Q sales in beer impacted by CDS,
stronger 4Q FY2018 customer orders and
timing of the Easter selling period.
We continue to invest in
building our brands to grow
the core.
New innovation for Hahn, in
the contemporary category,
was launched and has been
a collaboration between Lion
and Kirin Brewery.
(Distributor)
© Kirin Holdings Company, Limited 8
Global products
Pharmaceuticals and Bio-chemicals
Kyowa Hakko Kirin On track toward full-year forecasts both in Japan and overseas
Kyowa Hakko Bio Kirin Holdings acquired shares from Kyowa Hakko Kirin
Steady sales in Europe and North
America
Plan to expand the indications for
adults in Europe in the future.
Strong sales in the U.S.
Steady progress against full-year
sales forecast of 10 bn yen.
Re-application for approval
accepted by the U.S. Food and
Drug Administration※ Announced on April 4, 2019
KRN23/ brosmab
CrysvitaKW-0761/ mogamurizumab
PoteligeoKW-6002/ Istre Defirin
Nourist (product name in Japan)
Drugs for Parkinson's diseaseMedicine to treat hematologic cancerDrug to treat X-linked hypophosphatemia (XLH)
February 5, 2019Kirin Holdings announced the acquisition of 95%
of the shares in Kyowa Hakko Bio
April 24, 2019
Completion of share transfer
Merger
Kirin HD
Kirin
New business segment
Kyowa Hakko Kirin
Kyowa Hakko Bio
Kirin HD
New business segment
Kyowa Hakko Bio
Kyowa Hakko Kirin
95%
Acquisition
Accelerating
the creation
of synergies
focus on further growth
Appendix
© Kirin Holdings Company, Limited 10
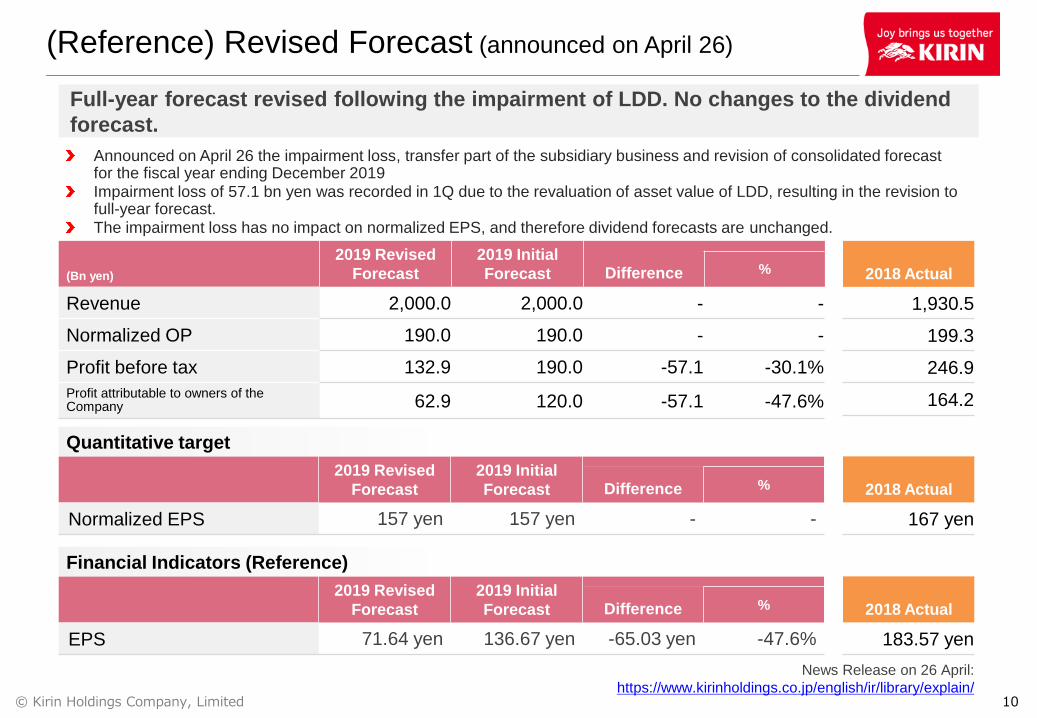
(Reference) Revised Forecast (announced on April 26)
(Bn yen)
2019 Revised
Forecast
2019 Initial
Forecast Difference %
Revenue 2,000.0 2,000.0 - -
Normalized OP 190.0 190.0 - -
Profit before tax 132.9 190.0 -57.1 -30.1%
Profit attributable to owners of the Company 62.9 120.0 -57.1 -47.6%
Quantitative target
2019 Revised
Forecast
2019 Initial
Forecast Difference %
Normalized EPS 157 yen 157 yen - -
Financial Indicators (Reference)
2019 Revised
Forecast
2019 Initial
Forecast Difference %
EPS 71.64 yen 136.67 yen -65.03 yen -47.6%
Full-year forecast revised following the impairment of LDD. No changes to the dividend
forecast.
Announced on April 26 the impairment loss, transfer part of the subsidiary business and revision of consolidated forecast for the fiscal year ending December 2019Impairment loss of 57.1 bn yen was recorded in 1Q due to the revaluation of asset value of LDD, resulting in the revision to full-year forecast.The impairment loss has no impact on normalized EPS, and therefore dividend forecasts are unchanged.
2018 Actual
1,930.5
199.3
246.9
164.2
2018 Actual
167 yen
2018 Actual
183.57 yen
News Release on 26 April:
https://www.kirinholdings.co.jp/english/ir/library/explain/
© Kirin Holdings Company, Limited 11
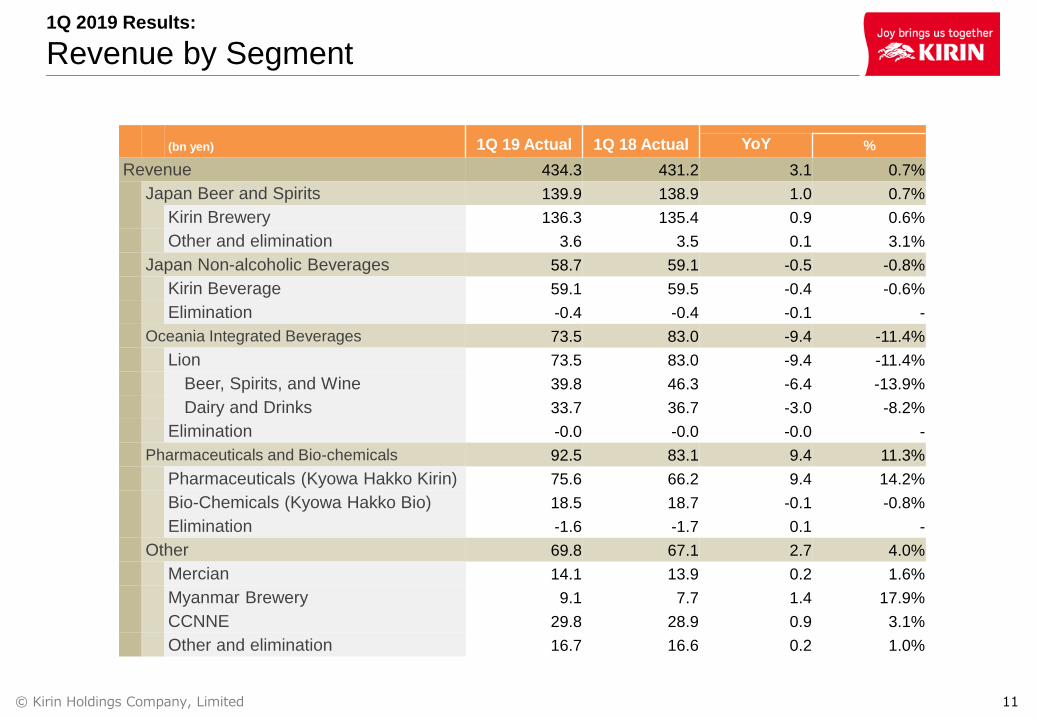
1Q 2019 Results:
Revenue by Segment
(bn yen) 1Q 19 Actual 1Q 18 Actual YoY %
Revenue 434.3 431.2 3.1 0.7%
Japan Beer and Spirits 139.9 138.9 1.0 0.7%
Kirin Brewery 136.3 135.4 0.9 0.6%
Other and elimination 3.6 3.5 0.1 3.1%
Japan Non-alcoholic Beverages 58.7 59.1 -0.5 -0.8%
Kirin Beverage 59.1 59.5 -0.4 -0.6%
Elimination -0.4 -0.4 -0.1 -
Oceania Integrated Beverages 73.5 83.0 -9.4 -11.4%
Lion 73.5 83.0 -9.4 -11.4%
Beer, Spirits, and Wine 39.8 46.3 -6.4 -13.9%
Dairy and Drinks 33.7 36.7 -3.0 -8.2%
Elimination -0.0 -0.0 -0.0 -
Pharmaceuticals and Bio-chemicals 92.5 83.1 9.4 11.3%
Pharmaceuticals (Kyowa Hakko Kirin) 75.6 66.2 9.4 14.2%
Bio-Chemicals (Kyowa Hakko Bio) 18.5 18.7 -0.1 -0.8%
Elimination -1.6 -1.7 0.1 -
Other 69.8 67.1 2.7 4.0%
Mercian 14.1 13.9 0.2 1.6%
Myanmar Brewery 9.1 7.7 1.4 17.9%
CCNNE 29.8 28.9 0.9 3.1%
Other and elimination 16.7 16.6 0.2 1.0%
© Kirin Holdings Company, Limited 12
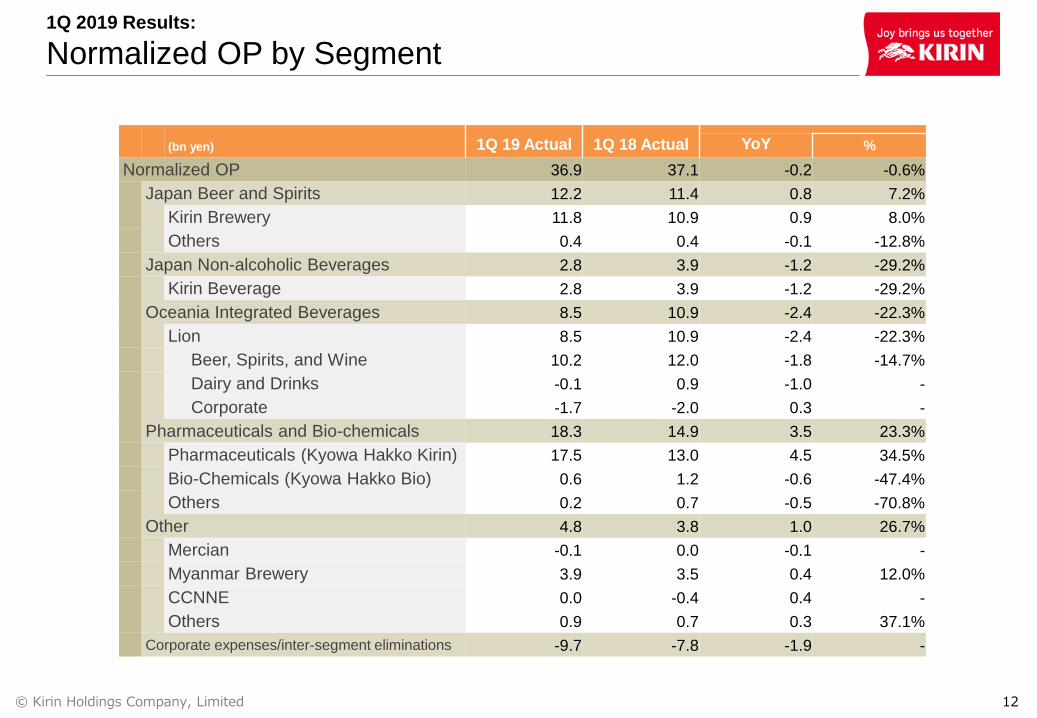
1Q 2019 Results:
Normalized OP by Segment
(bn yen) 1Q 19 Actual 1Q 18 Actual YoY %
Normalized OP 36.9 37.1 -0.2 -0.6%
Japan Beer and Spirits 12.2 11.4 0.8 7.2%
Kirin Brewery 11.8 10.9 0.9 8.0%
Others 0.4 0.4 -0.1 -12.8%
Japan Non-alcoholic Beverages 2.8 3.9 -1.2 -29.2%
Kirin Beverage 2.8 3.9 -1.2 -29.2%
Oceania Integrated Beverages 8.5 10.9 -2.4 -22.3%
Lion 8.5 10.9 -2.4 -22.3%
Beer, Spirits, and Wine 10.2 12.0 -1.8 -14.7%
Dairy and Drinks -0.1 0.9 -1.0 -
Corporate -1.7 -2.0 0.3 -
Pharmaceuticals and Bio-chemicals 18.3 14.9 3.5 23.3%
Pharmaceuticals (Kyowa Hakko Kirin) 17.5 13.0 4.5 34.5%
Bio-Chemicals (Kyowa Hakko Bio) 0.6 1.2 -0.6 -47.4%
Others 0.2 0.7 -0.5 -70.8%
Other 4.8 3.8 1.0 26.7%
Mercian -0.1 0.0 -0.1 -
Myanmar Brewery 3.9 3.5 0.4 12.0%
CCNNE 0.0 -0.4 0.4 -
Others 0.9 0.7 0.3 37.1%
Corporate expenses/inter-segment eliminations -9.7 -7.8 -1.9 -
© Kirin Holdings Company, Limited 13
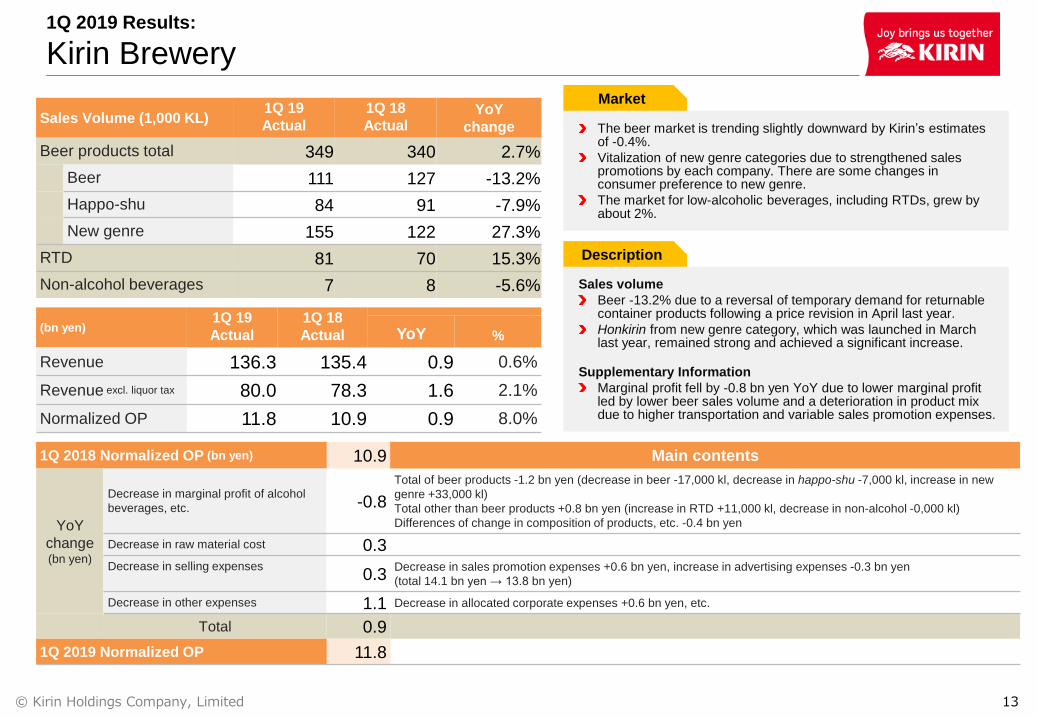
1Q 2019 Results:
Kirin Brewery
1Q 2018 Normalized OP (bn yen) 10.9 Main contents
YoY
change(bn yen)
Decrease in marginal profit of alcohol
beverages, etc. -0.8
Total of beer products -1.2 bn yen (decrease in beer -17,000 kl, decrease in happo-shu -7,000 kl, increase in new
genre +33,000 kl)
Total other than beer products +0.8 bn yen (increase in RTD +11,000 kl, decrease in non-alcohol -0,000 kl)
Differences of change in composition of products, etc. -0.4 bn yen
Decrease in raw material cost 0.3Decrease in selling expenses
0.3Decrease in sales promotion expenses +0.6 bn yen, increase in advertising expenses -0.3 bn yen
(total 14.1 bn yen → 13.8 bn yen)
Decrease in other expenses 1.1 Decrease in allocated corporate expenses +0.6 bn yen, etc.
Total 0.9
1Q 2019 Normalized OP 11.8
(bn yen)1Q 19
Actual
1Q 18
Actual YoY %
Revenue 136.3 135.4 0.9 0.6%
Revenue excl. liquor tax 80.0 78.3 1.6 2.1%
Normalized OP 11.8 10.9 0.9 8.0%
Sales Volume (1,000 KL)1Q 19
Actual
1Q 18
ActualYoY
change
Beer products total 349 340 2.7%
Beer 111 127 -13.2%
Happo-shu 84 91 -7.9%
New genre 155 122 27.3%
RTD 81 70 15.3%
Non-alcohol beverages 7 8 -5.6%
Market
The beer market is trending slightly downward by Kirin’s estimates of -0.4%.
Vitalization of new genre categories due to strengthened sales promotions by each company. There are some changes in consumer preference to new genre.
The market for low-alcoholic beverages, including RTDs, grew by about 2%.
Description
Sales volume
Beer -13.2% due to a reversal of temporary demand for returnable container products following a price revision in April last year.
Honkirin from new genre category, which was launched in March last year, remained strong and achieved a significant increase.
Supplementary Information
Marginal profit fell by -0.8 bn yen YoY due to lower marginal profit led by lower beer sales volume and a deterioration in product mix due to higher transportation and variable sales promotion expenses.
© Kirin Holdings Company, Limited 14
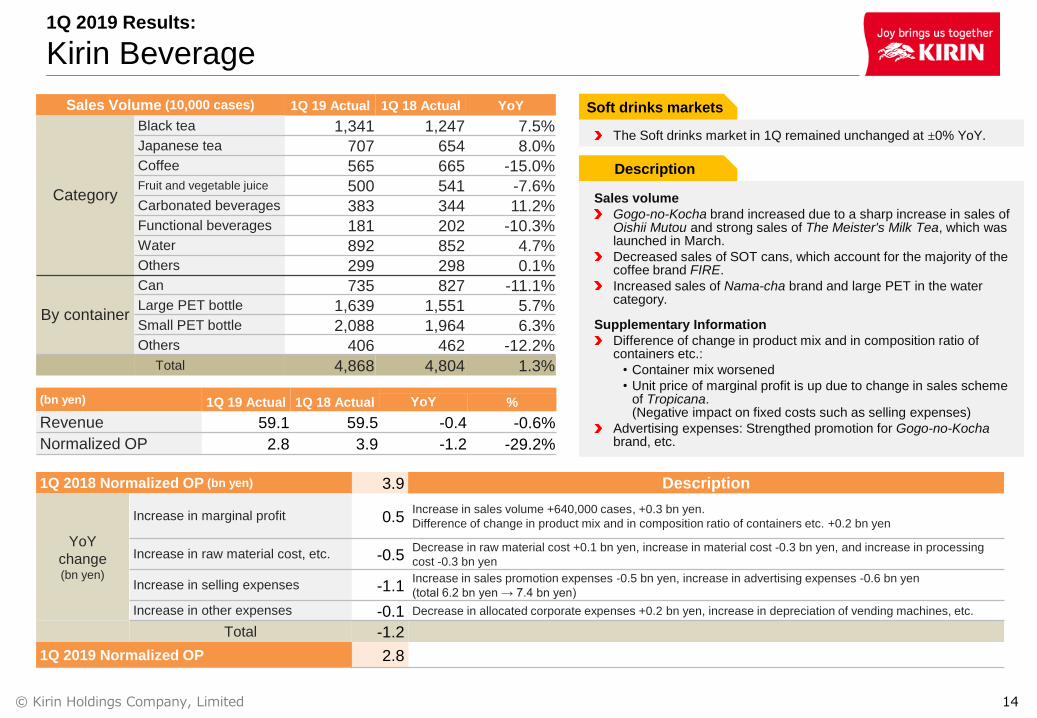
1Q 2019 Results:
Kirin Beverage
Sales Volume (10,000 cases) 1Q 19 Actual 1Q 18 Actual YoY
Category
Black tea 1,341 1,247 7.5%
Japanese tea 707 654 8.0%
Coffee 565 665 -15.0%Fruit and vegetable juice 500 541 -7.6%
Carbonated beverages 383 344 11.2%
Functional beverages 181 202 -10.3%
Water 892 852 4.7%
Others 299 298 0.1%
By container
Can 735 827 -11.1%
Large PET bottle 1,639 1,551 5.7%
Small PET bottle 2,088 1,964 6.3%
Others 406 462 -12.2%
Total 4,868 4,804 1.3%
Soft drinks markets
The Soft drinks market in 1Q remained unchanged at ±0% YoY.
Description
Sales volume
Gogo-no-Kocha brand increased due to a sharp increase in sales of Oishii Mutou and strong sales of The Meister's Milk Tea, which was launched in March.
Decreased sales of SOT cans, which account for the majority of the coffee brand FIRE.
Increased sales of Nama-cha brand and large PET in the water category.
Supplementary Information
Difference of change in product mix and in composition ratio of containers etc.:
• Container mix worsened
• Unit price of marginal profit is up due to change in sales scheme of Tropicana. (Negative impact on fixed costs such as selling expenses)
Advertising expenses: Strengthed promotion for Gogo-no-Kochabrand, etc.
1Q 2018 Normalized OP (bn yen) 3.9 Description
YoY
change(bn yen)
Increase in marginal profit 0.5Increase in sales volume +640,000 cases, +0.3 bn yen.
Difference of change in product mix and in composition ratio of containers etc. +0.2 bn yen
Increase in raw material cost, etc. -0.5Decrease in raw material cost +0.1 bn yen, increase in material cost -0.3 bn yen, and increase in processing
cost -0.3 bn yen
Increase in selling expenses -1.1Increase in sales promotion expenses -0.5 bn yen, increase in advertising expenses -0.6 bn yen
(total 6.2 bn yen → 7.4 bn yen)
Increase in other expenses -0.1 Decrease in allocated corporate expenses +0.2 bn yen, increase in depreciation of vending machines, etc.
Total -1.2
1Q 2019 Normalized OP 2.8
(bn yen) 1Q 19 Actual 1Q 18 Actual YoY %
Revenue 59.1 59.5 -0.4 -0.6%
Normalized OP 2.8 3.9 -1.2 -29.2%
© Kirin Holdings Company, Limited 15
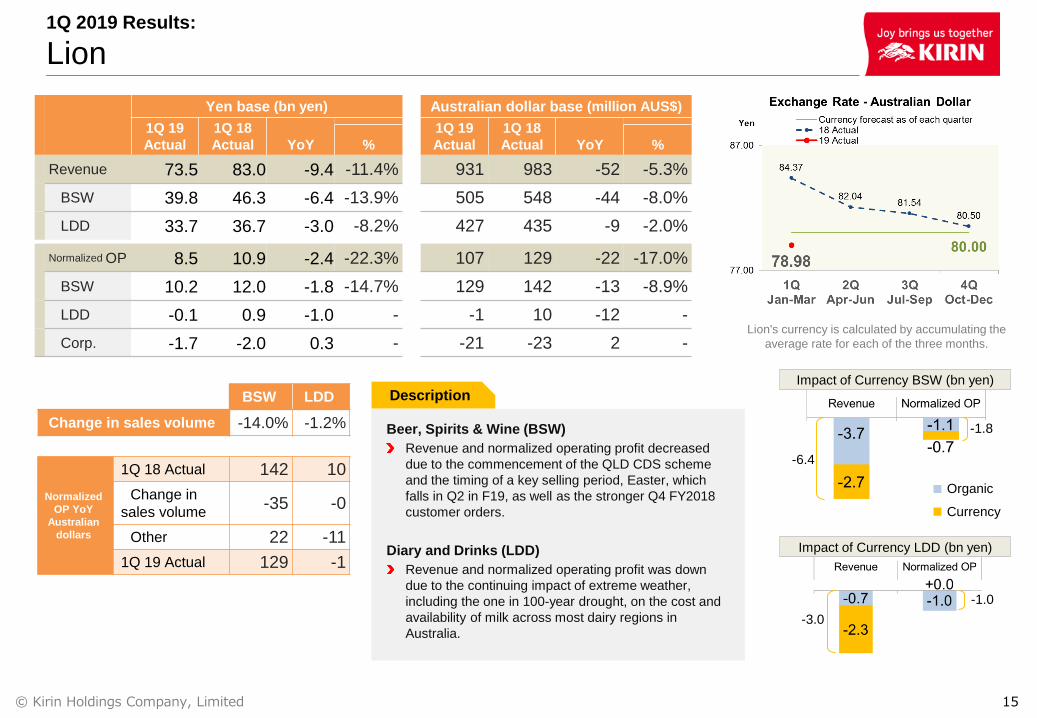
1Q 2019 Results:
Lion
Beer, Spirits & Wine (BSW)
Revenue and normalized operating profit decreased
due to the commencement of the QLD CDS scheme
and the timing of a key selling period, Easter, which
falls in Q2 in F19, as well as the stronger Q4 FY2018
customer orders.
Diary and Drinks (LDD)
Revenue and normalized operating profit was down
due to the continuing impact of extreme weather,
including the one in 100-year drought, on the cost and
availability of milk across most dairy regions in
Australia.
Description
Yen base (bn yen) Australian dollar base (million AUS$)
1Q 19
Actual
1Q 18
Actual YoY
1Q 19
Actual
1Q 18
Actual YoY% %
Revenue 73.5 83.0 -9.4 -11.4% 931 983 -52 -5.3%
BSW 39.8 46.3 -6.4 -13.9% 505 548 -44 -8.0%
LDD 33.7 36.7 -3.0 -8.2% 427 435 -9 -2.0%
Normalized OP 8.5 10.9 -2.4 -22.3% 107 129 -22 -17.0%
BSW 10.2 12.0 -1.8 -14.7% 129 142 -13 -8.9%
LDD -0.1 0.9 -1.0 - -1 10 -12 -
Corp. -1.7 -2.0 0.3 - -21 -23 2 -
BSW LDD
Change in sales volume -14.0% -1.2%
Normalized
OP YoY
Australian
dollars
1Q 18 Actual 142 10
Change in
sales volume-35 -0
Other 22 -11
1Q 19 Actual 129 -1
Impact of Currency BSW (bn yen)
Impact of Currency LDD (bn yen)
Organic
Currency
-6.4
-3.0
-1.8
-1.0
Lion's currency is calculated by accumulating the
average rate for each of the three months.
© Kirin Holdings Company, Limited 16
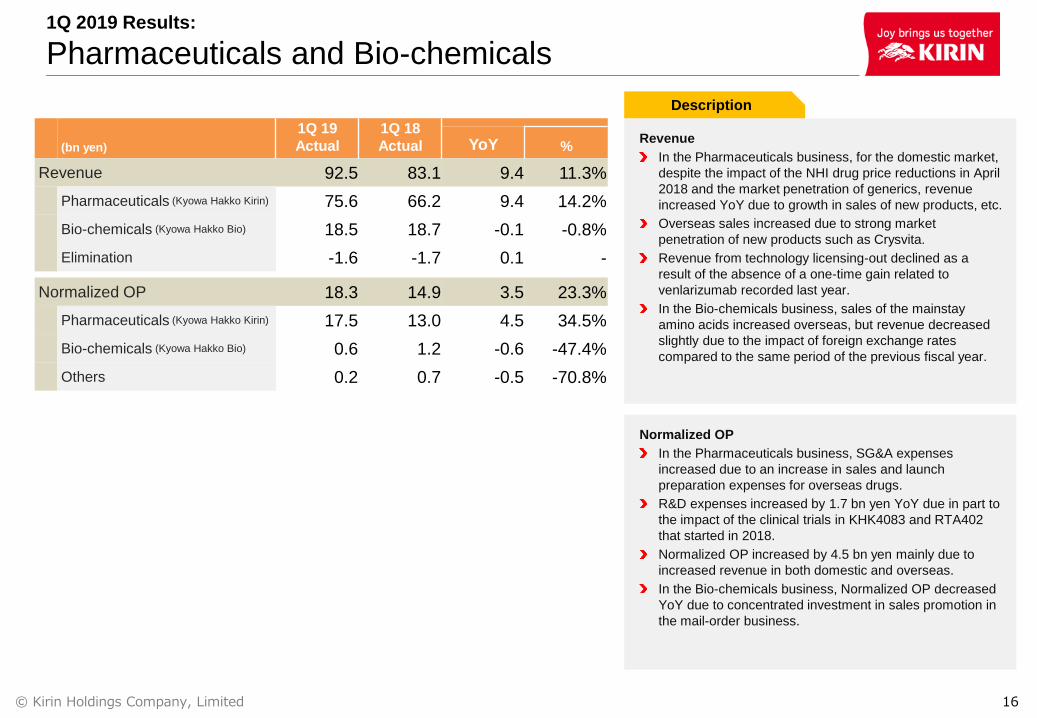
1Q 2019 Results:
Pharmaceuticals and Bio-chemicals
(bn yen)
1Q 19
Actual
1Q 18
Actual YoY %
Revenue 92.5 83.1 9.4 11.3%
Pharmaceuticals (Kyowa Hakko Kirin) 75.6 66.2 9.4 14.2%
Bio-chemicals (Kyowa Hakko Bio) 18.5 18.7 -0.1 -0.8%
Elimination -1.6 -1.7 0.1 -
Normalized OP 18.3 14.9 3.5 23.3%
Pharmaceuticals (Kyowa Hakko Kirin) 17.5 13.0 4.5 34.5%
Bio-chemicals (Kyowa Hakko Bio) 0.6 1.2 -0.6 -47.4%
Others 0.2 0.7 -0.5 -70.8%
Description
Revenue
In the Pharmaceuticals business, for the domestic market,
despite the impact of the NHI drug price reductions in April
2018 and the market penetration of generics, revenue
increased YoY due to growth in sales of new products, etc.
Overseas sales increased due to strong market
penetration of new products such as Crysvita.
Revenue from technology licensing-out declined as a
result of the absence of a one-time gain related to
venlarizumab recorded last year.
In the Bio-chemicals business, sales of the mainstay
amino acids increased overseas, but revenue decreased
slightly due to the impact of foreign exchange rates
compared to the same period of the previous fiscal year.
Normalized OP
In the Pharmaceuticals business, SG&A expenses
increased due to an increase in sales and launch
preparation expenses for overseas drugs.
R&D expenses increased by 1.7 bn yen YoY due in part to
the impact of the clinical trials in KHK4083 and RTA402
that started in 2018.
Normalized OP increased by 4.5 bn yen mainly due to
increased revenue in both domestic and overseas.
In the Bio-chemicals business, Normalized OP decreased
YoY due to concentrated investment in sales promotion in
the mail-order business.
© Kirin Holdings Company, Limited 17
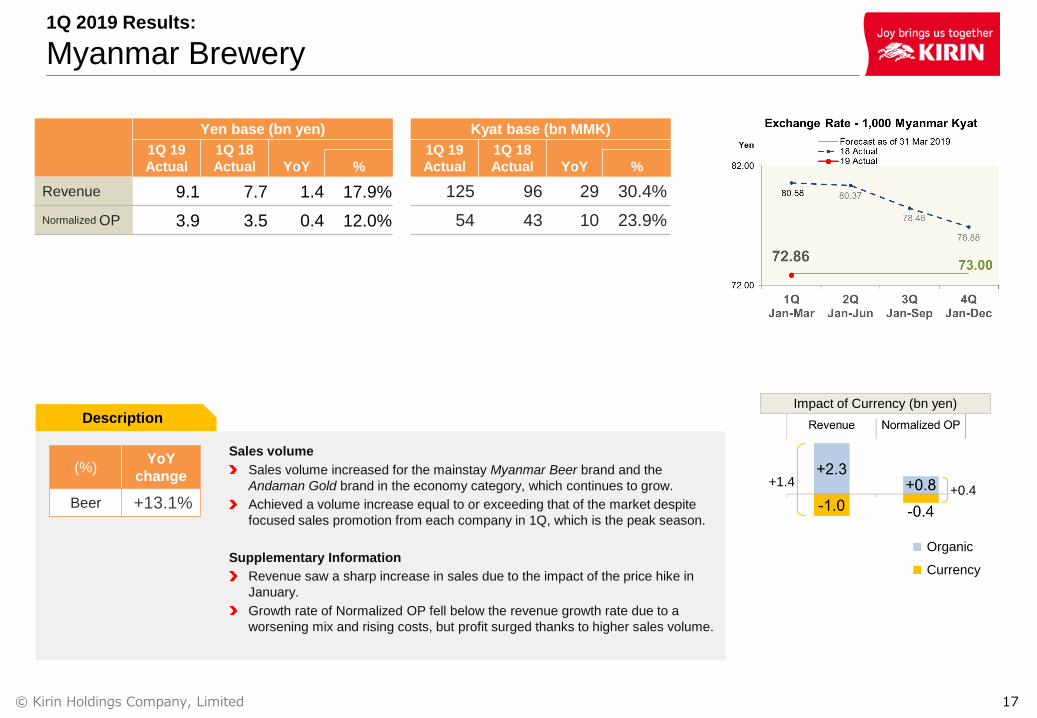
1Q 2019 Results:
Myanmar Brewery
Description
Sales volume
Sales volume increased for the mainstay Myanmar Beer brand and the
Andaman Gold brand in the economy category, which continues to grow.
Achieved a volume increase equal to or exceeding that of the market despite
focused sales promotion from each company in 1Q, which is the peak season.
Supplementary Information
Revenue saw a sharp increase in sales due to the impact of the price hike in
January.
Growth rate of Normalized OP fell below the revenue growth rate due to a
worsening mix and rising costs, but profit surged thanks to higher sales volume.
(%)YoY
change
Beer +13.1%
Yen base (bn yen) Kyat base (bn MMK)
1Q 19
Actual
1Q 18
Actual YoY
1Q 19
Actual
1Q 18
Actual YoY% %
Revenue 9.1 7.7 1.4 17.9% 125 96 29 30.4%
Normalized OP 3.9 3.5 0.4 12.0% 54 43 10 23.9%
Impact of Currency (bn yen)
Organic
Currency
+1.4+0.4
© Kirin Holdings Company, Limited 18
1Q 2019 Results:
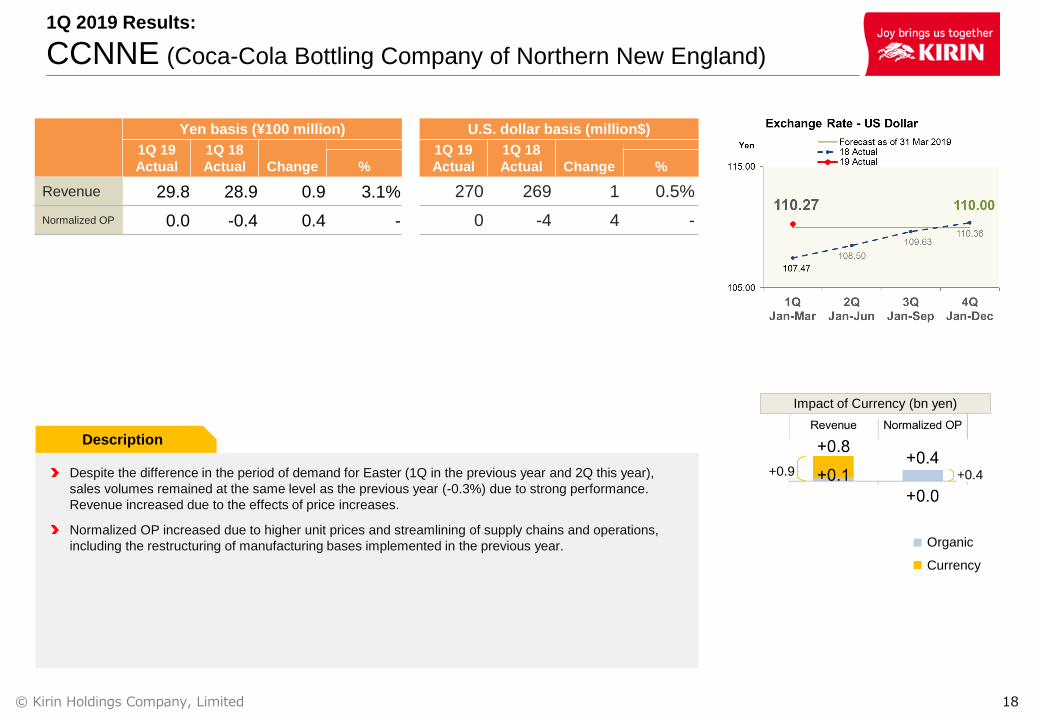
CCNNE (Coca-Cola Bottling Company of Northern New England)
Despite the difference in the period of demand for Easter (1Q in the previous year and 2Q this year),
sales volumes remained at the same level as the previous year (-0.3%) due to strong performance.
Revenue increased due to the effects of price increases.
Normalized OP increased due to higher unit prices and streamlining of supply chains and operations,
including the restructuring of manufacturing bases implemented in the previous year.
Description
Yen basis (¥100 million) U.S. dollar basis (million$)
1Q 19
Actual
1Q 18
Actual Change
1Q 19
Actual
1Q 18
Actual Change% %
Revenue 29.8 28.9 0.9 3.1% 270 269 1 0.5%
Normalized OP 0.0 -0.4 0.4 - 0 -4 4 -
Impact of Currency (bn yen)
Organic
Currency
+0.9 +0.4
© Kirin Holdings Company, Limited 19
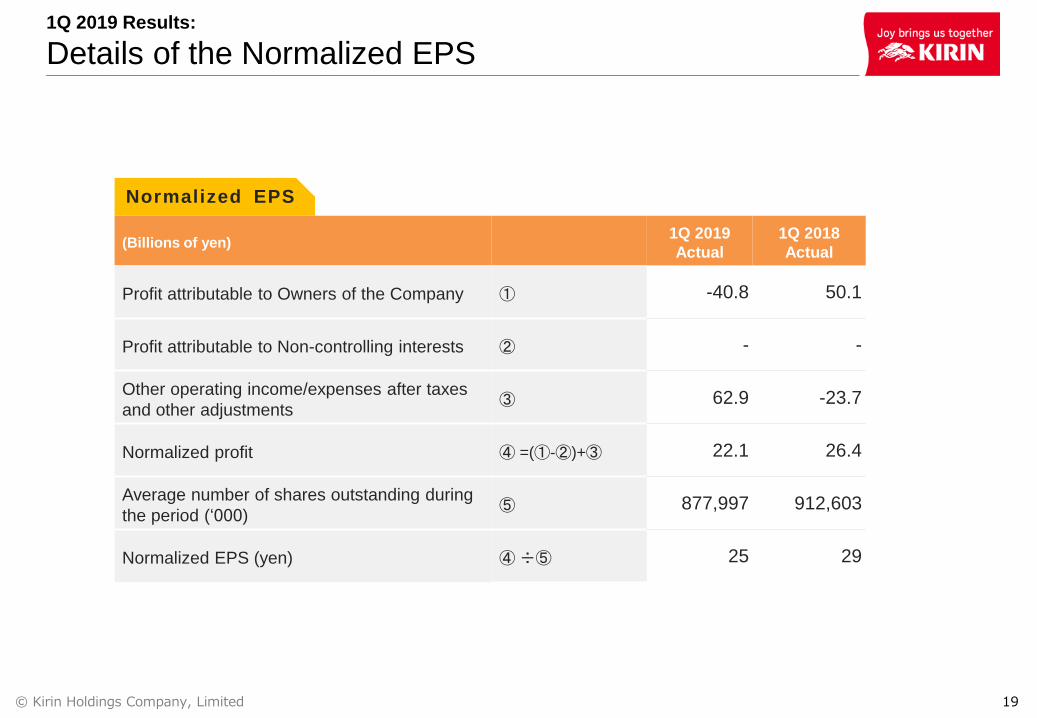
1Q 2019 Results:
Details of the Normalized EPS
(Billions of yen)1Q 2019
Actual
1Q 2018
Actual
Profit attributable to Owners of the Company ① -40.8 50.1
Profit attributable to Non-controlling interests ② - -
Other operating income/expenses after taxes
and other adjustments③ 62.9 -23.7
Normalized profit ④ =(①-②)+③ 22.1 26.4
Average number of shares outstanding during
the period (‘000)⑤ 877,997 912,603
Normalized EPS (yen) ④÷⑤ 25 29
Normalized EPS
This material is intended for informational purposes only and is not a solicitation or offer to buy or sell
securities or related financial instruments.