Embed Size (px)
Citation preview
FY2007 First Half Consolidated Financial Results For the Six Months Ended September 30, 2007English Translation from the Original Japanese-Language Document
November 2, 2007Company Name : Mazda Motor Corporation (Tokyo Stock Exchange/Code No. 7261)URL : http://www.mazda.co.jp Representative Person : Hisakazu Imaki, Representative Director, President and CEO Contact Person : Tetsuya Fujimoto, General Manager, Accounting Department, Phone (082) 282-111Payment of Dividends : Scheduled for starting from November 30, 2007Filing of Hanki Hokokusho, statutory annual business and financial report : Scheduled for December 14, 2007
(In Japanese yen rounded to millions, except amounts per share)1. Consolidated Financial Highlights (April 1, 2007 through September 30, 2007) (1) Consolidated Financial Results
Sales Operating Income Ordinary Income Net Income
million yen % million yen % million yen % million yen % FY2007 1st. Half FY2006 1st. Half FY2006 Note: Changes in sales, operating income, ordinary income, and net income from the previous period are shown in percentage.
Net Income Net IncomePer Share Per Share (Diluted)
yen yen FY2007 1st. Half FY2006 1st. Half FY2006 Notes: Equity in net income of unconsolidated subsidiaries and affiliated companies FY2007 1st. Half million yen
FY2006 1st. Half million yenFY2006 million yen
(2) Consolidated Financial PositionEquity
Per Sharemillion yen million yen % yen
FY2007 1st. Half FY2006 1st. Half FY2006 Note: The amounts of equity used for the calculation of equity ratio and equity FY2007 1st. Half million yen per share exclude minority interests in consolidated subsidiaries and FY2006 1st. Half million yen stock acquisition rights FY2006 million yen
(3) Consolidated Cash FlowsCash Flows from Cash Flows from Cash Flows from Ending Cash &
Operating Activities Investing Activities Financing Activities Cash Equivalentsmillion yen million yen million yen million yen
FY2007 1st. Half FY2006 1st. Half FY20062. Dividends
Dividends per ShareInterim Year-end Full-Year
yen yen yen FY2006 - 6.00 6.00 FY2007 3.00 FY2007 (Forecast) 3.00 6.00
3. FY2007 Consolidated Financial Forecast (April 1, 2007 through March 31, 2008)Net Incomeper Share
million yen % million yen % million yen % million yen % yen Full Year Note: Changes in sales, operating income, ordinary income, and net income from the previous period are shown in percentage.
Sales
3,320,000
Ordinary Income
29,89840,330 (48,783)
(38,135)116,358 (95,363) 9,346
2.2
1,907,752 479,882499,626414,991473,403
242,505
222,860
15.3 60.32160,000
Net IncomeOperating Income
0.9
162,465
336.45
127,753 - 73,744
23.4 296.22
6,151
24.8
-
25.8 354.57
3,812
3,247,485 - 158,532 -
(13,477)(38,520)
9.6140,000 85,000
1,656,2241,521,448 12.5
8.9 73,079 4.869,757 43.0
57,595 1.856,592 30.5
29,053 6.827,213 (12.5)
1,935,1351,771,625
501,382424,920
Total Assets Equity Equity Ratio
20.6419.43
20.5819.25
52.593,576
52.19
- 1 -
4. Other
(1) Changes in Consolidation scope: None
(2) Accounting Changes and Adoption of New Accounting Standards:
1) Adoption of new or revised accounting standards Yes 2) Other Yes Note: See Accounting Changes and Adoption of New Accounting Standards in the notes to the consolidated financial statements on page 16.
(3) Common Stock
1) Shares issued (including treasury stock) FY2007 1st. Half sharesFY2006 1st. Half sharesFY2006 shares
2) Treasury shares FY2007 1st. Half sharesFY2006 1st. Half sharesFY2006 shares
Note: For the number of shares of common stock used for the calculation of net income per share (consolidated), refer to the Information on Amounts Per Share of Common Stock on page 21.
(Reference)
1. Unconsolidated Financial Highlights (April 1, 2007 through September 30, 2007) (1) Unconsolidated Financial Results
Sales Operating Income Ordinary Income Net Income
million yen % million yen % million yen % million yen % FY2007 1st. Half FY2006 1st. Half FY2006 Note: Changes in sales, operating income, ordinary income, and net income from the previous period are shown in percentage.
Net Incomeper Share
yen FY2007 1st. Half FY2006 1st. Half FY2006
(2) Unconsolidated Financial PositionEquity
Per Sharemillion yen million yen % yen
FY2007 1st. Half FY2006 1st. Half FY2006 Note: The amounts of equity used for the calculation of equity ratio and equity FY2007 1st. Half million yen per share exclude stock acquisition rights. FY2006 1st. Half million yen FY2006 million yen
2. FY2007 Unconsolidated Financial Forecast (April 1, 2007 through March 31, 2008)
Net Incomeper Share
million yen % million yen % million yen % million yen % yen Full Year Note: Changes in sales, operating income, ordinary income, and net income from the previous period are shown in percentage.
The financial projection is the judgment of our management based on the information presently available. By nature, such financial projectionis subject to uncertainty and a risk. Therefore, we advise against making an investment decision by solely relying on this projection. Variables that could affect the actual financial results include, but are not limited to, economic environments related to our business areas and fluctuations in yen-to-dollar and other exchange rates. For further information on the above financial projection, please refer to page 4.
1,414,878,813
32,688
19.49
9,424,1538,257,879
16.14
1,139,897 3.3173.0
(9.2)
Total Assets Equity
1,103,019 16.9 43,13739,151
1,418,509,3991,409,195,844
2,390,000 106,000 98,000 58,000 41.16
1,523,358 520,472 34.2
34.01,377,580 482,107 35.0 344.12
Net Income
362.17520,344482,097509,596
106.384,464 - 2,327,073 - 88,803 - 51,062 - 41,271
22,721 (16.8)
7,845,934
(20.8)
2.7 19.4 16.0 13.6
230.7 27,296
369.27
Sales Operating Income Ordinary Income
Equity Ratio
36.41
1,496,657 509,663
- 2 -
- 3 -
1. Financial Results The economic environment surrounding Mazda, its consolidated subsidiaries, and equity method companies
(hereinafter referred to collectively as the Mazda Group) during this first half has been showed continued gradual expansion in Japan by export growth and increased capital investment, in addition to greater private-sector demand as demonstrated by a steady shift in consumer spending and other factors. On the other hand, as a result of increasing product commodity markets, the rise of commodity prices has continued, with crude oil prices recording all-time highs. In the global economy, the sub-prime loan issue in the United States has led to concerns of a credit squeeze, and there is ongoing tension in money markets around the world with risks of an economic slide still increasing.
Despite these circumstances, the Mazda Group has achieved a smooth start for the Mazda Advancement Plan, our four-year mid-term plan. The Group launched in the Japanese and Europe market the new Mazda2 (Demio in Japan), a new, globally-competitive product for the first half. R&D is moving ahead with the development of attractive products for customers to be launched in the future, while we also continued to address the enhancement of environment and safety technology development, based on our Sustainable Zoom-Zoom statement, which is our long-term technology development vision aiming for the realization of a sustainable car-based society. This year marks the 40th anniversary of the sale of the first rotary engine vehicle, and in August, we delivered the world-first hydrogen rotary engine vehicle, the Mazda RX-8 Hydrogen RE, to the Ministry of Economy, Trade and Industry (METI). To date, this vehicle has been leased to governmental bodies and private enterprises. In September of this year, we worked jointly with Teijin Limited and Teijin Fibers Limited to develop a biofabric for vehicle interiors made from 100% plant-derived fiber. In addition, we developed a world’s first catalyst for cars that uses single-nanotechnology (technology to control material structures at sizes smaller than conventional nano technology) to create a catalyst material structure which substantially reduces the amount of precious metals that are used, such as platinum and palladium. From this fall, Mazda will be participating in the public road proving tests using ITS (Intelligent Transportation System) that will be run jointly by industry, academia and the government in the Hiroshima region, aiming to enhance support for safe driving.
In the production area, the Niigata Prefecture Chuetsu-Oki Earthquake that hit in July resulted in the suspension of procurement of some parts and the subsequent suspension of plant operations. However, we achieved recovery of the production delay due to the suspension. We are currently working on the reinforcement of production capacity at our main Japanese plants in Hiroshima and Hofu, and will be increasing the combined capacity of the two plants by 11% during this fiscal year, to reach an annual production output of 996,000 units. Additionally we commenced mass production during April in Nanjing, China, at our engine manufacturing operation established jointly by Changan Automotive Group, Ford Motor Company and Mazda Motor Corporation. Mass production of the Mazda2 (known in Japan as the Demio) started at the vehicle assembly plant established by the same joint venture partners in October. In addition, Mazda and Ford Motor Company plan to build a new passenger car plant at AutoAlliance Thailand (AAT) -- their joint venture manufacturing plant -- to produce both companies’ B-car segment small passenger cars. The car production will commence at the new plant in 2009. In the sales area, we established a sales company in April to cover the Belgium and Luxemburg markets, and also plan
to establish a national sales company in Poland. Through our proactive establishment of national sales companies in markets throughout Europe over the past five years, our sales in the region have doubled. We now have nineteen sales companies covering twenty countries, and these account for approximately 90% of our total sales volume in Europe.
(1) Analysis of Financial Results
(Financial Results for the first half) As for the retail volume of key markets during this period, retail volume in Japan was 123,000 units, down by
5.8 percent year over year, due to the influence of the decline of the total industry demand for registered vehicles despite the fact that the introduction of all-new Mazda Demio (Mazda2) was successful. The retail volume in the U.S. was 213,000 units, up 7.1 percent from same period of the previous year. Not only the
- 4 -
enduring popularity of Mazda3 (Axela in Japan) but also the strong sales of the newly introduced CX-9 contributed. The retail volume in Europe was almost flat year on year at 153,000 units. In China, the retail volume fell to 41,000 units, down 32.6 percent from the same period of the prior year due to the impact of terminating production of 323 (the former Familia) and Premacy (the previous model), which had been sold as a Mazda brand vehicle. In other markets, also led by Mazda3 and CX-7, the retail volume increased by 17.9 percent to 129,000 units. As a result of these varying performances by market, the global retail volume was 659,000 units, up 0.9% from the same period of the prior fiscal year.
Consolidated sales revenue for the first half increased by ¥134.8 billion or 8.9 percent year-on-year to
¥1,656.2 billion. In spite of the increases in development cost and depreciation expense of fixed assets, operating profit increased by ¥3.3 billion or 4.8 percent year over year to ¥73.1 billion with the yen’s depreciation and cost reduction efforts that exceeded raw material price hikes. Ordinary profit was increased by ¥1.0 billion or 1.8 percent year-on-year to ¥57.6 billion. Net income of the half-year period was ¥29.1 billion, up ¥1.9 billion or 6.8 percent from a year earlier. (Financial Projection for the full year)
Our global retail volume for this fiscal year is projected to be 1,360,000 units, up by 4.5 percent year over year. Looking at retail volume projection by market, the volume in Japan is projected to be down year over year at 252,000 units (down 3.3 percent) due to the influence of the decline of the total industry demand. The volume in North America is projected to increase to 407,000 units (an increase of 7.1 percent) due to the full-year contribution of new models introduced in the previous year. The volume in Europe is projected to increase 5.6 percent to 321,000 units. The retail volume in China is projected at 105,000 units, down 18.7 percent. The volume in other markets is projected at 275,000 units (up 20.7 percent). The exchange rate assumption is ¥115 to the US dollar, and ¥159 to the Euro.
As for consolidated financial performance of this fiscal year, sales revenue is projected at ¥3,320.0 billion, up 2.2 percent, while operating profit is projected to increase 0.9 percent to ¥160.0 billion due to the volume and mix improvements, the impact of yen’s depreciation and cost reduction efforts that exceeded raw material price hikes partially offset by increases in development cost and depreciation expense of fixed assets. The operating ROS is projected to be almost flat year on year at 4.8 percent. Consolidated ordinary profit is expected to be ¥140.0 billion, up 9.6 percent, and net income is projected to be ¥85.0 billion, up 15.3 percent. Research and development costs are projected to be ¥120.0 billion.
The forecast for the year ending March 31, 2008 remains unchanged from the prior forecast that was released on April 27, 2007.
Consolidated Financial Forecast (from April 1, 2007 to March 31, 2008) Sales revenue 3,320.0 billion yen (up 2.2% compared to the prior year) Operating profit 160.0 billion yen (up 0.9% compared to the prior year) Ordinary profit 140.0 billion yen (up 9.6% compared to the prior year) Net income 85.0 billion yen (up 15.3% compared to the prior year) Unconsolidated Financial Forecast (from April 1, 2007 to March 31, 2008) Sales Revenue 2,390.0 billion yen (up 2.7% compared to the prior year) Operating profit 106.0 billion yen (up 19.4% compared to the prior year) Ordinary profit 98.0 billion yen (up 16.0% compared to the prior year) Net income 58.0 billion yen (up 13.6% compared to the prior year)
- 5 -
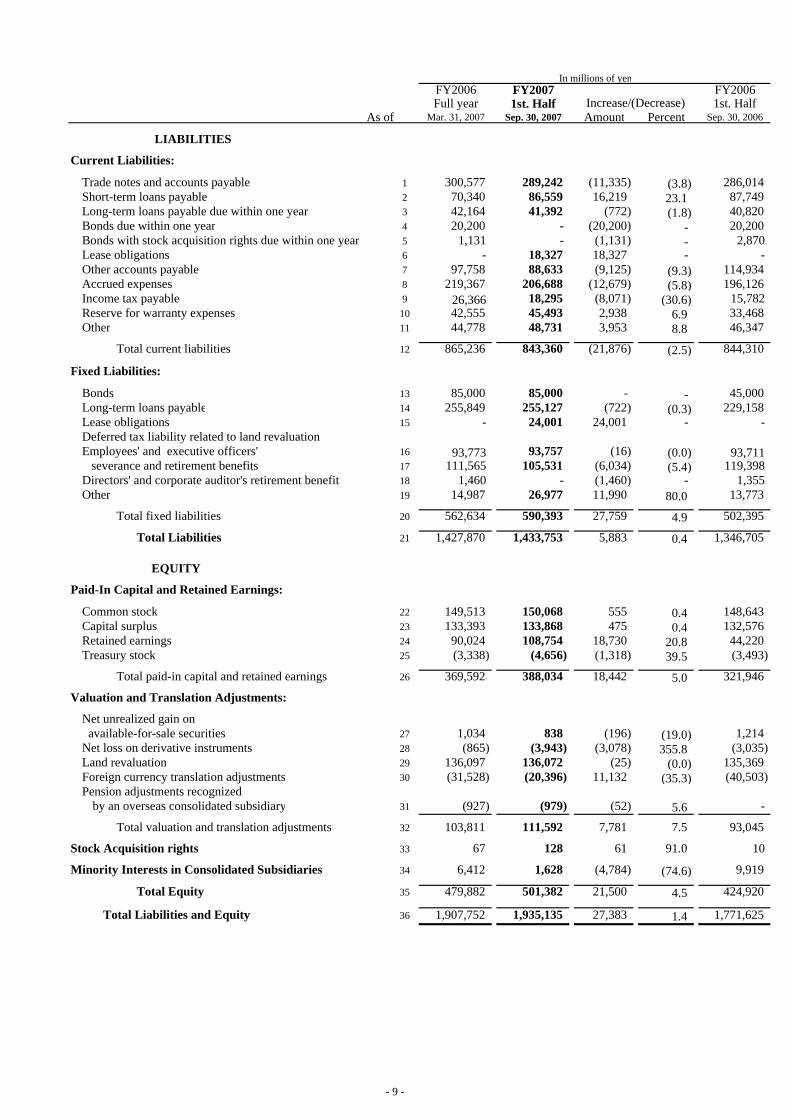
(2) Analysis on the Financial Position
(Analysis on Assets, Liabilities, Equity and Cash Flows) The company and its consolidated domestic subsidiaries early adopted the revised accounting standard for leases and therefore presented leased property and lease obligations on-balance from for the six months ended September 30, 2007, as discussed in “Accounting Changes and Adoption of New Accounting Standards” on page 16. Total assets as of the end of the first half were ¥1,935.1 billion, ¥27.3 billion more than at the end of previous fiscal year due to the recognition of leased property and other. Total financial debt at the end of the first half was ¥510.4 billion, ¥35.7 billion more than at the end of previous fiscal year due to the recognition of lease obligations and other. Total liabilities amounted to ¥1433.8 billion, up ¥5.9 billion from the end of previous fiscal year. Total equity amounted to ¥501.4 billion, up ¥21.5 billion from the end of previous fiscal year. Equity ratio became 25.8%, up 1.0 percentage points from the end of previous fiscal year. Net cash provided by the operating activities was ¥40.3 billion, primarily due to income before income taxes of ¥54.3 billion, depreciation expense of ¥32.7 billion, and income tax payments. Net cash used in investing activities amounted to ¥48.8 billion, mainly reflecting ¥39.8 billion capital investments in facilities and equipment. As a result, consolidated cash flow (operating and investing activities) was negative ¥8.5 billion. Net cash used in financing activities amounted to ¥13.5 billion, mainly reflecting repayment of loans and redemption of bond.
(Trends of cash flow data)
As of /Year
Ended
March 31, 2006
As of /Six Months
Ended
September 30, 2006
As of /Year
Ended
March 31, 2007
As of/Six Months
Ended
September 30, 2007
Equity Ratio 22.3% 23.4% 24.8% 25.8% Fair Value Equity Ratio 56.0% 56.6% 48.1% 42.3% Cash-Flow-To-Total-Debt Ratio 4.0 14.2 4.1 12.7 Interest Coverage Ratio 10.1 3.8 7.1 4.4
Equity Ratio: Equity/Total Assets Fair Value Equity Ratio: Gross Market Capitalization/Total Assets Cash Flow to Total Debt: Total Debt/Cash Flow Interest Coverage Ratio: Operating Cash Flow/Interest Payments 1) All indicators are calculated on the basis of consolidated financial values. 2) Gross Market Capitalization is based on the total number of shares issued excluding treasury stock. 3) Cash Flow means the cash flow provided by operating activities. 4) Total Debt includes all debts that interests are paid on among debts booked in consolidated balance sheet.
(3) Our Basic Policy on Distribution of Earnings and Dividends for This Fiscal Year
Our policy on distribution of earnings is to declare dividends by carefully considering each fiscal year’s financial results and business environment. Our policy on earnings retained in the company is to utilize the financial resources to enhance our business competitiveness, e.g. capital investment in facilities and equipment and investments in research and development. Our intent is to provide our stockholders with dividends on a stable basis. By the meeting of the board of directors held on November 2, 2007, we resolved to declare an interim dividend for ¥3 per share based upon September 30, 2007 record. We plan to declare a year-end dividend of ¥3 per share. Therefore, we plan to declare an annual dividend of ¥6 per share.
- 6 -
(4) Risks
Since there is no material change in risk information from Yuka Shoken Hokokusyo, the statutory annual business and financial report, for the year ended in March 2007 (disclosed on June 27, 2007), we omit the disclosure of the information at this time. For further information, please access the English-language annual report for the year ended March 31, 2007 that was prepared based on the Yuka Shoken Hokokusyo (which is available only in Japanese) for the same year from the website shown below.
(Mazda Website)
http://www.mazda.com/investors/annual/2007/
2. Mazda Group of Companies Since there is no material change in the information on Mazda group of companies from the Yuka Shoken Hokokusyo for the year ended in March 2007 (disclosed on June 27, 2007), we omit the disclosure of the information at this time. For further information, please access the following website for the same information on Mazda Group of Companies in English that was included in FY2006 Consolidated Financial Results for the year ended March 31, 2007 (disclosed on April 27, 2007). (Mazda Website) http://www.mazda.com/investors/result/2006/
3. Management Policy (1) Our Corporate Vision, Mission and Values (2) Business Targets and Long- and Mid-Term Corporate Business Strategy
Since there is no material change in the information on management policy from the FY2006 Consolidated Financial Results for the year ended March 31, 2007 (disclosed on April 27, 2007), we omit the disclosure of information at this time. For further information, please access the FY2006 Consolidated Financial Results from the website shown below.
(Mazda Website) http://www.mazda.com/investors/result/2006/
4. Consolidated Financial Statements
(1) Consolidated Statement of Income Six months ended September 30, 2007 With comparative figures for the six months ended September 30, 2006 and the fiscal year ended March 31, 2007
FY2006 FY2007 FY20061st. Half 1st. Half Full Year
For the periods ended Sep. 30, 2006 Sep. 30, 2007 Amount Percent Mar. 31, 2007
Net sales 1 1,521,448 1,656,224 134,776 8.9 3,247,485
Costs of sales 2 1,095,731 1,175,040 79,309 7.2 2,322,644
Gross profit on sales 3 425,717 481,184 55,467 13.0 924,841
Selling, general and administrative expenses 4 355,960 408,105 52,145 14.6 766,309
Operating income 5 69,757 73,079 3,322 4.8 158,532
Non-operating income
Interest and dividend income 6 1,400 2,117 717 51.2 2,877Equity in net income of unconsolidated subsidiaries and affiliates 7 3,812 3,576 (236) (6.2) 6,151Other 8 2,888 2,888 0 0.0 5,575
Total 9 8,100 8,581 481 5.9 14,603
Non-operating expenses
Interest expense 10 7,576 9,211 1,635 21.6 16,254Foreign exchange loss 11 8,695 11,632 2,937 33.8 19,914Other 12 4,994 3,222 (1,772) (35.5) 9,214
Total 13 21,265 24,065 2,800 13.2 45,382
Ordinary income 14 56,592 57,595 1,003 1.8 127,753
Extraordinary profits
Profit on sale of fixed assets 15 1,074 129 (945) (88.0) 1,361Profit on sale of investment securities 16 11 27 16 145.5 43Compensation for the exercise of eminent domain 17 - 82 82 - - Other 18 - - - - 44
Total 19 1,085 238 (847) (78.1) 1,448
Extraordinary losses
Loss on retirement and sale of fixed assets 20 2,620 2,191 (429) (16.4) 4,741Loss on impairment of fixed assets 21 2,164 229 (1,935) (89.4) 3,356 Loss on sale of investment securities 22 32 - (32) - 59Inventory valuation loss related to car-carrying vessel accident 23 - - - - 1,979Adoption of revised accounting standard for leases 24 - 1,144 1,144 - - Other 25 482 2 (480) (99.6) 616
Total 26 5,298 3,566 (1,732) (32.7) 10,751
Income before income taxes 27 52,379 54,267 1,888 3.6 118,450
Income taxes
Current 28 17,051 19,429 2,378 13.9 36,776Prior year 29 - - - - 3,229Deferred 30 7,053 5,189 (1,864) (26.4) 2,973
Minority interests of consolidated subsidiaries 31 1,062 596 (466) (43.9) 1,728
Net income 32 27,213 29,053 1,840 6.8 73,744
In millions of yen
Increase/(Decrease)
- 7 -
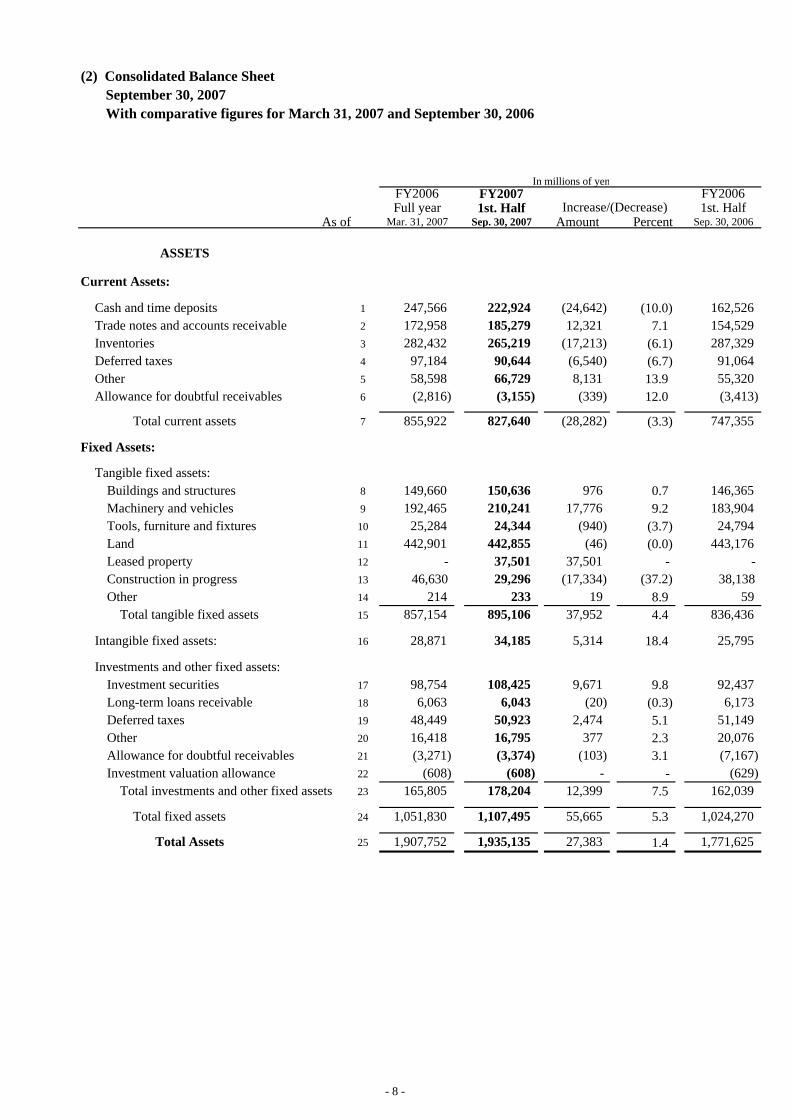
(2) Consolidated Balance Sheet September 30, 2007 With comparative figures for March 31, 2007 and September 30, 2006
FY2006 FY2007 FY2006Full year 1st. Half 1st. Half
As of Mar. 31, 2007 Sep. 30, 2007 Amount Percent Sep. 30, 2006
ASSETS
Current Assets:
Cash and time deposits 1 247,566 222,924 (24,642) (10.0) 162,526Trade notes and accounts receivable 2 172,958 185,279 12,321 7.1 154,529Inventories 3 282,432 265,219 (17,213) (6.1) 287,329Deferred taxes 4 97,184 90,644 (6,540) (6.7) 91,064Other 5 58,598 66,729 8,131 13.9 55,320Allowance for doubtful receivables 6 (2,816) (3,155) (339) 12.0 (3,413)
Total current assets 7 855,922 827,640 (28,282) (3.3) 747,355
Fixed Assets:
Tangible fixed assets:Buildings and structures 8 149,660 150,636 976 0.7 146,365Machinery and vehicles 9 192,465 210,241 17,776 9.2 183,904Tools, furniture and fixtures 10 25,284 24,344 (940) (3.7) 24,794Land 11 442,901 442,855 (46) (0.0) 443,176Leased property 12 - 37,501 37,501 - - Construction in progress 13 46,630 29,296 (17,334) (37.2) 38,138 Other 14 214 233 19 8.9 59
Total tangible fixed assets 15 857,154 895,106 37,952 4.4 836,436
Intangible fixed assets: 16 28,871 34,185 5,314 18.4 25,795
Investments and other fixed assets:Investment securities 17 98,754 108,425 9,671 9.8 92,437Long-term loans receivable 18 6,063 6,043 (20) (0.3) 6,173Deferred taxes 19 48,449 50,923 2,474 5.1 51,149Other 20 16,418 16,795 377 2.3 20,076Allowance for doubtful receivables 21 (3,271) (3,374) (103) 3.1 (7,167)Investment valuation allowance 22 (608) (608) - - (629)
Total investments and other fixed assets 23 165,805 178,204 12,399 7.5 162,039
Total fixed assets 24 1,051,830 1,107,495 55,665 5.3 1,024,270
Total Assets 25 1,907,752 1,935,135 27,383 1.4 1,771,625
In millions of yen
Increase/(Decrease)
- 8 -
FY2006 FY2007 FY2006Full year 1st. Half 1st. Half
As of Mar. 31, 2007 Sep. 30, 2007 Amount Percent Sep. 30, 2006
LIABILITIES
Current Liabilities:
Trade notes and accounts payable 1 300,577 289,242 (11,335) (3.8) 286,014Short-term loans payable 2 70,340 86,559 16,219 23.1 87,749Long-term loans payable due within one year 3 42,164 41,392 (772) (1.8) 40,820Bonds due within one year 4 20,200 - (20,200) - 20,200Bonds with stock acquisition rights due within one year 5 1,131 - (1,131) - 2,870 Lease obligations 6 - 18,327 18,327 - - Other accounts payable 7 97,758 88,633 (9,125) (9.3) 114,934Accrued expenses 8 219,367 206,688 (12,679) (5.8) 196,126Income tax payable 9 26,366 18,295 (8,071) (30.6) 15,782 Reserve for warranty expenses 10 42,555 45,493 2,938 6.9 33,468Other 11 44,778 48,731 3,953 8.8 46,347
Total current liabilities 12 865,236 843,360 (21,876) (2.5) 844,310
Fixed Liabilities:
Bonds 13 85,000 85,000 - - 45,000Long-term loans payable 14 255,849 255,127 (722) (0.3) 229,158Lease obligations 15 - 24,001 24,001 - - Deferred tax liability related to land revaluationEmployees' and executive officers' 16 93,773 93,757 (16) (0.0) 93,711 severance and retirement benefits 17 111,565 105,531 (6,034) (5.4) 119,398 Directors' and corporate auditor's retirement benefit 18 1,460 - (1,460) - 1,355 Other 19 14,987 26,977 11,990 80.0 13,773
Total fixed liabilities 20 562,634 590,393 27,759 4.9 502,395
Total Liabilities 21 1,427,870 1,433,753 5,883 0.4 1,346,705
EQUITY
Paid-In Capital and Retained Earnings:
Common stock 22 149,513 150,068 555 0.4 148,643Capital surplus 23 133,393 133,868 475 0.4 132,576Retained earnings 24 90,024 108,754 18,730 20.8 44,220Treasury stock 25 (3,338) (4,656) (1,318) 39.5 (3,493)
Total paid-in capital and retained earnings 26 369,592 388,034 18,442 5.0 321,946
Valuation and Translation Adjustments:
Net unrealized gain on available-for-sale securities 27 1,034 838 (196) (19.0) 1,214Net loss on derivative instruments 28 (865) (3,943) (3,078) 355.8 (3,035)Land revaluation 29 136,097 136,072 (25) (0.0) 135,369Foreign currency translation adjustments 30 (31,528) (20,396) 11,132 (35.3) (40,503)Pension adjustments recognized
by an overseas consolidated subsidiary 31 (927) (979) (52) 5.6 -
Total valuation and translation adjustments 32 103,811 111,592 7,781 7.5 93,045
Stock Acquisition rights 33 67 128 61 91.0 10
Minority Interests in Consolidated Subsidiaries 34 6,412 1,628 (4,784) (74.6) 9,919
Total Equity 35 479,882 501,382 21,500 4.5 424,920
Total Liabilities and Equity 36 1,907,752 1,935,135 27,383 1.4 1,771,625
In millions of yen
Increase/(Decrease)
- 9 -
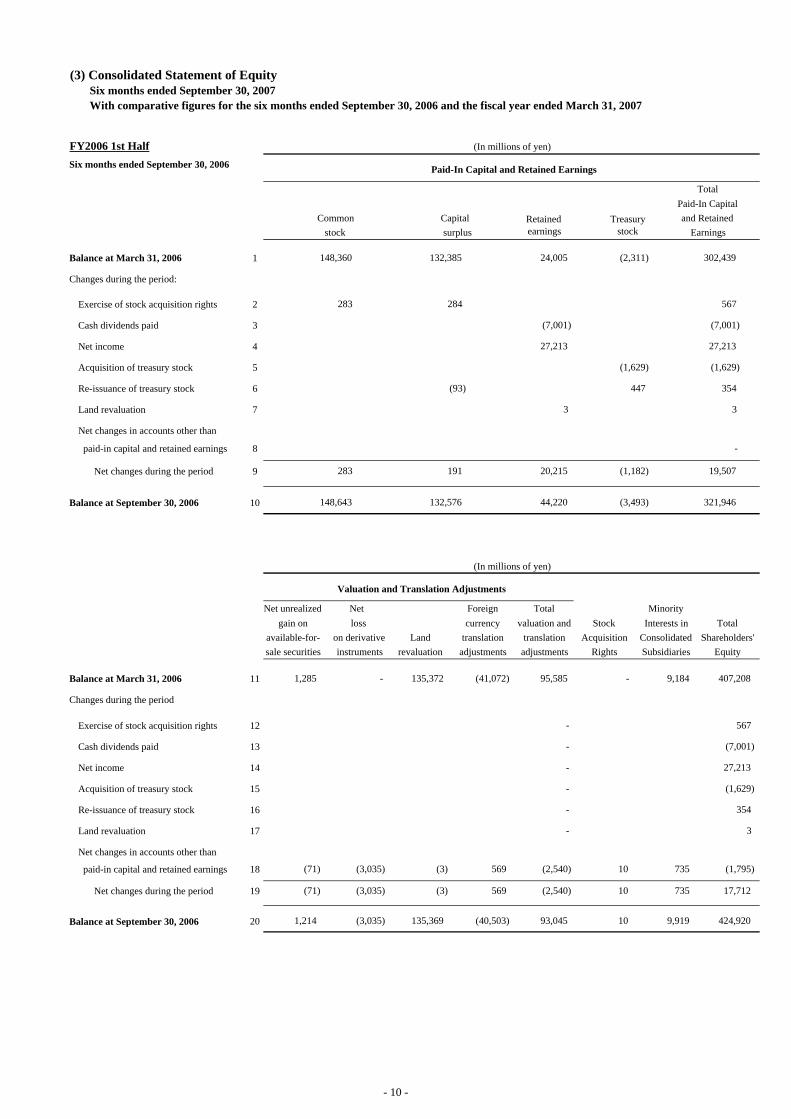
(3) Consolidated Statement of Equity Six months ended September 30, 2007 With comparative figures for the six months ended September 30, 2006 and the fiscal year ended March 31, 2007
FY2006 1st Half (In millions of yen)
Six months ended September 30, 2006
Total Paid-In Capital
Common Capital and Retained stock surplus Earnings
Balance at March 31, 2006 1
Changes during the period:
Exercise of stock acquisition rights 2
Cash dividends paid 3
Net income 4
Acquisition of treasury stock 5
Re-issuance of treasury stock 6
Land revaluation 7
Net changes in accounts other than
paid-in capital and retained earnings 8
Net changes during the period 9
Balance at September 30, 2006 10
(In millions of yen)
Net unrealized Net Foreign Total Minoritygain on loss currency valuation and Stock Interests in Total
available-for- on derivative Land translation translation Acquisition Consolidated Shareholders'sale securities instruments revaluation adjustments adjustments Rights Subsidiaries Equity
Balance at March 31, 2006 11
Changes during the period
Exercise of stock acquisition rights 12
Cash dividends paid 13
Net income 14
Acquisition of treasury stock 15
Re-issuance of treasury stock 16
Land revaluation 17
Net changes in accounts other than
paid-in capital and retained earnings 18
Net changes during the period 19
Balance at September 30, 2006 20
95,585
569
569
-
(40,503)
191
132,576
135,372
148,360
283
-
148,643
283
(3,035)
(41,072)1,285
(71)
1,214
(3)
(3)
135,369
(3,035)
(3,035)
(71)
-
-
(2,540)
-
-
(2,540)
93,045
-
10
10
10 9,919
407,208
567
(7,001)
(1,795)
17,712
424,920
354
3
735
735
Paid-In Capital and Retained Earnings
Valuation and Translation Adjustments
27,213
(1,629)
9,184
-
302,439
284 567
132,385
(7,001)
27,213
(7,001)
(1,629)
(93) 354
321,946
3
-
19,507
44,220
(1,182)
(3,493)
24,005
Retainedearnings
Treasurystock
(2,311)
27,213
3
(1,629)
447
20,215
- 10 -
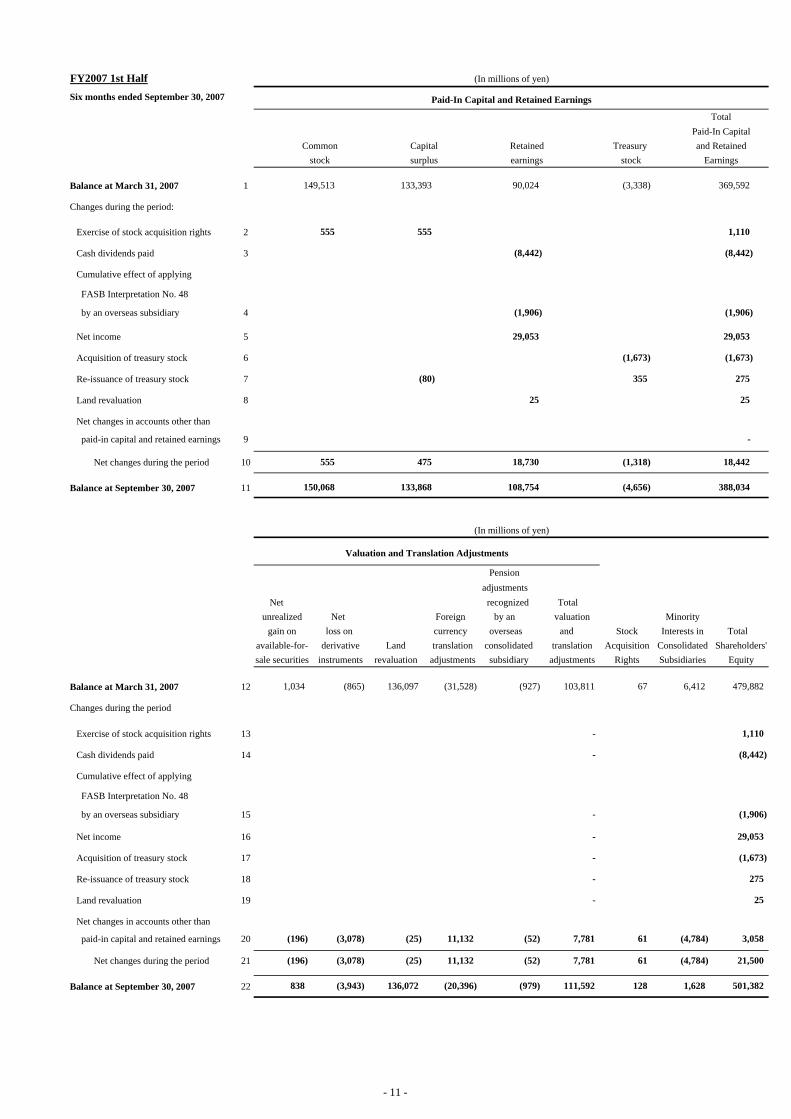
FY2007 1st Half (In millions of yen)
Six months ended September 30, 2007
Total Paid-In Capital
Common Capital Retained Treasury and Retained stock surplus earnings stock Earnings
Balance at March 31, 2007 1
Changes during the period:
Exercise of stock acquisition rights 2
Cash dividends paid 3
Cumulative effect of applying
FASB Interpretation No. 48
by an overseas subsidiary 4
Net income 5
Acquisition of treasury stock 6
Re-issuance of treasury stock 7
Land revaluation 8
Net changes in accounts other than
paid-in capital and retained earnings 9
Net changes during the period 10
Balance at September 30, 2007 11
(In millions of yen)
Pension adjustments
Net recognized Totalunrealized Net Foreign by an valuation Minority
gain on loss on currency overseas and Stock Interests in Total available-for- derivative Land translation consolidated translation Acquisition Consolidated Shareholders'
sale securities instruments revaluation adjustments subsidiary adjustments Rights Subsidiaries Equity
Balance at March 31, 2007 12
Changes during the period
Exercise of stock acquisition rights 13
Cash dividends paid 14
Cumulative effect of applying
FASB Interpretation No. 48
by an overseas subsidiary 15
Net income 16
Acquisition of treasury stock 17
Re-issuance of treasury stock 18
Land revaluation 19
Net changes in accounts other than
paid-in capital and retained earnings 20
Net changes during the period 21
Balance at September 30, 2007 22 501,382(979) 111,592 128 1,628838 (3,943) 136,072 (20,396)
3,058
(196) (3,078) (25) 11,132 (52) 7,781 61 (4,784) 21,500
(52) 7,781 61 (4,784)(196) (3,078) (25) 11,132
275
- 25
-
29,053
- (1,673)
- (1,906)
-
1,110
- (8,442)
-
67 6,412 479,882
Valuation and Translation Adjustments
1,034 (865) 136,097 (31,528) (927) 103,811
18,442
150,068 133,868 108,754 (4,656) 388,034
555 475 18,730 (1,318)
25
-
25
(1,673)
(80) 355 275
(1,673)
(1,906) (1,906)
29,053 29,053
1,110
(8,442) (8,442)
555 555
Paid-In Capital and Retained Earnings
149,513 133,393 90,024 (3,338) 369,592
- 11 -
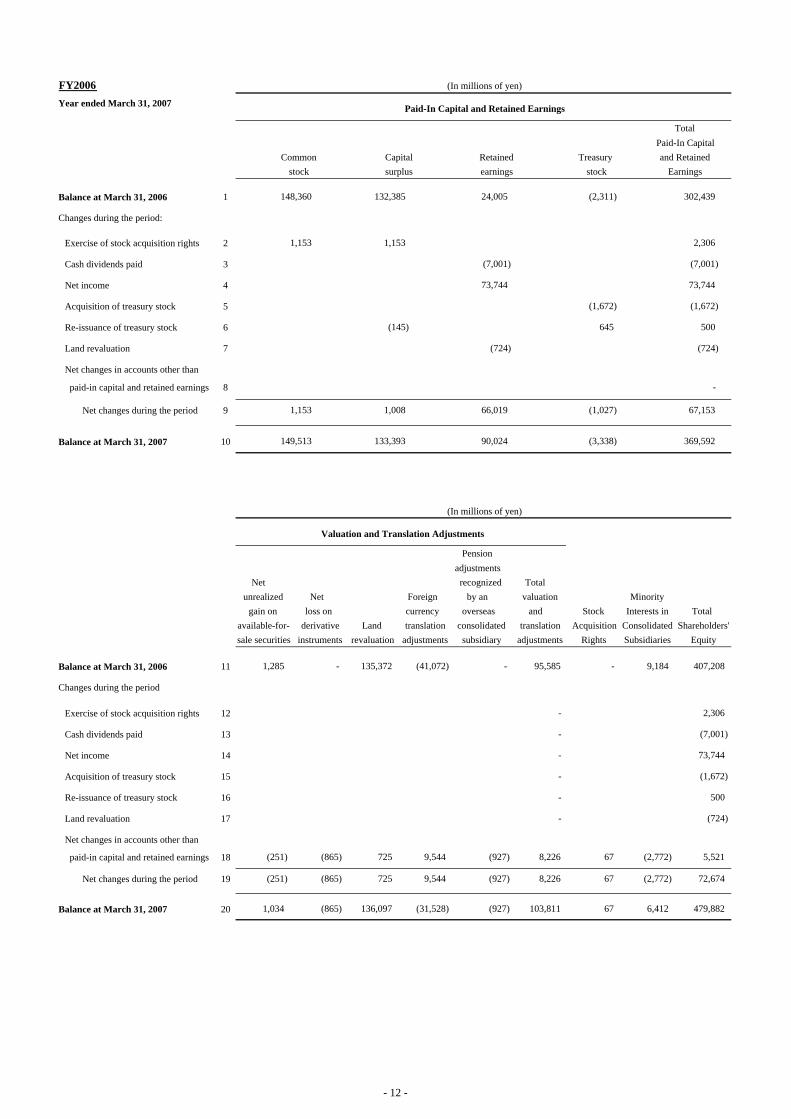
FY2006 (In millions of yen)
Year ended March 31, 2007
Total Paid-In Capital
Common Capital Retained Treasury and Retained stock surplus earnings stock Earnings
Balance at March 31, 2006 1
Changes during the period:
Exercise of stock acquisition rights 2
Cash dividends paid 3
Net income 4
Acquisition of treasury stock 5
Re-issuance of treasury stock 6
Land revaluation 7
Net changes in accounts other than
paid-in capital and retained earnings 8
Net changes during the period 9
Balance at March 31, 2007 10
(In millions of yen)
Pension adjustments
Net recognized Totalunrealized Net Foreign by an valuation Minority
gain on loss on currency overseas and Stock Interests in Totalavailable-for- derivative Land translation consolidated translation Acquisition Consolidated Shareholders'sale securities instruments revaluation adjustments subsidiary adjustments Rights Subsidiaries Equity
Balance at March 31, 2006 11
Changes during the period
Exercise of stock acquisition rights 12
Cash dividends paid 13
Net income 14
Acquisition of treasury stock 15
Re-issuance of treasury stock 16
Land revaluation 17
Net changes in accounts other than
paid-in capital and retained earnings 18
Net changes during the period 19
Balance at March 31, 2007 20
(927)
(927)
(927)
90,024 (3,338) 369,592
-
(724) (724)
-
(1,672)
(145) 645 500
(1,672)
(7,001)
73,744 73,744
(7,001)
302,439
1,153 2,306
24,005 (2,311)
Paid-In Capital and Retained Earnings
Valuation and Translation Adjustments
73,744
(1,672)
9,184
-
-
500
(724)
(2,772)
(2,772)
6,412
407,208
2,306
(7,001)
5,521
72,674
479,882
67
67
67
8,226
8,226
103,811
-
-
95,585
-
-
(251)
1,034
725
725
136,097
(865)
(865)
(251)
(41,072)1,285
149,513
1,153 1,008
133,393
(865)
135,372
148,360
1,153
132,385
-
9,544
66,019 (1,027) 67,153
(31,528)
9,544
-
- 12 -
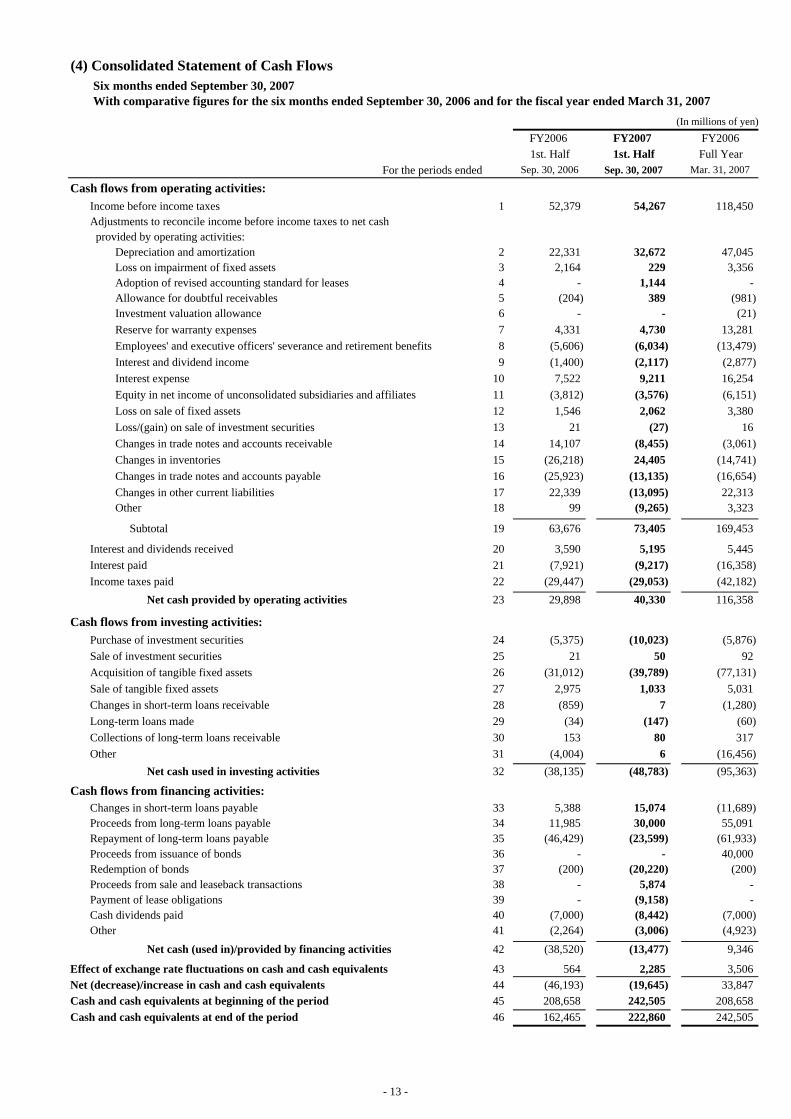
(4) Consolidated Statement of Cash Flows Six months ended September 30, 2007 With comparative figures for the six months ended September 30, 2006 and for the fiscal year ended March 31, 2007
(In millions of yen)FY2006 FY2007 FY20061st. Half 1st. Half Full Year
For the periods ended Sep. 30, 2006 Sep. 30, 2007 Mar. 31, 2007
Cash flows from operating activities: Income before income taxes 1 52,379 54,267 118,450 Adjustments to reconcile income before income taxes to net cash provided by operating activities:
Depreciation and amortization 2 22,331 32,672 47,045 Loss on impairment of fixed assets 3 2,164 229 3,356 Adoption of revised accounting standard for leases 4 - 1,144 - Allowance for doubtful receivables 5 (204) 389 (981) Investment valuation allowance 6 - - (21) Reserve for warranty expenses 7 4,331 4,730 13,281 Employees' and executive officers' severance and retirement benefits 8 (5,606) (6,034) (13,479) Interest and dividend income 9 (1,400) (2,117) (2,877) Interest expense 10 7,522 9,211 16,254 Equity in net income of unconsolidated subsidiaries and affiliates 11 (3,812) (3,576) (6,151) Loss on sale of fixed assets 12 1,546 2,062 3,380 Loss/(gain) on sale of investment securities 13 21 (27) 16 Changes in trade notes and accounts receivable 14 14,107 (8,455) (3,061) Changes in inventories 15 (26,218) 24,405 (14,741) Changes in trade notes and accounts payable 16 (25,923) (13,135) (16,654) Changes in other current liabilities 17 22,339 (13,095) 22,313 Other 18 99 (9,265) 3,323
Subtotal 19 63,676 73,405 169,453
Interest and dividends received 20 3,590 5,195 5,445 Interest paid 21 (7,921) (9,217) (16,358) Income taxes paid 22 (29,447) (29,053) (42,182)
Net cash provided by operating activities 23 29,898 40,330 116,358
Cash flows from investing activities: Purchase of investment securities 24 (5,375) (10,023) (5,876) Sale of investment securities 25 21 50 92 Acquisition of tangible fixed assets 26 (31,012) (39,789) (77,131) Sale of tangible fixed assets 27 2,975 1,033 5,031 Changes in short-term loans receivable 28 (859) 7 (1,280) Long-term loans made 29 (34) (147) (60) Collections of long-term loans receivable 30 153 80 317 Other 31 (4,004) 6 (16,456)
Net cash used in investing activities 32 (38,135) (48,783) (95,363)
Cash flows from financing activities: Changes in short-term loans payable 33 5,388 15,074 (11,689) Proceeds from long-term loans payable 34 11,985 30,000 55,091 Repayment of long-term loans payable 35 (46,429) (23,599) (61,933) Proceeds from issuance of bonds 36 - - 40,000 Redemption of bonds 37 (200) (20,220) (200) Proceeds from sale and leaseback transactions 38 - 5,874 - Payment of lease obligations 39 - (9,158) - Cash dividends paid 40 (7,000) (8,442) (7,000) Other 41 (2,264) (3,006) (4,923)
Net cash (used in)/provided by financing activities 42 (38,520) (13,477) 9,346
Effect of exchange rate fluctuations on cash and cash equivalents 43 564 2,285 3,506 Net (decrease)/increase in cash and cash equivalents 44 (46,193) (19,645) 33,847 Cash and cash equivalents at beginning of the period 45 208,658 242,505 208,658 Cash and cash equivalents at end of the period 46 162,465 222,860 242,505
- 13 -
- 14 -
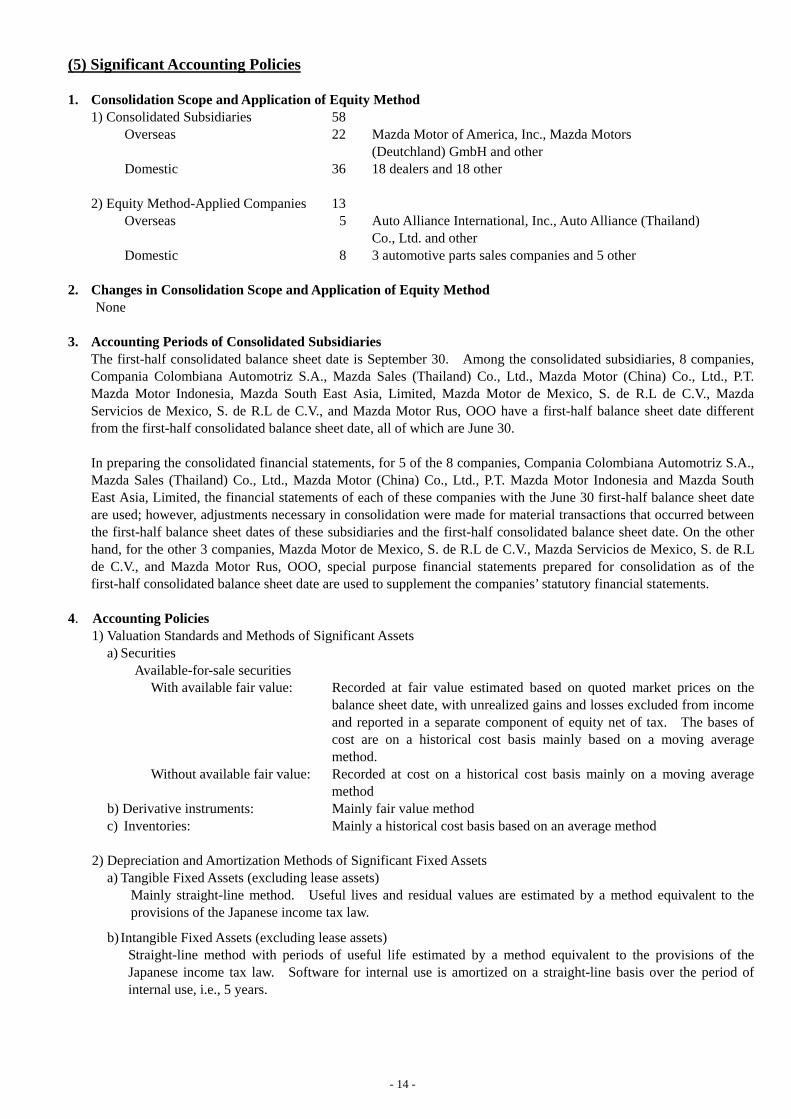
(5) Significant Accounting Policies 1. Consolidation Scope and Application of Equity Method
1) Consolidated Subsidiaries 58 Overseas 22 Mazda Motor of America, Inc., Mazda Motors (Deutchland) GmbH and other Domestic 36 18 dealers and 18 other
2) Equity Method-Applied Companies 13 Overseas 5 Auto Alliance International, Inc., Auto Alliance (Thailand) Co., Ltd. and other Domestic 8 3 automotive parts sales companies and 5 other
2. Changes in Consolidation Scope and Application of Equity Method
None 3. Accounting Periods of Consolidated Subsidiaries
The first-half consolidated balance sheet date is September 30. Among the consolidated subsidiaries, 8 companies, Compania Colombiana Automotriz S.A., Mazda Sales (Thailand) Co., Ltd., Mazda Motor (China) Co., Ltd., P.T. Mazda Motor Indonesia, Mazda South East Asia, Limited, Mazda Motor de Mexico, S. de R.L de C.V., Mazda Servicios de Mexico, S. de R.L de C.V., and Mazda Motor Rus, OOO have a first-half balance sheet date different from the first-half consolidated balance sheet date, all of which are June 30.
In preparing the consolidated financial statements, for 5 of the 8 companies, Compania Colombiana Automotriz S.A., Mazda Sales (Thailand) Co., Ltd., Mazda Motor (China) Co., Ltd., P.T. Mazda Motor Indonesia and Mazda South East Asia, Limited, the financial statements of each of these companies with the June 30 first-half balance sheet date are used; however, adjustments necessary in consolidation were made for material transactions that occurred between the first-half balance sheet dates of these subsidiaries and the first-half consolidated balance sheet date. On the other hand, for the other 3 companies, Mazda Motor de Mexico, S. de R.L de C.V., Mazda Servicios de Mexico, S. de R.L de C.V., and Mazda Motor Rus, OOO, special purpose financial statements prepared for consolidation as of the first-half consolidated balance sheet date are used to supplement the companies’ statutory financial statements.
4. Accounting Policies
1) Valuation Standards and Methods of Significant Assets a) Securities
Available-for-sale securities With available fair value: Recorded at fair value estimated based on quoted market prices on the
balance sheet date, with unrealized gains and losses excluded from income and reported in a separate component of equity net of tax. The bases of cost are on a historical cost basis mainly based on a moving average method.
Without available fair value: Recorded at cost on a historical cost basis mainly on a moving average method
b) Derivative instruments: Mainly fair value method c) Inventories: Mainly a historical cost basis based on an average method
2) Depreciation and Amortization Methods of Significant Fixed Assets
a) Tangible Fixed Assets (excluding lease assets) Mainly straight-line method. Useful lives and residual values are estimated by a method equivalent to the provisions of the Japanese income tax law.
b) Intangible Fixed Assets (excluding lease assets) Straight-line method with periods of useful life estimated by a method equivalent to the provisions of the Japanese income tax law. Software for internal use is amortized on a straight-line basis over the period of internal use, i.e., 5 years.
- 15 -
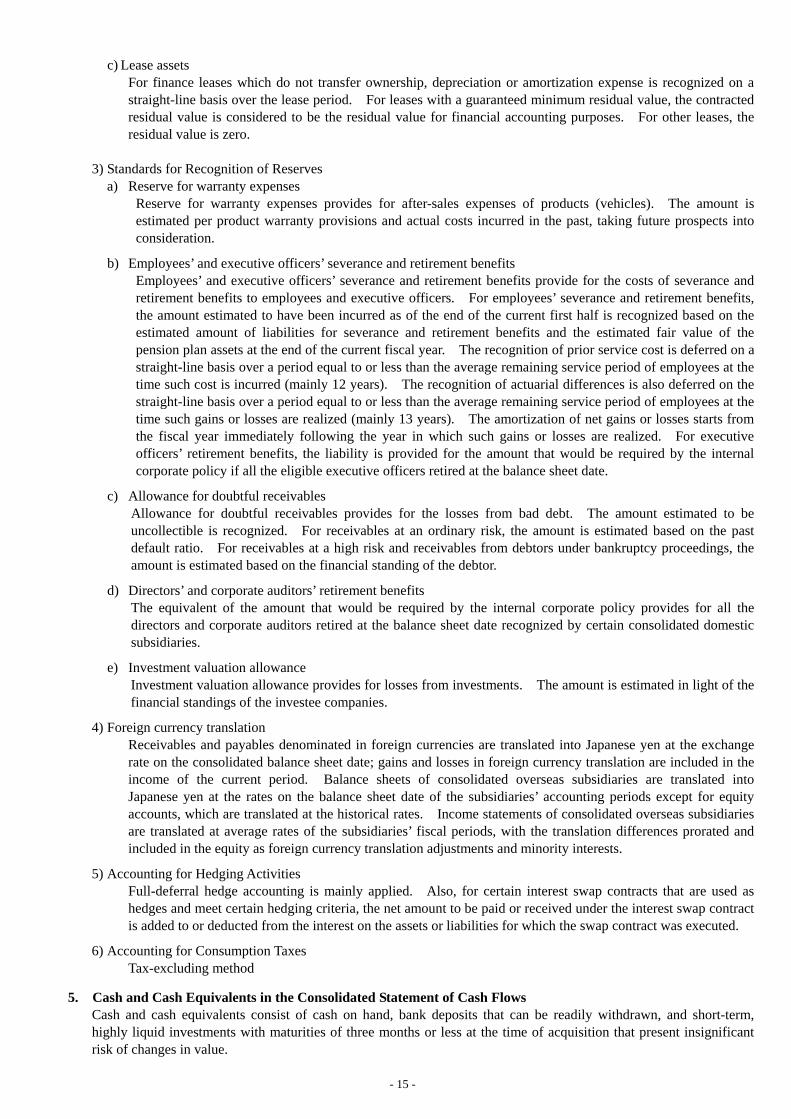
c) Lease assets For finance leases which do not transfer ownership, depreciation or amortization expense is recognized on a straight-line basis over the lease period. For leases with a guaranteed minimum residual value, the contracted residual value is considered to be the residual value for financial accounting purposes. For other leases, the residual value is zero.
3) Standards for Recognition of Reserves a) Reserve for warranty expenses
Reserve for warranty expenses provides for after-sales expenses of products (vehicles). The amount is estimated per product warranty provisions and actual costs incurred in the past, taking future prospects into consideration.
b) Employees’ and executive officers’ severance and retirement benefits Employees’ and executive officers’ severance and retirement benefits provide for the costs of severance and retirement benefits to employees and executive officers. For employees’ severance and retirement benefits, the amount estimated to have been incurred as of the end of the current first half is recognized based on the estimated amount of liabilities for severance and retirement benefits and the estimated fair value of the pension plan assets at the end of the current fiscal year. The recognition of prior service cost is deferred on a straight-line basis over a period equal to or less than the average remaining service period of employees at the time such cost is incurred (mainly 12 years). The recognition of actuarial differences is also deferred on the straight-line basis over a period equal to or less than the average remaining service period of employees at the time such gains or losses are realized (mainly 13 years). The amortization of net gains or losses starts from the fiscal year immediately following the year in which such gains or losses are realized. For executive officers’ retirement benefits, the liability is provided for the amount that would be required by the internal corporate policy if all the eligible executive officers retired at the balance sheet date.
c) Allowance for doubtful receivables Allowance for doubtful receivables provides for the losses from bad debt. The amount estimated to be uncollectible is recognized. For receivables at an ordinary risk, the amount is estimated based on the past default ratio. For receivables at a high risk and receivables from debtors under bankruptcy proceedings, the amount is estimated based on the financial standing of the debtor.
d) Directors’ and corporate auditors’ retirement benefits The equivalent of the amount that would be required by the internal corporate policy provides for all the directors and corporate auditors retired at the balance sheet date recognized by certain consolidated domestic subsidiaries.
e) Investment valuation allowance Investment valuation allowance provides for losses from investments. The amount is estimated in light of the financial standings of the investee companies.
4) Foreign currency translation Receivables and payables denominated in foreign currencies are translated into Japanese yen at the exchange rate on the consolidated balance sheet date; gains and losses in foreign currency translation are included in the income of the current period. Balance sheets of consolidated overseas subsidiaries are translated into Japanese yen at the rates on the balance sheet date of the subsidiaries’ accounting periods except for equity accounts, which are translated at the historical rates. Income statements of consolidated overseas subsidiaries are translated at average rates of the subsidiaries’ fiscal periods, with the translation differences prorated and included in the equity as foreign currency translation adjustments and minority interests.
5) Accounting for Hedging Activities Full-deferral hedge accounting is mainly applied. Also, for certain interest swap contracts that are used as hedges and meet certain hedging criteria, the net amount to be paid or received under the interest swap contract is added to or deducted from the interest on the assets or liabilities for which the swap contract was executed.
6) Accounting for Consumption Taxes Tax-excluding method
5. Cash and Cash Equivalents in the Consolidated Statement of Cash Flows Cash and cash equivalents consist of cash on hand, bank deposits that can be readily withdrawn, and short-term, highly liquid investments with maturities of three months or less at the time of acquisition that present insignificant risk of changes in value.
- 16 -
(6) Accounting Changes and Adoption of New Accounting Standards
Accounting for leases Commencing in the six months ended September 30, 2007, Mazda Motor Corporation (the “Company”) and its domestic consolidated subsidiaries (together the “Domestic Companies”) early adopted the Accounting Standards Board of Japan (“ASBJ”) Statement No.13, Accounting Standard for Lease Transaction, and ASBJ Guideline No.16, Guidance on Accounting Standard for Lease Transaction, originally issued by the Business Accounting Deliberation Counsel on June 17, 1993 and by the Japanese Institute of Certified Public Accountants on January 18, 1994, respectively, and both revised by the ASBJ on March 30, 2007. Early adoption of ASBJ Statement No. 13 and ASBJ Guideline No. 16 is permitted as of the beginning of a fiscal year that begins on or after April 1, 2007.
The effects of adopting the new standards on the consolidated balance sheet as of September 30, 2007 were to increase tangible fixed assets and intangible fixed assets by 35,595 million yen and 19 million yen, respectively, and to increase current liabilities and fixed liabilities by 12,775 million yen and 24,001 million yen, respectively. In addition, the effects of adopting the new standards on the consolidated statement of income for the six months ended September 30, 2007, were to increase operating income and ordinary income by 605 million yen and 103 million yen, respectively, and to decrease income before income taxes by 1,041 million yen. Also, the effects of adopting the new standards on the consolidated statement of cash flows for the six months ended September 30, 2007 were to increase cash flows from operating activities by 6,917 million yen, to decrease cash flows from investing activities by 5,874 million yen, and to decrease cash flows from financing activities by 1,043 million yen. The effects of adopting the new standards on the segment information are discussed in the applicable section of the notes to the consolidated financial statements.
Depreciation of tangible fixed assets
Commencing in the six months ended September 30, 2007, for those tangible fixed assets that were acquired on or after April 1, 2007, the Domestic Companies changed the depreciation method in accordance with the applicable provisions of the revised Japanese Income Tax Code, Law No. 6 and Ordinance No. 83 to Partly Revise Japanese (Corporate) Income Tax Code, both promulgated on March 30, 2007. The effects of this change on operating income, ordinary income, and income before income taxes in the consolidated statement of income for the six months ended September 30, 2007 were immaterial.
Adoption of new accounting standard by an overseas subsidiary
Until the prior period, among the consolidated subsidiaries, Compania Colombiana Automotriz S.A. (“CCA”) prepared its financial statements based on the accounting principles generally accepted in Colombia to reflect adjustments for the country’s inflationary economy and changing prices. On May 7, 2007, however, the federal government of Colombia promulgated a decree to abolish such adjustments from the country’s accounting principles. As a result, commencing in the six months ended September 30, 2007, CCA’s financial statements do not reflect such adjustments. In the consolidated statement of income for the six months ended September 30, 2007, the effects of adopting the new standard on operating income was none and those on ordinary income and income before income taxes were immaterial.
Changes in Financial Statement Presentation Consolidated balance sheet as of September 30, 2007 1. Until the prior period, in the consolidated balance sheet, leased property and lease obligations related to finance
lease transactions by an overseas consolidated subsidiary were included in the tools, furniture and fixtures of the tangible fixed assets and in the long-term loans payable due within one year of the current liabilities and the long-term loans payable of the fixed liabilities, respectively. Commencing in the six months ended September 30, 2007, however, these leased property and lease obligations are included in the leased property of the tangible fixed assets and the lease obligations of the current and fixed liabilities, respectively, as the Domestic Companies adopted the revised accounting standards for leases as discussed earlier in the accounting changes and adoption of new accounting standards, which resulted in increased materiality of leased property and lease obligations.
- 17 -
As of September 30, 2007, the balance of the leased property in the fixed liabilities amounted to 1,906 million yen, and that of the leased obligations amounted to 5,552 million yen in the current liabilities.
2. Until the prior period, in the consolidated balance sheet, directors’ and corporate auditors’ retirement benefits
were presented as a separate component of the fixed liabilities. Commencing in the six months ended September 30, 2007, however, the retirement benefits are included in the other fixed liabilities due to materiality, as the Company has terminated the compensation for directors and corporate auditors in the form of retirement benefits.
As of September 30, 2007, the balance of directors’ and corporate auditors’ retirement benefits recognized by certain consolidated domestic subsidiaries amounted to 548 million yen.
Consolidated statement of cash flows for the six months ended September 30, 2007 Until the prior period, payment of finance lease obligations by an overseas consolidated subsidiary was included in the repayment of long-term debt in the financing cash flows. Commencing in the six months ended September 30, 2007, such payment is included in the payment of lease obligations in the financing cash flows, as the Domestic Companies adopted the new accounting standard for leases discussed earlier in the accounting changes and adoption of new accounting standards. The payment of lease obligations by the overseas consolidated subsidiary for the six months ended September 30, 2007 amounted to 2,241 million yen.
Additional Information Accounting for residual value of fixed assets In relation to the changes in the Japanese Income Tax Code, commencing in the six months ended September 30, 2007, for the tangible fixes assets that were acquired on or before March 31, 2007 and for which accumulated depreciation has reached 95% of the acquisition cost, the Domestic Companies recognize depreciation for the difference between the 5% residual value and the nominal value (i.e., 1 yen) on a straight-line basis over 5 years, starting in the year following the year in which accumulated depreciation has reached 95% of the acquisition cost (or the year ending March 31, 2008, whichever comes later). The effects of adopting this accounting for residual value of fixes assets on the consolidated statement of income for the six months ended September 30, 2007 were to decrease operating income by 1,996 million yen and to decrease ordinary income and income before income taxes by 2,075 million yen. The effects of adopting this accounting for residual value of fixed assets on the segment information are discussed in the applicable section of the notes to the consolidated financial statements. Termination of directors’ and corporate auditors’ retirement benefits The Company used to recognize, in the liabilities, directors’ and corporate auditors’ retirement benefits that provide for retirement benefits to directors and corporate auditors; the amount that would be required by the internal corporate policy if all the directors and corporate auditors retired on the balance sheet date was recognized. As part of management reform, however, by the resolution of the general meeting of shareholders held on June 26, 2007, the Company reached a decision to terminate retirement benefits to directors and corporate auditors as of the end of this general meeting of shareholders as well as to pay the directors and corporate auditors such benefits already earned by the time of the decision. In relation to this decision, in the consolidated balance sheet as of September 30, 2007, an amount equivalent to the retirement benefits earned prior to the resolution, i.e., 618 million yen, was recognized in other fixed liabilities.
(7) Other Notes to the Consolidated Financial Statements
Consolidated Statement of Income (In millions of yen) FY2006 FY2007 FY20061st. Half 1st. Half Full Year
For the periods ended Sep. 30, 2006 Sep. 30, 2007 Mar. 31, 2007
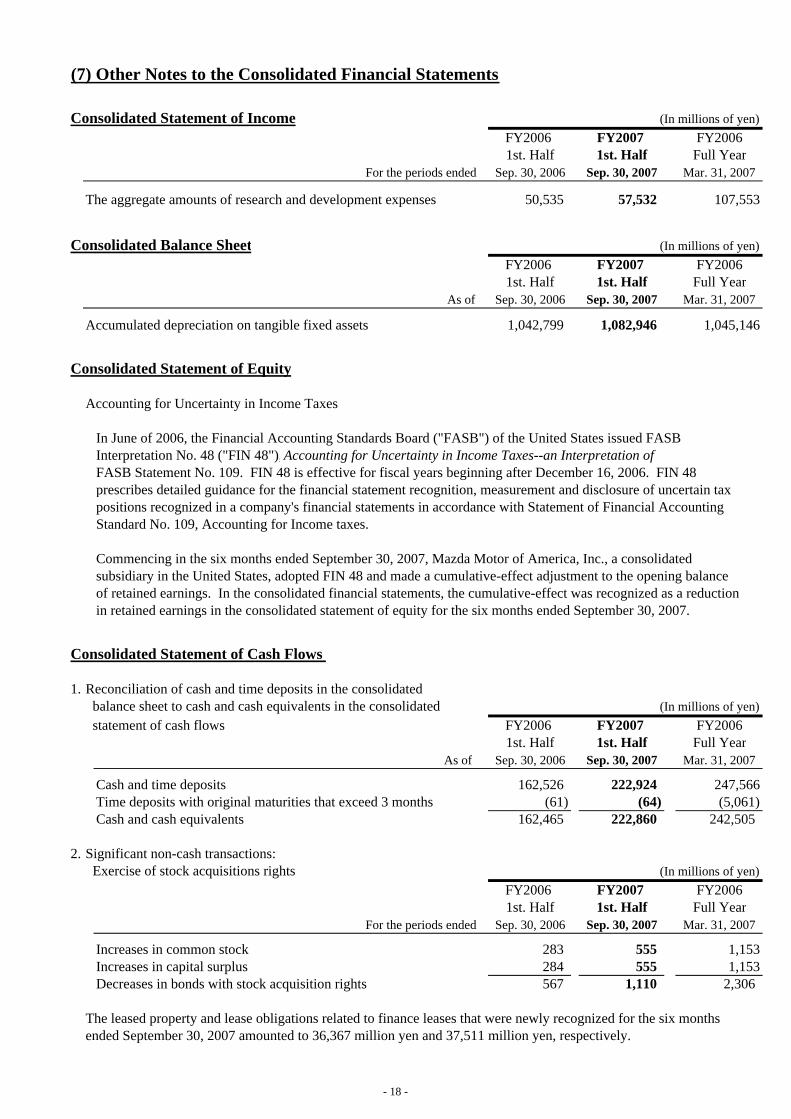
The aggregate amounts of research and development expenses 50,535 57,532 107,553
Consolidated Balance Sheet (In millions of yen) FY2006 FY2007 FY20061st. Half 1st. Half Full Year
As of Sep. 30, 2006 Sep. 30, 2007 Mar. 31, 2007
Accumulated depreciation on tangible fixed assets 1,042,799 1,082,946 1,045,146
Consolidated Statement of Equity
Accounting for Uncertainty in Income Taxes
In June of 2006, the Financial Accounting Standards Board ("FASB") of the United States issued FASB Interpretation No. 48 ("FIN 48"), Accounting for Uncertainty in Income Taxes--an Interpretation ofFASB Statement No. 109. FIN 48 is effective for fiscal years beginning after December 16, 2006. FIN 48 prescribes detailed guidance for the financial statement recognition, measurement and disclosure of uncertain tax positions recognized in a company's financial statements in accordance with Statement of Financial Accounting Standard No. 109, Accounting for Income taxes.
Commencing in the six months ended September 30, 2007, Mazda Motor of America, Inc., a consolidated subsidiary in the United States, adopted FIN 48 and made a cumulative-effect adjustment to the opening balance of retained earnings. In the consolidated financial statements, the cumulative-effect was recognized as a reduction in retained earnings in the consolidated statement of equity for the six months ended September 30, 2007.
Consolidated Statement of Cash Flows
1. Reconciliation of cash and time deposits in the consolidated balance sheet to cash and cash equivalents in the consolidated (In millions of yen) statement of cash flows FY2006 FY2007 FY2006
1st. Half 1st. Half Full YearAs of Sep. 30, 2006 Sep. 30, 2007 Mar. 31, 2007
Cash and time deposits 162,526 222,924 247,566Time deposits with original maturities that exceed 3 months (61) (64) (5,061)Cash and cash equivalents 162,465 222,860 242,505
2. Significant non-cash transactions: Exercise of stock acquisitions rights (In millions of yen)
FY2006 FY2007 FY20061st. Half 1st. Half Full Year
For the periods ended Sep. 30, 2006 Sep. 30, 2007 Mar. 31, 2007
Increases in common stock 283 555 1,153Increases in capital surplus 284 555 1,153Decreases in bonds with stock acquisition rights 567 1,110 2,306
The leased property and lease obligations related to finance leases that were newly recognized for the six months ended September 30, 2007 amounted to 36,367 million yen and 37,511 million yen, respectively.
- 18 -
Segment Information1) Information by Industry Segment
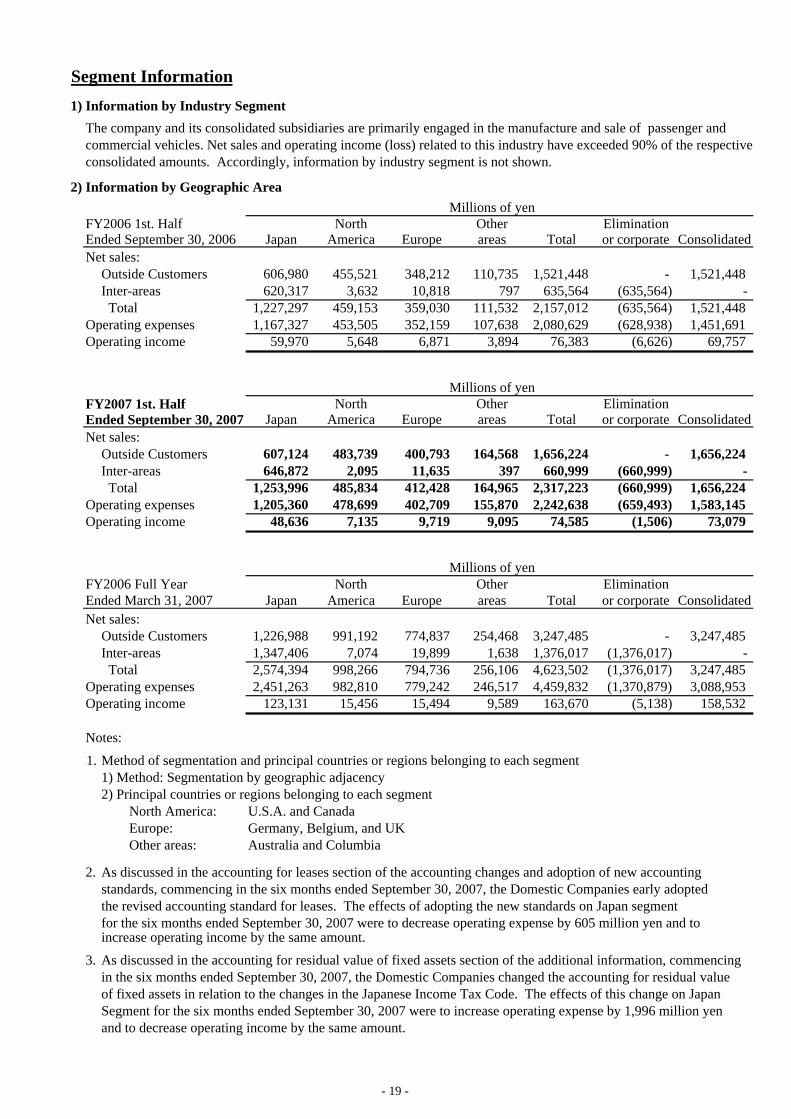
The company and its consolidated subsidiaries are primarily engaged in the manufacture and sale of passenger and commercial vehicles. Net sales and operating income (loss) related to this industry have exceeded 90% of the respective consolidated amounts. Accordingly, information by industry segment is not shown.
2) Information by Geographic AreaMillions of yen
FY2006 1st. Half North Other EliminationEnded September 30, 2006 Japan America Europe areas Total or corporate ConsolidatedNet sales:
Outside Customers 606,980 455,521 348,212 110,735 1,521,448 - 1,521,448Inter-areas 620,317 3,632 10,818 797 635,564 (635,564) -
Total 1,227,297 459,153 359,030 111,532 2,157,012 (635,564) 1,521,448Operating expenses 1,167,327 453,505 352,159 107,638 2,080,629 (628,938) 1,451,691Operating income 59,970 5,648 6,871 3,894 76,383 (6,626) 69,757
Millions of yenFY2007 1st. Half North Other EliminationEnded September 30, 2007 Japan America Europe areas Total or corporate ConsolidatedNet sales:
Outside Customers 607,124 483,739 400,793 164,568 1,656,224 - 1,656,224Inter-areas 646,872 2,095 11,635 397 660,999 (660,999) -
Total 1,253,996 485,834 412,428 164,965 2,317,223 (660,999) 1,656,224Operating expenses 1,205,360 478,699 402,709 155,870 2,242,638 (659,493) 1,583,145Operating income 48,636 7,135 9,719 9,095 74,585 (1,506) 73,079
Millions of yenFY2006 Full Year North Other EliminationEnded March 31, 2007 Japan America Europe areas Total or corporate ConsolidatedNet sales:
Outside Customers 1,226,988 991,192 774,837 254,468 3,247,485 - 3,247,485Inter-areas 1,347,406 7,074 19,899 1,638 1,376,017 (1,376,017) -
Total 2,574,394 998,266 794,736 256,106 4,623,502 (1,376,017) 3,247,485Operating expenses 2,451,263 982,810 779,242 246,517 4,459,832 (1,370,879) 3,088,953Operating income 123,131 15,456 15,494 9,589 163,670 (5,138) 158,532
Notes:
1. Method of segmentation and principal countries or regions belonging to each segment1) Method: Segmentation by geographic adjacency2) Principal countries or regions belonging to each segment North America: U.S.A. and Canada Europe: Germany, Belgium, and UK Other areas: Australia and Columbia
2. As discussed in the accounting for leases section of the accounting changes and adoption of new accounting standards, commencing in the six months ended September 30, 2007, the Domestic Companies early adoptedthe revised accounting standard for leases. The effects of adopting the new standards on Japan segment for the six months ended September 30, 2007 were to decrease operating expense by 605 million yen and toincrease operating income by the same amount.
3. As discussed in the accounting for residual value of fixed assets section of the additional information, commencing in the six months ended September 30, 2007, the Domestic Companies changed the accounting for residual valueof fixed assets in relation to the changes in the Japanese Income Tax Code. The effects of this change on JapanSegment for the six months ended September 30, 2007 were to increase operating expense by 1,996 million yen and to decrease operating income by the same amount.
- 19 -
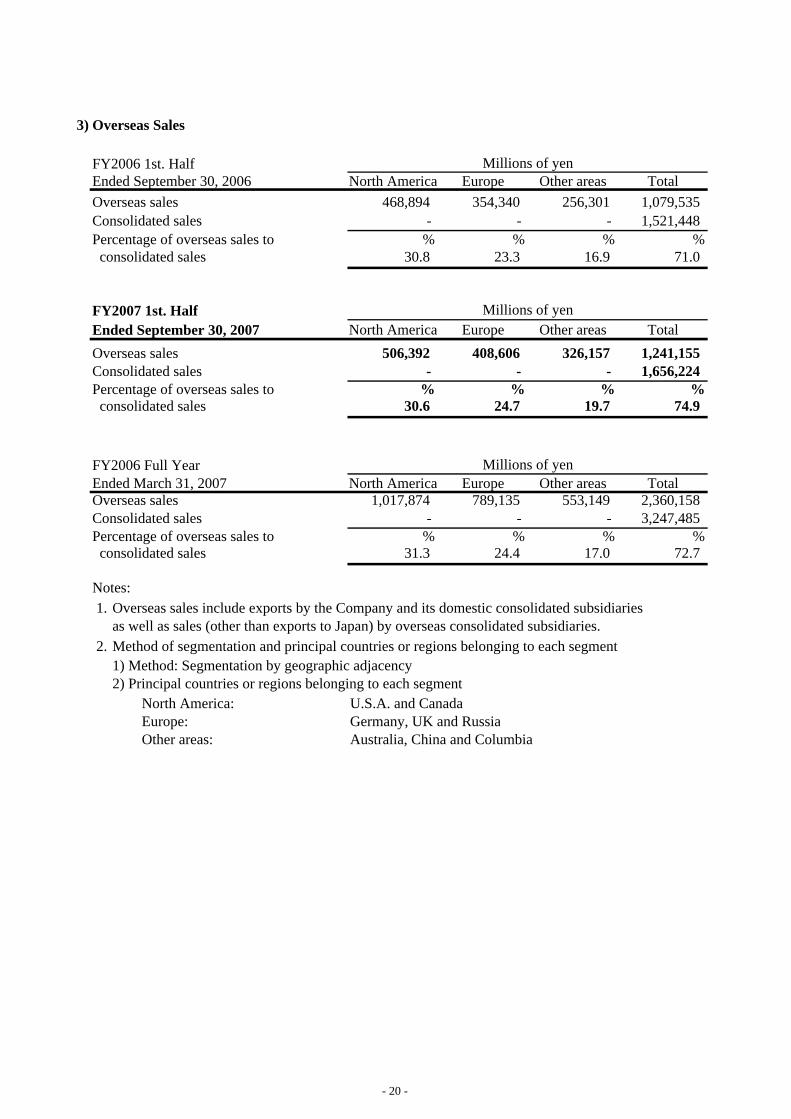
3) Overseas Sales
FY2006 1st. HalfEnded September 30, 2006 North America Europe Other areas TotalOverseas sales 468,894 354,340 256,301 1,079,535Consolidated sales - - - 1,521,448Percentage of overseas sales to % % % % consolidated sales 30.8 23.3 16.9 71.0
FY2007 1st. HalfEnded September 30, 2007 North America Europe Other areas TotalOverseas sales 506,392 408,606 326,157 1,241,155Consolidated sales - - - 1,656,224Percentage of overseas sales to % % % % consolidated sales 30.6 24.7 19.7 74.9
FY2006 Full YearEnded March 31, 2007 North America Europe Other areas TotalOverseas sales 1,017,874 789,135 553,149 2,360,158Consolidated sales - - - 3,247,485Percentage of overseas sales to % % % % consolidated sales 31.3 24.4 17.0 72.7
Notes:1. Overseas sales include exports by the Company and its domestic consolidated subsidiaries
as well as sales (other than exports to Japan) by overseas consolidated subsidiaries.2. Method of segmentation and principal countries or regions belonging to each segment
1) Method: Segmentation by geographic adjacency2) Principal countries or regions belonging to each segment North America: U.S.A. and Canada Europe: Germany, UK and Russia Other areas: Australia, China and Columbia
Millions of yen
Millions of yen
Millions of yen
- 20 -
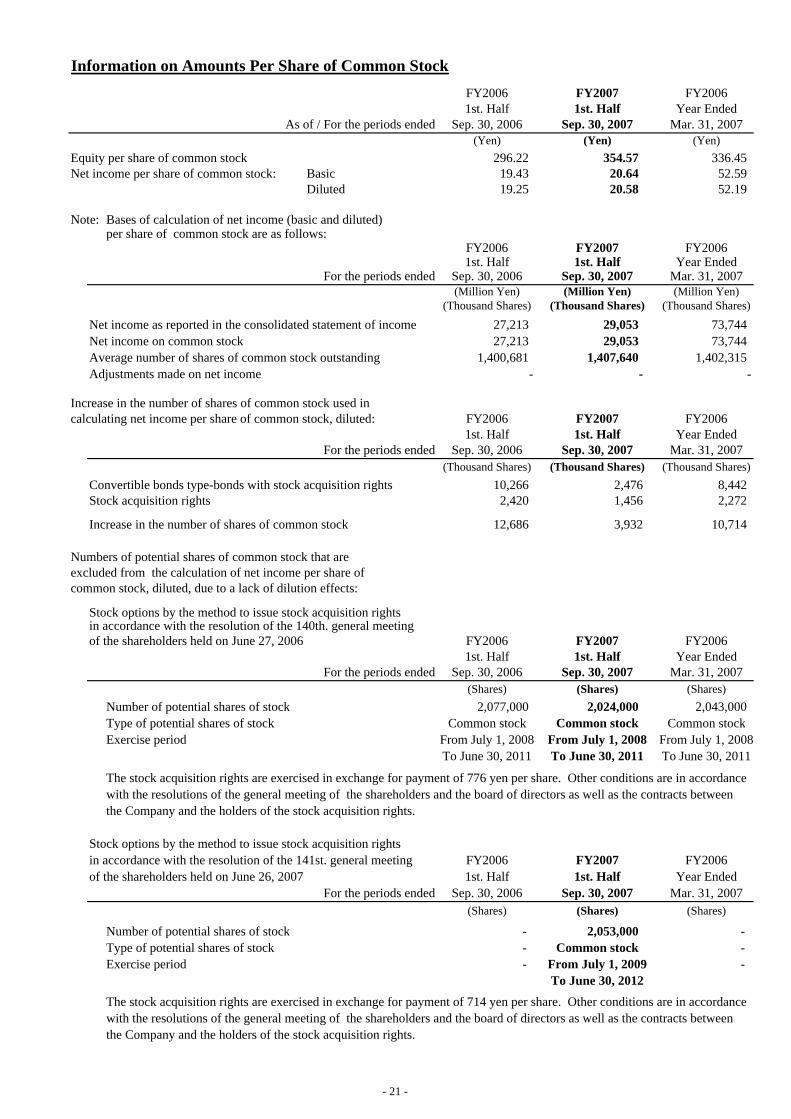
Information on Amounts Per Share of Common StockFY2006 FY2007 FY20061st. Half 1st. Half Year Ended
As of / For the periods ended Sep. 30, 2006 Sep. 30, 2007 Mar. 31, 2007(Yen) (Yen) (Yen)
Equity per share of common stock 296.22 354.57 336.45Net income per share of common stock: Basic 19.43 20.64 52.59
Diluted 19.25 20.58 52.19
Note: Bases of calculation of net income (basic and diluted) per share of common stock are as follows:
FY2006 FY2007 FY20061st. Half 1st. Half Year Ended
For the periods ended Sep. 30, 2006 Sep. 30, 2007 Mar. 31, 2007(Million Yen) (Million Yen) (Million Yen)
(Thousand Shares) (Thousand Shares) (Thousand Shares)
Net income as reported in the consolidated statement of income 27,213 29,053 73,744Net income on common stock 27,213 29,053 73,744Average number of shares of common stock outstanding 1,400,681 1,407,640 1,402,315Adjustments made on net income - - -
Increase in the number of shares of common stock used in calculating net income per share of common stock, diluted: FY2006 FY2007 FY2006
1st. Half 1st. Half Year EndedFor the periods ended Sep. 30, 2006 Sep. 30, 2007 Mar. 31, 2007
(Thousand Shares) (Thousand Shares) (Thousand Shares)Convertible bonds type-bonds with stock acquisition rights 10,266 2,476 8,442Stock acquisition rights 2,420 1,456 2,272
Increase in the number of shares of common stock 12,686 3,932 10,714
Numbers of potential shares of common stock that are excluded from the calculation of net income per share of common stock, diluted, due to a lack of dilution effects:
Stock options by the method to issue stock acquisition rightsin accordance with the resolution of the 140th. general meetingof the shareholders held on June 27, 2006 FY2006 FY2007 FY2006
1st. Half 1st. Half Year Ended For the periods ended Sep. 30, 2006 Sep. 30, 2007 Mar. 31, 2007
(Shares) (Shares) (Shares)Number of potential shares of stock 2,077,000 2,024,000 2,043,000Type of potential shares of stock Common stock Common stock Common stockExercise period From July 1, 2008 From July 1, 2008 From July 1, 2008
To June 30, 2011 To June 30, 2011 To June 30, 2011
The stock acquisition rights are exercised in exchange for payment of 776 yen per share. Other conditions are in accordance with the resolutions of the general meeting of the shareholders and the board of directors as well as the contracts between the Company and the holders of the stock acquisition rights.
Stock options by the method to issue stock acquisition rightsin accordance with the resolution of the 141st. general meeting FY2006 FY2007 FY2006of the shareholders held on June 26, 2007 1st. Half 1st. Half Year Ended
For the periods ended Sep. 30, 2006 Sep. 30, 2007 Mar. 31, 2007(Shares) (Shares) (Shares)
Number of potential shares of stock - 2,053,000 - Type of potential shares of stock - Common stock - Exercise period - From July 1, 2009 -
To June 30, 2012The stock acquisition rights are exercised in exchange for payment of 714 yen per share. Other conditions are in accordance with the resolutions of the general meeting of the shareholders and the board of directors as well as the contracts between the Company and the holders of the stock acquisition rights.
- 21 -
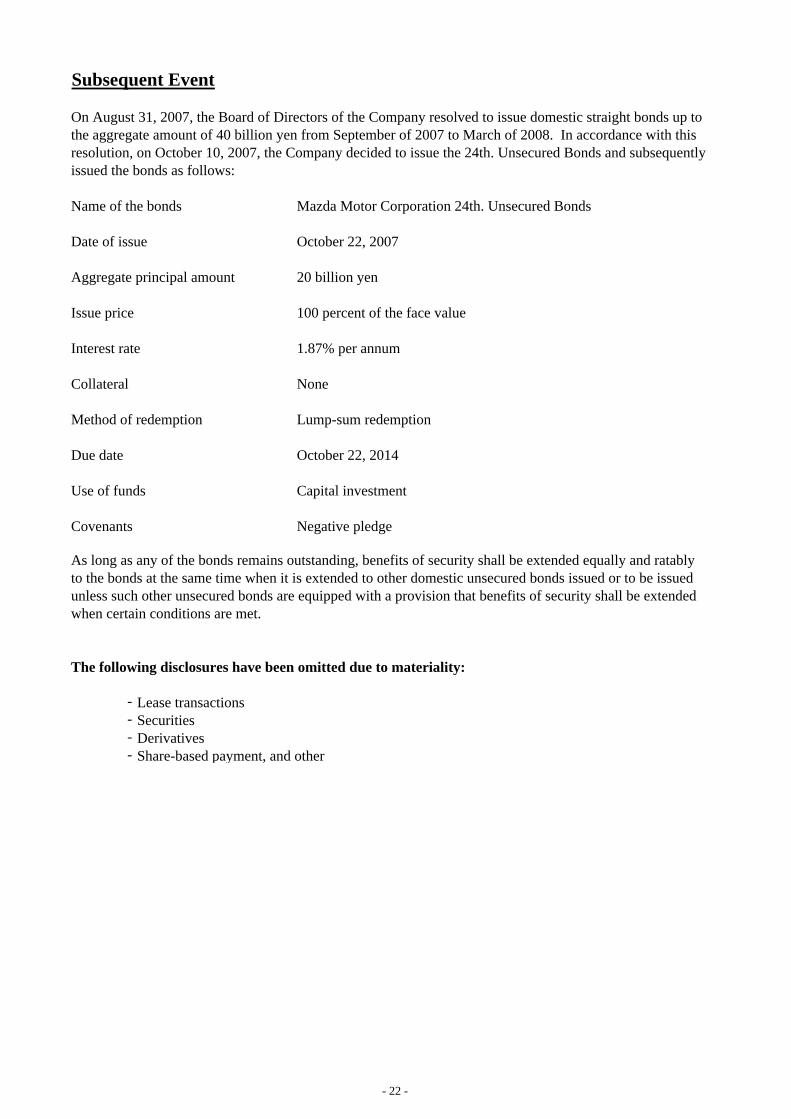
Subsequent Event
On August 31, 2007, the Board of Directors of the Company resolved to issue domestic straight bonds up to the aggregate amount of 40 billion yen from September of 2007 to March of 2008. In accordance with thisresolution, on October 10, 2007, the Company decided to issue the 24th. Unsecured Bonds and subsequentlyissued the bonds as follows:
Name of the bonds Mazda Motor Corporation 24th. Unsecured Bonds
Date of issue October 22, 2007
Aggregate principal amount 20 billion yen
Issue price 100 percent of the face value
Interest rate 1.87% per annum
Collateral None
Method of redemption Lump-sum redemption
Due date October 22, 2014
Use of funds Capital investment
Covenants Negative pledge
As long as any of the bonds remains outstanding, benefits of security shall be extended equally and ratablyto the bonds at the same time when it is extended to other domestic unsecured bonds issued or to be issuedunless such other unsecured bonds are equipped with a provision that benefits of security shall be extendedwhen certain conditions are met.
The following disclosures have been omitted due to materiality:
- Lease transactions- Securities- Derivatives- Share-based payment, and other
- 22 -
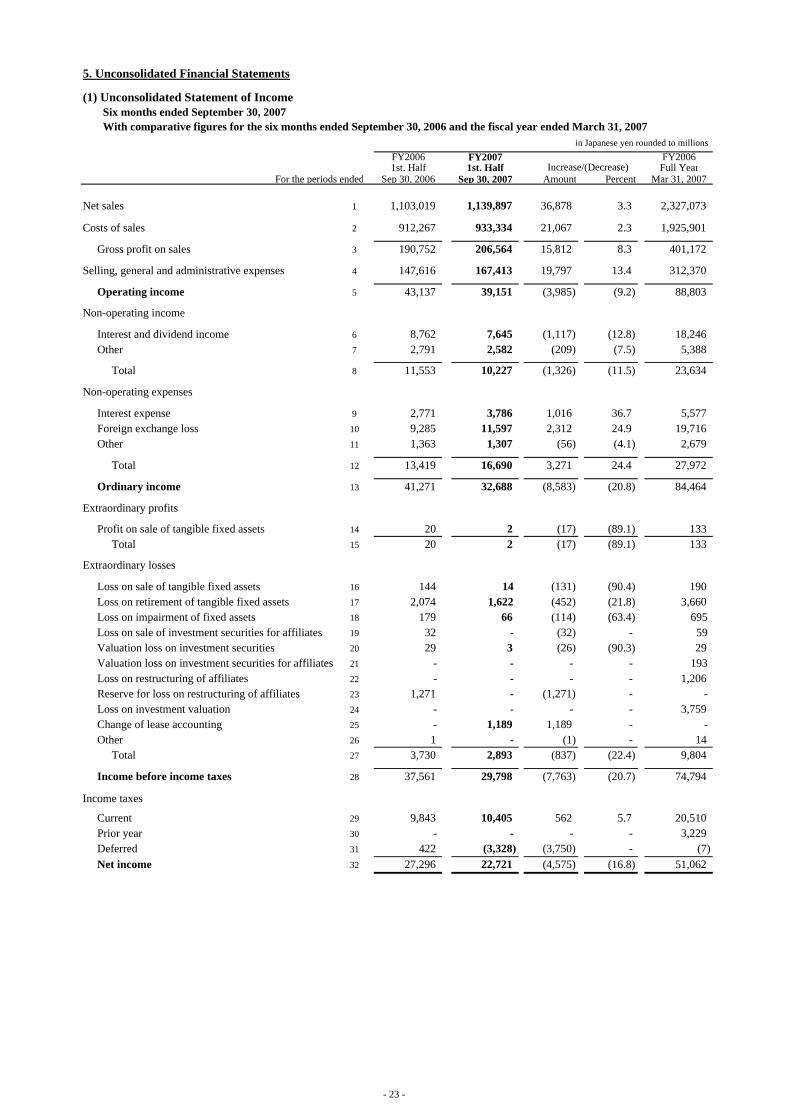
5. Unconsolidated Financial Statements
(1) Unconsolidated Statement of Income Six months ended September 30, 2007 With comparative figures for the six months ended September 30, 2006 and the fiscal year ended March 31, 2007
FY2006 FY2007 FY20061st. Half 1st. Half Full Year
For the periods ended Sep 30, 2006 Sep 30, 2007 Amount Percent Mar 31, 2007
Net sales 1 1,103,019 1,139,897 36,878 3.3 2,327,073
Costs of sales 2 912,267 933,334 21,067 2.3 1,925,901
Gross profit on sales 3 190,752 206,564 15,812 8.3 401,172
Selling, general and administrative expenses 4 147,616 167,413 19,797 13.4 312,370
Operating income 5 43,137 39,151 (3,985) (9.2) 88,803
Non-operating income
Interest and dividend income 6 8,762 7,645 (1,117) (12.8) 18,246Other 7 2,791 2,582 (209) (7.5) 5,388
Total 8 11,553 10,227 (1,326) (11.5) 23,634
Non-operating expenses
Interest expense 9 2,771 3,786 1,016 36.7 5,577Foreign exchange loss 10 9,285 11,597 2,312 24.9 19,716Other 11 1,363 1,307 (56) (4.1) 2,679
Total 12 13,419 16,690 3,271 24.4 27,972
Ordinary income 13 41,271 32,688 (8,583) (20.8) 84,464
Extraordinary profits
Profit on sale of tangible fixed assets 14 20 2 (17) (89.1) 133Total 15 20 2 (17) (89.1) 133
Extraordinary losses
Loss on sale of tangible fixed assets 16 144 14 (131) (90.4) 190Loss on retirement of tangible fixed assets 17 2,074 1,622 (452) (21.8) 3,660Loss on impairment of fixed assets 18 179 66 (114) (63.4) 695 Loss on sale of investment securities for affiliates 19 32 - (32) - 59 Valuation loss on investment securities 20 29 3 (26) (90.3) 29Valuation loss on investment securities for affiliates 21 - - - - 193 Loss on restructuring of affiliates 22 - - - - 1,206Reserve for loss on restructuring of affiliates 23 1,271 - (1,271) - - Loss on investment valuation 24 - - - - 3,759Change of lease accounting 25 - 1,189 1,189 - - Other 26 1 - (1) - 14
Total 27 3,730 2,893 (837) (22.4) 9,804
Income before income taxes 28 37,561 29,798 (7,763) (20.7) 74,794
Income taxes
Current 29 9,843 10,405 562 5.7 20,510Prior year 30 - - - - 3,229Deferred 31 422 (3,328) (3,750) - (7)Net income 32 27,296 22,721 (4,575) (16.8) 51,062
Increase/(Decrease)
in Japanese yen rounded to millions
- 23 -
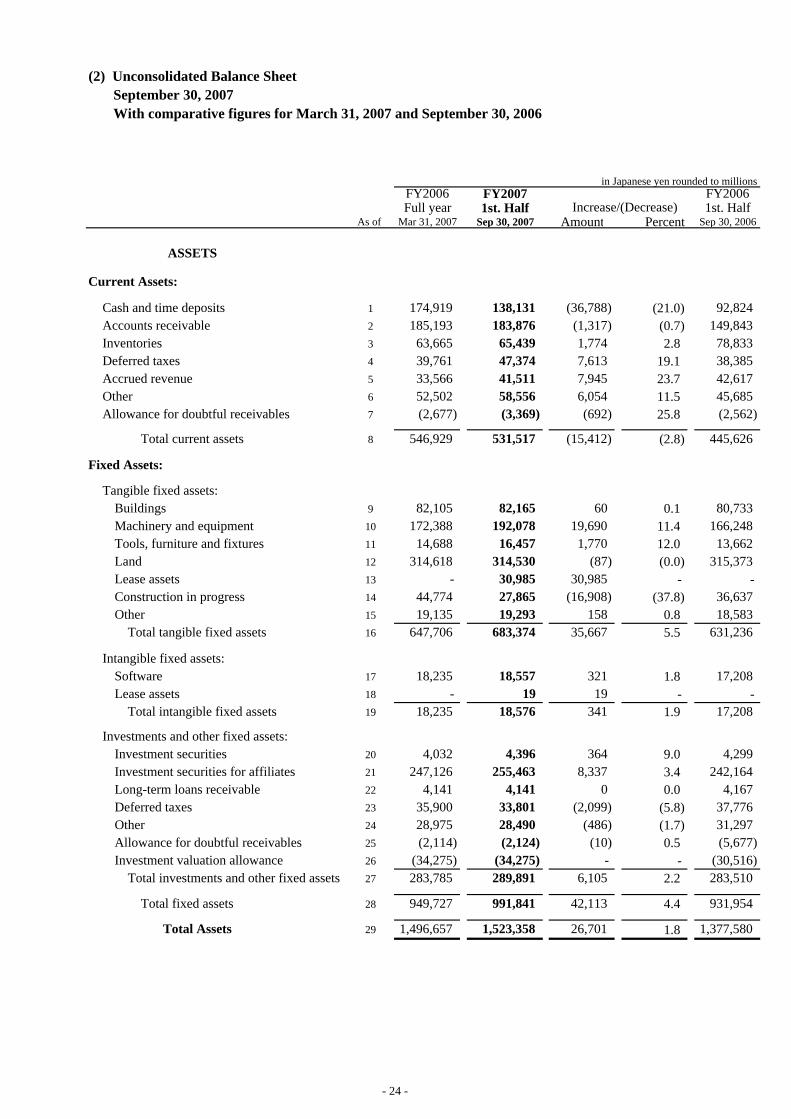
(2) Unconsolidated Balance Sheet September 30, 2007 With comparative figures for March 31, 2007 and September 30, 2006
FY2006 FY2007 FY2006Full year 1st. Half 1st. Half
As of Mar 31, 2007 Sep 30, 2007 Amount Percent Sep 30, 2006
ASSETS
Current Assets:
Cash and time deposits 1 174,919 138,131 (36,788) (21.0) 92,824Accounts receivable 2 185,193 183,876 (1,317) (0.7) 149,843Inventories 3 63,665 65,439 1,774 2.8 78,833Deferred taxes 4 39,761 47,374 7,613 19.1 38,385Accrued revenue 5 33,566 41,511 7,945 23.7 42,617Other 6 52,502 58,556 6,054 11.5 45,685Allowance for doubtful receivables 7 (2,677) (3,369) (692) 25.8 (2,562)
Total current assets 8 546,929 531,517 (15,412) (2.8) 445,626
Fixed Assets:
Tangible fixed assets:Buildings 9 82,105 82,165 60 0.1 80,733Machinery and equipment 10 172,388 192,078 19,690 11.4 166,248Tools, furniture and fixtures 11 14,688 16,457 1,770 12.0 13,662Land 12 314,618 314,530 (87) (0.0) 315,373Lease assets 13 - 30,985 30,985 - - Construction in progress 14 44,774 27,865 (16,908) (37.8) 36,637Other 15 19,135 19,293 158 0.8 18,583
Total tangible fixed assets 16 647,706 683,374 35,667 5.5 631,236
Intangible fixed assets:Software 17 18,235 18,557 321 1.8 17,208Lease assets 18 - 19 19 - -
Total intangible fixed assets 19 18,235 18,576 341 1.9 17,208
Investments and other fixed assets:Investment securities 20 4,032 4,396 364 9.0 4,299Investment securities for affiliates 21 247,126 255,463 8,337 3.4 242,164Long-term loans receivable 22 4,141 4,141 0 0.0 4,167Deferred taxes 23 35,900 33,801 (2,099) (5.8) 37,776Other 24 28,975 28,490 (486) (1.7) 31,297Allowance for doubtful receivables 25 (2,114) (2,124) (10) 0.5 (5,677)Investment valuation allowance 26 (34,275) (34,275) - - (30,516)
Total investments and other fixed assets 27 283,785 289,891 6,105 2.2 283,510
Total fixed assets 28 949,727 991,841 42,113 4.4 931,954
Total Assets 29 1,496,657 1,523,358 26,701 1.8 1,377,580
in Japanese yen rounded to millions
Increase/(Decrease)
- 24 -
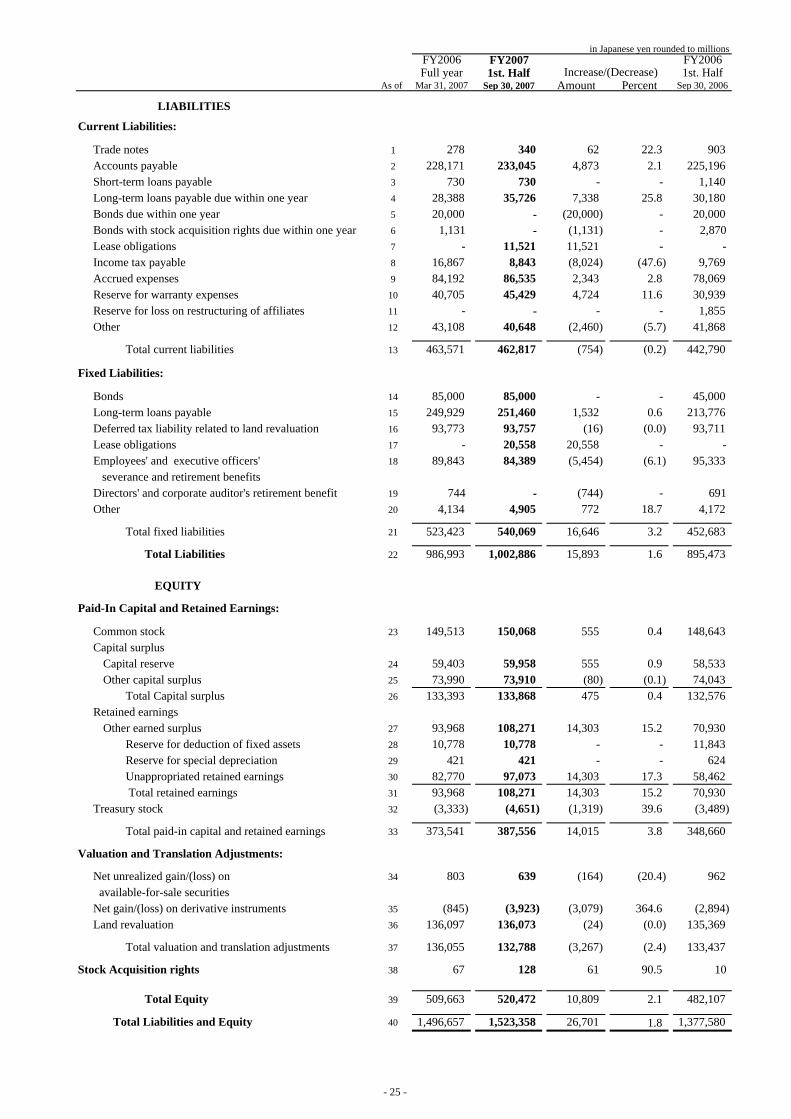
FY2006 FY2007 FY2006Full year 1st. Half 1st. Half
As of Mar 31, 2007 Sep 30, 2007 Amount Percent Sep 30, 2006
LIABILITIES
Current Liabilities:
Trade notes 1 278 340 62 22.3 903Accounts payable 2 228,171 233,045 4,873 2.1 225,196Short-term loans payable 3 730 730 - - 1,140Long-term loans payable due within one year 4 28,388 35,726 7,338 25.8 30,180Bonds due within one year 5 20,000 - (20,000) - 20,000Bonds with stock acquisition rights due within one year 6 1,131 - (1,131) - 2,870 Lease obligations 7 - 11,521 11,521 - - Income tax payable 8 16,867 8,843 (8,024) (47.6) 9,769Accrued expenses 9 84,192 86,535 2,343 2.8 78,069Reserve for warranty expenses 10 40,705 45,429 4,724 11.6 30,939Reserve for loss on restructuring of affiliates 11 - - - - 1,855Other 12 43,108 40,648 (2,460) (5.7) 41,868
Total current liabilities 13 463,571 462,817 (754) (0.2) 442,790
Fixed Liabilities:
Bonds 14 85,000 85,000 - - 45,000Long-term loans payable 15 249,929 251,460 1,532 0.6 213,776Deferred tax liability related to land revaluation 16 93,773 93,757 (16) (0.0) 93,711Lease obligations 17 - 20,558 20,558 - - Employees' and executive officers' 18 89,843 84,389 (5,454) (6.1) 95,333 severance and retirement benefitsDirectors' and corporate auditor's retirement benefit 19 744 - (744) - 691 Other 20 4,134 4,905 772 18.7 4,172
Total fixed liabilities 21 523,423 540,069 16,646 3.2 452,683
Total Liabilities 22 986,993 1,002,886 15,893 1.6 895,473
EQUITY
Paid-In Capital and Retained Earnings:
Common stock 23 149,513 150,068 555 0.4 148,643Capital surplus
Capital reserve 24 59,403 59,958 555 0.9 58,533Other capital surplus 25 73,990 73,910 (80) (0.1) 74,043
Total Capital surplus 26 133,393 133,868 475 0.4 132,576Retained earnings
Other earned surplus 27 93,968 108,271 14,303 15.2 70,930Reserve for deduction of fixed assets 28 10,778 10,778 - - 11,843Reserve for special depreciation 29 421 421 - - 624Unappropriated retained earnings 30 82,770 97,073 14,303 17.3 58,462 Total retained earnings 31 93,968 108,271 14,303 15.2 70,930
Treasury stock 32 (3,333) (4,651) (1,319) 39.6 (3,489)
Total paid-in capital and retained earnings 33 373,541 387,556 14,015 3.8 348,660
Valuation and Translation Adjustments:
Net unrealized gain/(loss) on 34 803 639 (164) (20.4) 962 available-for-sale securitiesNet gain/(loss) on derivative instruments 35 (845) (3,923) (3,079) 364.6 (2,894)Land revaluation 36 136,097 136,073 (24) (0.0) 135,369
Total valuation and translation adjustments 37 136,055 132,788 (3,267) (2.4) 133,437
Stock Acquisition rights 38 67 128 61 90.5 10
Total Equity 39 509,663 520,472 10,809 2.1 482,107
Total Liabilities and Equity 40 1,496,657 1,523,358 26,701 1.8 1,377,580
in Japanese yen rounded to millions
Increase/(Decrease)
- 25 -
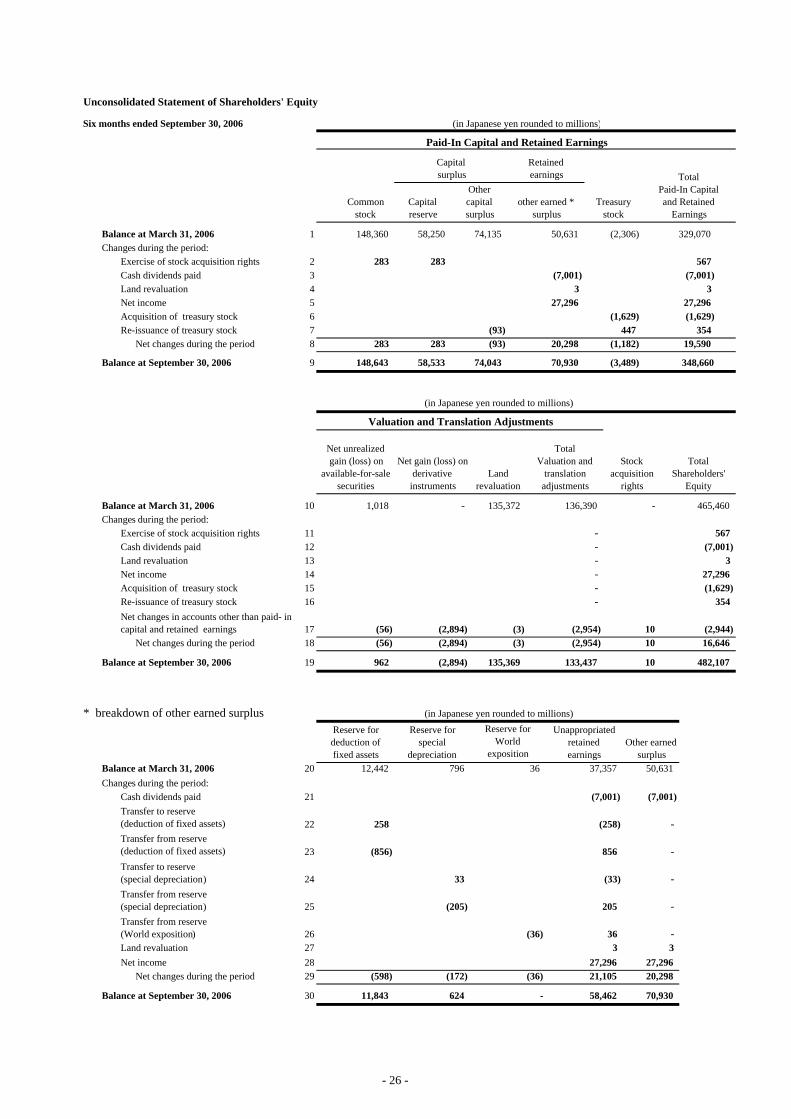
Six months ended September 30, 2006
Balance at March 31, 2006 1Changes during the period:
Exercise of stock acquisition rights 234 3 35678
Balance at September 30, 2006 9
Balance at March 31, 2006 10 - - Changes during the period:
Exercise of stock acquisition rights 11 - 12 - 13 - 14 - 15 - 16 -
1718
Balance at September 30, 2006 19
Balance at March 31, 2006 20Changes during the period:
21
22 -
23 -
24 -
25 -
26 - 27 32829
Balance at September 30, 2006 30
27,29621,105
58,462
(36)
(36)
-
(7,001)
27,29620,298
70,930
(33)
205
363Land revaluation
258
11,843
33
(205)
(172)
624
50,631
Net income Net changes during the period
12,442 796
(856)
(598)
Transfer to reserve(special depreciation)Transfer from reserve(special depreciation)Transfer from reserve(World exposition)
Cash dividends paidTransfer to reserve(deduction of fixed assets)Transfer from reserve(deduction of fixed assets)
Unappropriatedretainedearnings
36 37,357
(7,001)
(258)
856
10
Reserve fordeduction offixed assets
Reserve forspecial
depreciation
Reserve forWorld
exposition
962 (2,894) 135,369
Other earnedsurplus
133,437
* breakdown of other earned surplus
Net changes during the period
1,018
(3)(2,894)(56)(56)
(3,489) 348,660148,643 58,533 74,043 70,930
(1,629)
(1,182) 19,590
(7,001)
447 354Re-issuance of treasury stock
Cash dividends paidLand revaluation
Net changes during the period
(2,306) 329,070
Net incomeAcquisition of treasury stock
283 283 567
27,296 27,296(1,629)
TotalPaid-In Capitaland Retained
Earnings
Capitalsurplus
Retainedearnings
Capitalreserve
(7,001)
(93)283 283 (93) 20,298
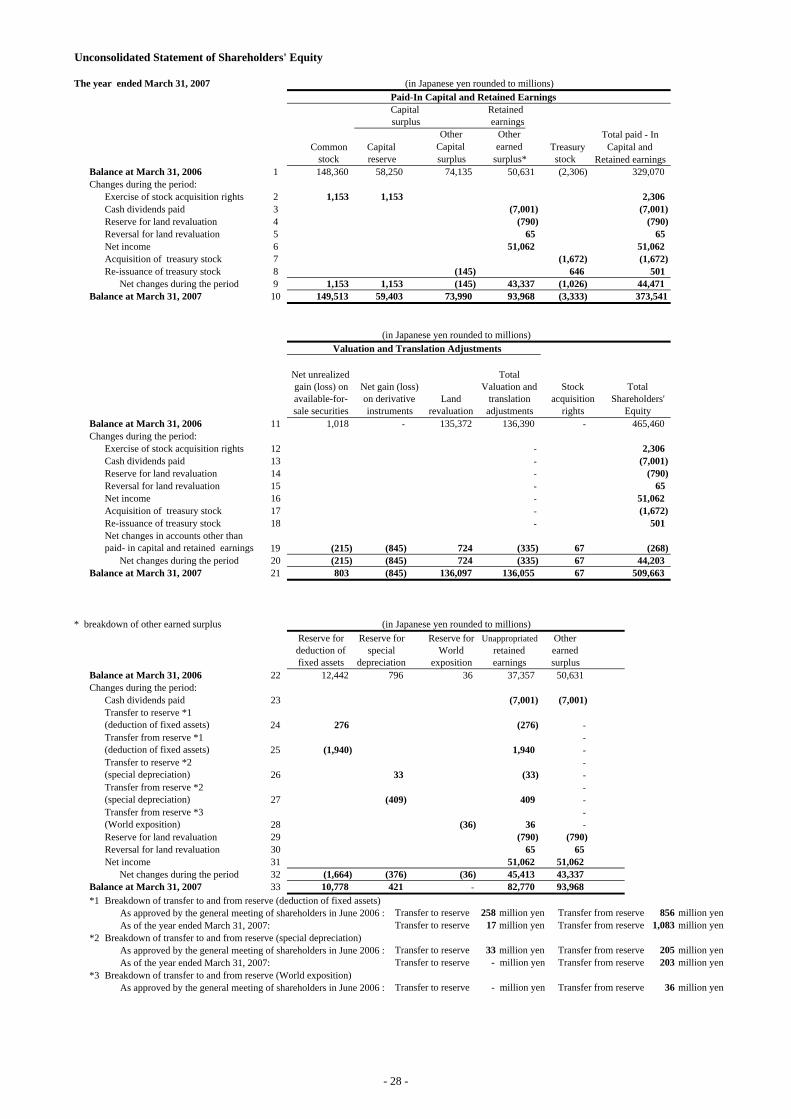
Unconsolidated Statement of Shareholders' Equity
148,360
Paid-In Capital and Retained Earnings
58,250
Othercapitalsurplus
other earned *surplus
74,135 50,631
Commonstock
Treasurystock
(in Japanese yen rounded to millions)
(in Japanese yen rounded to millions)
(in Japanese yen rounded to millions)
Re-issuance of treasury stock
Cash dividends paidLand revaluationNet income
Net gain (loss) onderivative
instrumentsLand
revaluation
Acquisition of treasury stock27,296(1,629)
354Net changes in accounts other than paid- incapital and retained earnings (2,894) (3) (2,954)
TotalShareholders'
Equity
465,460
(7,001)3
567
Valuation and Translation Adjustments
1010
TotalValuation and
translationadjustments
Stockacquisition
rights
Net unrealizedgain (loss) on
available-for-salesecurities
136,390
(2,954)
135,372
(2,944)16,646
482,107
- 26 -
Balance at March 31, 2007 1Changes during the period:
Exercise of stock acquisition right 234 245678
Balance at September 30, 2007 9
Balance at March 31, 2007 10Changes during the period:
Exercise of stock acquisition right 11 - 12 - 13 - 14 - 15 - 16 -
1718
Balance at September 30, 2007 19
Balance at March 31, 2007 20Changes during the period:
21222324 - -
Balance at September 30, 2007 25
(3,206)10,809
520,472
Valuation and Translation Adjustments
67
6161
TotalValuation and
translationadjustments
Stockacquisition
rights
Net unrealizedgain (loss) on
available-for-salesecurities
136,055
(3,267)
TotalShareholders'
Equity
509,663
(8,442)24
1,111
22,721(1,673)
274Net changes in accounts other than paid- incapital and retained earnings (3,079) (24) (3,267)
(in Japanese yen rounded to millions
(in Japanese yen rounded to millions)
(in Japanese yen rounded to millions)
Re-issuance of treasury stock
Cash dividends paidLand revaluationNet income
Net gain (loss) onderivative
instrumentsLand
revaluation
Acquisition of treasury stock
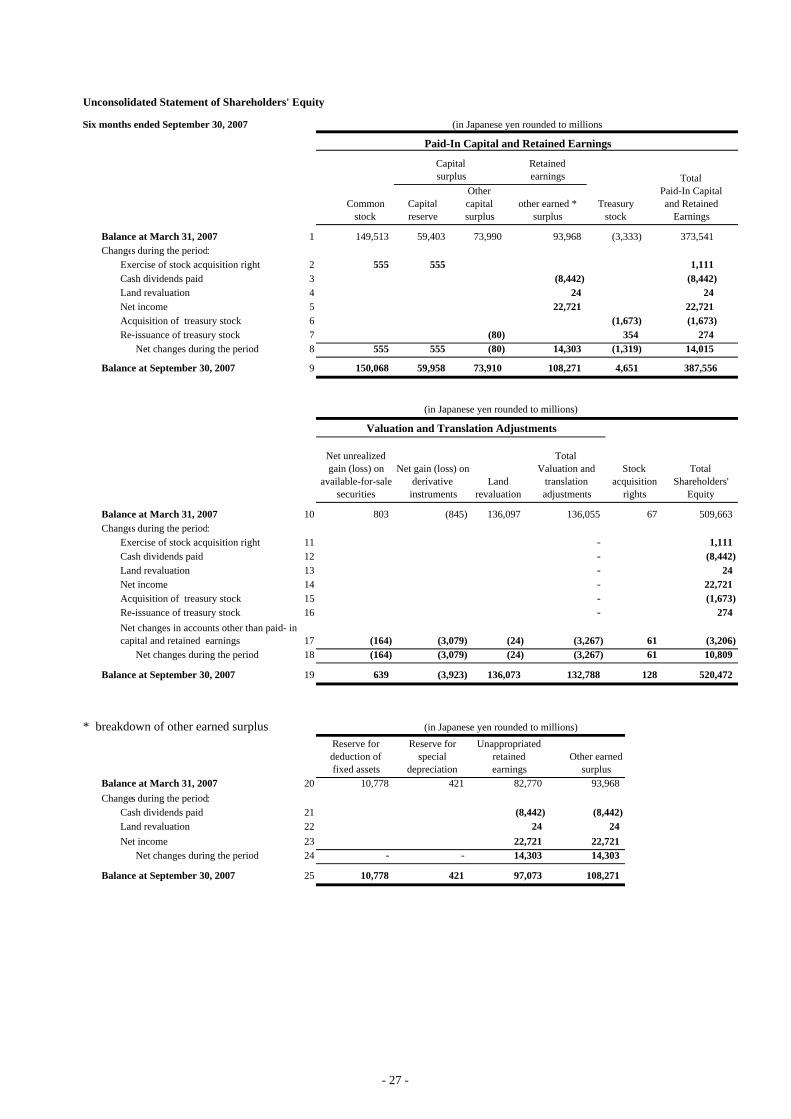
Unconsolidated Statement of Shareholders' Equity
Six months ended September 30, 2007
149,513
Paid-In Capital and Retained Earnings
59,403
Othercapitalsurplus
other earned *surplus
73,990 93,968
Commonstock
(8,442)
(80)555 555 (80) 14,303
Treasurystock
TotalPaid-In Capitaland Retained
Earnings
Capitalsurplus
Retainedearnings
Capitalreserve
(3,333) 373,541
Net incomeAcquisition of treasury stock
555 555 1,111
22,721 22,721(1,673)
Re-issuance of treasury stock
Cash dividends paidLand revaluation
Net changes during the period
(1,673)
(1,319) 14,015
(8,442)
354 274
24
4,651 387,556150,068 59,958 73,910 108,271
Net changes during the period
803 (845) 136,097
(24)(3,079)(164)(164)
128
Reserve fordeduction offixed assets
Reserve forspecial
depreciation
Unappropriatedretainedearnings
639 (3,923) 136,073 132,788
Other earnedsurplus
(8,442)Cash dividends paid
82,770
Land revaluation
93,968
(8,442)
421
10,778 421
2422,721
97,073
2422,72114,303
108,271
* breakdown of other earned surplus
14,303Net income Net changes during the period
10,778
- 27 -
Balance at March 31, 2006 1Changes during the period:
Exercise of stock acquisition rights 23456789
Balance at March 31, 2007 10
Balance at March 31, 2006 11 - - Changes during the period:
Exercise of stock acquisition rights 12 - 13 - 14 - 15 - 16 - 17 - 18 -
1920
Balance at March 31, 2007 21
Balance at March 31, 2006 22Changes during the period:
23
24 - -
25 - -
26 - -
27 - -
28 - 29303132
Balance at March 31, 2007 33 - *1 Breakdown of transfer to and from reserve (deduction of fixed assets)
As approved by the general meeting of shareholders in June 2006 :As of the year ended March 31, 2007:
*2 Breakdown of transfer to and from reserve (special depreciation)As approved by the general meeting of shareholders in June 2006 :As of the year ended March 31, 2007:
*3 Breakdown of transfer to and from reserve (World exposition)As approved by the general meeting of shareholders in June 2006 :
(1,672)
TotalShareholders'
Equity136,390
50144,471
646(1,026)
93,968
329,070
2,306(7,001)
(790)65
51,062(1,672)
(268)44,203
43,337
(790)65
51,06245,413
65
82,770
676767
Otherearnedsurplus
50,631
51,062
409
36(790)
1,018 135,372
276
421
Reserve forWorld
exposition36
(36)
(36)
796
33
59,403
(in Japanese yen rounded to millions)
Net unrealizedgain (loss) onavailable-for-sale securities
Net gain (loss)on derivativeinstruments
Landrevaluation
Stockacquisition
rights
(3,333) 373,541
The year ended March 31, 2007
Valuation and Translation Adjustments
TotalValuation and
translationadjustments
(845)
Net changes in accounts other thanpaid- in capital and retained earnings 724
Retainedearnings
1,153 1,153
Total paid - In
surplus Treasury
stock74,135 50,631
Other
1,1531,153
Unconsolidated Statement of Shareholders' Equity
148,360
Paid-In Capital and Retained Earnings
58,250
Commonstock
OtherCapital
Capitalsurplus
Capitalreserve
(in Japanese yen rounded to millions)
Cash dividends paid
Reversal for land revaluation
Net changes during the period
Reserve for land revaluation
Net incomeAcquisition of treasury stockRe-issuance of treasury stock
Reserve for land revaluation
724(215)
Net incomeReversal for land revaluation
Acquisition of treasury stock
(845)(845)
(215)
Net income
Transfer from reserve *3(World exposition)
Reversal for land revaluation
Cash dividends paidTransfer to reserve *1(deduction of fixed assets)Transfer from reserve *1(deduction of fixed assets)
Net changes during the period
Reserve for land revaluation
(335)
37,357
(7,001)
(276)
1,940
(33)Transfer to reserve *2(special depreciation)Transfer from reserve *2(special depreciation)
803
(in Japanese yen rounded to millions)
Net changes during the period509,663
Transfer to reserve 258 million yen Transfer from reserve 856 million yenTransfer to reserve 17 million yen Transfer from reserve 1,083 million yen
(7,001)
10,778(1,664)
Unappropriatedretainedearnings
(1,940)
12,442
Reserve forspecial
depreciation
Reserve fordeduction offixed assets
(409)
(376)
Transfer to reserve - million yen Transfer from reserve 36 million yen
Retained earningsCapital and
Transfer to reserve - million yenTransfer to reserve 33 million yen Transfer from reserve 205 million yen
Transfer from reserve 203 million yen
(335)
136,055
(1,672)501
465,460
2,306(7,001)
(790)65
51,062
earnedsurplus*
43,337
(7,001)(790)
6551,062
(2,306)
(145)(145)
* breakdown of other earned surplus
93,96873,990
136,097
149,513
Re-issuance of treasury stock
Cash dividends paid
- 28 -
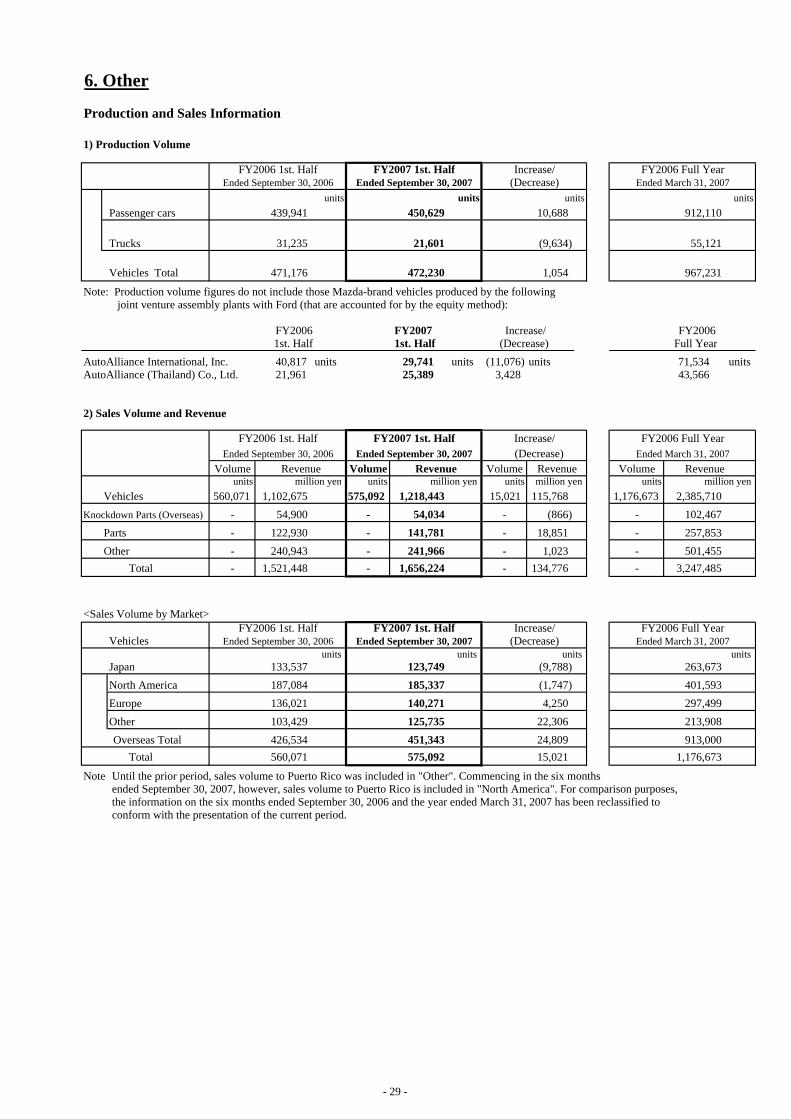
6. Other
Production and Sales Information
1) Production Volume
units units units unitsPassenger cars 439,941 450,629 10,688 912,110
Trucks 31,235 21,601 (9,634) 55,121
Vehicles Total 471,176 472,230 1,054 967,231
Note: Production volume figures do not include those Mazda-brand vehicles produced by the following joint venture assembly plants with Ford (that are accounted for by the equity method):
FY2006 FY2007 Increase/ FY2006 1st. Half 1st. Half (Decrease) Full Year
AutoAlliance International, Inc. 40,817 units 29,741 units (11,076) units 71,534 unitsAutoAlliance (Thailand) Co., Ltd. 21,961 25,389 3,428 43,566
2) Sales Volume and Revenue
Volume Volume Volume Volume Revenueunits units million yen units million yen units million yen
560,071 1,102,675 575,092 1,218,443 15,021 115,768 1,176,673 2,385,710- 54,900 - 54,034 - (866) - 102,467- 122,930 - 141,781 - 18,851 - 257,853- 240,943 - 241,966 - 1,023 - 501,455
Total - 1,521,448 - 1,656,224 - 134,776 - 3,247,485
<Sales Volume by Market>
units units units unitsJapan 133,537 123,749 (9,788) 263,673 North America 187,084 185,337 (1,747) 401,593 Europe 136,021 140,271 4,250 297,499 Other 103,429 125,735 22,306 213,908 Overseas Total 426,534 451,343 24,809 913,000
Total 560,071 575,092 15,021 1,176,673
Note: Until the prior period, sales volume to Puerto Rico was included in "Other". Commencing in the six months ended September 30, 2007, however, sales volume to Puerto Rico is included in "North America". For comparison purposes, the information on the six months ended September 30, 2006 and the year ended March 31, 2007 has been reclassified to conform with the presentation of the current period.
FY2006 Full YearEnded March 31, 2007
FY2006 Full YearEnded March 31, 2007
FY2006 Full YearEnded March 31, 2007
Ended September 30, 2007 (Decrease)FY2006 1st. Half FY2007 1st. Half Increase/
Ended September 30, 2006 Ended September 30, 2007 (Decrease)FY2006 1st. Half FY2007 1st. Half Increase/
Ended September 30, 2006 Ended September 30, 2007 (Decrease)FY2006 1st. Half FY2007 1st. Half Increase/
Vehicles
Revenue Revenue Revenuemillion yen
VehiclesKnockdown Parts (Overseas)
PartsOther
Ended September 30, 2006
- 29 -
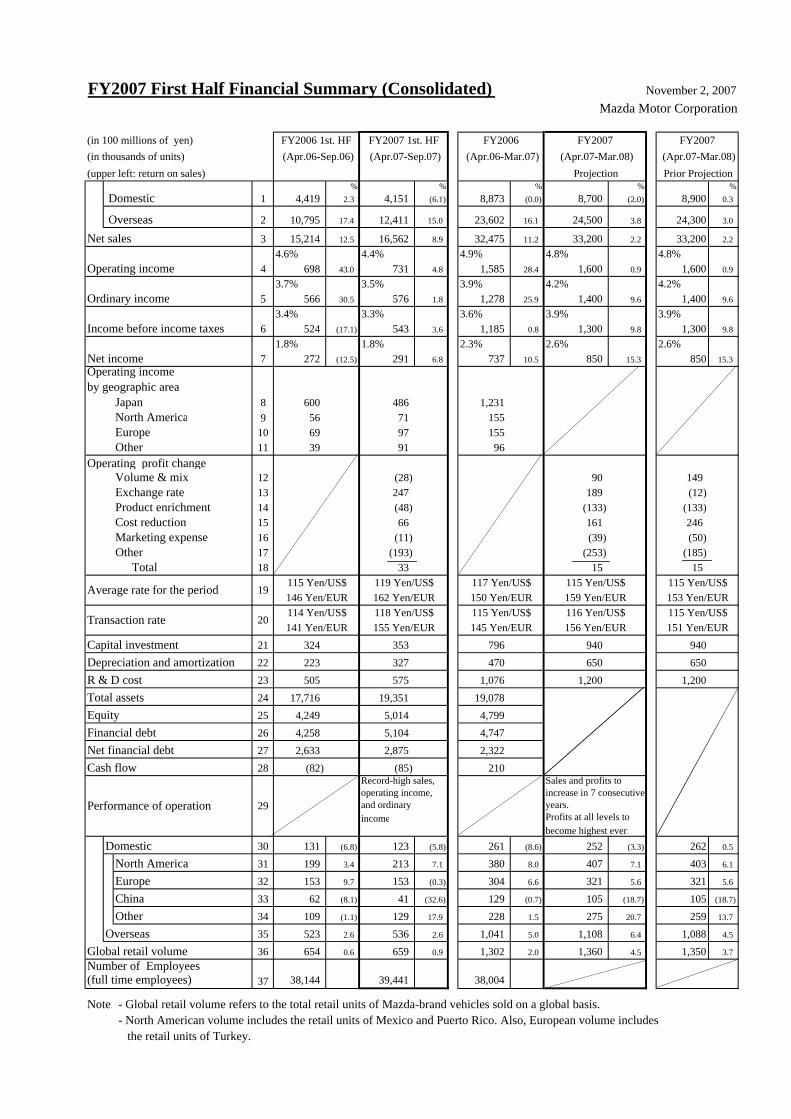
FY2007 First Half Financial Summary (Consolidated) November 2, 2007Mazda Motor Corporation
(in 100 millions of yen)(in thousands of units)(upper left: return on sales)
% % % % % Domestic 1 4,419 2.3 4,151 (6.1) 8,873 (0.0) 8,700 (2.0) 8,900 0.3
Overseas 2 10,795 17.4 12,411 15.0 23,602 16.1 24,500 3.8 24,300 3.0
Net sales 3 15,214 12.5 16,562 8.9 32,475 11.2 33,200 2.2 33,200 2.2
4.6% 4.4% 4.9% 4.8% 4.8%Operating income 4 698 43.0 731 4.8 1,585 28.4 1,600 0.9 1,600 0.9
3.7% 3.5% 3.9% 4.2% 4.2%Ordinary income 5 566 30.5 576 1.8 1,278 25.9 1,400 9.6 1,400 9.6
3.4% 3.3% 3.6% 3.9% 3.9%Income before income taxes 6 524 (17.1) 543 3.6 1,185 0.8 1,300 9.8 1,300 9.8
1.8% 1.8% 2.3% 2.6% 2.6%Net income 7 272 (12.5) 291 6.8 737 10.5 850 15.3 850 15.3
Japan 8 600 486 1,231North America 9 56 71 155Europe 10 69 97 155Other 11 39 91 96
Operating profit changeVolume & mix 12 (28) 90 149Exchange rate 13 247 189 (12)Product enrichment 14 (48) (133) (133)Cost reduction 15 66 161 246Marketing expense 16 (11) (39) (50)Other 17 (193) (253) (185)
Total 18 33 15 15
Capital investment 21 324 353 796 940 940Depreciation and amortization 22 223 327 470 650 650R & D cost 23 505 575 1,076 1,200 1,200Total assets 24 17,716 19,351 19,078Equity 25 4,249 5,014 4,799Financial debt 26 4,258 5,104 4,747Net financial debt 27 2,633 2,875 2,322Cash flow 28 (82) (85) 210
Record-high sales, Sales and profits to operating income, increase in 7 consecutiveand ordinary years.income Profits at all levels to
become highest ever.Domestic 30 131 (6.8) 123 (5.8) 261 (8.6) 252 (3.3) 262 0.5
North America 31 199 3.4 213 7.1 380 8.0 407 7.1 403 6.1
Europe 32 153 9.7 153 (0.3) 304 6.6 321 5.6 321 5.6
China 33 62 (8.1) 41 (32.6) 129 (0.7) 105 (18.7) 105 (18.7)
Other 34 109 (1.1) 129 17.9 228 1.5 275 20.7 259 13.7
Overseas 35 523 2.6 536 2.6 1,041 5.0 1,108 6.4 1,088 4.5
Global retail volume 36 654 0.6 659 0.9 1,302 2.0 1,360 4.5 1,350 3.7
Number of Employees (full time employees) 37 38,144 39,441 38,004
Note: - Global retail volume refers to the total retail units of Mazda-brand vehicles sold on a global basis. - North American volume includes the retail units of Mexico and Puerto Rico. Also, European volume includes the retail units of Turkey.
156 Yen/EUR
FY2007 1st. HF (Apr.07-Sep.07)
118 Yen/US$155 Yen/EUR
119 Yen/US$162 Yen/EUR
145 Yen/EUR116 Yen/US$
20
FY2007
115 Yen/US$151 Yen/EUR
(Apr.07-Mar.08)Prior Projection
115 Yen/US$153 Yen/EUR
FY2006 1st. HF
Performance of operation 29
(Apr.06-Sep.06)
141 Yen/EUR114 Yen/US$
Operating incomeby geographic area
146 Yen/EUR
Transaction rate
Average rate for the period 19115 Yen/US$
FY2007
Projection (Apr.07-Mar.08)
FY2006 (Apr.06-Mar.07)
115 Yen/US$159 Yen/EUR
117 Yen/US$150 Yen/EUR115 Yen/US$
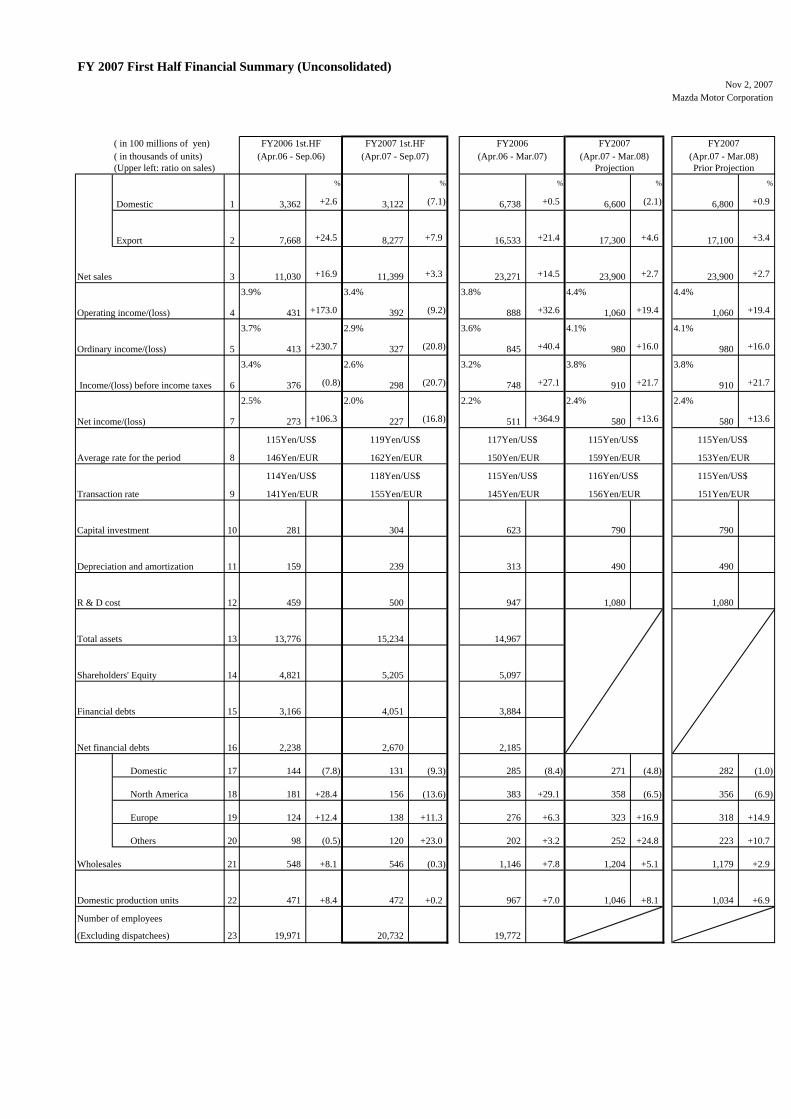
FY 2007 First Half Financial Summary (Unconsolidated)Nov 2, 2007
Mazda Motor Corporation
( in 100 millions of yen) FY2006 FY2007 FY2007( in thousands of units)(Upper left: ratio on sales) Projection
% % % % %
Domestic 1 3,362 +2.6 3,122 (7.1) 6,738 +0.5 6,600 (2.1) 6,800 +0.9
Export 2 7,668 +24.5 8,277 +7.9 16,533 +21.4 17,300 +4.6 17,100 +3.4
Net sales 3 11,030 +16.9 11,399 +3.3 23,271 +14.5 23,900 +2.7 23,900 +2.7
3.9% 3.4% 3.8% 4.4% 4.4%
4 431 +173.0 392 (9.2) 888 +32.6 1,060 +19.4 1,060 +19.4
3.7% 2.9% 3.6% 4.1% 4.1%
5 413 +230.7 327 (20.8) 845 +40.4 980 +16.0 980 +16.0
3.4% 2.6% 3.2% 3.8% 3.8%
6 376 (0.8) 298 (20.7) 748 +27.1 910 +21.7 910 +21.7
2.5% 2.0% 2.2% 2.4% 2.4%
Net income/(loss) 7 273 +106.3 227 (16.8) 511 +364.9 580 +13.6 580 +13.6
115Yen/US$ 119Yen/US$ 117Yen/US$ 115Yen/US$ 115Yen/US$
8 146Yen/EUR 162Yen/EUR 150Yen/EUR 159Yen/EUR 153Yen/EUR
114Yen/US$ 118Yen/US$ 115Yen/US$ 116Yen/US$ 115Yen/US$
9 141Yen/EUR 155Yen/EUR 145Yen/EUR 156Yen/EUR 151Yen/EUR
Capital investment 10 281 304 623 790 790
Depreciation and amortization 11 159 239 313 490 490
R & D cost 12 459 500 947 1,080 1,080
Total assets 13 13,776 15,234 14,967
Shareholders' Equity 14 4,821 5,205 5,097
Financial debts 15 3,166 4,051 3,884
Net financial debts 16 2,238 2,670 2,185
Domestic 17 144 (7.8) 131 (9.3) 285 (8.4) 271 (4.8) 282 (1.0)
North America 18 181 +28.4 156 (13.6) 383 +29.1 358 (6.5) 356 (6.9)
Europe 19 124 +12.4 138 +11.3 276 +6.3 323 +16.9 318 +14.9
Others 20 98 (0.5) 120 +23.0 202 +3.2 252 +24.8 223 +10.7
Wholesales 21 548 +8.1 546 (0.3) 1,146 +7.8 1,204 +5.1 1,179 +2.9
Domestic production units 22 471 +8.4 472 +0.2 967 +7.0 1,046 +8.1 1,034 +6.9
Number of employees
(Excluding dispatchees) 23 19,971 20,732 19,772
(Apr.07 - Mar.08)Prior Projection
Operating income/(loss)
Ordinary income/(loss)
Income/(loss) before income taxes
FY2006 1st.HF FY2007 1st.HF
Average rate for the period
Transaction rate
(Apr.06 - Mar.07) (Apr.07 - Mar.08)(Apr.06 - Sep.06) (Apr.07 - Sep.07)