Embed Size (px)
Citation preview
MBA CAREER SERVICES
& EMPLOYER ALLIANCE
STANDARDS FOR REPORTING
FULL-TIME MBA
EMPLOYMENT STATISTICS©
Edition VI, Adopted May, 2017

© 2017 MBA Career Services and Employer Alliance (MBACSEA). All rights reserved. Infringing use or
adaptation of these standards or any MBACSEA trademarks is prohibited except by authorized licensees of
MBACSEA.
MBA CSEA Standards for Reporting
Full-Time MBA Employment Statistics©
Page | 1
TABLE OF CONTENTS
PURPOSE AND USE OF STANDARDS; MISSION STATEMENT 2
REPORTING STANDARDS
A ACCOUNT FOR ALL GRADUATES 4
Table 1.A – The Graduating Class 5
B. DATA COLLECTION AND TIMING 7
C. OFFERS 9
Table 2.A – Timing of First Job Offers 10
D. ACCEPTANCES 11
Table 2.B – Timing of Job Acceptances 11
E. PRIMARY SOURCE OF FULL-TIME JOB ACCEPTANCES 12
Table 3.A – Primary Source of Job Acceptances 13
F. SALARY AND COMPENSATION DATA 13
Table 4.A – Compensation Report 15
Table 4.B – Compensation by Professional Function 17
Table 4.C – Compensation by Industry 19
Table 4.D – Compensation by World Region 21
Table 4.E – Compensation by Region: Africa 21
Table 4.F – Compensation by Region: Asia 22
Table 4.G – Compensation by Region: Europe 22
Table 4.H – Compensation by Region: Latin America and Caribbean 23
Table 4.I – Compensation by Region: North America 23
Table 4.J – Compensation by Region: Oceania 24
Table 4.K – Compensation by Undergraduate Major 25
Table 4.L – Compensation by Professional Experience 26
G. GENDER, RACE AND NATIONAL ORIGIN 26
H. FOOTNOTES AND COMPLIANCE STATEMENT 26
APPENDICES 29
I. GEOGRAPHIC REGIONS 30
II. RESCINDED AND WITHDRAWN OFFERS 33
III. STANDARDS HISTORY 35
MBA CSEA Standards for Reporting
Full-Time MBA Employment Statistics©
Page | 2
MBA CAREER SERVICES & EMPLOYER ALLIANCE
STANDARDS FOR REPORTING
FULL-TIME MBA EMPLOYMENT STATISTICS©
THE PURPOSE AND USE OF STANDARDS FOR REPORTING MBA EMPLOYMENT STATISTICS©
In 1994, MBA career services professionals from around the United States met and expressed their frustration
and dissatisfaction with the lack of agreed upon and accepted reporting standards for MBA employment data.
They expressed the perception that (a) many MBA employment reports were generated primarily as marketing
devices to attract students and employers and to attain media-generated rankings, (b) employment reports did
not reflect an accurate representation of graduates’ performance in the job market, (c) salary statistics were
inflated by inclusion and/or exclusion of certain populations, and (d) prospective students and employers had no
valid way of comparing schools one to another. To address these concerns, the MBA Career Services &
Employer Alliance (formerly MBA Career Services Council) developed the Standards for Reporting
Employment Statistics© (Standards). Since the development of the Standards, it has continued to be a priority
for the Board of Directors to address the need to improve the reliability, usefulness, accuracy and comparability
of reported MBA employment data.
In January 2005, the MBA Career Services & Employer Alliance and the Graduate Management Admission
Council® (GMAC)® announced to our membership the terms of a strategic partnership to collect and audit
employment data. With this agreement, MBA CSEA took the biggest step since the Standards were finalized in
1996, to provide reliable, useful, accurate and comparable employment data on our industry. When GMAC®
elected to withdraw from the employment data audit partnership in 2012, the MBA Career Services & Employer
Alliance decided to continue with the program independently. In summary, Standards Compliance Reviews
(formerly known as reviews of Agreed Upon Procedures) help MBA CSEA to increase the use and knowledge
of our Standards and improve interpretation by a diverse audience.
The following tables are required in order to be compliant with the MBA CSEA Standards:
Table 1.A The Full-Time Graduating Class
Table 2.A Timing of First Job Offers
Table 2.B Timing of Job Acceptances
Table 3.A Primary Source of Full-Time Job Acceptances
Table 4.A Compensation Report
Table 4.B Compensation by Professional Functions
Table 4.C Compensation by Industries
Table 4.D World Region Breakdown
One table for your own region from tables 4.E - 4.J
These Standards do not preclude schools from collecting other employment data as deemed necessary for
internal or external marketing purposes. Schools are strongly discouraged from reporting additional information
for purposes of media surveys.
MBA CSEA Standards for Reporting
Full-Time MBA Employment Statistics©
Page | 3
STANDARDS COMMITTEE MISSION STATEMENT
The MBA Employment Standards Committee was formed to develop reporting Standards appropriate for the
MBA career services profession.
These Standards are to be used primarily as internal (to our industry) benchmarking indices to support our
profession. The Standards will reflect the reporting categories as developed by the Committee and approved by
the MBA Career Services & Employer Alliance Board of Directors.
MBA CSEA Standards for Reporting
Full-Time MBA Employment Statistics©
Page | 4
MBA CAREER SERVICES & EMPLOYER ALLIANCE
STANDARDS FOR REPORTING
FULL-TIME MBA EMPLOYMENT STATISTICS©
A. ACCOUNT FOR ALL GRADUATES (TABLE 1.A)
1. All MBA graduates (excluding Executive MBA graduates) should be accounted for in either the
Full-Time or Part-Time Standards to satisfy the concept of full disclosure. The remainder of
this document outlines Standards for Full-Time MBA reporting.
2. The total Full-Time graduating class is defined as all MBA students graduating during the 12
months ending June 30th. This provision is especially important for those schools with multiple
graduation dates, as the Standards reporting time frame may differ from an individual school’s
reporting year. While MBA graduates may have moved between programs during their tenure at
a university, for reporting purposes, MBA graduates should be counted and reported as Full-
Time or Part-Time according to their status as designated by the university registrar at the time
of each graduate’s completion of degree requirements (graduation).
3. Employment statistics should focus on Full-Time MBA graduates within three major categories:
1) Permanent Work Authorization, 2) Non-Permanent Work Authorization, and 3) all MBA
graduates, with a footnote defining Permanent Work Authorization.
Example: Work Authorization Definition For a school in the United States with a full-time program graduating MBA students, the footnote
would read: Permanent Work Authorization is defined as US Citizens and Permanent Residents.
Likewise, a school in France would have a footnote reading: Permanent Work Authorization is
defined as French and European Union Citizens.
4. The MBA Career Services & Employer Alliance’s minimum target for “the percent of total
graduates for whom your school has information” is 85 percent. This includes graduates for
whom you have reliable employment information from any source. The equation is: number of
graduates for whom you have information / total graduates in the graduating class, i.e., the
number in the lower right-hand corner of Table (1) = percent of graduates for whom you have
information.
5. When the Standards were developed, reviewed, and approved, there was agreement that the
MBA CSEA wanted to measure the “employment process experience” of MBA students.
Therefore, categorize the graduating class into three major designations:
i. Seeking Employment (as defined in the Instructions for Table 1.A)
ii. Not Seeking Employment (as defined in the Instructions for Table 1.A) should be
categorized in the following designations:
1. Company-Sponsored or Already Employed
2. Continuing Education
3. Postponing Job Search
4. Starting a New Business as Owner/Founder
MBA CSEA Standards for Reporting
Full-Time MBA Employment Statistics©
Page | 5
5. Not Seeking for Other Reasons
iii. No Recent Information (as defined in the Instructions for Table 1.A)
6. For any individual student whose status changes between the above categories over the time in
the MBA program and in the three months following, it is the status three months after
graduation that governs the status at all measurement points. Therefore, a student’s status at
graduation may change after graduation. Refer to Section B for additional information.
7. Career Services Directors are charged with exercising professional judgment in making
determinations about the usefulness of all information used in compiling an MBA Employment
Report. Appropriate backup notes are required when making professional judgment calls.
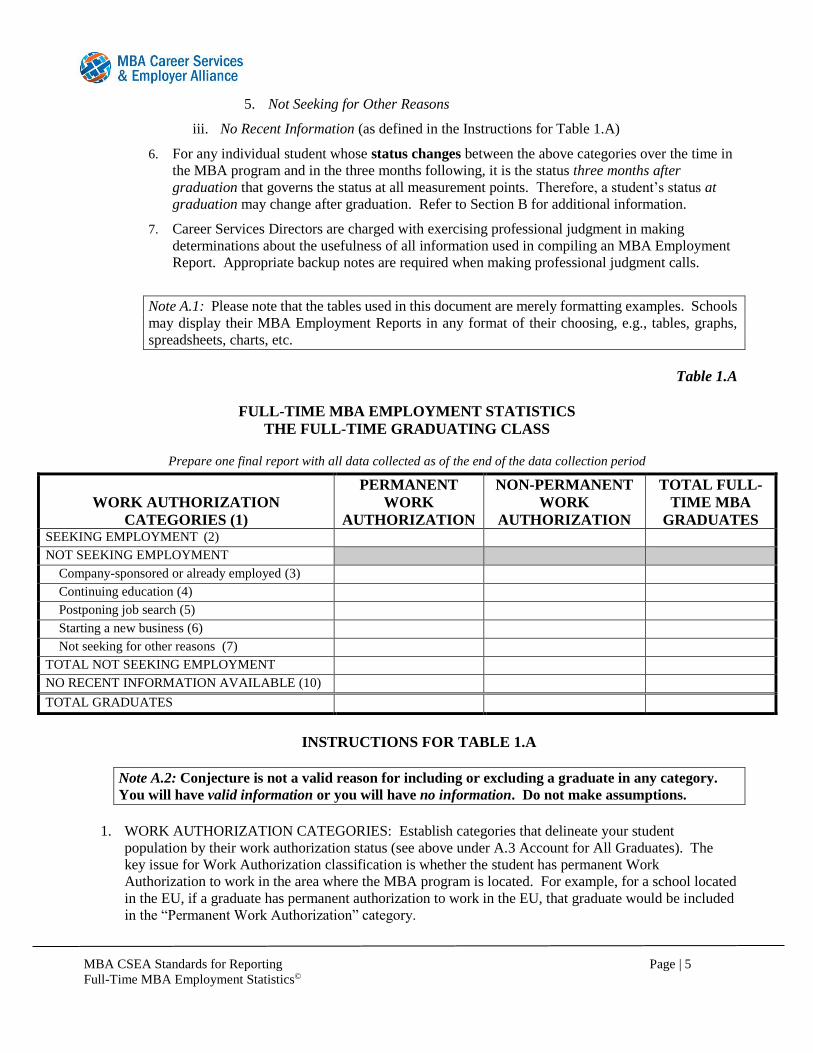
Note A.1: Please note that the tables used in this document are merely formatting examples. Schools
may display their MBA Employment Reports in any format of their choosing, e.g., tables, graphs,
spreadsheets, charts, etc.
Table 1.A
FULL-TIME MBA EMPLOYMENT STATISTICS
THE FULL-TIME GRADUATING CLASS
Prepare one final report with all data collected as of the end of the data collection period
WORK AUTHORIZATION
CATEGORIES (1)
PERMANENT
WORK
AUTHORIZATION
NON-PERMANENT
WORK
AUTHORIZATION
TOTAL FULL-
TIME MBA
GRADUATES SEEKING EMPLOYMENT (2) NOT SEEKING EMPLOYMENT Company-sponsored or already employed (3) Continuing education (4) Postponing job search (5) Starting a new business (6) Not seeking for other reasons (7) TOTAL NOT SEEKING EMPLOYMENT NO RECENT INFORMATION AVAILABLE (10)
TOTAL GRADUATES
INSTRUCTIONS FOR TABLE 1.A
Note A.2: Conjecture is not a valid reason for including or excluding a graduate in any category.
You will have valid information or you will have no information. Do not make assumptions.
1. WORK AUTHORIZATION CATEGORIES: Establish categories that delineate your student
population by their work authorization status (see above under A.3 Account for All Graduates). The
key issue for Work Authorization classification is whether the student has permanent Work
Authorization to work in the area where the MBA program is located. For example, for a school located
in the EU, if a graduate has permanent authorization to work in the EU, that graduate would be included
in the “Permanent Work Authorization” category.

MBA CSEA Standards for Reporting
Full-Time MBA Employment Statistics©
Page | 6
2. SEEKING EMPLOYMENT: This category is defined as graduates reporting seeking full-time
professional MBA-level employment. This includes those graduates seeking and/or accepting a position
with a start-up company.
Note A.3: When preparing the MBA Employment Report, career services staff are expected to use their
best professional judgment when making a determination that a graduate’s job is a professional MBA-
level employment. Title and salary level alone are not the determining factors in making a judgment call
on whether a job is MBA-level. If the graduate believes the job is MBA-level and his/her job
performance will be enhanced by an MBA education, then the job is MBA-level. When making judgment
calls, MBA career center staff should document the reasons carefully and be consistent.
3. COMPANY-SPONSORED or ALREADY EMPLOYED: This category includes those graduates
reporting not seeking employment because they were financially sponsored by an employer during the
MBA and are intending to return to that employer, in a guaranteed position, for which they need not
apply. This category also includes those graduates who were employed while a student and will
continue to work for that employer, even if they were not sponsored for their education.
4. CONTINUING EDUCATION: Enrolled/will enroll in further graduate studies.
Example: Continuing Education: Student X is enrolled as a JD/MBA student. Student X will complete the MBA degree requirements this
year and will graduate from the MBA program. However, Student X has additional degree
requirements for his law degree and will not graduate for another year from the law program.
Therefore, upon MBA graduation this year, Student X should be classified as not seeking and
continuing education.
5. POSTPONING JOB SEARCH: Includes graduates reporting postponing their job search for a specific
reason, e.g., spouse is relocating, taking a long trip before commencing the job search.
Note A.4: A graduate’s lack of effort in the job search does not in itself make them eligible for this
category. Professional judgment may be required, but if a graduate would accept a position (even if they
were not actively searching) within 90 days of graduation then they should be considered seeking.
6. STARTING NEW BUSINESS AS OWNER: These graduates belong in the Not Seeking Employment
category. Do not include graduates in this category who accept jobs with a salary in a new business or a
start-up; those graduates should be in the Seeking Employment category. Two of the Standards’
objectives are to measure the job search performance of your graduates and the effectiveness of the
career services office in assisting their graduates in the employment search. The Standards Committee
fully discussed the pros and cons of this issue and determined that persons starting their own businesses
are not seeking employment in a ‘typical’ job-seeking mode and, therefore, should be included in the
“Not Seeking” category.
7. NOT SEEKING FOR OTHER REASONS: Other reasons as defined and reported by the graduate. This
includes graduates of dual-degree or joint-degree programs who are not seeking MBA-level
employment.
MBA CSEA Standards for Reporting
Full-Time MBA Employment Statistics©
Page | 7
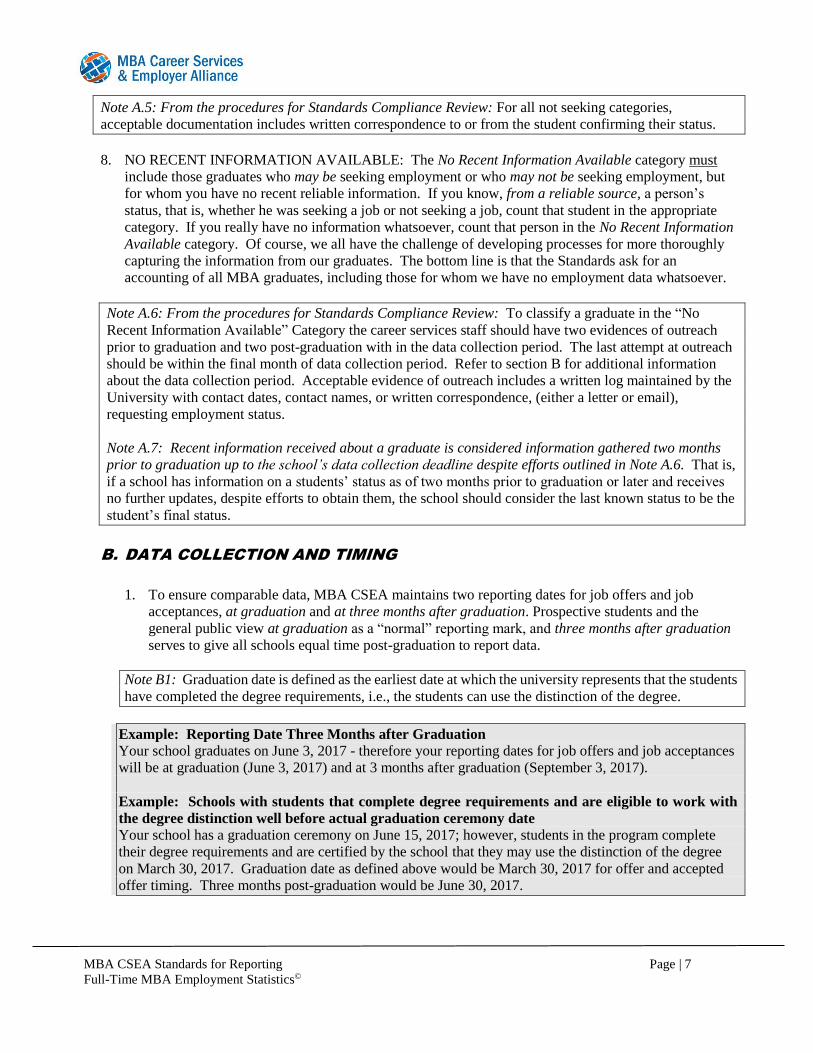
Note A.5: From the procedures for Standards Compliance Review: For all not seeking categories,
acceptable documentation includes written correspondence to or from the student confirming their status.
8. NO RECENT INFORMATION AVAILABLE: The No Recent Information Available category must
include those graduates who may be seeking employment or who may not be seeking employment, but
for whom you have no recent reliable information. If you know, from a reliable source, a person’s
status, that is, whether he was seeking a job or not seeking a job, count that student in the appropriate
category. If you really have no information whatsoever, count that person in the No Recent Information
Available category. Of course, we all have the challenge of developing processes for more thoroughly
capturing the information from our graduates. The bottom line is that the Standards ask for an
accounting of all MBA graduates, including those for whom we have no employment data whatsoever.
Note A.6: From the procedures for Standards Compliance Review: To classify a graduate in the “No
Recent Information Available” Category the career services staff should have two evidences of outreach
prior to graduation and two post-graduation with in the data collection period. The last attempt at outreach
should be within the final month of data collection period. Refer to section B for additional information
about the data collection period. Acceptable evidence of outreach includes a written log maintained by the
University with contact dates, contact names, or written correspondence, (either a letter or email),
requesting employment status.
Note A.7: Recent information received about a graduate is considered information gathered two months
prior to graduation up to the school’s data collection deadline despite efforts outlined in Note A.6. That is,
if a school has information on a students’ status as of two months prior to graduation or later and receives
no further updates, despite efforts to obtain them, the school should consider the last known status to be the
student’s final status.
B. DATA COLLECTION AND TIMING
1. To ensure comparable data, MBA CSEA maintains two reporting dates for job offers and job
acceptances, at graduation and at three months after graduation. Prospective students and the
general public view at graduation as a “normal” reporting mark, and three months after graduation
serves to give all schools equal time post-graduation to report data.
Note B1: Graduation date is defined as the earliest date at which the university represents that the students
have completed the degree requirements, i.e., the students can use the distinction of the degree.
Example: Reporting Date Three Months after Graduation
Your school graduates on June 3, 2017 - therefore your reporting dates for job offers and job acceptances
will be at graduation (June 3, 2017) and at 3 months after graduation (September 3, 2017).
Example: Schools with students that complete degree requirements and are eligible to work with
the degree distinction well before actual graduation ceremony date
Your school has a graduation ceremony on June 15, 2017; however, students in the program complete
their degree requirements and are certified by the school that they may use the distinction of the degree
on March 30, 2017. Graduation date as defined above would be March 30, 2017 for offer and accepted
offer timing. Three months post-graduation would be June 30, 2017.
MBA CSEA Standards for Reporting
Full-Time MBA Employment Statistics©
Page | 8
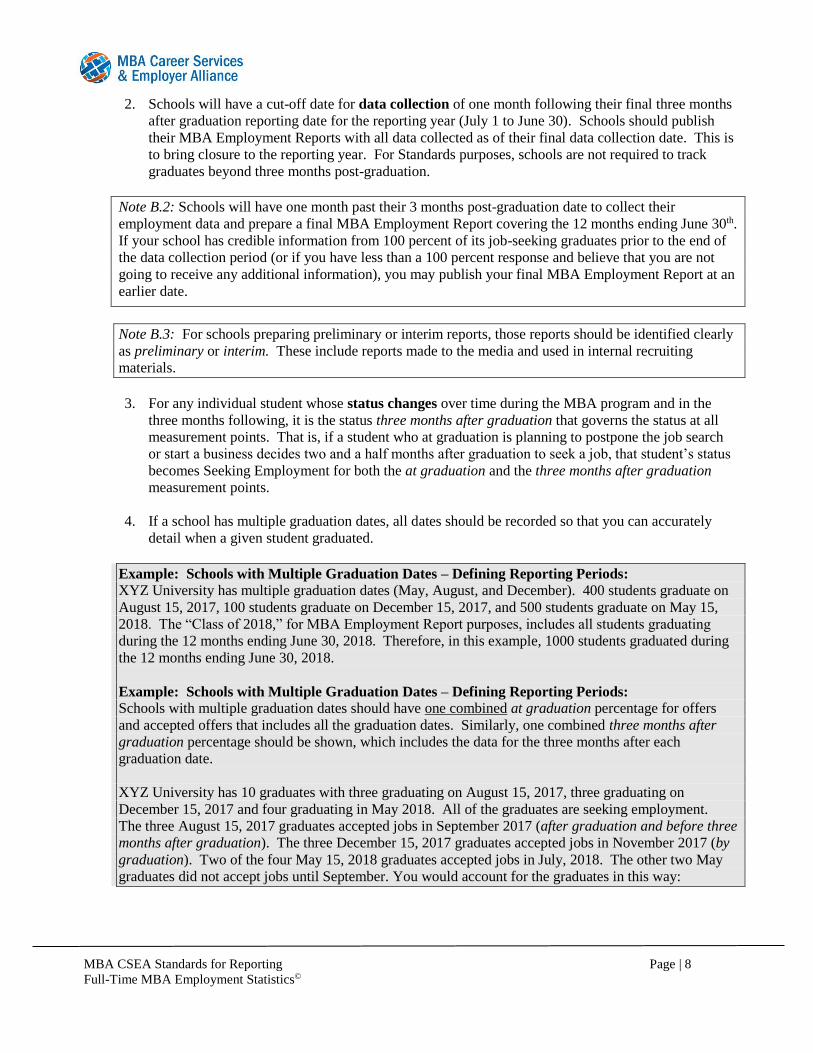
2. Schools will have a cut-off date for data collection of one month following their final three months
after graduation reporting date for the reporting year (July 1 to June 30). Schools should publish
their MBA Employment Reports with all data collected as of their final data collection date. This is
to bring closure to the reporting year. For Standards purposes, schools are not required to track
graduates beyond three months post-graduation.
Note B.2: Schools will have one month past their 3 months post-graduation date to collect their
employment data and prepare a final MBA Employment Report covering the 12 months ending June 30th.
If your school has credible information from 100 percent of its job-seeking graduates prior to the end of
the data collection period (or if you have less than a 100 percent response and believe that you are not
going to receive any additional information), you may publish your final MBA Employment Report at an
earlier date.
Note B.3: For schools preparing preliminary or interim reports, those reports should be identified clearly
as preliminary or interim. These include reports made to the media and used in internal recruiting
materials.
3. For any individual student whose status changes over time during the MBA program and in the
three months following, it is the status three months after graduation that governs the status at all
measurement points. That is, if a student who at graduation is planning to postpone the job search
or start a business decides two and a half months after graduation to seek a job, that student’s status
becomes Seeking Employment for both the at graduation and the three months after graduation
measurement points.
4. If a school has multiple graduation dates, all dates should be recorded so that you can accurately
detail when a given student graduated.
Example: Schools with Multiple Graduation Dates – Defining Reporting Periods:
XYZ University has multiple graduation dates (May, August, and December). 400 students graduate on
August 15, 2017, 100 students graduate on December 15, 2017, and 500 students graduate on May 15,
2018. The “Class of 2018,” for MBA Employment Report purposes, includes all students graduating
during the 12 months ending June 30, 2018. Therefore, in this example, 1000 students graduated during
the 12 months ending June 30, 2018.
Example: Schools with Multiple Graduation Dates – Defining Reporting Periods:
Schools with multiple graduation dates should have one combined at graduation percentage for offers
and accepted offers that includes all the graduation dates. Similarly, one combined three months after
graduation percentage should be shown, which includes the data for the three months after each
graduation date.
XYZ University has 10 graduates with three graduating on August 15, 2017, three graduating on
December 15, 2017 and four graduating in May 2018. All of the graduates are seeking employment.
The three August 15, 2017 graduates accepted jobs in September 2017 (after graduation and before three
months after graduation). The three December 15, 2017 graduates accepted jobs in November 2017 (by
graduation). Two of the four May 15, 2018 graduates accepted jobs in July, 2018. The other two May
graduates did not accept jobs until September. You would account for the graduates in this way:

MBA CSEA Standards for Reporting
Full-Time MBA Employment Statistics©
Page | 9
Example: Schools with One Graduation Date
Your school has one graduation date each year in May. Your May 2018 graduating date falls within the
“12 months ending June 30, 2018” and all students graduating in May 2018 will be included in your 2018
MBA Employment Report.
Example: Data Collection Period
Your school has its final graduation date of June 25, 2018 for the reporting year ending June 30, 2018.
You will have up to four months post-graduation, or one month past the three-month post-graduation
reporting date, to collect data for your MBA Employment Report for 2018. This would mean your
school’s reporting date three months post-graduation is September 25, 2018 and your school would have
up to October 25, 2018 to collect and finalize the data.
C. OFFERS (Table 2.A)
1. Report Full-Time graduates’ experiences on length of time to receive their first offer (Table 2.A)
whether or not that is the offer they accept. Based upon all information received as of one month past
your three month post-graduation date, develop a table or histogram indicating the number and percent
of job seeking full-time graduates who had:
a. Received their first offer by graduation
b. Received their first offer after graduation and by three months after graduation, and
c. Did not receive offer by three months after graduation
2. The number of graduates in these three categories (C.1.a., C.1.b., and C.1.c.) must equal the number of
Total Graduates Seeking Employment (from Table 1.A). Similarly, the denominator, when calculating
the percent within each of the three categories is the Total Graduates Seeking Employment.
3. This information demonstrates when graduates had an opportunity for a job. A job offer is a valid offer
for a specific position. The job offer to the graduate does not have to be in writing or include a salary.
It should however, be MBA-level work, as noted in instruction 2 for Table 1.A. It does not include
verbal speculation or suggestions involving possible or potential offers for unidentified positions. An
information source may include an employer, a parent, your personal knowledge, or other reliable
sources. The career office should document in an email communication or the Career Services office’s
tracking system the information on the offer sourced from the graduate, parent, employer or other
source stated above, and should include the date of the offer or accepted offer and the date the career
office received the information.
REPORTING AN ACCEPTED OFFER
DATES
ACCEPT BY
GRAD DATE
ACCEPT AFTER
GRAD AND BEFORE 3
MONTHS
HAVE NOT
REPORTED
ACCEPTING AN
OFFER BY 3 MONTHS
August 15, 2017 0 3 (30%) 0
December 15, 2017 3 (30%) 0 0
May 15, 2018 0 2 (20%) 2 (20%)
Combined dates to be reported in
the 2018 MBA Employment
Report
3 (30%) 5 (50%) 2 (20%)
MBA CSEA Standards for Reporting
Full-Time MBA Employment Statistics©
Page | 10
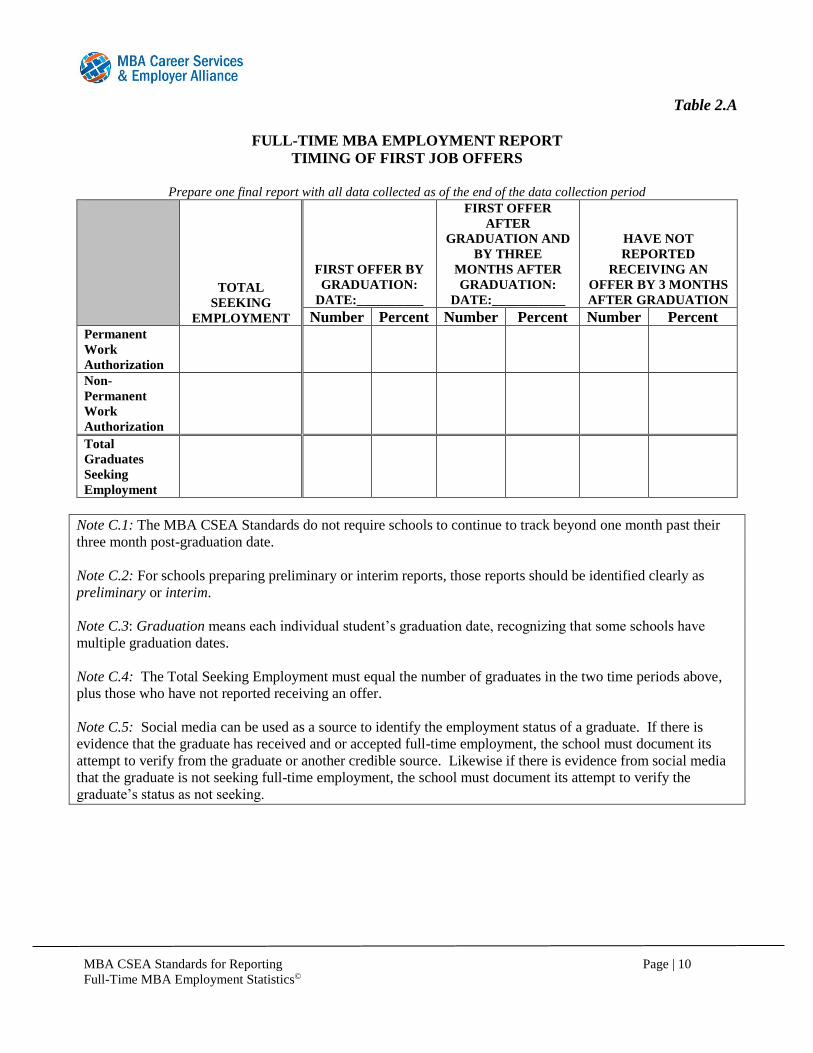
Table 2.A
FULL-TIME MBA EMPLOYMENT REPORT
TIMING OF FIRST JOB OFFERS
Prepare one final report with all data collected as of the end of the data collection period
TOTAL
SEEKING
EMPLOYMENT
FIRST OFFER BY
GRADUATION:
DATE:__________
FIRST OFFER
AFTER
GRADUATION AND
BY THREE
MONTHS AFTER
GRADUATION:
DATE:___________
HAVE NOT
REPORTED
RECEIVING AN
OFFER BY 3 MONTHS
AFTER GRADUATION
Number Percent Number Percent Number Percent Permanent
Work
Authorization
Non-
Permanent
Work
Authorization
Total
Graduates
Seeking
Employment
Note C.1: The MBA CSEA Standards do not require schools to continue to track beyond one month past their
three month post-graduation date.
Note C.2: For schools preparing preliminary or interim reports, those reports should be identified clearly as
preliminary or interim.
Note C.3: Graduation means each individual student’s graduation date, recognizing that some schools have
multiple graduation dates.
Note C.4: The Total Seeking Employment must equal the number of graduates in the two time periods above,
plus those who have not reported receiving an offer.
Note C.5: Social media can be used as a source to identify the employment status of a graduate. If there is
evidence that the graduate has received and or accepted full-time employment, the school must document its
attempt to verify from the graduate or another credible source. Likewise if there is evidence from social media
that the graduate is not seeking full-time employment, the school must document its attempt to verify the
graduate’s status as not seeking.
MBA Career Services & Employer Alliance Page | 11
Standards for Reporting MBA Employment Statistics©
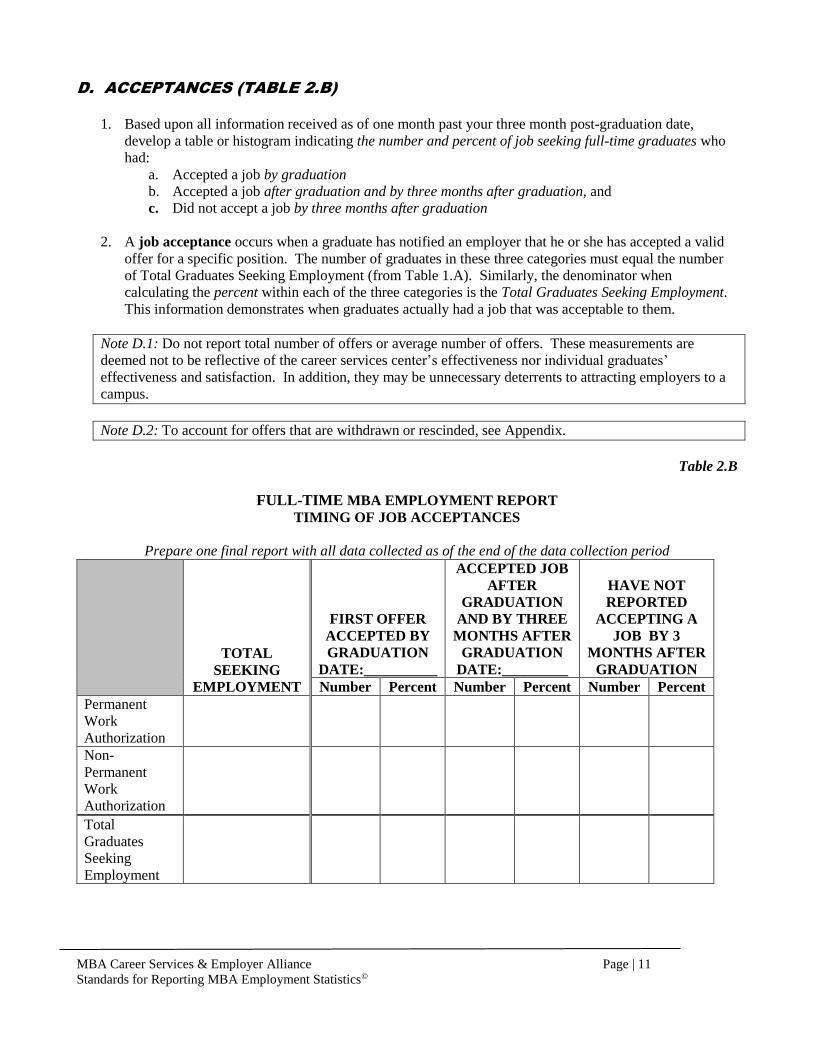
D. ACCEPTANCES (TABLE 2.B)
1. Based upon all information received as of one month past your three month post-graduation date,
develop a table or histogram indicating the number and percent of job seeking full-time graduates who
had:
a. Accepted a job by graduation
b. Accepted a job after graduation and by three months after graduation, and
c. Did not accept a job by three months after graduation
2. A job acceptance occurs when a graduate has notified an employer that he or she has accepted a valid
offer for a specific position. The number of graduates in these three categories must equal the number
of Total Graduates Seeking Employment (from Table 1.A). Similarly, the denominator when
calculating the percent within each of the three categories is the Total Graduates Seeking Employment.
This information demonstrates when graduates actually had a job that was acceptable to them.
Note D.1: Do not report total number of offers or average number of offers. These measurements are
deemed not to be reflective of the career services center’s effectiveness nor individual graduates’
effectiveness and satisfaction. In addition, they may be unnecessary deterrents to attracting employers to a
campus.
Note D.2: To account for offers that are withdrawn or rescinded, see Appendix.
Table 2.B
FULL-TIME MBA EMPLOYMENT REPORT
TIMING OF JOB ACCEPTANCES
Prepare one final report with all data collected as of the end of the data collection period
TOTAL
SEEKING
EMPLOYMENT
FIRST OFFER
ACCEPTED BY
GRADUATION
DATE:__________
ACCEPTED JOB
AFTER
GRADUATION
AND BY THREE
MONTHS AFTER
GRADUATION
DATE:_________
HAVE NOT
REPORTED
ACCEPTING A
JOB BY 3
MONTHS AFTER
GRADUATION
Number Percent Number Percent Number Percent
Permanent
Work
Authorization
Non-
Permanent
Work
Authorization
Total
Graduates
Seeking
Employment

MBA CSEA Standards for Reporting
Full-Time MBA Employment Statistics©
Page | 12
Note D.3: The MBA CSEA Standards do not require schools to continue to track graduates beyond the data
collection period (one month past each School’s three month post-graduation date).
Note D.4: For schools preparing preliminary or interim reports, those reports should be identified clearly as
preliminary or interim.
Note D.5: Graduation means each individual student’s graduation date, recognizing that some schools have
multiple graduation dates.
Note D.6: The Total Seeking Employment must equal the number of graduates in the two time periods above,
plus those who have not reported accepting an offer.
E. PRIMARY SOURCE OF FULL-TIME JOB ACCEPTANCES (Table 3.A)
1. Required Categories: Identify the sources of the jobs that MBA graduates accept. In Table 3.A,
report the number of graduates that provided the primary source of their accepted offer in the
following two categories:
a. School-facilitated activities
b. Graduate-facilitated activities
Percentages of graduates in each category are calculated on the basis of graduates accepting jobs
whose information (job source) is known.
2. Optional Subcategories: Schools may use subcategories within the School-facilitated and Graduate-
facilitated categories. Table 3.A provides examples.
Note E.1: It is recommended that Career Services offices do not publish the number of recruiters, as it is
not a reflective measure of how MBA graduates find employment.

MBA CSEA Standards for Reporting
Full-Time MBA Employment Statistics©
Page | 13
Table 3.A
FULL-TIME MBA EMPLOYMENT REPORT
PRIMARY SOURCE OF FULL-TIME JOB ACCEPTANCES
(SCHOOL-FACILITATED AND GRADUATE-FACILITATED)
Prepare one final report with all data collected as of the data collection period
NUMBER PERCENT
SCHOOL-FACILITATED ACTIVITIES:
Conversion of internship; internship obtained through school sources
Scheduled interviews on or off campus for full time employment
Job postings on school career systems, resume books, resume referrals by career
center
Activities supported by career center (i.e. job fairs/conferences, employer events,
information meetings, school promoted job boards)
School network/resources (i.e. faculty referrals, alumni referrals, classmates, campus
speakers, treks, club events, class projects)
Other school-facilitated source
TOTAL SCHOOL-FACILITATED ACTIVITIES
GRADUATE-FACILITATED ACTIVITIES:
Conversion of internship; internship obtained through graduate-initiated sources
Personal contacts (i.e. previous employers, family, friends outside of school, etc.)
Online job postings (i.e. social media/LinkedIn, Indeed, company websites)
Other graduate-facilitated source
TOTAL GRADUATE-FACILITATED ACTIVITIES
TOTAL 100%
F. SALARY AND COMPENSATION DATA (Tables 4.A–4.L)
1. REPORTING BASE SALARY AND SIGNING / STARTING BONUS
a. Salary/compensation data pertains only to job acceptances received by three months after
graduation. If you have any information about positions, including salary information, for
positions accepted later than three months post-graduation, you should not use it.
b. Report compensation in two categories (Table 4.A provides a worksheet for this report).
i. Base Salary
ii. Signing / Starting Bonus
c. Salary/compensation data should be reported for all Full-Time graduates accepting new
employment by three months after graduation. Do not include salary information for graduates
who were company-sponsored or already employed, i.e., who had not accepted a new
employment offer (those graduates should have been included in the Not Seeking Employment
category on Table 1.A).
d. Salary reports should carry a footnote indicating the percent of job-accepting graduates for
whom you have useable salary information. While the goal is to obtain information from 100
percent of job-accepting graduates, the MBA CSEA minimum target is 80 percent. The
equation is: number of job-accepting graduates for whom you have useable salary
information/total job-accepting graduates = percent.
MBA CSEA Standards for Reporting
Full-Time MBA Employment Statistics©
Page | 14
e. Compensation relates to job acceptances by three months after graduation (not job offers).
f. Base salary excludes bonuses, commissions, and other compensation such as benefits and
perquisites (e.g., car, equipment, memberships, relocation expenses, etc.). Do not equate
benefits and perquisites to cash and do not include them in a compensation report.
g. Report the salary of those graduates accepting employment with a start-up company.
Note F.1: The Standards do not per se allow clarification to identify the percentage of graduates
within each industry/function who have accepted employment with start-ups. A school can
elaborate, in a footnote, the background of its statistics.
h. Schools may express salary in their local country currency or the currency most appropriate for
their local employment market. For schools outside the US that wish to express their
employment reports in US dollars, they may convert salary reported in €, £, or C$ to US$ on or
near their own data collection cutoff date, using official currency rates published by the
Financial Times.
i. Schools may elect, in addition to reporting their salary tables in absolute terms, to provide or
publish salary information to their prospective student populations using purchasing power
parity (PPP) conversions to reflect purchasing power differences between countries. Schools
should not report regional or metropolitan area purchasing power parity differences within a
single country. Graduate salary information with country level purchasing power parity
conversions should not be submitted to external publications and media outlets. If a school
elects to produce these salary tables with PPP conversions they should use the most recent
conversion estimates supplied by the IMF – World Economic Outlook Database – for the
current reporting year and footnote same on their report along with the published date.
j. Express salary as reported and calculated, i.e., not rounded.
k. Stock option values, tuition reimbursement and relocation and moving expenses are excluded
from this compensation report. However, schools may report the number or percent of job-
seeking graduates receiving stock options, or relocation and moving expenses.
l. Signing / Starting Bonus is an incentive to join a firm, which may be paid either when the offer
is accepted or in the early stages of employment.
m. Base Salary and Signing / Starting Bonus are not cumulative. Schools should not publish a
“Total Compensation” or “Salary plus Signing / Starting Bonus” figure. Total Compensation
does not provide an accurate representation of actual compensation since it represents the
addition of base salary, plus other types of compensation. This combines one-time payments
with ongoing or potentially ongoing payments. Thus, a total compensation figure does not
provide a consistent, reliable salary figure. The most accurate way to depict MBA
compensation is to list each type of compensation separately—base salary and signing / starting
bonus.
n. Report the median, mean, high and low salaries within the categories when there are a minimum
of three salary data points, or the number of salary data points is equal to or greater than one
percent of Full-Time graduates accepting employment, whichever is greater. This provides
MBA CSEA Standards for Reporting
Full-Time MBA Employment Statistics©
Page | 15
additional confidentiality for compensation reporting. Even when minimum data requirements
are met, career services professionals may elect not to report any salary data that would
compromise student confidentiality; they should exercise their judgment in making this
determination.
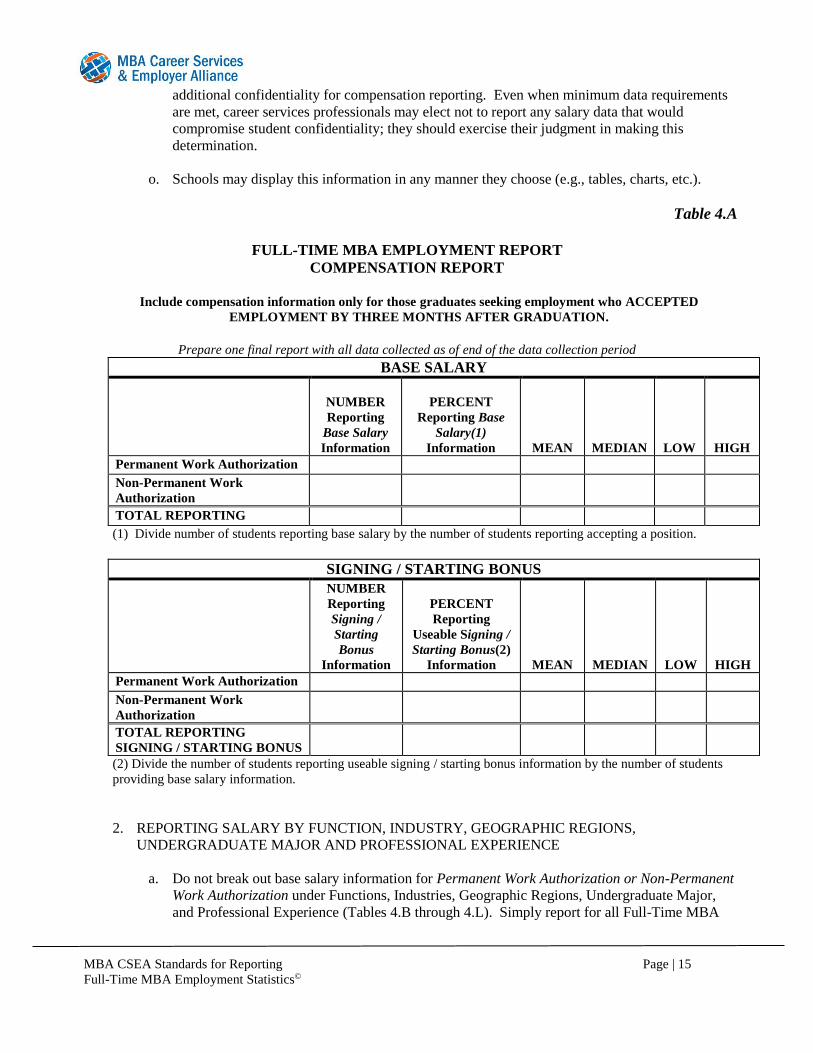
o. Schools may display this information in any manner they choose (e.g., tables, charts, etc.).
Table 4.A
FULL-TIME MBA EMPLOYMENT REPORT
COMPENSATION REPORT
Include compensation information only for those graduates seeking employment who ACCEPTED
EMPLOYMENT BY THREE MONTHS AFTER GRADUATION.
Prepare one final report with all data collected as of end of the data collection period
BASE SALARY
NUMBER
Reporting
Base Salary
Information
PERCENT
Reporting Base
Salary(1)
Information
MEAN
MEDIAN
LOW
HIGH
Permanent Work Authorization Non-Permanent Work
Authorization
TOTAL REPORTING (1) Divide number of students reporting base salary by the number of students reporting accepting a position.
SIGNING / STARTING BONUS
NUMBER
Reporting
Signing /
Starting
Bonus
Information
PERCENT
Reporting
Useable Signing /
Starting Bonus(2)
Information
MEAN
MEDIAN
LOW
HIGH
Permanent Work Authorization Non-Permanent Work
Authorization
TOTAL REPORTING
SIGNING / STARTING BONUS
(2) Divide the number of students reporting useable signing / starting bonus information by the number of students
providing base salary information.
2. REPORTING SALARY BY FUNCTION, INDUSTRY, GEOGRAPHIC REGIONS,
UNDERGRADUATE MAJOR AND PROFESSIONAL EXPERIENCE
a. Do not break out base salary information for Permanent Work Authorization or Non-Permanent
Work Authorization under Functions, Industries, Geographic Regions, Undergraduate Major,
and Professional Experience (Tables 4.B through 4.L). Simply report for all Full-Time MBA

MBA CSEA Standards for Reporting
Full-Time MBA Employment Statistics©
Page | 16
graduates seeking employment who accepted employment by three months after graduation in
these categories.
b. Minimum data required: Include data on a professional function, industry, geographic region,
undergraduate major, or level of experience when there are a minimum of three salary data
points, or the number of salary data points is equal to or greater than one percent of full-time
graduates seeking employment (whichever is greater). Data points not meeting the “minimum
of three” or “one percent or greater” requirements should be reported in the Other category
(assuming there are a minimum of three such salary data points), or indicated by an N/A
designation. Even when minimum data requirements are met, career services professionals may
elect not to report any salary data that would compromise student confidentiality; they should
exercise their judgment in making this determination.
c. The number of graduates accepting new employment in Tables 4.B through Table 4.L is the
number reporting employment by function, industry, geographic region, undergraduate major or
years of work experience, regardless of whether the graduate has provided base salary
information.
d. The percentage of graduates accepting new employment for each table is calculated on the basis
of those who have provided the information for that table (function, industry, geographic region,
etc.).
e. The number of graduates reporting salary in Tables 4.B through Table 4.L is the number within
the category (i.e., that function, industry, geographic region, undergraduate major, or experience
range) who reported salary.
f. Both number of graduates accepting new employment and number of graduates reporting salary
should be reported for MBA CSEA Standards-compliant tables. For report formats where the
report only allows for one number for a category, it should be the number accepting new
employment, because the number reporting salary should never be reported without the number
accepting new employment.
Example: Minimum Data Required
500 full-time graduates seeking employment; one percent equals five graduates:
Four graduates accepted employment and reported salary within one of the categories in this section.
While the minimum of three graduates rule was met, the one- percent or greater rule was not met.
Therefore, the graduates in this category could either be moved to the Other category, or the 0.8% of
graduates who accepted jobs in could be left in the appropriate category and their salary shown as N/A.
Fifteen graduates (three percent) accepted employment and reported salary within one of the categories
in this section. These 15 graduates would be counted in that category and their salary would be shown,
since the minimum of three graduates and the one- percent or greater rules have been met.
Example: Minimum Data Required
90 full-time graduates seeking employment; one percent equals one graduate:
Three graduates accepted employment and reported salary within one of the categories in this section.
The minimum of three graduates and the one- percent or greater rules have been met.
Two graduates accepted employment and reported salary within one of the categories in this section.
While the one-percent or greater rule has been met, the minimum of three graduates rule has not been
met. Therefore, these two graduates (2.2% of the class) could be shown as accepting jobs in this
MBA CSEA Standards for Reporting
Full-Time MBA Employment Statistics©
Page | 17
category, and the salary for the category be shown as N/A, or these graduates and their salaries could be
included in the Other category.
Example: Minimum Data Required
100 full-time graduates seeking employment; one percent equals one graduate:
Four graduates accepted employment within one of the categories in this section. Only three graduates
provided salary data within that category. The minimum of three graduates and the one- percent or
greater rules have been met.
Four graduates accepted employment within one of the categories in this section. Only two graduates
provided salary data within that category. The minimum of three graduates rule has not been met.
Therefore, these four graduates (4% of the class) could be shown as accepting jobs in this category, and
the salary for the category be shown as N/A, or these graduates and their salaries could be included in
the Other category.
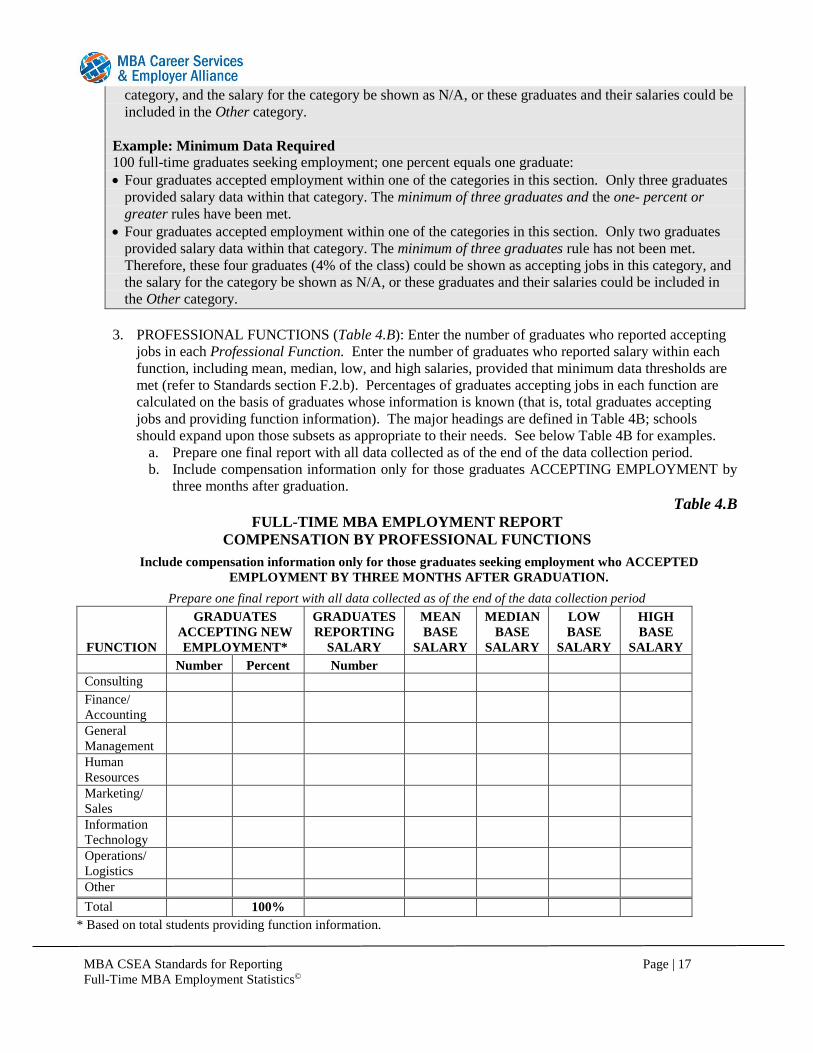
3. PROFESSIONAL FUNCTIONS (Table 4.B): Enter the number of graduates who reported accepting
jobs in each Professional Function. Enter the number of graduates who reported salary within each
function, including mean, median, low, and high salaries, provided that minimum data thresholds are
met (refer to Standards section F.2.b). Percentages of graduates accepting jobs in each function are
calculated on the basis of graduates whose information is known (that is, total graduates accepting
jobs and providing function information). The major headings are defined in Table 4B; schools
should expand upon those subsets as appropriate to their needs. See below Table 4B for examples.
a. Prepare one final report with all data collected as of the end of the data collection period.
b. Include compensation information only for those graduates ACCEPTING EMPLOYMENT by
three months after graduation.
Table 4.B
FULL-TIME MBA EMPLOYMENT REPORT
COMPENSATION BY PROFESSIONAL FUNCTIONS
Include compensation information only for those graduates seeking employment who ACCEPTED
EMPLOYMENT BY THREE MONTHS AFTER GRADUATION.
Prepare one final report with all data collected as of the end of the data collection period
FUNCTION
GRADUATES
ACCEPTING NEW
EMPLOYMENT*
GRADUATES
REPORTING
SALARY
MEAN
BASE
SALARY
MEDIAN
BASE
SALARY
LOW
BASE
SALARY
HIGH
BASE
SALARY
Number Percent Number Consulting Finance/
Accounting
General
Management
Human
Resources
Marketing/
Sales
Information
Technology
Operations/
Logistics
Other
Total 100% * Based on total students providing function information.
MBA CSEA Standards for Reporting
Full-Time MBA Employment Statistics©
Page | 18
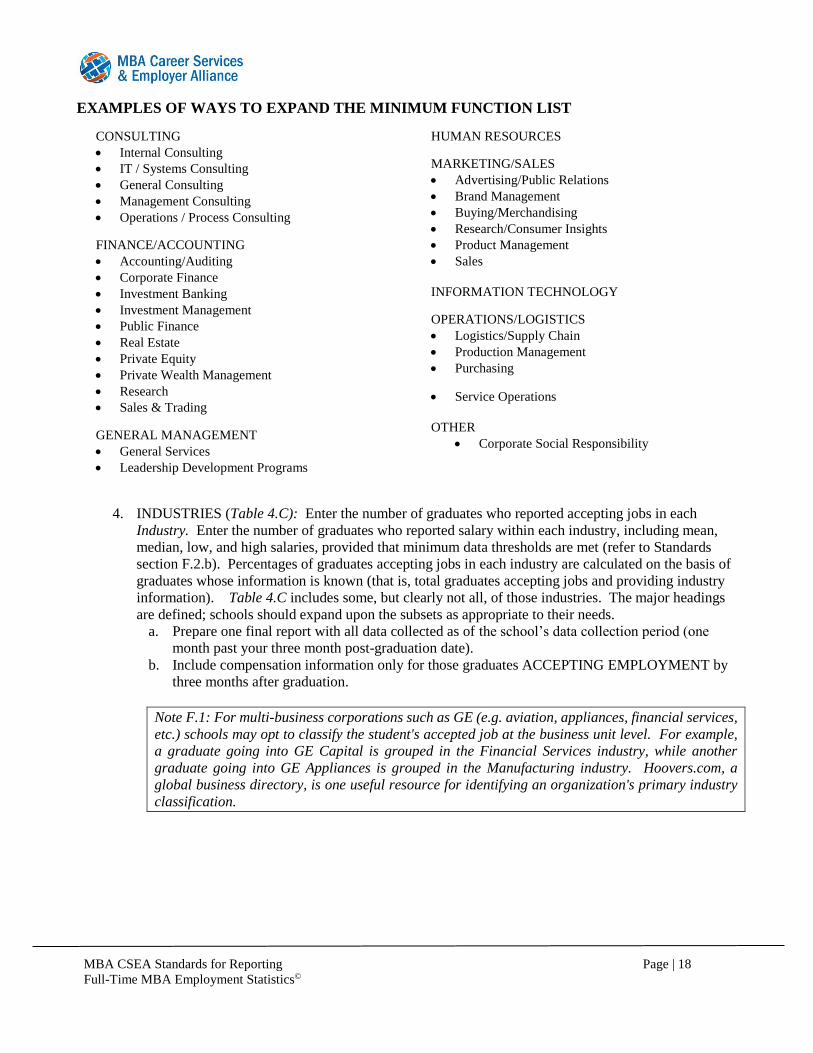
EXAMPLES OF WAYS TO EXPAND THE MINIMUM FUNCTION LIST
CONSULTING
Internal Consulting
IT / Systems Consulting
General Consulting
Management Consulting
Operations / Process Consulting
FINANCE/ACCOUNTING
Accounting/Auditing
Corporate Finance
Investment Banking
Investment Management
Public Finance
Real Estate
Private Equity
Private Wealth Management
Research
Sales & Trading
GENERAL MANAGEMENT
General Services
Leadership Development Programs
HUMAN RESOURCES
MARKETING/SALES
Advertising/Public Relations
Brand Management
Buying/Merchandising
Research/Consumer Insights
Product Management
Sales
INFORMATION TECHNOLOGY
OPERATIONS/LOGISTICS
Logistics/Supply Chain
Production Management
Purchasing
Service Operations
OTHER
Corporate Social Responsibility
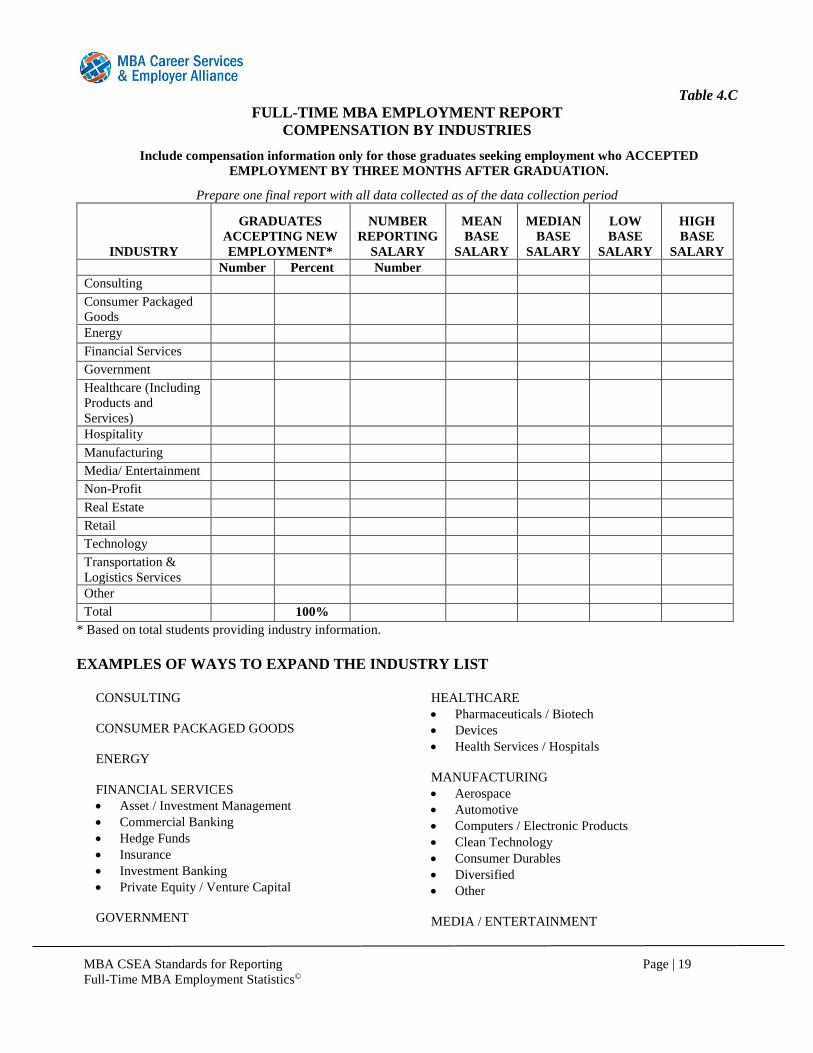
4. INDUSTRIES (Table 4.C): Enter the number of graduates who reported accepting jobs in each
Industry. Enter the number of graduates who reported salary within each industry, including mean,
median, low, and high salaries, provided that minimum data thresholds are met (refer to Standards
section F.2.b). Percentages of graduates accepting jobs in each industry are calculated on the basis of
graduates whose information is known (that is, total graduates accepting jobs and providing industry
information). Table 4.C includes some, but clearly not all, of those industries. The major headings
are defined; schools should expand upon the subsets as appropriate to their needs.
a. Prepare one final report with all data collected as of the school’s data collection period (one
month past your three month post-graduation date).
b. Include compensation information only for those graduates ACCEPTING EMPLOYMENT by
three months after graduation.
Note F.1: For multi-business corporations such as GE (e.g. aviation, appliances, financial services,
etc.) schools may opt to classify the student's accepted job at the business unit level. For example,
a graduate going into GE Capital is grouped in the Financial Services industry, while another
graduate going into GE Appliances is grouped in the Manufacturing industry. Hoovers.com, a
global business directory, is one useful resource for identifying an organization's primary industry
classification.
MBA CSEA Standards for Reporting
Full-Time MBA Employment Statistics©
Page | 19
Table 4.C
FULL-TIME MBA EMPLOYMENT REPORT
COMPENSATION BY INDUSTRIES
Include compensation information only for those graduates seeking employment who ACCEPTED
EMPLOYMENT BY THREE MONTHS AFTER GRADUATION.
Prepare one final report with all data collected as of the data collection period
INDUSTRY
GRADUATES
ACCEPTING NEW
EMPLOYMENT*
NUMBER
REPORTING
SALARY
MEAN
BASE
SALARY
MEDIAN
BASE
SALARY
LOW
BASE
SALARY
HIGH
BASE
SALARY
Number Percent Number
Consulting Consumer Packaged
Goods
Energy Financial Services Government Healthcare (Including
Products and
Services)
Hospitality Manufacturing Media/ Entertainment Non-Profit Real Estate Retail Technology Transportation &
Logistics Services
Other Total 100%
* Based on total students providing industry information.
EXAMPLES OF WAYS TO EXPAND THE INDUSTRY LIST
CONSULTING
CONSUMER PACKAGED GOODS
ENERGY
FINANCIAL SERVICES
Asset / Investment Management
Commercial Banking
Hedge Funds
Insurance
Investment Banking
Private Equity / Venture Capital
GOVERNMENT
HEALTHCARE
Pharmaceuticals / Biotech
Devices
Health Services / Hospitals
MANUFACTURING
Aerospace
Automotive
Computers / Electronic Products
Clean Technology
Consumer Durables
Diversified
Other
MEDIA / ENTERTAINMENT
MBA CSEA Standards for Reporting
Full-Time MBA Employment Statistics©
Page | 20
NON-PROFIT
REAL ESTATE
RETAIL
TECHNOLOGY
Internet Services
Retail
Telecommunications
5. GEOGRAPHIC REGIONS (Tables 4.D through 4.J): Each school should complete Table 4.D,
the World Region Breakdown, and the table that corresponds to its home region in order to be
Standards-compliant. Completing additional tables is recommended, but not required.
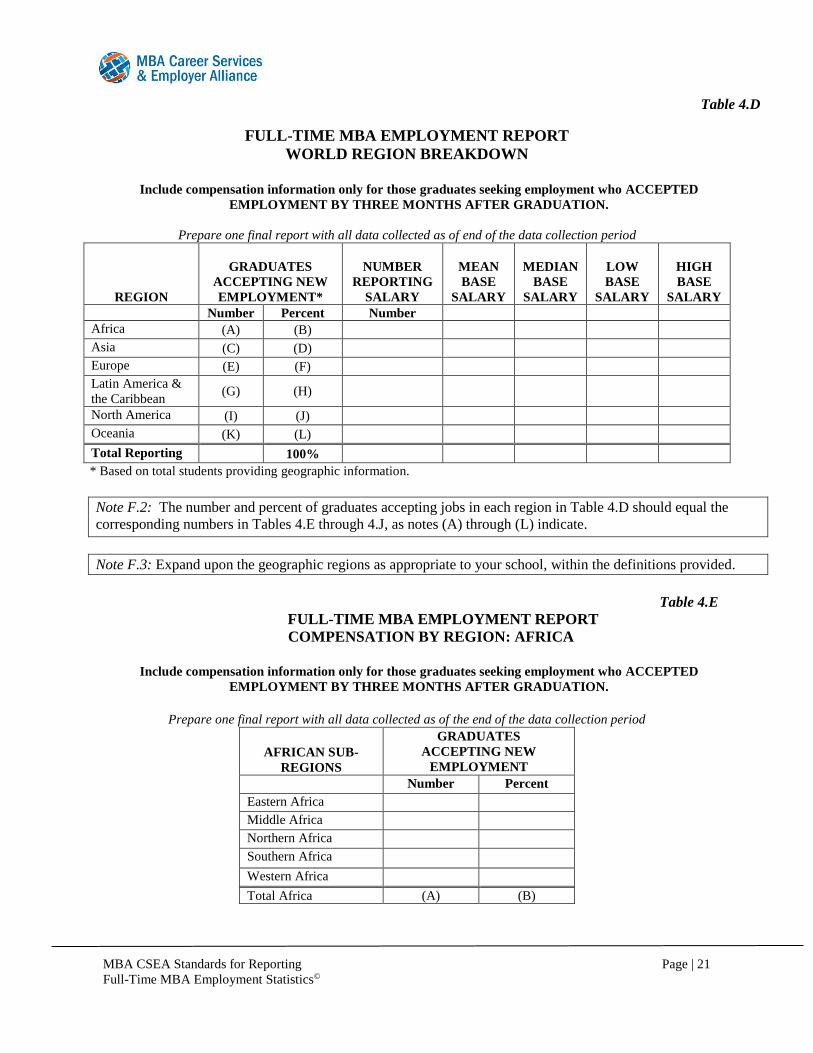
For Table 4.D, World Region Breakdown, enter the number of graduates who reported accepting
jobs in each Geographic Region. Enter the number of graduates who reported salary within each
region, including mean, median, low, and high salaries, provided that minimum data thresholds are
met (refer to Standards section F.2.b). Percentages of graduates accepting jobs in each region are
calculated on the basis of graduates whose information is known (that is, total graduates accepting
jobs and providing geographic region).
For Tables 4.E through 4.J, enter the number of graduates and salaries in the same fashion. For a
definition of the countries included in each sub-region, refer to the United Nations’ Composition of
Macro Geographical (Continental) Regions and Geographical Sub-regions, which is provided
online. A listing produced in 2015, which was up to date as of 2017, appears in Appendix I.
Percentages for all tables are calculated on the basis of total graduates whose information is known
worldwide, so that Tables 4.E through 4.J are components of Table 4.D.
a. Schools are encouraged to utilize subsets, if appropriate, for their population: e.g.,
specific countries or cities within a given geographic region. Salary data, when provided,
should be provided at the country, city, or other more granular level. Salary data by sub-
region is likely less meaningful because it aggregates multiple countries, so it is not part
of the Standards, with the exception of North America, where it has historical precedent
within the Standards.
b. Prepare one final report with all data collected as the end of the data collection period
(one month past your three month post-graduation date).
c. Include compensation information only for those graduates accepting employment and
reporting geographic location by three months after graduation.
MBA CSEA Standards for Reporting
Full-Time MBA Employment Statistics©
Page | 21
Table 4.D
FULL-TIME MBA EMPLOYMENT REPORT
WORLD REGION BREAKDOWN
Include compensation information only for those graduates seeking employment who ACCEPTED
EMPLOYMENT BY THREE MONTHS AFTER GRADUATION.
Prepare one final report with all data collected as of end of the data collection period
REGION
GRADUATES
ACCEPTING NEW
EMPLOYMENT*
NUMBER
REPORTING
SALARY
MEAN
BASE
SALARY
MEDIAN
BASE
SALARY
LOW
BASE
SALARY
HIGH
BASE
SALARY
Number Percent Number
Africa (A) (B) Asia (C) (D) Europe (E) (F) Latin America &
the Caribbean (G) (H)
North America (I) (J) Oceania (K) (L)
Total Reporting 100% * Based on total students providing geographic information.
Note F.2: The number and percent of graduates accepting jobs in each region in Table 4.D should equal the
corresponding numbers in Tables 4.E through 4.J, as notes (A) through (L) indicate.
Note F.3: Expand upon the geographic regions as appropriate to your school, within the definitions provided.
Table 4.E
FULL-TIME MBA EMPLOYMENT REPORT
COMPENSATION BY REGION: AFRICA
Include compensation information only for those graduates seeking employment who ACCEPTED
EMPLOYMENT BY THREE MONTHS AFTER GRADUATION.
Prepare one final report with all data collected as of the end of the data collection period
AFRICAN SUB-
REGIONS
GRADUATES
ACCEPTING NEW
EMPLOYMENT
Number Percent
Eastern Africa Middle Africa Northern Africa Southern Africa
Western Africa
Total Africa (A) (B)

MBA CSEA Standards for Reporting
Full-Time MBA Employment Statistics©
Page | 22
Note F.4: The total number and percent of graduates shown accepting new employment and reporting salary for
each region should equal the total number and percent of graduates shown for this region in Table 4.D. Thus,
percentages on each regional table are calculated on the basis of the total students providing geographic
information worldwide.
Table 4.F
FULL-TIME MBA EMPLOYMENT REPORT
COMPENSATION BY REGION: ASIA
Include compensation information only for those graduates seeking employment who ACCEPTED
EMPLOYMENT BY THREE MONTHS AFTER GRADUATION.
Prepare one final report with all data collected as of the end of the data collection period
ASIAN SUB-
REGIONS
GRADUATES
ACCEPTING NEW
EMPLOYMENT
Number Percent
Central Asia Eastern Asia Southern Asia South-Eastern Asia
Western Asia
Total Asia (C) (D)
Table 4.G
FULL-TIME MBA EMPLOYMENT REPORT
COMPENSATION BY REGION: EUROPE
Include compensation information only for those graduates seeking employment who ACCEPTED
EMPLOYMENT BY THREE MONTHS AFTER GRADUATION.
Prepare one final report with all data collected as of the end of the data collection period
EUROPEAN SUB-
REGIONS
GRADUATES
ACCEPTING NEW
EMPLOYMENT
Number Percent
Eastern Europe Northern Europe Southern Europe Western Europe
Total Europe (E) (F)
MBA CSEA Standards for Reporting
Full-Time MBA Employment Statistics©
Page | 23
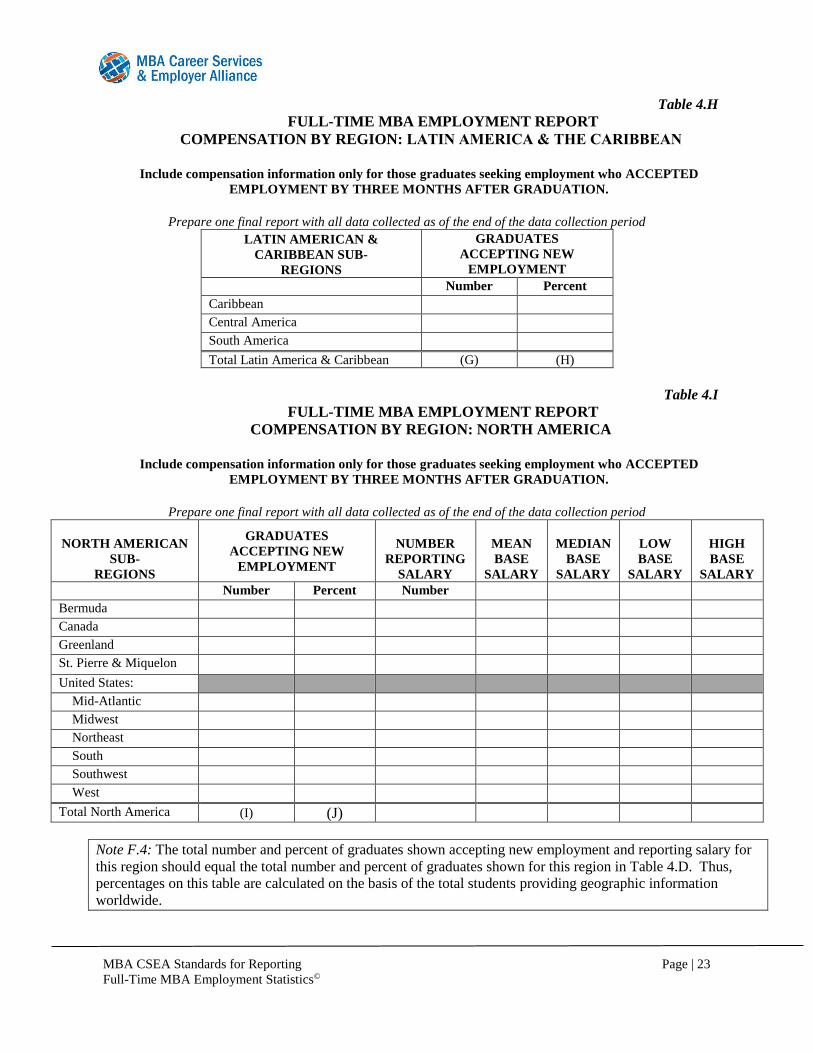
Table 4.H
FULL-TIME MBA EMPLOYMENT REPORT
COMPENSATION BY REGION: LATIN AMERICA & THE CARIBBEAN
Include compensation information only for those graduates seeking employment who ACCEPTED
EMPLOYMENT BY THREE MONTHS AFTER GRADUATION.
Prepare one final report with all data collected as of the end of the data collection period
LATIN AMERICAN &
CARIBBEAN SUB-
REGIONS
GRADUATES
ACCEPTING NEW
EMPLOYMENT
Number Percent
Caribbean Central America South America
Total Latin America & Caribbean (G) (H)
Table 4.I
FULL-TIME MBA EMPLOYMENT REPORT
COMPENSATION BY REGION: NORTH AMERICA
Include compensation information only for those graduates seeking employment who ACCEPTED
EMPLOYMENT BY THREE MONTHS AFTER GRADUATION.
Prepare one final report with all data collected as of the end of the data collection period
NORTH AMERICAN
SUB-
REGIONS
GRADUATES
ACCEPTING NEW
EMPLOYMENT
NUMBER
REPORTING
SALARY
MEAN
BASE
SALARY
MEDIAN
BASE
SALARY
LOW
BASE
SALARY
HIGH
BASE
SALARY
Number Percent Number
Bermuda Canada Greenland St. Pierre & Miquelon
United States: Mid-Atlantic Midwest Northeast South Southwest West
Total North America (I) (J)
Note F.4: The total number and percent of graduates shown accepting new employment and reporting salary for
this region should equal the total number and percent of graduates shown for this region in Table 4.D. Thus,
percentages on this table are calculated on the basis of the total students providing geographic information
worldwide.
MBA CSEA Standards for Reporting
Full-Time MBA Employment Statistics©
Page | 24
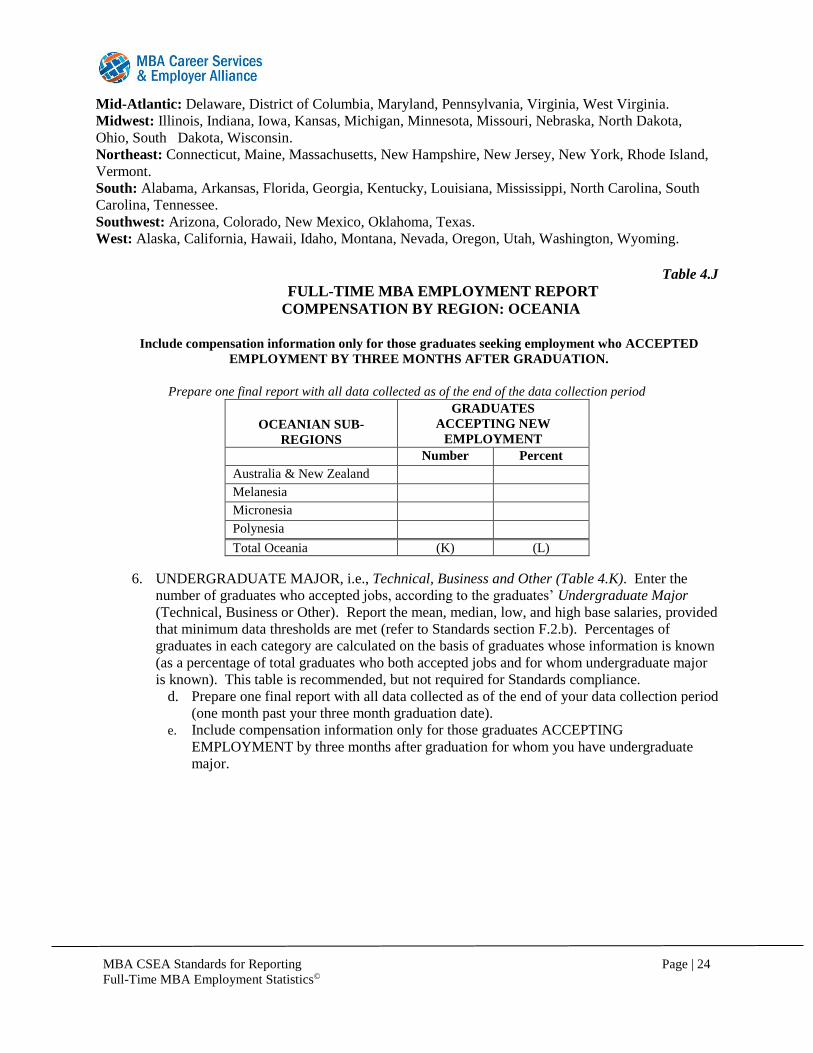
Mid-Atlantic: Delaware, District of Columbia, Maryland, Pennsylvania, Virginia, West Virginia.
Midwest: Illinois, Indiana, Iowa, Kansas, Michigan, Minnesota, Missouri, Nebraska, North Dakota,
Ohio, South Dakota, Wisconsin.
Northeast: Connecticut, Maine, Massachusetts, New Hampshire, New Jersey, New York, Rhode Island,
Vermont.
South: Alabama, Arkansas, Florida, Georgia, Kentucky, Louisiana, Mississippi, North Carolina, South
Carolina, Tennessee.
Southwest: Arizona, Colorado, New Mexico, Oklahoma, Texas.
West: Alaska, California, Hawaii, Idaho, Montana, Nevada, Oregon, Utah, Washington, Wyoming.
Table 4.J
FULL-TIME MBA EMPLOYMENT REPORT
COMPENSATION BY REGION: OCEANIA
Include compensation information only for those graduates seeking employment who ACCEPTED
EMPLOYMENT BY THREE MONTHS AFTER GRADUATION.
Prepare one final report with all data collected as of the end of the data collection period
OCEANIAN SUB-
REGIONS
GRADUATES
ACCEPTING NEW
EMPLOYMENT
Number Percent
Australia & New Zealand Melanesia Micronesia Polynesia
Total Oceania (K) (L)
6. UNDERGRADUATE MAJOR, i.e., Technical, Business and Other (Table 4.K). Enter the
number of graduates who accepted jobs, according to the graduates’ Undergraduate Major
(Technical, Business or Other). Report the mean, median, low, and high base salaries, provided
that minimum data thresholds are met (refer to Standards section F.2.b). Percentages of
graduates in each category are calculated on the basis of graduates whose information is known
(as a percentage of total graduates who both accepted jobs and for whom undergraduate major
is known). This table is recommended, but not required for Standards compliance.
d. Prepare one final report with all data collected as of the end of your data collection period
(one month past your three month graduation date).
e. Include compensation information only for those graduates ACCEPTING
EMPLOYMENT by three months after graduation for whom you have undergraduate
major.

MBA CSEA Standards for Reporting
Full-Time MBA Employment Statistics©
Page | 25
Table 4.K
FULL-TIME MBA EMPLOYMENT REPORT
COMPENSATION BY UNDERGRADUATE MAJOR
Include compensation information only for those graduates seeking employment who ACCEPTED
EMPLOYMENT BY THREE MONTHS AFTER GRADUATION.
Prepare one final report with all data collected as of the end of the data collection period
UNDERGRADUATE
MAJOR
GRADUATES
ACCEPTING NEW
EMPLOYMENT*
NUMBER
PROVIDING
SALARY
MEAN
BASE
SALARY
MEDIAN
BASE
SALARY
LOW
BASE
SALARY
HIGH
BASE
SALARY
Number Percent Number Technical Business Other
Total 100% * Based on total students providing undergraduate major information.
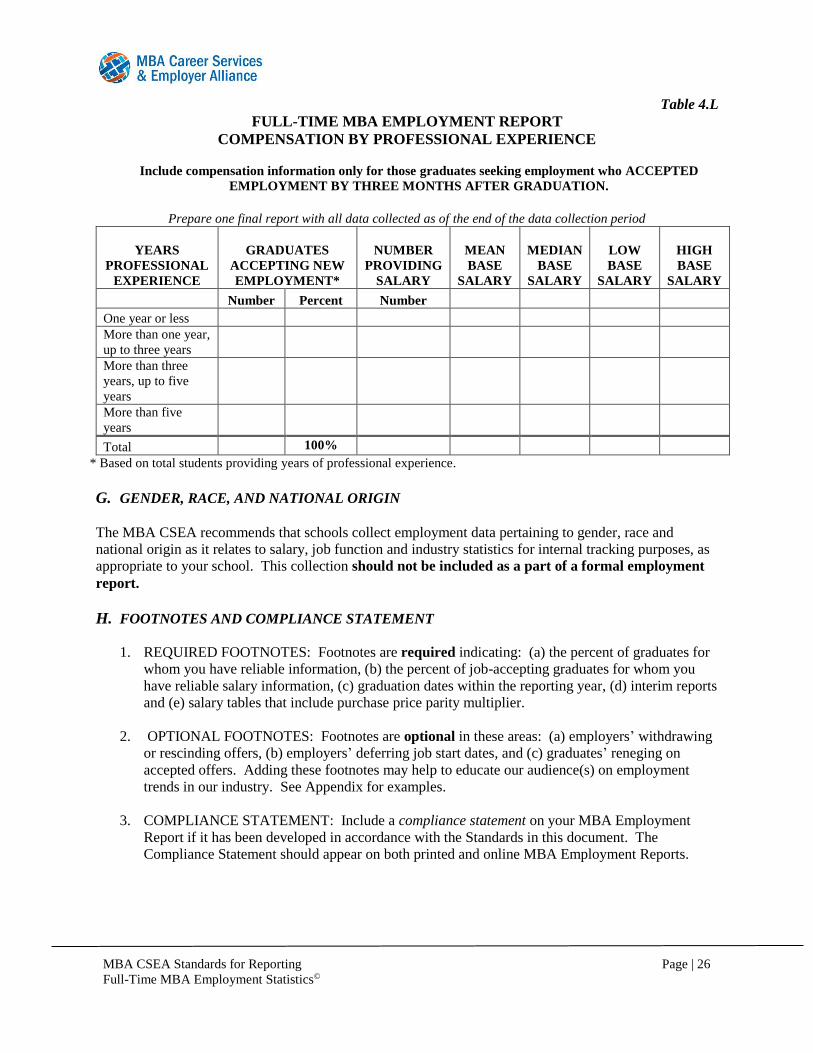
7. PROFESSIONAL EXPERIENCE (Table 4.L). Report Professional Experience within the
following groups:
a. One year or less,
b. More than one year and up to three years,
c. More than three years and up to five years, and
d. More than five years.
Enter the number of graduates who reported accepting jobs, according to the graduates’ Years
of Professional Experience (since earning their first degree, see example below). Report the
mean, median, low, and high base salaries, provided that minimum data thresholds are met
(refer to Standards section F.2.b). Percentages of graduates in each category are calculated on
the basis of graduates whose information is known (as a percentage of total graduates who both
accepted jobs and for whom years of professional experience is known). This table is
recommended, but not required for Standards compliance.
1. Prepare one final report with all data collected as of the end of the data collection period
(one month past your three month post-graduation date).
2. Include compensation information only for those employment seeking graduates
ACCEPTING EMPLOYMENT by three months after graduation for whom you have
years of professional experience.
3. Express Professional Experience as the number of years of full-time, professional work
experience completed since earning the first degree, through graduation with the MBA.
Example: Years of Professional Work Experience
Helen Smith earned her BA degree in 2011. She worked four years and nine months for Compaq
and another four months for Dell during the summer of her MBA program. Helen has five years
and one month of professional experience.
MBA CSEA Standards for Reporting
Full-Time MBA Employment Statistics©
Page | 26
Table 4.L
FULL-TIME MBA EMPLOYMENT REPORT
COMPENSATION BY PROFESSIONAL EXPERIENCE
Include compensation information only for those graduates seeking employment who ACCEPTED
EMPLOYMENT BY THREE MONTHS AFTER GRADUATION.
Prepare one final report with all data collected as of the end of the data collection period
YEARS
PROFESSIONAL
EXPERIENCE
GRADUATES
ACCEPTING NEW
EMPLOYMENT*
NUMBER
PROVIDING
SALARY
MEAN
BASE
SALARY
MEDIAN
BASE
SALARY
LOW
BASE
SALARY
HIGH
BASE
SALARY
Number Percent Number
One year or less More than one year,
up to three years
More than three
years, up to five
years
More than five
years
Total 100% * Based on total students providing years of professional experience.
G. GENDER, RACE, AND NATIONAL ORIGIN
The MBA CSEA recommends that schools collect employment data pertaining to gender, race and
national origin as it relates to salary, job function and industry statistics for internal tracking purposes, as
appropriate to your school. This collection should not be included as a part of a formal employment
report.
H. FOOTNOTES AND COMPLIANCE STATEMENT
1. REQUIRED FOOTNOTES: Footnotes are required indicating: (a) the percent of graduates for
whom you have reliable information, (b) the percent of job-accepting graduates for whom you
have reliable salary information, (c) graduation dates within the reporting year, (d) interim reports
and (e) salary tables that include purchase price parity multiplier.
2. OPTIONAL FOOTNOTES: Footnotes are optional in these areas: (a) employers’ withdrawing
or rescinding offers, (b) employers’ deferring job start dates, and (c) graduates’ reneging on
accepted offers. Adding these footnotes may help to educate our audience(s) on employment
trends in our industry. See Appendix for examples.
3. COMPLIANCE STATEMENT: Include a compliance statement on your MBA Employment
Report if it has been developed in accordance with the Standards in this document. The
Compliance Statement should appear on both printed and online MBA Employment Reports.
MBA CSEA Standards for Reporting
Full-Time MBA Employment Statistics©
Page | 27
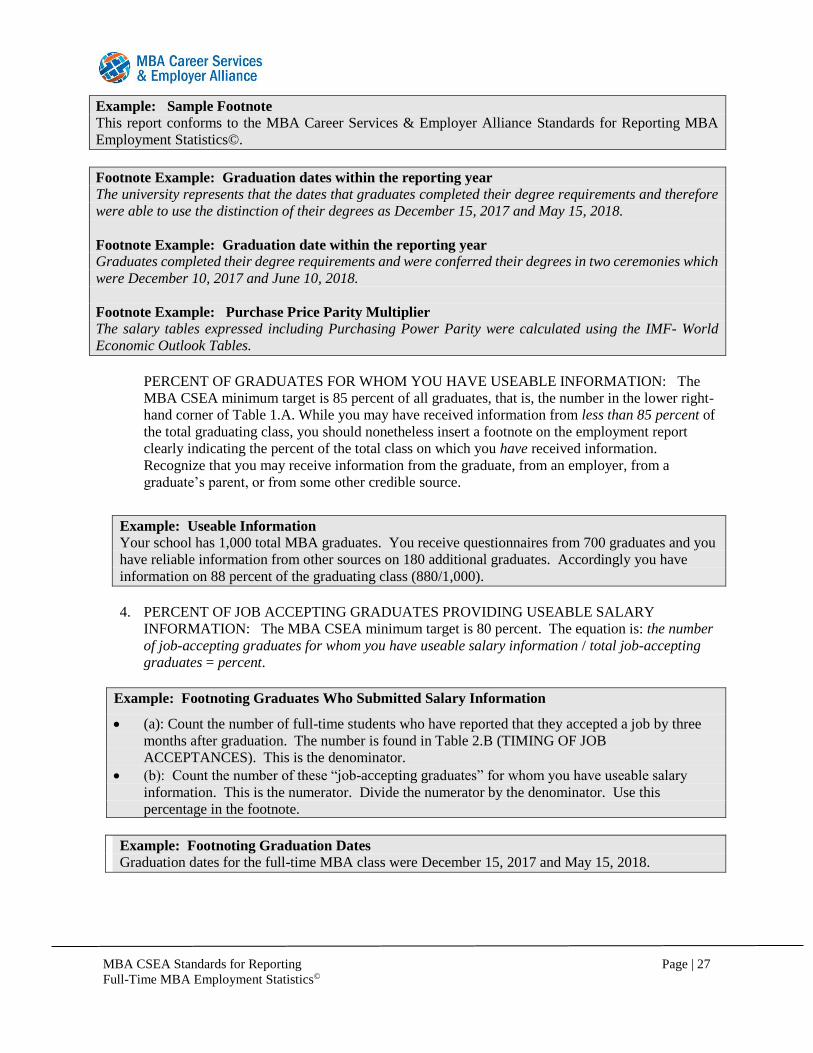
Example: Sample Footnote
This report conforms to the MBA Career Services & Employer Alliance Standards for Reporting MBA
Employment Statistics©.
Footnote Example: Graduation dates within the reporting year
The university represents that the dates that graduates completed their degree requirements and therefore
were able to use the distinction of their degrees as December 15, 2017 and May 15, 2018.
Footnote Example: Graduation date within the reporting year
Graduates completed their degree requirements and were conferred their degrees in two ceremonies which
were December 10, 2017 and June 10, 2018.
Footnote Example: Purchase Price Parity Multiplier
The salary tables expressed including Purchasing Power Parity were calculated using the IMF- World
Economic Outlook Tables.
PERCENT OF GRADUATES FOR WHOM YOU HAVE USEABLE INFORMATION: The
MBA CSEA minimum target is 85 percent of all graduates, that is, the number in the lower right-
hand corner of Table 1.A. While you may have received information from less than 85 percent of
the total graduating class, you should nonetheless insert a footnote on the employment report
clearly indicating the percent of the total class on which you have received information.
Recognize that you may receive information from the graduate, from an employer, from a
graduate’s parent, or from some other credible source.
Example: Useable Information
Your school has 1,000 total MBA graduates. You receive questionnaires from 700 graduates and you
have reliable information from other sources on 180 additional graduates. Accordingly you have
information on 88 percent of the graduating class (880/1,000).
4. PERCENT OF JOB ACCEPTING GRADUATES PROVIDING USEABLE SALARY
INFORMATION: The MBA CSEA minimum target is 80 percent. The equation is: the number
of job-accepting graduates for whom you have useable salary information / total job-accepting
graduates = percent.
Example: Footnoting Graduates Who Submitted Salary Information
(a): Count the number of full-time students who have reported that they accepted a job by three
months after graduation. The number is found in Table 2.B (TIMING OF JOB
ACCEPTANCES). This is the denominator.
(b): Count the number of these “job-accepting graduates” for whom you have useable salary
information. This is the numerator. Divide the numerator by the denominator. Use this
percentage in the footnote.
Example: Footnoting Graduation Dates
Graduation dates for the full-time MBA class were December 15, 2017 and May 15, 2018.
MBA CSEA Standards for Reporting
Full-Time MBA Employment Statistics©
Page | 28
Example 1: Useable Salary Information
If 100 graduates had accepted a job by three months after graduation, and 92 of those graduates provided
useable salary information, the percent of job-accepting graduates for whom you have useable salary
information is 92%.
Example 2: Useable Salary Information
If 100 graduates had accepted a job by three months after graduation, 78 of those graduates provided
useable salary information, and you have useable salary information from employers for 14 other
graduates, the percent of job-accepting graduates for whom you have useable information is 92%.
Footnote Example:
This salary report is based upon useable salary information from 92% of the graduates who accepted a
job by three months after graduation.
5. INTERIM REPORTS: Schools may wish to prepare and publish any number of interim reports
prior to the end of the data collection period (one month past your three month post-graduation
date). However, schools should date those interim reports and clearly indicate that those reports
are interim reports.
6. If your school has reliable data on 100 percent of the total graduating class or 100 percent of the
MBA graduates seeking employment before the end of your data collection period, then your
school may publish your data as of that date. .
Example: Interim Reports
This is an INTERIM REPORT. A final Full-Time MBA Employment Report, which will include all
information received as of (the end of the data collection period) will be published at a later date.
Footnote Example:
This is XYZ UNIVERSITY’S FINAL FULL-TIME MBA Employment Report. It is based upon information
from 100 percent of the MBA graduates seeking employment.

MBA CSEA Standards for Reporting
Full-Time MBA Employment Statistics©
Page | 29
APPENDICES
MBA CSEA Standards for Reporting
Full-Time MBA Employment Statistics©
Page | 30
APPENDIX I – GEOGRAPHIC REGIONS
COMPOSITION OF MAJOR AREAS AND REGIONS
From United Nations, Department of Economic and Social Affairs, Population Division (2015).
2015 Revision of World Population Prospects (http://esa.un.org/unpd/wpp/).
AFRICA
Eastern Africa
Burundi
Comoros
Djibouti
Eritrea
Ethiopia
Kenya
Madagascar
Malawi
Mauritius
Mayotte
Mozambique
Réunion
Rwanda
Seychelles
Somalia
South Sudan
Uganda
United Republic of Tanzania
Zambia
Zimbabwe
Middle Africa
Angola
Cameroon
Central African Republic
Chad
Congo
Democratic Republic of the Congo
Equatorial Guinea
Gabon
Sao Tome and Principe
Northern Africa
Algeria
Egypt
Libyan Arab Jamahiriya
Morocco
Sudan
Tunisia
Western Sahara
Southern Africa
Botswana
Lesotho
Namibia
South Africa
Swaziland
Western Africa
Benin
Burkina Faso
Cabo Verde
Côte d'Ivoire
Gambia
Ghana
Guinea
Guinea-Bissau
Liberia
Mali
Mauritania
Niger
Nigeria
Saint Helena
Senegal
Sierra Leone
Togo
ASIA
Eastern Asia
China
China, Hong Kong SAR
China, Macao SAR
Democratic People's Republic of Korea
Japan
Mongolia
Republic of Korea
MBA CSEA Standards for Reporting
Full-Time MBA Employment Statistics©
Page | 31
South-Central Asia
Afghanistan
Bangladesh
Bhutan
India
Iran (Islamic Republic of)
Kazakhstan
Kyrgyzstan
Maldives
Nepal
Pakistan
Sri Lanka
Tajikistan
Turkmenistan
Uzbekistan
South-Eastern Asia
Brunei Darussalam
Cambodia
Indonesia
Lao People's Democratic Republic
Malaysia
Myanmar
Philippines
Singapore
Thailand
Timor Leste
Viet Nam
Western Asia
Armenia
Azerbaijan
Bahrain
Cyprus
Georgia
Iraq
Israel
Jordan
Kuwait
Lebanon
Oman
Qatar
Saudi Arabia
State of Palestine
Syrian Arab Republic
Turkey
United Arab Emirates
Yemen
EUROPE
Eastern Europe
Belarus
Bulgaria
Czech Republic
Hungary
Poland
Republic of Moldova
Romania
Russian Federation
Slovakia
Ukraine
Northern Europe
Åland Islands
Denmark
Estonia
Faeroe Islands
Finland
Guernsey
Iceland
Ireland
Isle of Man
Jersey
Latvia
Lithuania
Norway
Sweden
United Kingdom of Great Britain and
Northern Ireland
Southern Europe
Albania
Andorra
Bosnia and Herzegovina
Croatia
Gibraltar
Greece
Holy See

MBA CSEA Standards for Reporting
Full-Time MBA Employment Statistics©
Page | 32
Italy
Malta
Montenegro
Portugal
San Marino
Serbia
Slovenia
Spain
TFYR of Macedonia
Western Europe
Austria
Belgium
France
Germany
Liechtenstein
Luxembourg
Monaco
Netherlands
Switzerland
LATIN AMERICA and the
CARIBBEAN
Caribbean
Anguilla
Antigua and Barbuda
Aruba
Bahamas
Barbados
Bonaire, Saba and Sint Eustatius
British Virgin Islands
Cayman Islands
Cuba
Curaçao
Dominica
Dominican Republic
Grenada
Guadaloupe
Haiti
Jamaica
Martinique
Montserrat
Puerto Rico
Saint Kitts and Nevis
Saint Lucia
Saint Vincent and the
Grenadines
Sint Maarten (Dutch part)
Trinidad and Tobago
Turks and Caicos Islands
United States Virgin
Islands
Central America
Belize
Costa Rica
El Salvador
Guatemala
Honduras
Mexico
Nicaragua
Panama
South America
Argentina
Bolivia (Plurinational State of)
Brazil
Chile
Colombia
Ecuador
Falkland Islands (Malvinas)
French Guiana
Guyana
Paraguay
Peru
Suriname
Uruguay
Venezuela (Bolivarian Republic of)
NORTH AMERICA
Bermuda
Canada
Greenland
Saint Pierre and Miquelon
United States of America
MBA CSEA Standards for Reporting
Full-Time MBA Employment Statistics©
Page | 33
OCEANIA
Australia and New Zealand
Australia
New Zealand
Norfolk Island
Melanesia
Fiji
New Caledonia
Papua New Guinea
Solomon Islands
Vanuatu
Micronesia
Guam
Kiribati
Marshall Islands
Micronesia (Federated States of)
Nauru
Northern Mariana Islands
Palau
Polynesia
American Samoa
Cook Islands
French Polynesia
Niue
Pitcairn
Samoa
Tokelau
Tonga
Tuvalu
Wallis and Futuna Islands
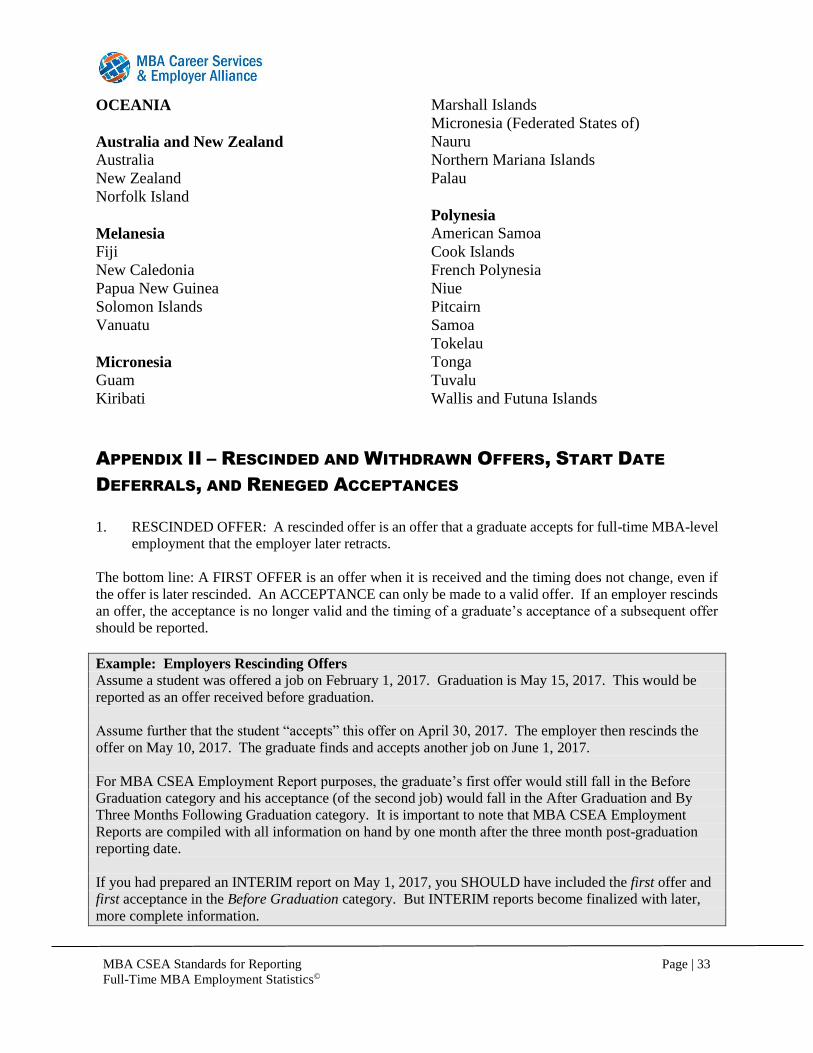
APPENDIX II – RESCINDED AND WITHDRAWN OFFERS, START DATE
DEFERRALS, AND RENEGED ACCEPTANCES
1. RESCINDED OFFER: A rescinded offer is an offer that a graduate accepts for full-time MBA-level
employment that the employer later retracts.
The bottom line: A FIRST OFFER is an offer when it is received and the timing does not change, even if
the offer is later rescinded. An ACCEPTANCE can only be made to a valid offer. If an employer rescinds
an offer, the acceptance is no longer valid and the timing of a graduate’s acceptance of a subsequent offer
should be reported.
Example: Employers Rescinding Offers
Assume a student was offered a job on February 1, 2017. Graduation is May 15, 2017. This would be
reported as an offer received before graduation.
Assume further that the student “accepts” this offer on April 30, 2017. The employer then rescinds the
offer on May 10, 2017. The graduate finds and accepts another job on June 1, 2017.
For MBA CSEA Employment Report purposes, the graduate’s first offer would still fall in the Before
Graduation category and his acceptance (of the second job) would fall in the After Graduation and By
Three Months Following Graduation category. It is important to note that MBA CSEA Employment
Reports are compiled with all information on hand by one month after the three month post-graduation
reporting date.
If you had prepared an INTERIM report on May 1, 2017, you SHOULD have included the first offer and
first acceptance in the Before Graduation category. But INTERIM reports become finalized with later,
more complete information.
MBA CSEA Standards for Reporting
Full-Time MBA Employment Statistics©
Page | 34
The Standards provide that schools may footnote instances of employers rescinding accepted offers
in the school’s final report. Footnote examples can be found below.
2. WITHDRAWN OFFERS: A withdrawn offer is defined as a Full-Time MBA-level employment
offer made to a graduate that is later withdrawn before the graduate accepts the offer.
The bottom line: A FIRST OFFER is an offer when it is received and the timing does not change, even if
the offer is later withdrawn.
Example: Offer Withdrawal
Assume a student was offered a job on February 1, 2017. Graduation is May 15, 2017.
This would be reported as an offer received Before Graduation. The employer then withdraws the offer on
May 10, 2017. The graduate finds and accepts another job on June 1, 2017.
For MBA CSEA Employment Report purposes, the graduate’s first offer would still fall in the Before
Graduation category, and his acceptance (of the second job) would fall in the After Graduation and By
Three Months Following Graduation category. It is important to note that MBA CSEA Employment
Reports are compiled with all information on hand by one month after the three month post-graduation date.
If you had prepared an INTERIM report on May 1, 2017, you SHOULD have included this first offer in
the Before Graduation category.
The Reporting Standards provide that schools may footnote instances of employers withdrawing
offers in the school’s final report.
3. START DATE DEFERRALS BY EMPLOYERS: Include in a footnote the number and percent of
graduates impacted by employer-deferred employment starting dates about which you have
knowledge from any reliable source. You are encouraged to make appropriate back-up notes to
support your data. This applies to deferrals of accepted jobs and not to offers that have not been
accepted. The equation is the number of job seeking graduates with offers that have employer-
deferred employment starting dates / the number of Full-Time MBA graduates accepting employment
= percent.
Example: Offer Deferrals
Twelve graduates inform you that their new employers have notified them that their employment starting
dates have been deferred for as much as six months. Another five employers inform you of five additional
graduates whose starting date has been deferred (for a total of 17 deferrals). There are 200 Full-Time MBA
graduates who accepted employment.
Footnote Example: Employers deferred 17 graduates’ employment starting dates. This impacted 8.5 percent of Full-Time MBA
graduates who had accepted employment.
4. RENEGED ACCEPTANCES: A reneged acceptance is an acceptance that a graduate at a later date
chooses not to honor. You may include in a footnote the number and percent of graduates who renege
on their acceptance of a job about which you have knowledge from any reliable source. The equation
is the number of job seeking graduates reneging on an accepted job offer / total Full-Time MBA
graduates accepting employment = percent.

MBA CSEA Standards for Reporting
Full-Time MBA Employment Statistics©
Page | 35
Example: Reneged Offers Five employers inform you that five of your graduates reneged on a job, which they previously accepted.
There are 160 Full-Time MBA graduates who accepted employment. Therefore, 3.1% of the graduates
reneged on offers they had accepted.
APPENDIX III – STANDARDS HISTORY
Listed below are the substantive changes made to the Standards. They are listed in order of the academic
year they were recommended by the Standards Committee and approved by the Board of Directors.
Significant changes have not been effective until the following reporting year’s cycle.
SUBSTANTIVE CHANGES MADE IN THE 2004 – 2005 REPORTING YEAR:
(Month/Year approved by Board of Directors)
To ensure an accurate and complete list of world regions, the US Census Bureau definitions were
adopted for the geographic country/region breakdown. (June 2004)
To meet the changing needs of schools’ reporting practices, the industry category breakdown was
expanded. This had the additional benefit of making it easier for schools to respond to media
requests for industry information. (June 2004)
In response to member interest in more complete data, the minimum target for the “percent of
total graduates for whom your school has information” was increased from 80% to 85% and put
into effect beginning with the Class of 2006. In addition, the word “recommended” was removed
before “minimum target” to provide greater clarity. This change was prompted by the Agreed
Upon Procedures (AUP) process. (April 2005)
To improve the ability for international schools to represent their students in a more meaningful
manner, the language for accounting for all graduates was changed. The employment reports
would focus on Full-Time MBA graduates within three major categories: Permanent Work
Authorization, Non-Permanent Work Authorization, and all MBA graduates with a footnote
defining Permanent Work Authorization (to improve the international understanding of the
Standards). (April 2005)
To clarify the timing of collecting and reporting offer and acceptance data, the charts indicating
the number and percent of job seeking full-time graduates and when they received either job
offers and/or accepted offers was revised. The statement “Received their first offer more than
three months after graduation” was deleted. For Standards purposes, this is not relevant data,
though a school may choose to collect it for its own purposes. (April 2005)
SUBSTANTIVE CHANGES MADE IN THE 2005 – 2006 REPORTING YEAR:
In order to make the Standards more “user-friendly, all the documents were reorganized and
consolidated into one document. This included the 1st edition (1999), 2nd edition (2002), FAQs
(1999) and any additional changes made after 2002. (2005-2006)
With the goal of working towards the internationalization of the Standards, for schools outside
the US, the MBA CSEA decided to release currency conversion rates between the reporting cycle
cutoff date (June 30th) and data collection date (September 30th). Schools could convert salary
reported in €, £, or C$ to $ on or near the data collection cutoff date (September 30). (December
2005)

MBA CSEA Standards for Reporting
Full-Time MBA Employment Statistics©
Page | 36
In order to provide clarity, the word “recommended” was removed before “minimum target” for
the percent of “job accepting graduates providing useable salary information”. This change was
prompted by the effort to provide comparable data as well as by the AUP process. (December
2005)
SUBSTATIVE CHANGES MADE IN THE 2011 – 2012 REPORTING YEAR:
In continuing the effort to make the Standards more useful and easer to adopt globally, a note was
added in Section B of the Standards to clarify that graduation date is defined as the earliest date at
which the university represents that the students have completed their degree requirements. In
some locations, there is a long period of time between completion of degree requirements and the
actual graduation ceremony. Instruction was added in Section H requiring that universities list
their graduation dates for the reporting year.
The definition of the data collection period was redefined, to allow global programs to more
easily adopt the Standards. The data collection cut off was changed from a fixed date of
September 30th, to a relative date of one month past the final three month post-graduation
reporting date. For example if the final graduation date of the reporting year is June 1, the three
month post-graduation reporting date is September 1 and the end of the data collection period for
that reporting year is October 1.
In Section F of the Standards, Non-US based schools can report and publish their employment
reports in their local currency as well as in US dollars. The other addition in Section F allows
programs to express their compensation tables with country-level purchase price parity
multipliers as supplied by IMF-WEO tables. The IMF-WEO tables have PPP conversions for 184
countries. The conversions are based on global survey of prices for a wide range of goods and
services. According to the website the statistics are updated twice a year.
The World Region breakdown in Table 4.D was updated to more accurately reflect the world
geographical regions in 2012. Mexico is included in the Central America region and taken out of
the North America Table 4.E.
SUBSTATIVE CHANGES MADE IN THE 2014 – 2015 REPORTING YEAR:
To ensure that schools attempt to contact the graduates they have not heard from near the end of
the collection period, the No Information category was relabeled the No Recent Information
category, a time parameter was established to determine that any graduate who had not provided
recent information be contacted in the final month of the collection period, and a time parameter
was established that information received two months prior to graduation or after was considered
recent.
The way to classify graduates whose status changes during the reporting period was outlined.
The definition of “work authorization” was expanded to specify that it is for the location where
the school is located.
The definition of “MBA-level job” was updated to make clear that the job need not require an
MBA.
Clarification was added to indicate that although job offers do need not always be in writing, the
knowledge of the offers needs to be documented by the Career Center.
The appropriate use of social media as a source of employment information was specified.
Additional specification was added clarifying that the number of graduates going to a specific
industry, function, or geography should reflect graduates accepting, not graduates reporting salary
information.
MBA CSEA Standards for Reporting
Full-Time MBA Employment Statistics©
Page | 37
Schools’ options for classifying students in industries and functions that did not meet minimum
data thresholds were illustrated in expanded examples.
Optional ways to expand the minimum function list were provided.
Schools’ options for classifying the industry of a company in multiple lines of business were
outlined.
Industry categories were changed slightly, and examples of optional subcategories were added.
SUBSTANTIVE CHANGES MADE IN THE 2016 – 2017 REPORTING YEAR:
To clarify the use of this Standards document in the year that Standards for Part-Time MBAs and
Specialty Masters Programs were launched, Full-Time was added to the name of this Standards
document.
To increase comparability in reporting across programs, the Other category of students was
removed. With Part-Time students being reported under separate Standards, Accounting for All
Students was simplified, and a table was eliminated.
To make the name of process formerly known as Agreed Upon Procedures clearer, it was
changed to Standards Compliance Review.
To make the Sources of Job Acceptances more relevant, a shorter and more updated list of
sources was adopted. To bring tables into agreement on the treatment of students for whom no
information existed, the “no information” row was removed.
To reflect the common timing of payments of Signing Bonus, the measure was renamed
Signing/Starting Bonus.
To promote the sharing of valid information and in recognition of research that showed that Other
Guaranteed Compensation had become an unreliable measure, the measure was eliminated.
To permit the calculation of industry-wide weighted average salaries, the number of students
providing salary was added to salary tables that did not previously contain that information.
To ensure career services professionals’ ability to protect student confidentiality, a statement was
added that schools may decline to report information that meets data minimums if doing so would
compromise student confidentiality, in the professionals’ judgment.
To facilitate the calculation of percentages of students entering each function, industry, and
geographic area, it was clarified that the denominator for all such tables should be the number of
students providing the classifying information, which agreed with widespread industry practice.
To ensure a balanced representation of all world regions, the United Nations’s definitions were
adopted for World regions and tables were added collecting information on employment within
regions of all major areas. The UN was identified as an external, and therefore regularly
refreshed, source of information to which members can refer for definitions, and the latest list of
regions in each major area was included in an appendix. As a result of this change, US
Possessions and Territories now appear in their respective geographic areas.
To ease the burden of data collection and reporting on schools, certain tables that could be
onerous to produce with limited resources were identified as optional: Compensation by Years of
Work Experience, Compensation by Undergraduate Major, and the new Regional tables outside
of the World Region table and the one corresponding to the school’s home region.
To ensure that the Standards were helpful to schools in challenging market conditions but not
unnecessarily onerous in normal market conditions, footnotes for reneged acceptances, rescinded
offers, and delayed start dates were made optional.
MBA CSEA Standards for Reporting
Full-Time MBA Employment Statistics©
Page | 38
HISTORY OF THE STANDARDS
In July 1994, the MBA Employment Statistics Standards Committee was formed at the MBA Career
Services & Employer Alliances’s (formerly MBA Career Services Council) inaugural meeting in San
Diego, California. Pete League (George Mason University), Glen Payne (University of Maryland) and
Jackie Wilbur (Babson College) agreed to lead the effort to conduct a survey of then current reporting
practices and report back to the membership at the next meeting in Toronto, Canada in June 1995.
The survey was conducted, and Mr. League and Ms. Wilbur presented a report as requested (Mr. Payne had
withdrawn from the committee upon accepting other employment). The survey data indicated a wide
variance in how MBA programs reported employment statistics. The data clearly showed that some
programs were reporting statistics based upon information provided by as few as 10-20 percent of their
graduates. There were no recognized standards nor common definitions (or informal understandings) of
the key components of a quality employment report. Additionally, few published reports provided adequate
footnotes to enable the reader to understand exactly what was being presented.
At the June 1995 Toronto meeting, the committee was expanded and asked to develop specific preliminary
reporting recommendations and to submit those recommendations at the June 1996 meeting in Chicago.
During the next year, the committee met in Fairfax, Virginia and in Atlanta, Georgia and developed its
recommendations. Mr. League (then with the Monterey Institute of International Studies) and Ms. Wilbur
(then with Georgetown University) presented a formal report at the June 1996 Chicago meeting.
Approximately 25 schools volunteered, as pilot schools, to use the preliminary standards in developing their
MBA employment statistics during the next year. The committee was asked to incorporate a number of
recommendations, meet again, and report to the MBA Career Services Council Board in December 1996.
The Board adopted the committee’s recommendations in December 1996.
During the 1997 and 1998 MBA Career Services & Employer Alliance annual meetings, additional
membership comments and suggestions were solicited and accepted. The first edition of the reporting
standards was adopted in 1999. The second edition, adopted February 2002, is based on feedback from the
membership over the previous year and the identification of new situations that arose in the employment
market. Modifications were made which addressed both employers’ and students’ rescission and reneging
of offers, respectively.
2016 – 2017 COMMITTEE MEMBERS
Shannon Caldwell, University of Georgia (Co-Chair)
Tracy Handler, New York University (Co-Chair)
Emily Anderson, Vanderbilt University
Liza Kirkpatrick, Northwestern University
Lesley Kromer, Carnegie Mellon University
Susan Lemke, Babson College
Barbara Lindquist, Georgia Institute of Technology
Jeff McNish, University of Virginia
Paul Steven, University of Chicago
Kathi To, New York University
Wendy Tsung, Emory University
ADVISORS to the 2016-2017 COMMITTEE
Megan Hendricks, MBA CSEA
Wayne France, MBA CSEA

MBA CSEA Standards for Reporting
Full-Time MBA Employment Statistics©
Page | 39
2013 – 2014 and 2014-2015 COMMITTEE MEMBERS (changes adopted 2014-2015)
Nicole Hall, Wake Forest University (Co-Chair, 2013-14 and 2014-15)
Emily Anderson, Vanderbilt University (Co-Chair, 2013-14)
Mark Peterson, Iowa State University (Co-Chair, 2014-15)
Collene Burns, University of Rochester
Shannon Caldwell, University of Georgia
Tracy Handler, New York University
Helga Kirchner, ESADE
Lesley Kromer, Carnegie Mellon University
Barbara Lindquist, Georgia Institute of Technology
Jonathan Masland, Dartmouth University
Paul Poissant, The Pennsylvania State University
Kathi To, New York University
Wendy Tsung, Emory University
Derek Walker, Oxford University
Damian Zikakis, University of Michigan
ADVISOR to the 2013-2014 and 2014-2015 COMMITTEE
Megan Hendricks, MBA CSEA
2011 – 2012 COMMITTEE MEMBERS
Emily Anderson, Vanderbilt University (Co-Chair)
Beth Rehman, Thunderbird University (Co-Chair)
Deanna Fuehne, Rice University (Media Liaison)
Kip Harrell, Thunderbird
Tracy Handler, Baruch College
Derek Walker, Oxford University
Nicole Hall, Wake Forest University
Shane Sugino, Northwestern University
Lesley Kromer, Carnegie Mellon University
Damian Zikakis, University of Michigan
Kathi To, New York University
ADVISORS to the 2011-2012 COMMITTEE
Ken Keeley, Carnegie Mellon University retired
Julie Morton, University of Chicago
Jackie Wilbur, MIT University
2006 – 2007 COMMITTEE MEMBERS
Ken Keeley, Carnegie Mellon University (Co-Chair - Media)
Sue Kline, Massachusetts Institute of Technology (Co-Chair – Committee)
Julie Morton, University of Chicago (former Chair, current GMAC Liaison)
Emily Anderson, Vanderbilt University
Wayne France, University of Rochester
Phil Han, University of California at Los Angeles
Tracy Handler, Baruch College
Kip Harrell, Thunderbird
Christa Hinton, DePaul University
MBA CSEA Standards for Reporting
Full-Time MBA Employment Statistics©
Page | 40
Stephen Labarbera, University of Florida
Debra Rizzo, University of Virginia
FORMER COMMITTEE MEMBERS Andrew Adams, University of Pennsylvania
Mary Banks, University of Colorado - Boulder
Jamie King Belinne, University of Texas - Austin
Sheila Bennett, Yale University
David Bergheim, Emory University
Trina Callie, University of Arizona (former Chair)
Deborah Chereck, Oregon State University
Helen Dashney, Michigan State University
Alan Ferrell, Purdue University
Betsy Kacizak, University of Wisconsin – Madison
Kay Keck, Thunderbird
Pete League, Monterrey Institute of International Studies (former Chair)
Kori Neville, Emory University
Barry O'Donnell, Virginia Technical University
Margaret O'Hara, New York University
Nancy Ortman, Emory University
Jerry Paschal, University of South Carolina
Lawson Pride, Loyola University, Chicago
Samantha Renfro, Emory University
Barbara Robinson, Florida State University
Roland Ruble, Rollins College
Nita Saylor, Wake Forest University
Ann Stringfellow, University of Colorado
Glenn Sykes, University of Chicago
Peter Veruki, Rice University
Jackie Wilbur, Massachusetts Institute of Technology (former Chair)
Randy Williams, University of California - Irvine