Embed Size (px)
Citation preview
MBA795Strategy Formulation
Steven E. PhelanSteven E. Phelan
IntroductionCourse ObjectivesCourse AssessmentGroup Formation
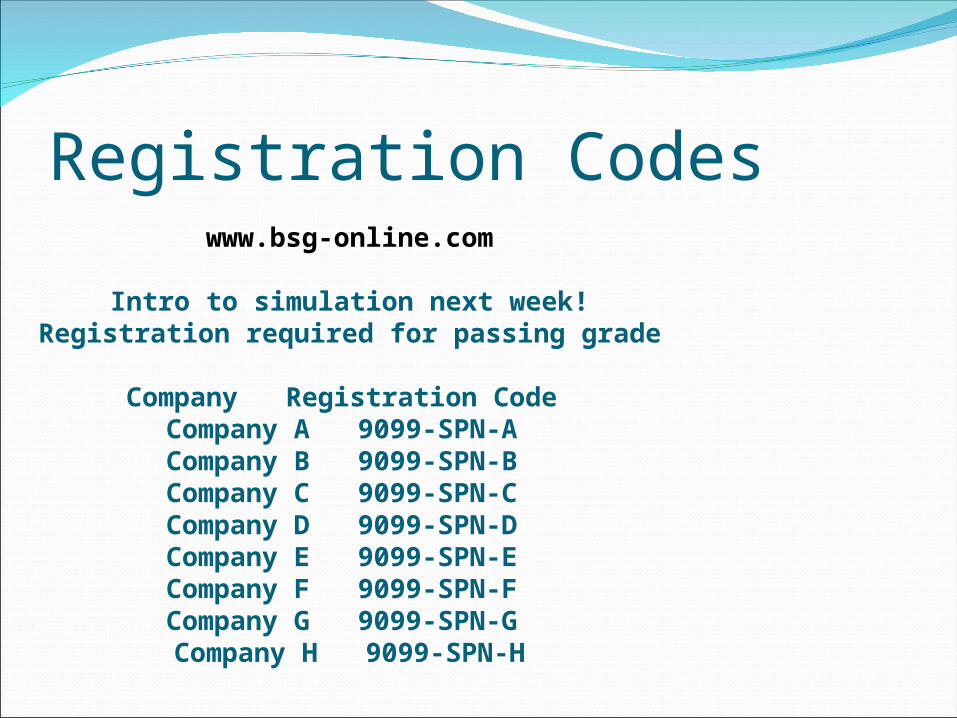
Registration Codeswww.bsg-online.com
Intro to simulation next week!Registration required for passing grade
Company Registration Code Company A 9099-SPN-A Company B 9099-SPN-B Company C 9099-SPN-C Company D 9099-SPN-D Company E 9099-SPN-E Company F 9099-SPN-F Company G 9099-SPN-G Company H 9099-SPN-H
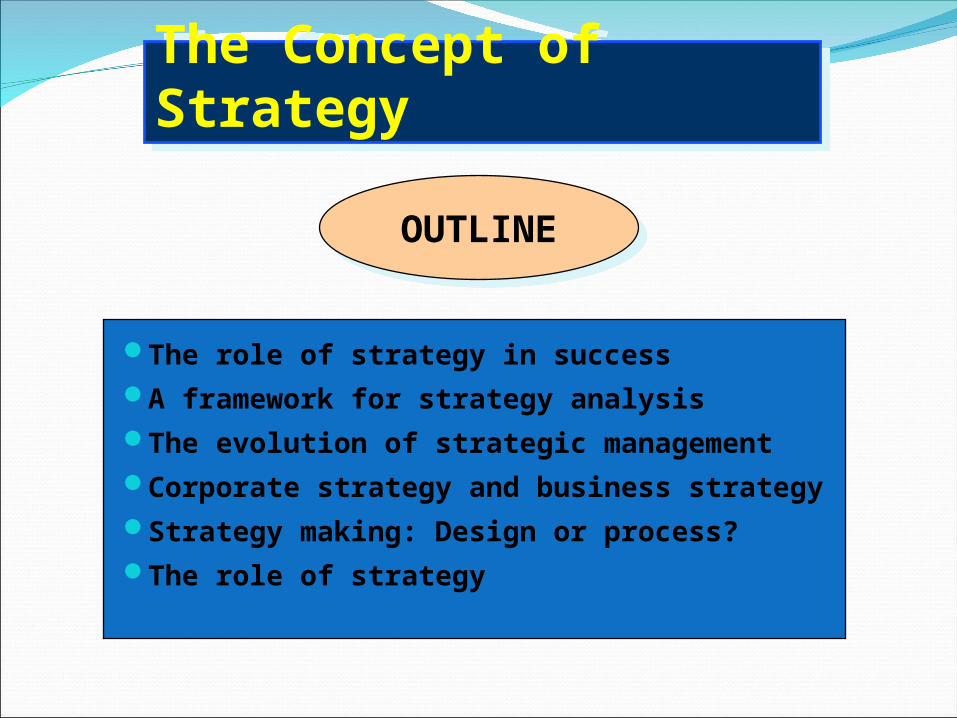
The Concept of StrategyThe Concept of Strategy
The role of strategy in successA framework for strategy analysis
The evolution of strategic management
Corporate strategy and business strategy
Strategy making: Design or process?
The role of strategy
OUTLINEOUTLINE
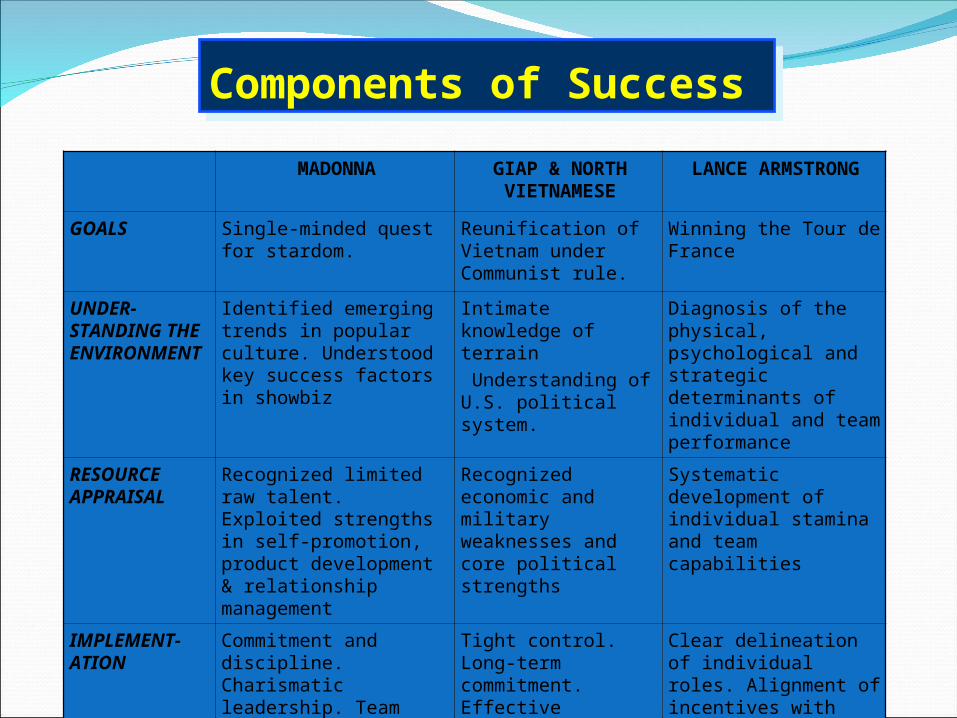
Components of SuccessComponents of Success
MADONNA GIAP & NORTH VIETNAMESE
LANCE ARMSTRONG
GOALS Single-minded quest for stardom.
Reunification of Vietnam under Communist rule.
Winning the Tour de France
UNDER-STANDING THE ENVIRONMENT
Identified emerging trends in popular culture. Understood key success factors in showbiz
Intimate knowledge of terrain
Understanding of U.S. political system.
Diagnosis of the physical, psychological and strategic determinants of individual and team performance
RESOURCE APPRAISAL
Recognized limited raw talent. Exploited strengths in self-promotion, product development & relationship management
Recognized economic and military weaknesses and core political strengths
Systematic development of individual stamina and team capabilities
IMPLEMENT- ATION
Commitment and discipline. Charismatic leadership. Team building. Attention to detail.
Tight control. Long-term commitment. Effective propaganda. Inspirational leadership.
Clear delineation of individual roles. Alignment of incentives with team goals. Nurturing esprit de corp
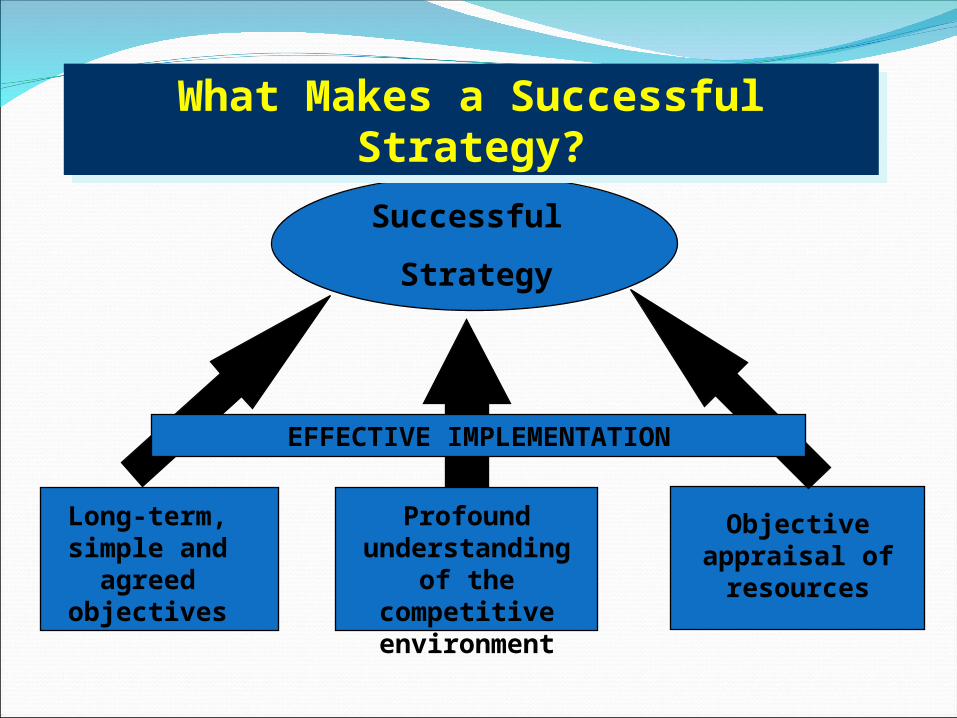
Successful
Strategy
Long-term, simple and
agreed objectives
Profound understanding of the competitive
environment
Objective appraisal of resources
What Makes a Successful Strategy?What Makes a Successful Strategy?
EFFECTIVE IMPLEMENTATION
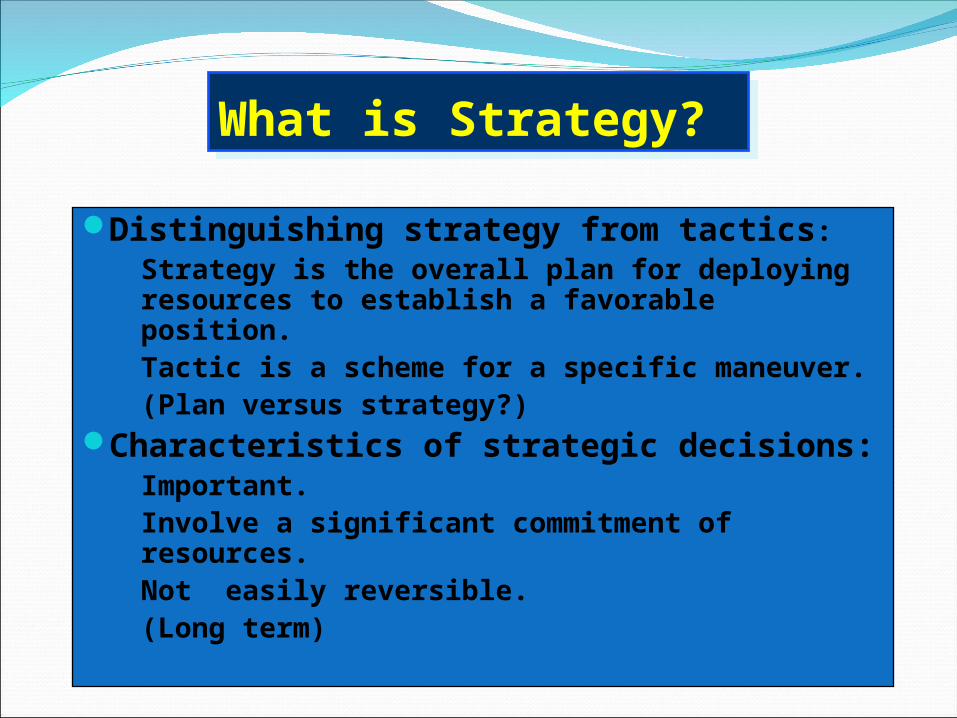
What is Strategy?What is Strategy?
Distinguishing strategy from tactics:Strategy is the overall plan for deploying
resources to establish a favorable position.Tactic is a scheme for a specific maneuver.(Plan versus strategy?)
Characteristics of strategic decisions:Important.Involve a significant commitment of resources.Not easily reversible.(Long term)
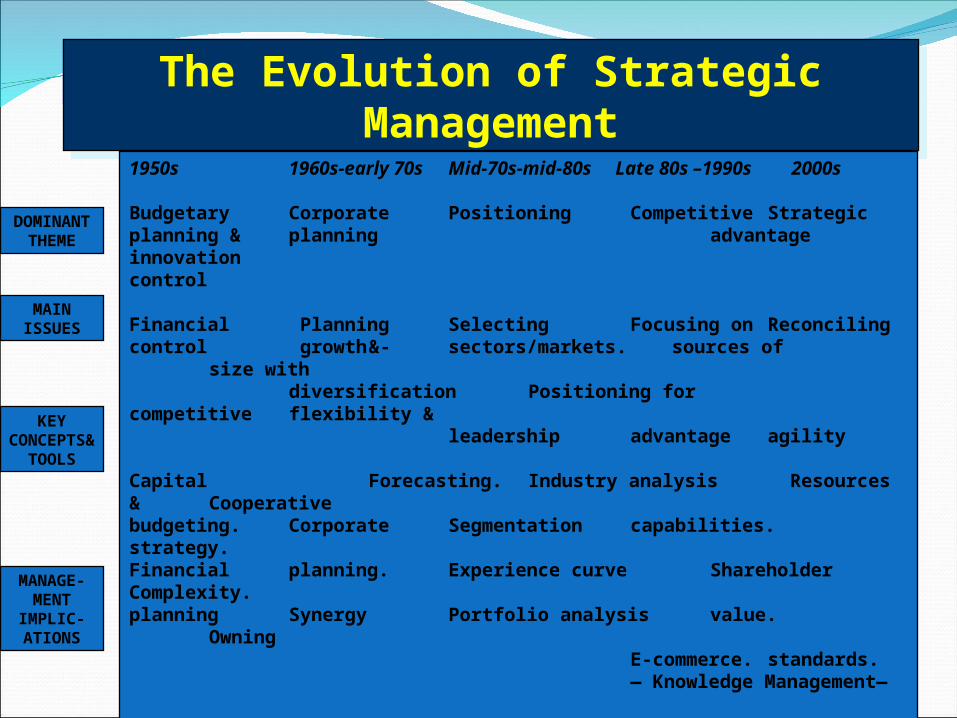
The Evolution of Strategic ManagementThe Evolution of Strategic Management
DOMINANTTHEME
1950s 1960s-early 70s Mid-70s-mid-80s Late 80s –1990s 2000s
Budgetary Corporate Positioning Competitive Strategicplanning & planning advantage innovationcontrol Financial Planning Selecting Focusing on Reconcilingcontrol growth &- sectors/markets. sources of size with
diversification Positioning for competitive flexibility &leadership advantage agility
Capital Forecasting. Industry analysis Resources & Cooperativebudgeting. Corporate Segmentation capabilities. strategy.Financial planning. Experience curve Shareholder Complexity. planning Synergy Portfolio analysis value. Owning
E-commerce. standards. — Knowledge Management—
Coordination Corporate Diversification. Restructuring. Alliances && control by planning depts. Global strategies. Reengineering. networksBudgeting created. Rise of Matrix structures Refocusing. Self -organizsystems corporate Outsourcing. ation & virtual
planning organization
MAINISSUES
KEY CONCEPTS
&TOOLS
MANAGE-MENT
IMPLIC-ATIONS

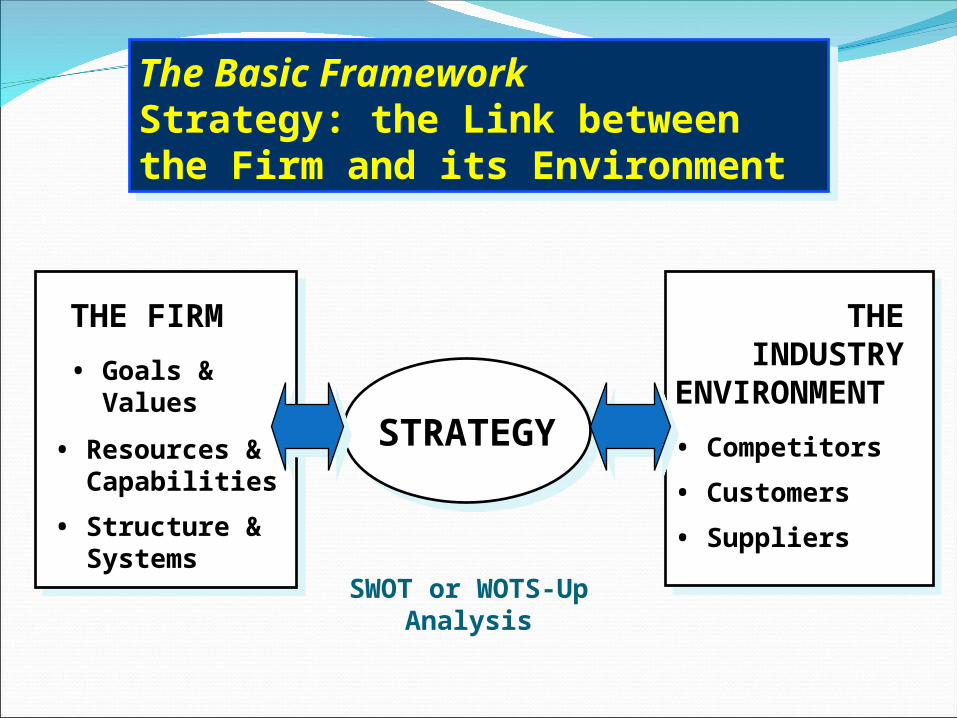
The Basic FrameworkStrategy: the Link between the Firm and its Environment
The Basic FrameworkStrategy: the Link between the Firm and its Environment
THE FIRM
• Goals & Values
• Resources & Capabilities
• Structure & Systems
THE FIRM
• Goals & Values
• Resources & Capabilities
• Structure & Systems
THE INDUSTRYENVIRONMENT
• Competitors
• Customers
• Suppliers
THE INDUSTRYENVIRONMENT
• Competitors
• Customers
• Suppliers
STRATEGYSTRATEGYSTRATEGY
SWOT or WOTS-UpAnalysis
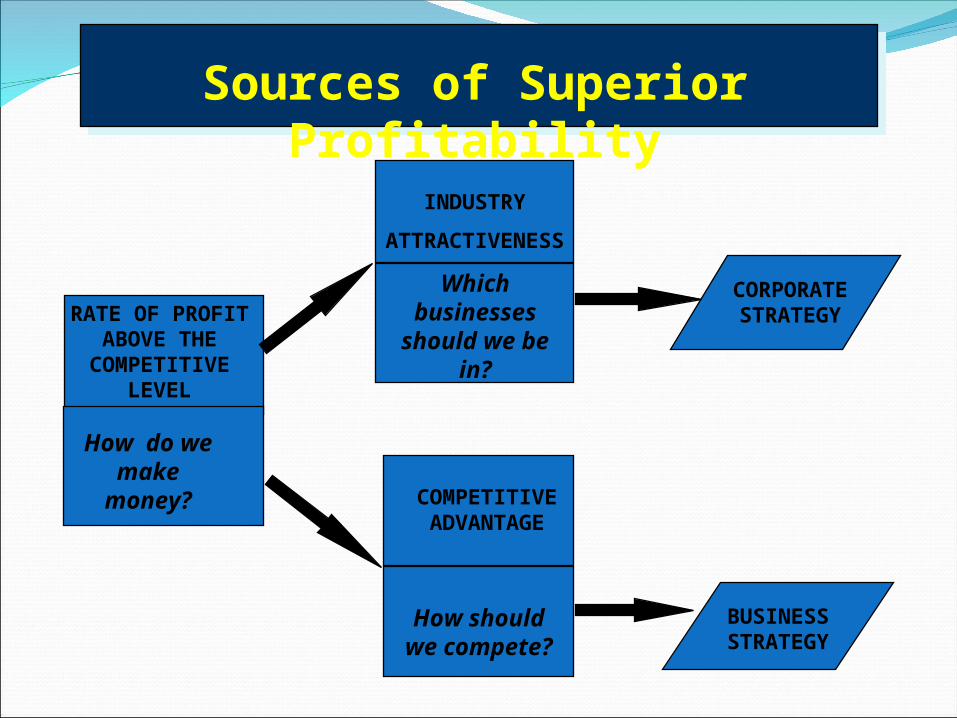
Sources of Superior Profitability
RATE OF PROFIT ABOVE THE
COMPETITIVE LEVEL
How do we make
money?
INDUSTRY
ATTRACTIVENESS
Which businesses
should we be in?
COMPETITIVE ADVANTAGE
How should we compete?
CORPORATE STRATEGY
BUSINESS STRATEGY
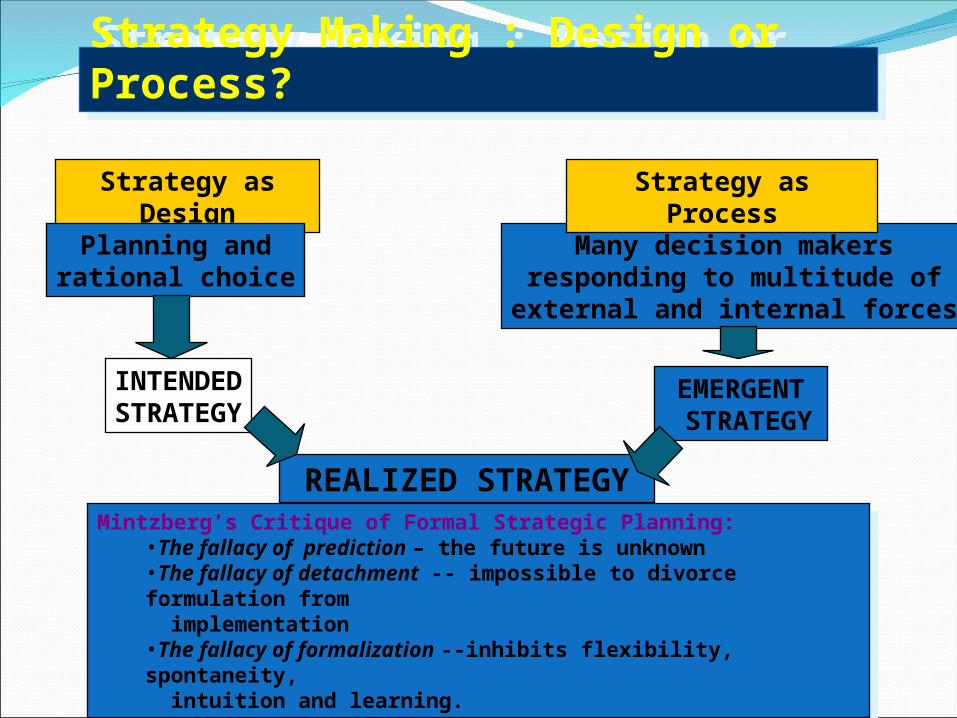
Strategy Making : Design or Process?Strategy Making : Design or Process?
Strategy as Design
Planning andrational choice
INTENDEDSTRATEGY
Many decision makersresponding to multitude ofexternal and internal forces
REALIZED STRATEGY
EMERGENT STRATEGY
Strategy as Process
Mintzberg’s Critique of Formal Strategic Planning:•The fallacy of prediction – the future is unknown•The fallacy of detachment -- impossible to divorce formulation from implementation•The fallacy of formalization --inhibits flexibility, spontaneity, intuition and learning.
Mintzberg’s Critique of Formal Strategic Planning:•The fallacy of prediction – the future is unknown•The fallacy of detachment -- impossible to divorce formulation from implementation•The fallacy of formalization --inhibits flexibility, spontaneity, intuition and learning.
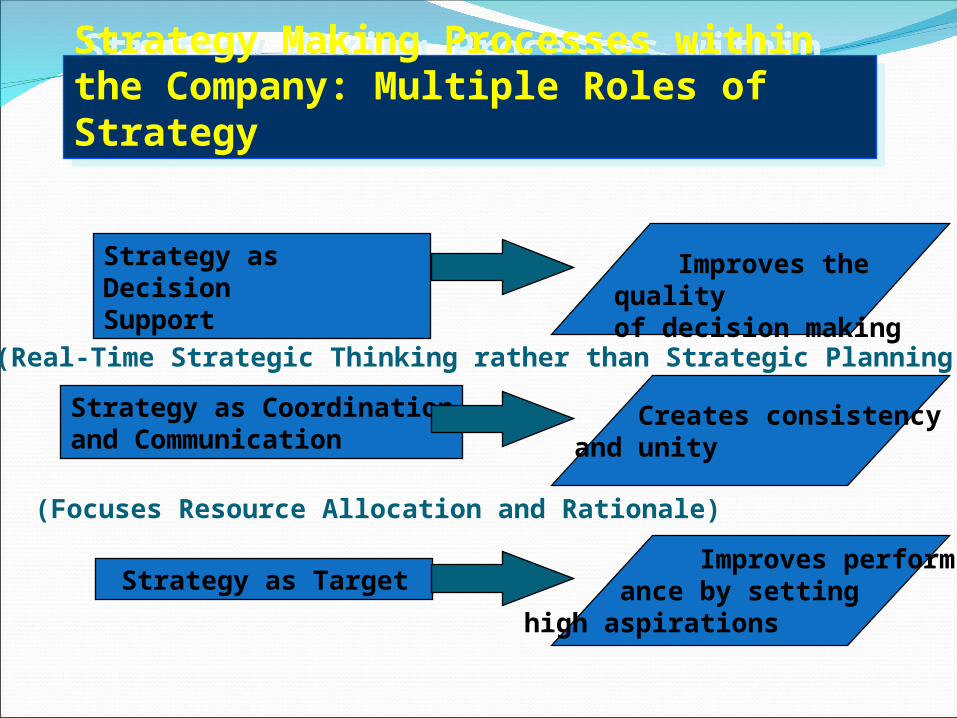
Strategy Making Processes within the Company: Multiple Roles of Strategy
Strategy Making Processes within the Company: Multiple Roles of Strategy
Strategy as DecisionSupport
Strategy as Coordinationand Communication
Strategy as Target
Improves the qualityof decision making
Creates consistencyand unity
Improves perform- ance by setting high aspirations
(Real-Time Strategic Thinking rather than Strategic Planning)
(Focuses Resource Allocation and Rationale)
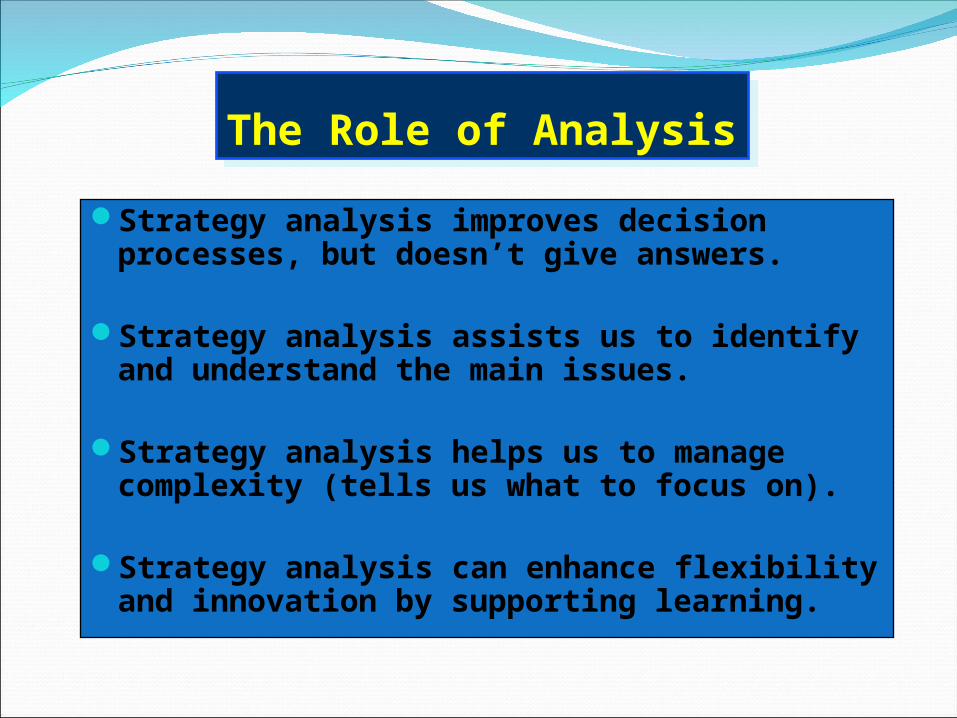
The Role of AnalysisThe Role of Analysis
Strategy analysis improves decision processes, but doesn’t give answers.
Strategy analysis assists us to identify and understand the main issues.
Strategy analysis helps us to manage complexity (tells us what to focus on).
Strategy analysis can enhance flexibility and innovation by supporting learning.
Goals, Values and PerformanceGoals, Values and Performance
Strategy as a quest for value
What is profit?
The shareholder value approach
The shareholder value and strategy formulation
Mission and values
OUTLINE
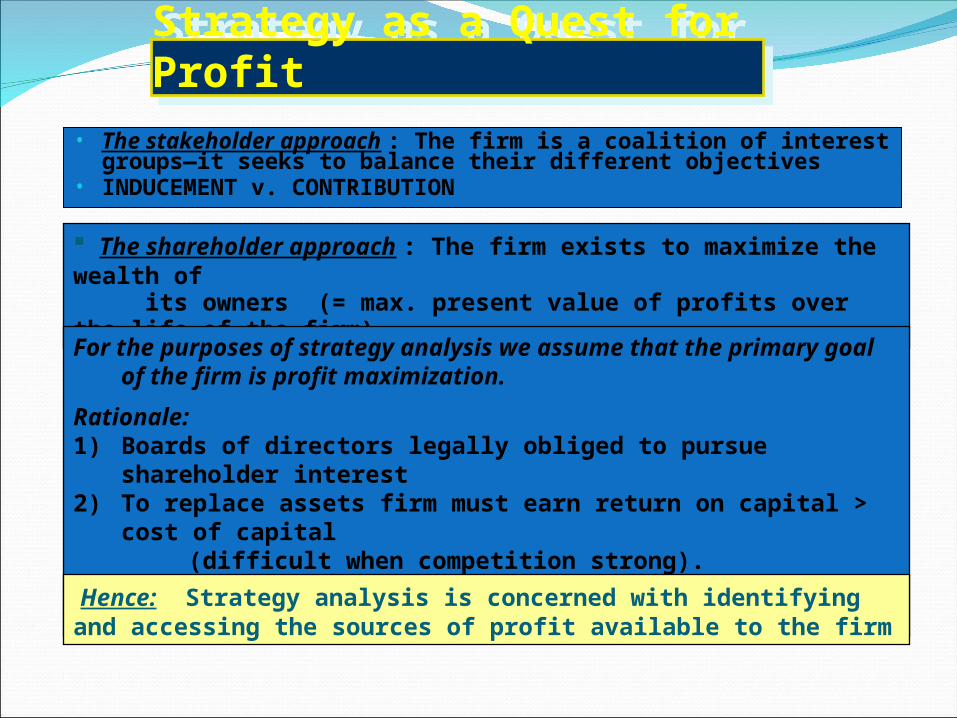
Strategy as a Quest for ProfitStrategy as a Quest for Profit• The stakeholder approach : The firm is a coalition of interest
groups—it seeks to balance their different objectives• INDUCEMENT v. CONTRIBUTION
The shareholder approach : The firm exists to maximize the wealth of its owners (= max. present value of profits over the life of the firm)
For the purposes of strategy analysis we assume that the primary goal of the firm is profit maximization.
Rationale:1) Boards of directors legally obliged to pursue shareholder interest2) To replace assets firm must earn return on capital > cost of capital (difficult when competition strong).3) Firms that do not max. stock-market value will be acquired
Hence: Strategy analysis is concerned with identifying and accessing the sources of profit available to the firm
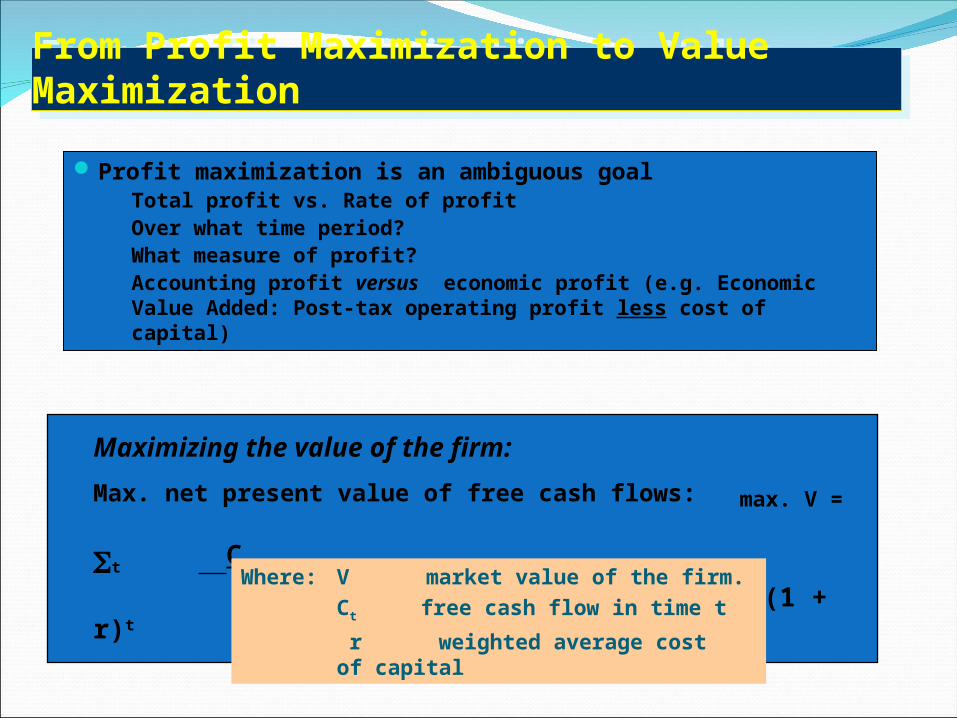
From Profit Maximization to Value MaximizationFrom Profit Maximization to Value Maximization
Profit maximization is an ambiguous goal Total profit vs. Rate of profit Over what time period? What measure of profit? Accounting profit versus economic profit (e.g. Economic
Value Added: Post-tax operating profit less cost of capital)
Maximizing the value of the firm:
Max. net present value of free cash flows: max. V = t Ct
(1 + r)t Where: V market value of the firm.
Ct free cash flow in time t
r weighted average cost of capital
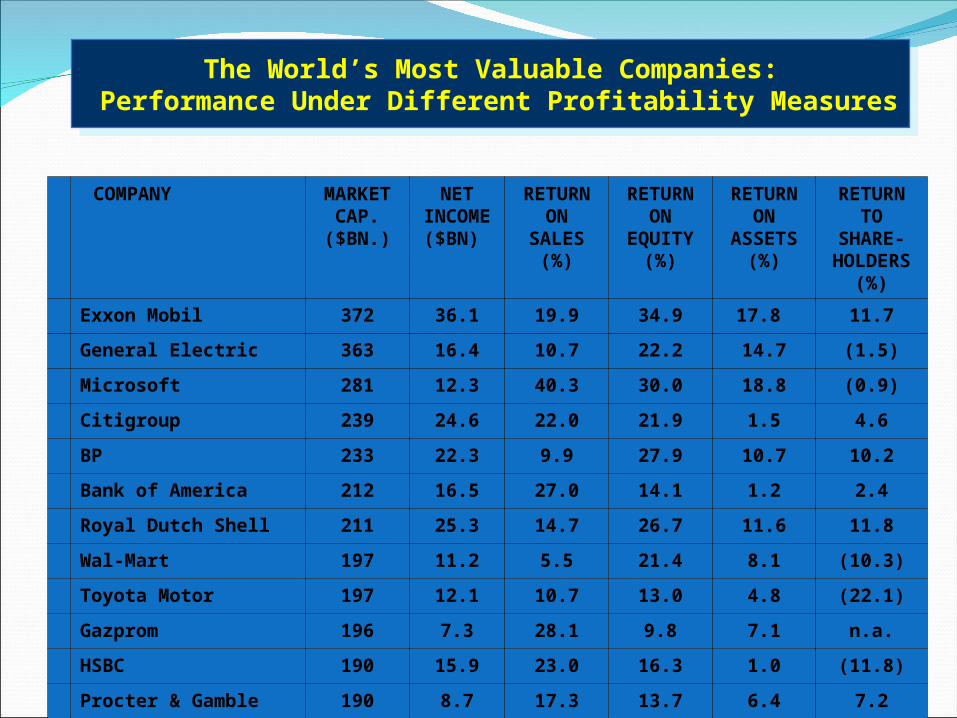
The World’s Most Valuable Companies: Performance Under Different Profitability Measures
The World’s Most Valuable Companies: Performance Under Different Profitability Measures
COMPANY MARKET CAP.
($BN.)
NET INCOME ($BN)
RETURN ON
SALES (%)
RETURN ON
EQUITY (%)
RETURN ON
ASSETS (%)
RETURN TO
SHARE-HOLDERS
(%)
Exxon Mobil 372 36.1 19.9 34.9 17.8 11.7
General Electric 363 16.4 10.7 22.2 14.7 (1.5)
Microsoft 281 12.3 40.3 30.0 18.8 (0.9)
Citigroup 239 24.6 22.0 21.9 1.5 4.6
BP 233 22.3 9.9 27.9 10.7 10.2
Bank of America 212 16.5 27.0 14.1 1.2 2.4
Royal Dutch Shell 211 25.3 14.7 26.7 11.6 11.8
Wal-Mart 197 11.2 5.5 21.4 8.1 (10.3)
Toyota Motor 197 12.1 10.7 13.0 4.8 (22.1)
Gazprom 196 7.3 28.1 9.8 7.1 n.a.
HSBC 190 15.9 23.0 16.3 1.0 (11.8)
Procter & Gamble 190 8.7 17.3 13.7 6.4 7.2
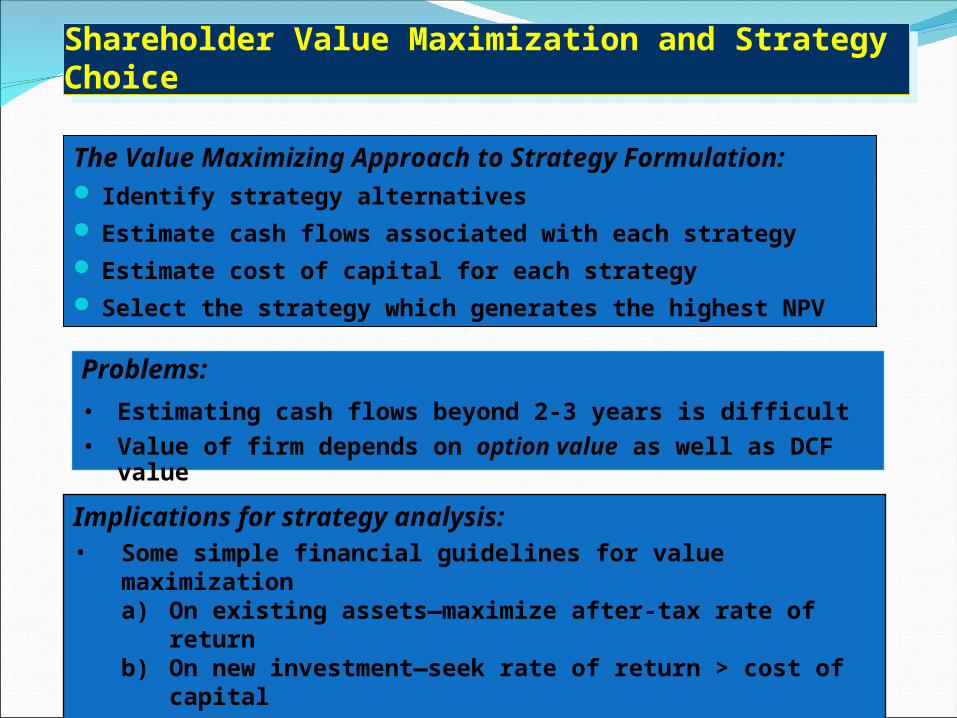
Shareholder Value Maximization and Strategy ChoiceShareholder Value Maximization and Strategy Choice
The Value Maximizing Approach to Strategy Formulation: Identify strategy alternatives Estimate cash flows associated with each strategy Estimate cost of capital for each strategy Select the strategy which generates the highest NPV
Problems:
• Estimating cash flows beyond 2-3 years is difficult
• Value of firm depends on option value as well as DCF value
Implications for strategy analysis: • Some simple financial guidelines for value maximization
a) On existing assets—maximize after-tax rate of returnb) On new investment—seek rate of return > cost of capital
• Utilize qualitative strategy analysis to evaluate future profit potential
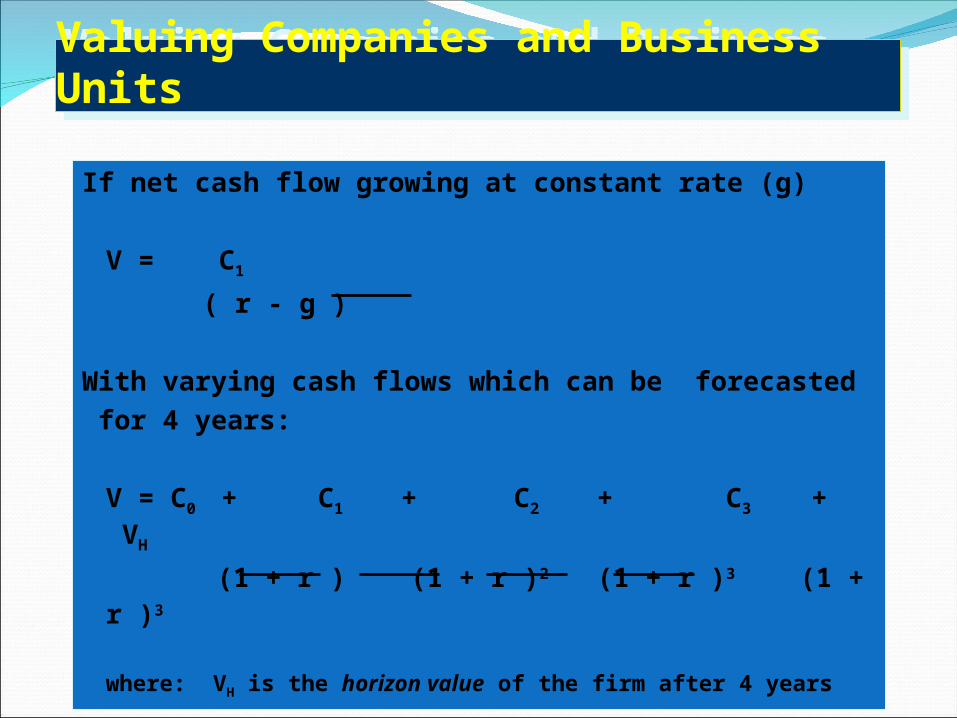
Valuing Companies and Business UnitsValuing Companies and Business Units
If net cash flow growing at constant rate (g)
V = C1
( r - g )
With varying cash flows which can be forecasted for 4 years:
V = C0 + C1 + C2 + C3 + VH
(1 + r ) (1 + r )2 (1 + r )3 (1 + r )3
where: VH is the horizon value of the firm after 4 years
Real OptionsThe right but not the obligation to buy an assetBlack Scholes Formula used to value financial optionsThere is hidden value in real (or strategic) options
Flexibility to speed up or slow down projectsFlexibility to abandon a projectFlexibility to shutdown a projectFlexibility to extend a project into new products or
marketsFlexibility to switch designs or plants
In general, more uncertainty and more time before committing to a decision increases the value of an option
Hence, strategists should seek explore options given time and uncertainty
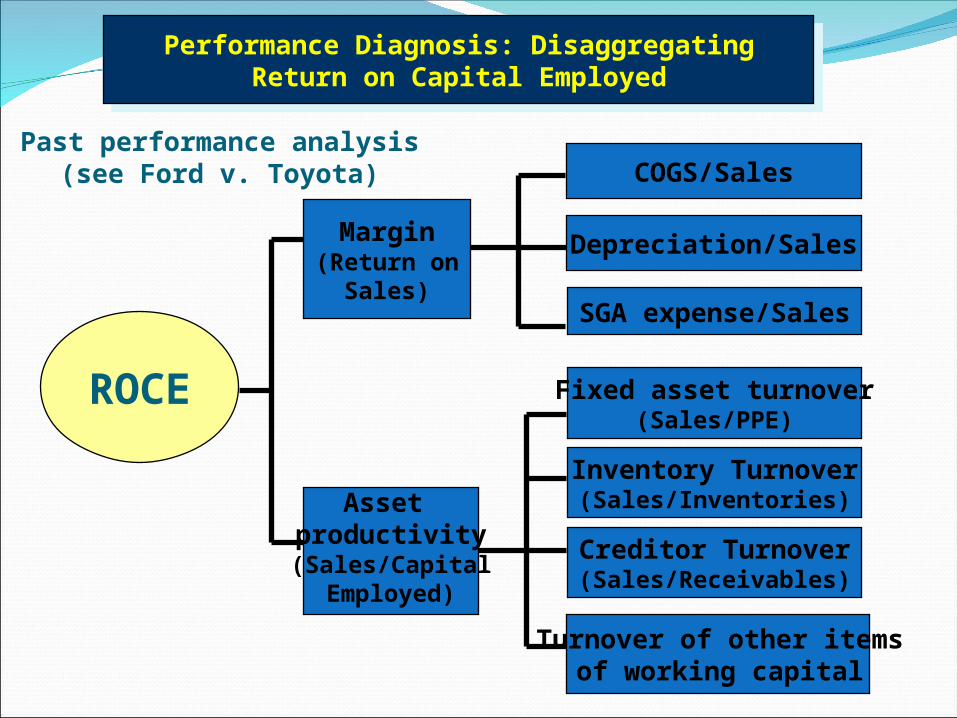
ROCE
Margin(Return on
Sales)
Asset productivity(Sales/Capital
Employed)
COGS/Sales
Depreciation/Sales
SGA expense/Sales
Fixed asset turnover(Sales/PPE)
Inventory Turnover(Sales/Inventories)
Creditor Turnover(Sales/Receivables)
Turnover of other items of working capital
Performance Diagnosis: DisaggregatingReturn on Capital Employed
Performance Diagnosis: DisaggregatingReturn on Capital Employed
Past performance analysis(see Ford v. Toyota)
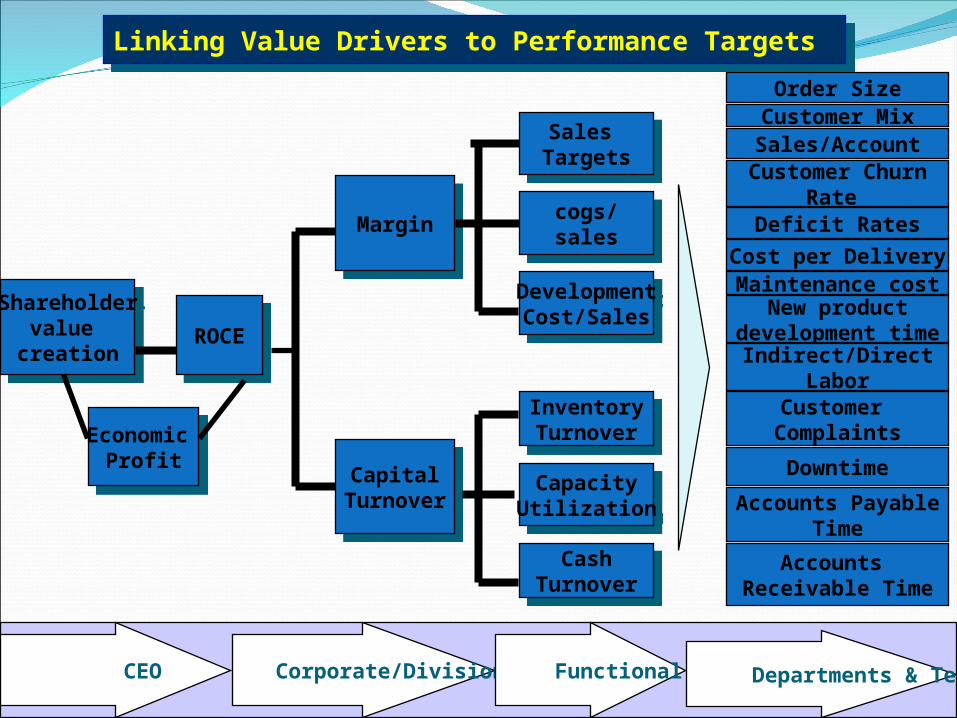
Shareholdervalue
creation
Shareholdervalue
creation ROCEROCE
Economic Profit
Economic Profit
MarginMargin
CapitalTurnover
CapitalTurnover
Sales Targets
Sales Targets
cogs/sales
cogs/sales
DevelopmentCost/Sales
DevelopmentCost/Sales
InventoryTurnover
InventoryTurnover
CapacityUtilization
CapacityUtilization
CashTurnover
CashTurnover
Order SizeCustomer MixSales/Account
Customer ChurnRate
Deficit Rates
Cost per DeliveryMaintenance cost
New productdevelopment time
Indirect/DirectLabor
Customer Complaints
Downtime
Accounts PayableTime
Accounts Receivable Time
CEO Corporate/Divisional Functional Departments & Teams
Linking Value Drivers to Performance TargetsLinking Value Drivers to Performance Targets
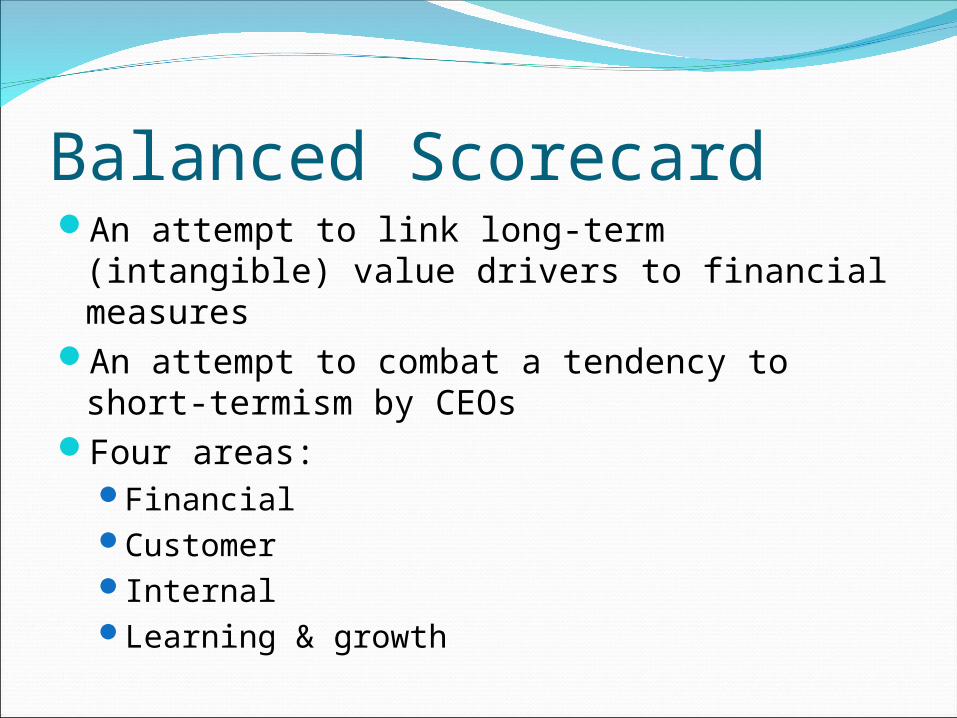
Balanced ScorecardAn attempt to link long-term (intangible)
value drivers to financial measuresAn attempt to combat a tendency to short-
termism by CEOsFour areas:
FinancialCustomerInternalLearning & growth
FINANCIAL
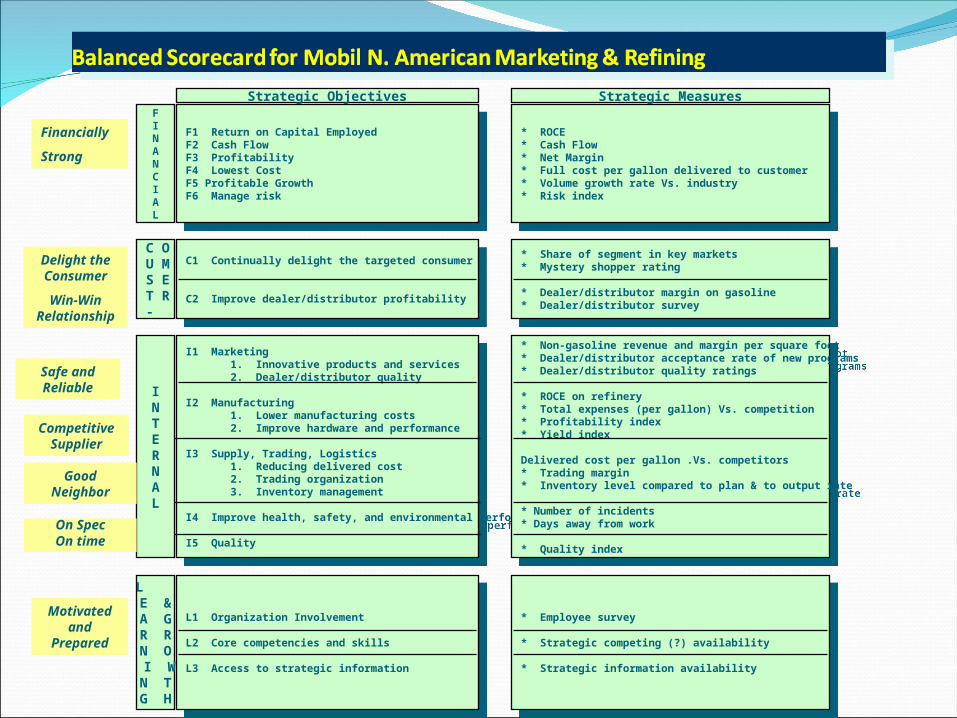
F1 Return on Capital EmployedF2 Cash FlowF3 ProfitabilityF4 Lowest CostF5 Profitable GrowthF6 Manage risk
F1 Return on Capital EmployedF2 Cash FlowF3 ProfitabilityF4 Lowest CostF5 Profitable GrowthF6 Manage risk
Strategic Objectives
Financially
Strong* ROCE* Cash Flow* Net Margin* Full cost per gallon delivered to customer * Volume growth rate Vs. industry* Risk index
* ROCE* Cash Flow* Net Margin* Full cost per gallon delivered to customer * Volume growth rate Vs. industry* Risk index
Strategic Measures
C OU MS ET R-
C1 Continually delight the targeted consumer
C2 Improve dealer/distributor profitability
C1 Continually delight the targeted consumer
C2 Improve dealer/distributor profitability
* Share of segment in key markets* Mystery shopper rating
* Dealer/distributor margin on gasoline* Dealer/distributor survey
* Share of segment in key markets* Mystery shopper rating
* Dealer/distributor margin on gasoline* Dealer/distributor survey
Delight the Consumer
Win-Win Relationship
I1 Marketing 1. Innovative products and services 2. Dealer/distributor quality
I2 Manufacturing 1. Lower manufacturing costs 2. Improve hardware and performance
I3 Supply, Trading, Logistics 1. Reducing delivered cost 2. Trading organization 3. Inventory management
I4 Improve health, safety, and environmental performance I5 Quality
INTERNAL
* Non-gasoline revenue and margin per square foot* Dealer/distributor acceptance rate of new programs* Dealer/distributor quality ratings
* ROCE on refinery* Total expenses (per gallon) Vs. competition* Profitability index* Yield index
Delivered cost per gallon .Vs. competitors* Trading margin* Inventory level compared to plan & to output rate
* Number of incidents* Days away from work
* Quality index
L E & A GR RN O I WN TG H
L1 Organization Involvement
L2 Core competencies and skills
L3 Access to strategic information
L1 Organization Involvement
L2 Core competencies and skills
L3 Access to strategic information
* Employee survey
* Strategic competing (?) availability
* Strategic information availability
* Employee survey
* Strategic competing (?) availability
* Strategic information availability
Safe and Reliable
Competitive Supplier
Good Neighbor
On SpecOn time
Motivated and
Prepared
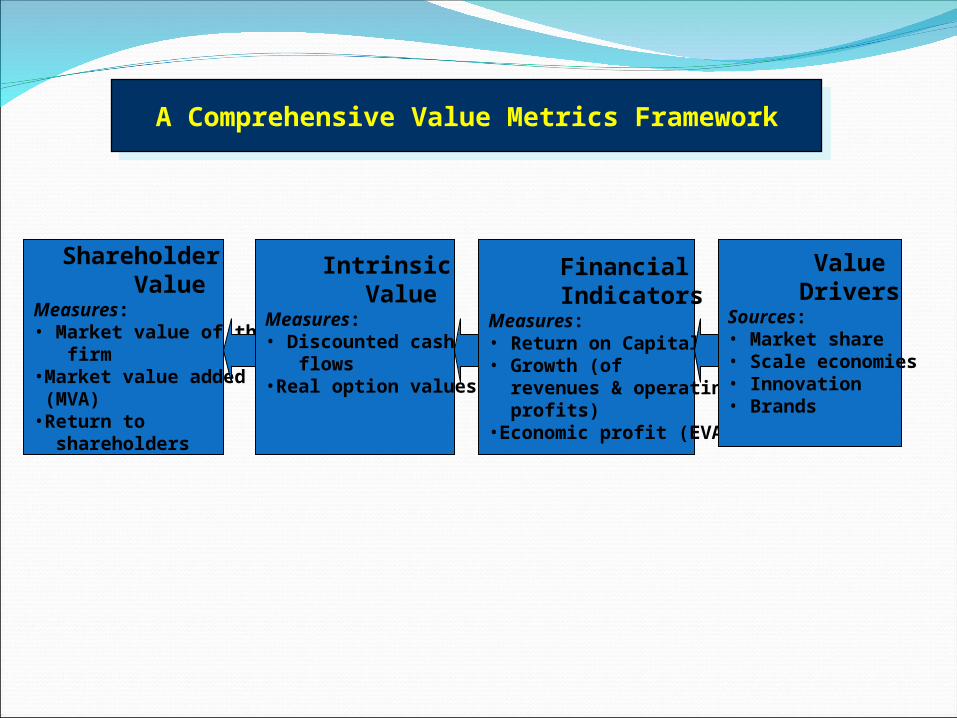
Shareholder ValueMeasures:• Market value of the firm•Market value added (MVA)•Return to shareholders
Intrinsic ValueMeasures:• Discounted cash flows•Real option values
Financial IndicatorsMeasures:• Return on Capital • Growth (of revenues & operating profits)•Economic profit (EVA)
Value DriversSources:• Market share• Scale economies• Innovation• Brands
A Comprehensive Value Metrics FrameworkA Comprehensive Value Metrics Framework
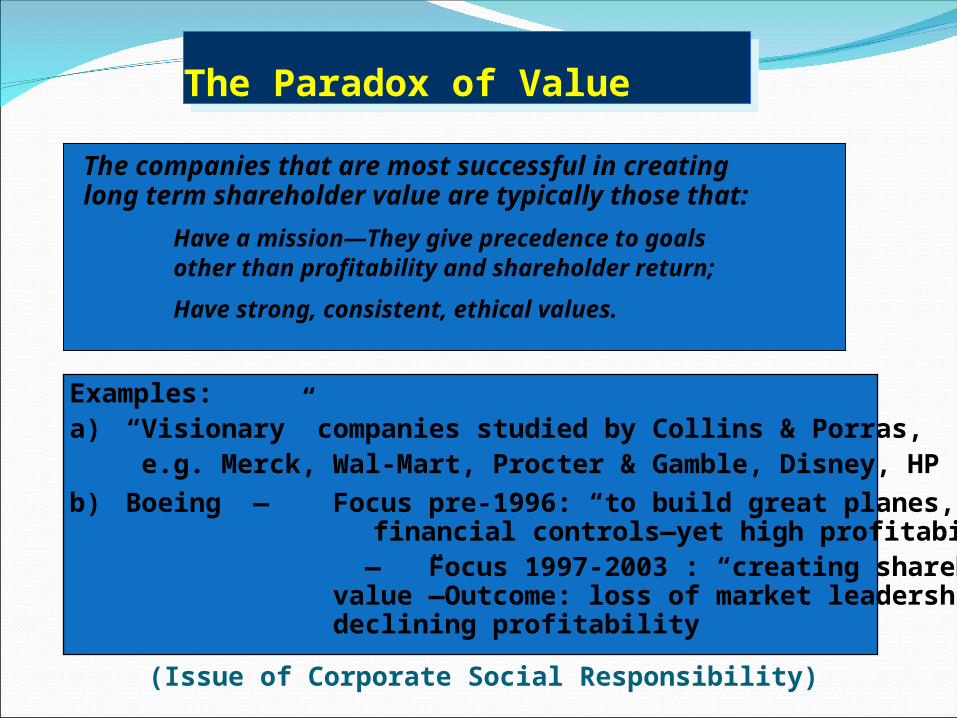
The Paradox of ValueThe Paradox of Value
The companies that are most successful in creating long term shareholder value are typically those that:
a) Have a mission—They give precedence to goals other than profitability and shareholder return;
b) Have strong, consistent, ethical values.
Examples: a) “Visionary” companies studied by Collins & Porras,
e.g. Merck, Wal-Mart, Procter & Gamble, Disney, HP
b) Boeing — Focus pre-1996: “to build great planes,” weak financial controls—yet high profitability
— Focus 1997-2003 : “creating shareholder value”—Outcome: loss of market leadership, declining profitability
(Issue of Corporate Social Responsibility)