Embed Size (px)
Citation preview

IMPAQ International, LLC Page i Food For Education Baseline Report
Mc-Govern Dole International Food for Education and Child Nutrition Project
Saint Louis Region, Senegal Baseline Report
Authors: Laurence Dessein, Ed.M.
Michaela Gulemetova, Ph.D. Elnaz Safarha, M.S. Robert Dean, M.S.
March 2016
Submitted by:
Project Director: Laurence Dessein IMPAQ International, LLC 10420 Little Patuxent Parkway, Suite 300 Columbia, MD 21044
Submitted to:
Regional Director: Ellen Garrett Counterpart International 2345 Crystal Drive, Suite 301 Arlington, Virginia, 22202

IMPAQ International, LLC Page i Food For Education Baseline Report
ACKNOWLEDGEMENTS We thank Counterpart International (CPI) and the U.S. Department of Agriculture (USDA) for their financial support. We extend special thanks to Ms. Alina Scutaru, Ms. Camille Gockowski, and Mr. Desire Yameogo from Counterpart International for their support and advice, as well as Counterpart’s remarkable field staff in Senegal for facilitating the planning and rollout of the baseline data collection. We acknowledge Dr. Jacob Benus and Dr. Susan Berkowitz for their technical inputs and reviews. Finally, we thank Ms. Fatima Bousso-Kane and Edoxi Kindane for coordinating the field work. The findings, interpretations, and conclusions expressed herein are entirely those of the authors. They do not necessarily represent the views of IMPAQ International nor do they reflect the views of CPI and the USDA.

IMPAQ International, LLC Page ii Food For Education Baseline Report
TABLE OF CONTENTS
TABLE OF EXHIBITS ................................................................................................................. i
ACRONYM LIST ..................................................................................................................... iii
EXECUTIVE SUMMARY .......................................................................................................... iv
CHAPTER 1. INTRODUCTION .................................................................................................. 1
CHAPTER 2. EVALUATION APPROACH AND DATA ................................................................... 2
2.1 Research Questions and Key Indicators ........................................................................... 2
2.2 Methodology .................................................................................................................... 3
2.3 Data Sources ..................................................................................................................... 5
CHAPTER 3. EVALUATION SAMPLES ....................................................................................... 7
3.1 Schools.............................................................................................................................. 7
3.2 Students ........................................................................................................................... 8
3.3 Mothers and Household Environment ............................................................................. 9
3.4 Teachers ......................................................................................................................... 10
3.5 Directors ......................................................................................................................... 12
CHAPTER 4. FIELD WORK AND ANALYSIS .............................................................................. 13
4.1 Field Work ...................................................................................................................... 13
4.2 Quantitative Analysis ..................................................................................................... 13
CHAPTER 5. BASELINE LEVELS .............................................................................................. 14
5.1 School Outcomes............................................................................................................ 18
5.2 Students’ Outcomes ....................................................................................................... 19
5.3 Mothers’ Outcomes ....................................................................................................... 23
5. 4 Teachers’ Outcomes ........................................................................................................ 28
5. 5 Directors’ Outcomes........................................................................................................ 31
CHAPTER 6. CONCLUSIONS .................................................................................................. 35
6.1 Key Findings....................................................................................................................... 35
6.2 Recommendations ............................................................................................................ 37
REFERENCES ........................................................................................................................ 35
APPENDICES ........................................................................................................................ 40
APPENDIX 1. McGovern-Dole Results Frameworks ............................................................... 41
APPENDIX 2: Evaluation Indicators ...................................................................................... 43
APPENDIX 3: Total Number of Respondents by School and Category .................................... 44
IMPAQ International, LLC Page iii Food For Education Baseline Report
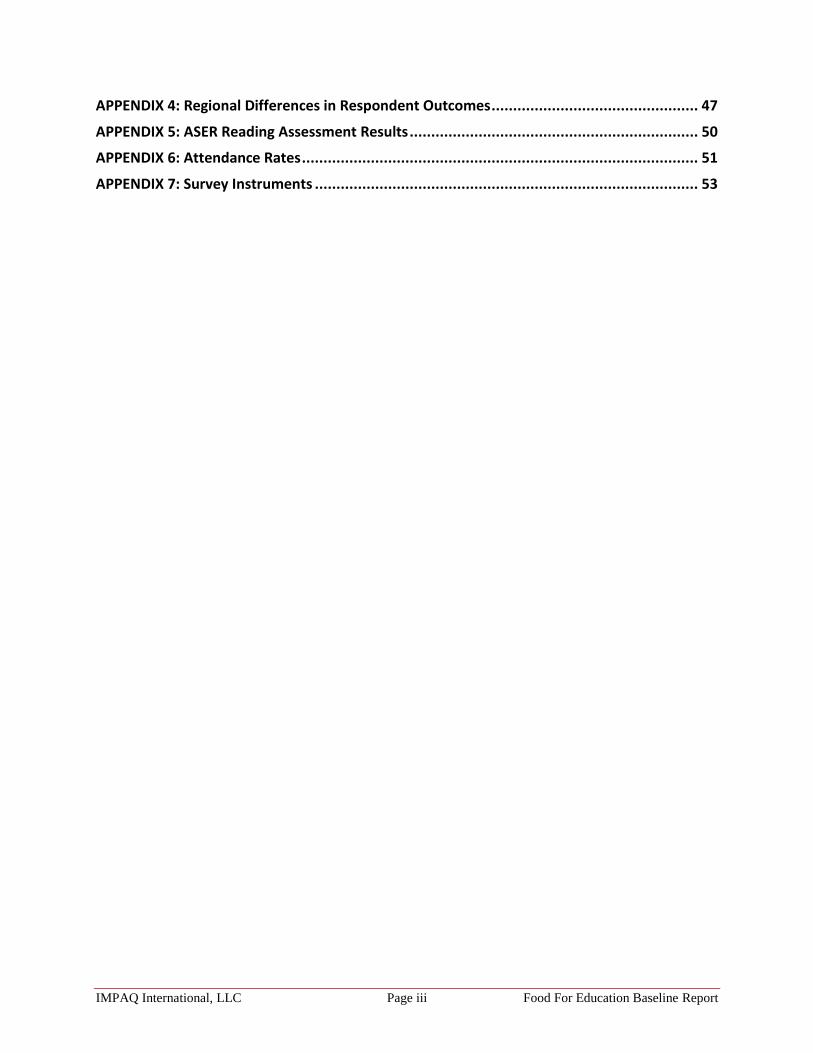
APPENDIX 4: Regional Differences in Respondent Outcomes ................................................ 47
APPENDIX 5: ASER Reading Assessment Results ................................................................... 50
APPENDIX 6: Attendance Rates ............................................................................................ 51
APPENDIX 7: Survey Instruments ......................................................................................... 53
IMPAQ International, LLC Page i Food For Education Baseline Report
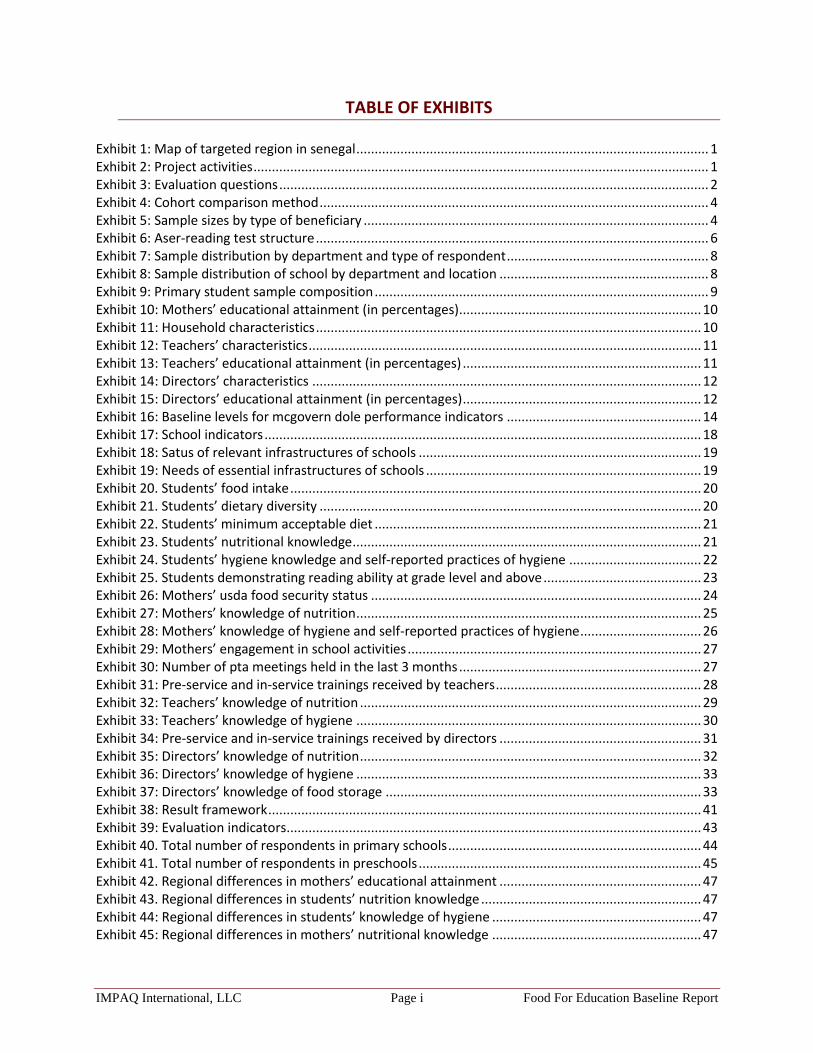
TABLE OF EXHIBITS Exhibit 1: Map of targeted region in senegal ................................................................................................ 1 Exhibit 2: Project activities ............................................................................................................................ 1 Exhibit 3: Evaluation questions ..................................................................................................................... 2 Exhibit 4: Cohort comparison method .......................................................................................................... 4 Exhibit 5: Sample sizes by type of beneficiary .............................................................................................. 4 Exhibit 6: Aser-reading test structure ........................................................................................................... 6 Exhibit 7: Sample distribution by department and type of respondent ....................................................... 8 Exhibit 8: Sample distribution of school by department and location ......................................................... 8 Exhibit 9: Primary student sample composition ........................................................................................... 9 Exhibit 10: Mothers’ educational attainment (in percentages) .................................................................. 10 Exhibit 11: Household characteristics ......................................................................................................... 10 Exhibit 12: Teachers’ characteristics ........................................................................................................... 11 Exhibit 13: Teachers’ educational attainment (in percentages) ................................................................. 11 Exhibit 14: Directors’ characteristics .......................................................................................................... 12 Exhibit 15: Directors’ educational attainment (in percentages) ................................................................. 12 Exhibit 16: Baseline levels for mcgovern dole performance indicators ..................................................... 14 Exhibit 17: School indicators ....................................................................................................................... 18 Exhibit 18: Satus of relevant infrastructures of schools ............................................................................. 19 Exhibit 19: Needs of essential infrastructures of schools ........................................................................... 19 Exhibit 20. Students’ food intake ................................................................................................................ 20 Exhibit 21. Students’ dietary diversity ........................................................................................................ 20 Exhibit 22. Students’ minimum acceptable diet ......................................................................................... 21 Exhibit 23. Students’ nutritional knowledge ............................................................................................... 21 Exhibit 24. Students’ hygiene knowledge and self-reported practices of hygiene .................................... 22 Exhibit 25. Students demonstrating reading ability at grade level and above ........................................... 23 Exhibit 26: Mothers’ usda food security status .......................................................................................... 24 Exhibit 27: Mothers’ knowledge of nutrition .............................................................................................. 25 Exhibit 28: Mothers’ knowledge of hygiene and self-reported practices of hygiene ................................. 26 Exhibit 29: Mothers’ engagement in school activities ................................................................................ 27 Exhibit 30: Number of pta meetings held in the last 3 months .................................................................. 27 Exhibit 31: Pre-service and in-service trainings received by teachers ........................................................ 28 Exhibit 32: Teachers’ knowledge of nutrition ............................................................................................. 29 Exhibit 33: Teachers’ knowledge of hygiene .............................................................................................. 30 Exhibit 34: Pre-service and in-service trainings received by directors ....................................................... 31 Exhibit 35: Directors’ knowledge of nutrition ............................................................................................. 32 Exhibit 36: Directors’ knowledge of hygiene .............................................................................................. 33 Exhibit 37: Directors’ knowledge of food storage ...................................................................................... 33 Exhibit 38: Result framework ...................................................................................................................... 41 Exhibit 39: Evaluation indicators ................................................................................................................. 43 Exhibit 40. Total number of respondents in primary schools ..................................................................... 44 Exhibit 41. Total number of respondents in preschools ............................................................................. 45 Exhibit 42. Regional differences in mothers’ educational attainment ....................................................... 47 Exhibit 43. Regional differences in students’ nutrition knowledge ............................................................ 47 Exhibit 44: Regional differences in students’ knowledge of hygiene ......................................................... 47 Exhibit 45: Regional differences in mothers’ nutritional knowledge ......................................................... 47

IMPAQ International, LLC Page ii Food For Education Baseline Report
Exhibit 46: Regional differences in mothers’ knowledge of hygiene .......................................................... 48 Exhibit 47: Regional differences in mothers’ engagement in school activities .......................................... 48 Exhibit 48: Regional differences in teachers’ knowledge of nutrition ........................................................ 48 Exhibit 49: Regional differences in teachers’ knowledge of hygiene ......................................................... 48 Exhibit 50: Regional differences in directors’ knowledge of hygiene ......................................................... 49 Exhibit 51. Gender differences in demonstrating reading ability ............................................................... 50 Exhibit 52: Mothers’ attendance by meetings held .................................................................................... 51
IMPAQ International, LLC Page iii Food For Education Baseline Report
ACRONYM LIST
ANPECTP Government Agency in Charge of Early Childhood Development APE l'Association des Parents d'Elèves (Parent Association) CGE Committé de Gestion d’Ecole (School Management Commitee) CPI Counterpart International DAP Development Activity Proposal FAS Foreign Agricultural Service FFE Food for Education IDEN Departmental Inspector of National Education M&E Monitoring and Evaluation MDG McGovern-Dole MDMS Midday Meal Scheme MOE Ministry of Education PA Parent Associations PTA Parent-Teacher Association SDA Departmental Agricultural Services SFP School Feeding Project USDA US Department of Agriculture

IMPAQ International, LLC Page iv Food For Education Baseline Report
EXECUTIVE SUMMARY The McGovern-Dole International Food for Education and Child Nutrition Project in the Saint Louis Region in Senegal is being implemented by Counterpart International (CPI) and is funded by the United States Department of Agriculture (USDA) under the McGovern Dole (MDG) International Food for Education and Child Nutrition (FFE) project. The FFE Saint Louis project aims to improve the literacy of school-aged children and improve health and dietary practices in Northern Senegal through a variety of school feeding related activities. CPI selected IMPAQ International, LLC (IMPAQ) to design the evaluation approach of the project and conduct the baseline data collection. This report presents the baseline levels of key project indicators. For the baseline, IMPAQ collected data on more than 500 variables from 1,030 primary school students, 1,292 mothers, 102 Parent-Teacher Associations board members, 367 teachers, and 87 school directors. The data provides interesting insights into the students’, mothers’, and teachers’ knowledge of nutrition and hygiene, students’ academic performance, and community engagement. The data also point to the need for projects, such as the one implemented by CPI, to improve food security, nutritional knowledge, and student literacy. Key findings are summarized below. Schools’ Outcomes
On average, more than 75 percent of preschool teachers were female as compared to only 25 percent of primary school teachers.
Primary schools demonstrated a greater need for essential infrastructures, such as classrooms and latrines, compared to preschools in our sample.
Students’ Outcomes
On average, 89 percent of primary school students ate lunch at home and 72 percent of those students had a minimum acceptable diet, per FAS guidelines.
Less than half of all students could cite one food in each of the three key nutrition groups: proteins (43 percent), carbohydrates and fats (51 percent), and minerals and vitamins (36 percent).
About 63 percent of primary school students could cite at least 2 instances in which one should wash one’s hands and 9 percent of students could cite at least 2 ways to prevent intestinal worms.
Only 32 percent of 3rd graders, 16 percent of 4th graders, and 18 percent of 5th graders could read at grade level or above.
Mothers’ Outcomes
Food security was very low among all mothers: 13 percent of mothers of primary school age children (primary school mother) and 24 percent of mother of preschool age children (preschool mothers) were food secure.
Only about half of mothers could cite one food in each of the three key nutrition groups: proteins (53 percent), carbohydrates and fats (50 percent), and minerals and vitamins (47 percent).
While the majority of mothers reported that they washed their hands at critical moments (after latrine use and before eating), only 57 percent of preschool mothers and 75 percent of primary school mothers reported that they used both soap and water to wash their hands.
Only 15 percent of primary school mothers and 23 percent of preschool mothers could cite two ways to prevent intestinal worms.
IMPAQ International, LLC Page v Food For Education Baseline Report
Only 48 percent of preschool mothers and 62 percent of primary school mothers had attended the school’s general assembly1 in the past three months.
Teachers’ Outcomes
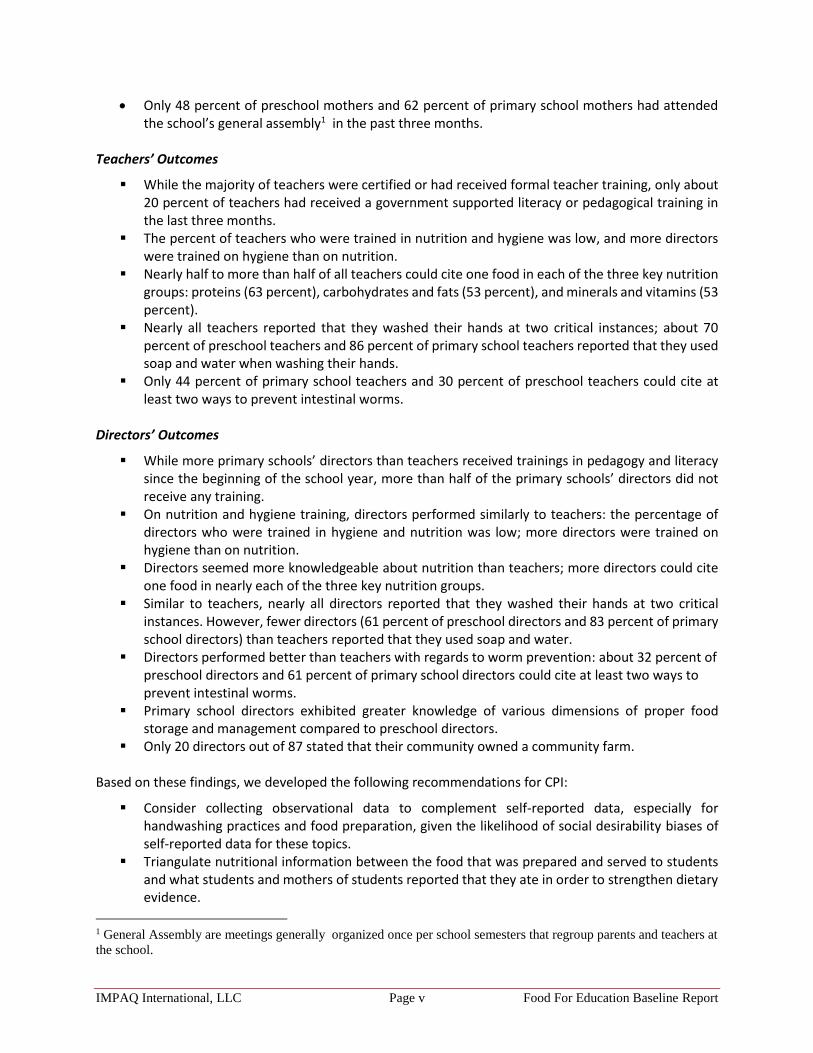
While the majority of teachers were certified or had received formal teacher training, only about 20 percent of teachers had received a government supported literacy or pedagogical training in the last three months.
The percent of teachers who were trained in nutrition and hygiene was low, and more directors were trained on hygiene than on nutrition.
Nearly half to more than half of all teachers could cite one food in each of the three key nutrition groups: proteins (63 percent), carbohydrates and fats (53 percent), and minerals and vitamins (53 percent).
Nearly all teachers reported that they washed their hands at two critical instances; about 70 percent of preschool teachers and 86 percent of primary school teachers reported that they used soap and water when washing their hands.
Only 44 percent of primary school teachers and 30 percent of preschool teachers could cite at least two ways to prevent intestinal worms.
Directors’ Outcomes
While more primary schools’ directors than teachers received trainings in pedagogy and literacy since the beginning of the school year, more than half of the primary schools’ directors did not receive any training.
On nutrition and hygiene training, directors performed similarly to teachers: the percentage of directors who were trained in hygiene and nutrition was low; more directors were trained on hygiene than on nutrition.
Directors seemed more knowledgeable about nutrition than teachers; more directors could cite one food in nearly each of the three key nutrition groups.
Similar to teachers, nearly all directors reported that they washed their hands at two critical instances. However, fewer directors (61 percent of preschool directors and 83 percent of primary school directors) than teachers reported that they used soap and water.
Directors performed better than teachers with regards to worm prevention: about 32 percent of preschool directors and 61 percent of primary school directors could cite at least two ways to prevent intestinal worms.
Primary school directors exhibited greater knowledge of various dimensions of proper food storage and management compared to preschool directors.
Only 20 directors out of 87 stated that their community owned a community farm. Based on these findings, we developed the following recommendations for CPI:
Consider collecting observational data to complement self-reported data, especially for handwashing practices and food preparation, given the likelihood of social desirability biases of self-reported data for these topics.
Triangulate nutritional information between the food that was prepared and served to students and what students and mothers of students reported that they ate in order to strengthen dietary evidence.
1 General Assembly are meetings generally organized once per school semesters that regroup parents and teachers at
the school.

IMPAQ International, LLC Page vi Food For Education Baseline Report
Administer the same survey instruments at midline and endline to enable researchers to make comparisons between different points of time.
Plan for thoughtful qualitative data at midline and endline to complement the quantitative data to enable researchers to cross-validate findings and to produce robust conclusions.
Implement a comprehensive monitoring plan that has unique identifiers for schools, directors, teachers, students, and other project beneficiaries to track progress over time in the most effective and cost-efficient manner.
Photo: Beneficiary students at a sampled preschool in Saint Louis, IMPAQ

IMPAQ International, LLC Page 1 Food For Education Baseline Report
CHAPTER 1. INTRODUCTION This report provides the baseline results of the evaluation of the McGovern-Dole International Food for Education and Child Nutrition Project (FFE) in the Saint Louis region of Senegal. The FFE Saint Louis project is implemented by Counterpart International (CPI) and is funded by the United States Department of Agriculture (USDA) under the McGovern-Dole (MGD) International Food for Education and Child Nutrition (FFE) project. CPI selected IMPAQ International, LLC (IMPAQ) to design the evaluation approach of the project and conduct the baseline data collection.
In September 2014, USDA awarded CPI funds and commodities to implement the Food for Education Saint Louis project in Senegal in response to recurrent food crises, high levels of malnutrition, and low and inequitable levels of education in the Sahel region. The project is part of the larger MDG International Food for Education and Child Nutrition project managed by USDA’s Foreign Agriculture Service (FAS). Project partners include a large group of local and international stakeholders: the Ministry of Education (MoE), the Departmental Inspector of National Education (IDEN), the Government Agency in Charge of Early Childhood Development (ANPECTP), the U.S. Peace Corps, the Departmental Agricultural Services (SDA), the Parent-Teacher Associations (PAs), and Local Government Agencies. The goal of the three year, multi-sectorial project is to improve food security through education, health and capacity building in the Saint Louis region, Senegal. Exhibit 1 shows the location of the targeted
regions in Senegal. The project targets 270 school administrators, 1,295 teachers, 43,040students, and 270 PAs across 204 primary schools and 66 preschools in Saint Louis, Dagana, Podor, and Pete inspections. The project also targets 302,827 indirect beneficiaries (beneficiary students’ families).
Exhibit 1: Map of targeted region in Senegal
IMPAQ International, LLC Page 1 Food For Education Baseline Report
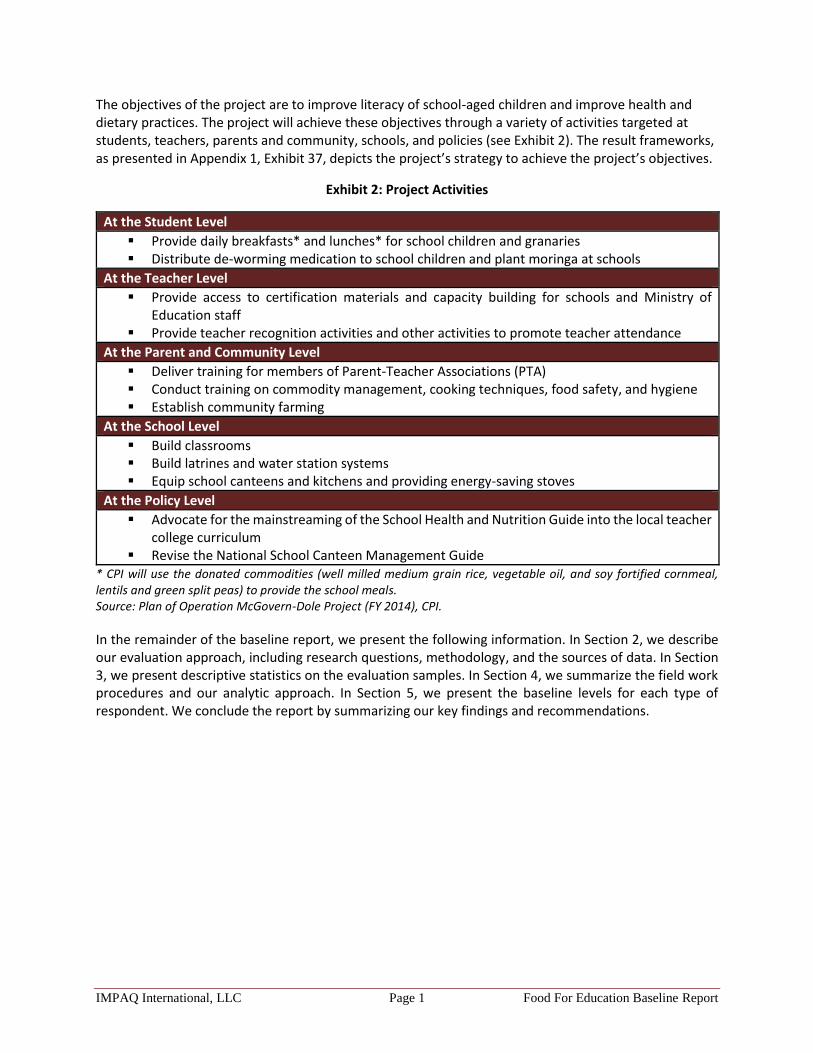
The objectives of the project are to improve literacy of school-aged children and improve health and dietary practices. The project will achieve these objectives through a variety of activities targeted at students, teachers, parents and community, schools, and policies (see Exhibit 2). The result frameworks, as presented in Appendix 1, Exhibit 37, depicts the project’s strategy to achieve the project’s objectives.
Exhibit 2: Project Activities
* CPI will use the donated commodities (well milled medium grain rice, vegetable oil, and soy fortified cornmeal, lentils and green split peas) to provide the school meals. Source: Plan of Operation McGovern-Dole Project (FY 2014), CPI.
In the remainder of the baseline report, we present the following information. In Section 2, we describe our evaluation approach, including research questions, methodology, and the sources of data. In Section 3, we present descriptive statistics on the evaluation samples. In Section 4, we summarize the field work procedures and our analytic approach. In Section 5, we present the baseline levels for each type of respondent. We conclude the report by summarizing our key findings and recommendations.
At the Student Level
Provide daily breakfasts* and lunches* for school children and granaries Distribute de-worming medication to school children and plant moringa at schools
At the Teacher Level
Provide access to certification materials and capacity building for schools and Ministry of Education staff
Provide teacher recognition activities and other activities to promote teacher attendance
At the Parent and Community Level
Deliver training for members of Parent-Teacher Associations (PTA) Conduct training on commodity management, cooking techniques, food safety, and hygiene Establish community farming
At the School Level
Build classrooms Build latrines and water station systems Equip school canteens and kitchens and providing energy-saving stoves
At the Policy Level
Advocate for the mainstreaming of the School Health and Nutrition Guide into the local teacher college curriculum
Revise the National School Canteen Management Guide

IMPAQ International, LLC Page 2 Food For Education Baseline Report
CHAPTER 2. EVALUATION APPROACH AND DATA
2.1 Research Questions and Key Indicators Throughout the implementation of the project, we will assess the following four dimensions of the project’s achievements:
1. Implementation and relevance, 2. Effectiveness and performance, 3. Efficiency, and 4. Sustainability.
The evaluation questions are outlined in Exhibit 3. At the baseline of the project, we collected and analyzed data to produce baseline indicators of the project’s effectiveness and performance (as outlined in red in the Exhibit 3). In addition, we collected and used data to report on preselected McGovern Dole standard performance indicators, as required by USDA (see Appendix 2 Exhibit 39). We will use these baseline indicators to monitor and assess the project’s progress during its implementation and after it is completed. We will answer the remaining questions regarding the effectiveness and performance dimensions and the questions under the three other dimensions using midline and endline data, since the project at baseline had not yet started.
Exhibit 3: Evaluation Questions
Implementation and Relevance
To what extent was the project implemented as designed (e.g., lunches and trainings delivered)? To what extent did the project’s design and activities reflect the needs of the project’s
beneficiaries? How relevant was the project given the economic, cultural (including gender), and political
context? To what extent did the project take into account the government’s existing strategic framework in
terms of the thematic areas tackled by the project?
Effectiveness and Performance
To what extent was the project effective at increasing student enrollment and attendance? To what extent was the project effective at increasing students’ literacy outcomes? To what extent did beneficiaries perceive the community farm activities as helpful in supporting
the management and maintenance of school canteens and school feeding activities? To what extent was the project successful in improving students’ knowledge and behavior about
nutrition, health, and sanitation? To what extent did beneficiary perceive the establishment of moringa plantations as helpful in
improving nutrition among school-aged children? To what extent was the project successful at improving students, school teachers’ and mothers’
knowledge of and behaviors with respect to nutrition, health, and sanitation? Were there any unintended or indirect impacts?
Efficiency
How much return, in terms of project results, did USDA resources yield? Could other implementation strategies have achieved more with the same resources?
IMPAQ International, LLC Page 3 Food For Education Baseline Report
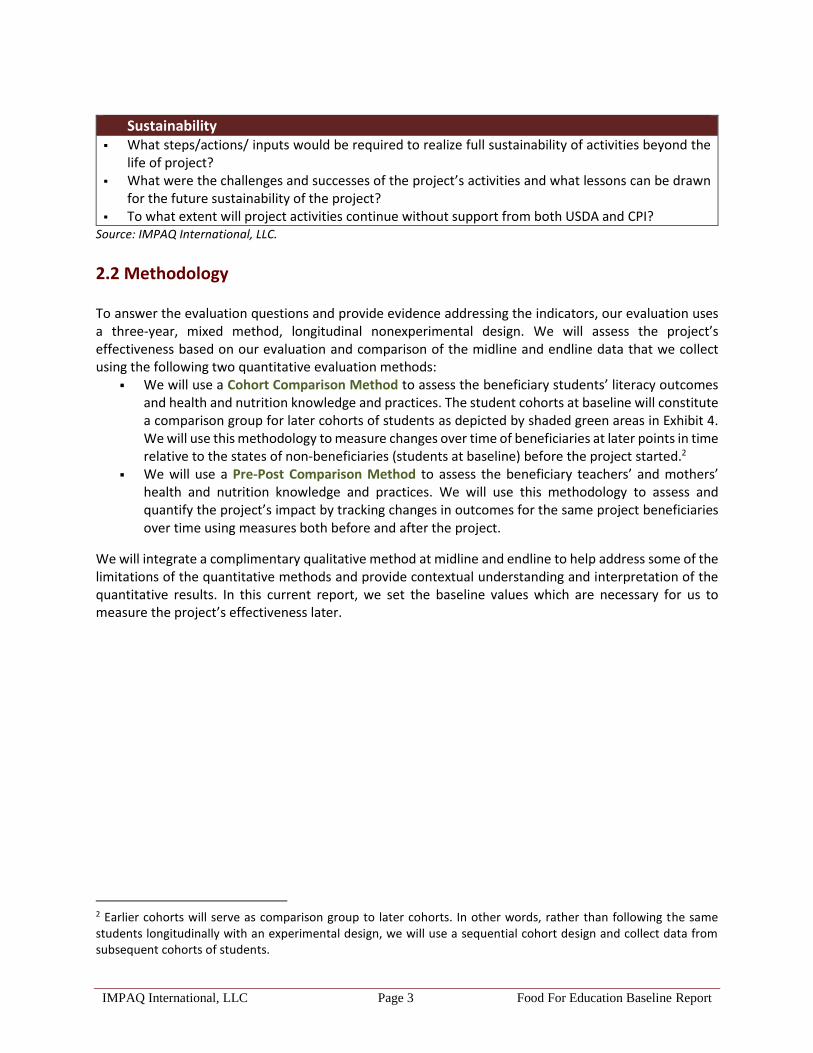
Sustainability What steps/actions/ inputs would be required to realize full sustainability of activities beyond the
life of project? What were the challenges and successes of the project’s activities and what lessons can be drawn
for the future sustainability of the project? To what extent will project activities continue without support from both USDA and CPI?
Source: IMPAQ International, LLC.
2.2 Methodology To answer the evaluation questions and provide evidence addressing the indicators, our evaluation uses a three-year, mixed method, longitudinal nonexperimental design. We will assess the project’s effectiveness based on our evaluation and comparison of the midline and endline data that we collect using the following two quantitative evaluation methods:
We will use a Cohort Comparison Method to assess the beneficiary students’ literacy outcomes and health and nutrition knowledge and practices. The student cohorts at baseline will constitute a comparison group for later cohorts of students as depicted by shaded green areas in Exhibit 4. We will use this methodology to measure changes over time of beneficiaries at later points in time relative to the states of non-beneficiaries (students at baseline) before the project started.2
We will use a Pre-Post Comparison Method to assess the beneficiary teachers’ and mothers’ health and nutrition knowledge and practices. We will use this methodology to assess and quantify the project’s impact by tracking changes in outcomes for the same project beneficiaries over time using measures both before and after the project.
We will integrate a complimentary qualitative method at midline and endline to help address some of the limitations of the quantitative methods and provide contextual understanding and interpretation of the quantitative results. In this current report, we set the baseline values which are necessary for us to measure the project’s effectiveness later.
2 Earlier cohorts will serve as comparison group to later cohorts. In other words, rather than following the same students longitudinally with an experimental design, we will use a sequential cohort design and collect data from subsequent cohorts of students.

IMPAQ International, LLC Page 4 Food For Education Baseline Report
Exhibit 4: Cohort Comparison Method
Source: Authors’ calculations.
In Exhibit 5, we present the sample sizes that we calculated as necessary for the project evaluation using Don A. Dillman’s formula (see Exhibit 5).3
Exhibit 5: Sample Sizes by Type of Beneficiary
Beneficiary Sample size Repetition
Primary schools (N = 41)
Students 1,1074 A new sample will be drawn both at midline and endline
Mothers 1,107 The sample will be followed at midline and endline
Teachers 232 The sample will be followed at midline and endline
Directors 41 The sample will be followed at midline and endline
Preschools (N = 50)
Mothers 450 The sample will be followed at midline and endline
Teachers 150 The sample will be followed at midline and endline
Directors 50 The sample will be followed at midline and endline Source: Authors’ calculations.
3 Don Dillman, D.A. (2007) Mail and Internet Surveys: The Tailored Design Method (2007 update with new Internet, visual, and mixed-mode guide), 2nd edn. New York: John Wiley. 4 The sample size calculations for students are based on the initial student population size of 11,118 provided to IMPAQ by CPI.

IMPAQ International, LLC Page 5 Food For Education Baseline Report
2.3 Data Sources To evaluate the project we selected baseline indicators that address the research questions and align with the conceptual framework of the intervention. The data that we report in the following baseline report comes from four surveys (a student survey, a teacher survey, a director survey, and a mother survey), as well as an assessment of students’ reading skills (included in Appendix 7). Surveys
We designed and fielded the surveys to collect pre-project measures of food security, dietary diversity, and nutrition and hygiene knowledge and behavior of students, mothers, teachers, and directors. We were guided by the following best practices in designing the surveys:
The survey should contain the key indicators in the results framework to enable us to assess the project against its stated objectives. We include these core indicators in Appendix 2 Exhibit 39, although the final surveys contained many more relevant indicators.
Where possible, we measured indicators using the questions and approaches that have already been field tested and approved by USDA on other evaluations.5,6,7 For almost all of the key indicators measured in the study, we employed questions from surveys used in other similar school feeding project evaluation in the region, thus ensuring that they were appropriate for local conditions and that the resulting data could be compared with national/international data.
The surveys were of manageable lengths to avoid interviewer or respondent fatigue. Each survey took respondents approximately 20 to 30 minutes to complete.
Beyond these three principles, and consistent with international best practices in project evaluation, using the IMPAQ surveys we collected sufficient information along the causal chain to enable us to understand how the project influenced behaviors, and whether the project affected final outcomes.
Reading Assessment
We developed, fielded, and used an adaptation of the ASER-Reading test to measure students’ reading levels at baseline. In collaboration with
5 Food and Agriculture Organization. (2010). Guidelines for Measuring Household and Individual Dietary Diversity. Rome, Italy: United Nations. 6 United States Department of Agriculture, Foreign Agricultural Service. (2014, July). Food for Progress and McGovern-Dole Indicators and Definitions. Food Assistance Division, Office of Capacity Building and Development. 7 United States Department of Agriculture, Economics Research Service. (2012, September). U.S. Household Food Security Survey Module: Six-Item Short Form.
Photo: Ennumerator administrating ASER assessment to primary school student in Dagana, IMPAQ
IMPAQ International, LLC Page 6 Food For Education Baseline Report
CPI staff, IMPAQ conducted an adaptation workshop and a pretest to ensure that test was culturally appropriate and consistent with Senegal’s learning standards for each grade level in primary school. In the one-day adaptation workshop, we convened a group of local reading, curriculum, and assessment experts from MoE to assess the appropriateness of the test and its administration instructions with respect to the following factors:
(1) the language; (2) the grade level; and, (3) the research questions.
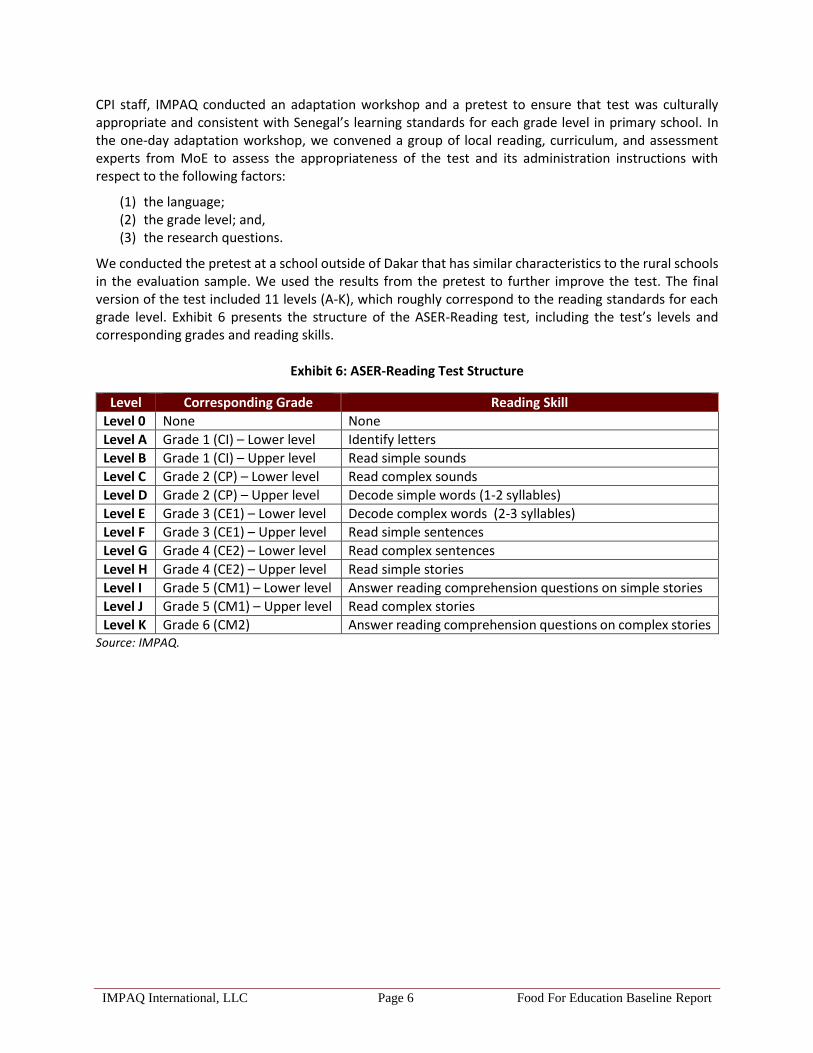
We conducted the pretest at a school outside of Dakar that has similar characteristics to the rural schools in the evaluation sample. We used the results from the pretest to further improve the test. The final version of the test included 11 levels (A-K), which roughly correspond to the reading standards for each grade level. Exhibit 6 presents the structure of the ASER-Reading test, including the test’s levels and corresponding grades and reading skills.
Exhibit 6: ASER-Reading Test Structure
Level Corresponding Grade Reading Skill
Level 0 None None
Level A Grade 1 (CI) – Lower level Identify letters
Level B Grade 1 (CI) – Upper level Read simple sounds
Level C Grade 2 (CP) – Lower level Read complex sounds
Level D Grade 2 (CP) – Upper level Decode simple words (1-2 syllables)
Level E Grade 3 (CE1) – Lower level Decode complex words (2-3 syllables)
Level F Grade 3 (CE1) – Upper level Read simple sentences
Level G Grade 4 (CE2) – Lower level Read complex sentences
Level H Grade 4 (CE2) – Upper level Read simple stories
Level I Grade 5 (CM1) – Lower level Answer reading comprehension questions on simple stories
Level J Grade 5 (CM1) – Upper level Read complex stories
Level K Grade 6 (CM2) Answer reading comprehension questions on complex stories Source: IMPAQ.

IMPAQ International, LLC Page 7 Food For Education Baseline Report
CHAPTER 3. EVALUATION SAMPLES
3.1 Schools To compare changes in individual outcomes over time, we used a sample of 41 primary schools and 50 preschools. We selected the primary schools using a proportional random sampling approach to account for the following range of regional characteristics collected and provided by CPI:
The geographical location of the school (Dagana and Podor departments); The urban/rural status of schools as measured by whether the school was located in a Oualo8 or
Diery9 area or a school near the Route National; and, Other relevant criteria such as whether the school participated in the Development Activity
Proposal (DAP)10 project, whether the school had a farm, and whether the school needed a latrine, classroom, or both according to CPI’s documentation.
We selected the preschools using a proportional random sampling approach to match the distribution of the same regional characteristics with the exception of the urban/rural indicator, as it was available for only 9 preschools. In each primary school, we surveyed the director, the grade 1 through 6 teachers, and a random sample of grade 3 through 5 students and their mothers,11 as well as mothers who were members of the PTA board. For each preschool that we surveyed, we surveyed the director, 3 teachers, and 8 to 10 mothers.12 We made a concerted effort to ensure that the student-mother pairs were at the school on the scheduled date of the survey.13 Overall, the number of respondents who did not give us their consent to proceed with the survey was low:14 only 1 mother declined to give consent for herself, and 12 mothers did not consent to have us survey their students. Exhibit 7 shows the distribution of sample respondents by departments and school level. Exhibit 8 shows the distribution of school location depending on whether the school was located in an Oualo or Diery area or near the Route National. See Appendix 3 for a detailed list of schools and the number of respondents by category.
8 Pastoral area. 9 Agricultural area that is cultivated, adjacent to a river, and generally hard to access during the rainy season. 10 DAP is the school feeding project that preceded the Food for Education (FFE) Saint-Louis project. 11 We interviewed pairs of mothers and children for two reasons: 1) to ensure we obtained parental consent to survey each student and 2) to enable us to more meaningfully interpret the findings between students and mothers. 12 We didn’t sample preschool students because they do not possess the cognitive or emotional skills to answer the type of questions we asked in our surveys, and conducted the surveys with their mothers instead. 13 In case of missing mothers and/or students, we surveyed replacement pairs present at the school, whom we also selected randomly, to reach the necessary sample size. Replacement rates were low – 9 percent among pairs. 14 In accordance with the U.S. Department of Health and Human Services guidelines on Human Subjects Research (45 C.F.R. § 46), we asked all respondents if they consented to proceed with the survey. For students specifically, enumerators asked mothers to give us consent to survey their students, and asked students for their assent to be surveyed. Human Subject Regulations Decision Charts. (2016, February 16). Retrieved from http://www.hhs.gov/ohrp/policy/checklists/decisioncharts.html

IMPAQ International, LLC Page 8 Food For Education Baseline Report
Exhibit 7: Sample Distribution by Department and Type of Respondent
School Type Type of Respondents Dagana Podor Saint Louis Total
Primary
Schools 13 28 -- 41
Students 342 688 -- 1030
Mothers 307 644 -- 951
Teachers 69 158 -- 227
Directors15 13 25 -- 38
PTAs 24 40 -- 64
Type of Respondents Dagana Podor Saint Louis Total
Preschool
Schools 17 8 25 50
Mothers 106 32 203 341
Teachers 43 21 76 140
Directors16 17 8 24 49
PTAs 10 2 26 38 Source: Surveys of Students, Mothers, Teachers, and Directors; authors’ calculations.
Exhibit 8: Sample Distribution of School by Department and Location
Characteristic Preschool Primary School
Dagana Podor Saint Louis Dagana Podor
Schools near national route 0% 63% 0% 31% 61%
Diery schools N/A N/A N/A 38% 32%
Oualo schools N/A N/A N/A 31% 7%
Total number of schools 17 8 25 13 28 Source: CPI school level data; authors’ calculations.
Below we discuss the basic demographic characteristics of each group of respondents.
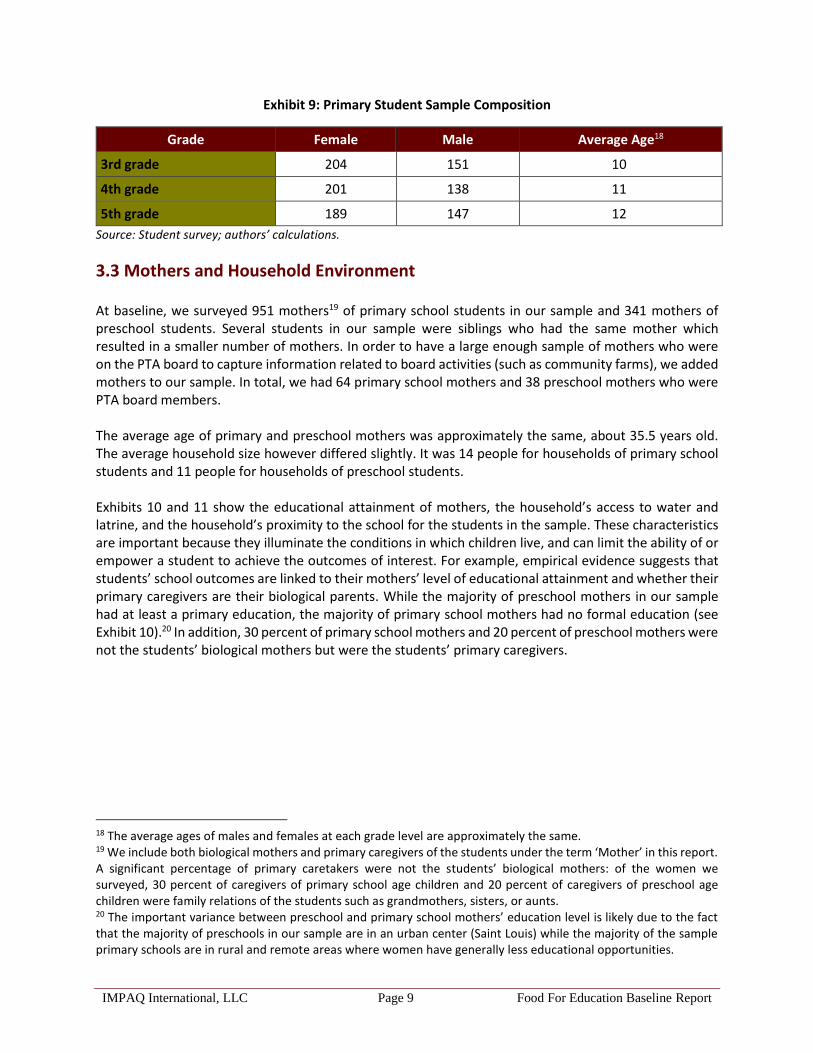
3.2 Students At baseline, we surveyed 1030 primary school students (594 females and 436 males) from grades 3 through 5. Within each grade in each school, we randomly selected five girls and four boys to maintain the boys-to-girls ratio between the sample of students and the population of beneficiary students.17 This sample will enable us to disaggregate the data by student gender and to explore differences across grade levels. Exhibit 9 shows the composition of the student sample in terms of grade, gender, and average age.
15 These include respondents who served as directors only or were directors who also taught at the school. 16 These include respondents who served as directors only or were directors who also taught at the school. 17 We oversampled boys and girls in the five largest schools to compensate for the five to six small schools without sufficient number of students to pool from.
IMPAQ International, LLC Page 9 Food For Education Baseline Report
Exhibit 9: Primary Student Sample Composition
Grade Female Male Average Age18
3rd grade 204 151 10
4th grade 201 138 11
5th grade 189 147 12
Source: Student survey; authors’ calculations.
3.3 Mothers and Household Environment At baseline, we surveyed 951 mothers19 of primary school students in our sample and 341 mothers of preschool students. Several students in our sample were siblings who had the same mother which resulted in a smaller number of mothers. In order to have a large enough sample of mothers who were on the PTA board to capture information related to board activities (such as community farms), we added mothers to our sample. In total, we had 64 primary school mothers and 38 preschool mothers who were PTA board members. The average age of primary and preschool mothers was approximately the same, about 35.5 years old. The average household size however differed slightly. It was 14 people for households of primary school students and 11 people for households of preschool students. Exhibits 10 and 11 show the educational attainment of mothers, the household’s access to water and latrine, and the household’s proximity to the school for the students in the sample. These characteristics are important because they illuminate the conditions in which children live, and can limit the ability of or empower a student to achieve the outcomes of interest. For example, empirical evidence suggests that students’ school outcomes are linked to their mothers’ level of educational attainment and whether their primary caregivers are their biological parents. While the majority of preschool mothers in our sample had at least a primary education, the majority of primary school mothers had no formal education (see Exhibit 10).20 In addition, 30 percent of primary school mothers and 20 percent of preschool mothers were not the students’ biological mothers but were the students’ primary caregivers.
18 The average ages of males and females at each grade level are approximately the same. 19 We include both biological mothers and primary caregivers of the students under the term ‘Mother’ in this report. A significant percentage of primary caretakers were not the students’ biological mothers: of the women we surveyed, 30 percent of caregivers of primary school age children and 20 percent of caregivers of preschool age children were family relations of the students such as grandmothers, sisters, or aunts. 20 The important variance between preschool and primary school mothers’ education level is likely due to the fact that the majority of preschools in our sample are in an urban center (Saint Louis) while the majority of the sample primary schools are in rural and remote areas where women have generally less educational opportunities.

IMPAQ International, LLC Page 10 Food For Education Baseline Report
Exhibit 10: Mothers’ Educational Attainment (in Percentages)
Source: Mother Survey; authors’ calculations.
There are some notable regional difference with regards to mothers’ levels of educational attainment. Of note, approximately 77 percent of preschool mothers in Saint Louis had at least a primary education, which is 10 to 20 percent higher compared to that of preschool mothers in Podor and Dagana, respectively (see Exhibit 42 in Appendix 4 for a breakdown of mothers’ education by region). Furthermore, easy access21 to water and latrines at home can facilitate hygiene practices. The majority of mothers in our sample said that they had access to water and a latrine at home (Exhibit 11). In addition, the home’s proximity to the school may not only facilitate parental engagement with the school but also facilitate students’ school access and attendance. In our sample, 80 percent of mothers said that they lived within a 15 minute walk of their children’s school.
Exhibit 11: Household Characteristics
HH Environnent Preschool Primary School
Access to water in HH 94% 85%
Access to a latrine in HH 93% 80%
Distance between HH and school <15 min 79% 78%
Source: Mother Survey; authors’ calculations.
3.4 Teachers We surveyed a total of 367 teachers, including 227 primary school teachers and 140 preschool teachers. We surveyed approximately six teachers in each primary school and three teachers per preschool. The teacher turnover rate within the 3 month period between the time we received the list and the time we collected the data was relatively low: 13 percent of primary school teachers and 4 percent of preschool
21 Access was defined as having water available at the household when needed for activities such as cooking, washing, etc.
IMPAQ International, LLC Page 11 Food For Education Baseline Report
teachers were replaced for variety of reasons (e.g., no longer works at the school, transferred to another school, etc.)
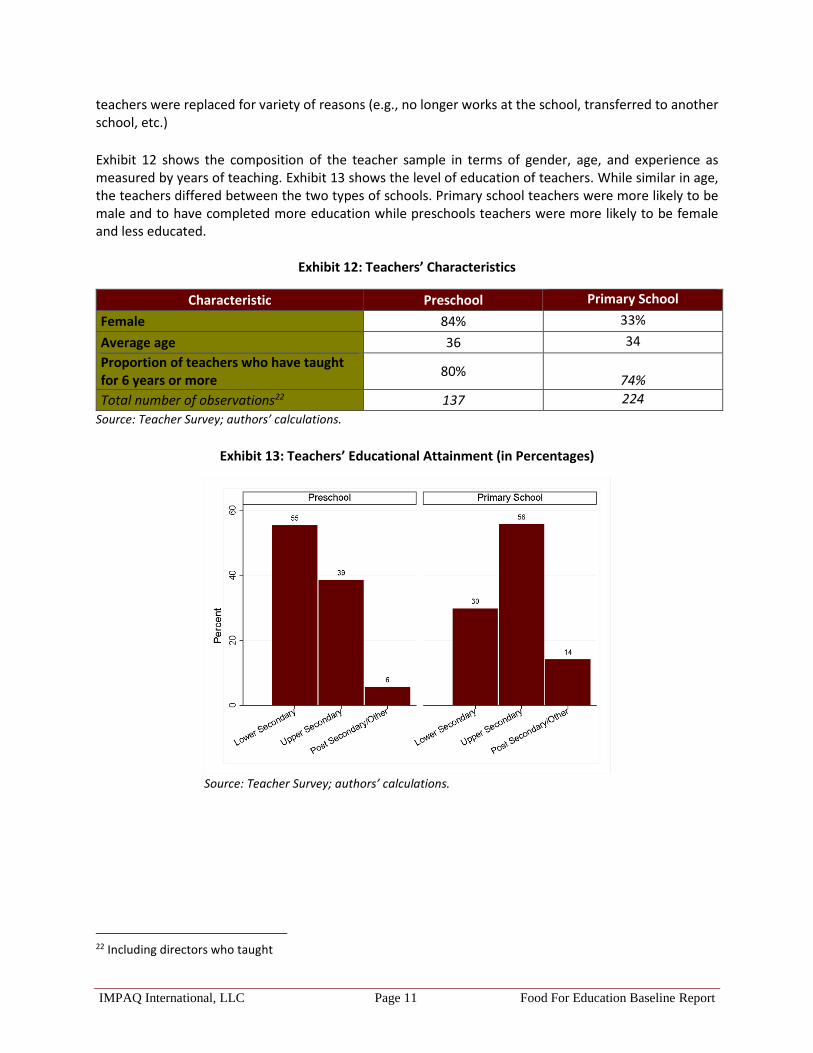
Exhibit 12 shows the composition of the teacher sample in terms of gender, age, and experience as measured by years of teaching. Exhibit 13 shows the level of education of teachers. While similar in age, the teachers differed between the two types of schools. Primary school teachers were more likely to be male and to have completed more education while preschools teachers were more likely to be female and less educated.
Exhibit 12: Teachers’ Characteristics
Characteristic Preschool Primary School
Female 84% 33%
Average age 36 34
Proportion of teachers who have taught for 6 years or more
80%
74%
Total number of observations22 137 224
Source: Teacher Survey; authors’ calculations.
Exhibit 13: Teachers’ Educational Attainment (in Percentages)
Source: Teacher Survey; authors’ calculations.
22 Including directors who taught

IMPAQ International, LLC Page 12 Food For Education Baseline Report
3.5 Directors We surveyed all directors from our sample, a total of 87 school directors, including 38 primary school directors and 49 preschool directors. The turnover of directors within the three month period between the time we received the list and the time we collected the data was higher than that of teachers: 26 percent of primary school directors and 12 percent of preschool directors were replaced. About half to slightly more than half of both types of directors had been serving at the school for at least six years. Exhibit 14 shows the composition of the director sample in terms of gender, age, and teaching status (as measured by the percent of directors who also serve as teachers at the school). Exhibit 15 shows the level of education of directors. We observed similar differences in age and level of educational attainment among the school directors: Primary school directors were almost all male and were more educated than preschools directors who on average were female and less educated.
Exhibit 14: Directors’ Characteristics
Characteristics Preschool Primary School
Female 63% 3%
Average age 42 44
Proportion of directors who also teach 63% 47%
Proportion of directors who have served their school for 6 or more years
57% 50%
Total number of observations23 49 38
Source: Director Survey; authors’ calculations.
Exhibit 15: Directors’ Educational Attainment (in Percentages)
Source: Director Survey; authors’ calculations
23 Including directors who taught
IMPAQ International, LLC Page 13 Food For Education Baseline Report
CHAPTER 4. FIELD WORK AND ANALYSIS
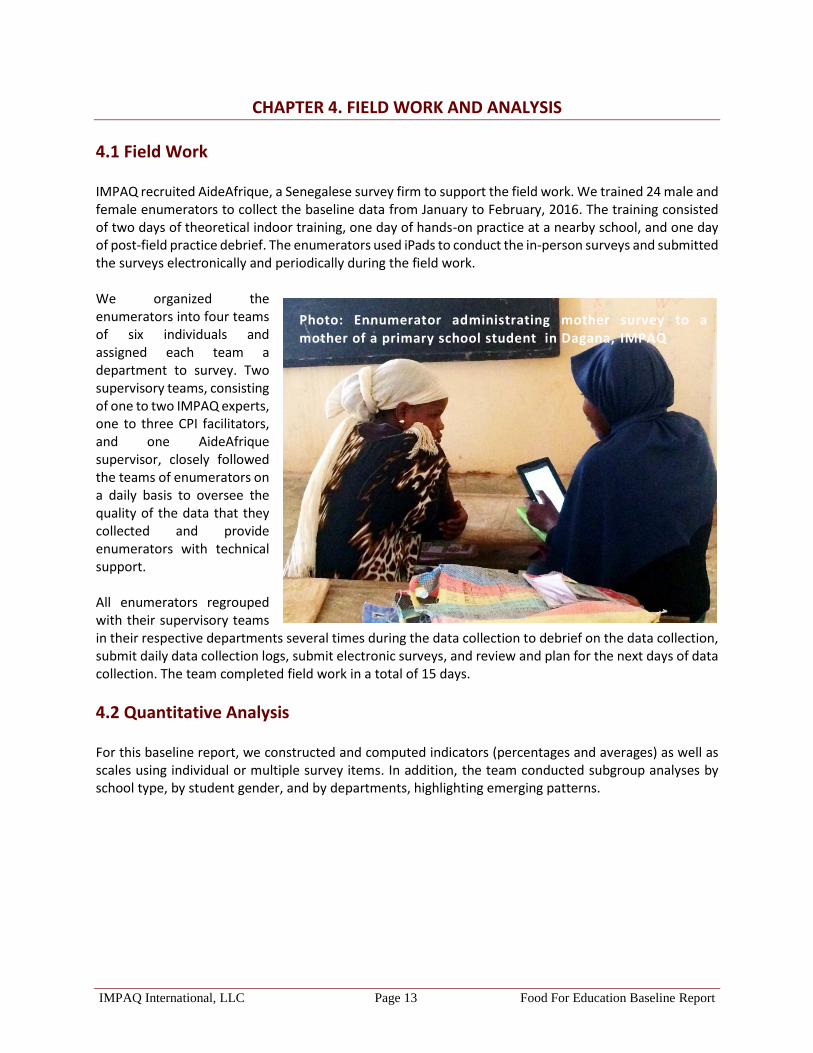
4.1 Field Work IMPAQ recruited AideAfrique, a Senegalese survey firm to support the field work. We trained 24 male and female enumerators to collect the baseline data from January to February, 2016. The training consisted of two days of theoretical indoor training, one day of hands-on practice at a nearby school, and one day of post-field practice debrief. The enumerators used iPads to conduct the in-person surveys and submitted the surveys electronically and periodically during the field work. We organized the enumerators into four teams of six individuals and assigned each team a department to survey. Two supervisory teams, consisting of one to two IMPAQ experts, one to three CPI facilitators, and one AideAfrique supervisor, closely followed the teams of enumerators on a daily basis to oversee the quality of the data that they collected and provide enumerators with technical support. All enumerators regrouped with their supervisory teams in their respective departments several times during the data collection to debrief on the data collection, submit daily data collection logs, submit electronic surveys, and review and plan for the next days of data collection. The team completed field work in a total of 15 days.
4.2 Quantitative Analysis For this baseline report, we constructed and computed indicators (percentages and averages) as well as scales using individual or multiple survey items. In addition, the team conducted subgroup analyses by school type, by student gender, and by departments, highlighting emerging patterns.
Photo: Ennumerator administrating mother survey to a mother of a primary school student in Dagana, IMPAQ

IMPAQ International, LLC Page 14 Food For Education Baseline Report
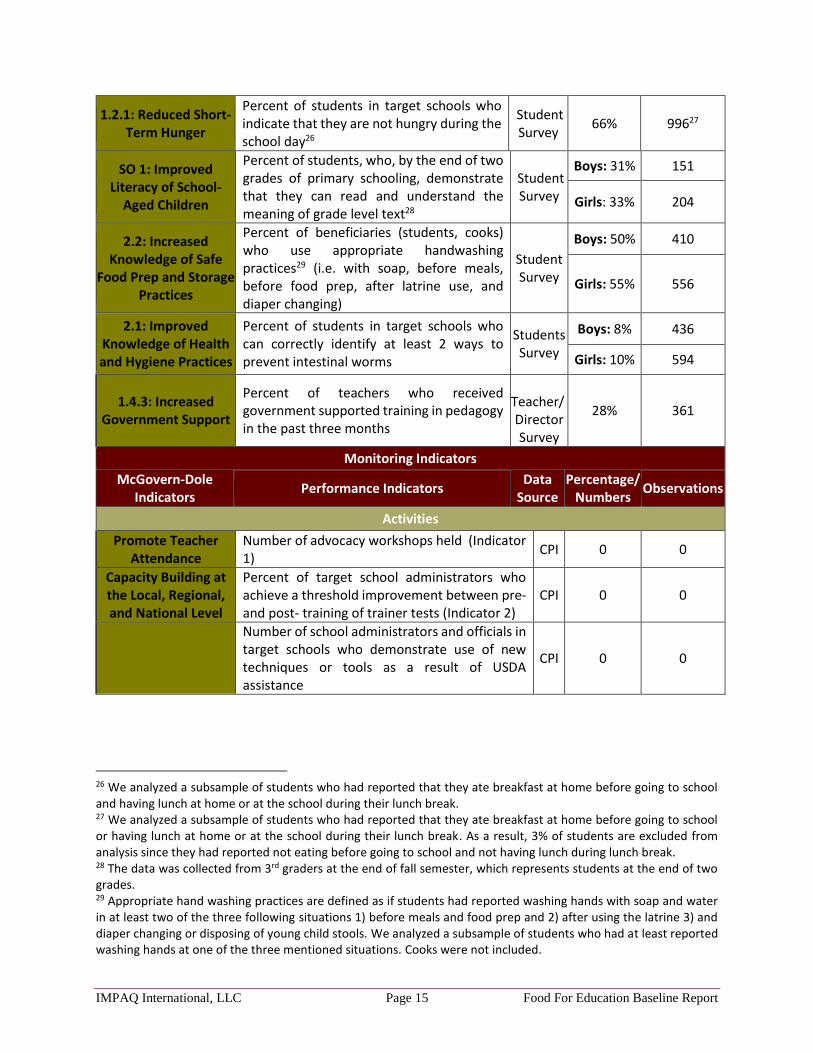
CHAPTER 5. BASELINE LEVELS Below, we analyze data from the surveys of students, mothers, teachers, and directors separately and disaggregate the data by type of school: preschools and primary schools. We highlight indicators that have considerable regional and gender differences, and provide further details in the referenced appendices 4 and 5. We note the number of observations in the exhibits as appropriate. Due to the low sample sizes of directors and PTA board members, we refrain from reporting differences by school type and by region for this group of respondents. In addition, we report in the table below the baseline levels for the McGovern Dole Performance Indicators, as required by the approved Monitoring and Evaluation (M&E) Plan (see Exhibit 16). Per the approved M&E plan, MPAQ is responsible for collecting data for the performance indicators listed under the evaluation indicators while CPI will collect data to inform the performance indicators listed under monitoring indicators.
Exhibit 16: Baseline Levels for McGovern Dole Performance Indicators
Evaluation Indicators
McGovern-Dole Indicators
Performance Indicators Data
Source
Percentage/
Numbers Observations
1.1.4: Increased Skills and Knowledge of
Teachers
Number of school administrators and officials trained or certified as a result of USDA assistance24
CPI 0 0
1.1.5: Increased Skills and Knowledge of
School Administrator
Number of teachers/educators/teaching assistants trained or certified as a result of USDA assistance25
CPI 0 0
SO 2: Increased Use of Health and Dietary
Practices
Percent of school-aged children receiving a minimum acceptable diet at the school level
Student Survey
Dag
ana Boys:
2% 156
Girls: 1%
185
Po
do
r
Boys: 1%
279
Girls: 2%
402
24 Since the project has not started yet, school administrators and officials defined as school directors have not been trained or certified as a result of USDA assistance. 25 Since the project has not started yet, teachers/educators/teaching assistants have not been trained or certified as a result of USDA assistance.
IMPAQ International, LLC Page 15 Food For Education Baseline Report
1.2.1: Reduced Short-Term Hunger
Percent of students in target schools who indicate that they are not hungry during the school day26
Student Survey
66% 99627
SO 1: Improved Literacy of School-
Aged Children
Percent of students, who, by the end of two grades of primary schooling, demonstrate that they can read and understand the meaning of grade level text28
Student Survey
Boys: 31% 151
Girls: 33% 204
2.2: Increased Knowledge of Safe
Food Prep and Storage Practices
Percent of beneficiaries (students, cooks) who use appropriate handwashing practices29 (i.e. with soap, before meals, before food prep, after latrine use, and diaper changing)
Student Survey
Boys: 50% 410
Girls: 55% 556
2.1: Improved Knowledge of Health and Hygiene Practices
Percent of students in target schools who can correctly identify at least 2 ways to prevent intestinal worms
Students Survey
Boys: 8% 436
Girls: 10% 594
1.4.3: Increased Government Support
Percent of teachers who received government supported training in pedagogy in the past three months
Teacher/ Director Survey
28% 361
Monitoring Indicators
McGovern-Dole Indicators
Performance Indicators Data
Source Percentage/
Numbers Observations
Activities
Promote Teacher Attendance
Number of advocacy workshops held (Indicator 1)
CPI 0 0
Capacity Building at the Local, Regional, and National Level
Percent of target school administrators who achieve a threshold improvement between pre- and post- training of trainer tests (Indicator 2)
CPI 0 0
Number of school administrators and officials in target schools who demonstrate use of new techniques or tools as a result of USDA assistance
CPI 0 0
26 We analyzed a subsample of students who had reported that they ate breakfast at home before going to school and having lunch at home or at the school during their lunch break. 27 We analyzed a subsample of students who had reported that they ate breakfast at home before going to school or having lunch at home or at the school during their lunch break. As a result, 3% of students are excluded from analysis since they had reported not eating before going to school and not having lunch during lunch break. 28 The data was collected from 3rd graders at the end of fall semester, which represents students at the end of two grades. 29 Appropriate hand washing practices are defined as if students had reported washing hands with soap and water in at least two of the three following situations 1) before meals and food prep and 2) after using the latrine 3) and diaper changing or disposing of young child stools. We analyzed a subsample of students who had at least reported washing hands at one of the three mentioned situations. Cooks were not included.

IMPAQ International, LLC Page 16 Food For Education Baseline Report
Number of teachers/educators/teaching assistants in target schools who demonstrate use of new and quality teaching techniques or tools as a result of USDA assistance
CPI 0 0
Construct Latrines and Water Station Systems
Number of educational facilities (i.e. school buildings, classrooms, and latrines) rehabilitated/constructed as a result of USDA assistance (latrines) (Indicator 7)
CPI 0 0
School Infrastructure
Number of educational facilities (i.e. school buildings, classrooms, and latrines) rehabilitated/constructed as a result of USDA assistance (classrooms) (Indicator 7)
CPI 0 0
Parent Association Training
Number of PA members trained as a result of USDA assistance (Indicator 8)
CPI 0 0
School Feeding
Number of daily school meals (breakfast, snack, lunch) provided to school-age children as a result of USDA assistance (Indicator 9)
CPI 0 0
Number of school-aged children receiving daily school meals (breakfast, snack, lunch) as a result of USDA assistance (Indicator 10)
CPI 0 0
Number of students regularly (80%) attending USDA supported classrooms/schools (Indicator 11)30
CPI 0 0
Number of students enrolled in schools receiving USDA assistance (Indicator 12)
CPI Boys:17,974
0 Girls: 25,066
School Feeding
Number of social assistance beneficiaries participating in productive safety nets as a result of USDA assistance (Indicator 13)
CPI 0 0
Number of individuals benefiting directly from USDA-funded interventions (Indicator 14)
CPI 0 0
Number of individuals benefiting indirectly from USDA-funded interventions (Indicator 15)
CPI 0 0
Establish Community Farms
Number of community farms established (Indicator 16)
CPI 0 0
Good Health and Nutrition Practices
Number of individuals trained in child health and nutrition as a result of USDA assistance (Indicator 17)
CPI 0 0
Training in Food Preparation and Storage Practices
Number of people trained in Food Preparation and Storage Practices as a result of USDA assistance (Indicator 18)
CPI 0 0
Provide Access to Preventive Health
Interventions
Number of students receiving deworming medication(s) (Indicator 19)
CPI 0 0
30 CPI is currently collecting this data.

IMPAQ International, LLC Page 17 Food For Education Baseline Report
Equip Schools with Energy Saving Stoves, Canteen Equipment
and Materials
Number of school canteens equipped with canteen equipment and material (Indicator 20)
CPI 0 0
Results
SO 1: Improved Literacy of School-Age
Children
Number of individuals benefiting indirectly from USDA funded interventions (Indicator 15)
CPI 0 0
Number of individuals benefiting directly from USDA-funded interventions (Indicator 14)
CPI 0 0
1.1.1: More Consistent Teacher Attendance
Percent increase in average teacher attendance rates compared to baseline (Indicator 22)
CPI 0 0
1.1.5: Increased Skills and Knowledge of
School Administrators
Percent of target school administrators who achieve a threshold improvement between pre and post training of trainer tests (Indicator 2)
CPI 0 0
1.3: Improved Student Attendance
Number of students regularly (80%) attending USDA supported classrooms/schools (Indicator 11)
CPI 0 0
Number of students enrolled in schools receiving USDA assistance (Indicator 12)
CPI
Boys: 17,974
0 Girls: 25,066
1.4.2 Improved Policy and Regulatory
Framework
Numbers of educational policies, regulations, or administrative procedures in each of the following stages of development as a result of USDA assistance (Indicator 26)
CPI 0 0
1.4.4: Increased Engagement of Local
Organizations and Community Groups
Number of Parent-Teacher Associations (PTAs) or similar “school” governance structures supported as a result of USDA assistance (Indicator 28)
CPI 0 0
2.7.2: Increased Policy or Regulatory
Framework
Number of child health and nutritional policies, regulations or administrative procedures in the following stages of development as a result of USDA assistance (Indicator 32)
CPI 0 0
FTF: Contributions to Feed the Future
Number of social assistance beneficiaries participating in productive safety nets as a result of USDA assistance (Indicator 33)
CPI 0 0
Number of individuals trained in child health and nutrition as a result of USDA assistance (Indicator 17)
CPI 0 0
Author’s calculations.
IMPAQ International, LLC Page 18 Food For Education Baseline Report
5.1 School Outcomes In this section, we present baseline outcomes for schools in our sample in four key areas, using the following data on school characteristics provided by CPI:31
School enrollment Teaching staff size School infrastructure status School infrastructure needs
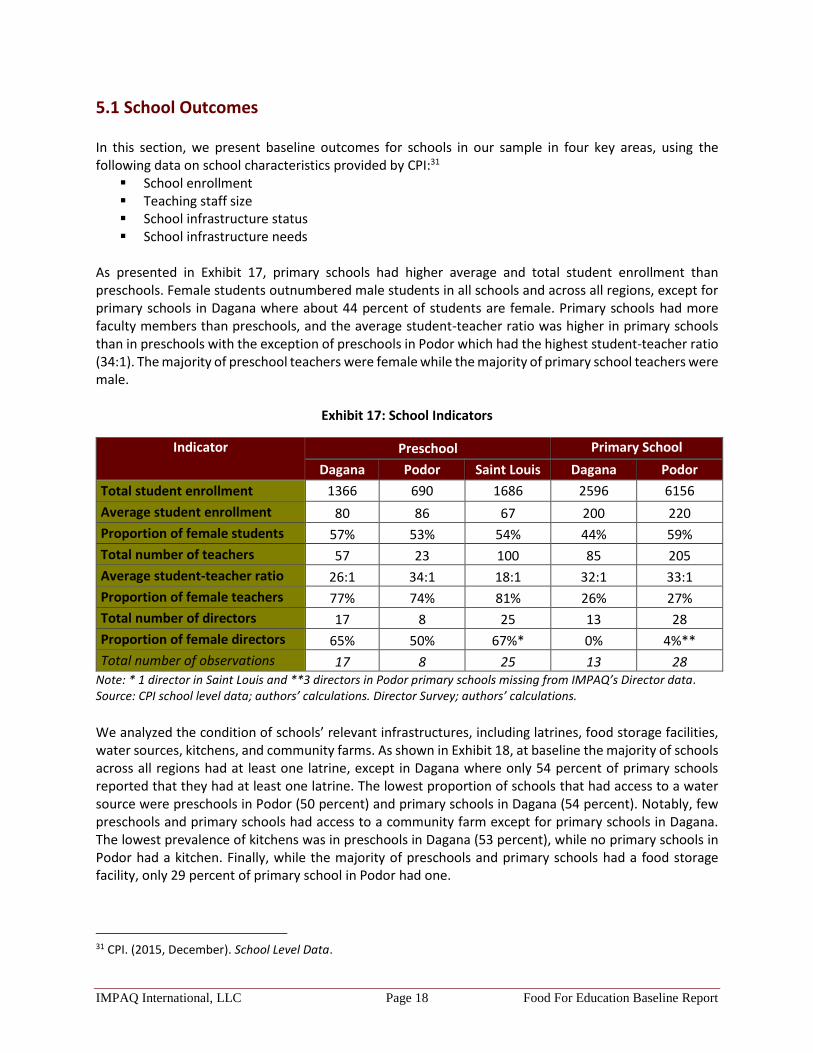
As presented in Exhibit 17, primary schools had higher average and total student enrollment than preschools. Female students outnumbered male students in all schools and across all regions, except for primary schools in Dagana where about 44 percent of students are female. Primary schools had more faculty members than preschools, and the average student-teacher ratio was higher in primary schools than in preschools with the exception of preschools in Podor which had the highest student-teacher ratio (34:1). The majority of preschool teachers were female while the majority of primary school teachers were male.
Exhibit 17: School Indicators
Indicator
Preschool Primary School
Dagana Podor Saint Louis Dagana Podor
Total student enrollment 1366 690 1686 2596 6156
Average student enrollment 80 86 67 200 220
Proportion of female students 57% 53% 54% 44% 59%
Total number of teachers 57 23 100 85 205
Average student-teacher ratio 26:1 34:1 18:1 32:1 33:1
Proportion of female teachers 77% 74% 81% 26% 27%
Total number of directors 17 8 25 13 28
Proportion of female directors 65% 50% 67%* 0% 4%**
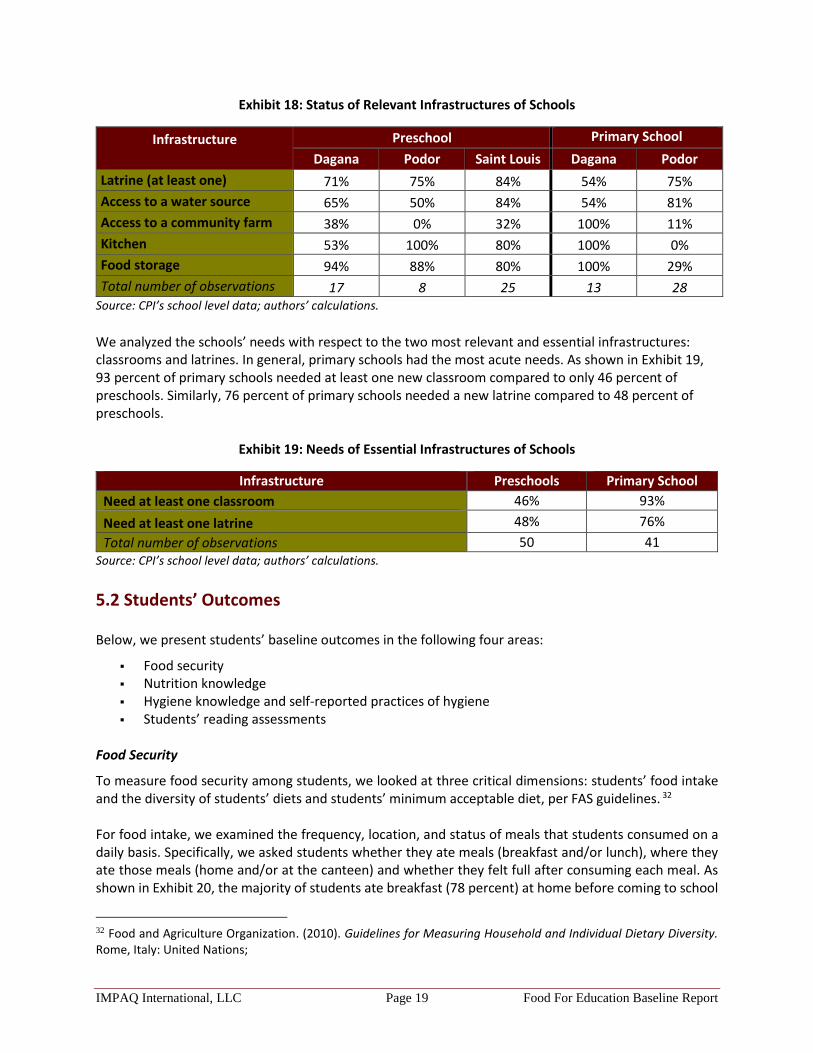
Total number of observations 17 8 25 13 28 Note: * 1 director in Saint Louis and **3 directors in Podor primary schools missing from IMPAQ’s Director data. Source: CPI school level data; authors’ calculations. Director Survey; authors’ calculations. We analyzed the condition of schools’ relevant infrastructures, including latrines, food storage facilities, water sources, kitchens, and community farms. As shown in Exhibit 18, at baseline the majority of schools across all regions had at least one latrine, except in Dagana where only 54 percent of primary schools reported that they had at least one latrine. The lowest proportion of schools that had access to a water source were preschools in Podor (50 percent) and primary schools in Dagana (54 percent). Notably, few preschools and primary schools had access to a community farm except for primary schools in Dagana. The lowest prevalence of kitchens was in preschools in Dagana (53 percent), while no primary schools in Podor had a kitchen. Finally, while the majority of preschools and primary schools had a food storage facility, only 29 percent of primary school in Podor had one.
31 CPI. (2015, December). School Level Data.
IMPAQ International, LLC Page 19 Food For Education Baseline Report
Exhibit 18: Status of Relevant Infrastructures of Schools
Infrastructure
Preschool Primary School
Dagana Podor Saint Louis Dagana Podor
Latrine (at least one) 71% 75% 84% 54% 75%
Access to a water source 65% 50% 84% 54% 81%
Access to a community farm 38% 0% 32% 100% 11%
Kitchen 53% 100% 80% 100% 0%
Food storage 94% 88% 80% 100% 29%
Total number of observations 17 8 25 13 28 Source: CPI’s school level data; authors’ calculations.
We analyzed the schools’ needs with respect to the two most relevant and essential infrastructures: classrooms and latrines. In general, primary schools had the most acute needs. As shown in Exhibit 19, 93 percent of primary schools needed at least one new classroom compared to only 46 percent of preschools. Similarly, 76 percent of primary schools needed a new latrine compared to 48 percent of preschools.
Exhibit 19: Needs of Essential Infrastructures of Schools
Infrastructure Preschools Primary School
Need at least one classroom 46% 93%
Need at least one latrine 48% 76%
Total number of observations 50 41 Source: CPI’s school level data; authors’ calculations.
5.2 Students’ Outcomes Below, we present students’ baseline outcomes in the following four areas:
Food security Nutrition knowledge Hygiene knowledge and self-reported practices of hygiene Students’ reading assessments
Food Security
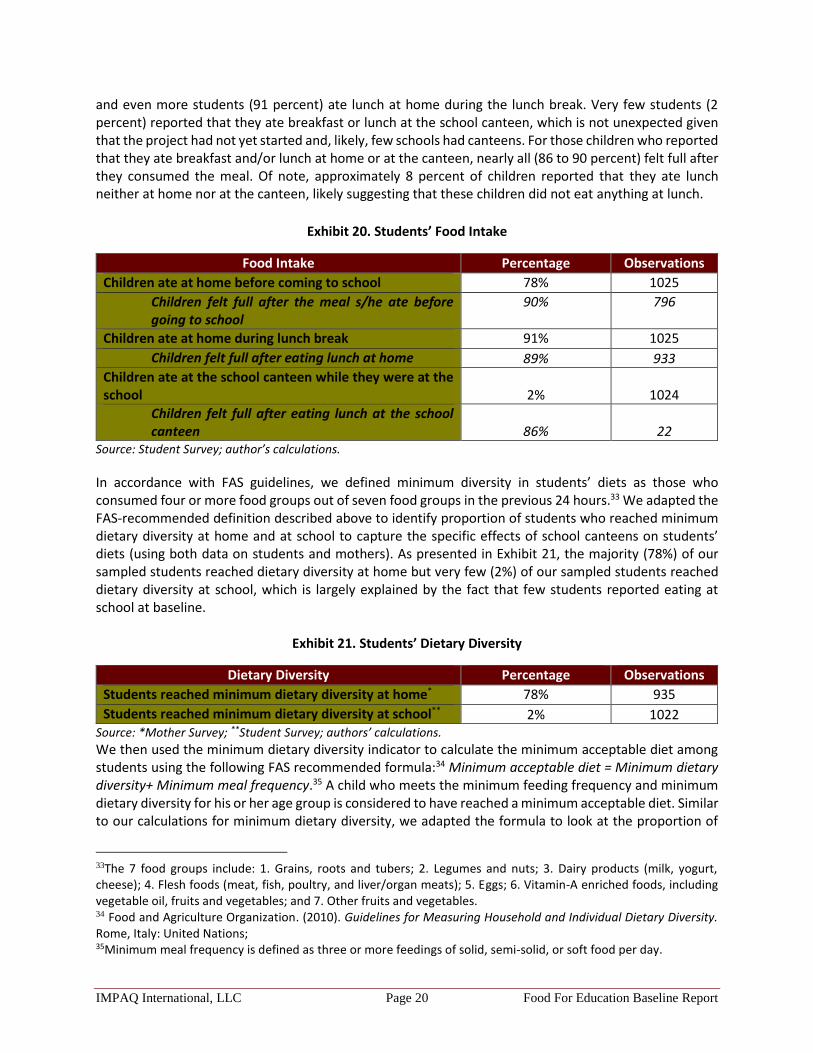
To measure food security among students, we looked at three critical dimensions: students’ food intake and the diversity of students’ diets and students’ minimum acceptable diet, per FAS guidelines. 32 For food intake, we examined the frequency, location, and status of meals that students consumed on a daily basis. Specifically, we asked students whether they ate meals (breakfast and/or lunch), where they ate those meals (home and/or at the canteen) and whether they felt full after consuming each meal. As shown in Exhibit 20, the majority of students ate breakfast (78 percent) at home before coming to school
32 Food and Agriculture Organization. (2010). Guidelines for Measuring Household and Individual Dietary Diversity. Rome, Italy: United Nations;
IMPAQ International, LLC Page 20 Food For Education Baseline Report
and even more students (91 percent) ate lunch at home during the lunch break. Very few students (2 percent) reported that they ate breakfast or lunch at the school canteen, which is not unexpected given that the project had not yet started and, likely, few schools had canteens. For those children who reported that they ate breakfast and/or lunch at home or at the canteen, nearly all (86 to 90 percent) felt full after they consumed the meal. Of note, approximately 8 percent of children reported that they ate lunch neither at home nor at the canteen, likely suggesting that these children did not eat anything at lunch.
Exhibit 20. Students’ Food Intake
Food Intake Percentage Observations
Children ate at home before coming to school 78% 1025
Children felt full after the meal s/he ate before going to school
90% 796
Children ate at home during lunch break 91% 1025
Children felt full after eating lunch at home 89% 933
Children ate at the school canteen while they were at the school 2% 1024
Children felt full after eating lunch at the school canteen 86% 22
Source: Student Survey; author’s calculations.
In accordance with FAS guidelines, we defined minimum diversity in students’ diets as those who consumed four or more food groups out of seven food groups in the previous 24 hours.33 We adapted the FAS-recommended definition described above to identify proportion of students who reached minimum dietary diversity at home and at school to capture the specific effects of school canteens on students’ diets (using both data on students and mothers). As presented in Exhibit 21, the majority (78%) of our sampled students reached dietary diversity at home but very few (2%) of our sampled students reached dietary diversity at school, which is largely explained by the fact that few students reported eating at school at baseline.
Exhibit 21. Students’ Dietary Diversity
Dietary Diversity Percentage Observations
Students reached minimum dietary diversity at home* 78% 935
Students reached minimum dietary diversity at school** 2% 1022 Source: *Mother Survey; **Student Survey; authors’ calculations.
We then used the minimum dietary diversity indicator to calculate the minimum acceptable diet among students using the following FAS recommended formula:34 Minimum acceptable diet = Minimum dietary diversity+ Minimum meal frequency.35 A child who meets the minimum feeding frequency and minimum dietary diversity for his or her age group is considered to have reached a minimum acceptable diet. Similar to our calculations for minimum dietary diversity, we adapted the formula to look at the proportion of
33The 7 food groups include: 1. Grains, roots and tubers; 2. Legumes and nuts; 3. Dairy products (milk, yogurt, cheese); 4. Flesh foods (meat, fish, poultry, and liver/organ meats); 5. Eggs; 6. Vitamin-A enriched foods, including vegetable oil, fruits and vegetables; and 7. Other fruits and vegetables. 34 Food and Agriculture Organization. (2010). Guidelines for Measuring Household and Individual Dietary Diversity. Rome, Italy: United Nations; 35Minimum meal frequency is defined as three or more feedings of solid, semi-solid, or soft food per day.
IMPAQ International, LLC Page 21 Food For Education Baseline Report
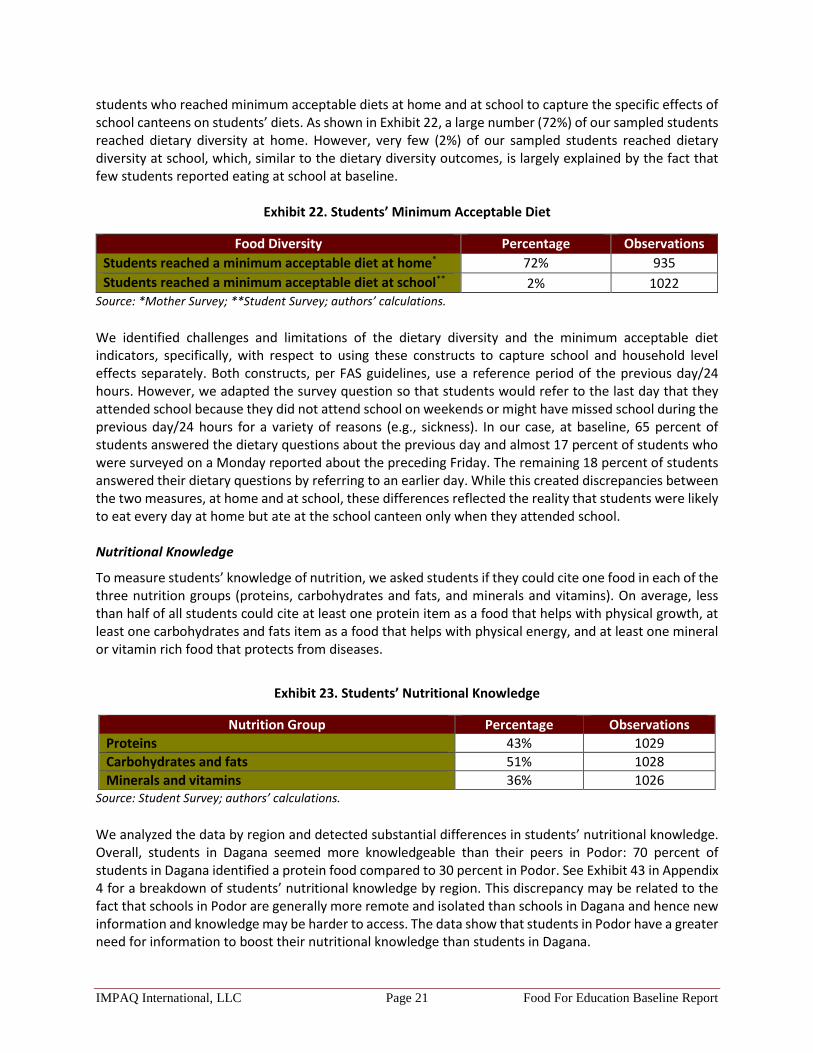
students who reached minimum acceptable diets at home and at school to capture the specific effects of school canteens on students’ diets. As shown in Exhibit 22, a large number (72%) of our sampled students reached dietary diversity at home. However, very few (2%) of our sampled students reached dietary diversity at school, which, similar to the dietary diversity outcomes, is largely explained by the fact that few students reported eating at school at baseline.
Exhibit 22. Students’ Minimum Acceptable Diet
Food Diversity Percentage Observations
Students reached a minimum acceptable diet at home* 72% 935
Students reached a minimum acceptable diet at school** 2% 1022 Source: *Mother Survey; **Student Survey; authors’ calculations.
We identified challenges and limitations of the dietary diversity and the minimum acceptable diet indicators, specifically, with respect to using these constructs to capture school and household level effects separately. Both constructs, per FAS guidelines, use a reference period of the previous day/24 hours. However, we adapted the survey question so that students would refer to the last day that they attended school because they did not attend school on weekends or might have missed school during the previous day/24 hours for a variety of reasons (e.g., sickness). In our case, at baseline, 65 percent of students answered the dietary questions about the previous day and almost 17 percent of students who were surveyed on a Monday reported about the preceding Friday. The remaining 18 percent of students answered their dietary questions by referring to an earlier day. While this created discrepancies between the two measures, at home and at school, these differences reflected the reality that students were likely to eat every day at home but ate at the school canteen only when they attended school.
Nutritional Knowledge
To measure students’ knowledge of nutrition, we asked students if they could cite one food in each of the three nutrition groups (proteins, carbohydrates and fats, and minerals and vitamins). On average, less than half of all students could cite at least one protein item as a food that helps with physical growth, at least one carbohydrates and fats item as a food that helps with physical energy, and at least one mineral or vitamin rich food that protects from diseases.
Exhibit 23. Students’ Nutritional Knowledge
Nutrition Group Percentage Observations
Proteins 43% 1029
Carbohydrates and fats 51% 1028
Minerals and vitamins 36% 1026 Source: Student Survey; authors’ calculations.
We analyzed the data by region and detected substantial differences in students’ nutritional knowledge. Overall, students in Dagana seemed more knowledgeable than their peers in Podor: 70 percent of students in Dagana identified a protein food compared to 30 percent in Podor. See Exhibit 43 in Appendix 4 for a breakdown of students’ nutritional knowledge by region. This discrepancy may be related to the fact that schools in Podor are generally more remote and isolated than schools in Dagana and hence new information and knowledge may be harder to access. The data show that students in Podor have a greater need for information to boost their nutritional knowledge than students in Dagana.
IMPAQ International, LLC Page 22 Food For Education Baseline Report
Hygiene knowledge and self-reported practices of hygiene
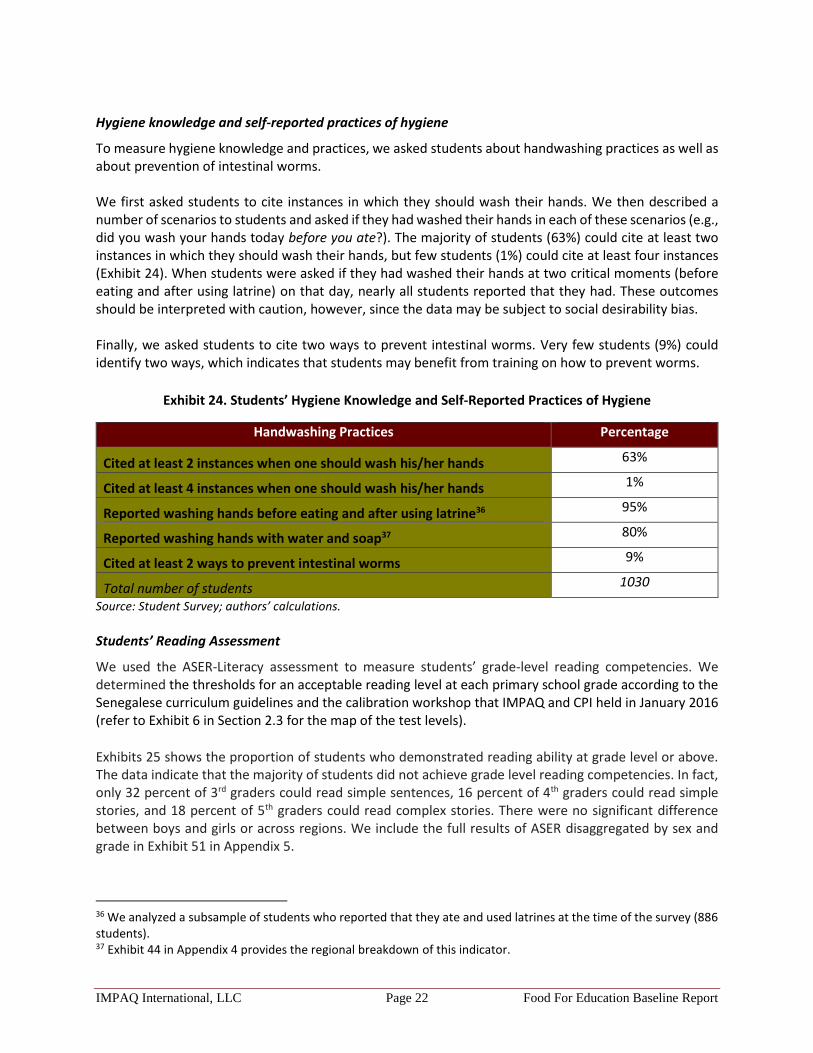
To measure hygiene knowledge and practices, we asked students about handwashing practices as well as about prevention of intestinal worms. We first asked students to cite instances in which they should wash their hands. We then described a number of scenarios to students and asked if they had washed their hands in each of these scenarios (e.g., did you wash your hands today before you ate?). The majority of students (63%) could cite at least two instances in which they should wash their hands, but few students (1%) could cite at least four instances (Exhibit 24). When students were asked if they had washed their hands at two critical moments (before eating and after using latrine) on that day, nearly all students reported that they had. These outcomes should be interpreted with caution, however, since the data may be subject to social desirability bias. Finally, we asked students to cite two ways to prevent intestinal worms. Very few students (9%) could identify two ways, which indicates that students may benefit from training on how to prevent worms.
Exhibit 24. Students’ Hygiene Knowledge and Self-Reported Practices of Hygiene
Handwashing Practices Percentage
Cited at least 2 instances when one should wash his/her hands 63%
Cited at least 4 instances when one should wash his/her hands 1%
Reported washing hands before eating and after using latrine36 95%
Reported washing hands with water and soap37 80%
Cited at least 2 ways to prevent intestinal worms 9%
Total number of students 1030
Source: Student Survey; authors’ calculations.
Students’ Reading Assessment
We used the ASER-Literacy assessment to measure students’ grade-level reading competencies. We determined the thresholds for an acceptable reading level at each primary school grade according to the Senegalese curriculum guidelines and the calibration workshop that IMPAQ and CPI held in January 2016 (refer to Exhibit 6 in Section 2.3 for the map of the test levels).
Exhibits 25 shows the proportion of students who demonstrated reading ability at grade level or above. The data indicate that the majority of students did not achieve grade level reading competencies. In fact, only 32 percent of 3rd graders could read simple sentences, 16 percent of 4th graders could read simple stories, and 18 percent of 5th graders could read complex stories. There were no significant difference between boys and girls or across regions. We include the full results of ASER disaggregated by sex and grade in Exhibit 51 in Appendix 5.
36 We analyzed a subsample of students who reported that they ate and used latrines at the time of the survey (886 students). 37 Exhibit 44 in Appendix 4 provides the regional breakdown of this indicator.

IMPAQ International, LLC Page 23 Food For Education Baseline Report
Exhibit 25. Students Demonstrating Reading Ability at Grade Level and Above
Reading Ability Percentage Observations
Grade 3 demonstrating reading ability at grade level or above 32% 355
Grade 4 demonstrating reading ability at grade level or above 16% 339
Grade 5 demonstrating reading ability at grade level or above 18% 336
Source: Students’ assessments; authors’ calculations.
5.3 Mothers’ Outcomes In this section, we present mothers’ baseline outcomes in the following five areas:
Food security Nutrition knowledge Hygiene knowledge and self-reported practices of hygiene School engagement Mothers’ participation in PTAs
Food Security
To measure the food security of the households of the students in our sample, we asked students’ mothers a series of six questions on the food that their household consumed in the last 12 months and whether they were able to afford the food that they needed. These questions are based on the USDA Household Food Security Survey Module.38 The sum of a mother’s affirmative responses to the six questions is the household’s raw score. We linked the raw score to a food security status as follows:
Raw score 0-1—High or marginal food security Raw score 2-4—Low food security Raw score 5-6—Very low food security
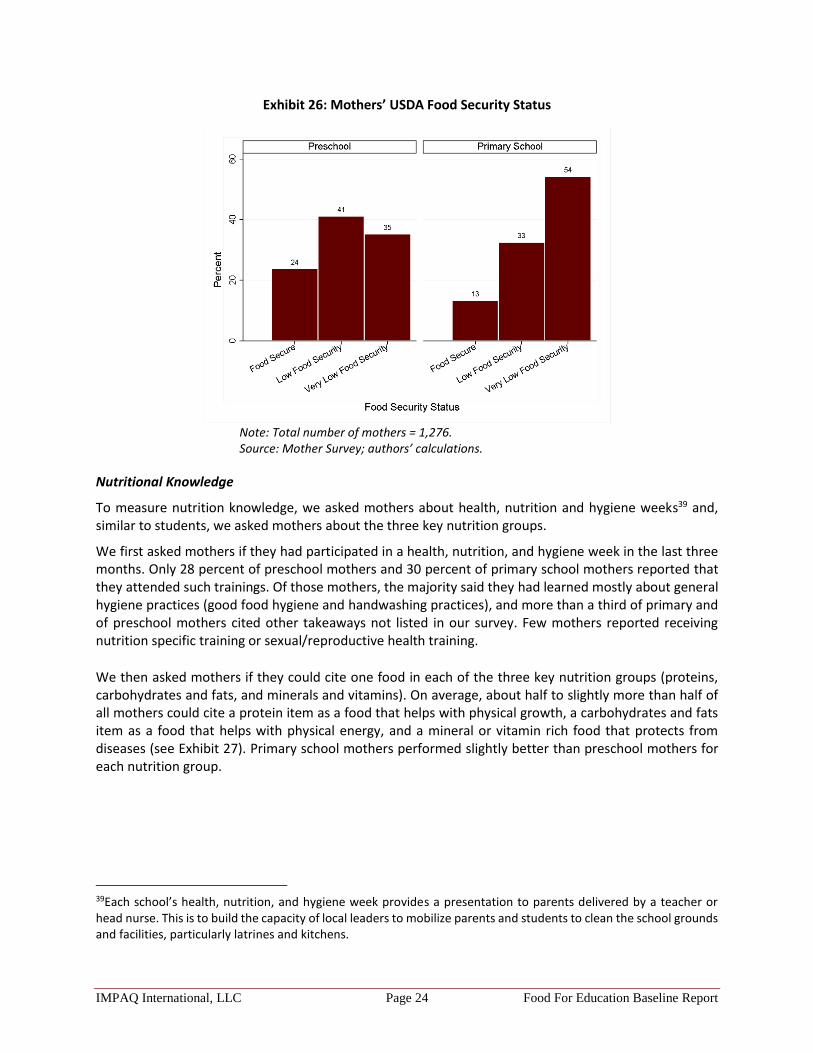
Overall, as shown in Exhibit 26, food security was low among all mothers but particularly low for mothers of students in primary schools. In fact, only 13 percent of primary school mothers were food secure compared to 24 percent of preschool mothers. We hypothesize that the higher food security status among preschool mothers was due to the fact that the majority of our sampled preschools are located in a large urban area (Saint Louis) while the majority of our sampled primary schools are located in remote areas. Nonetheless, the findings suggest that households would benefit from food assistance projects.
38 Economic Research Service, USDA. (2012). U.S. Household Food Security Survey Module: Six-Item Short Form (Tech.). Washington, DC: USDA.
IMPAQ International, LLC Page 24 Food For Education Baseline Report
Exhibit 26: Mothers’ USDA Food Security Status
Note: Total number of mothers = 1,276. Source: Mother Survey; authors’ calculations.
Nutritional Knowledge
To measure nutrition knowledge, we asked mothers about health, nutrition and hygiene weeks39 and, similar to students, we asked mothers about the three key nutrition groups.
We first asked mothers if they had participated in a health, nutrition, and hygiene week in the last three months. Only 28 percent of preschool mothers and 30 percent of primary school mothers reported that they attended such trainings. Of those mothers, the majority said they had learned mostly about general hygiene practices (good food hygiene and handwashing practices), and more than a third of primary and of preschool mothers cited other takeaways not listed in our survey. Few mothers reported receiving nutrition specific training or sexual/reproductive health training.
We then asked mothers if they could cite one food in each of the three key nutrition groups (proteins, carbohydrates and fats, and minerals and vitamins). On average, about half to slightly more than half of all mothers could cite a protein item as a food that helps with physical growth, a carbohydrates and fats item as a food that helps with physical energy, and a mineral or vitamin rich food that protects from diseases (see Exhibit 27). Primary school mothers performed slightly better than preschool mothers for each nutrition group.
39Each school’s health, nutrition, and hygiene week provides a presentation to parents delivered by a teacher or head nurse. This is to build the capacity of local leaders to mobilize parents and students to clean the school grounds and facilities, particularly latrines and kitchens.

IMPAQ International, LLC Page 25 Food For Education Baseline Report
Exhibit 27: Mothers’ Knowledge of Nutrition
Nutrition Group Preschools Primary Schools
Proteins 47% 56%
Carbohydrates and fats 48% 51%
Minerals and vitamins 44% 47%
Total number of observations 341 935 Source: Mother Survey; authors’ calculations.
We analyzed the data by region and found that mothers in Dagana cited more foods in each nutrition group than mothers in Podor and Saint Louis. For example, 76 percent of primary and 63 percent of preschool mothers in Dagana cited at least one food that has protein, while only roughly 45 percent of mothers in Podor and 40 percent of mothers in Saint Louis cited at least one food with protein (see Exhibit 45 in Appendix 4). These findings suggest that mothers’ needs for nutritional training varied by region. Hygiene Knowledge & Self-Reported Practice of Hygiene
To measure mothers’ knowledge of hygiene, we asked mothers about handwashing practices, food hygiene practices, and prevention of intestinal worms. We first asked mothers to identify instances in which they should wash their hands. Roughly 80 percent of all mothers could identify at least two instances; however, very few mothers identified at least four instances (see Exhibit 28). We then asked mothers if they had washed their hands at critical moments that day (e.g., before they ate and after they used the latrine). About 97 percent of mothers in both primary schools and preschools reported that they had washed their hands at both critical moments. We interpret these data with caution because of social desirability biases.40 When we asked mothers what they used to wash their hands, approximately 75 percent of primary school mothers reported that they used soap compared to only 57 percent of preschool mothers. There were notable regional differences: only 47 percent of mothers in Saint Louis reported that they used soap and water compared to roughly 70 percent of mothers in other regions (see Exhibit 46 in Appendix 4).
40 With self reported data, respondents may respond based on the answer they believe is expected of them.
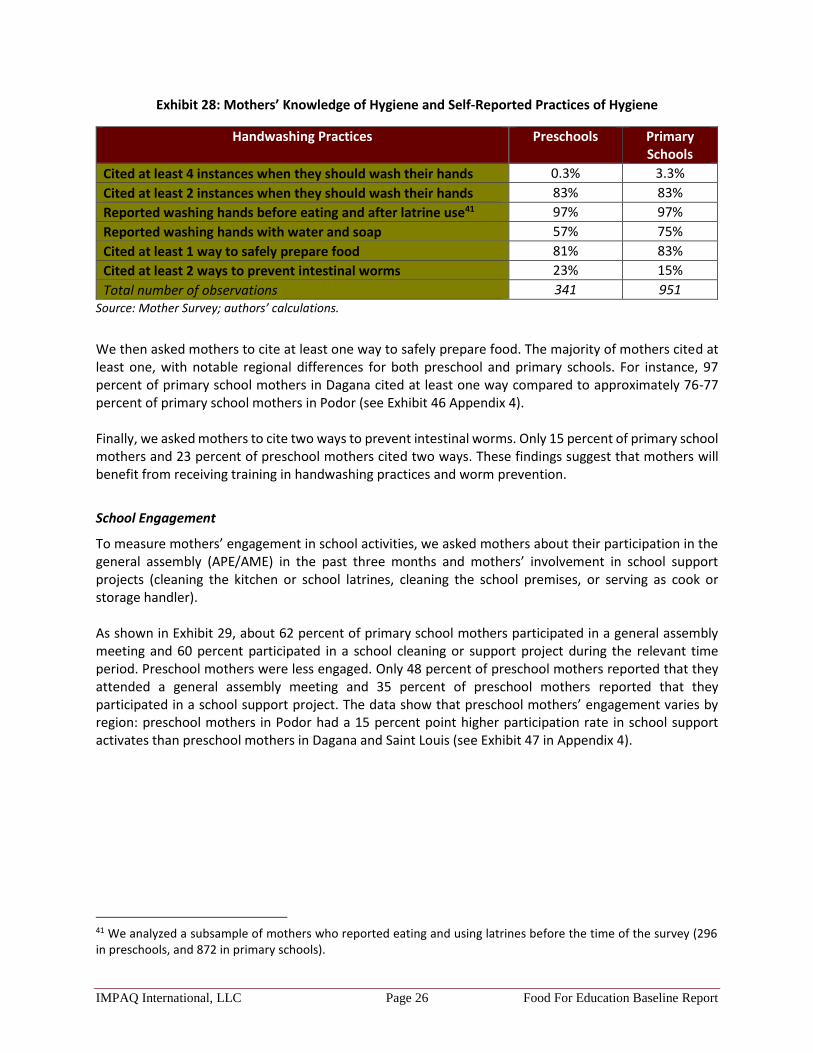
IMPAQ International, LLC Page 26 Food For Education Baseline Report
Exhibit 28: Mothers’ Knowledge of Hygiene and Self-Reported Practices of Hygiene
Handwashing Practices Preschools Primary Schools
Cited at least 4 instances when they should wash their hands 0.3% 3.3%
Cited at least 2 instances when they should wash their hands 83% 83%
Reported washing hands before eating and after latrine use41 97% 97%
Reported washing hands with water and soap 57% 75%
Cited at least 1 way to safely prepare food 81% 83%
Cited at least 2 ways to prevent intestinal worms 23% 15%
Total number of observations 341 951 Source: Mother Survey; authors’ calculations.
We then asked mothers to cite at least one way to safely prepare food. The majority of mothers cited at least one, with notable regional differences for both preschool and primary schools. For instance, 97 percent of primary school mothers in Dagana cited at least one way compared to approximately 76-77 percent of primary school mothers in Podor (see Exhibit 46 Appendix 4). Finally, we asked mothers to cite two ways to prevent intestinal worms. Only 15 percent of primary school mothers and 23 percent of preschool mothers cited two ways. These findings suggest that mothers will benefit from receiving training in handwashing practices and worm prevention.
School Engagement
To measure mothers’ engagement in school activities, we asked mothers about their participation in the general assembly (APE/AME) in the past three months and mothers’ involvement in school support projects (cleaning the kitchen or school latrines, cleaning the school premises, or serving as cook or storage handler). As shown in Exhibit 29, about 62 percent of primary school mothers participated in a general assembly meeting and 60 percent participated in a school cleaning or support project during the relevant time period. Preschool mothers were less engaged. Only 48 percent of preschool mothers reported that they attended a general assembly meeting and 35 percent of preschool mothers reported that they participated in a school support project. The data show that preschool mothers’ engagement varies by region: preschool mothers in Podor had a 15 percent point higher participation rate in school support activates than preschool mothers in Dagana and Saint Louis (see Exhibit 47 in Appendix 4).
41 We analyzed a subsample of mothers who reported eating and using latrines before the time of the survey (296 in preschools, and 872 in primary schools).

IMPAQ International, LLC Page 27 Food For Education Baseline Report
Exhibit 29: Mothers’ Engagement in School Activities
School Engagement Activities Preschools Primary Schools
Attended the general assembly (APE/AME) in the past three months
48% 62%
Participated in at least one school cleaning or support project 35% 60%
Total number of observations 341 935 Source: Mother Survey; authors’ calculations.
Mothers’ Participation in PTAs
To measure mothers’ engagement in PTAs, we asked all mothers about the number of PTA meetings that their student’s school held during the past three months (see Exhibit 30). Of note, about half of all mothers reported that their student’s school PTA held no meetings in the past three months or that they could not recall whether a meeting was held. With regards to meeting attendance, generally half or more of mothers attended meetings when they were held (see Exhibit 52 in Appendix 6 for detailed breakdown).
Exhibit 30: Number of PTA Meetings Held in the Last 3 months
Note: Total number of mothers: Preschools = 341; Primary Schools = 951. Source: Mother Survey; authors’ calculations.
We also examined the proportion of PTA board members who had received special training on committee governance and management, committee member rotation, PTA meeting organization, benefits of education, and knowledge utilization in class settings. Fifty three (53) percent (N=38) of preschool board members and 27 percent (N=64) of primary school board members received some form of training. The most prevalent PTA training received by both types of members was on committee governance and management.
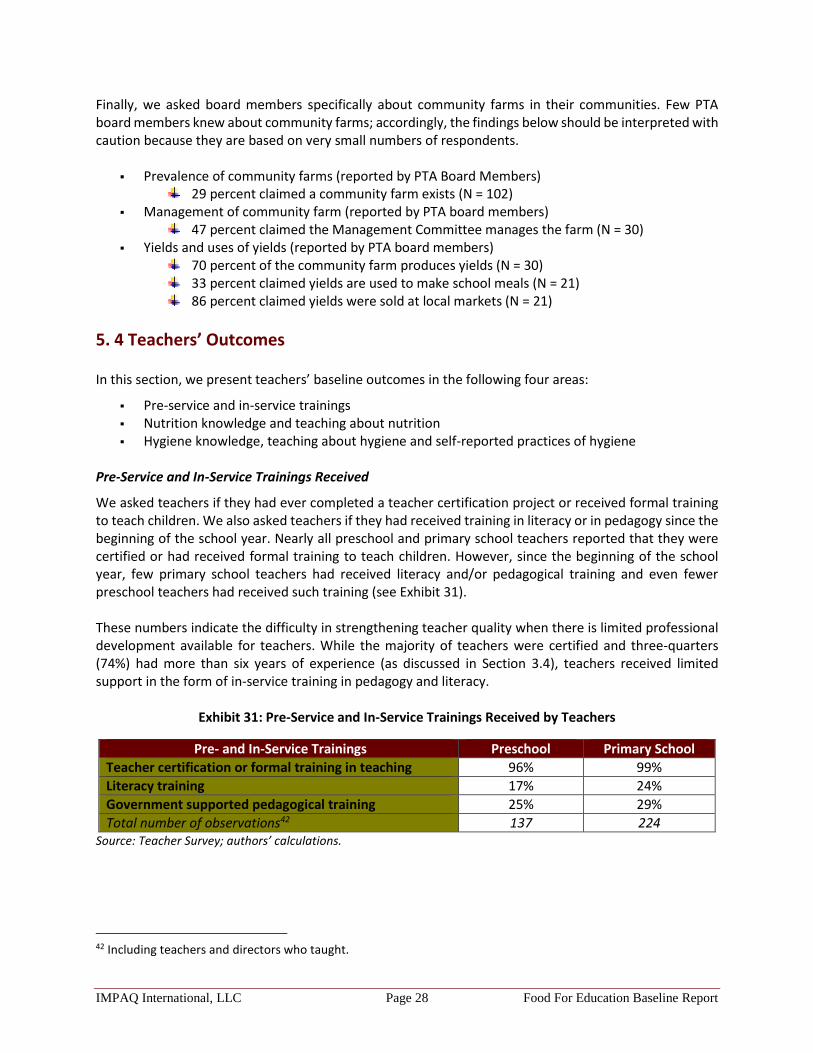
IMPAQ International, LLC Page 28 Food For Education Baseline Report
Finally, we asked board members specifically about community farms in their communities. Few PTA board members knew about community farms; accordingly, the findings below should be interpreted with caution because they are based on very small numbers of respondents.
Prevalence of community farms (reported by PTA Board Members) 29 percent claimed a community farm exists (N = 102)
Management of community farm (reported by PTA board members) 47 percent claimed the Management Committee manages the farm (N = 30)
Yields and uses of yields (reported by PTA board members) 70 percent of the community farm produces yields (N = 30) 33 percent claimed yields are used to make school meals (N = 21) 86 percent claimed yields were sold at local markets (N = 21)
5. 4 Teachers’ Outcomes In this section, we present teachers’ baseline outcomes in the following four areas:
Pre-service and in-service trainings Nutrition knowledge and teaching about nutrition Hygiene knowledge, teaching about hygiene and self-reported practices of hygiene
Pre-Service and In-Service Trainings Received
We asked teachers if they had ever completed a teacher certification project or received formal training to teach children. We also asked teachers if they had received training in literacy or in pedagogy since the beginning of the school year. Nearly all preschool and primary school teachers reported that they were certified or had received formal training to teach children. However, since the beginning of the school year, few primary school teachers had received literacy and/or pedagogical training and even fewer preschool teachers had received such training (see Exhibit 31). These numbers indicate the difficulty in strengthening teacher quality when there is limited professional development available for teachers. While the majority of teachers were certified and three-quarters (74%) had more than six years of experience (as discussed in Section 3.4), teachers received limited support in the form of in-service training in pedagogy and literacy.
Exhibit 31: Pre-Service and In-Service Trainings Received by Teachers
Pre- and In-Service Trainings Preschool Primary School
Teacher certification or formal training in teaching 96% 99%
Literacy training 17% 24%
Government supported pedagogical training 25% 29%
Total number of observations42 137 224 Source: Teacher Survey; authors’ calculations.
42 Including teachers and directors who taught.

IMPAQ International, LLC Page 29 Food For Education Baseline Report
Nutritional Knowledge and Teaching about Nutrition
To measure teachers’ knowledge of nutrition, we asked teachers about nutrition trainings they received and also asked them questions about the three key nutrition groups. We first asked teachers if they had received training about nutrition since the beginning of the school year. While averages were generally low for both types of teachers, many more preschool teachers (18%) had received nutrition training compared to primary school teachers (4%). We hypothesize that the higher rates of trained preschool teachers compared to primary school teachers were due to the fact that most of our sampled preschool teachers were located in an urban area (Saint Louis). Meanwhile, 43 percent of all preschool teachers and 71 percent of all primary school teachers claimed to teach nutrition on a regular basis. When we compared whether teachers who taught about nutrition were teachers who had received nutrition training, we found that primary school teachers were more likely (90%, N=10) to teach about nutrition if they had received nutrition training, but preschool teachers were only slightly more likely (54%, N=24) to teach about nutrition if they had received training. We then asked teachers to cite at least one food in each of the three key nutrition groups (proteins, carbohydrates and fats, and minerals and vitamins). On average, nearly half to more than half of all teachers cited a protein item as a food that helps with physical growth, a carbohydrate and fat item as a food that helps with physical energy, and a mineral or vitamin rich food that protects from diseases (see Exhibit 32). Primary teachers performed slightly better than preschool teachers for each nutrition group, except for carbohydrates and fats. We analyzed the data by region and found that primary school teachers in Dagana seemed more knowledgeable than their counterparts in Podor. In fact, 88 percent of primary school teachers in Dagana identified a protein food compared to 56 percent in Podor. Similarly, 65 percent of primary school teachers in Dagana identified a carbohydrates and fats food item compared to 43 percent in Podor (see Exhibit 48 in Appendix 4 for the full regional breakdown).
Exhibit 32: Teachers’ Knowledge of Nutrition
Nutrition Group Preschool Primary School
Proteins 57% 66%
Carbohydrates and fats 55% 52%
Minerals and vitamins 47% 56%
Total number of observations43 137 224 Source: Teacher Survey; authors’ calculations.
Our data show that teachers, especially those in Podor, need information to boost their own nutritional knowledge, which is a necessary precondition to increasing students’ and communities’ nutritional awareness. In addition, more teachers seem knowledgeable about nutrition than would be expected given the numbers of teachers who have trained in nutrition. Future training should be tailored to topics that provide teachers with new information. Finally, teachers should receive practical support on how to teach nutrition effectively.
43Including teachers and directors who taught.

IMPAQ International, LLC Page 30 Food For Education Baseline Report
Hygiene Knowledge and Self-Reported Practices of Hygiene
To measure teachers’ knowledge of hygiene, we asked teachers about hygiene training, handwashing practices, and prevention of intestinal worms.
Similar to nutrition, we asked teachers if they had received training about hygiene since the beginning of the school year. We found that while the average numbers of teachers who had been trained about hygiene were higher than the ones for nutrition, they were still generally low for both types of teachers, particularly for primary school teachers. In fact, 36 percent of preschool teachers received hygiene training compared to 19 percent for primary school teachers. While training rates were low among teachers, 99 percent of preschool teachers and 95 percent of primary school teachers claimed to teach about hygiene on a regular basis. Only one preschool teacher received hygiene training but claimed not to teach about hygiene (2%, N=50). All primary school teachers who had received hygiene training also claimed to teach about hygiene regularly (100% N=43).
We then asked teachers to cite instances in which they should wash their hands, such as after using latrines or before preparing food. We also provided teachers with a number of scenarios and asked if they had washed their hands in each of these scenarios (e.g., did you wash your hands today before you ate?). The majority of teachers cited at least 2 instances when they should wash their hands, but few teachers cited at least 4 instances (Exhibit 33). Correspondingly, when we asked teachers if they had washed their hands at two critical instances (before eating and after using the latrines), nearly all teachers reported that they did. When prompted about what they used to wash their hands, 86 percent of primary school teachers reported that they used soap and water compared to 70 percent of preschool teachers. We found important regional differences in the data: 92 percent of primary school teachers in Podor reported using soap and water compared to roughly 70 percent of teachers in other regions (see Exhibit 49 in Appendix 4). These data should be interpreted with caution due to social desirability bias.
Exhibit 33: Teachers’ Knowledge of Hygiene
Handwashing Practices Preschool Primary School
Cited at least 2 instances when one should wash hands. 77% 90%
Cited at least 4 instances when one should wash hands. 3% 5%
Reported washing hands before eating and after latrine use44 100% 97%
Reported washing hands with water and soap 70% 86%
Total number of observations45 137 224
Source: Teacher Survey, authors’ calculations. With regards to intestinal worms, less than half (44%) of primary school teachers and even fewer preschool teachers (30%) cited at least two ways to prevent intestinal worms. This indicates that both types of teachers may benefit from additional training on how to prevent worms.
44 We analyzed a subsamples of teachers who had reported eating and using latrines before the time of the survey
(109 in preschools, and 185 in primary schools). 45Including teachers and directors who taught.
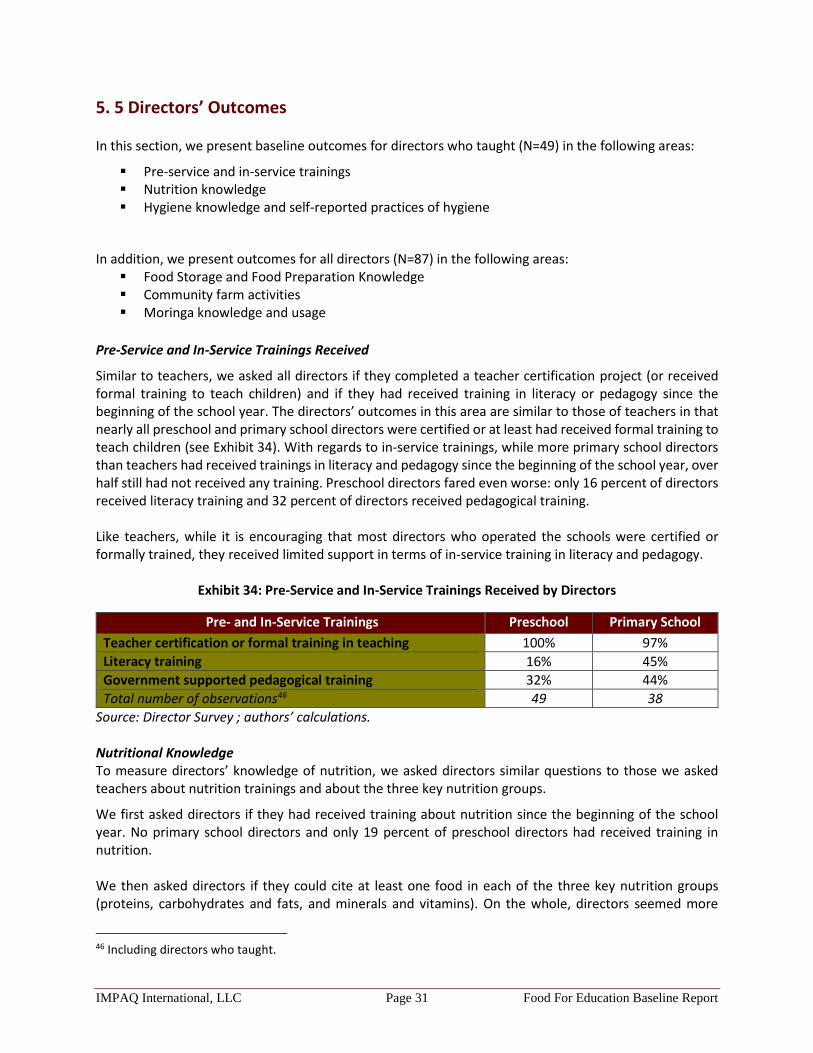
IMPAQ International, LLC Page 31 Food For Education Baseline Report
5. 5 Directors’ Outcomes In this section, we present baseline outcomes for directors who taught (N=49) in the following areas:
Pre-service and in-service trainings Nutrition knowledge Hygiene knowledge and self-reported practices of hygiene
In addition, we present outcomes for all directors (N=87) in the following areas: Food Storage and Food Preparation Knowledge Community farm activities Moringa knowledge and usage
Pre-Service and In-Service Trainings Received
Similar to teachers, we asked all directors if they completed a teacher certification project (or received formal training to teach children) and if they had received training in literacy or pedagogy since the beginning of the school year. The directors’ outcomes in this area are similar to those of teachers in that nearly all preschool and primary school directors were certified or at least had received formal training to teach children (see Exhibit 34). With regards to in-service trainings, while more primary school directors than teachers had received trainings in literacy and pedagogy since the beginning of the school year, over half still had not received any training. Preschool directors fared even worse: only 16 percent of directors received literacy training and 32 percent of directors received pedagogical training. Like teachers, while it is encouraging that most directors who operated the schools were certified or formally trained, they received limited support in terms of in-service training in literacy and pedagogy.
Exhibit 34: Pre-Service and In-Service Trainings Received by Directors
Pre- and In-Service Trainings Preschool Primary School
Teacher certification or formal training in teaching 100% 97%
Literacy training 16% 45%
Government supported pedagogical training 32% 44%
Total number of observations46 49 38
Source: Director Survey ; authors’ calculations. Nutritional Knowledge To measure directors’ knowledge of nutrition, we asked directors similar questions to those we asked teachers about nutrition trainings and about the three key nutrition groups.
We first asked directors if they had received training about nutrition since the beginning of the school year. No primary school directors and only 19 percent of preschool directors had received training in nutrition. We then asked directors if they could cite at least one food in each of the three key nutrition groups (proteins, carbohydrates and fats, and minerals and vitamins). On the whole, directors seemed more
46 Including directors who taught.
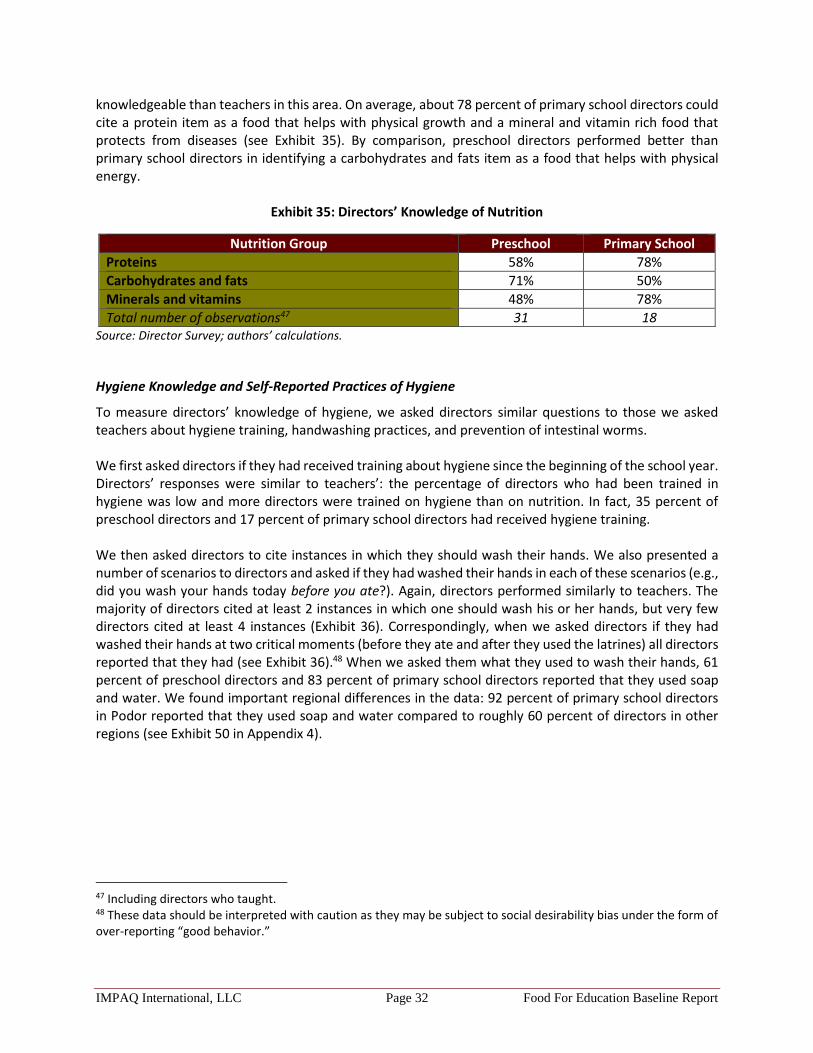
IMPAQ International, LLC Page 32 Food For Education Baseline Report
knowledgeable than teachers in this area. On average, about 78 percent of primary school directors could cite a protein item as a food that helps with physical growth and a mineral and vitamin rich food that protects from diseases (see Exhibit 35). By comparison, preschool directors performed better than primary school directors in identifying a carbohydrates and fats item as a food that helps with physical energy.
Exhibit 35: Directors’ Knowledge of Nutrition
Nutrition Group Preschool Primary School
Proteins 58% 78%
Carbohydrates and fats 71% 50%
Minerals and vitamins 48% 78%
Total number of observations47 31 18 Source: Director Survey; authors’ calculations.
Hygiene Knowledge and Self-Reported Practices of Hygiene
To measure directors’ knowledge of hygiene, we asked directors similar questions to those we asked teachers about hygiene training, handwashing practices, and prevention of intestinal worms. We first asked directors if they had received training about hygiene since the beginning of the school year. Directors’ responses were similar to teachers’: the percentage of directors who had been trained in hygiene was low and more directors were trained on hygiene than on nutrition. In fact, 35 percent of preschool directors and 17 percent of primary school directors had received hygiene training. We then asked directors to cite instances in which they should wash their hands. We also presented a number of scenarios to directors and asked if they had washed their hands in each of these scenarios (e.g., did you wash your hands today before you ate?). Again, directors performed similarly to teachers. The majority of directors cited at least 2 instances in which one should wash his or her hands, but very few directors cited at least 4 instances (Exhibit 36). Correspondingly, when we asked directors if they had washed their hands at two critical moments (before they ate and after they used the latrines) all directors reported that they had (see Exhibit 36).48 When we asked them what they used to wash their hands, 61 percent of preschool directors and 83 percent of primary school directors reported that they used soap and water. We found important regional differences in the data: 92 percent of primary school directors in Podor reported that they used soap and water compared to roughly 60 percent of directors in other regions (see Exhibit 50 in Appendix 4).
47 Including directors who taught. 48 These data should be interpreted with caution as they may be subject to social desirability bias under the form of over-reporting “good behavior.”

IMPAQ International, LLC Page 33 Food For Education Baseline Report
Exhibit 36: Directors’ Knowledge of Hygiene
Handwashing Practices Preschool Primary School
Cited at least 2 instances when one should wash hands 84% 100%
Cited at least 4 instances when one should wash hands 3% 6%
Reported washing hands before eating and after latrine use49 100% 100%
Reported washing hands with water and soap 61% 83%
Total number of observations 31 18 Source: Director Survey; authors’ calculations.
Finally, we asked directors questions about how to prevent the transmission of intestinal worms. Primary school directors performed much better than did preschool directors. More than half (61%) of primary school directors cited at least two ways to prevent intestinal worms, compared to only 32 percent of preschool directors. Food Storage and Food Preparation Knowledge
To measure school directors’ knowledge of proper food storage and management, we questioned directors on how to ensure that food is safely stored in a storage facility, how to properly maintain a storage facility, and how to inventory stock, based on CPI’s training curriculums. Overall, primary school directors were more knowledgeable than preschool directors on all three subjects (see Exhibit 37). The majority (over 80%) of primary school directors were knowledgeable about storage maintenance and stock inventory, but fewer (39%) knew about how to store food safely in the storage facility. Similarly, fewer preschool directors (19%) knew about how to store food safely compared to the other two subjects. The data indicate that training on food storage would most benefit preschool directors; primary school directors would benefit specifically from training in safety around food storage.
Exhibit 37: Directors’ Knowledge of Food Storage
Food Storage Dimensions Preschool Primary School
Cited at least 3 ways to ensure food is safely stored in a storage facility at their school 19% 39%
Cited at least 2 ways to maintain a storage facility at the school 65% 84%
Cited at least 3 ways to track the stock/food in the storage facility 47% 80%
Total number of observations 48 38 Source: Director Survey ; authors’ calculations.
We also asked directors about how to safely prepare food. The majority of preschool directors (71%) and primary school directors (73%) cited at least 3 ways to safely prepare food.
49 We analyzed a subsample of directors who had reported eating and using latrines before the time of the survey (26 in preschools, and 16 in primary schools).

IMPAQ International, LLC Page 34 Food For Education Baseline Report
Community Farms
We asked directors about community farms activities in their school’s community including whether the community had a farm, who supported the farm and whether the farm produced any yields. The numbers we report below should be interpreted with caution because of the small number of respondents.
Prevalence of community farms: 23 percent of directors claimed a community farm existed (N = 87)
Support and management of community farm: 70 percent of directors claimed that the community supported the farm (N=20) 25 percent of directors claimed the CGE managed the farm (N=20)
Farm yields and uses: 55 percent of directors claimed the farm produced yields (N=20) 18 percent of directors claimed the yields were used to make school meals (N=11) 18 percent of directors claimed the yields were sold at local markets (N=11)
Moringa Knowledge and Usage
We also asked directors about their knowledge of moringa and whether it was used at their schools. Overall, 94 percent of the school directors had heard of moringa (N=87). Similar to community farms’ outcomes, the numbers we report below should be interpreted with caution given the small number of respondents.
Knowledge of benefits of moringa 65 percent of preschool directors (N=46) and 52 percent of primary school directors
(N=36) cited at least one benefit of moringa. Cultivation of moringa at school
11 percent of preschool directors (N=46) and 8 percent of primary school directors (N=36) reported that moringa grew at their school.
2 percent of preschool directors (N=46) and 3 percent of primary school directors (N=36) reported using moringa to make school meals (N=46)

IMPAQ International, LLC Page 35 Food For Education Baseline Report
CHAPTER 6. CONCLUSIONS
6.1 Key Findings In this report, we established baseline levels for the indicators of interest against which we will measure progress over time as the project’s services are implemented. We provided benchmarks for average levels of student enrollment, student-teacher ratios, and gender composition among students, teachers, and directors for both primary schools and preschools. We highlighted the need for essential school infrastructure by school type and by departments. Students
We found that the majority of students ate lunch at home at baseline while only two percent of students ate lunch at school at baseline. A large amount of students reached dietary diversity at home and passed the threshold for minimum acceptable diets, as reported by mothers. However, very few students passed the threshold for minimum acceptable diets at school, as reported by students, which is largely explained by the fact that few students reported eating at school at baseline. The levels of these outcomes, particularly for those related to home, may be biased and over reported for several reasons: first, the timing of the survey administration coincided with the post-harvest season during which food tends to be more abundant; second there is a significant sensitivity for mothers in the area related to exposing the difficulty of feeding their children; and third young students may not by the most reliable respondents from whom to obtain nutritional information about the meals they consumed. We provide additional information under the recommendation section on how to improve data accuracy for these outcomes. With regards to nutrition and hygiene knowledge and practices, we found that students had important knowledge gaps, with some important regional differences. Specifically, students in Podor had larger deficits in nutrition knowledge compared to students in Dagana, suggesting that students in Podor have a greater need for information to boost their nutritional knowledge. Across regions, very few students could identify ways to prevent intestinal worms, indicating that all students may benefit from training in worm prevention. On reading skills, students had particularly large deficits, regardless of their region or gender. This highlights the critical need, across both regions, for literacy-based interventions that can help boost reading skills among primary school students. Mothers
On the other hand, preschool and primary school mothers reported low food security, suggesting that they and their families would benefit from food assistance not only at school but also at home. It is important to note that the reported level of food security may be even above usual, because as mentioned above the survey coincided with the post-harvest season during which food tends to be more abundant among households. The discrepancy between the low percentage of food secure households and the high percentage of students with minimum acceptable diets at home may be due to several factors. The questions related to food security covered the last 12 months while the questions related to students’ diets were based on the last 24 hours. This means that households may be food insecure overall, but may have been better able to feed their children nutritious foods at the time of the survey since the survey coincided with the post-
IMPAQ International, LLC Page 36 Food For Education Baseline Report
harvest season during which food tends to be more abundant. Additionally, it is possible that while mothers’ reported feeding their children nutritious foods, they may have not been able to provide sufficient quantities of various food categories to their children. As we recommend further below in Section 6.2, it will be critical at midline and endline to collect complementary data on the dietary indicators, including: observational data on the meals given to students at home and at school and information from school cooks or personnel on the nutritional content of school lunches. These different data will enable the evaluator to triangulate nutrition information in order to strengthen dietary evidence. It will also be important at midline and endline to collect additional information from mothers to better understand if the food is distributed equally among children and assess whether some children within a household are fed more or less than others (e.g. older boys vs. younger girls). Secondly, while mothers exhibited greater nutritional and hygiene knowledge than their children, they too showed deficient knowledge in nutrition and hygiene practices, with several important regional differences:
Mothers in Podor and Saint Louis had much larger deficits in nutrition knowledge compared to mothers in Dagana, suggesting that mothers in Podor and Saint Louis may have a greater need for nutrition training.
Preschool mothers in Saint Louis reported poorer handwashing practices compared to mothers in Podor and Dagana, indicating that mothers in Saint Louis may have greater need for hygiene training around handwashing.
While the majority of preschool and primary school mothers were knowledgeable about safe food preparation, fewer mothers in Podor and Saint Louis knew how to safely prepare food compared to mothers in Dagana.
Overall, very few mothers across regions seemed knowledgeable about how to prevent worms, and would likely benefit from trainings on worm prevention.
Lastly, baseline levels of mothers’ engagement in school activities and their awareness and attendance of PTA meetings also suggested that there was room for improvement. The data revealed some important regional difference in this area for preschool mothers: In Podor, mothers had a 15 percentage point higher participation rate in school support activities than preschool mothers in Dagana and Saint Louis. Teachers
We found that the majority of primary and preschool teachers reported receiving pre-service training in the form of teacher certification or formal training in teaching. However, many fewer teachers reported receiving any form of in-service training in literacy or pedagogy in the current school year. This suggests that efforts to strengthen teacher quality may be difficult if it does not incorporate ongoing professional development opportunities for teachers. In addition, we found that teachers reported deficient knowledge of nutrition and hygiene, with some important regional differences. Specifically, primary school teachers in Podor were less knowledgeable about nutrition than their counterparts in Dagana, suggesting that teachers in Podor have greater training needs to boost their nutritional knowledge. Across regions, less than half of preschool and primary school teachers could identify ways to prevent intestinal worms, indicating that all teachers may benefit from additional training on worm prevention.
IMPAQ International, LLC Page 37 Food For Education Baseline Report
Directors
While the majority of all directors, like teachers, reported being certified in teaching or having formal training in teaching, directors were more likely than teachers to report that they had received literacy or pedagogical trainings since the beginning of the school year. Both preschool and primary school directors also have greater knowledge in nutrition and hygiene compared to teachers. We observed some important differences in director knowledge across regions. Primary school directors in Podor were much more likely to report better handwashing practices compared to their primary school counterparts in other regions. In addition, while directors exhibited greater knowledge in worm prevention compared to teachers, they too showed deficient knowledge in that area, both at preschools and primary schools. The baseline differences between directors and teachers suggests that a cascade-type training model that CPI is envisioning50 may further build capacity for those beneficiaries higher on the chain (inspectors and school directors), but may be limited in effectiveness for the beneficiaries lower down the chain (e.g. teachers). It may be worthwhile to reconsider the project activities targeted at teachers with greater emphasis on boosting their knowledge in hygiene and nutrition and providing them with practical information and tools to foster greater change in their classroom instruction. Finally, school community farms were rare at baseline: only one-in-four directors knew of the community having a community farm. While directors had heard about moringa and many of them knew of its beneficial properties, few cultivated it and even fewer used it in school meals. These findings suggest that there is room for project activities in bringing awareness about moringa’s benefits and in providing support and practical tips on how to cultivate it and how to cook it.
6.2 Recommendations We present the followings recommendations to CPI based on our experience in the field at baseline and after analyzing the data that we collected. Consider observations to complement self-reported data. Survey data on practices and behaviors are usually less reliable than observing actual behaviors. We recommend that the midline and endline data collection include observational data on handwashing, food preparation and meals consumed in addition to the surveys. There is a tradeoff in collecting observational data, however, as individuals are aware of the presence of the enumerator and may not act naturally. Something else to consider in including observations is that to collect comparable data, enumerators may be restricted to collect the surveys and observations during narrower time slots (e.g., around lunch time or in the evening). Even though there are both advantages and disadvantages in including observations, we recommend this additional source of data in order to provide a more nuanced picture of the changes in knowledge, perceptions and behaviors related to handwashing and food preparation among project beneficiaries. Use data from cooks and/or personnel who prepare lunch. In addition to collecting nutritional data from students and mothers, we recommend that the midline and endline data collection include a survey specifically designed to collect information from school cooks on the nutritional content of school lunch.
50A training model that would provide trainings to inspectors who would in turn train directors who would then disseminate knowledge to teachers.
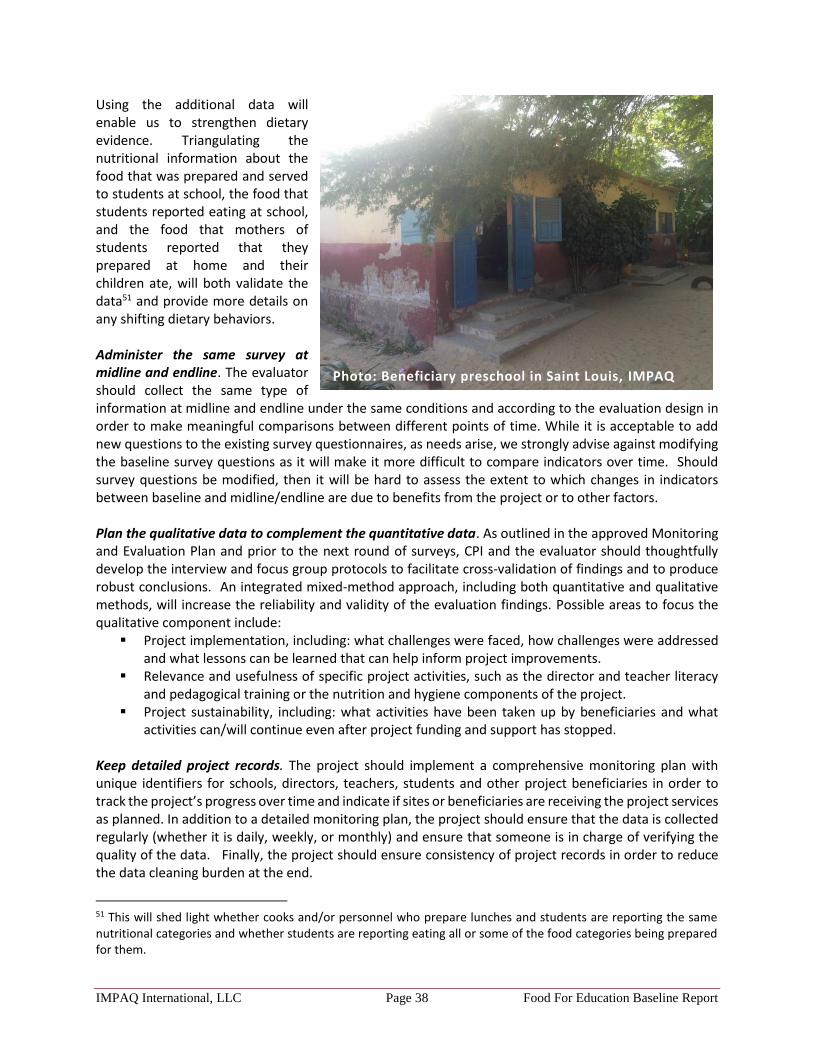
IMPAQ International, LLC Page 38 Food For Education Baseline Report
Using the additional data will enable us to strengthen dietary evidence. Triangulating the nutritional information about the food that was prepared and served to students at school, the food that students reported eating at school, and the food that mothers of students reported that they prepared at home and their children ate, will both validate the data51 and provide more details on any shifting dietary behaviors. Administer the same survey at midline and endline. The evaluator should collect the same type of information at midline and endline under the same conditions and according to the evaluation design in order to make meaningful comparisons between different points of time. While it is acceptable to add new questions to the existing survey questionnaires, as needs arise, we strongly advise against modifying the baseline survey questions as it will make it more difficult to compare indicators over time. Should survey questions be modified, then it will be hard to assess the extent to which changes in indicators between baseline and midline/endline are due to benefits from the project or to other factors. Plan the qualitative data to complement the quantitative data. As outlined in the approved Monitoring and Evaluation Plan and prior to the next round of surveys, CPI and the evaluator should thoughtfully develop the interview and focus group protocols to facilitate cross-validation of findings and to produce robust conclusions. An integrated mixed-method approach, including both quantitative and qualitative methods, will increase the reliability and validity of the evaluation findings. Possible areas to focus the qualitative component include:
Project implementation, including: what challenges were faced, how challenges were addressed and what lessons can be learned that can help inform project improvements.
Relevance and usefulness of specific project activities, such as the director and teacher literacy and pedagogical training or the nutrition and hygiene components of the project.
Project sustainability, including: what activities have been taken up by beneficiaries and what activities can/will continue even after project funding and support has stopped.
Keep detailed project records. The project should implement a comprehensive monitoring plan with unique identifiers for schools, directors, teachers, students and other project beneficiaries in order to track the project’s progress over time and indicate if sites or beneficiaries are receiving the project services as planned. In addition to a detailed monitoring plan, the project should ensure that the data is collected regularly (whether it is daily, weekly, or monthly) and ensure that someone is in charge of verifying the quality of the data. Finally, the project should ensure consistency of project records in order to reduce the data cleaning burden at the end.
51 This will shed light whether cooks and/or personnel who prepare lunches and students are reporting the same nutritional categories and whether students are reporting eating all or some of the food categories being prepared for them.
Photo: Beneficiary preschool in Saint Louis, IMPAQ
IMPAQ International, LLC Page 39 Food For Education Baseline Report
REFERENCES Don Dillman, D.A. (2007) Mail and Internet Surveys: The Tailored Design Method (2007 update with new
Internet, visual, and mixed-mode guide), 2nd edn. New York: John Wiley. Economic Research Service, USDA. (2012). U.S. Household Food Security Survey Module: Six-Item Short
Form (Tech.). Washington, DC: USDA. Food and Agriculture Organization. (2010). Guidelines for Measuring Household and Individual Dietary
Diversity. Rome, Italy: United Nations. Human Subject Regulations Decision Charts. (2016, February 16). Retrieved from
http://www.hhs.gov/ohrp/policy/checklists/decisioncharts.html United States Department of Agriculture, Economics Research Service. (2012, September). U.S. Household
Food Security Survey Module: Six-Item Short Form United States Department of Agriculture, & Foreign Agricultural Service. (2014, July). Food for Progress
and McGovern-Dole Indicators and Definitions. Food Assistance Division, Office
IMPAQ International, LLC Page 40 Food For Education Baseline Report
APPENDICES
1. McGovern-Dole Results Frameworks 2. Evaluation Indicators 3. Total Number of Respondents by School and Category 4. Regional Differences in respondent outcomes 5. ASER Reading Assessment Results 6. Attendance Rates 7. Survey Instruments
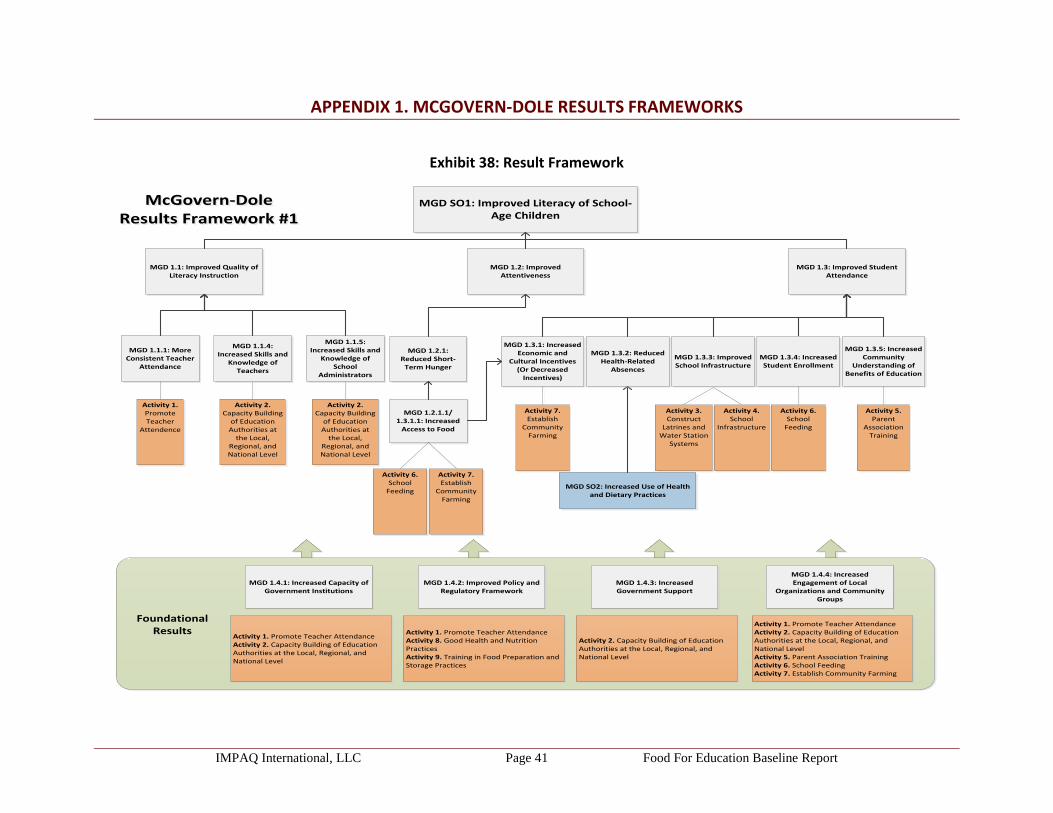
IMPAQ International, LLC Page 41 Food For Education Baseline Report
APPENDIX 1. MCGOVERN-DOLE RESULTS FRAMEWORKS
Exhibit 38: Result Framework
MGD SO1: Improved Literacy of School-Age Children
MGD 1.1: Improved Quality of Literacy Instruction
MGD 1.2: Improved Attentiveness
MGD 1.3: Improved Student Attendance
MGD 1.1.1: More Consistent Teacher
Attendance
Activity 1. Promote Teacher
Attendence
Activity 2. Capacity Building
of Education Authorities at
the Local, Regional, and National Level
MGD SO2: Increased Use of Health and Dietary Practices
Foundational Results
MGD 1.4.1: Increased Capacity of Government Institutions
Activity 1. Promote Teacher AttendanceActivity 2. Capacity Building of Education Authorities at the Local, Regional, and National Level
McGovern-Dole Results Framework #1
McGovern-Dole Results Framework #1
MGD 1.1.4: Increased Skills and
Knowledge of Teachers
MGD 1.1.5: Increased Skills and
Knowledge of School
Administrators
MGD 1.2.1: Reduced Short-
Term Hunger
MGD 1.2.1.1/ 1.3.1.1: Increased
Access to Food
Activity 6. School
Feeding
Activity 7. Establish
Community Farming
MGD 1.3.1: Increased Economic and
Cultural Incentives (Or Decreased
Incentives)
MGD 1.3.2: Reduced Health-Related
Absences
MGD 1.3.3: Improved School Infrastructure
MGD 1.3.5: Increased Community
Understanding of Benefits of Education
Activity 3. Construct
Latrines and Water Station
Systems
Activity 4. School
Infrastructure
Activity 5. Parent
Association Training
MGD 1.4.3: Increased Government Support
MGD 1.4.4: Increased Engagement of Local
Organizations and Community Groups
Activity 2. Capacity Building of Education Authorities at the Local, Regional, and National Level
Activity 1. Promote Teacher AttendanceActivity 2. Capacity Building of Education Authorities at the Local, Regional, and National LevelActivity 5. Parent Association TrainingActivity 6. School FeedingActivity 7. Establish Community Farming
MGD 1.3.4: Increased Student Enrollment
Activity 6. School
Feeding
Activity 2. Capacity Building
of Education Authorities at
the Local, Regional, and National Level
Activity 7. Establish
Community Farming
MGD 1.4.2: Improved Policy and Regulatory Framework
Activity 1. Promote Teacher AttendanceActivity 8. Good Health and Nutrition PracticesActivity 9. Training in Food Preparation and Storage Practices
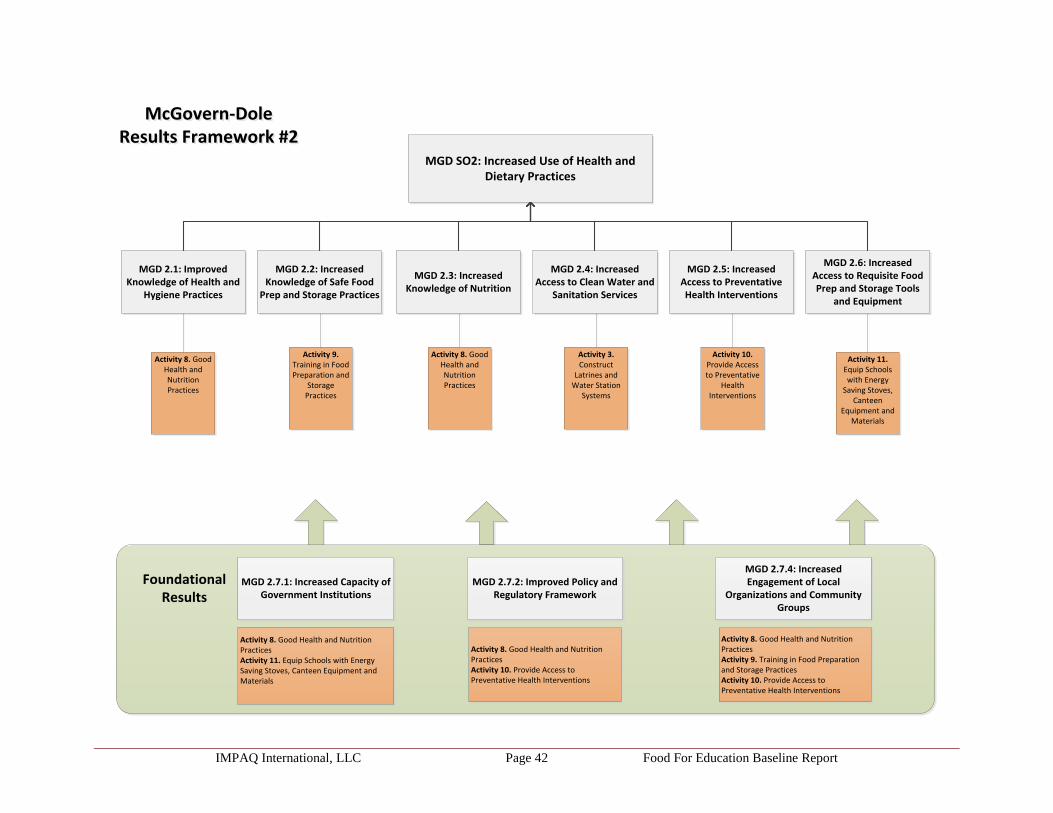
IMPAQ International, LLC Page 42 Food For Education Baseline Report
MGD SO2: Increased Use of Health and Dietary Practices
MGD 2.1: Improved Knowledge of Health and
Hygiene Practices
Foundational Results
MGD 2.7.1: Increased Capacity of Government Institutions
McGovern-Dole Results Framework #2
McGovern-Dole Results Framework #2
Activity 8. Good Health and Nutrition PracticesActivity 9. Training in Food Preparation and Storage PracticesActivity 10. Provide Access to Preventative Health Interventions
MGD 2.2: Increased Knowledge of Safe Food
Prep and Storage Practices
MGD 2.3: Increased Knowledge of Nutrition
MGD 2.4: Increased Access to Clean Water and
Sanitation Services
MGD 2.5: Increased Access to Preventative Health Interventions
MGD 2.6: Increased Access to Requisite Food Prep and Storage Tools
and Equipment
Activity 8. Good Health and Nutrition Practices
Activity 9. Training in Food Preparation and
Storage Practices
Activity 3. Construct
Latrines and Water Station
Systems
Activity 11. Equip Schools with Energy
Saving Stoves, Canteen
Equipment and Materials
MGD 2.7.2: Improved Policy and Regulatory Framework
MGD 2.7.4: Increased Engagement of Local
Organizations and Community Groups
Activity 8. Good Health and Nutrition PracticesActivity 10. Provide Access to Preventative Health Interventions
Activity 8. Good Health and Nutrition PracticesActivity 11. Equip Schools with Energy Saving Stoves, Canteen Equipment and Materials
Activity 8. Good Health and Nutrition Practices
Activity 10. Provide Access to Preventative
Health Interventions

IMPAQ International, LLC Page 43 Food For Education Baseline Report
APPENDIX 2: EVALUATION INDICATORS
Exhibit 39: Evaluation Indicators
Evaluation Indicators
MGD 1.1.4: Increased Skills and Knowledge of Teachers
Number of school administrators and officials in target schools who demonstrate use of new techniques or tools as a result of USDA assistance
Number of school administrators and officials trained or certified as a result of USDA assistance
MGD 1.1.5: Increased Skills and Knowledge of School Administrator
Number of teachers/educators/teaching assistants in target schools who demonstrate use of new and quality teaching techniques or tools as a result of USDA assistance
Number of teachers/educators/teaching assistants trained or certified as a result of USDA assistance
MGD SO 2: Increased Use of Health and Dietary Practices
Percent of school-aged children receiving a minimum acceptable diet at the school level
MGD 1.2.1: Reduced Short-Term Hunger
Percent of students in target schools who indicate that they are not hungry during the school day
MGD SO 1: Improved Literacy of School-Aged Children
Percent of students, who, by the end of two grades of primary schooling, demonstrate that they can read and understand the meaning of grade level text
MGD 2.2: Increased Knowledge of Safe Food Prep and Storage Practices
Percent of beneficiaries (students, cooks) who use appropriate handwashing practices (i.e. with soap, before meals, before food prep, after latrine use, and diaper changing)
MGD 2.1: Improved Knowledge of Health and Hygiene Practices
Percent of students in target schools who can correctly identify at least 2 ways to prevent intestinal worms
MGD 1.4.3: Increased Government Support
Percent of teachers who received government supported training in pedagogy in the past three months
Source: Counterpart International, Inc. (2015, December). Monitoring and Evaluation Plan
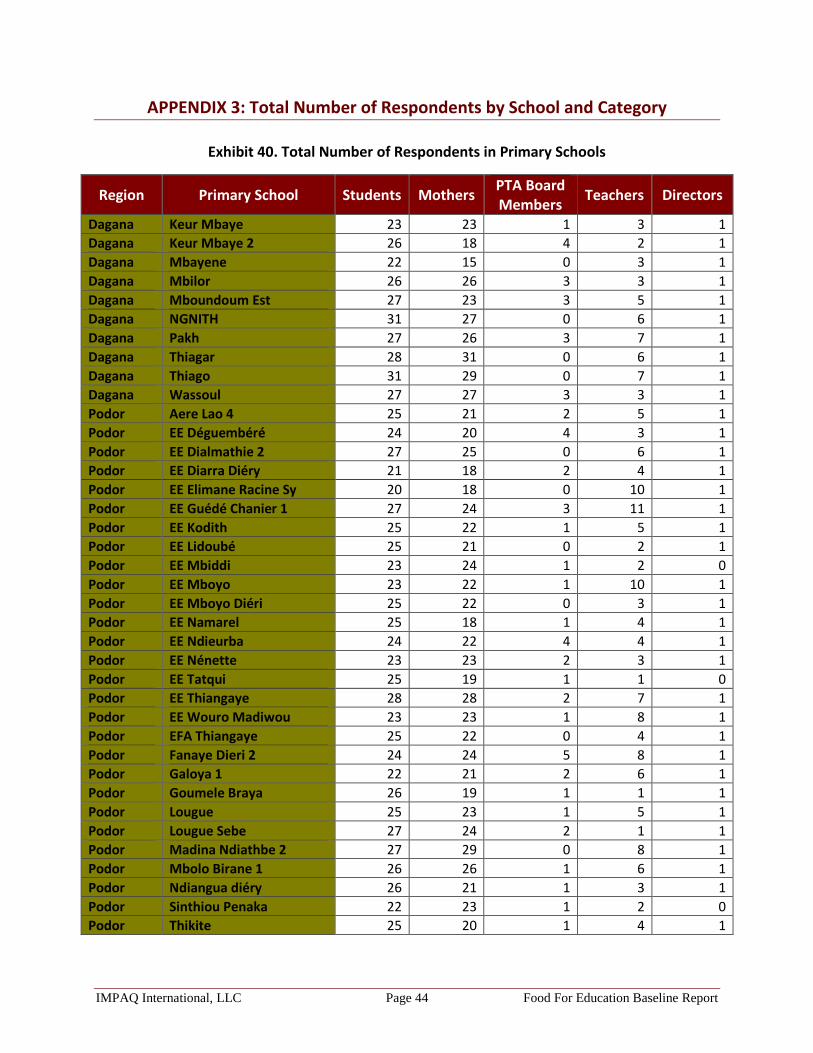
IMPAQ International, LLC Page 44 Food For Education Baseline Report
APPENDIX 3: Total Number of Respondents by School and Category
Exhibit 40. Total Number of Respondents in Primary Schools
Region Primary School Students Mothers PTA Board Members
Teachers Directors
Dagana Keur Mbaye 23 23 1 3 1
Dagana Keur Mbaye 2 26 18 4 2 1
Dagana Mbayene 22 15 0 3 1
Dagana Mbilor 26 26 3 3 1
Dagana Mboundoum Est 27 23 3 5 1
Dagana NGNITH 31 27 0 6 1
Dagana Pakh 27 26 3 7 1
Dagana Thiagar 28 31 0 6 1
Dagana Thiago 31 29 0 7 1
Dagana Wassoul 27 27 3 3 1
Podor Aere Lao 4 25 21 2 5 1
Podor EE Déguembéré 24 20 4 3 1
Podor EE Dialmathie 2 27 25 0 6 1
Podor EE Diarra Diéry 21 18 2 4 1
Podor EE Elimane Racine Sy 20 18 0 10 1
Podor EE Guédé Chanier 1 27 24 3 11 1
Podor EE Kodith 25 22 1 5 1
Podor EE Lidoubé 25 21 0 2 1
Podor EE Mbiddi 23 24 1 2 0
Podor EE Mboyo 23 22 1 10 1
Podor EE Mboyo Diéri 25 22 0 3 1
Podor EE Namarel 25 18 1 4 1
Podor EE Ndieurba 24 22 4 4 1
Podor EE Nénette 23 23 2 3 1
Podor EE Tatqui 25 19 1 1 0
Podor EE Thiangaye 28 28 2 7 1
Podor EE Wouro Madiwou 23 23 1 8 1
Podor EFA Thiangaye 25 22 0 4 1
Podor Fanaye Dieri 2 24 24 5 8 1
Podor Galoya 1 22 21 2 6 1
Podor Goumele Braya 26 19 1 1 1
Podor Lougue 25 23 1 5 1
Podor Lougue Sebe 27 24 2 1 1
Podor Madina Ndiathbe 2 27 29 0 8 1
Podor Mbolo Birane 1 26 26 1 6 1
Podor Ndiangua diéry 26 21 1 3 1
Podor Sinthiou Penaka 22 23 1 2 0
Podor Thikite 25 20 1 4 1
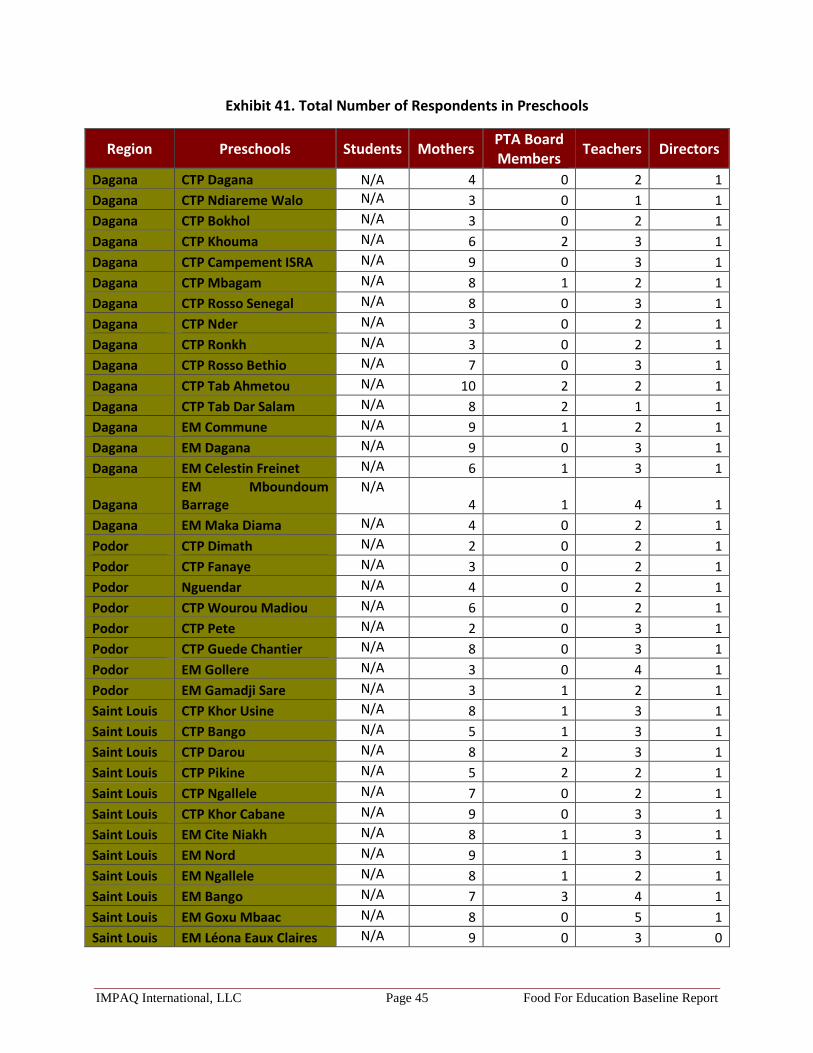
IMPAQ International, LLC Page 45 Food For Education Baseline Report
Exhibit 41. Total Number of Respondents in Preschools
Region Preschools Students Mothers PTA Board Members
Teachers Directors
Dagana CTP Dagana N/A 4 0 2 1
Dagana CTP Ndiareme Walo N/A 3 0 1 1
Dagana CTP Bokhol N/A 3 0 2 1
Dagana CTP Khouma N/A 6 2 3 1
Dagana CTP Campement ISRA N/A 9 0 3 1
Dagana CTP Mbagam N/A 8 1 2 1
Dagana CTP Rosso Senegal N/A 8 0 3 1
Dagana CTP Nder N/A 3 0 2 1
Dagana CTP Ronkh N/A 3 0 2 1
Dagana CTP Rosso Bethio N/A 7 0 3 1
Dagana CTP Tab Ahmetou N/A 10 2 2 1
Dagana CTP Tab Dar Salam N/A 8 2 1 1
Dagana EM Commune N/A 9 1 2 1
Dagana EM Dagana N/A 9 0 3 1
Dagana EM Celestin Freinet N/A 6 1 3 1
Dagana EM Mboundoum Barrage
N/A 4 1 4 1
Dagana EM Maka Diama N/A 4 0 2 1
Podor CTP Dimath N/A 2 0 2 1
Podor CTP Fanaye N/A 3 0 2 1
Podor Nguendar N/A 4 0 2 1
Podor CTP Wourou Madiou N/A 6 0 2 1
Podor CTP Pete N/A 2 0 3 1
Podor CTP Guede Chantier N/A 8 0 3 1
Podor EM Gollere N/A 3 0 4 1
Podor EM Gamadji Sare N/A 3 1 2 1
Saint Louis CTP Khor Usine N/A 8 1 3 1
Saint Louis CTP Bango N/A 5 1 3 1
Saint Louis CTP Darou N/A 8 2 3 1
Saint Louis CTP Pikine N/A 5 2 2 1
Saint Louis CTP Ngallele N/A 7 0 2 1
Saint Louis CTP Khor Cabane N/A 9 0 3 1
Saint Louis EM Cite Niakh N/A 8 1 3 1
Saint Louis EM Nord N/A 9 1 3 1
Saint Louis EM Ngallele N/A 8 1 2 1
Saint Louis EM Bango N/A 7 3 4 1
Saint Louis EM Goxu Mbaac N/A 8 0 5 1
Saint Louis EM Léona Eaux Claires N/A 9 0 3 0

IMPAQ International, LLC Page 46 Food For Education Baseline Report
Region Preschools Students Mothers PTA Board Members
Teachers Directors
Saint Louis EM Cheikh Toure N/A 7 0 3 1
Saint Louis EM Fidel N/A 8 0 3 1
Saint Louis EM Sor Diagne N/A 7 0 3 1
Saint Louis CTP Mpal N/A 9 0 2 1
Saint Louis CTP Rao N/A 10 0 3 1
Saint Louis CTP Ndieuwdoune N/A 8 0 3 1
Saint Louis CTP UGB N/A 9 1 3 1
Saint Louis CTP Tassinere N/A 9 3 2 1
Saint Louis CTP Ndiebene Gandiol N/A 9 0 2 1
Saint Louis EM Mpal N/A 7 2 3 1
Saint Louis EM Gando N/A 9 0 4 1
Saint Louis EM Ndiebene Toube N/A 10 2 4 1
Saint Louis EM Sanar N/A 10 6 3 1
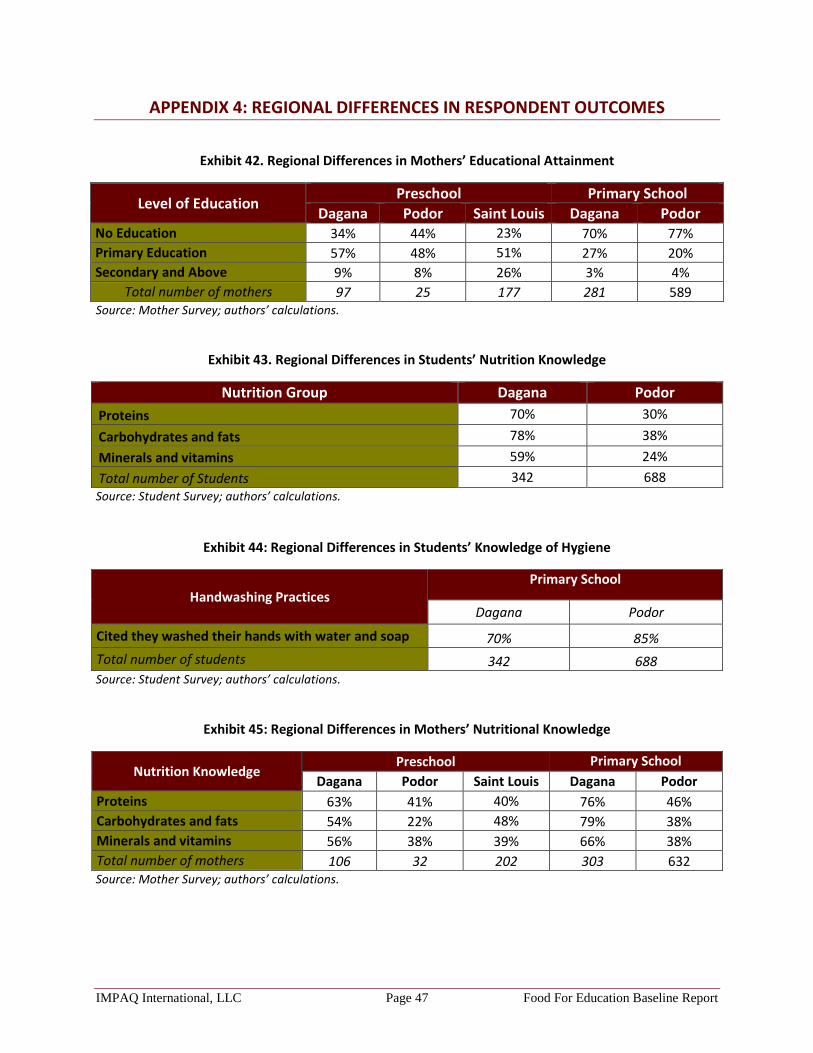
IMPAQ International, LLC Page 47 Food For Education Baseline Report
APPENDIX 4: REGIONAL DIFFERENCES IN RESPONDENT OUTCOMES
Exhibit 42. Regional Differences in Mothers’ Educational Attainment
Level of Education Preschool Primary School
Dagana Podor Saint Louis Dagana Podor No Education 34% 44% 23% 70% 77%
Primary Education 57% 48% 51% 27% 20%
Secondary and Above 9% 8% 26% 3% 4%
Total number of mothers 97 25 177 281 589 Source: Mother Survey; authors’ calculations.
Exhibit 43. Regional Differences in Students’ Nutrition Knowledge
Nutrition Group Dagana Podor
Proteins 70% 30%
Carbohydrates and fats 78% 38%
Minerals and vitamins 59% 24%
Total number of Students 342 688
Source: Student Survey; authors’ calculations.
Exhibit 44: Regional Differences in Students’ Knowledge of Hygiene
Handwashing Practices Primary School
Dagana Podor
Cited they washed their hands with water and soap 70% 85%
Total number of students 342 688 Source: Student Survey; authors’ calculations.
Exhibit 45: Regional Differences in Mothers’ Nutritional Knowledge
Nutrition Knowledge Preschool Primary School
Dagana Podor Saint Louis Dagana Podor
Proteins 63% 41% 40% 76% 46%
Carbohydrates and fats 54% 22% 48% 79% 38%
Minerals and vitamins 56% 38% 39% 66% 38%
Total number of mothers 106 32 202 303 632 Source: Mother Survey; authors’ calculations.
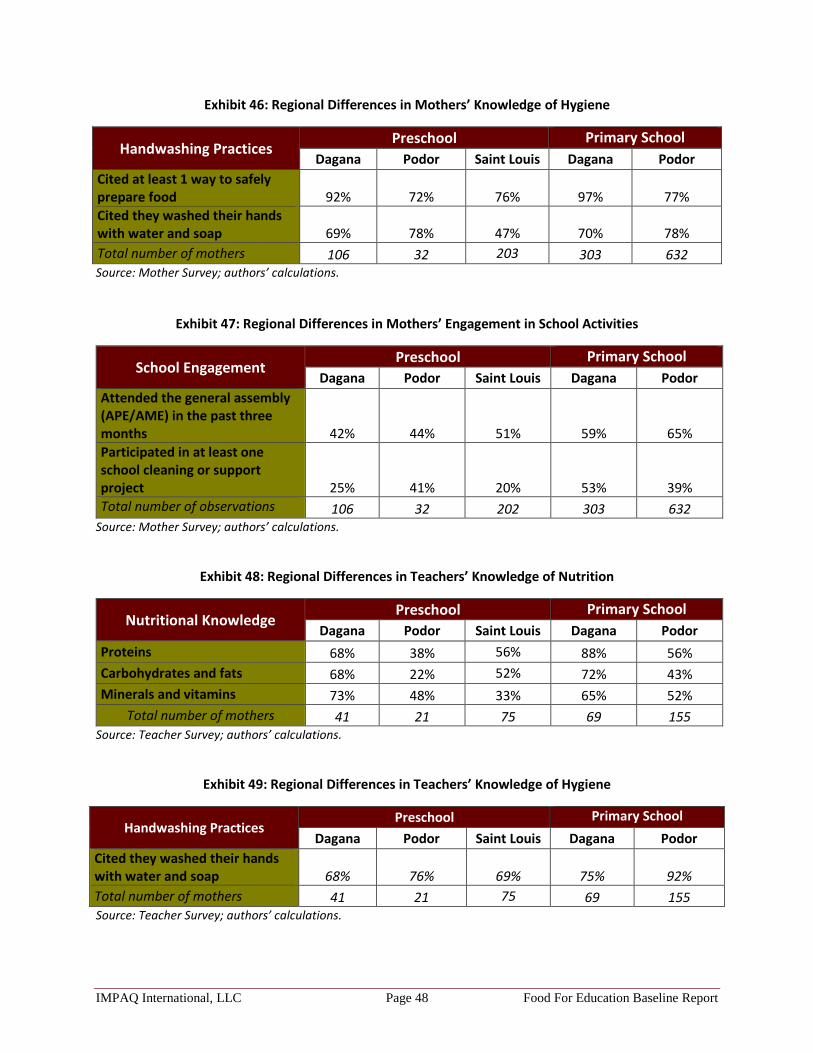
IMPAQ International, LLC Page 48 Food For Education Baseline Report
Exhibit 46: Regional Differences in Mothers’ Knowledge of Hygiene
Handwashing Practices Preschool Primary School
Dagana Podor Saint Louis Dagana Podor
Cited at least 1 way to safely prepare food 92% 72%
76% 97% 77%
Cited they washed their hands with water and soap 69% 78%
47% 70% 78%
Total number of mothers 106 32 203 303 632 Source: Mother Survey; authors’ calculations.
Exhibit 47: Regional Differences in Mothers’ Engagement in School Activities
School Engagement Preschool Primary School
Dagana Podor Saint Louis Dagana Podor
Attended the general assembly (APE/AME) in the past three months 42% 44% 51% 59% 65%
Participated in at least one school cleaning or support project 25% 41% 20% 53% 39%
Total number of observations 106 32 202 303 632 Source: Mother Survey; authors’ calculations.
Exhibit 48: Regional Differences in Teachers’ Knowledge of Nutrition
Nutritional Knowledge Preschool Primary School
Dagana Podor Saint Louis Dagana Podor
Proteins 68% 38% 56% 88% 56%
Carbohydrates and fats 68% 22% 52% 72% 43%
Minerals and vitamins 73% 48% 33% 65% 52%
Total number of mothers 41 21 75 69 155 Source: Teacher Survey; authors’ calculations.
Exhibit 49: Regional Differences in Teachers’ Knowledge of Hygiene
Handwashing Practices Preschool Primary School
Dagana Podor Saint Louis Dagana Podor
Cited they washed their hands with water and soap 68% 76%
69% 75% 92%
Total number of mothers 41 21 75 69 155 Source: Teacher Survey; authors’ calculations.

IMPAQ International, LLC Page 49 Food For Education Baseline Report
Exhibit 50: Regional Differences in Directors’ Knowledge of Hygiene
Handwashing Practices Preschool Primary School
Dagana Podor Saint Louis Dagana Podor
Cited they washed their hands with water and soap 62% 71%
55% 60% 92%
Total number of mothers 13 7 11 5 13 Source: Director Survey ; authors’ calculations.

IMPAQ International, LLC Page 50 Food For Education Baseline Report
APPENDIX 5: ASER READING ASSESSMENT RESULTS
Exhibit 51. Gender Differences in Demonstrating Reading Ability
at Grade Level, and Above by Grade
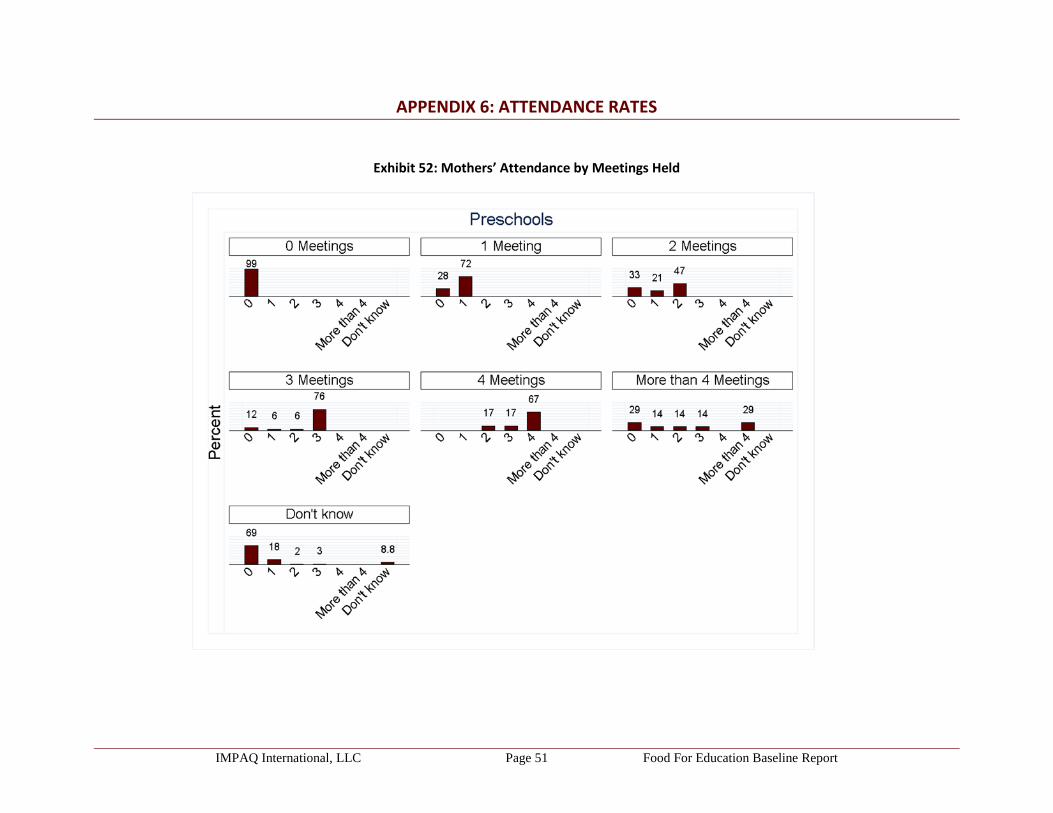
IMPAQ International, LLC Page 51 Food For Education Baseline Report
APPENDIX 6: ATTENDANCE RATES
Exhibit 52: Mothers’ Attendance by Meetings Held

IMPAQ International, LLC Page 52 Food For Education Baseline Report
IMPAQ International, LLC Page 53 Food For Education Baseline Report
APPENDIX 7: Survey Instruments
ASER Reading Assessment ASER Test Administration Instructions
Student Survey Mother Survey
Teacher/ Director Survey

IMPAQ International, LLC Page 54 Food For Education Baseline Report
ASER Reading Assessment

IMPAQ International, LLC Page 55 Food For Education Baseline Report
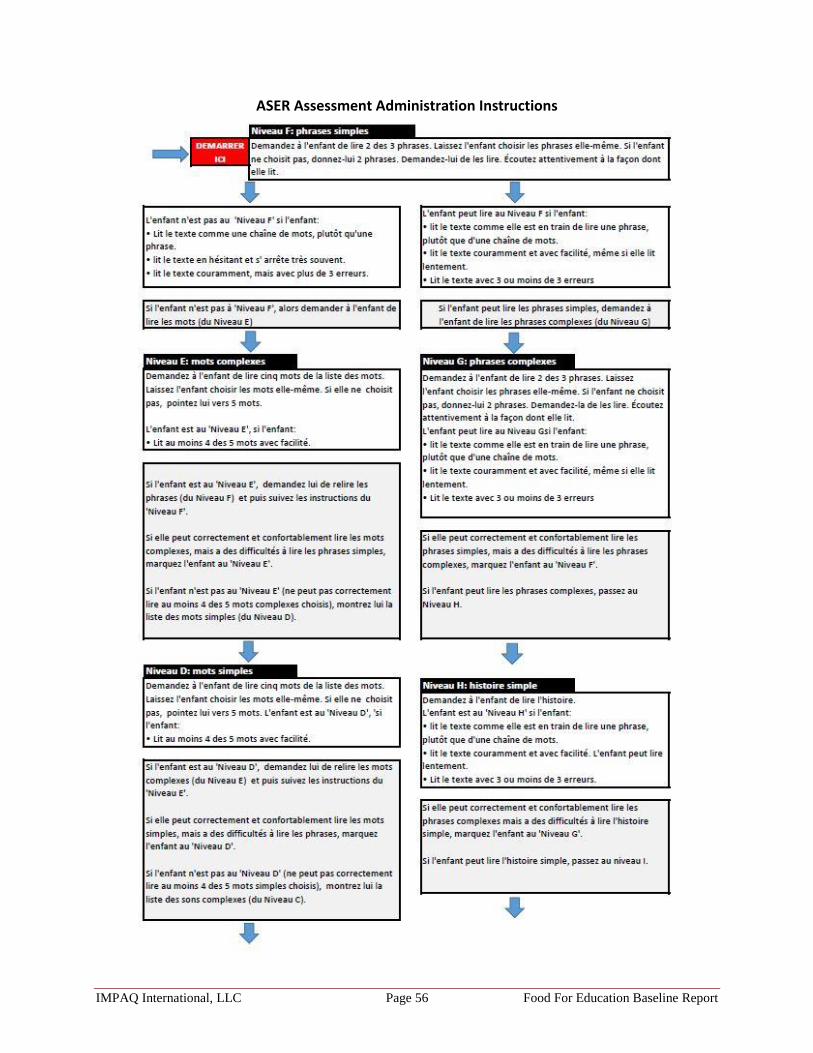
IMPAQ International, LLC Page 56 Food For Education Baseline Report
ASER Assessment Administration Instructions

IMPAQ International, LLC Page 57 Food For Education Baseline Report

IMPAQ International, LLC Page 58 Food For Education Baseline Report
Student Survey Introduction AGENT ENQUETEUR (Nom et prénom)..................................................... ID I__I__I__| DATE.......................................................................................................... Information de base
insp Choisir inspection: 1. Dagana 2. Podor 3. Pete
I__I *Sélectionner seulement une option
School Indiquer école : ………………………………………..
fname Quel est ton prénom? ……………………………………………………….
lname Quel est ton nom de famille ? ……………………………………………………
grade Quel est ton niveau d'étude? 1. CE1 2. CE2 3. CM1
I__I
*S'il s'agit d'une autre classe, remercier le répondant et terminer l’enquête *Sélectionner seulement une option
Si réponse à “grade” est une autre classe remercier le répondant et terminer l’enquête
Cher Elève : Tu as été sélectionné pour participer à une enquête sur la santé, la nutrition et l’éducation dans le cadre du projet Cantine Scolaire. Ta participation dans cette étude est entièrement volontaire. Tu n'es sous aucune obligation d’y participer. Tu as le droit de refuser de répondre à des questions et de te rétracter de l’étude en tout moment. Si tu acceptes, veuilles bien à répondre à toutes les questions le plus honnêtement possible. Si tu es incapable de répondre à une des questions, tu peux ignorer la question. Toutes tes réponses sont strictement confidentielles.
consent Acceptes-tu de participer à cette enquête ? 1. Oui 2. Non 9. Non trouvé
I__I *Sélectionner seulement une option *Si Non ou Non trouvé remercier le répondant et terminer l’enquête *Si Oui aller à “insp”
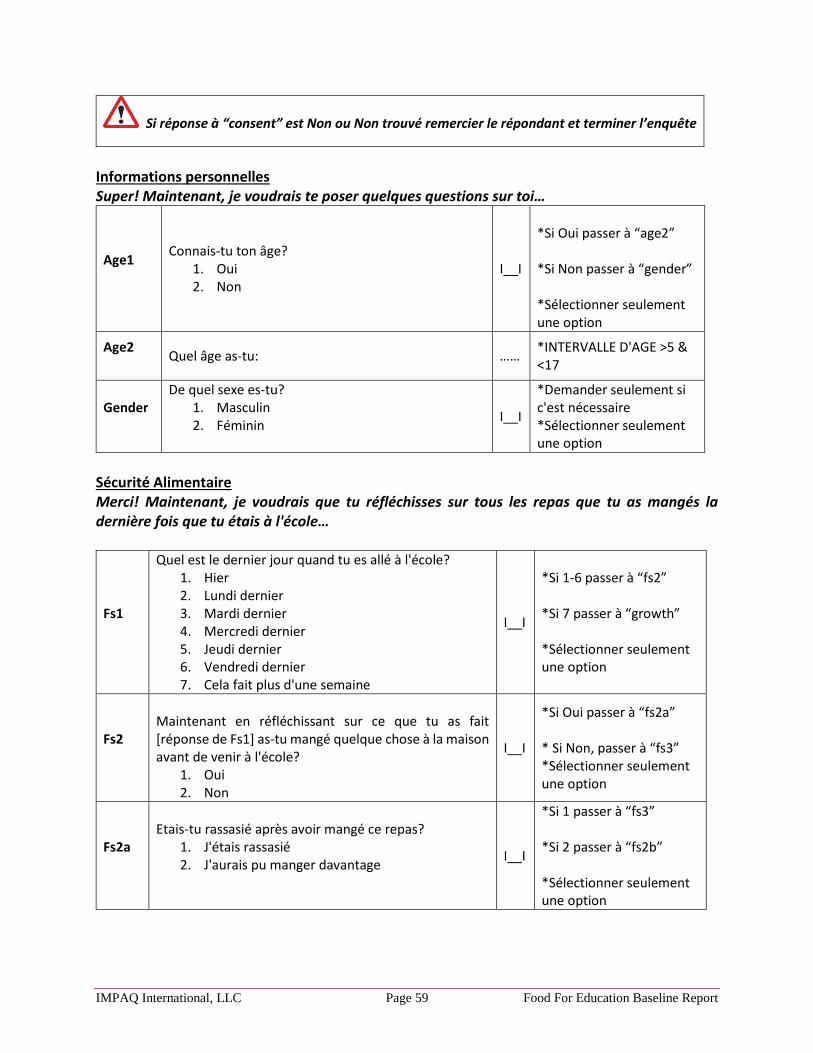
IMPAQ International, LLC Page 59 Food For Education Baseline Report
Si réponse à “consent” est Non ou Non trouvé remercier le répondant et terminer l’enquête
Informations personnelles Super! Maintenant, je voudrais te poser quelques questions sur toi…
Age1
Connais-tu ton âge? 1. Oui 2. Non
I__I
*Si Oui passer à “age2” *Si Non passer à “gender” *Sélectionner seulement une option
Age2
Quel âge as-tu: …… *INTERVALLE D'AGE >5 & <17
Gender
De quel sexe es-tu? 1. Masculin 2. Féminin
I__I
*Demander seulement si c'est nécessaire *Sélectionner seulement une option
Sécurité Alimentaire Merci! Maintenant, je voudrais que tu réfléchisses sur tous les repas que tu as mangés la dernière fois que tu étais à l'école…
Fs1
Quel est le dernier jour quand tu es allé à l'école? 1. Hier 2. Lundi dernier 3. Mardi dernier 4. Mercredi dernier 5. Jeudi dernier 6. Vendredi dernier 7. Cela fait plus d'une semaine
I__I
*Si 1-6 passer à “fs2” *Si 7 passer à “growth” *Sélectionner seulement une option
Fs2
Maintenant en réfléchissant sur ce que tu as fait [réponse de Fs1] as-tu mangé quelque chose à la maison avant de venir à l'école?
1. Oui 2. Non
I__I
*Si Oui passer à “fs2a” * Si Non, passer à “fs3” *Sélectionner seulement une option
Fs2a
Etais-tu rassasié après avoir mangé ce repas?
1. J'étais rassasié 2. J'aurais pu manger davantage
I__I
*Si 1 passer à “fs3” *Si 2 passer à “fs2b” *Sélectionner seulement une option

IMPAQ International, LLC Page 60 Food For Education Baseline Report
Fs2b
Pourquoi n'as-tu pas mangé plus de nourriture?
1. Il n'y avait plu de nourriture 2. Il y avait rien que j'aimais 3. Autre
I__I *Sélectionner seulement une option
Fs3
Es-tu allé à la maison pour manger pendant la pause du déjeuner [réponse de fs1]?
1. Oui 2. Non
I__I
*Si Oui passer à “fs3a” *Si Non passer à “fs4” *Sélectionner seulement une option
Fs3a
Etais-tu rassasié après avoir mangé le déjeuner à la maison?
1. J'étais rassasié 2. J'aurais pu manger davantage
I__I
* Si 1 passer à “fs4” *Si 2 passer à “fs3b” *Sélectionner seulement une option
Fs3b
Pourquoi n'as-tu pas mangé plus de nourriture?
1. Il n'y avait plu de nourriture 2. Il y avait rien que j'aimais 3. Autre
I__I *Sélectionner seulement une option
Fs4
As-tu mangé à la cantine lorsque tu étais à l'école [réponse de fs1]?
1. Oui 2. Non
I__I
*Si Oui passer à “fs4a” *Si Non, passer à “fs5” *Sélectionner seulement une option
Fs4a
Etais-tu rassasié après avoir mangé à la cantine? 1. J'étais rassasié 2. J'aurais pu manger davantage I__I
*Si 1 passer à “fs5” *Si 2, passer à “fs4b” *Sélectionner seulement une option
Fs4b
Pourquoi n'as-tu pas mangé plus de nourriture? 1. Il n'y avait plus d'aliment 2. Il y avait rien de ce que je voulais 3. Autre
I__I *Sélectionner seulement une option
Nous venons juste de parler de tous les repas que tu as mangé [réponse de fs1] à l'école. Maintenant, je voudrais que tu prennes quelques minutes pour réfléchir sur tous les différents aliments que tu as mangés durant ce temps. Es-tu prêts? Ok.
Fs5
As-tu mangé des tubercules, graines (tel que le mil, le riz, le maïs, le sorgho), ou les racines (tel que le manioc)?
1. Oui 2. Non
I__I *Sélectionner seulement une option
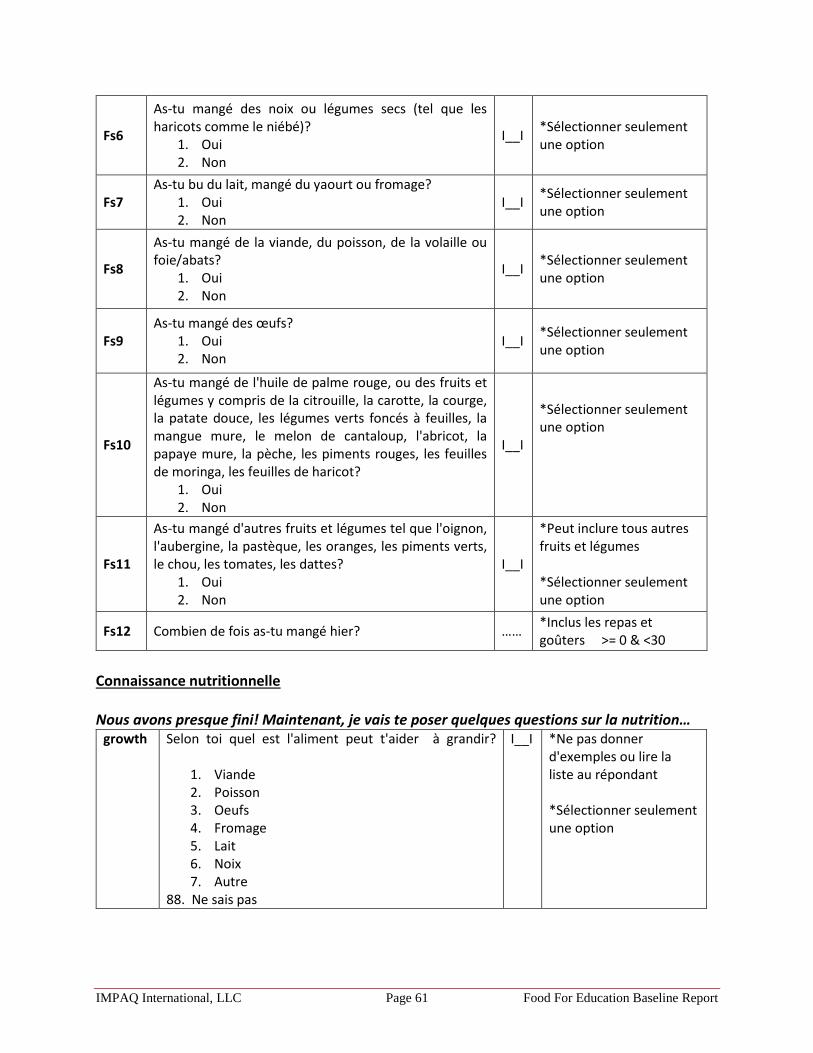
IMPAQ International, LLC Page 61 Food For Education Baseline Report
Fs6
As-tu mangé des noix ou légumes secs (tel que les haricots comme le niébé)?
1. Oui 2. Non
I__I *Sélectionner seulement une option
Fs7 As-tu bu du lait, mangé du yaourt ou fromage?
1. Oui 2. Non
I__I *Sélectionner seulement une option
Fs8
As-tu mangé de la viande, du poisson, de la volaille ou foie/abats?
1. Oui 2. Non
I__I *Sélectionner seulement une option
Fs9 As-tu mangé des œufs?
1. Oui 2. Non
I__I *Sélectionner seulement une option
Fs10
As-tu mangé de l'huile de palme rouge, ou des fruits et légumes y compris de la citrouille, la carotte, la courge, la patate douce, les légumes verts foncés à feuilles, la mangue mure, le melon de cantaloup, l'abricot, la papaye mure, la pèche, les piments rouges, les feuilles de moringa, les feuilles de haricot?
1. Oui 2. Non
I__I
*Sélectionner seulement une option
Fs11
As-tu mangé d'autres fruits et légumes tel que l'oignon, l'aubergine, la pastèque, les oranges, les piments verts, le chou, les tomates, les dattes?
1. Oui 2. Non
I__I
*Peut inclure tous autres fruits et légumes *Sélectionner seulement une option
Fs12 Combien de fois as-tu mangé hier? …… *Inclus les repas et goûters >= 0 & <30
Connaissance nutritionnelle Nous avons presque fini! Maintenant, je vais te poser quelques questions sur la nutrition…
growth Selon toi quel est l'aliment peut t'aider à grandir?
1. Viande 2. Poisson 3. Oeufs 4. Fromage 5. Lait 6. Noix 7. Autre
88. Ne sais pas
I__I *Ne pas donner d'exemples ou lire la liste au répondant *Sélectionner seulement une option
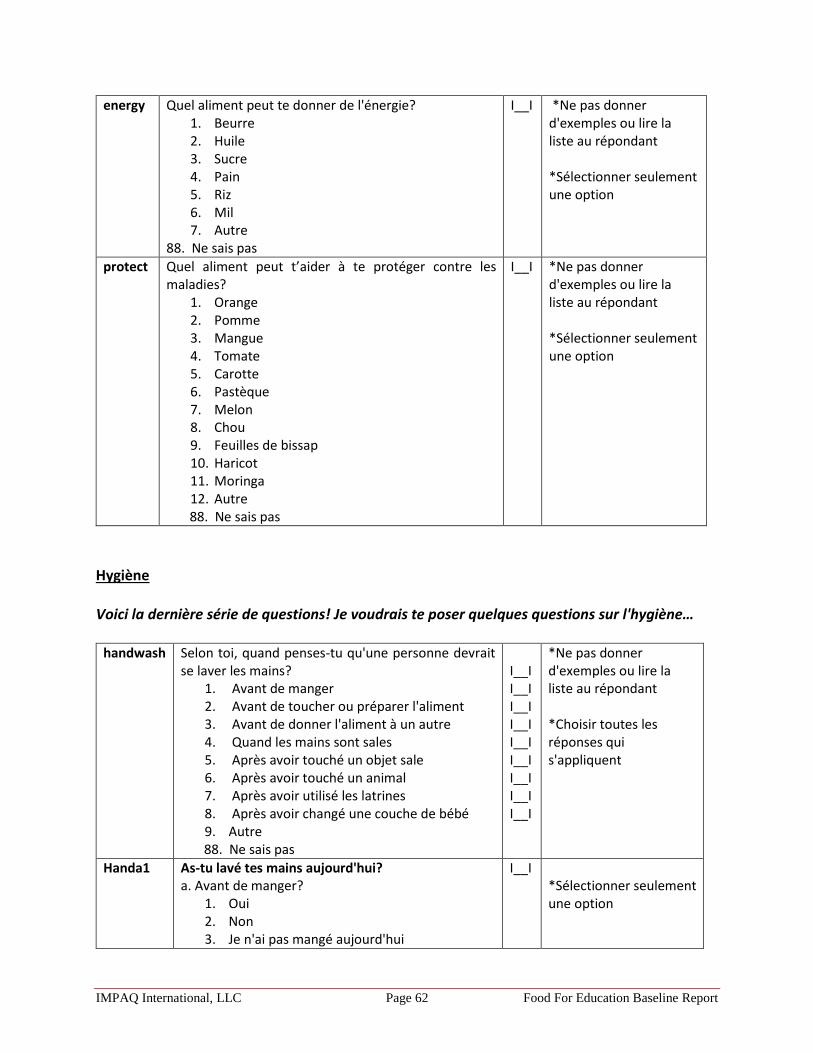
IMPAQ International, LLC Page 62 Food For Education Baseline Report
energy Quel aliment peut te donner de l'énergie? 1. Beurre 2. Huile 3. Sucre 4. Pain 5. Riz 6. Mil 7. Autre
88. Ne sais pas
I__I *Ne pas donner d'exemples ou lire la liste au répondant *Sélectionner seulement une option
protect Quel aliment peut t’aider à te protéger contre les maladies?
1. Orange 2. Pomme 3. Mangue 4. Tomate 5. Carotte 6. Pastèque 7. Melon 8. Chou 9. Feuilles de bissap 10. Haricot 11. Moringa 12. Autre
88. Ne sais pas
I__I *Ne pas donner d'exemples ou lire la liste au répondant *Sélectionner seulement une option
Hygiène Voici la dernière série de questions! Je voudrais te poser quelques questions sur l'hygiène…
handwash Selon toi, quand penses-tu qu'une personne devrait se laver les mains?
1. Avant de manger 2. Avant de toucher ou préparer l'aliment 3. Avant de donner l'aliment à un autre 4. Quand les mains sont sales 5. Après avoir touché un objet sale 6. Après avoir touché un animal 7. Après avoir utilisé les latrines 8. Après avoir changé une couche de bébé 9. Autre
88. Ne sais pas
I__I I__I I__I I__I I__I I__I I__I I__I I__I
*Ne pas donner d'exemples ou lire la liste au répondant *Choisir toutes les réponses qui s'appliquent
Handa1 As-tu lavé tes mains aujourd'hui? a. Avant de manger?
1. Oui 2. Non 3. Je n'ai pas mangé aujourd'hui
I__I *Sélectionner seulement une option

IMPAQ International, LLC Page 63 Food For Education Baseline Report
Handa2 b. Avant de toucher ou préparer la nourriture? 1. Oui 2. Non 3. Je n'ai pas touché/préparé la nourriture
aujourd'hui
I__I *Sélectionner seulement une option
Handa3 c. Avant de donner la nourriture à une autre personne?
1. Oui 2. Non 3. Je n'ai pas donné de nourriture à une autre
personne aujourd'hui
I__I *Sélectionner seulement une option
Handa4 d. Quand tes mains sont sales? 1. Oui 2. Non 3. Je n'ai pas de saleté sur les mains aujourd'hui
I__I *Sélectionner seulement une option
Handa5 e. Après avoir touché un objet sale? 1. Oui 2. Non 3. Je n'ai pas touché quelque chose de sale
aujourd'hui
I__I *Sélectionner seulement une option
Handa6 f. Après avoir touché un animal? 1. Oui 2. Non 3. N'a pas touché un animal aujourd'hui
I__I *Sélectionner seulement une option
Handa7 g. Après avoir touché les latrines? 1. Oui 2. Non 3. Je n'ai pas utilisé les latrines aujourd'hui
I__I *Sélectionner seulement une option
Handa8 h. Après avoir changé une couche de bébé? 1. Oui 2. Non
Je n'ai pas changé une couche de bébé aujourd'hui
I__I *Sélectionner seulement une option
Hand2 Qu'utilises-tu pour te laver les mains? 1. Eau 2. Cendres 3. Sable 4. Savon
Autre
I__I I__I I__I I__I I__I
*Ne pas donner d'exemples ou lire la liste au répondant *Choisir toutes les réponses qui s'appliquent"
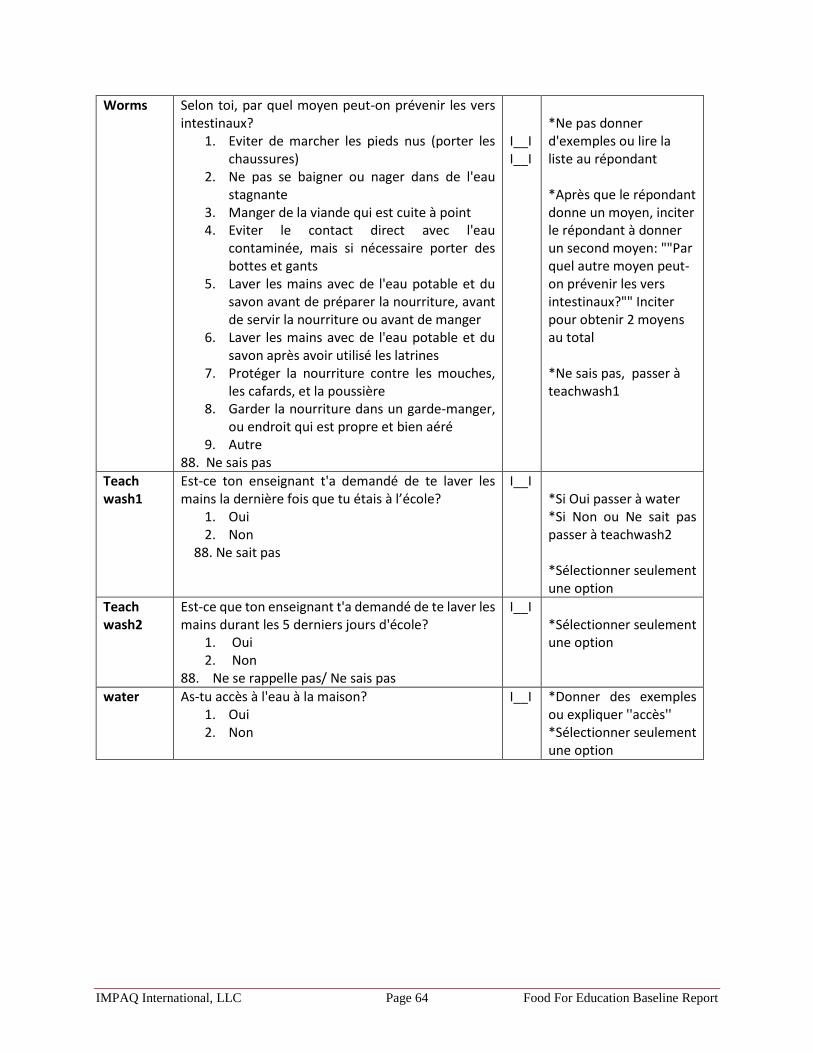
IMPAQ International, LLC Page 64 Food For Education Baseline Report
Worms Selon toi, par quel moyen peut-on prévenir les vers intestinaux?
1. Eviter de marcher les pieds nus (porter les chaussures)
2. Ne pas se baigner ou nager dans de l'eau stagnante
3. Manger de la viande qui est cuite à point 4. Eviter le contact direct avec l'eau
contaminée, mais si nécessaire porter des bottes et gants
5. Laver les mains avec de l'eau potable et du savon avant de préparer la nourriture, avant de servir la nourriture ou avant de manger
6. Laver les mains avec de l'eau potable et du savon après avoir utilisé les latrines
7. Protéger la nourriture contre les mouches, les cafards, et la poussière
8. Garder la nourriture dans un garde-manger, ou endroit qui est propre et bien aéré
9. Autre 88. Ne sais pas
I__I I__I
*Ne pas donner d'exemples ou lire la liste au répondant *Après que le répondant donne un moyen, inciter le répondant à donner un second moyen: ""Par quel autre moyen peut-on prévenir les vers intestinaux?"" Inciter pour obtenir 2 moyens au total *Ne sais pas, passer à teachwash1
Teach wash1
Est-ce ton enseignant t'a demandé de te laver les mains la dernière fois que tu étais à l’école?
1. Oui 2. Non
88. Ne sait pas
I__I *Si Oui passer à water *Si Non ou Ne sait pas passer à teachwash2 *Sélectionner seulement une option
Teach wash2
Est-ce que ton enseignant t'a demandé de te laver les mains durant les 5 derniers jours d'école?
1. Oui 2. Non
88. Ne se rappelle pas/ Ne sais pas
I__I *Sélectionner seulement une option
water As-tu accès à l'eau à la maison? 1. Oui 2. Non
I__I *Donner des exemples ou expliquer ''accès'' *Sélectionner seulement une option
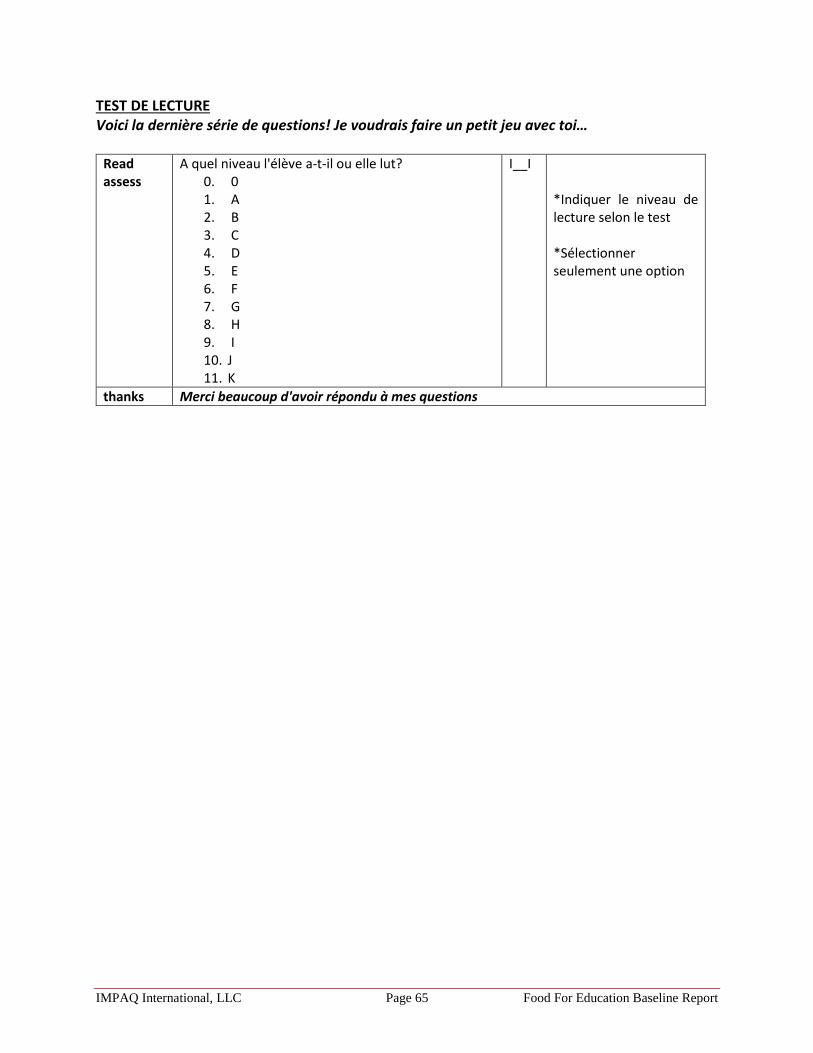
IMPAQ International, LLC Page 65 Food For Education Baseline Report
TEST DE LECTURE Voici la dernière série de questions! Je voudrais faire un petit jeu avec toi…
Read assess
A quel niveau l'élève a-t-il ou elle lut? 0. 0 1. A 2. B 3. C 4. D 5. E 6. F 7. G 8. H 9. I 10. J 11. K
I__I *Indiquer le niveau de lecture selon le test *Sélectionner seulement une option
thanks Merci beaucoup d'avoir répondu à mes questions
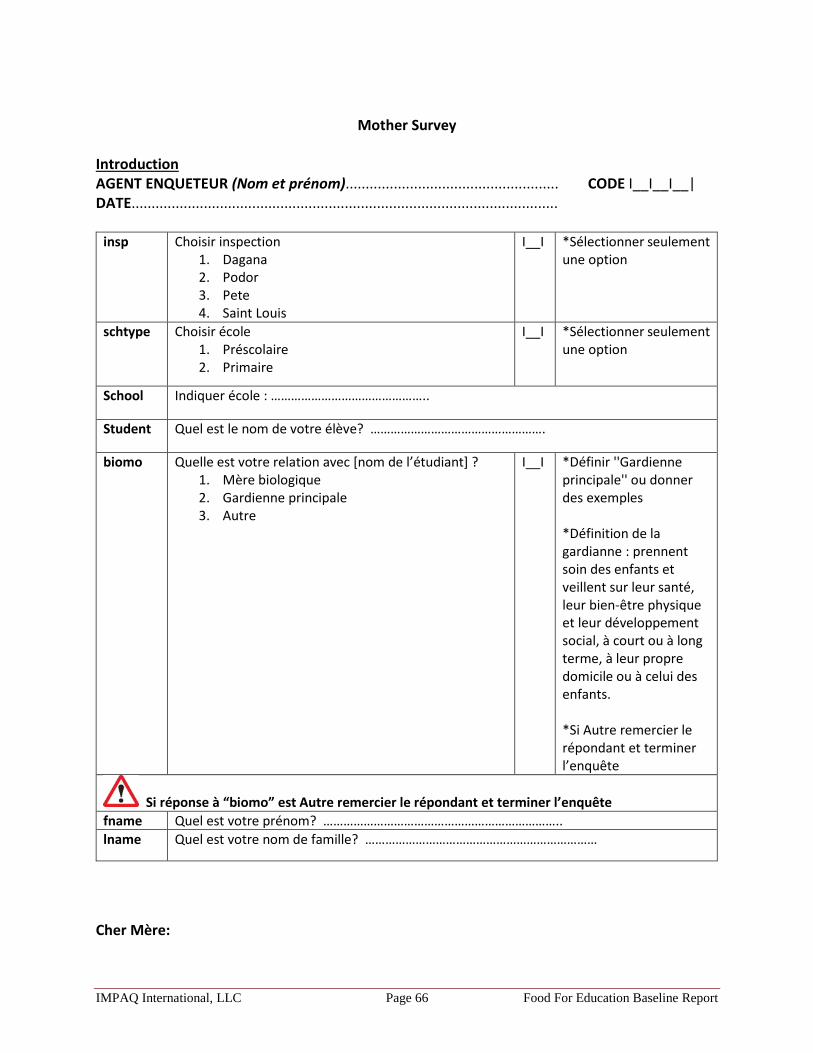
IMPAQ International, LLC Page 66 Food For Education Baseline Report
Mother Survey
Introduction AGENT ENQUETEUR (Nom et prénom)..................................................... CODE I__I__I__| DATE..........................................................................................................
insp Choisir inspection 1. Dagana 2. Podor 3. Pete 4. Saint Louis
I__I *Sélectionner seulement une option
schtype Choisir école 1. Préscolaire 2. Primaire
I__I *Sélectionner seulement une option
School Indiquer école : ………………………………………..
Student Quel est le nom de votre élève? …………………………………………….
biomo Quelle est votre relation avec [nom de l’étudiant] ? 1. Mère biologique 2. Gardienne principale 3. Autre
I__I *Définir ''Gardienne principale'' ou donner des exemples *Définition de la gardianne : prennent soin des enfants et veillent sur leur santé, leur bien-être physique et leur développement social, à court ou à long terme, à leur propre domicile ou à celui des enfants. *Si Autre remercier le répondant et terminer l’enquête
Si réponse à “biomo” est Autre remercier le répondant et terminer l’enquête
fname Quel est votre prénom? ……………………………………………………………..
lname Quel est votre nom de famille? ……………………………………………………………
Cher Mère:

IMPAQ International, LLC Page 67 Food For Education Baseline Report
Vous avez été sélectionné pour participer à un sondage sur la santé, la nutrition et l’éducation dans le cadre du projet cantine scolaire. Votre participation dans cette étude est entièrement volontaire. Vous n’êtes sous aucune obligation d’y participer. Vous avez le droit de refuser de répondre à des questions et de vous rétracter de l’étude en tout moment. Si vous acceptez, veuillez répondre à toutes les questions le plus honnêtement possible. Si vous êtes incapable de répondre à une des questions, vous pouvez ignorer la question. Toutes vos réponses sont strictement confidentielles. Si le répondant refuse de répondre à quelconque question marqué un “R” pour la réponse et passer à la question suivante.
consent Acceptez-vous de participer à cette enquête ? 1. Oui 2. Non 3. Non trouvé
I__I *Si Non ou non trouvé remercier le répondant et terminer l’enquête *Si Oui, aller à “grade” *Sélectionner seulement une option
Si réponse à “consent” est Non ou Non trouvé remercier le répondant et terminer l’enquête
Informations personnelles Bien! Maintenant, je voudrais vous poser quelques questions sur vous et [nom de l’élève].
Grade
Dans quelle classe est [nom de l’élève] ? 1. Prescolaire 2. CE1 3. CE2 4. CM1
I__I
*S'il s'agit d'une autre classe, aller à APE1 *Sélectionner seulement une option
S'il s'agit d'une autre classe, aller à APE1.
Age1
Pouvez-vous me donner votre âge? 3. Oui 4. Non
I__I
*Si Oui passer à “age2” *Si Non passer à “distance” *Sélectionner seulement une option
Age2
Quel âge avez-vous? …… *INTERVALLE D'AGE >12 & <99

IMPAQ International, LLC Page 68 Food For Education Baseline Report
Distance
Quelle distance sépare votre maison de l'école? 1. Jusqu'à 15 minutes de marche 2. Entre 15 et 30 minutes de marche 3. Entre 30 minutes et 1 heure de marche 4. Plus de 1 heure de marche
I__I
*Sélectionner seulement une option
Latrine1
Avez-vous une latrine à la maison? 1. Oui 2. Non
*Si Non passer à “hsize” *Sélectionner seulement une option
Latrine2
Quel type de latrine s'agit-il? 1. Installation à chasse mécanique ou manuelle reliée
à un égout ou système septique ou fosse 2. Latrine à fosse ventilée 3. Latrine à fosse avec une dalle 4. Latrine à fosse sans dalle 5. Latrine à seau 6. Autre
*Sélectionner seulement une option
hsize
Y compris vous, combien de personnes sont dans votre ménage?
………
*Définir « ménage » ou donner des exemples : C'est un groupe de personnes généralement unies par des liens de sang ou de mariage, logeant habituellement ensemble, produisant ensemble, et dont l'autorité budgétaire relève au moins théoriquement d'une seule personne appelée chef de ménage. NB : le ménage peut être constitué d’une seule personne. *INTERVALLE >1 &<99

IMPAQ International, LLC Page 69 Food For Education Baseline Report
Edu
Quel est le plus haut niveau d’étude que vous ayez complété? 1. Aucune 2. CP1 - CE2 3. CM1 - CM2 4. 6 ème – 3 ème 5. 2nde - Terminale 6. Un peu d'université 7. Passé la licence 8. Plus que la license 9. École professionnelle
I__I
*Sélectionner seulement une option
Act2
Depuis les trois derniers mois, c’est-à-dire depuis octobre dernier, est-ce que vous ou un autre adulte dans votre ménage a: Participé à une réunion d'Association de Parents d'Elèves?
1. Oui 2. Non
I__I *Sélectionner seulement une option
Act3
Participé à un projet de nettoyage de l'école (tel que nettoyer les latrines ou la cuisine)?
1. Oui 2. Non
I__I
*Sélectionner seulement une option
Act4
Participé au nettoyage des locaux scolaires? 1. Oui 2. Non I__I
*Sélectionner seulement une option
Act5
Aidé l'école comme cuisinier ou magasinier? 1. Oui 2. Non I__I
*Sélectionner seulement une option
Act6
Autre projet scolaire?
1. Oui 2. Non
I__I *Sélectionner seulement une option
Connaissance nutritionnelle Super! Maintenant, je vais vous poser quelques questions à propos de la nutrition…
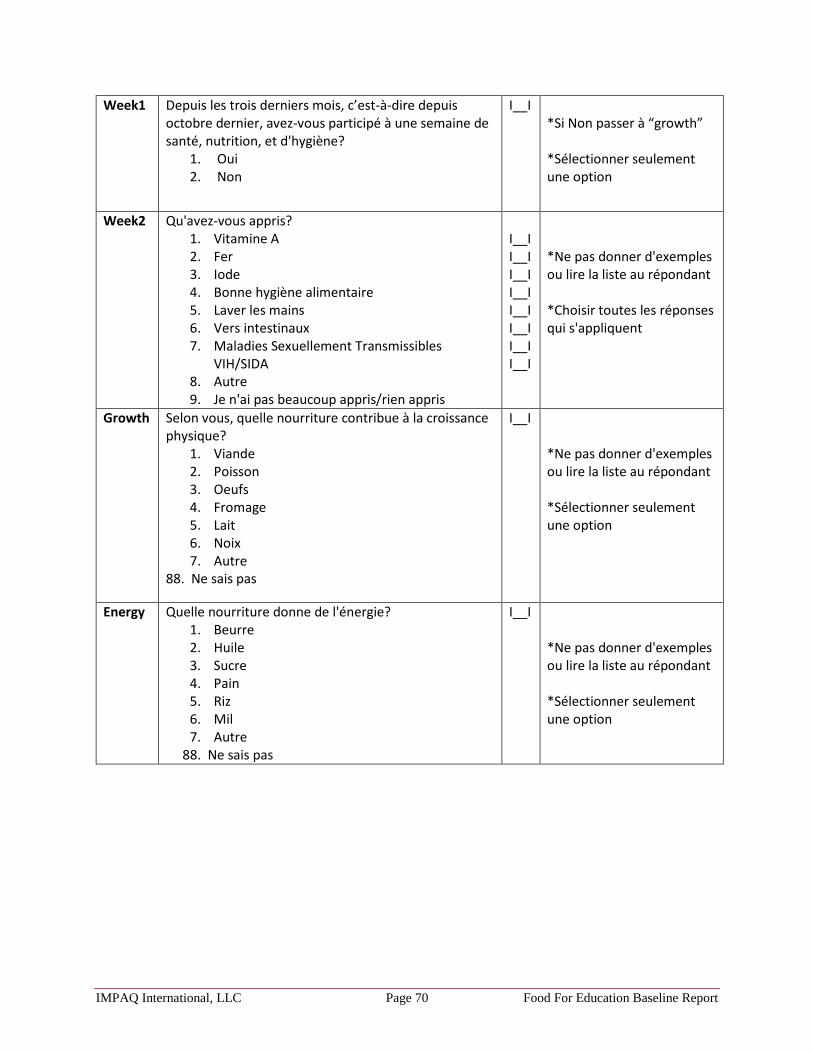
IMPAQ International, LLC Page 70 Food For Education Baseline Report
Week1 Depuis les trois derniers mois, c’est-à-dire depuis octobre dernier, avez-vous participé à une semaine de santé, nutrition, et d'hygiène?
1. Oui 2. Non
I__I *Si Non passer à “growth” *Sélectionner seulement une option
Week2 Qu'avez-vous appris? 1. Vitamine A 2. Fer 3. Iode 4. Bonne hygiène alimentaire 5. Laver les mains 6. Vers intestinaux 7. Maladies Sexuellement Transmissibles
VIH/SIDA 8. Autre 9. Je n'ai pas beaucoup appris/rien appris
I__I I__I I__I I__I I__I I__I I__I I__I
*Ne pas donner d'exemples ou lire la liste au répondant *Choisir toutes les réponses qui s'appliquent
Growth Selon vous, quelle nourriture contribue à la croissance physique?
1. Viande 2. Poisson 3. Oeufs 4. Fromage 5. Lait 6. Noix 7. Autre
88. Ne sais pas
I__I
*Ne pas donner d'exemples ou lire la liste au répondant *Sélectionner seulement une option
Energy Quelle nourriture donne de l'énergie? 1. Beurre 2. Huile 3. Sucre 4. Pain 5. Riz 6. Mil 7. Autre
88. Ne sais pas
I__I *Ne pas donner d'exemples ou lire la liste au répondant *Sélectionner seulement une option
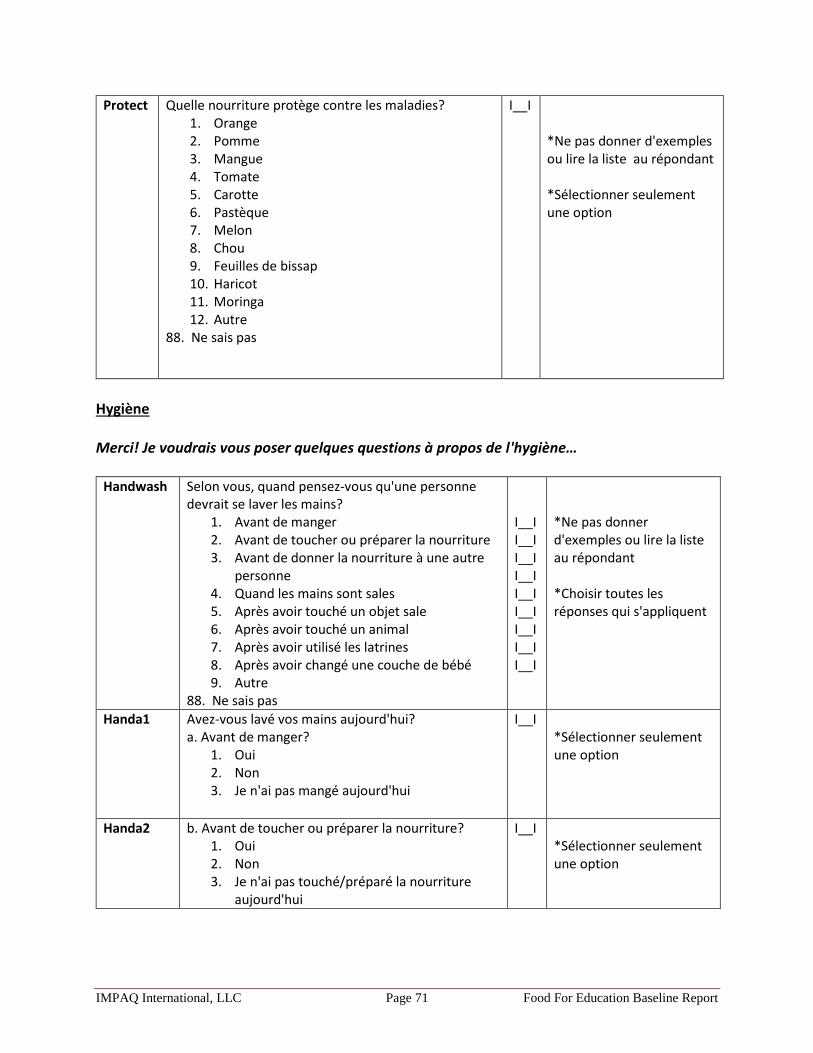
IMPAQ International, LLC Page 71 Food For Education Baseline Report
Protect Quelle nourriture protège contre les maladies? 1. Orange 2. Pomme 3. Mangue 4. Tomate 5. Carotte 6. Pastèque 7. Melon 8. Chou 9. Feuilles de bissap 10. Haricot 11. Moringa 12. Autre
88. Ne sais pas
I__I *Ne pas donner d'exemples ou lire la liste au répondant *Sélectionner seulement une option
Hygiène Merci! Je voudrais vous poser quelques questions à propos de l'hygiène…
Handwash Selon vous, quand pensez-vous qu'une personne devrait se laver les mains?
1. Avant de manger 2. Avant de toucher ou préparer la nourriture 3. Avant de donner la nourriture à une autre
personne 4. Quand les mains sont sales 5. Après avoir touché un objet sale 6. Après avoir touché un animal 7. Après avoir utilisé les latrines 8. Après avoir changé une couche de bébé 9. Autre
88. Ne sais pas
I__I I__I I__I I__I I__I I__I I__I I__I I__I
*Ne pas donner d'exemples ou lire la liste au répondant *Choisir toutes les réponses qui s'appliquent
Handa1 Avez-vous lavé vos mains aujourd'hui? a. Avant de manger?
1. Oui 2. Non 3. Je n'ai pas mangé aujourd'hui
I__I *Sélectionner seulement une option
Handa2 b. Avant de toucher ou préparer la nourriture? 1. Oui 2. Non 3. Je n'ai pas touché/préparé la nourriture
aujourd'hui
I__I *Sélectionner seulement une option
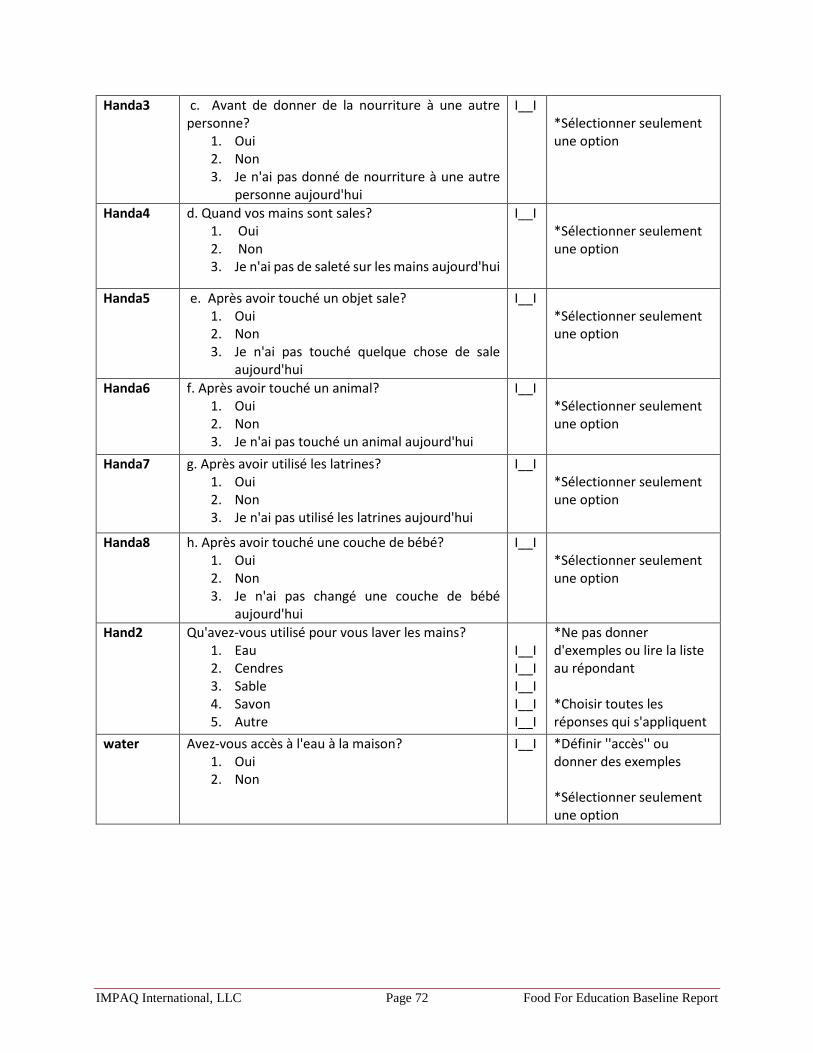
IMPAQ International, LLC Page 72 Food For Education Baseline Report
Handa3 c. Avant de donner de la nourriture à une autre personne?
1. Oui 2. Non 3. Je n'ai pas donné de nourriture à une autre
personne aujourd'hui
I__I *Sélectionner seulement une option
Handa4 d. Quand vos mains sont sales? 1. Oui 2. Non 3. Je n'ai pas de saleté sur les mains aujourd'hui
I__I *Sélectionner seulement une option
Handa5 e. Après avoir touché un objet sale? 1. Oui 2. Non 3. Je n'ai pas touché quelque chose de sale
aujourd'hui
I__I *Sélectionner seulement une option
Handa6 f. Après avoir touché un animal? 1. Oui 2. Non 3. Je n'ai pas touché un animal aujourd'hui
I__I *Sélectionner seulement une option
Handa7 g. Après avoir utilisé les latrines? 1. Oui 2. Non 3. Je n'ai pas utilisé les latrines aujourd'hui
I__I *Sélectionner seulement une option
Handa8 h. Après avoir touché une couche de bébé? 1. Oui 2. Non 3. Je n'ai pas changé une couche de bébé
aujourd'hui
I__I *Sélectionner seulement une option
Hand2 Qu'avez-vous utilisé pour vous laver les mains? 1. Eau 2. Cendres 3. Sable 4. Savon 5. Autre
I__I I__I I__I I__I I__I
*Ne pas donner d'exemples ou lire la liste au répondant *Choisir toutes les réponses qui s'appliquent
water Avez-vous accès à l'eau à la maison? 1. Oui 2. Non
I__I *Définir ''accès'' ou donner des exemples *Sélectionner seulement une option
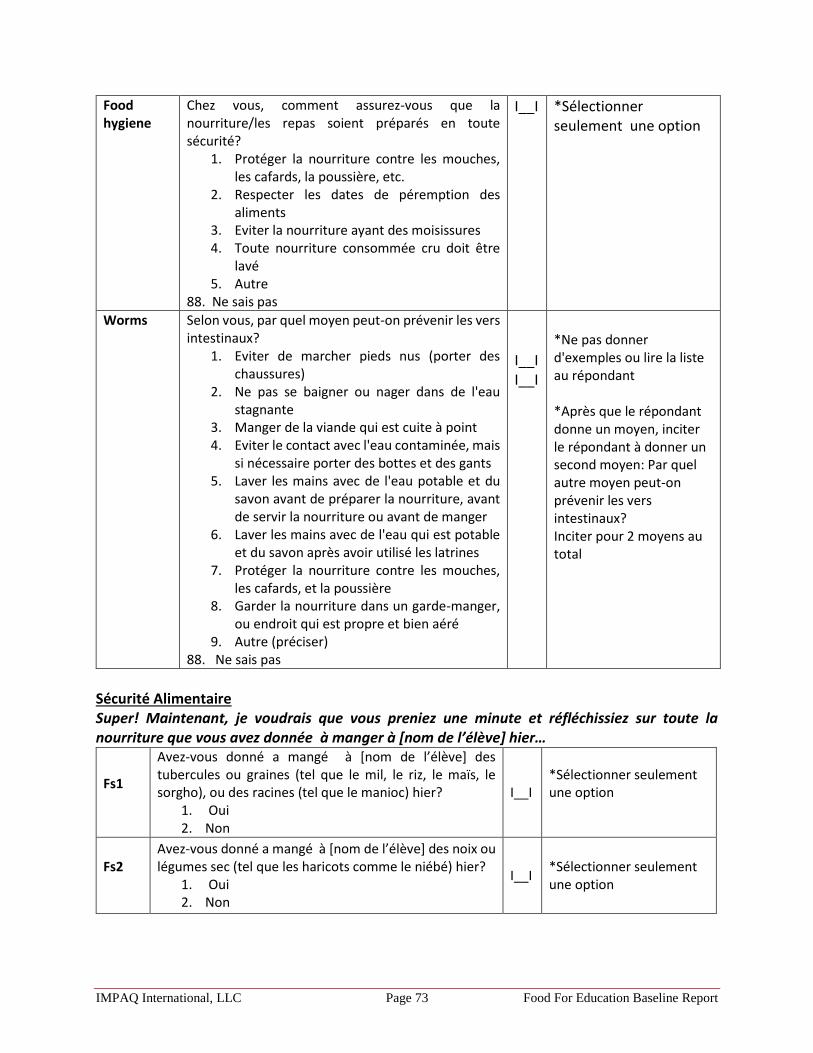
IMPAQ International, LLC Page 73 Food For Education Baseline Report
Food hygiene
Chez vous, comment assurez-vous que la nourriture/les repas soient préparés en toute sécurité?
1. Protéger la nourriture contre les mouches, les cafards, la poussière, etc.
2. Respecter les dates de péremption des aliments
3. Eviter la nourriture ayant des moisissures 4. Toute nourriture consommée cru doit être
lavé 5. Autre
88. Ne sais pas
I__I *Sélectionner seulement une option
Worms Selon vous, par quel moyen peut-on prévenir les vers intestinaux?
1. Eviter de marcher pieds nus (porter des chaussures)
2. Ne pas se baigner ou nager dans de l'eau stagnante
3. Manger de la viande qui est cuite à point 4. Eviter le contact avec l'eau contaminée, mais
si nécessaire porter des bottes et des gants 5. Laver les mains avec de l'eau potable et du
savon avant de préparer la nourriture, avant de servir la nourriture ou avant de manger
6. Laver les mains avec de l'eau qui est potable et du savon après avoir utilisé les latrines
7. Protéger la nourriture contre les mouches, les cafards, et la poussière
8. Garder la nourriture dans un garde-manger, ou endroit qui est propre et bien aéré
9. Autre (préciser) 88. Ne sais pas
I__I I__I
*Ne pas donner d'exemples ou lire la liste au répondant *Après que le répondant donne un moyen, inciter le répondant à donner un second moyen: Par quel autre moyen peut-on prévenir les vers intestinaux? Inciter pour 2 moyens au total
Sécurité Alimentaire Super! Maintenant, je voudrais que vous preniez une minute et réfléchissiez sur toute la nourriture que vous avez donnée à manger à [nom de l’élève] hier…
Fs1
Avez-vous donné a mangé à [nom de l’élève] des tubercules ou graines (tel que le mil, le riz, le maïs, le sorgho), ou des racines (tel que le manioc) hier?
1. Oui 2. Non
I__I
*Sélectionner seulement une option
Fs2
Avez-vous donné a mangé à [nom de l’élève] des noix ou légumes sec (tel que les haricots comme le niébé) hier?
1. Oui 2. Non
I__I *Sélectionner seulement une option

IMPAQ International, LLC Page 74 Food For Education Baseline Report
Fs3
Avez-vous donné a mangé à [nom de l’élève] du yaourt ou fromage ou lait hier?
1. Oui 2. Non
I__I *Sélectionner seulement une option
Fs4
Avez-vous donné a mangé à [nom de l’élève] de la viande, du poisson, de la volaille ou foie hier?
1. Oui 2. Non
I__I *Sélectionner seulement une option
Fs5
Avez-vous donné a mangé à [nom de l’élève] des œufs hier?
1. Oui 2. Non
I__I *Sélectionner seulement une option
Fs6
Avez-vous donné a mangé à [nom de l’élève] de l'huile de palme rouge ou des fruits et des légumes y compris la citrouille, la carotte, la courge, la patate douce, les légumes verts foncés à feuilles, la mangue mure, melon de cantaloup, abricot, papaye mure, pèche, piments rouges, feuilles de moringa, feuilles de haricot hier?
1. Oui 2. Non
I__I *Sélectionner seulement une option
Fs7
Avez-vous donné a mangé à [nom de l’élève] des autres fruits et légumes, tel que l'oignon, l'aubergine, la pastèque, les oranges, les piments verts, le chou, les tomates, les dattes hier?
1. Oui 2. Non
I__I
*Peut inclure tous autres fruits et légumes *Sélectionner seulement une option
Fs14 Combien de fois [nom de l’élève] a-t-il ou elle mangé hier? …….
*Préciser au répondant que cela inclus les repas et goûters >=0 & < 30
Maintenant, je vais vous lire plusieurs déclarations que les personnes ont faites à propos de leur situation alimentaire. Pour ces déclarations, veuillez me dire si la déclaration est souvent valable, parfois valable, ou jamais valable pour (vous/votre ménage) durant les 12 derniers mois - c'est à dire, depuis janvier dernier.
Fs8
L'aliment que (nous avons) acheté n'a pas du tout duré, et (je n'ai/nous n'avons) pas d'argent pour en avoir davantage. Etait-il le cas souvent, parfois, ou jamais pour (votre ménage) durant les 12 derniers mois, c'est à dire depuis janvier dernier?
1. Souvent 2. Parfois 3. Jamais
88. Ne sais pas
I__I
*Sélectionner seulement une option

IMPAQ International, LLC Page 75 Food For Education Baseline Report
Fs9
(Nous) ne pouvais/pouvions pas me permettre le luxe de manger des repas équilibrés. Était-il le cas souvent, parfois, ou jamais pour (votre ménage) durant les 12 derniers mois?
1. Souvent 2. Parfois 3. Jamais
88. Ne sais pas
I__I
*Expliquer repas ''équilibré' *Sélectionner seulement une option
Fs10
Durant les 12 derniers mois, c’est-à-dire depuis janvier dernier, avez (vous/ou d'autres adultes dans votre ménage) une fois réduit la taille de vos repas ou sauter des repas parce qu'il n'y avait pas assez d'argent pour la nourriture?
1. Oui 2. Non
88. Ne sais pas
I__I
*Si Oui passer à fs11 *Si Non ou Ne sais pas passer à fs12 *Sélectionner seulement une option
Fs11
Combien de fois ceci s'est-il passé - presque chaque mois, quelques mois mais pas chaque mois, ou seulement 1 ou 2 mois?
1. Presque chaque mois 2. Quelques mois mais pas chaque mois 3. Seulement 1 ou 2 mois
88. Ne sais pas
I__I *Sélectionner seulement une option
Fs12
Durant les 12 derniers mois, c’est-à-dire depuis janvier dernier, avez-vous une fois mangée moins que vous pensiez que vous devriez parce qu'il n’y avait pas assez d'argent pour la nourriture?
1. Oui 2. Non
88. Ne sais pas
I__I *Sélectionner seulement une option
Fs13
Durant les 12 derniers mois, c’est-à-dire depuis janvier dernier, aviez-vous une fois faim mais n'avez pas mangé parce qu'il n'y avait pas assez d'argent pour la nourriture?
1. Oui 2. Non
88. Ne sais pas
I__I *Sélectionner seulement une option
APE Maintenant, je voudrais vous poser des questions à propos de l'Association des Parents d'Elèves (APE) de l'école de [nom de l’élève] …

IMPAQ International, LLC Page 76 Food For Education Baseline Report
Ape1 Etes-vous membre du bureau de l'APE? 1. Oui 2. Non
I__I *Sélectionner seulement une option
APE2 Combien de réunions l'APE a-t-elle tenues depuis les trois derniers mois, c’est-à-dire depuis octobre dernier?
0. 0 1. 1 2. 2 3. 3 4. 4 5. Plus de 4
88. Ne sais pas
I__I *Sélectionner seulement une option
APE3 Combien de réunions de l'APE avez-vous assisté depuis les trois derniers mois, c’est-à-dire depuis octobre dernier?
0. 0 1. 1 2. 2 3. 3 4. 4 5. Plus de 4
88. Ne sais pas
I__I *Sélectionner seulement une option
Si la réponse à « APE1 » est Oui sauter à Farm1
AE4 En tant que membre du bureau de l'APE, avez-vous reçu une formation sur les sujets suivants?
1. Comité de gouvernance et gestion 2. Rotation des membres du comité 3. Organisation des réunions de l'APE 4. Profits de l'éducation 5. Utilisation de la connaissance dans les salles de
classe 6. Autre 7. Aucun
88. Ne sais pas
I__I I__I I__I I__I I__I I__I I__I
*Lire les réponses à haute voix *Choisir toutes les réponses qui s'appliquent
FERMES COMMUNAUTAIRES Voici la dernière série de questions! Je voudrais vous poser quelques questions à propos du champ communautaire de cette communauté…

IMPAQ International, LLC Page 77 Food For Education Baseline Report
Farm1 D'après votre connaissance, est-ce que la communauté possède un champ communautaire?
1. Oui 2. Non
88. Ne sais pas
I__I
*Si Non ou ne sais pas remercier le répondant et terminer l’enquête *Sélectionner seulement une option
Si réponse à “farm1” est “Non” ou “Ne sais pas” remercier le répondant et terminer l’enquête
Farm2 Qui gère le champ communautaire? 1. Comité de Gestion du Champ
Communautaire 2. CGE 3. APE 4. Directeur 5. Autre
88. Ne sais pas
I__I *Sélectionner seulement une option
Farm3 Est-ce que la communauté soutient le champ communautaire?
1. Oui 2. Non
88. Ne sais pas
I__I *Définir soutenir ou donner des exemples *Si Oui passer à “farm4” *Si Non ou Ne sais pas passer à “farm5” *Sélectionner seulement une option
Farm4 Est-ce que [la personne qui gère le champ communautaire] a reçu un des éléments suivants?
1. Formation agricole 2. Equipement de petite exploitation agricole 3. Autre
88. Ne sais pas
I__I I__I I__I
*Choisir toutes les réponses qui s'appliquent
Farm5 Est-ce que le champ a déjà produit des rendements?
1. Oui 2. Non
88. Ne sais pas
I__I * Si Oui passer à “farm6” *Si Non ou Ne sais pas remercier le répondant et terminer l’enquête *Sélectionner seulement une option
Si réponse à “Farm5” est Non ou Ne sais pas remercier le répondant et terminer l’enquête

IMPAQ International, LLC Page 78 Food For Education Baseline Report
Farm6 Est-ce que les rendements sont utilisés pour faire des repas à l'école?
1. Oui 2. Non
88. Ne sais pas
I__I *Sélectionner seulement une option
Farm7 Est-ce que les rendements sont vendus aux marchés locaux?
1. Oui 2. Non
88. Ne sais pas
I__I *Si Non or Ne sais pas passer à “farm9”
Farm8 Comment sont utilisées les recettes de la vente? 1. Appuyer la gestion de la cantine scolaire 2. Appuyer l'alimentation de l'école 3. Payer les cuisiniers de la cantine scolaire 4. Payer les membres [la personne qui gère le
champ communautaire] 5. Autre
88. Ne sais pas
I__I I__I I__I I__I I__I
*Choisir toutes les réponses qui s'appliquent
Farm9 A quelle autre fin les rendements sont-ils utilisés? ……………………………………………………………… [OUVERTE]
Farm10 Selon vous, combien de fois les rendements contribuent-ils à l'alimentation des élèves de l'école?
1. Toujours 2. Habituellement 3. Environ la moitié du temps 4. Rarement 5. Jamais
88. Ne sais pas
I__I *Sélectionner seulement une option
Si mère d’un élève au préscolaire ou mère d’un élève dans une autre classe que CE1, CE2, et CM 1 remercier le répondant et terminer l’enquête.
Student_ Consent
Donnez-vous consentement pour [nom de l’élève] d'être interrogé?
1. Oui 2. Non
I__I *Si Oui aller au Questionnaire élève *Si Non remercier le répondant et terminer l’enquête *Sélectionner une option
thanks Merci beaucoup d'avoir répondu à mes questions
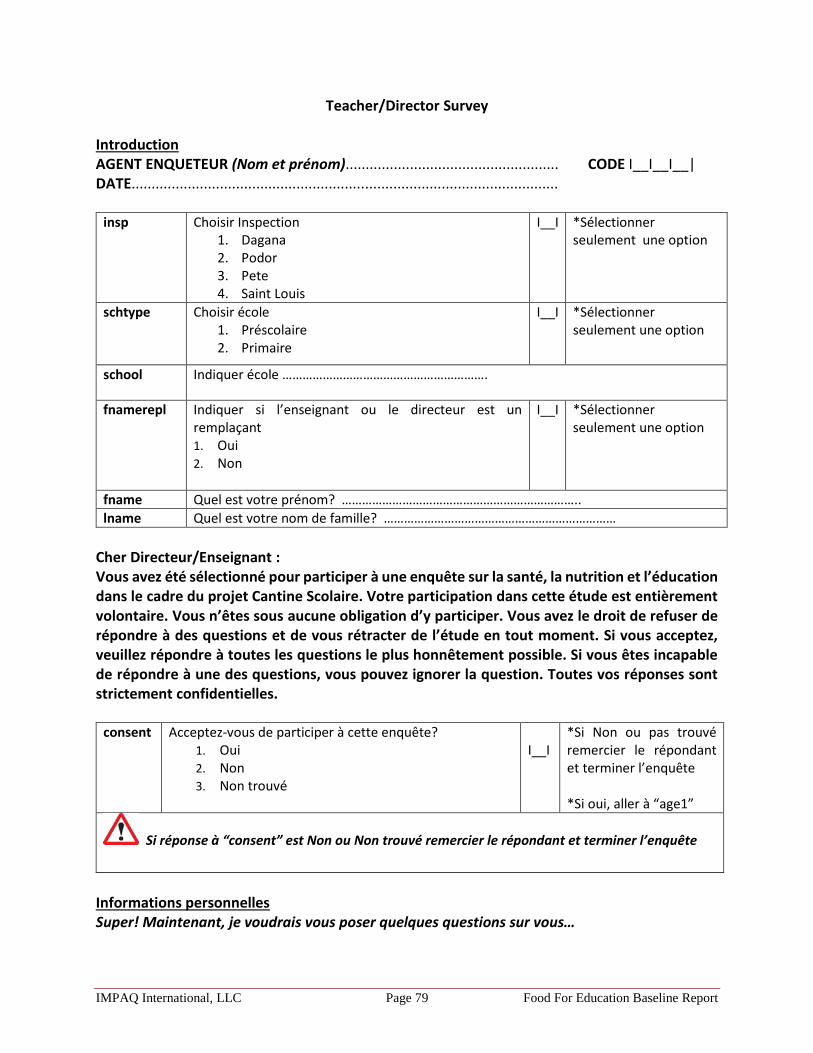
IMPAQ International, LLC Page 79 Food For Education Baseline Report
Teacher/Director Survey Introduction AGENT ENQUETEUR (Nom et prénom)..................................................... CODE I__I__I__| DATE..........................................................................................................
insp Choisir Inspection 1. Dagana 2. Podor 3. Pete 4. Saint Louis
I__I *Sélectionner seulement une option
schtype Choisir école 1. Préscolaire 2. Primaire
I__I *Sélectionner seulement une option
school Indiquer école …………………………………………………….
fnamerepl Indiquer si l’enseignant ou le directeur est un remplaçant 1. Oui 2. Non
I__I *Sélectionner seulement une option
fname Quel est votre prénom? ……………………………………………………………..
lname Quel est votre nom de famille? ……………………………………………………………
Cher Directeur/Enseignant : Vous avez été sélectionné pour participer à une enquête sur la santé, la nutrition et l’éducation dans le cadre du projet Cantine Scolaire. Votre participation dans cette étude est entièrement volontaire. Vous n’êtes sous aucune obligation d’y participer. Vous avez le droit de refuser de répondre à des questions et de vous rétracter de l’étude en tout moment. Si vous acceptez, veuillez répondre à toutes les questions le plus honnêtement possible. Si vous êtes incapable de répondre à une des questions, vous pouvez ignorer la question. Toutes vos réponses sont strictement confidentielles.
consent Acceptez-vous de participer à cette enquête? 1. Oui 2. Non 3. Non trouvé
I__I
*Si Non ou pas trouvé remercier le répondant et terminer l’enquête *Si oui, aller à “age1”
Si réponse à “consent” est Non ou Non trouvé remercier le répondant et terminer l’enquête
Informations personnelles Super! Maintenant, je voudrais vous poser quelques questions sur vous…
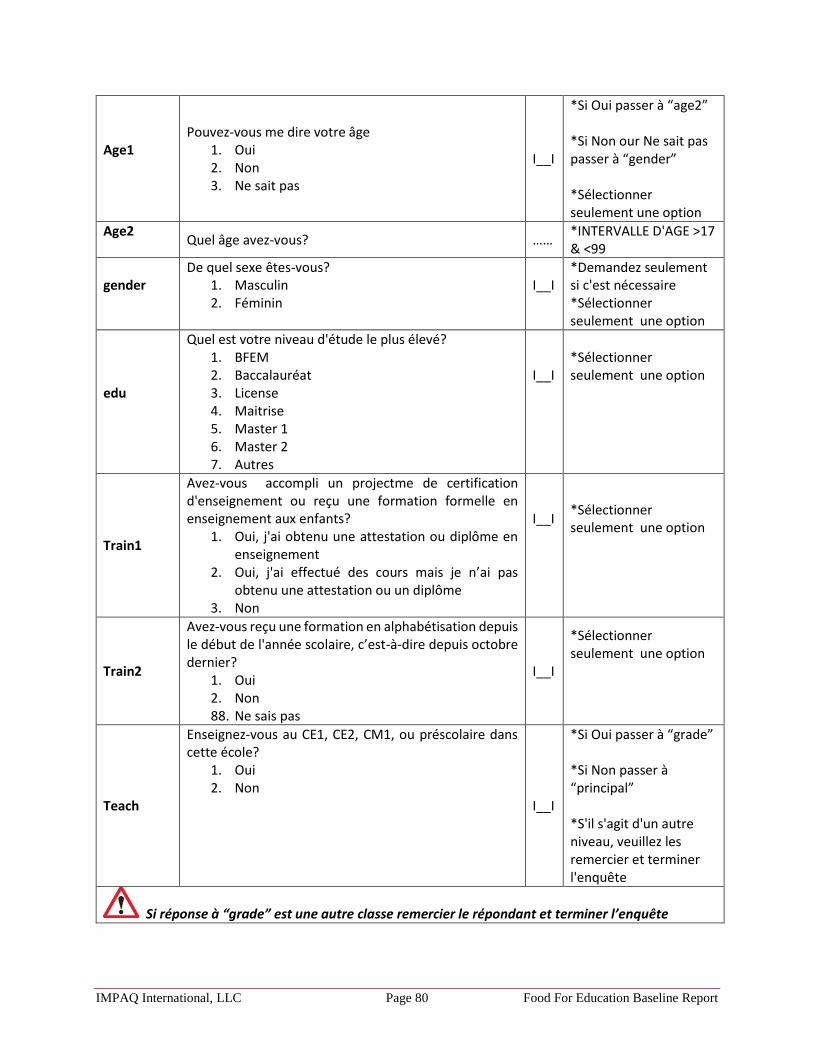
IMPAQ International, LLC Page 80 Food For Education Baseline Report
Age1
Pouvez-vous me dire votre âge 1. Oui 2. Non 3. Ne sait pas
I__I
*Si Oui passer à “age2” *Si Non our Ne sait pas passer à “gender” *Sélectionner seulement une option
Age2
Quel âge avez-vous? …… *INTERVALLE D'AGE >17 & <99
gender
De quel sexe êtes-vous? 1. Masculin 2. Féminin
I__I
*Demandez seulement si c'est nécessaire *Sélectionner seulement une option
edu
Quel est votre niveau d'étude le plus élevé? 1. BFEM 2. Baccalauréat 3. License 4. Maitrise 5. Master 1 6. Master 2 7. Autres
I__I
*Sélectionner seulement une option
Train1
Avez-vous accompli un projectme de certification d'enseignement ou reçu une formation formelle en enseignement aux enfants?
1. Oui, j'ai obtenu une attestation ou diplôme en enseignement
2. Oui, j'ai effectué des cours mais je n’ai pas obtenu une attestation ou un diplôme
3. Non
I__I
*Sélectionner seulement une option
Train2
Avez-vous reçu une formation en alphabétisation depuis le début de l'année scolaire, c’est-à-dire depuis octobre dernier?
1. Oui 2. Non 88. Ne sais pas
I__I
*Sélectionner seulement une option
Teach
Enseignez-vous au CE1, CE2, CM1, ou préscolaire dans cette école?
1. Oui 2. Non
I__I
*Si Oui passer à “grade” *Si Non passer à “principal” *S'il s'agit d'un autre niveau, veuillez les remercier et terminer l'enquête
Si réponse à “grade” est une autre classe remercier le répondant et terminer l’enquête
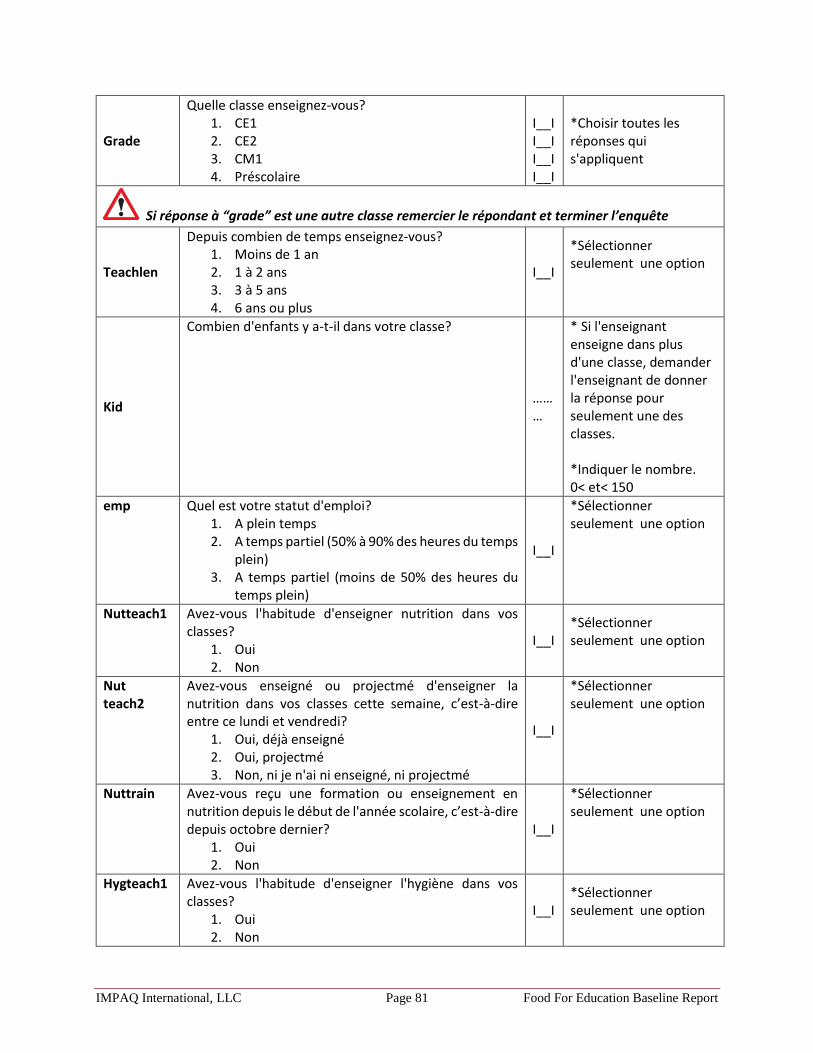
IMPAQ International, LLC Page 81 Food For Education Baseline Report
Grade
Quelle classe enseignez-vous? 1. CE1 2. CE2 3. CM1 4. Préscolaire
I__I I__I I__I I__I
*Choisir toutes les réponses qui s'appliquent
Si réponse à “grade” est une autre classe remercier le répondant et terminer l’enquête
Teachlen
Depuis combien de temps enseignez-vous? 1. Moins de 1 an 2. 1 à 2 ans 3. 3 à 5 ans 4. 6 ans ou plus
I__I
*Sélectionner seulement une option
Kid
Combien d'enfants y a-t-il dans votre classe?
………
* Si l'enseignant enseigne dans plus d'une classe, demander l'enseignant de donner la réponse pour seulement une des classes. *Indiquer le nombre. 0< et< 150
emp Quel est votre statut d'emploi? 1. A plein temps 2. A temps partiel (50% à 90% des heures du temps
plein) 3. A temps partiel (moins de 50% des heures du
temps plein)
I__I
*Sélectionner seulement une option
Nutteach1 Avez-vous l'habitude d'enseigner nutrition dans vos classes?
1. Oui 2. Non
I__I *Sélectionner seulement une option
Nut teach2
Avez-vous enseigné ou projectmé d'enseigner la nutrition dans vos classes cette semaine, c’est-à-dire entre ce lundi et vendredi?
1. Oui, déjà enseigné 2. Oui, projectmé 3. Non, ni je n'ai ni enseigné, ni projectmé
I__I
*Sélectionner seulement une option
Nuttrain Avez-vous reçu une formation ou enseignement en nutrition depuis le début de l'année scolaire, c’est-à-dire depuis octobre dernier?
1. Oui 2. Non
I__I
*Sélectionner seulement une option
Hygteach1 Avez-vous l'habitude d'enseigner l'hygiène dans vos classes?
1. Oui 2. Non
I__I *Sélectionner seulement une option

IMPAQ International, LLC Page 82 Food For Education Baseline Report
Hygteach2 Avez-vous enseigné ou projectmé d'enseigner l'hygiène dans vos classes cette semaine, c’est-à-dire entre ce lundi et vendredi?
1. Oui, déjà enseigné 2. Oui, projectmé 3. Non, ni je n'ai ni enseigné, ni projectmé
I__I
*Sélectionner seulement une option
Hygtrain Avez-vous reçu une formation ou enseigné l'hygiène depuis les trois derniers mois, c’est-à-dire depuis octobre dernier?
1. Oui 2. Non 3. Ne sais pas
I__I
*Sélectionner seulement une option
FORMATION PEDAGOGIQUE Merci! Maintenant, je voudrais vous poser quelques questions sur le type de formation et les diplômes que vous avez reçus dans le passé…
Train3 Avez-vous participé à une formation pédagogique appuyée par le gouvernement depuis octobre dernier?
1. Oui 2. Non 88. Ne sais pas
I__I *Sélectionner
seulement une option
Connaissance nutritionnelle Merci! Maintenant, je vais vous poser quelques questions sur la nutrition…
Growth Selon vous, quelle nourriture contribue à la croissance physique?
1. Viande 2. Poisson 3. Oeufs 4. Fromage 5. Lait 6. Noix 7. Autre 88. Ne sais pas
I__I
*Ne pas donner d'exemples ou lire la liste au répondant *Sélectionner seulement une option

IMPAQ International, LLC Page 83 Food For Education Baseline Report
Energy Quelle nourriture contribue à l'énergie physique? 1. Beurre 2. Huile 3. Sucre 4. Pain 5. Riz 6. Mil 7. Autre 88. Ne sais pas
I__I
*Ne pas donner d'exemples ou lire la liste au répondant *Sélectionner seulement une option
Protect Quelle nourriture protège contre les maladies? 1. Orange 2. Pomme 3. Mangue 4. Tomate 5. Carotte 6. Pastèque 7. Melon 8. Chou 9. Feuilles de bissap 10. Haricot 11. Moringa 12. Autre 88. Ne sais pas
I__I
*Ne pas donner d'exemples ou lire la liste au répondant *Sélectionner seulement une option
Hygiène Nous avons presque fini! Maintenant, je vais vous poser quelques questions sur l'hygiène...
Handwash Selon vous, quand pensez-vous qu'une personne devrait se laver les mains?
1. Avant de manger 2. Avant de toucher ou préparer la nourriture 3. Avant de donner la nourriture à une autre
personne 4. Quand les mains sont sales 5. Après avoir touché un objet sale 6. Après avoir touché un animal 7. Après avoir utilisé les latrines 8. Après avoir changé une couche de bébé 9. Autre 88. Ne sais pas
I__I I__I I__I I__I I__I I__I I__I I__I I__I
*Ne pas donner d'exemples ou lire la liste au répondant *Choisir toutes les réponses qui s'appliquent
Handa1 Avez-vous lavé vos mains aujourd'hui? a. Avant de manger?
1. Oui 2. Non 3. Je n'ai pas mangé aujourd'hui
I__I
*Sélectionner seulement une option

IMPAQ International, LLC Page 84 Food For Education Baseline Report
Handa2 b. Avant de toucher ou préparer la nourriture? 1. Oui 2. Non 3. Je n'ai pas touché/préparé la nourriture
aujourd'hui
I__I *Sélectionner seulement une option
Handa3 c. Avant de donner de la nourriture à une autre personne?
1. Oui 2. Non 3. Je n'ai pas donné de nourriture à une autre
personne aujourd'hui
I__I *Sélectionner seulement une option
Handa4 d. Quand vos mains étaient sales? 1. Oui 2. Non 3. Je n'ai pas de saleté sur les mains aujourd'hui
I__I *Sélectionner seulement une option
Handa5 e. Après avoir touché un objet sale? 1. Oui 2. Non 3. Je n'ai pas touché quelque chose de sale
aujourd'hui
I__I *Sélectionner seulement une option
Handa6 f. Après avoir touché un animal? 1. Oui 2. Non 3. Je n'ai pas touché un animal aujourd'hui
I__I *Sélectionner seulement une option
Handa7 g. Après avoir utilisé les latrines? 1. Oui 2. Non 3. Je n'ai pas utilisé les latrines aujourd'hui
I__I *Sélectionner seulement une option
Handa8 h. Après avoir touché une couche de bébé? 1. Oui 2. Non 3. Je n'ai pas changé une couche de bébé
aujourd'hui
I__I *Sélectionner seulement une option
Hand2 Qu'avez-vous utilisé pour vous laver les mains? 1. Eau 2. Cendres 3. Sable 4. Savon 5. Autre
I__I I__I I__I I__I I__I
*Ne pas donner d'exemples ou lire la liste au répondant *Choisir toutes les réponses qui s'appliquent

IMPAQ International, LLC Page 85 Food For Education Baseline Report
Worms1 Par quel moyen peut-on prévenir les vers intestinaux? 1. Eviter de marcher pieds nus (porter des
chaussures) 2. Ne pas se baigner ou nager dans de l'eau
stagnante 3. Manger de la viande qui est cuite à point 4. Eviter le contact avec l'eau contaminée, mais si
nécessaire porter des bottes et des gants 5. Laver les mains avec de l'eau potable et du
savon avant de préparer la nourriture, avant de servir la nourriture ou avant de manger
6. Laver les mains avec de l'eau qui est potable et du savon après avoir utilisé les latrines
7. Protéger la nourriture contre les mouches, les cafards, et la poussière
8. Garder la nourriture dans un garde-manger, ou endroit qui est propre et bien aéré
9. Autre 88. Ne sais pas
I__I I__I
*Ne pas donner d'exemples ou lire la liste à la personne interrogée *Après que le répondant donne un moyen, inciter le répondant à donner un second moyen: Par quel autre moyen peut-on prévenir les vers intestinaux? *Inciter pour obtenir 2 moyens au total
Stuprop A votre avis, durant une journée normale, combien d'élèves parmi vos élèves se lavent les mains avant de manger à l'école?
1. Aucun 2. Moins de la moitié 3. Environ la moitié 4. Plus de la moitié 5. Presque tous 6. Tous 88. Ne sais pas
I__I *Sélectionner seulement une option
Directeur Maintenant, je voudrais savoir si vous servez comme directeur d'école
principal Servez-vous comme directeur dans cette école? 1. Oui 2. Non
I__I *Si Oui passer à “principal1“ *Si réponse à “principal” est “Non” remercier le répondant et terminer l’enquête *Sélectionner seulement une option
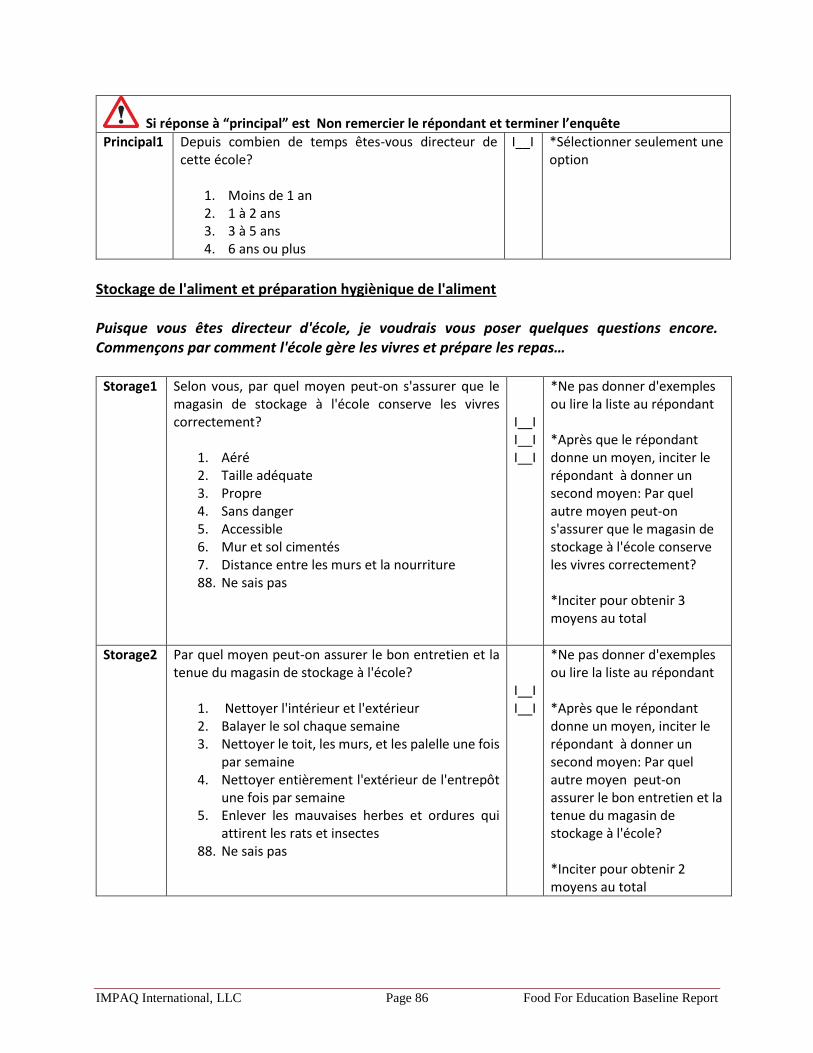
IMPAQ International, LLC Page 86 Food For Education Baseline Report
Si réponse à “principal” est Non remercier le répondant et terminer l’enquête
Principal1 Depuis combien de temps êtes-vous directeur de cette école?
1. Moins de 1 an 2. 1 à 2 ans 3. 3 à 5 ans 4. 6 ans ou plus
I__I *Sélectionner seulement une option
Stockage de l'aliment et préparation hygiènique de l'aliment Puisque vous êtes directeur d'école, je voudrais vous poser quelques questions encore. Commençons par comment l'école gère les vivres et prépare les repas…
Storage1 Selon vous, par quel moyen peut-on s'assurer que le magasin de stockage à l'école conserve les vivres correctement?
1. Aéré 2. Taille adéquate 3. Propre 4. Sans danger 5. Accessible 6. Mur et sol cimentés 7. Distance entre les murs et la nourriture 88. Ne sais pas
I__I I__I I__I
*Ne pas donner d'exemples ou lire la liste au répondant *Après que le répondant donne un moyen, inciter le répondant à donner un second moyen: Par quel autre moyen peut-on s'assurer que le magasin de stockage à l'école conserve les vivres correctement? *Inciter pour obtenir 3 moyens au total
Storage2 Par quel moyen peut-on assurer le bon entretien et la tenue du magasin de stockage à l'école?
1. Nettoyer l'intérieur et l'extérieur 2. Balayer le sol chaque semaine 3. Nettoyer le toit, les murs, et les palelle une fois
par semaine 4. Nettoyer entièrement l'extérieur de l'entrepôt
une fois par semaine 5. Enlever les mauvaises herbes et ordures qui
attirent les rats et insectes 88. Ne sais pas
I__I I__I
*Ne pas donner d'exemples ou lire la liste au répondant *Après que le répondant donne un moyen, inciter le répondant à donner un second moyen: Par quel autre moyen peut-on assurer le bon entretien et la tenue du magasin de stockage à l'école? *Inciter pour obtenir 2 moyens au total
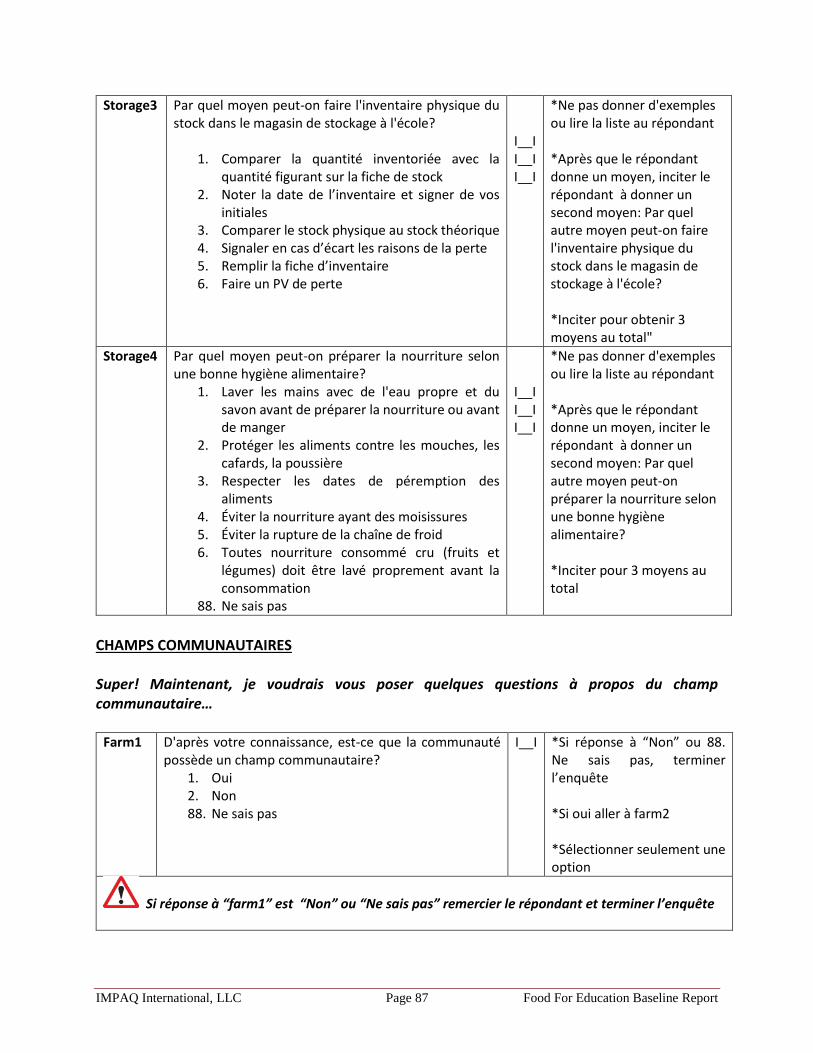
IMPAQ International, LLC Page 87 Food For Education Baseline Report
Storage3 Par quel moyen peut-on faire l'inventaire physique du stock dans le magasin de stockage à l'école?
1. Comparer la quantité inventoriée avec la quantité figurant sur la fiche de stock
2. Noter la date de l’inventaire et signer de vos initiales
3. Comparer le stock physique au stock théorique 4. Signaler en cas d’écart les raisons de la perte 5. Remplir la fiche d’inventaire 6. Faire un PV de perte
I__I I__I I__I
*Ne pas donner d'exemples ou lire la liste au répondant *Après que le répondant donne un moyen, inciter le répondant à donner un second moyen: Par quel autre moyen peut-on faire l'inventaire physique du stock dans le magasin de stockage à l'école? *Inciter pour obtenir 3 moyens au total"
Storage4 Par quel moyen peut-on préparer la nourriture selon une bonne hygiène alimentaire?
1. Laver les mains avec de l'eau propre et du savon avant de préparer la nourriture ou avant de manger
2. Protéger les aliments contre les mouches, les cafards, la poussière
3. Respecter les dates de péremption des aliments
4. Éviter la nourriture ayant des moisissures 5. Éviter la rupture de la chaîne de froid 6. Toutes nourriture consommé cru (fruits et
légumes) doit être lavé proprement avant la consommation
88. Ne sais pas
I__I I__I I__I
*Ne pas donner d'exemples ou lire la liste au répondant *Après que le répondant donne un moyen, inciter le répondant à donner un second moyen: Par quel autre moyen peut-on préparer la nourriture selon une bonne hygiène alimentaire? *Inciter pour 3 moyens au total
CHAMPS COMMUNAUTAIRES Super! Maintenant, je voudrais vous poser quelques questions à propos du champ communautaire…
Farm1 D'après votre connaissance, est-ce que la communauté possède un champ communautaire?
1. Oui 2. Non 88. Ne sais pas
I__I
*Si réponse à “Non” ou 88. Ne sais pas, terminer l’enquête *Si oui aller à farm2 *Sélectionner seulement une option
Si réponse à “farm1” est “Non” ou “Ne sais pas” remercier le répondant et terminer l’enquête
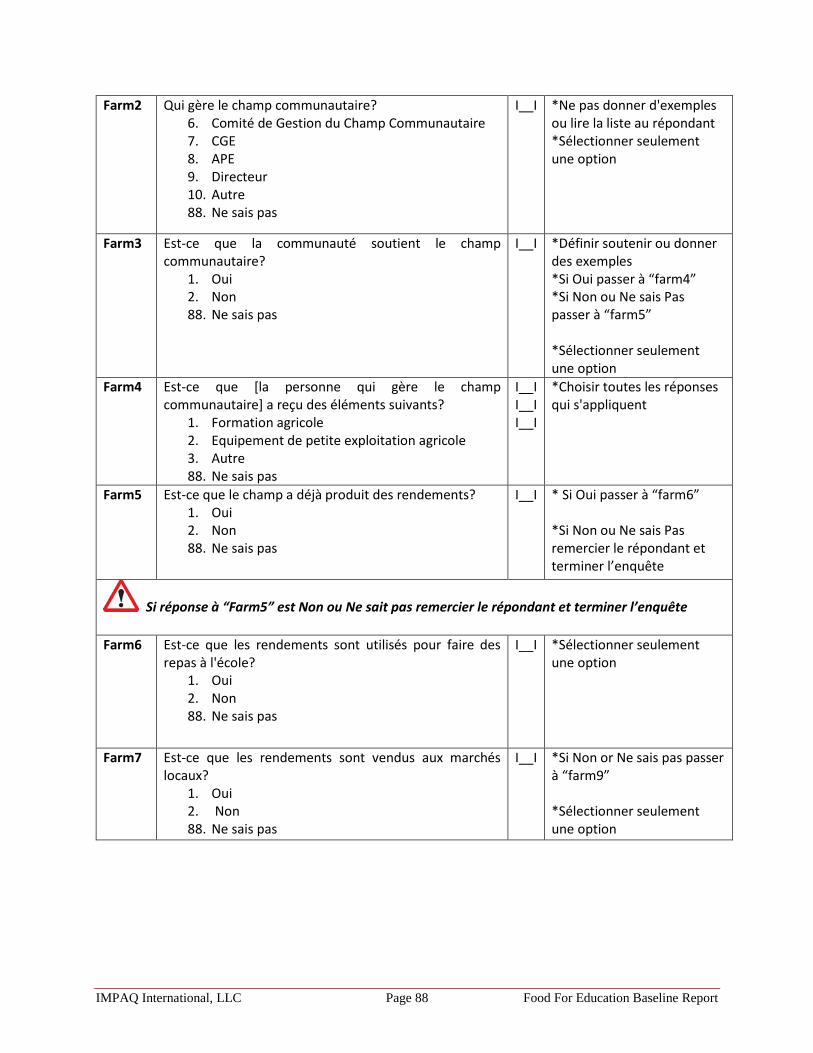
IMPAQ International, LLC Page 88 Food For Education Baseline Report
Farm2 Qui gère le champ communautaire? 6. Comité de Gestion du Champ Communautaire 7. CGE 8. APE 9. Directeur 10. Autre 88. Ne sais pas
I__I *Ne pas donner d'exemples ou lire la liste au répondant *Sélectionner seulement une option
Farm3 Est-ce que la communauté soutient le champ communautaire?
1. Oui 2. Non 88. Ne sais pas
I__I *Définir soutenir ou donner des exemples *Si Oui passer à “farm4” *Si Non ou Ne sais Pas passer à “farm5” *Sélectionner seulement une option
Farm4 Est-ce que [la personne qui gère le champ communautaire] a reçu des éléments suivants?
1. Formation agricole 2. Equipement de petite exploitation agricole 3. Autre 88. Ne sais pas
I__I I__I I__I
*Choisir toutes les réponses qui s'appliquent
Farm5 Est-ce que le champ a déjà produit des rendements? 1. Oui 2. Non 88. Ne sais pas
I__I * Si Oui passer à “farm6” *Si Non ou Ne sais Pas remercier le répondant et terminer l’enquête
Si réponse à “Farm5” est Non ou Ne sait pas remercier le répondant et terminer l’enquête
Farm6 Est-ce que les rendements sont utilisés pour faire des repas à l'école?
1. Oui 2. Non 88. Ne sais pas
I__I *Sélectionner seulement une option
Farm7 Est-ce que les rendements sont vendus aux marchés locaux?
1. Oui 2. Non 88. Ne sais pas
I__I *Si Non or Ne sais pas passer à “farm9” *Sélectionner seulement une option
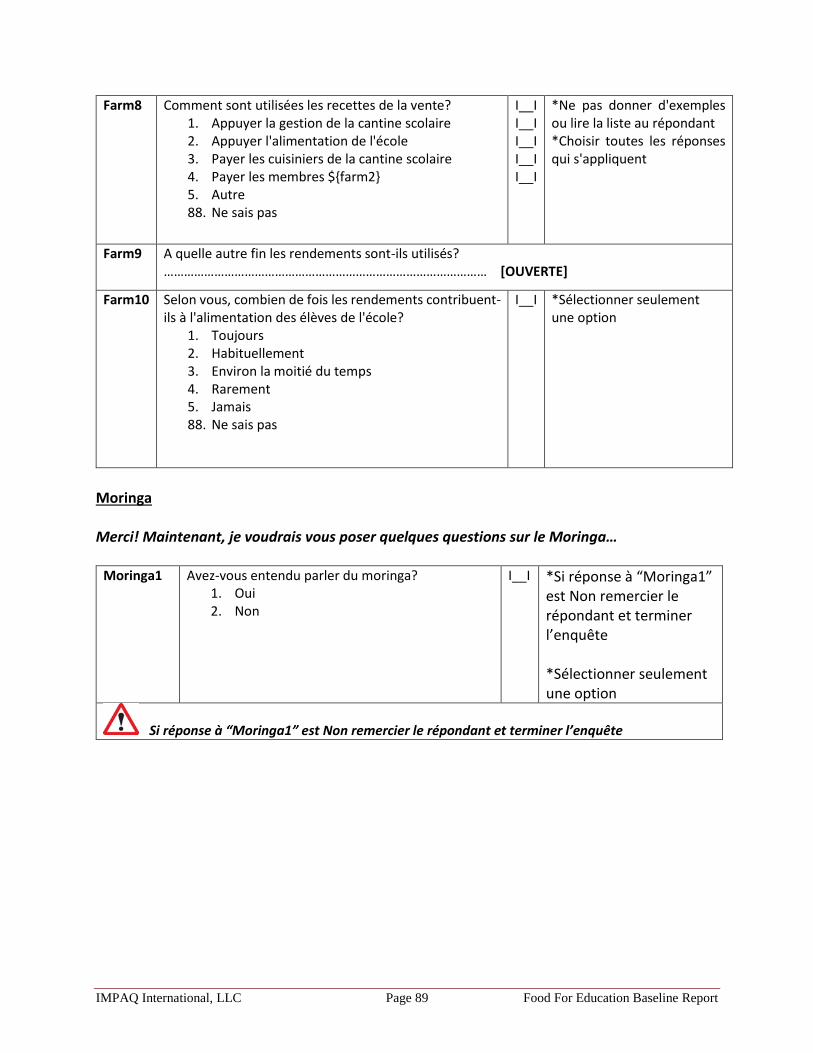
IMPAQ International, LLC Page 89 Food For Education Baseline Report
Farm8 Comment sont utilisées les recettes de la vente? 1. Appuyer la gestion de la cantine scolaire 2. Appuyer l'alimentation de l'école 3. Payer les cuisiniers de la cantine scolaire 4. Payer les membres ${farm2} 5. Autre 88. Ne sais pas
I__I I__I I__I I__I I__I
*Ne pas donner d'exemples ou lire la liste au répondant *Choisir toutes les réponses qui s'appliquent
Farm9 A quelle autre fin les rendements sont-ils utilisés? …………………………………………………………………………………… [OUVERTE]
Farm10 Selon vous, combien de fois les rendements contribuent-ils à l'alimentation des élèves de l'école?
1. Toujours 2. Habituellement 3. Environ la moitié du temps 4. Rarement 5. Jamais 88. Ne sais pas
I__I *Sélectionner seulement une option
Moringa Merci! Maintenant, je voudrais vous poser quelques questions sur le Moringa…
Moringa1 Avez-vous entendu parler du moringa? 1. Oui 2. Non
I__I
*Si réponse à “Moringa1” est Non remercier le répondant et terminer l’enquête *Sélectionner seulement une option
Si réponse à “Moringa1” est Non remercier le répondant et terminer l’enquête
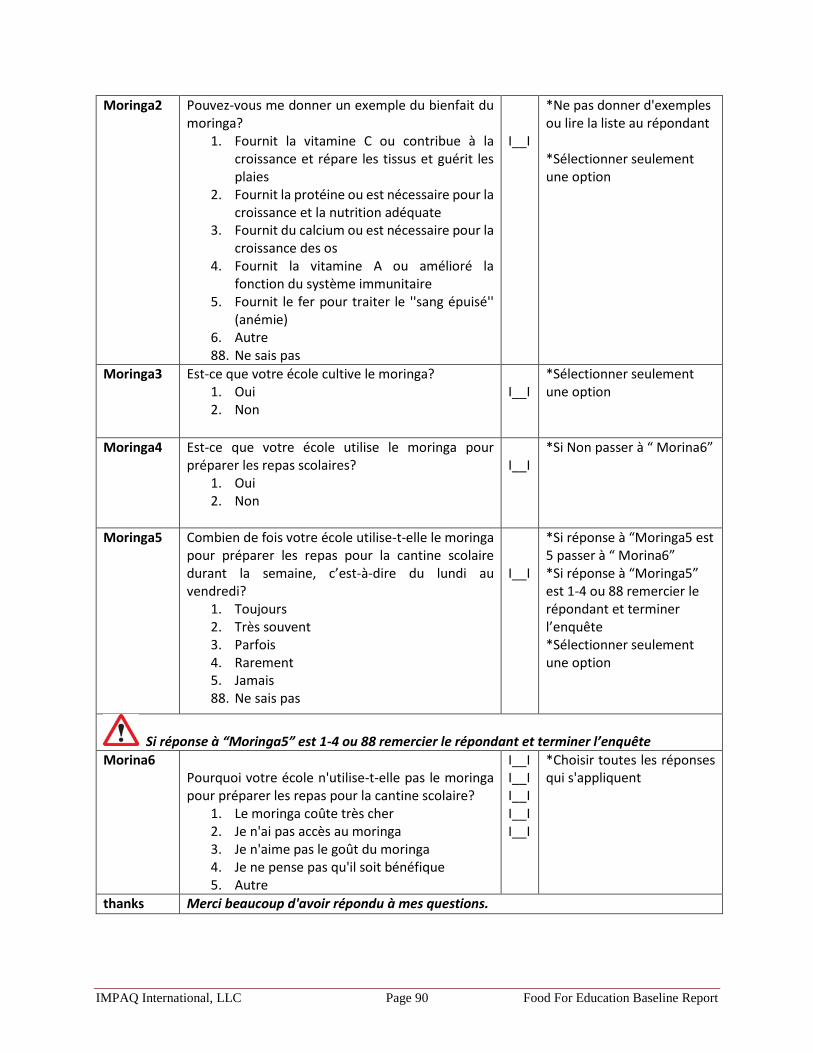
IMPAQ International, LLC Page 90 Food For Education Baseline Report
Moringa2 Pouvez-vous me donner un exemple du bienfait du moringa?
1. Fournit la vitamine C ou contribue à la croissance et répare les tissus et guérit les plaies
2. Fournit la protéine ou est nécessaire pour la croissance et la nutrition adéquate
3. Fournit du calcium ou est nécessaire pour la croissance des os
4. Fournit la vitamine A ou amélioré la fonction du système immunitaire
5. Fournit le fer pour traiter le ''sang épuisé'' (anémie)
6. Autre 88. Ne sais pas
I__I
*Ne pas donner d'exemples ou lire la liste au répondant *Sélectionner seulement une option
Moringa3 Est-ce que votre école cultive le moringa? 1. Oui 2. Non
I__I
*Sélectionner seulement une option
Moringa4 Est-ce que votre école utilise le moringa pour préparer les repas scolaires?
1. Oui 2. Non
I__I
*Si Non passer à “ Morina6”
Moringa5 Combien de fois votre école utilise-t-elle le moringa pour préparer les repas pour la cantine scolaire durant la semaine, c’est-à-dire du lundi au vendredi?
1. Toujours 2. Très souvent 3. Parfois 4. Rarement 5. Jamais 88. Ne sais pas
I__I
*Si réponse à “Moringa5 est 5 passer à “ Morina6” *Si réponse à “Moringa5” est 1-4 ou 88 remercier le répondant et terminer l’enquête *Sélectionner seulement une option
Si réponse à “Moringa5” est 1-4 ou 88 remercier le répondant et terminer l’enquête
Morina6 Pourquoi votre école n'utilise-t-elle pas le moringa pour préparer les repas pour la cantine scolaire?
1. Le moringa coûte très cher 2. Je n'ai pas accès au moringa 3. Je n'aime pas le goût du moringa 4. Je ne pense pas qu'il soit bénéfique 5. Autre
I__I I__I I__I I__I I__I
*Choisir toutes les réponses qui s'appliquent
thanks Merci beaucoup d'avoir répondu à mes questions.